96
Sustainability Sustainability Waste Treatement and Valorization Myriam CALLIER, Ifremer Myriam CALLIER, Ifremer 17/12/2015

SustainabilitySustainabilityWaste Treatement and Valorization
Myriam CALLIER, IfremerMyriam CALLIER, Ifremer17/12/2015

Sustainable development: towards ecological intensification oftowards ecological intensification of
aquacultureq

Intensification of the productionIntensification of the production
Aquaculture production now equals fisheriesAquaculture production now equals fisheries= intensification of the production

ChallengesChallenges
Global and multidisciplinary approach to addressnew challenges facing aquaculture intensificationnew challenges facing aquaculture intensification
A t h t lt (EAA) iAn ecosystem approach to aquaculture (EAA) is astrategy for the integration of the activity within theid t h th t it t t i blwider ecosystem such that it promotes sustainable
development, equity and resilience of interlinkedi l l i t (FAO 2010)social‐ecologica systems » (FAO 2010)»
Sustainable developmentSustainable development
“a sustainable aquaculture should be environmentallyacceptable, economically viable, and socially equitable”
even if these principles are clear, their application is even if these principles are clear, their application is not straightforward
ImprovementImprovement
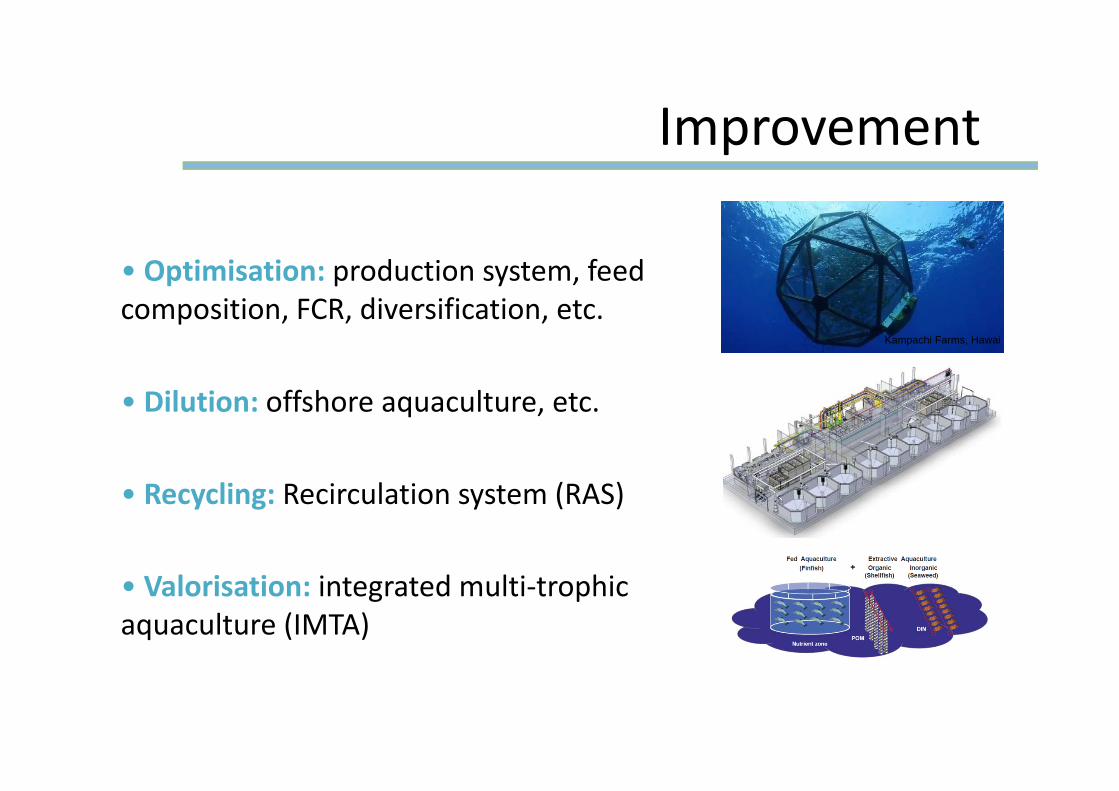
• Optimisation: production system, feedcomposition FCR diversification etc
Dil ti ff h lt t
Kampachi Farms, Hawai
composition, FCR, diversification, etc.
• Dilution: offshore aquaculture, etc.
R li R i l ti t (RAS)• Recycling: Recirculation system (RAS)
l i i d l h
Summerfelt
• Valorisation: integrated multi‐trophicaquaculture (IMTA)
Chopin et al. 2006
ImprovementImprovement
Uneaten feed waste is mainly the consequence of overfeeding.The quantity, frequency, time and duration of meals are keyfactors in order to optimize the feeding process and avoid feedfactors in order to optimize the feeding process and avoid feedwasting (Breton, 2005).
Partial digestibility of feed:• For instance in Norway FCR was 2 08 in 1974 was reducedFor instance, in Norway, FCR was 2.08 in 1974 was reduced
to 1.25 in 1994• FCR of 1.0 1‐1 are reported for Danish and Norwegian fishFCR of 1.0 1 1 are reported for Danish and Norwegian fish
farm
7

ECOLOGICAL INTENSIFICATION OF FISH FARMING
Joël Aubin, Myriam Callier*, Hélène Rey‐Valette, Syndhia Mathé, Aurélie Wilfart, Marc Legendre Jacques Slembrouck Eduardo Chia Gérard Masson Jean Paul BlanchetonLegendre, Jacques Slembrouck, Eduardo Chia, Gérard Masson,, Jean‐Paul Blancheton,
Aurélien Tocqueville, Domenico Caruso, Pascal Fontaine
*
8

Guide of Ecological Intensification

Ecological intensificationBased on:
Ecological intensification
Agroecology principles (Griffon 2010): « Improve
Based on:
Agroecology principles (Griffon 2010): « Improvesystem efficiency using ecological processes andfunctions to control pests reduce pollution make anfunctions to control pests, reduce pollution, make anefficient use of resources etc. »
Ecosystem services: improve services provided byaquaculture ecosystems
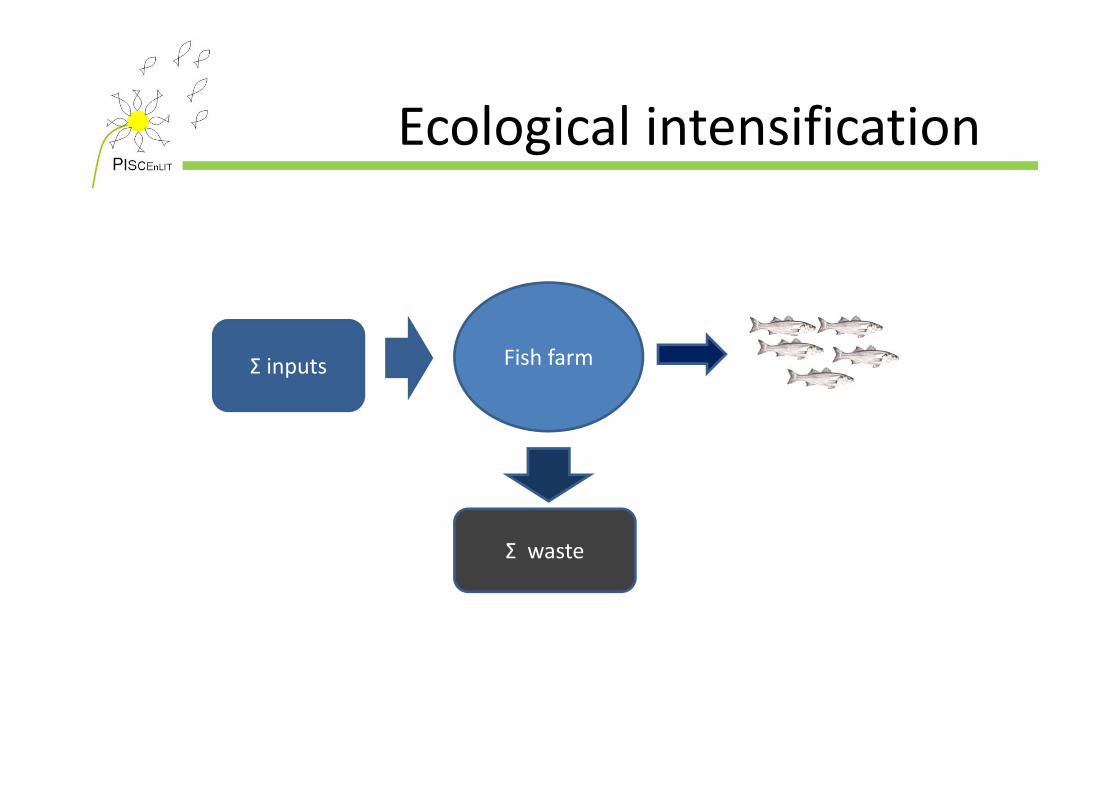
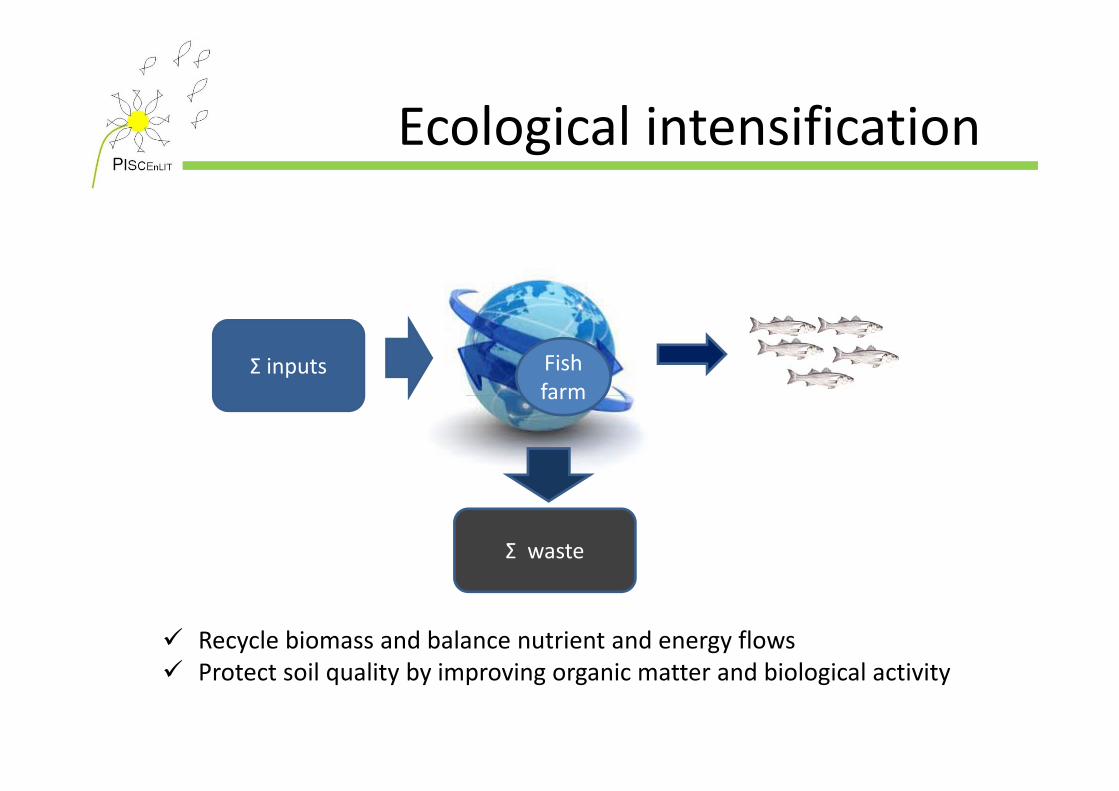
Ecological intensificationEcological intensification
Fish farmΣ inputs
Σ waste
Ecological intensificationEcological intensification
Fish farm
Σ inputsfarm
Σ waste
Recycle biomass and balance nutrient and energy flows P t t il lit b i i i tt d bi l i l ti it Protect soil quality by improving organic matter and biological activity
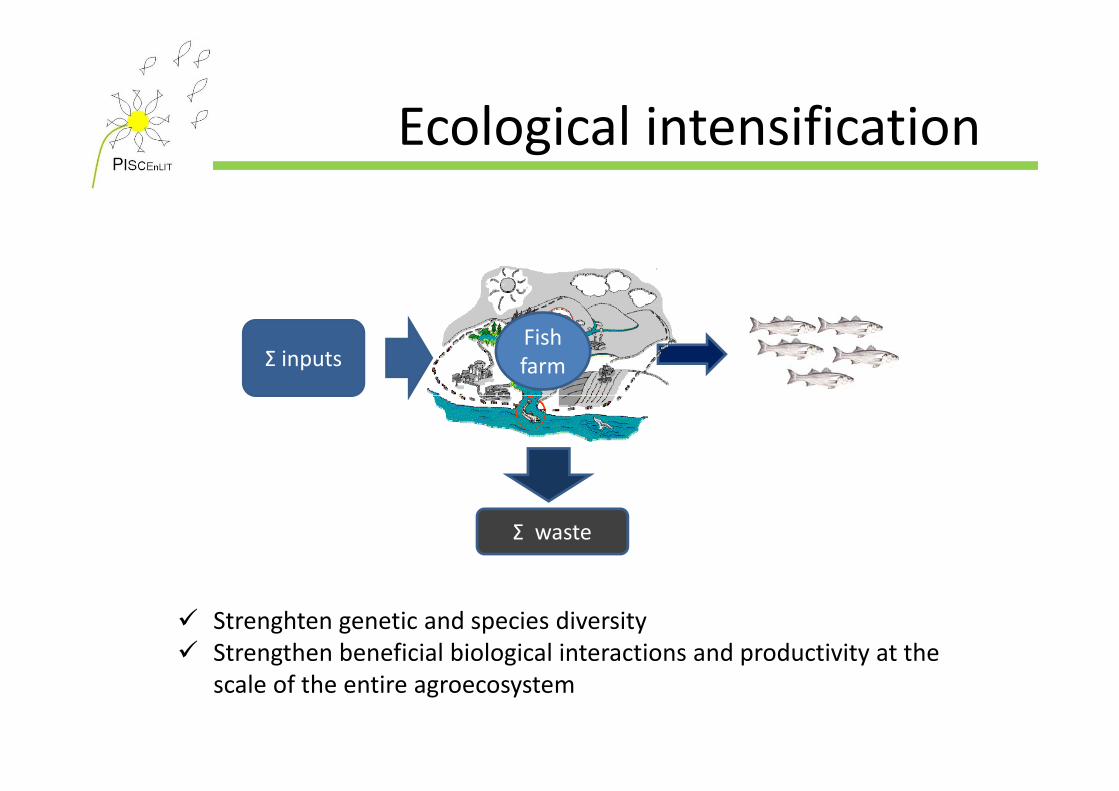
Ecological intensificationEcological intensification
Σ inputsFish farm
Σ waste
Strenghten genetic and species diversity Strengthen beneficial biological interactions and productivity at the g g p y
scale of the entire agroecosystem

Ecological intensificationEcological intensification
Fish farmΣ Inputs Other
products
Ecosystem
Σ wasteservices
improve productivity and services provided by aquacultureimprove productivity and services provided by aquacultureecosystems

How to define ecosystem services?How to define ecosystem services?
i) “The conditions and processes through which naturalecosystems and species that make them up sustain and fulfillecosystems, and species that make them up, sustain and fulfillhuman life” (Fisher et al., 2009),
ii) “The benefits human populations derive, directly or indirectly,from ecosystem functions” (Costanza et al., 1997),y ( , ),
iii) “The benefits people obtain from ecosystems” (Milleniumiii) The benefits people obtain from ecosystems (MilleniumEcosystem Assessment, 2005).

Ecosystem servicesEcosystem services“The benefits people obtain from ecosystems” (Millenium EcosystemAssessment, 2005).

Supply servicesSupply services

Regulating servicesRegulating services

Cultural servicesCultural services
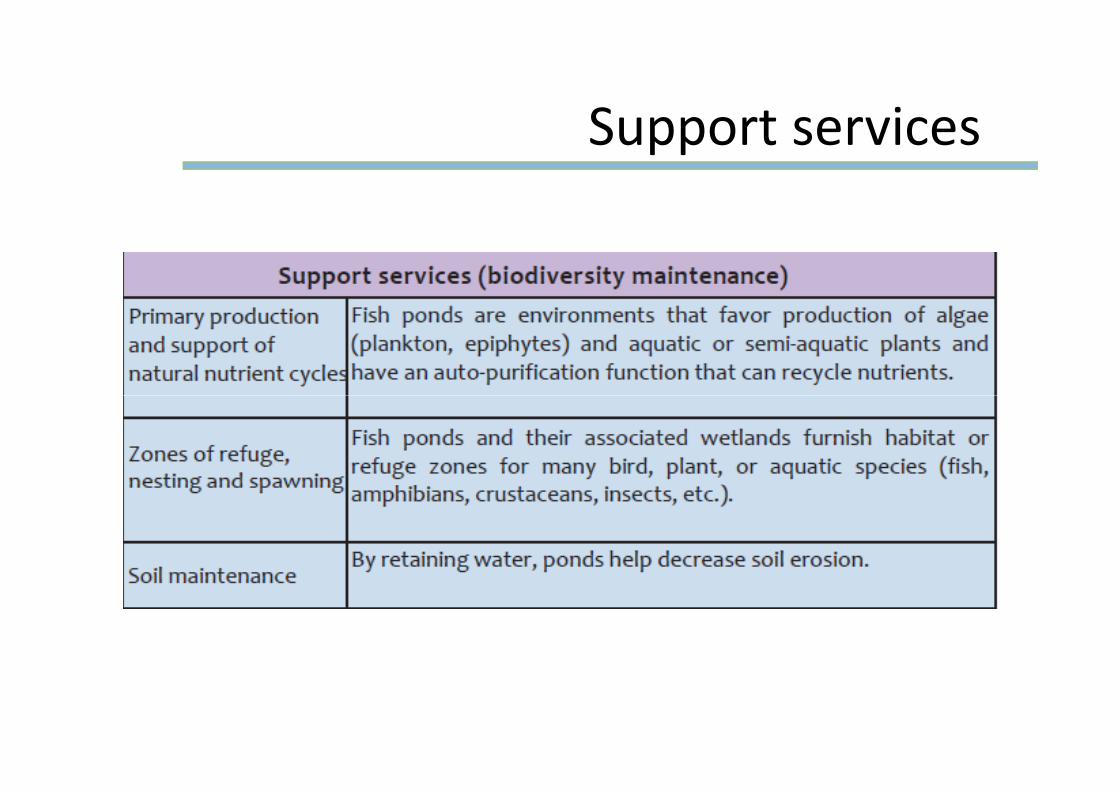
Support servicesSupport services

Study sitesStudy sites
Ponds
Diversity of ecosystemservicesPonds
(France)Integ. ponds
services
p(Brazil)
Ponds(Indon.)
RAS(France)(France)
Orientation of fish farming

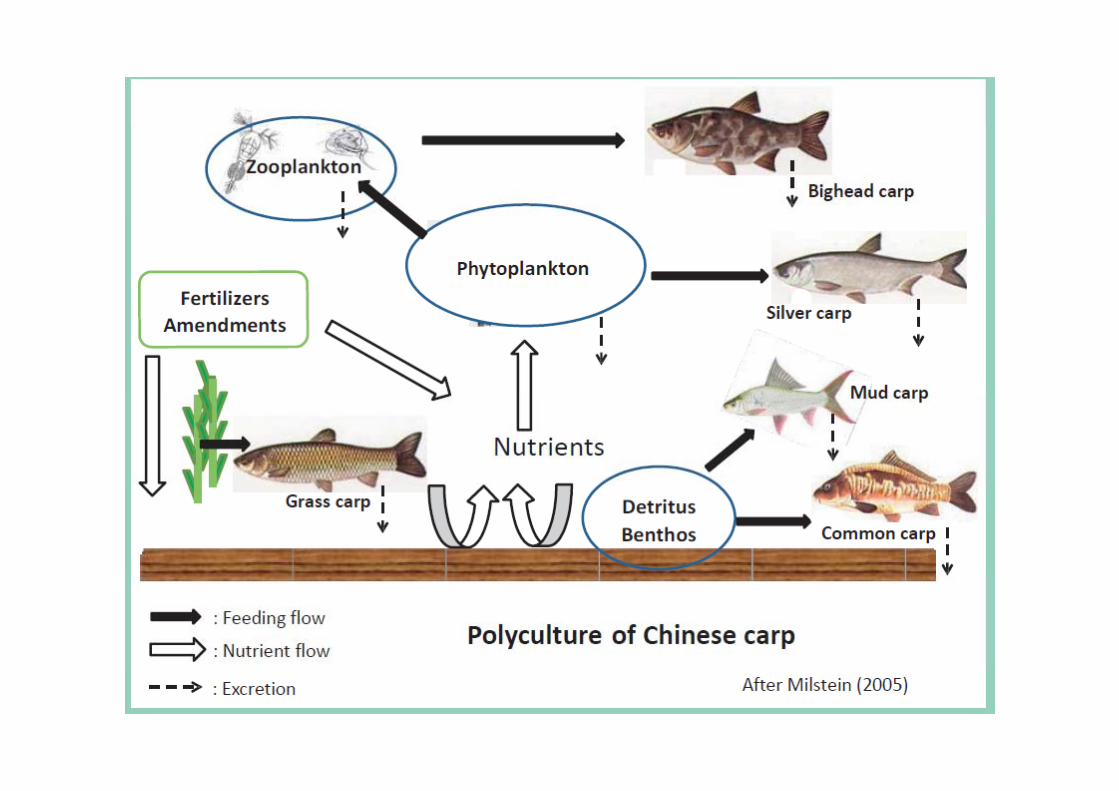
Extensive ponds in FranceExtensive ponds in FranceCarp polyculture in extensive ponds, Yields: 300kg/ha

Integrated polyculture in South BrazilIntegrated polyculture in South BrazilTilapia: M lt
IMTA with pork: • 10‐12 ton/Ha/yr
Silver carpMonoculture • 10‐12 ton/Ha/yr
Common carp Bighead carp

Pangas Ponds in Muara JambiPangas Ponds in Muara Jambi
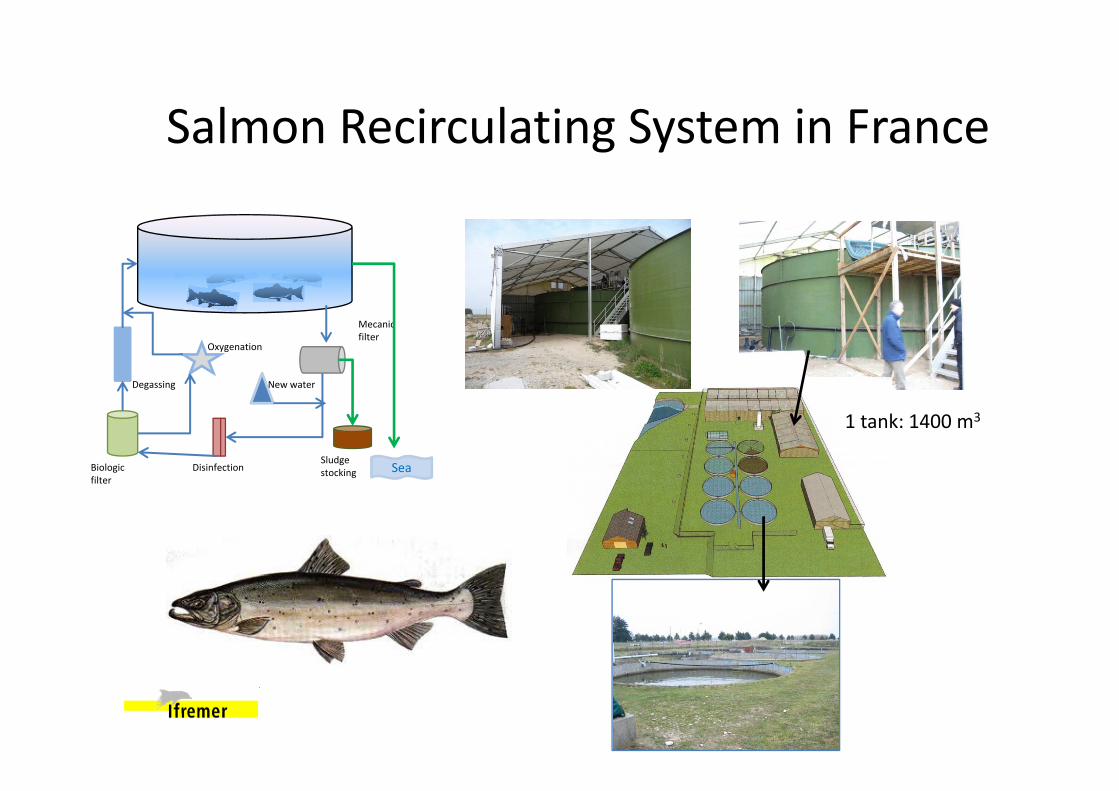
Salmon Recirculating System in FranceSalmon Recirculating System in France
New water
Mecanicfilter
Degassing
Oxygenation
Sludge stockingDisinfectionBiologic
filterSea
1 tank: 1400 m3

Methodology to define ecologicalintensification scenarios
S k h ld
Typologies Scenarios
Stakeholders position
Perception of ecological services
AdaptationProduction, biodiversity
Material and energy Flow
l i
gEcological
intensification status
Experiment
( )analysis
Sociological and innovation status Scenarios of
Characterisation of initial state
(LCA)
Scenarios of Evolution
Stakeholders position

PathwaysPathways
28
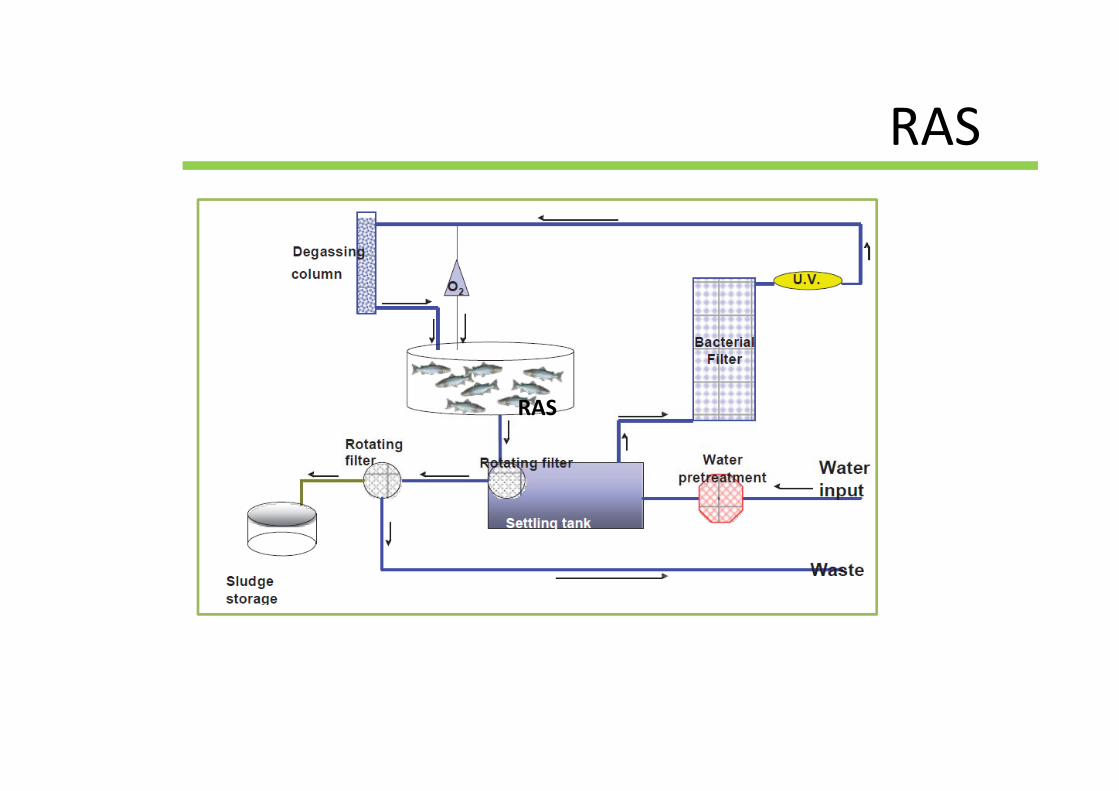
RASRAS
RAS

Profils of ecological intensification: initial
Receiving ecosystemsResource ecosystems
Other ecosystem
Natural resourcesand fucntions
yservices
Farm
and fucntions
Products
Inputs Dis‐services
Territoire

Profils of ecological intensification: « decrease impact »
Receiving ecosystemsResource ecosystems
Other ecosystem
Natural resourcesand fucntions
yservices
Farm
and fucntions
Products
Inputs Dis‐services
Territoire

Profils of ecological intensification: « change practices »
Receiving ecosystemsResource ecosystems
Other ecosystem
Natural resourcesand fucntions
yservices
Farm
and fucntions
Products
Inputs Dis‐services
Territoire

Profils of ecological intensification: « territorial integration »
Receiving ecosystemsResource ecosystems
Other ecosystem
Natural resourcesand fucntions
yservices
Farm
and fucntions
Products
Inputs Dis‐services
Territoire

Objective 1

Objective 2

Objective 3

Objective 4

Objective 5
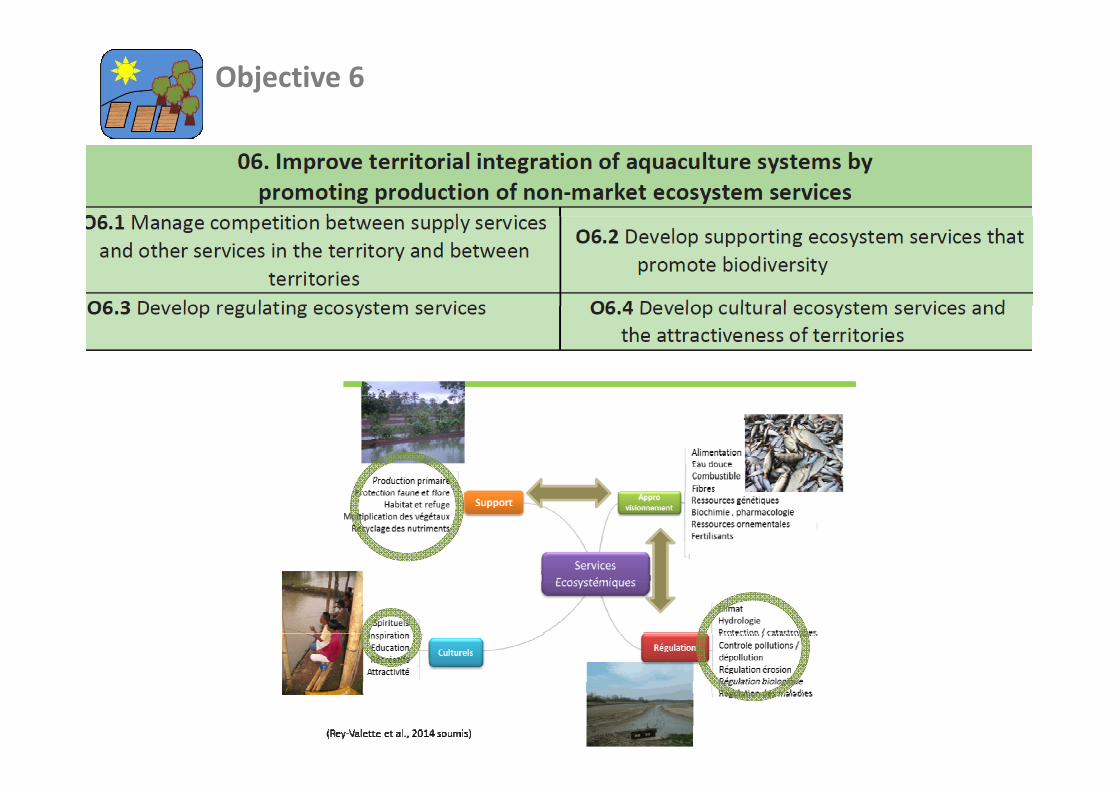
Objective 6

Objective 7

Objective 2
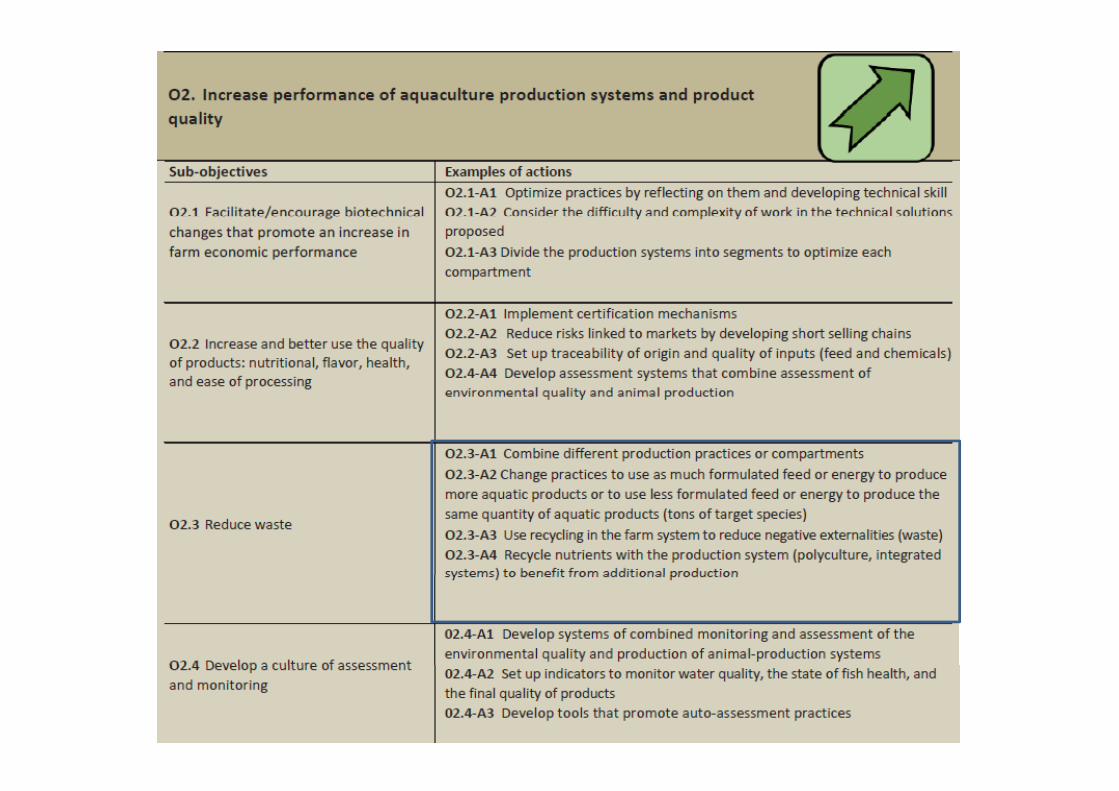

Actions
Indicators
Life Cycle Assessment (LCA)
A technique for assessing the environmental aspects
y ( )
A technique for assessing the environmental aspectsand potential impacts throughout the life of a productor service, from the raw material extraction throughor service, from the raw material extraction throughproduction, use and disposal
Identify the most significant ecological burdens associated with a product system
Indicate the areas were the most effective improvements can be madecan be made
Identify research needs for environmental performance improvement
Courtesy J Aubin

LCA system definitiony
Feeds processing
Infrastructure building
Fish Production
Equipment manufacturing
Raw material extraction
Wastemanagement
Courtesy J Aubin

A worldwide inventory…
E l f t t d ti i FExample of trout production in France
Feeds Ore ExtractionOre ExtractionT
Fish meal / oil
Wheat
Maize
Equipment processingEquipment processingEquipment processingEquipment processing
T
T
Soy bean
TT
Fertilizer OilT
Fish meal / oil
Resource use and pollutant emissionResource use and pollutant emission
46Courtesy J Aubin

Life Cycle Assessment StagesLife Cycle Assessment Stages
E l ti ISystem definition Inventory Evaluation
Energy Use
Inte
Input Farm
RessourcesE i i
Energy UseEutrophication P.Acidification P.Gl b l W i P
erprEmissions Global Warming P.
Net PrimaryProduction Use
reta
((A diA di G iG i 1999) 1999)
tio
Expressed by a Functional Unit : 1 ton of fish
((AccordingAccording to to GeierGeier, 1999), 1999) n
p y
Courtesy J Aubin

Potential Impact Categoriesp gImpact Categories Unit Resources and Emissions
Energy use MJ Coal, oil, gas, uranium, lignite
N Prim Production use kg C Biotic resourcesN. Prim. Production use kg C Biotic resources
Climate Change kg CO2-eq CO2, N2O, CH4
Acidification kg SO2-eq NH3, NO2, NOx, SO2
Eutrophication kg PO4-eq NH3, NO3, NO2, NOx, PO4, p Water dependence
g 4 q
m3
2
3, 3, 2, x, 4,COD, ThOD River, sea, spring, ground water
Surface use Manpower
m2
man day
Land Labour
48Courtesy J Aubin
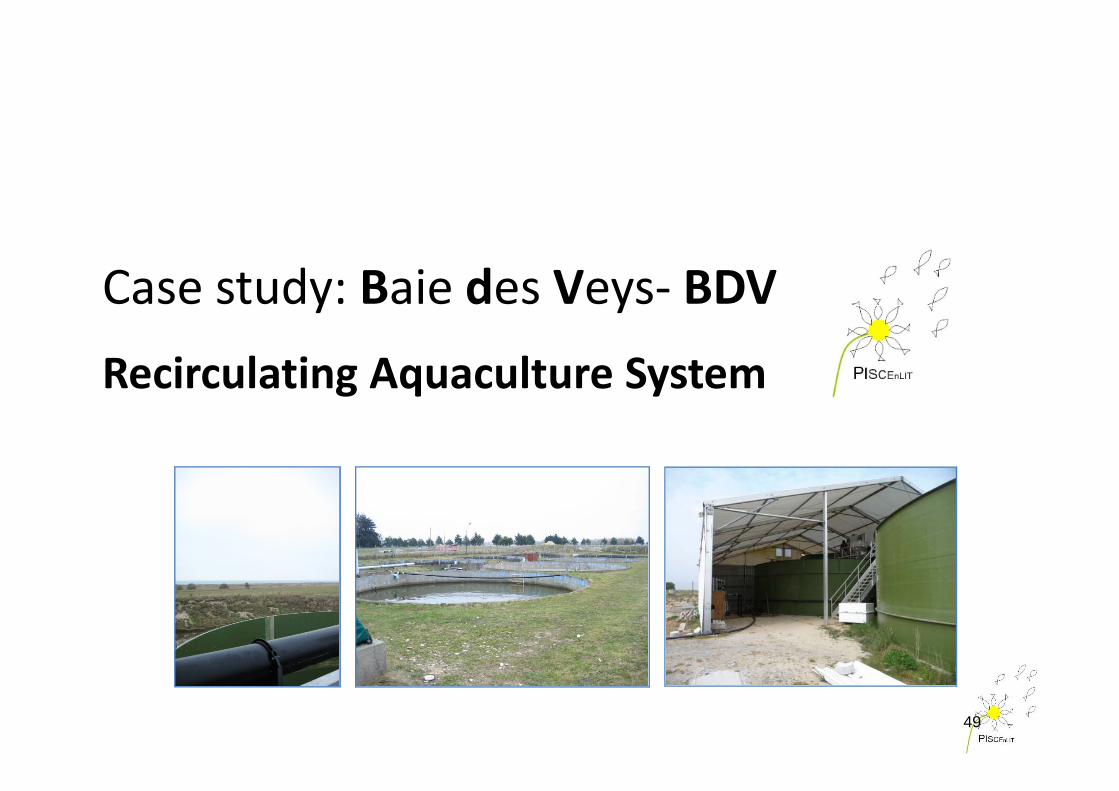
Case study: Baie des Veys‐ BDVy y
Recirculating Aquaculture Systemg q y
49

Normandie
1500 m
Shellfish farming
1300 m
BDV
farmBaie des VeysBDV
50
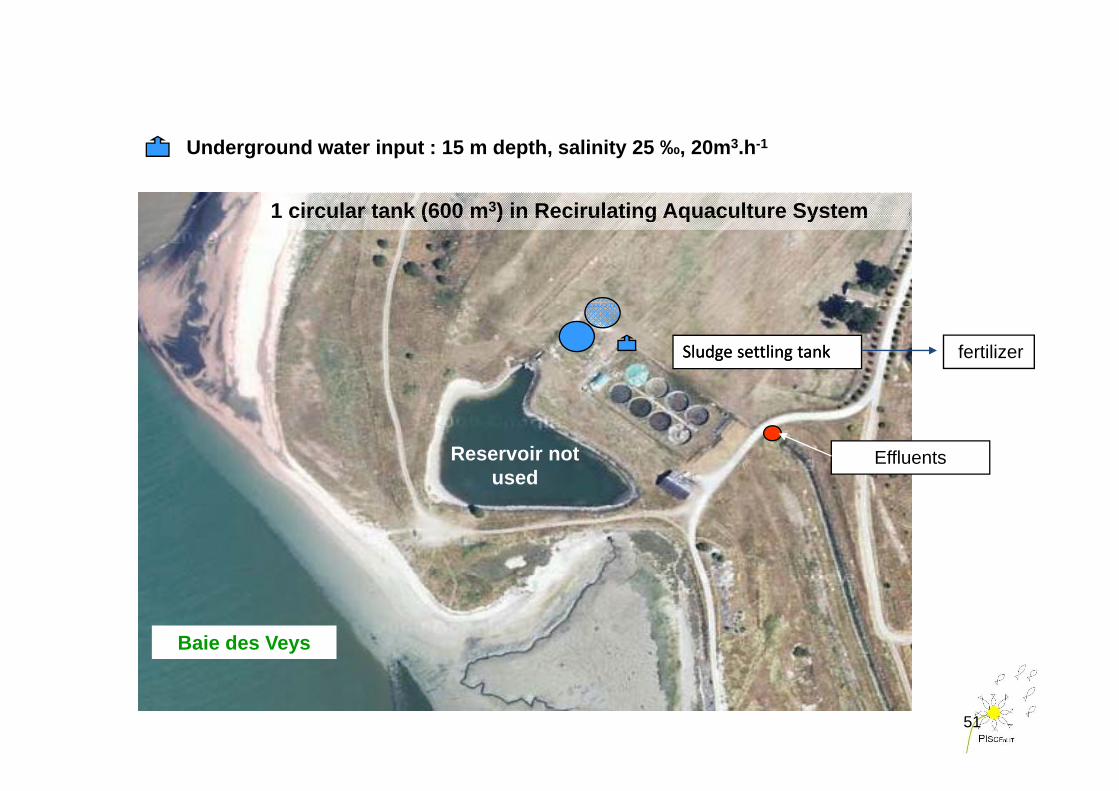
Underground water input : 15 m depth, salinity 25 ‰, 20m3.h-1
1 circular tank (600 m3) in Recirulating Aquaculture System1 circular tank (600 m ) in Recirulating Aquaculture System
Sludge settling tankSludge settling tank fertilizer
EffluentsReservoir not used
Baie des Veys
51
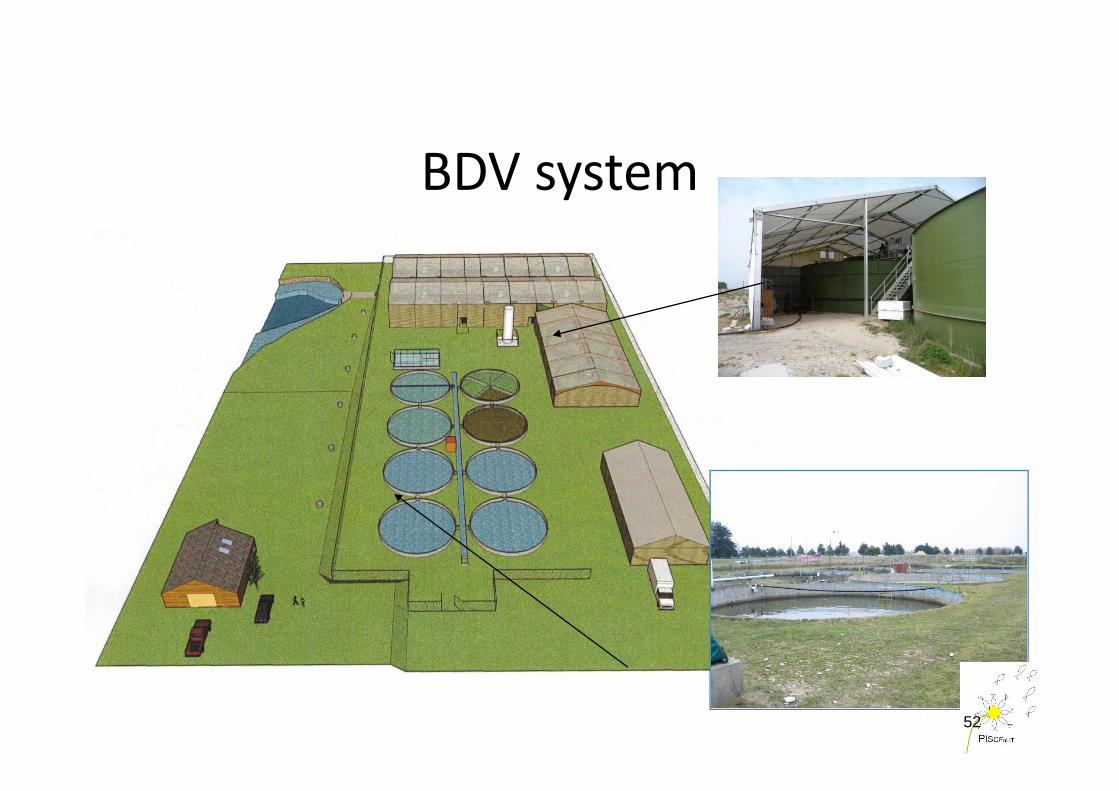
BDV system
52

Scenario of « ecological intensification »Unit Production
(T.year‐1)Qe‐s
(m3.h‐1)Treatment
W t t t Sl dWater output Sludge
2010 1 50 20 no 7T
2011 2 100 40 1 bassin with macroalgae (ulva)
14T
b i i h2015 4 200 80 6 bassins with microalgae+ 1 wetlands
28T
(2000 m2) Macrophyte ecosystemsecosystems
54

Fish farm + algae+ constructed wetlands
500 m length10 cm depthp
55
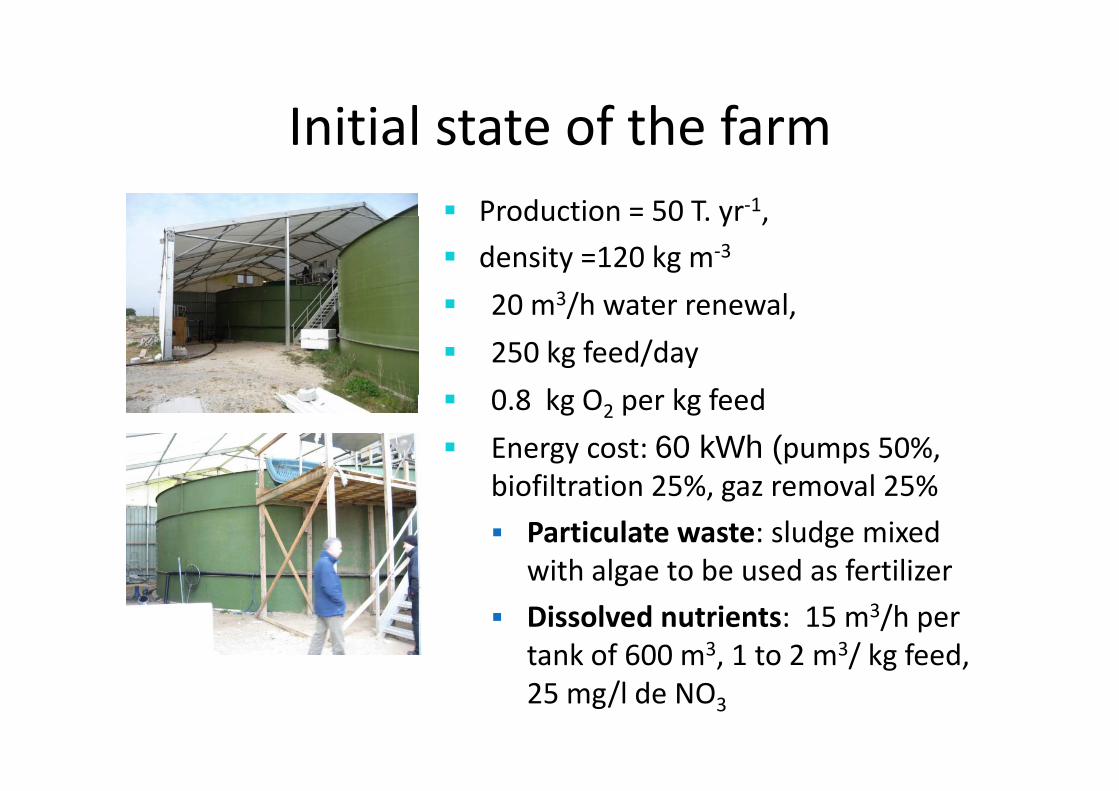
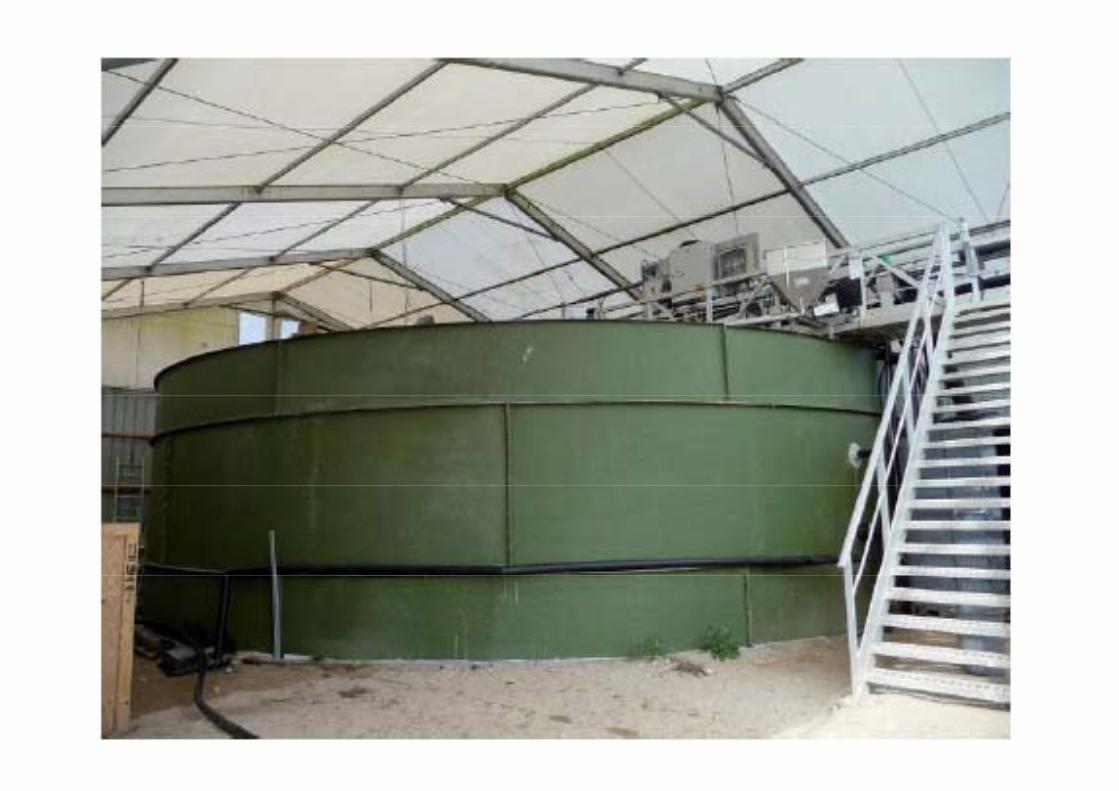
Initial state of the farm Production = 50 T yr‐1
Initial state of the farmProduction 50 T. yr ,
density =120 kg m‐3
20 m3/h water renewal 20 m /h water renewal, 250 kg feed/day 0 8 kg O per kg feed 0.8 kg O2 per kg feed Energy cost: 60 kWh (pumps 50%,
biofiltration 25% gaz removal 25%biofiltration 25%, gaz removal 25% Particulate waste: sludge mixed
with algae to be used as fertilizerwith algae to be used as fertilizer Dissolved nutrients: 15 m3/h per
tank of 600 m3, 1 to 2 m3/ kg feed,tank of 600 m , 1 to 2 m / kg feed, 25 mg/l de NO3
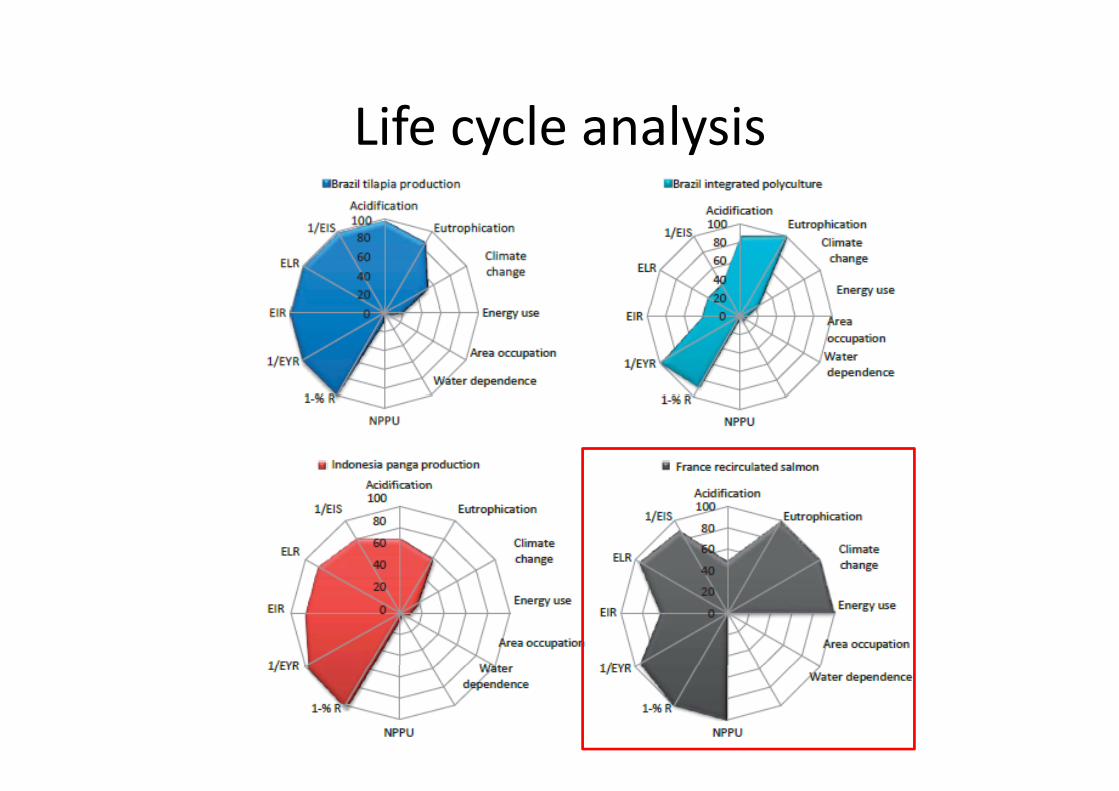
Life cycle analysisLife cycle analysis

Scenario of evolutionScenario of evolution
P i i i
+
ProvisioningFoodFertilizers

Scenario of evolutionScenario of evolution
algae Constructedalgae wetlands
Support+
+ +
P i i i
Primary productionPlant multiplicationNutrients cycling
+
ProvisioningFoodFertilizers
Algae and constructed wetlands to treat the waste water at the outlet of the farm + valorisation of the co‐production

Pond systems in Sumatray
d l f ( d h h h l ) h dIn Indonesia, a monoculture of panga (Pangasianodon hypophthalmus) was changed into a polyculture associating, a cage of panga, a floating plant (Lemna minor) and high value herbivorous species (Osphronemus goramy).
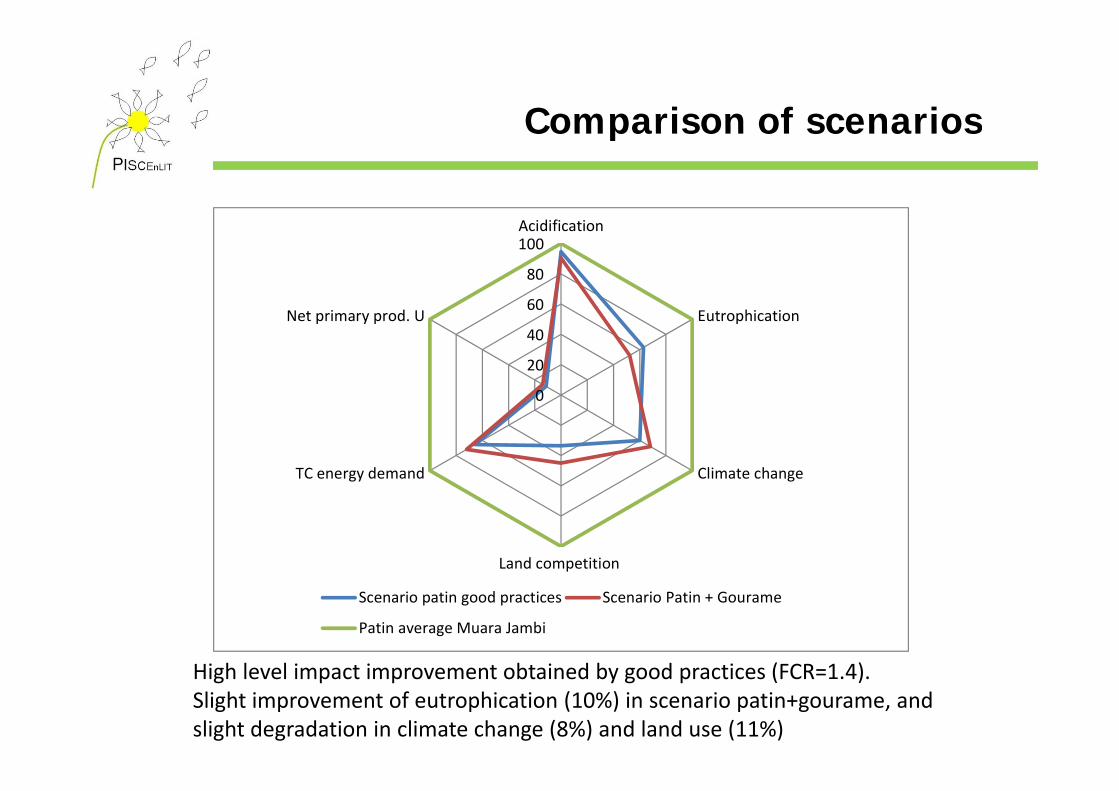
Comparison of scenariosComparison of scenarios
60
80
100Acidification
0
20
40
60EutrophicationNet primary prod. U
0
Climate changeTC energy demand
Land competition
Scenario patin good practices Scenario Patin + Gourame
Patin average Muara Jambi
Hi h l l i i b i d b d i (FCR 1 4)High level impact improvement obtained by good practices (FCR=1.4).Slight improvement of eutrophication (10%) in scenario patin+gourame, and slight degradation in climate change (8%) and land use (11%)
Waste treatment and valorization:Waste treatment and valorization:RAS‐IMTA
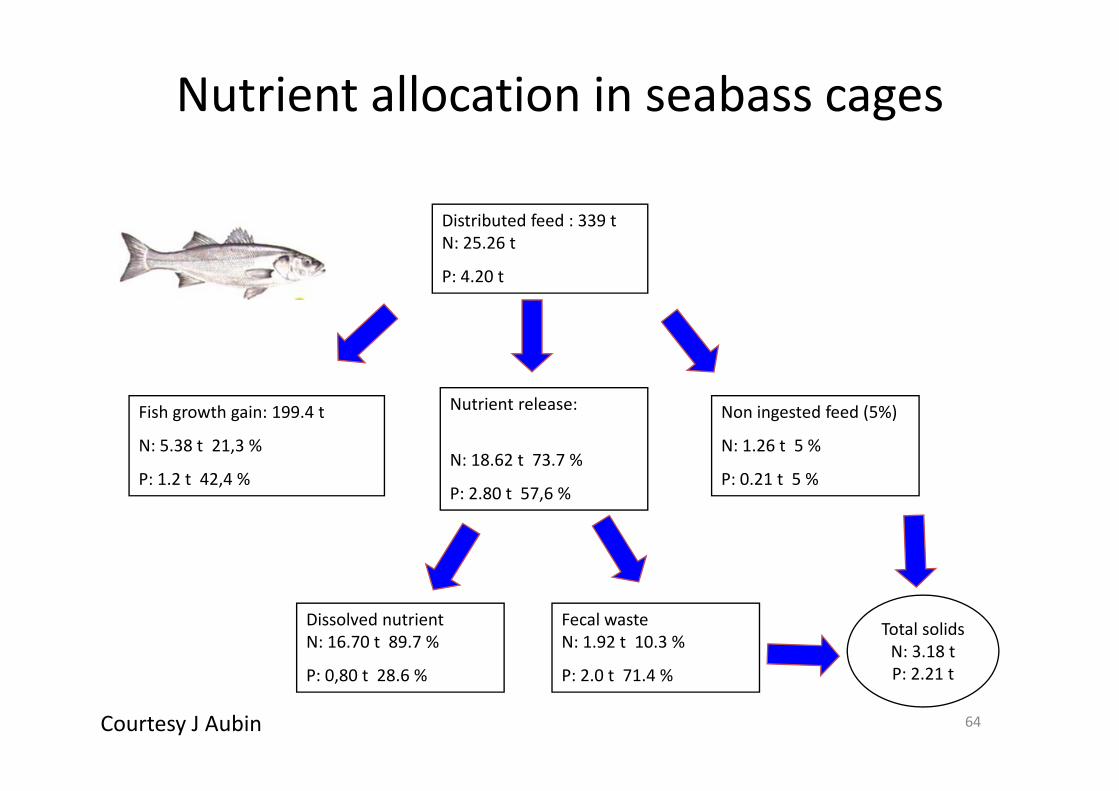
Nutrient allocation in seabass cages
Di t ib t d f d 339 tDistributed feed : 339 tN: 25.26 t
P: 4.20 t
Non ingested feed (5%)
N: 1.26 t 5 %
P: 0.21 t 5 %
Fish growth gain: 199.4 t
N: 5.38 t 21,3 %
P: 1.2 t 42,4 %
Nutrient release:
N: 18.62 t 73.7 %,
P: 2.80 t 57,6 %
Fecal wasteN: 1.92 t 10.3 %
Dissolved nutrientN: 16.70 t 89.7 %
Total solidsN: 3.18 t
P: 2.0 t 71.4 %P: 0,80 t 28.6 % P: 2.21 t
64Courtesy J Aubin

LegislationLegislation
Recommendations and directives from institutional bodies (FAO,EU) and from National / Regional bodies suggest thedevelopment and enforcement of increasingly restrictivedevelopment and enforcement of increasingly restrictivemeasures in order:
Promote sustainable water used Prevent futher deterioration and protect condition ofPrevent futher deterioration and protect condition ofaquatic ecosystems
Ensure reduction of pollution of groundwaterEnsure reduction of pollution of groundwater
65

LegislationLegislation
Aquaculture use a shared primary resource (water) andgenerate effluents that return to public domain
How to comply with requirements and stay viable?
Two approaches: b d l h d f d based on maximal authorized feed quantity
Maximal authorized emissions in the environment
66
LegislationLegislation
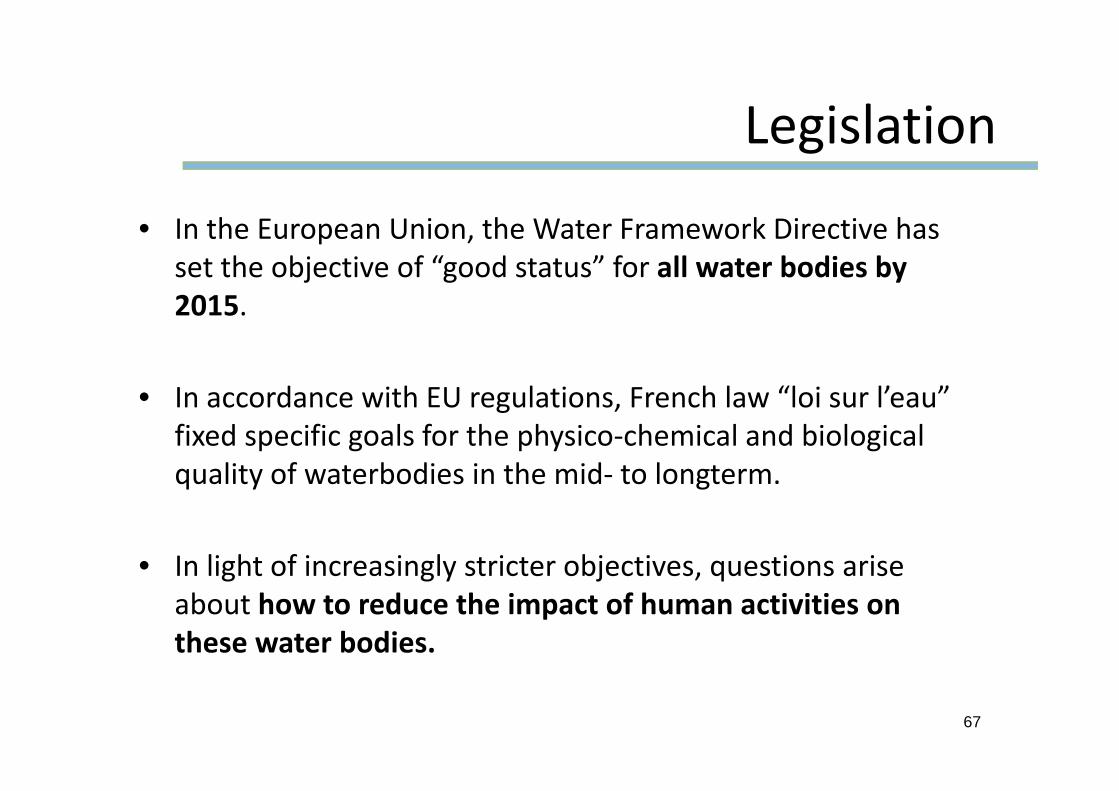
• In the European Union, the Water Framework Directive has set the objective of “good status” for all water bodies by 20152015.
• In accordance with EU regulations French law “loi sur l’eau”• In accordance with EU regulations, French law loi sur l eau fixed specific goals for the physico‐chemical and biological quality of waterbodies in the mid‐ to longterm.q y g
• In light of increasingly stricter objectives, questions ariseIn light of increasingly stricter objectives, questions arise about how to reduce the impact of human activities on these water bodies.
67
LegislationLegislation
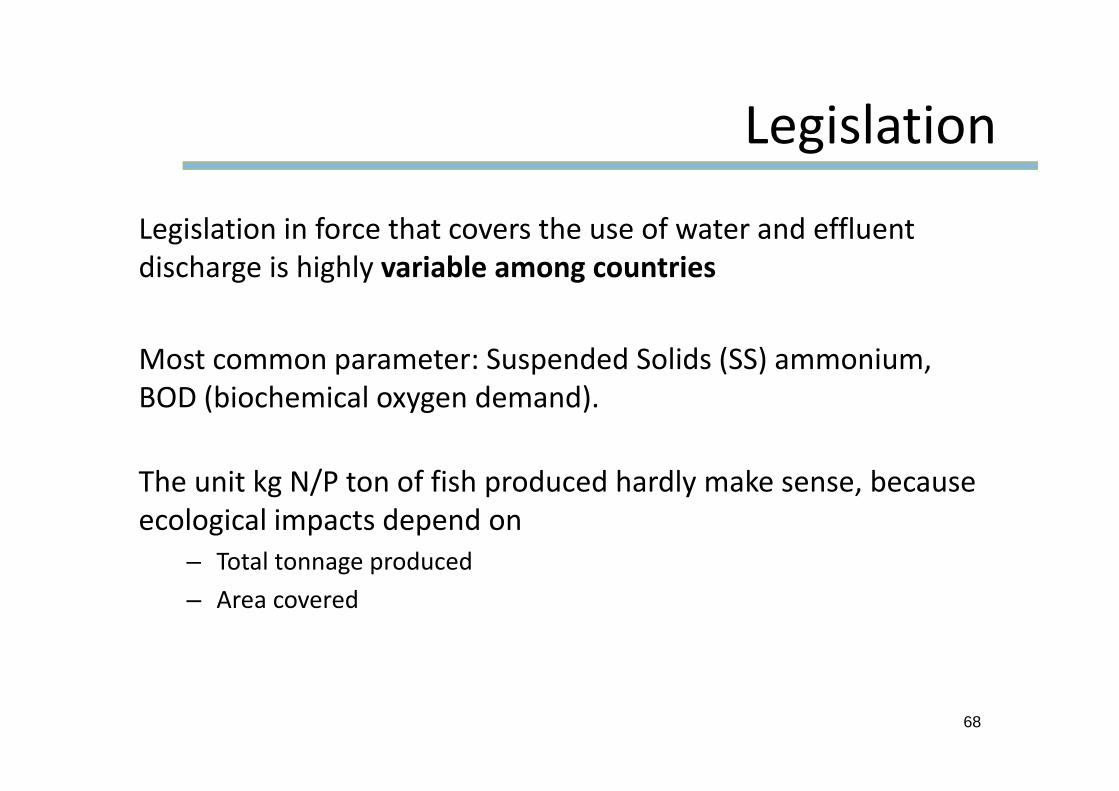
Legislation in force that covers the use of water and effluent discharge is highly variable among countries
Most common parameter: Suspended Solids (SS) ammonium, BOD (biochemical oxygen demand)BOD (biochemical oxygen demand).
The unit kg N/P ton of fish produced hardly make sense becauseThe unit kg N/P ton of fish produced hardly make sense, becauseecological impacts depend on
– Total tonnage produced– Area covered
68

Threshold in effluentsThreshold in effluents
69

Threshold in effluentsDifference between input and output:
Threshold in effluentsDifference between input and output:
100 m downstream on 24h
NH4+ 0.5 mg l‐1NH4 0.5 mg l
NO2‐ 0.3 mg l‐1
PO 3 0 5 l‐1PO43‐ 0.5 mg l‐1
BOD5 5.0 mg l‐1
SS 15 mg l‐1
BOD: amount of dissolved oxygen needed by aerobic biological organisms in aBOD: amount of dissolved oxygen needed by aerobic biological organisms in abody of water to break down organic material present in a given water sampleat certain temperature over a specific time period. The BOD value is mostcommonly expressed in milligrams of oxygen consumed per litre of sample
70
commonly expressed in milligrams of oxygen consumed per litre of sampleduring 5 days of incubation at 20 °C.

Characteristics of the wastesCharacteristics of the wastesExtensive Semi to intensive
/ t kIntensive tanks i RAScages cages / tanks in RAS
Visual Onshore facilites Tanks / foam BuildingsOlfactory Odours OdoursOlfactory Odours Odours
Auditory Boats Pumps / boatd PumpsNit NH NONitrogen NH3‐4 NO3
Phosphorous PO4 PO4
Carbon CO2 CO2Carbon CO2 CO2Suspended solids Faeces / Feed / Fish / Faeces / bacterial
biomassChemical Antifouling Antibiotics/
DisinfectantDisinfectant
Fi h d Fi h d R i lFish and repromaterials
Fish and repromaterials
Repro materials
71
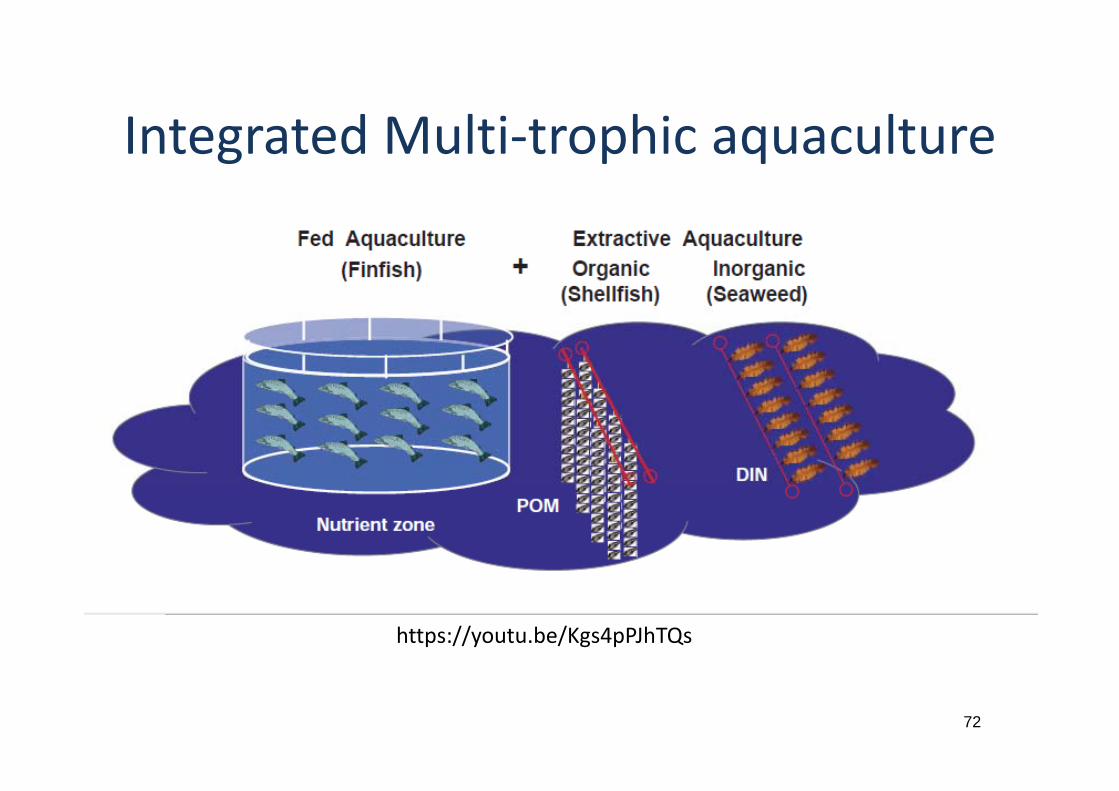
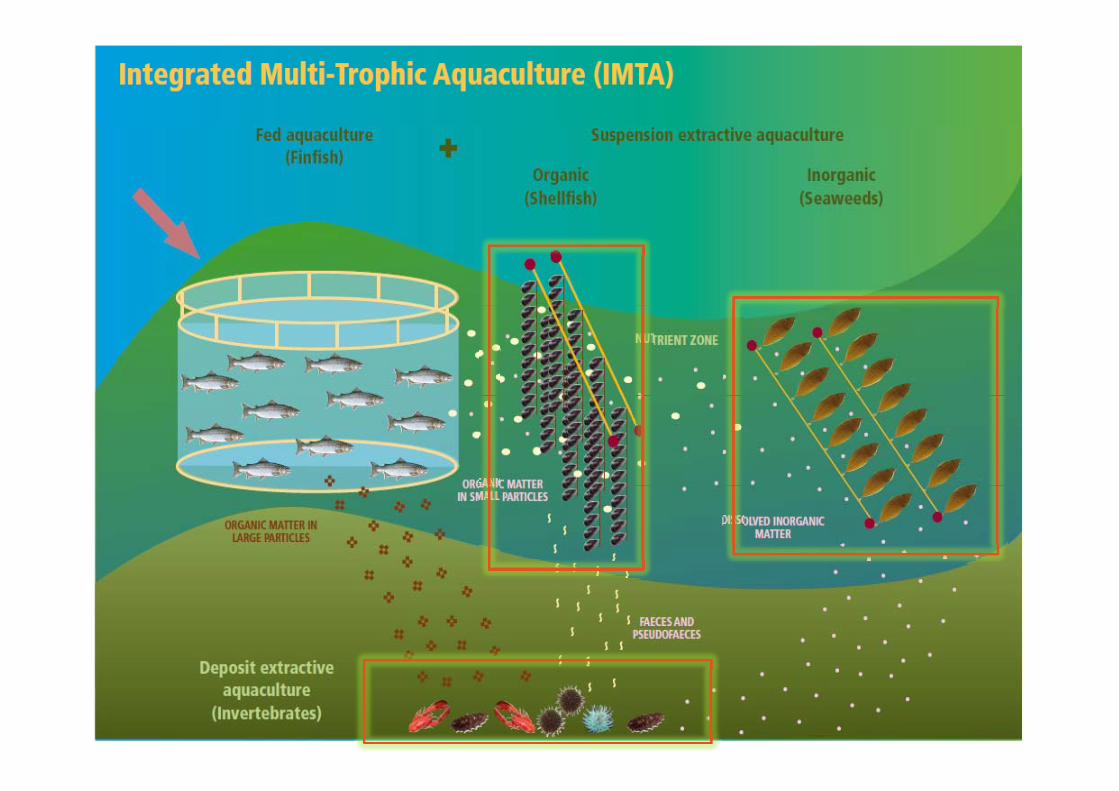
Integrated Multi trophic aquacultureIntegrated Multi‐trophic aquaculture
https://youtu.be/Kgs4pPJhTQs
72
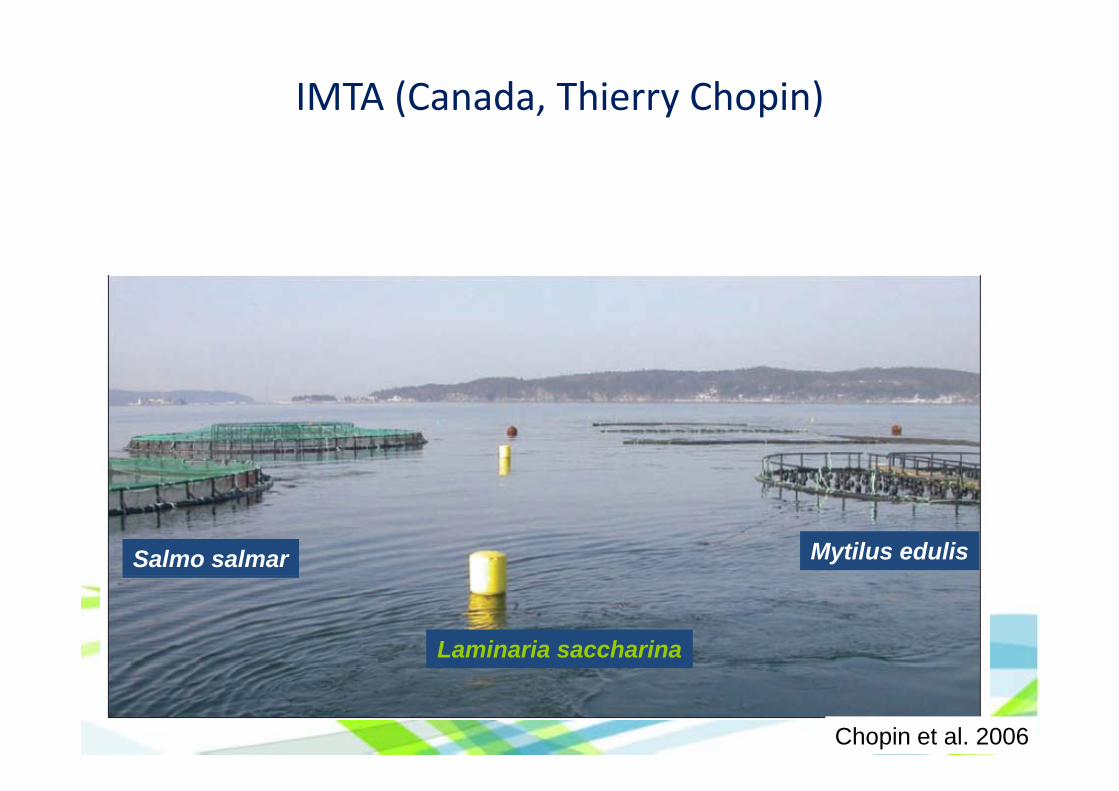
IMTA (Canada, Thierry Chopin)
Salmo salmar Mytilus edulis
Laminaria saccharina
74Chopin et al. 2006
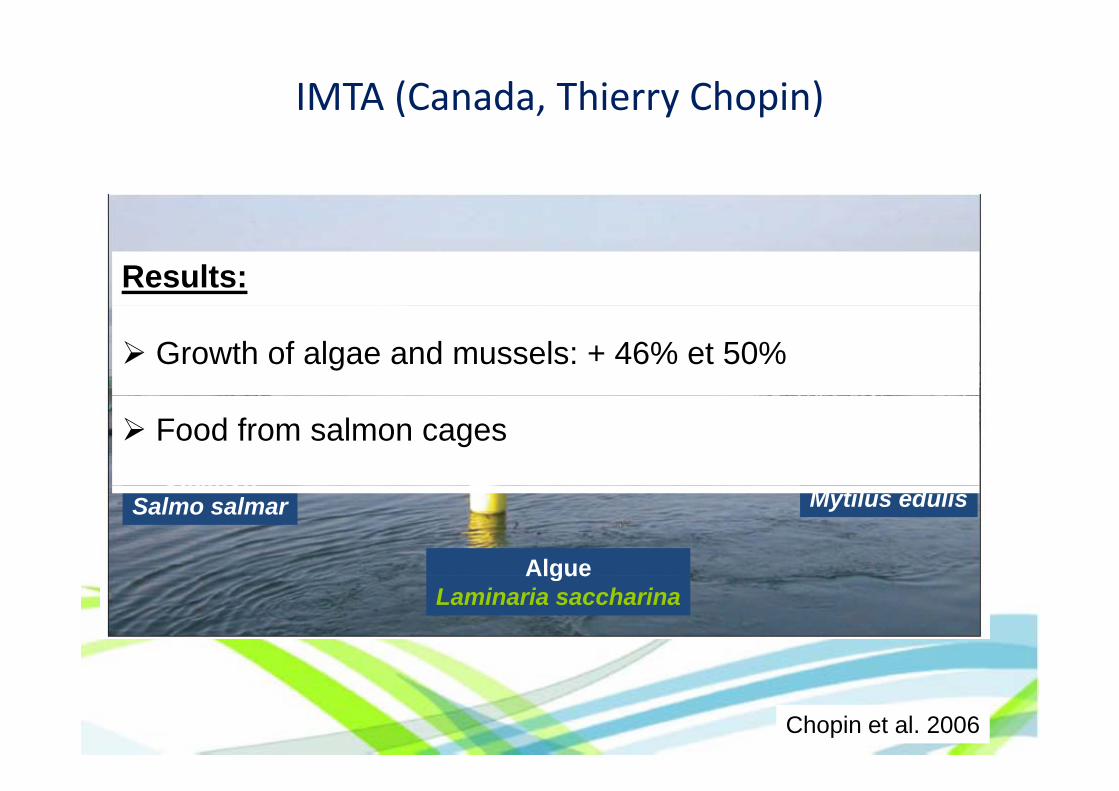
IMTA (Canada, Thierry Chopin)
Results:
Growth of algae and mussels: + 46% et 50%
Saumon Moule Food from salmon cages
SaumonSalmo salmar Mytilus edulis
AlgueAlgueLaminaria saccharina
75Chopin et al. 2006

Sustainable Aquaculture (Canada, Steve Cross)

Steve Cross
77

SEACASE project (2006 2010)SEACASE project (2006‐2010)
Hussenot, Richard, 2010

The Genesis IAS: French and Israëli d t ti it (l d b d i lt h)demonstration units (land-based in a salt-marsh)
Fish earthen pondS i i
pSedimentation earthen pond
esis
A Seabass 80 m3,
Dissolved nutrients
y: G
enSE
A Seabass600 m3, 1 TRes. Time 1 to 3 d
80 m3, Res. Time 5 to 10 h
stu
dy
Lagoon Conversion
ParticulatenutrientsC
ase
gWetland
Phytoplankton d600 3
Hussenot & Shpigel, 2003
pond200 to 300 m3, Res. Time 10 to 40 h
Oysters600 m3, 1 to 3 TRes. Time 1 to 3 d
600 m3, Res. Time 1 to 3 d
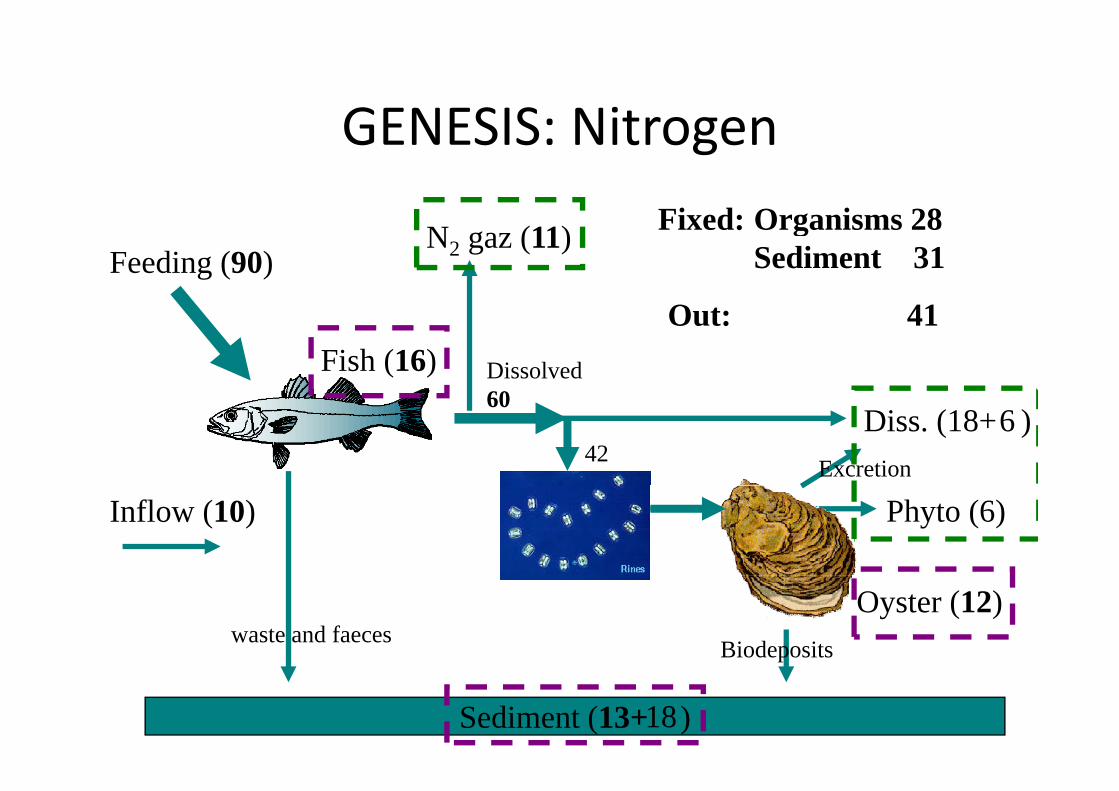
GENESIS: NitrogenGENESIS: NitrogenFixed: Organisms 28
Feeding (90)N2 gaz (11) Fixed: Organisms 28
Sediment 31
O t 41Fish (16) Dissolved
60
Out: 41
Diss. (18+ )60
426
Excretion
Inflow (10) Phyto (6)
Oyster (12)waste and faeces Biodeposits
Sediment (13+ )18
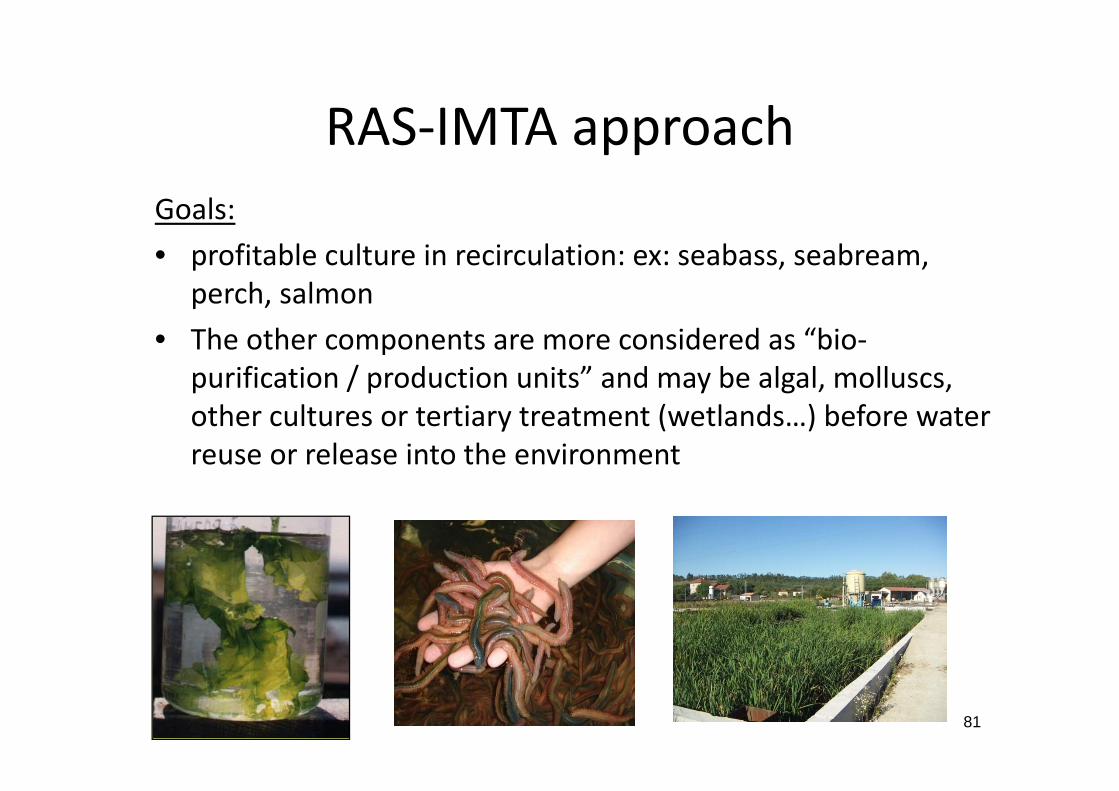
RAS IMTA approachRAS‐IMTA approachGoals:Goals:• profitable culture in recirculation: ex: seabass, seabream,
perch, salmonp ,• The other components are more considered as “bio‐
purification / production units” and may be algal, molluscs,other cultures or tertiary treatment (wetlands…) before water reuse or release into the environment
81

RAS‐IMTA
FiltreBio
NH4+
NO3-NH4+
NO3‐
RAS (Di t h l b )
20-80 mg/l
Macroalgues (Ulva sp.)RAS (Dicentrachus labrax)
FècesNH4+
PO43-
Alimentation animale
Polychètes (Nereis sp.)

MacroalgaeFish biomass (60 to 140 kg/m3)
Macroalgae
N(NO3) 20 - 80 mg /L P(PO4) 1 - 5 mg /LS. Solids 5 - 20 mg/L
Dissolved excretionUlva sp.
83

MacroalgaeMacroalgaeIn high rate algal pond
• In the HRAP: 99% of green macroalgae(Ulvae) all year round(Ulvae) all year round • Average yearly efficiency 50% for N and P removalfor N and P removal
• Seabass standing stock of 2T (up to 100kg/m 3) :
300m2 of HRAP would produce300m2 of HRAP would produce1T of macroalgae DW (density < 0.2 g DW.l‐1) 50 kg of phytoplancton (d. w.) per yearg p y p ( ) p y
84
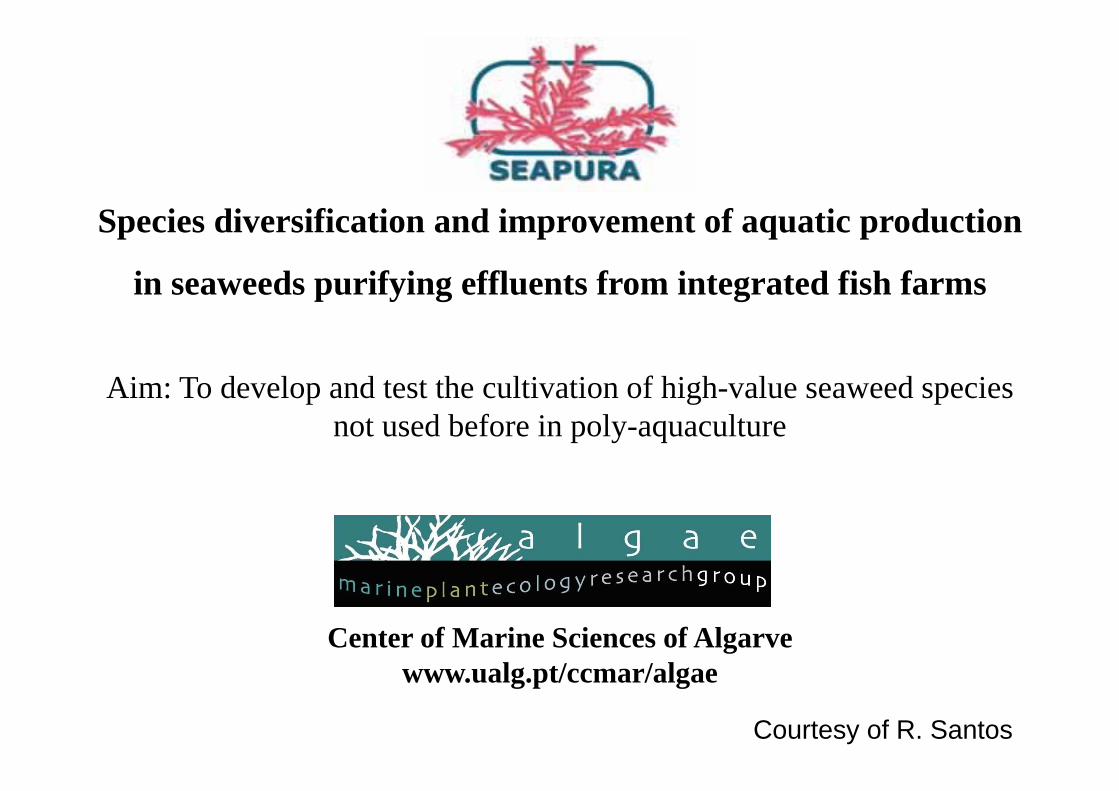
Species di ersification and impro ement of aq atic prod ctionSpecies diversification and improvement of aquatic production
in seaweeds purifying effluents from integrated fish farms
Aim: To develop and test the cultivation of high-value seaweed speciesAim: To develop and test the cultivation of high value seaweed species not used before in poly-aquaculture
Center of Marine Sciences of Algarvel t/ / lwww.ualg.pt/ccmar/algae
Courtesy of R. Santos

Species testedGenus Major commercial use as a source forAsparagopsis * Halogenated antibiotic compoundsAsparagopsis * Halogenated, antibiotic compoundsPlocamium Tetra-chloro monoterpene as anti-foulingH l H l d ibi i dHypoglossum Halogenated, antibiotic compoundsDictyota Extract to treating and improving bone disorders
h isuch as osteoporosisCodium CosmeticsHalopytis * Dibromophenol, dimethyl sulfophoniopropionate
as antibacterial agentLaurencia Terpene with antitumoral activity Hypnea * Prostaglandins productionAnotrichium * Biliproteins, phycobilisomes
Courtesy of R. Santos

1 ton of fish excrete 500 g TAN d-11 ton. of fish excrete 500 g TAN d 1
TAN flux (uM h-1) 25 50 100 200 400 600
Removal (%) 82.9 71.5 53.2 29.5 9.1 2.8
Yield (g DW m-2 d-1) 18 31 51 76 99 110
Surface needed (m2) 124 62 31 15.5 7.8 5.2
Total yield (g d-1) 2232 1922 1581 1178 772 572
Depending on the objectives and characteristics of the farm Depending on the objectives and characteristics of the farm, calculations can be made in order to optimise either the removal efficiency / biomass yield or surface needed.efficiency / biomass yield or surface needed.
Courtesy R. Santos
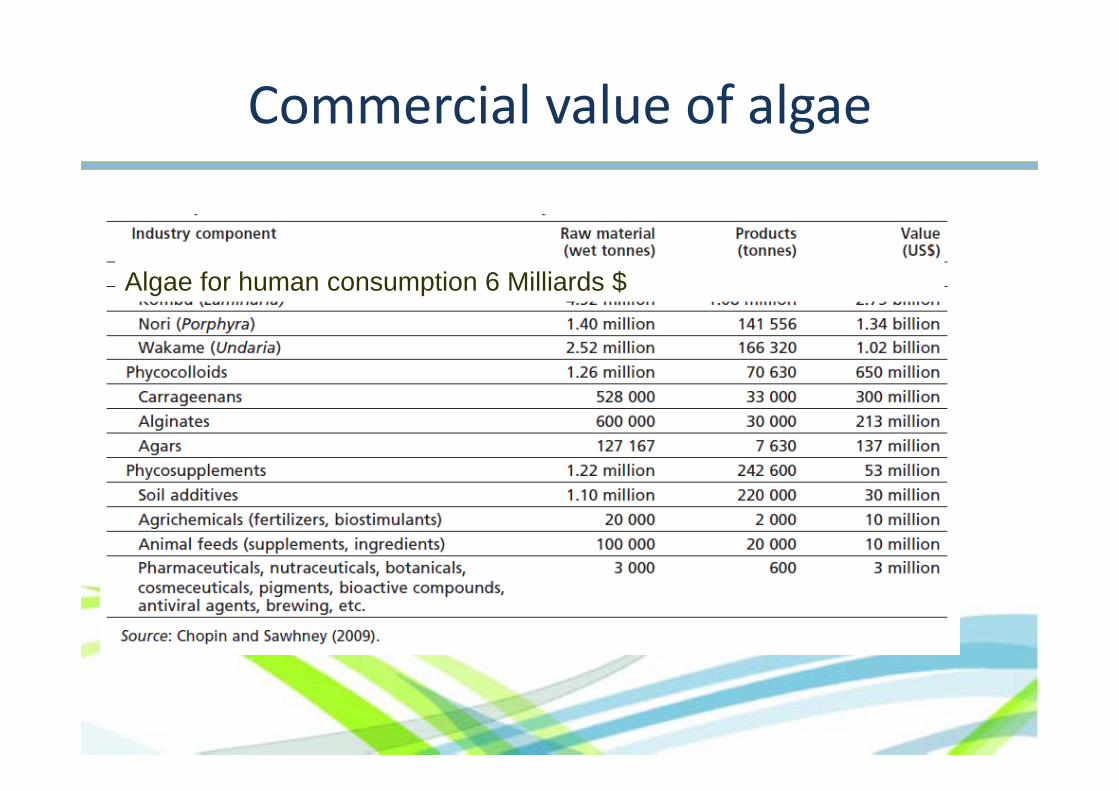
Commercial value of algaeg
Algae for human consumption 6 Milliards $
88

Constructed Wetlands CWs
Constructed wetlands remove fine particulate and dissolved nutrients following recycling of heavier particulate fraction in the effluent + maintain biodiversity 89

MicroalgaeMicroalgae
Lagunage Haut Rendement Algal (LHRA) = Volume 8 m3, surface 11 m2, profondeur 0.5 m.
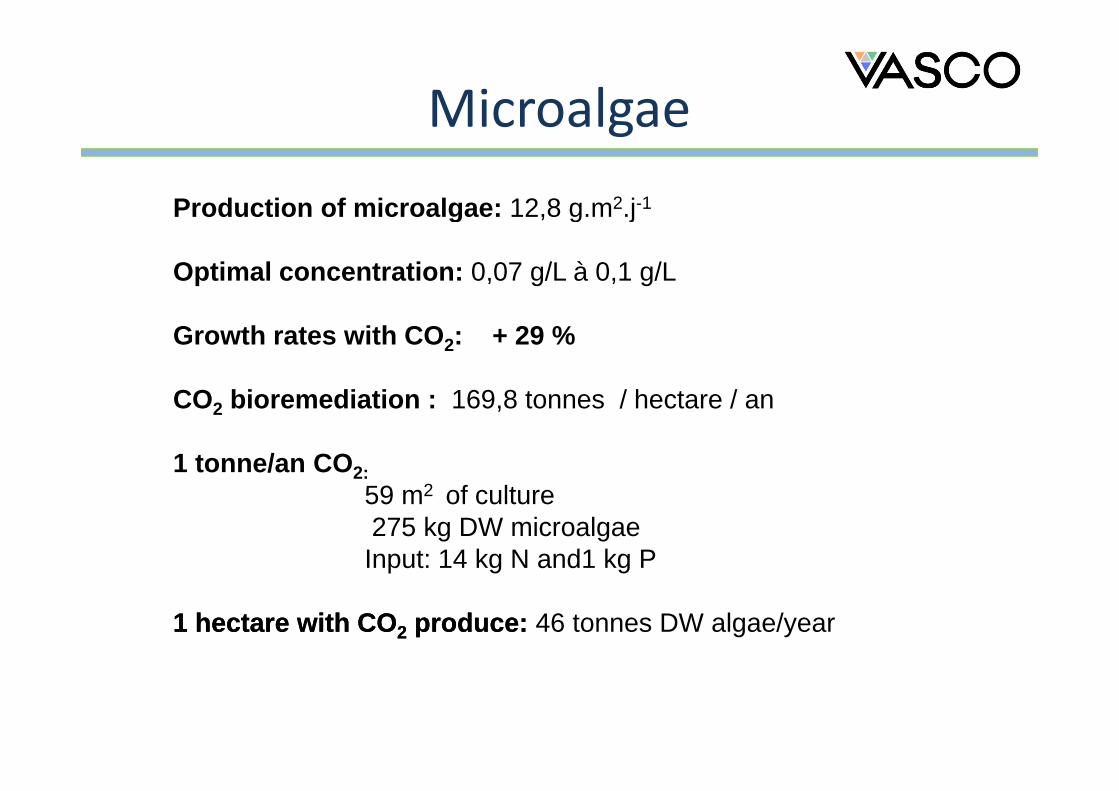
MicroalgaeProduction of microalgae: 12,8 g.m2.j-1
MicroalgaeProduction of microalgae: 12,8 g.m .j
Optimal concentration: 0,07 g/L à 0,1 g/L
Growth rates with CO2: + 29 %
CO bioremediation : 169 8 tonnes / hectare / anCO2 bioremediation : 169,8 tonnes / hectare / an
1 tonne/an CO2:59 2 f l59 m2 of culture275 kg DW microalgaeInput: 14 kg N and1 kg P
1 hectare 1 hectare withwith COCO22 produceproduce: : 46 tonnes DW algae/year

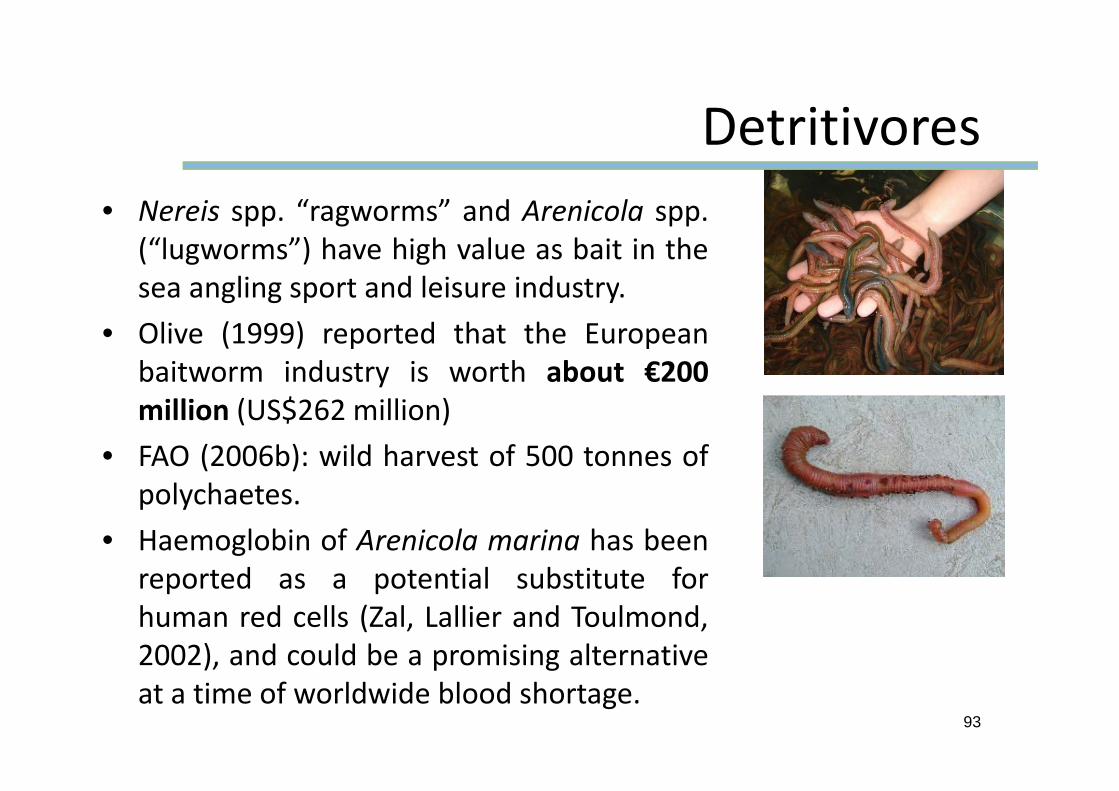
Detritivores• Nereis spp “ragworms” and Arenicola spp
DetritivoresNereis spp. ragworms and Arenicola spp.(“lugworms”) have high value as bait in thesea angling sport and leisure industry.
• Olive (1999) reported that the Europeanbaitworm industry is worth about €200million (US$262 million)
• FAO (2006b): wild harvest of 500 tonnes ofl hpolychaetes.
• Haemoglobin of Arenicola marina has beenreported as a potential substitute forreported as a potential substitute forhuman red cells (Zal, Lallier and Toulmond,2002), and could be a promising alternative2002), and could be a promising alternativeat a time of worldwide blood shortage.
93
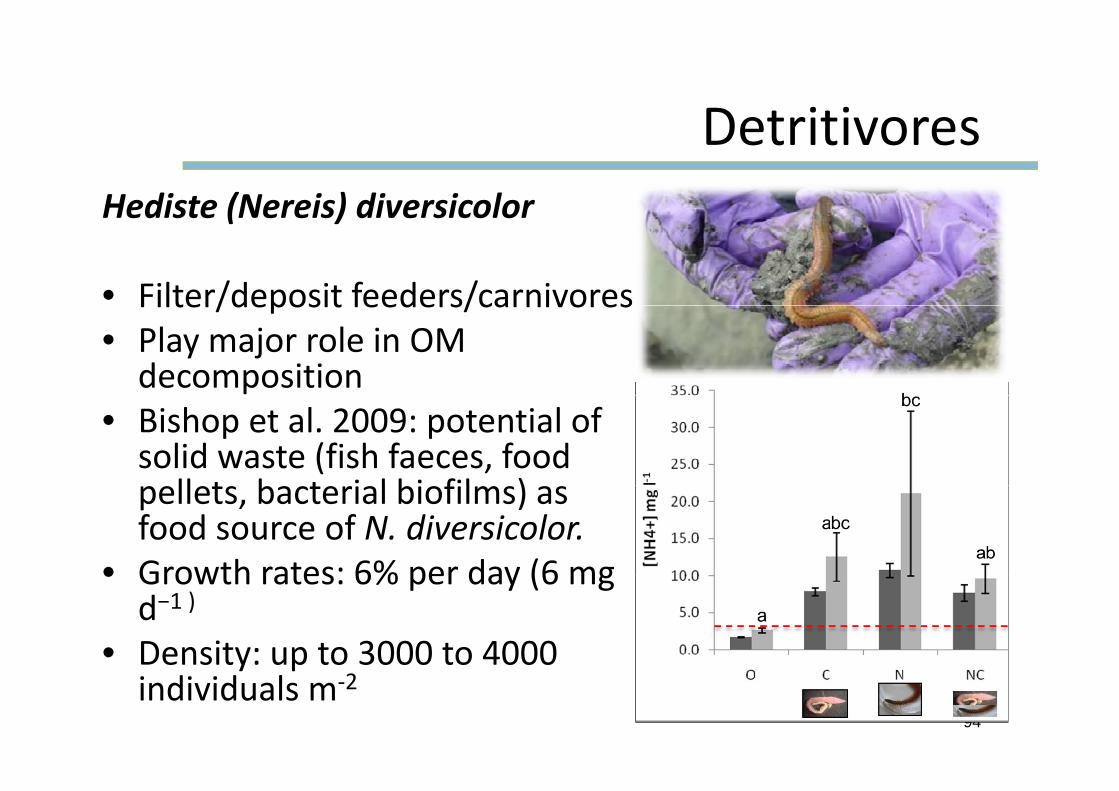
DetritivoresHediste (Nereis) diversicolor
DetritivoresHediste (Nereis) diversicolor
• Filter/deposit feeders/carnivoresFilter/deposit feeders/carnivores• Play major role in OM decomposition
• Bishop et al. 2009: potential of solid waste (fish faeces, food
ll t b t i l bi fil )pellets, bacterial biofilms) as food source of N. diversicolor.
• Growth rates: 6% per day (6 mg• Growth rates: 6% per day (6 mg d−1 )
• Density: up to 3000 to 4000 e s y up o 3000 o 000individuals m‐2
94

Discussion and perspectivesp p
Regardless of the situation, adoption ofecological intensification involvesconcerted efforts that depend onconcerted efforts that depend onconditions for adopting innovations butalso processes of collective engagement.
Thank you for your attentionThank you for your attention
Guide for ecological intensification of fish farming (Aubin et al, 2014).


