Sustainable Agriculture: An On-Farm Assessment Tool Report prepared for Ben and Jerry's Homemade, Inc. South Burlington, Vermont Carey Bylin, Ruchi Misra, Mindy Murch and Wendy Rigterink Report No. CSS04-04 March 11, 2004
Transcript
Sustainable Agriculture:
An On-Farm Assessment Tool
Report prepared for Ben and Jerry's Homemade, Inc.South Burlington, Vermont
Carey Bylin, Ruchi Misra, Mindy Murch and Wendy Rigterink
Report No. CSS04-04
March 11, 2004
Sustainable Agriculture: An On-Farm Assessment Tool Report prepared for Ben and Jerry’s Homemade, Inc. South Burlington, Vermont
Carey Bylin, Ruchi Misra, Mindy Murch and Wendy Rigterink Center for Sustainable Systems
University of Michigan Ann Arbor, MI
11 March, 2004
a report of the Center for Sustainable Systems Report No. CSS04-04
Document Description SUSTAINABLE AGRICULTURE: AN ON-FARM ASSESSMENT TOOL Report prepared for Ben and Jerry’s Homemade, Inc., South Burlington, Vermont Carey Bylin, Ruchi Misra, Mindy Murch and Wendy Rigterink Center for Sustainable Systems, Report No. CSS04-04, University of Michigan, Ann Arbor, Michigan, March 11, 2004. 95 pp. This document is available online: http://css.snre.umich.edu Center for Sustainable Systems The University of Michigan 430 East University, Dana Building Ann Arbor, MI 48109-1115 Phone: 734-764-1412 Fax: 734-647-5841 e-mail: css.info@umich http://css.snre.umich.edu Copyright 2004 by the Regents of the University of Michigan
SUSTAINABLE AGRICULTURE: AN ON-FARM
ASSESSMENT TOOL
1
INTRODUCTION TO DAIRY FARM TOOLKIT
INTRODUCTION This Toolkit is designed to provide the Vermont dairy farmer with information on how his or her current practices compare economically, socially and environmentally to best management practices. Additional resources are provided on how to improve upon these practices, if desired.
UNDERSTANDING THE TOOLKIT When farms are operated in balance with the earth’s natural systems such as air, water, energy and nutrients, nature’s principles are applied to sustain a farm’s natural resources. Sustainable dairy farming strives to protect and enhance the natural environment, animal welfare, and local communities, while simultaneously ensuring profitability and providing a high quality of life for farmers and their families. This Toolkit contains ten Educational Modules, each of which covers a topic critical to sustainable dairy farming in Vermont. Modules focus on:
Animal Welfare Nutrient Management
Biodiversity Organic
Community Health Pest Management
Energy Health
Farm Financials Water Management These modules are designed to be reviewed one by one, and in no particular order. This way, you have the flexibility to focus on areas of interest as time permits. Each module focuses on either an economic, environmental, or social issue and has the following parts:
o Description. Provides an explanation of the topic and its relevance to dairy farming. Also, any unusual terms that may be used are clarified in this section.
o Incentives for Change. This section addresses the benefits you can expect by improving practices within this area. Such benefits may include cost savings, improved human health and environment, improved public image, and regulatory compliance.
o Assessment Questions. You will be asked to answer approximately five to ten questions regarding the topic area. The majority of questions are multiple-choice with the first possible answer a status quo baseline practice and the last possible answer, a best practice. Each question or set of questions is followed by a brief discussion that provides an explanation of desirable practices and connections between the listed practices in relation to the indicator topic.
2
o Linkages to Other Modules. The topics in a given module are often linked to
topics in other modules. This section outlines where related topics are covered in different modules. A chart displaying the linkages can also be seen below:
Ani
mal
Wel
fare
Bio
dive
rsity
Com
mun
ity H
ealth
Ene
rgy
Farm
Fin
anci
als
Nut
rient
Man
agem
ent
Org
anic
Pes
t Man
agem
ent
Soi
l Hea
lth M
anag
emen
t
Wat
er M
anag
emen
t
Animal Welfare X X X X X X XBiodiversity X X X X X X X XCommunity Health X X X X XEnergy X X X X XFarm Financials X X X X X XNutrient Management X X X XOrganic X X X XPest Management X X XSoil Health Management X XWater Management X
o Further Information. After completing these short Educational Modules, you
may find that you would like to gain additional information on the subject. This section includes additional information including helpful websites, organizations, and other resources.
o Summary of Results. This section summarizes your responses and rates your overall performance according to a ‘stop light’ system. A “Green” score means that you are utilizing best practices; a “Yellow” score means that while some good practices are being used, there are some key areas to improve upon; and a “Red” score means that you should carefully review your practices and make an effort to improve your practices in the topic area.
The goals of this program are to introduce farmers to best management practices as they relate to sustainable dairy farming. While many farmers may already be operating at a ‘best practice’ level, others may benefit from making changes to existing practices. Given that farmers’ have limited time for other endeavors, when farmers do find that they could improve their processes, the anticipation is that this program will be a continual work in progress and may run for numerous years, as change, especially on a farm, takes time. The general process is anticipated as the following:
1. Evaluate your farms on a module-by-module basis, as time permits. 2. Meet with a representative from Organization X to review assessment results and
discuss which areas are of top importance and to discuss alternative practices within the specific area of focus. Discuss limitations or concerns that are specific to your farm.
3. Make modifications to farm practices with assistance from the representative and/or additional information sources.
4. Steps 2 – 5 continue on an on-going basis, with periodic updates to the modules.
3
These steps and resulting changes in on-farm practices will help to transition the farm from existing practices to desirable practices or sustainable dairy farming. Gradual change is anticipated.
SPONSOR ORGANIZATIONS The development of the Educational Modules was sponsored and initiated by Ben & Jerry’s, as they recognize the importance of dairy farmers to their product and want to help create value for the dairy farmer. Part of their corporate mission is to improve the quality of life locally, nationally, and internationally and to use natural ingredients and conduct business in a way that promotes respect for the Earth’s natural resources.
4
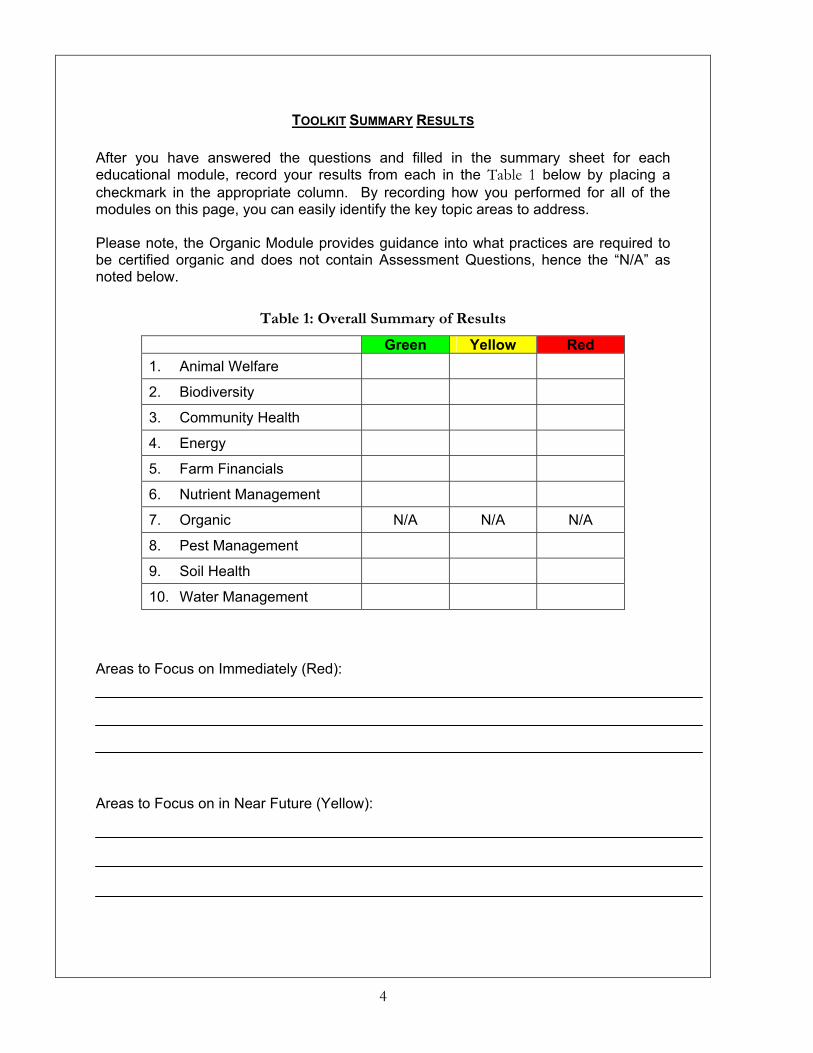
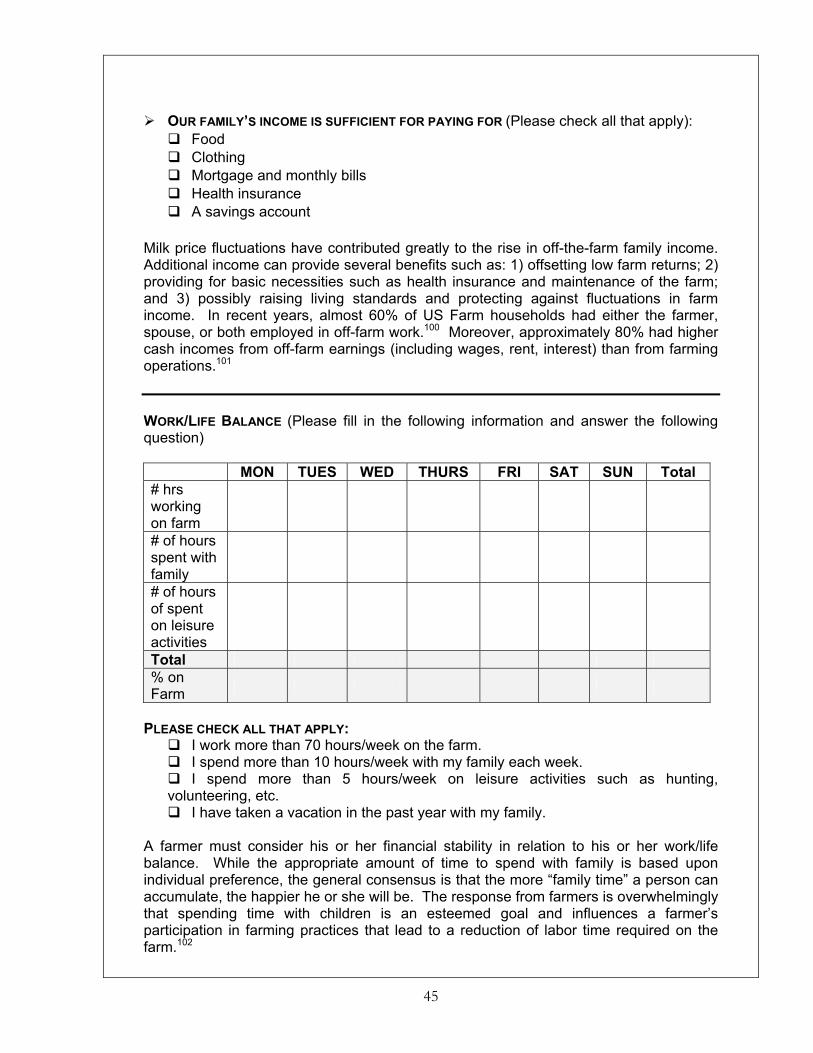
TOOLKIT SUMMARY RESULTS After you have answered the questions and filled in the summary sheet for each educational module, record your results from each in the Table 1 below by placing a checkmark in the appropriate column. By recording how you performed for all of the modules on this page, you can easily identify the key topic areas to address. Please note, the Organic Module provides guidance into what practices are required to be certified organic and does not contain Assessment Questions, hence the “N/A” as noted below.
Table 1: Overall Summary of Results
Green Yellow Red 1. Animal Welfare
2. Biodiversity
3. Community Health
4. Energy
5. Farm Financials
6. Nutrient Management
7. Organic N/A N/A N/A
8. Pest Management
9. Soil Health
10. Water Management
Areas to Focus on Immediately (Red): Areas to Focus on in Near Future (Yellow):
5
ANIMAL WELFARE EDUCATIONAL MODULE
DESCRIPTION Animal welfare is defined by the American Veterinary Medical Association as the “human responsibility that encompasses all aspects of animal well-being, including proper housing, management, nutrition, disease prevention and treatment, responsible care, humane handling, slaughter and, when necessary, humane euthanasia.”1 While dairy farmers inherently know that animal welfare should be a top concern, significant pressure to increase profits may encroach on this consideration as a trade-off for short-term gain. To be successful in the long term, a farmer must provide for appropriate animal welfare, as “any animal will perform well below potential wherever under nutrition or stress is present.” 2 Three main areas should be reviewed in order to ensure optimal performance: nutrition, living conditions, and overall health. Animal nutrition refers to the type and quality of feed that are provided to the dairy cows. They should receive a well-balanced portion of grain to ensure enough energy for milk production and fiber to ensure proper digestion.3 An imbalance will result in poor milk production and/or health concerns. Living conditions refer to the general comfort of the animal. This includes the quality, size, and cleanliness of the living and milking space. Herd health refers to incidence of diseases, such as mastitis, lameness, infertility, and metabolic disorders will be used as a way to assess herd health. Nutritional intake and living conditions are important determinants of herd health.
INCENTIVES FOR CHANGE • Cost savings. When pressured to increase profits, farmers tend to focus on
increasing volume rather than on decreasing operating costs. By increasing milk volumes through unnatural means (rBGH, unbalanced feed, encouraging higher consumption, etc.), animal welfare may suffer and cost as much or more than the increase in profits due to associated production costs, health treatment costs and management demands.4 For example, as milk yields increase, diseases, such as lameness, mastitis or fertility problems, also increase.5 The greater the work demands on the cow, the more susceptible they are to disease and stress. Proper nutrition and living conditions can stave off disease, via prevention. Given the high costs associated with disease, such as vet costs, and lost revenues due to decreased milk production, farmers should investigate ways to prevent disease or other detriments to herd health. It is important to balance and understand the connection between high production and healthy cows.
• Improved public image. Farmers are unfortunately under critical review by the
public that may or may not truly understand the actual needs of the animals. Due to the increasing threat of unwanted attention from animal activist groups, a number of organizations are taking independent steps to ensure they do not come under scrutiny. One such example is Heifer International. This non-profit group provides a heifer to a family that is struggling to make ends meet. They recently developed guidelines regarding animal welfare practices for the receiving families. Similarly, the farmer that proactively modifies his or her practices not only avoids this potential negative publicity, but may also receive positive responses.
6
ASSESSMENT QUESTIONS For all questions, please choose the categories that best identify your current management practices. Use the summary sheet on the last page of this module to evaluate overall performance. HERD NUTRITION6
1. Herd nutrition is inadequate or not monitored. 2. Farmer works with off-farm organization that has nutritional expertise and
determines appropriate balance for cows. 3. In addition to #2, farmer understands connection between metabolic diseases
(such as ketosis, retained placenta, infertility, etc.) and nutritional needs. Records are kept regarding rations and nutritional value.
4. In addition to #3, rations are modified/reduced based on excess nutrients passing through cows into the manure.
The level of understanding and monitoring involved in herd nutrition is important because it has significant implications for milk production and herd health.7 By keeping records regarding changes in diet, patterns may emerge that will help to identify best nutrients for a specific herd. The closer the farmer and/or nutritionalist can get to meet each cow’s exact needs, the more cost-effective the process will be. OVERALL HEALTH8
1. Herd health is inadequate. 2. Herd health is recorded for each cow, by milk production, body condition,
diseases, foot and leg problems, vaccinations and medications. Veterinarians make monthly visits to inspect animals and sick animals are given appropriate vaccinations and antibiotics.
3. In addition to #2, herd health is visually checked daily. Sick cows are housed and milked separately from the herd.
4. In addition to #3, farmer focus to determine causes of sub-optimal health issues and implement preventative measures, with help from specialists, like veterinarians.
Understanding and monitoring herd health is critical to understand the condition of your cows. It is important to analyze and track cows individually, to ensure each cow is in optimal health and producing high quality milk. Similarly, it is important to separate sick cows from the rest of the group to minimize the spread of disease. Taking preventative measures is a best practice as problems are corrected before they start. HEALTH OF INCOMING/OUTGOING ANIMALS9
1. Incoming animals without known health histories are brought directly onto farm. 2. Incoming animals are from herds with known health status and effective
vaccination programs. 3. In addition to #2, incoming animals are carefully examined for health concerns
and are thoroughly washed before bringing them onto the farm. Visitors wear booties or clean their boots prior to entering the barn.
7
4. In addition to #3, animal delivery to renderers and cattle dealers is done outside of barns, without contact between these individuals and other animals. Additional bio-security measures, such as farm signage instructing visitors how to proceed onto the farm, are taken.
Just as there is concern regarding the spread of disease within the farm, steps should also be taken to decrease the chance of spreading disease among farms. A few simple precautions regarding animal transportation and integration can minimize the potential risk. MILK QUALITY
1. While milk quality, as measured by somatic cell count (SCC), is reported, there is no time to review this information.
2. Milk quality is periodically monitored through SCC. Farmer understands milk quality and health implications of high SCC, and monthly average is less than 350,000.
3. SCC counts are monitored regularly, and farmer has acceptable target range of SCC. Average monthly SCC is less than 250,000.
4. In addition to #3, the average monthly SCC is less than 150,000. An economic consideration via price premiums is determined in part by SCC, as set by the St. Albans Co-op. SCC indicates the presence of mastitis, which decreases milk production and may be contagious. In terms of managing mastitis, early identification is best to prevent spreading, and various management practices can reduce the likelihood of this infection. For example, farmers have seen a decrease in mastitis incidence when they increase the amount of time their cows are outside (to be more than 50% of the time). This pasturing assumes optimal outdoor conditions, such as well-drained pastures to minimize mud. This deals effectively with environmental pathogens that cause mastitis. The other cause of mastitis, contagious pathogens, can be decreased by correctly managing milking procedures.10 LACTATIONS11
1. Farmer does not monitor the number of lactations per cow. 2. Farmer monitors number of lactations per cow and herd averages less than 3
lactations per cow. 3. Farmer monitors number of lactations per cow and herd averages 3 to 5
lactations per cow. 4. Farmer monitors number of lactations per cow and herd averages more than 5
lactations per cow. “Most modern dairy cows have a life span of less than four lactations.”12 Cows that are stressed or treated only to optimize milk production typically have a shorter productive life span. A farm that consistently has younger herds may produce more milk, but with higher operating costs related to more frequent heifer replacement.
8
HOUSING/HANDLING AREAS13 1. Housing and handling areas are inadequate, causing undue stress. Walking
areas are poor quality, either slippery or too rough. Cattle spend over 4 hours/day standing.
2. Housing and handling areas are maintained in clean and dry conditions with adequate clean bedding, feeders and water stations.
3. In addition to #2, housing and handling areas are large enough to allow normal social behaviors and minimize cow stress.
4. In addition to #3, new or renovated housing/handling areas implement advanced design features to minimize stress by aligning cow movement patterns to match a cow’s own natural tendency.
Stress levels of a cow can not only impact productivity and depressed social behavior, but also overall health. Housing features significantly impact stress levels. The type of flooring in walking and standing areas, as well as the amount of time standing on concrete, also have large impacts on the incidence of lameness. Additionally, clean, dry bedding is critical to prevent mastitis.
STALLS 1. Stalls are inadequate, causing undue stress. 2. Stall dimensions are large enough for cows to lie comfortably, including sufficient
width, headroom and clean bedding. 3. In addition to #2, cows use stalls as designers intended. Each stall has TWO of
the following attributes: slight slope to the stall, applied lime to base, appropriate lighting or sufficient ventilation.
4. In addition to #3, there are 5% more stalls in the barn than there are cattle, enabling normal social behaviors and minimizing cattle stress.
Cows, especially in confinement operations, spend a significant amount of time in their stalls. Ensuring that the cow can maneuver around comfortably is critical to its health. If a stall is not designed properly, the cow may be forced to behave in non-natural ways (such as standing for long time periods). Sometimes the physical design of the stall is sufficient, however, social relations among cows may disrupt optimal behavior. For example, it is not uncommon to see lower social standing cows forced to stand for long periods of time, mainly because the only place to lay down is close to a dominant cow. This, too, results in an increase in health problems and a decrease in milk production. By providing additional stalls, the farmer allows a comfortable place for these lower social standing cows.
PASTURING14 1. Pastures are open-grazed, undivided and inadequate for all pasturing cows. 2. Pastures are adequate for all pasturing cows. If cows are wintered outside,
conditions are carefully monitored and provisions are made to ensure adequate food, water, bedding and shelter during severe weather; shelter and teat care are adequate to prevent frostbite; sufficient extra feed is provided to maintain body condition; cows are clean and dry when turned out after milking; and manure from wintered cattle is not allowed to contaminate surface water.
9
3. In addition to #2, at least four paddock divisions are maintained. Rotations are scheduled to maintain adequate re-growth.
4. In addition to #3, forage species are managed for maximum, vegetative production. Forage stubble heights are maintained by cows. Supplemental feed, water and shelter sites within paddocks are also rotated to prevent erosion and reduce compaction in these areas.
While mixed opinions exist regarding herd health benefits of pasturing, this topic was included for completeness as optimal pasturing conditions lead to improved herd health. Pasturing cows allows them the freedom to exercise and live in a more natural environment. Again, as with confinement, certain provisions must be considered for this method to be optimally beneficial for both the cows and the land.
MILKING EQUIPMENT AND PARLOR15 1. Milking equipment and facilities are not in good operating order. 2. Milking equipment and facilities are adequate and in good working order. 3. Milking equipment is tested for proper function. Facilities are designed and
maintained for animal comfort. Milking area is clean and well ventilated. 4. In addition to #3, newborn calves are monitored in the first 48 hours to ensure
they consume sufficient colostrum. Given that cows are typically milked twice a day, it is critical to the comfort of the animal that the milk equipment is functioning properly. The milking facility is also an area where contagious diseases can be spread. By increasing the cleanliness and ventilation in these areas, the likelihood of spreading diseases is decreased. CALF RAISING CONDITIONS (Please check all that apply) Calves consume colostrum during the first 48 hours. Calves receive roughage by two weeks of age. Sufficient space is provided for calves to lie comfortably, with legs stretched out. Calves are provided clean, dry, and well-ventilated housing. Calves' navels are dipped in iodine.
Special attention is required early in the life of a cow in order to ensure an optimally healthy life. Just as with mature cows, the three things that must be considered for calves are: nutrition, living conditions and overall health. For calves, nutritional concerns revolve around consuming colostrums shortly after birth and roughage within the first two weeks. Living conditions for calves should be clean, dry and well ventilated with sufficient room for movement and to lie comfortably. Just as for older cows, living conditions can help to discourage (or encourage if not appropriate) disease incidence. One final practice to ensure optimal health for the calf is dipping the umbilical cord in iodine. The umbilical cord is a hallow tube and if not treated properly, pathogens which cause disease can enter the calf’s circulatory system. This can result in mortality or naval infection. Iodine serves to clean, sanitize and dry the end of the umbilical cord, which in turn closes the tube quicker, thereby decreasing the chance of pathogens entering the calf’s system.16
10
LINKAGES TO OTHER MODULES While the questions above cover the basics of animal welfare, other practices also have impacts. Please review your practices regarding the following topics in the Educational Modules listed below. ANIMAL WELFARE TOPIC OTHER MODULE(S) Manure Management Nutrient Management Clean Water Water Management Genetic Diversity Biodiversity Potential Erosion Soil Health Living Conditions and Nutrition Organic
FURTHER INFORMATION Additional details and information on the above can be obtained through the following programs. • Appropriate Technology Transfer for Rural Areas (ATTRA). “Sustainable
Agriculture: An Introduction.” http://attra.ncat.org. ATTRA specializes in developing sustainable agricultural information and tools. For a summary of the practices they advocate regarding animal welfare, see “Sustainable Agriculture: An Introduction” at http://attra.ncat.org/attra-pub/PDF/sustagintro.pdf. Contact: Ann Wells, phone: 1-800-346-9140.
• The Food Alliance. http://www.thefoodalliance.org/. This organization certifies
producers, which use socially and environmentally responsible farming practices. The certification process includes sections on natural area management, watershed management, crop management, pest management, pastureland management, and animal welfare. Details on animal welfare are included under animal husbandry.
• Farm Animal Welfare Council (FAWC). This organization was established by the
United Kingdom government but is an independent advisory board that is active in reviewing the welfare of farm animals. They produced a report, “Report on the Welfare of Dairy Cattle by Farm Animal Welfare Council,” which identifies a number of concerns and solutions regarding dairy cattle. http://www.fawc.org.uk/reports/dairycow/dcowrtoc.htm.
• Facility Designs that Minimize Stress. Dr. Temple Grandin, as Associate
Professor of Animal Science at Colorado State University, has conducted research regarding the design of cow facilities and how to minimize stress on the animal. While she has focused more on beef cattle, there are crossover learnings. Specific topics and links with additional information are: o Non-slip flooring: http://www.grandin.com/design/non.slip.flooring.html o Livestock handling systems: http://www.grandin.com/design/design.html o Handling and transport: http://www.grandin.com/behaviour/transport.html
• Cooperative Extension, Institute of Agriculture and Natural Resources,
University of Nebraska - Lincoln. www.ianr.unl.edu/pubs/animaldisease/g1032.htm#nutritionally. This website, titled “Dairy Cow Health and Metabolic Disease Relative to Nutritional Factors,” contains
11
information provided by a veterinarian and dairy specialist. It focuses on the interconnections between herd health and metabolic diseases.
12
SUMMARY OF RESULTS FOR ANIMAL WELFARE Instructions: In the table below, please record the score for the answer you selected for each question. For multiple-choice questions, the response number serves as your score for that category (i.e. choice # 2 is worth 2 points). For “check all that apply questions,” please see scoring criteria for each question in the chart below. Once all responses have been completed, add up the answers and record the total. QUESTION ANSWER/SCORE
1. Herd Nutrition
2. Overall Health
3. Health of Incoming/Outgoing Animals
4. Milk Quality
5. Lactations
6. Housing/Handling Areas
7. Stalls
8. Pasturing
9. Milk Equipment
10. Calf Raising Conditions (Add 1 for each box checked)
Total Score
Total Possible Points 41
Interpretation: The next step in understanding your farm’s performance in the category of Animal Welfare is to compare your results to best practices. Below is a table that ranks your performance from best practices (green) to practices that require improvement (red). Compare the number of points you received for your farm compared to optimal practices. Point Range Interpretation
Green 35 - 41 Best practices regarding Animal Welfare are currently being employed on this farm.
Yellow 25 - 34 Farm is using some good practices regarding Animal Welfare, however there are some key areas that should be improved upon.
Red 9 - 24 Animal welfare practices should be carefully evaluated and a strong effort should be made to adopt improved practices in several areas.
13
1 American Veterinary Medical Association Policy on Animal Welfare and Animal Rights. Animal Welfare Guidelines, Heifer International. 2 International Livestock Research Institute. <http://www.cgiar.org/ilri/dbtw-wpd/fulldocs/smhdairy/22egan-02.htm>. 8 July 2003. 3 Wells, Ann. Personal Interview. 30 July 2003. 4 “Report on the Welfare of Dairy Cattle by Farm Animal Welfare Council (UK).” Sept. 2003. <http://www.fawc.org.uk/reports/dairycow/dcowr079.htm>. 12 Oct. 2003. 5 Broom, Donald M., “Effects of Dairy Cattle Breeding and Production Methods on Animal Welfare.” University of Cambridge, Department of Clinical Veterinary Medicine. <http://www.nal.usda.gov/awic/pubs/dairy/effects.htm>. 8 July 2003. 6 Question adapted from The Food Alliance. Dairy Inspection Tool for the Pacific Northwest. 2002. 7 Rice, Duane N. and Grant, Rick. “Dairy Cow Health and Metabolic Disease Relative to Nutritional Factors.” Institute of Agriculture and Natural Resources, Cooperative Extension, University of Nebraska-Lincoln. July 1996. <www.ianr.unl.edu/pubs/animaldisease/g1032.htm#nutritionally>. September 2003. 8 Question adapted from The Food Alliance. Dairy Inspection Tool for the Pacific Northwest. 2002. 9 Ibid. 10 Appropriate Technology Transfer for Rural Areas. Dairy Farm Sustainability Checksheet. March 2001. <http://attra.ncat.org/attra-pub/PDF/dairychecksheet.pdf>. 10 June 2003. 11 Question adapted from The Food Alliance. Dairy Inspection Tool for the Pacific Northwest. 2002. 12 “Report on the Welfare of Dairy Cattle by Farm Animal Welfare Council (UK).” Sept. 2003. <http://www.fawc.org.uk/reports/dairycow/dcowr079.htm>. 12 Oct. 2003. 13 Question adapted from The Food Alliance. Dairy Inspection Tool for the Pacific Northwest. 2002. 14 Ibid. 15 Question adapted from The Food Alliance. Dairy Inspection Tool for the Pacific Northwest. 2002. 16 Leadley, Sam and Sojda, Pam, “Calving Ease.” March 2001. <http://www.calfnotes.com/pdffiles/CNCE0301.pdf>. 1 Dec. 2003.
14
15
BIODIVERSITY EDUCATIONAL MODULE
DESCRIPTION Biodiversity refers to all plants, animals, and microorganisms existing and interacting within an ecosystem.17 In an agricultural setting, biodiversity can be viewed in layers: microorganisms and worms living in the soil; native plants, crops, and trees growing on top of the soil; and insects, birds, and animals inhabiting the plants, crops, and trees. The greater the number of microorganisms, plants, and animals in an ecosystem, the higher the level of biodiversity is. Humans also live within and alter natural ecosystems. Biodiversity levels are rapidly declining globally due to increased development by humans. The World Wildlife Fund reports that within the next 30 years, as much as 20% of the world’s species will go extinct.18 Within the United States alone, as of 2003, the Fish and Wildlife Service has classified a total of 1,821 species as threatened or endangered.19 Other organizations estimate that up to one-third of all plants and animals within the US are at risk.20 Vermont is also affected by declining biodiversity levels. Vermont has an estimated 2,274 species.21 Currently, the State of Vermont’s Nongame and Natural Heritage Program has identified 28 fish, 19 amphibians and reptiles, 16 mammals, 59 birds, 83 invertebrates (mostly beetles), 20 moths and 12 mollusks as rare and uncommon.22 The number comprises almost 10% of all species in Vermont. Moreover, eight of these species are listed as threatened or endangered under the Endangered Species Act.23 Plant and animal species fulfill a number of important roles in regulating the natural and agricultural environment. Microorganisms and worms in soil convert nitrogen and other nutrients into a usable form for plants and trees. Plants help to manage water runoff, filter impurities and toxins from water sources, cycle oxygen and provide habit for animals. Animals, such as bats, spiders, birds and other insects help regulate insect and rodent pests. Insects such as bees help to pollinate crops and wild plant species. Many of these species interact and depend upon one another, making high levels of biodiversity important for the functioning of the entire system. Agriculture, no matter how small the farm, alters the biodiversity in a landscape through the development of pastureland, crop fields and new structures. Oftentimes, farms are built in floodplains or along rivers and streams, areas typically highest in terms of biodiversity.24 The implementation of highly managed monoculture systems or development of pastureland displaces native species and reduces the biodiversity upon which the ecological functioning of an ecosystem depends. Genetically modified organisms can also displace native species or have adverse impacts on native populations. An example is one strain of Bacillus thuringiensis (Bt) corn, Bt 176. This strain, which is resistant to the European corn borer (a pest which costs US farmers approximately $1 billion in lost crop yields and crop protection costs), led to a severe decline in populations of monarch butterflies.25 Luckily the effects of the strain were small-scale in that only an estimated 2% of GMO corn was Bt 176 compared to strain MO810, which accounts for almost 95% of planted GMO corn.26 While this particular strain has since been removed from the marketplace, new GMOs may also have negative, unintended consequences. Sustainable agricultural processes that foster biodiversity through natural means and low-impact management practices provide an alternative. These processes help restore
16
ecosystem functioning and increase biodiversity levels.27 Practices such as low-till and no-till farming of feed crops, inter-species plantings, grazing-based management, integrated pest management techniques and other practices allow farmers to decrease use of costly external inputs such as fertilizers, pesticides, and GMO seed and replace these inputs with natural processes.28
INCENTIVES FOR CHANGE • Decrease in expensive external inputs. The benefits of increasing biodiversity are
most readily seen when the farm is viewed as part of an ecosystem. The key is to “identify and exploit combinations of crops, plants, animals, and practices that increase above- and below-ground diversity and foster proper ecosystem functioning.”29 For example, the use of no or low-till cropping practices maintains soil structure in the top layers of the soil surface, which provides habitat for species which recycle nutrients for plants. One square meter may contain 10,000 species with high population densities.30 These species assist plants in nutrient uptake and protect plants from disease.31 If destroyed by tillage practices and the application of certain pesticides, these species must be replaced by costly fertilizers as a means of maintaining production levels.
• Marketing opportunity. Certifications for environmentally and socially responsible
agricultural production, awarded by groups such as the Food Alliance program (www.thefoodalliance.org), require that farmers work to enhance biodiversity. This sustainable farming certificate may allow farmers to receive a premium for their practices. Genetic biodiversity is also marketable. Most dairy farmers focus on the genetic lineage of their cows or utilize different cultivars when growing crops. Registering cows to certify genetic lineage may allow a farmer to receive higher prices for heifers sold in the marketplace.
ASSESSMENT QUESTIONS For all questions, please choose the categories that best identify your current management practices. Use the Summary sheet on the last page of this module to evaluate overall performance. GENETIC DIVERSITY OF CROPS
1. I only use one variety of seed per crop per season. 2. I use more than one variety of seed per crop and track use of the different seed
varieties in my fields. 3. I inter-mix different seed varieties to increase genetic diversity throughout my
fields. 4. I inter-mix different seed varieties, crops, and utilize cover crops as a means of
increasing biodiversity in my fields.
Chromosomes, genes, and DNA “determine the uniqueness” of each individual within a species. Having an array of unique individuals or a genetically diverse number of seed types is important to protect crops from disease and other natural events such as drought that may wipe them out.32 Increasing the number and types of crops in a field also provides habitat for species, which increases biodiversity as well as encourages inhabitation by beneficial species such as spiders and birds.
17
NATURAL AREA CONSERVATION33 1. Few, if any, wild areas exist around fencerows or wooded areas to provide
habitat for birds, mammals, or other wildlife. 2. Fencerows and other areas are managed to provide limited wildlife habitat. Any
pastures on the farm are in good health and provide limited wildlife habitat. 3. Fencerows and other areas are managed to provide wildlife habitat. A
percentage of pastures, rest pads, ditches and other wild areas are not grazed or mowed until grassland bird nesting is complete. Pastures are managed for multiple (domestic and wild) species.
4. Fencerows and other areas are managed to provide wildlife habitat. Specific actions are planned and have been taken to improve and enhance wildlife habitat on the farm (Habitat Plan). Pastures are managed for multiple (domestic and wild) species. Native wildlife species are considered in the habitat plan and/or in action (e.g. raptors). Natural habitat areas are connected to provide corridors for wildlife.
Management for natural areas provides habitat for beneficial organisms and other forms of wildlife. While many farmers in the Champlain Valley may already utilize hedgerows and the natural features of the land to provide habitat for biodiversity, farmers in Northern and Southern Vermont may not. Well-structured habitat management plans help ensure higher levels of biodiversity. MANAGEMENT OF RIPARIAN AREAS34
Riparian areas are “the edges of streams, wet weather creeks, ditches, or any other area where water flows at various times of the year.”35 If you have a riparian area on your property, please indicate how you manage your cows:
1. Pastures and confinement areas are less than 50 feet from surface waters. Cow access to surface water sites is not restricted or monitored.
2. Pastures and confinement areas are at least 50 feet from surface waters. Cow access to water sites is restricted by fencing or vegetation.
3. Pastures and confinement areas are at least 50 feet from surface waters. Cow access to water sites is restricted to ensure healthy stream bank vegetation, adequate bank angles, and natural water habitat conditions without visible signs of erosion, sedimentation, and manure deposition in water.
4. Watering sites are developed and located away from stream courses, and cows are not allowed direct access to streams.
Riparian areas on farms provide unique habitats for a diverse set of plants and organisms and are often the most diverse in a given ecosystem.36 They are therefore a priority for managing biodiversity on a farm. Cows around water bodies can cause erosion, trample diverse populations of aquatic vegetation, and cause high nutrient levels in streams due to uncontained manure. Management of cows to prevent water body damage increases ecosystem health and biodiversity levels. PASTURE MANAGEMENT37
1. Pastures are managed without regard to environmental impact. 2. Natural plant varieties are established. Any planted varieties selected are
compatible with current Integrated Pest Management methods.
18
3. Site and varieties are carefully selected and designed for optimum production with minimal agrochemical inputs.
CROP FIELD MANAGEMENT38
1. New plantings are established without regard to environmental impact. 2. Varieties and planting systems are selected that are compatible with current
Integrated Pest Management methods. 3. Varieties and planting systems are selected and designed as per # 2, with at
least some of the acreage in (non-GMO) pest-resistant varieties and/or designed to maximize habitat for beneficial organisms. Chemical pre-plant fumigants or other pesticides, if used, are applied by a certified custom applicator.
4. Site, varieties and planting systems are carefully selected and designed for optimum production with minimal agrochemical inputs. Chemical pre-plant fumigants are avoided whenever possible. Sites are selected or otherwise prepared to avoid nematodes or pre-existing disease conditions. Cover crops are planted and incorporated before planting crops.
Depending upon land management practices, species may be displaced or even lost. Managing pasture and crop field lands in ways that enhance habitat increases production while only minimally impacting biodiversity. Herbicides and fungicides can kill not only pests, but also beneficial plants and fungi that may enhance nutrient uptake and provide disease resistance. ADJACENT AREA MANAGEMENT (LANDS SURROUNDING YOUR PROPERTY)39
1. Areas adjacent to cropland or pasture are not managed. 2. Areas adjacent to cropland or pasture under the control of the farmer are
managed in response to known pest problems. 3. In addition to #2, adjacent areas are managed to reduce potential for pest
immigration as well as pesticide and fertilizer movement off-site and to encourage wildlife.
4. In addition to # 3, adjacent areas are planted with hedgerows, windbreaks, or other low-maintenance plantings to encourage specific beneficial organisms and/or native wildlife.
While land ownership stops at property lines, ecosystems function across ownership boundaries. Managing what comes into and flows off your property can adversely or beneficially impact biodiversity. GMOS (Please check all that apply) I do not use rBST. I do not use GMO crops.
Genetically modified organisms (GMOs) are defined as “organisms in which the genetic material (DNA) has been altered in a way that does not occur naturally by mating or natural recombination.”40 The Genomes Project of the US Department of Energy Office of Science cites that some potential benefits associated with GMOs include: improved quality and taste, increased yields due to decreased loss from pests and disease, increased disease resistance (which decreases the need for costly herbicides and
19
insecticides), and new products. While this may be true, the risks associated with GMO use are also large. Some potential risks include production of new allergens, loss of flora and fauna biodiversity, unintended cross-pollination with natural crops, and problems associated with access to intellectual property. Controversies over the use of GMOs have been especially strong in Europe where strict regulations have been instituted for approval of GMOs.41,42 The newest directive, Directive 2001/18/EC, requires in-depth environmental assessments and public comment on the approval and release of any new GMOs. Public backlash against GMOs has caused concern both in the US and Europe. As early as 1999, Archer-Daniels-Midland asked US producers to separate GMO and non-GMO stock due to increasing demands for non-GMO products in Europe and Asia.43 This trend against the use of GMO-altered crops and animal products may indicate a growing social backlash and financial risk to farmers using GMOs. Vermont itself has a number of active pieces of legislation trying to limit the use of GMO seed.44 Given these developments and potential negative consequences, a better alternative may be the implementation of an integrated pest management plan which utilizes natural pest management methods and limited pesticide use instead of GMOs. rBGH is one controversial GMO. Bovine growth hormone, or bovine somatotropin (BST), is produced by the pituitary gland in cows and affects milk production. Genetically engineered microorganisms have been developed to produce an almost identical hormone [recombinant bovine growth hormone (rBGH)] that when injected into dairy cattle, can increase milk production by 10% to 15%.45 While the increase in production is large, rBGH when injected into cows, can also be passed into offspring and create genetic modifications in the strains.46 Other potential negative effects of rBGH include excess milk production and probable udder pain for cows, increased udder infections, bacteria, pus, and antibiotic resistance.47 These impacts in cows can be passed on to humans with links to increased risk of cancer and antibiotic resistance.48 Due to controversy surrounding the hormone, rBGH has been banned in Europe and rejected by a number of companies including Ben & Jerry’s.
LINKAGES TO OTHER MODULES Water quality issues are tied to Soil, Animal Welfare, and Pest Management. The table below identifies where you can find more information on some of the topics mentioned in this module.
BIODIVERSITY TOPIC OTHER MODULE(S) Cover Crops Soil Health Pasturing Animal Welfare Crop/Pasture Insect Pests Pest Management Weeds Animal Welfare
FURTHER INFORMATION Additional details and information on the above can be obtained through the following programs or sources. • Altieri, Miguel. “The ecological role of biodiversity in agroecosystems.” Agriculture,
Ecosystems and Environment 74 (1999) 19-31. This article details how biodiversity
20
is essential to a healthy and naturally-functioning agricultural system. It also describes management practices for enhancing biodiversity and restoring ecosystem function to farm lands.
• Appropriate Technology Transfer for Rural Areas (ATTRA) “Sustainable
Agriculture: An Introduction.” http://attra.ncat.org. ATTRA specializes in developing sustainable agricultural information and tools. For a summary of the practices they advocate regarding biodiversity, see “Sustainable Agriculture: An Introduction” at http://attra.ncat.org/attra-pub/PDF/sustagintro.pdf.
• The Food Alliance. http://www.thefoodalliance.org/. This organization certifies
producers, which use socially and environmentally responsible farming practices. The certification process includes sections on natural area management, watershed management, crop management, pest management, pastureland management, and animal welfare. Details on biodiversity are included under wildlife habitat.
21
SUMMARY RESULTS FOR BIODIVERSITY Instructions: In the table below, please record the score for the answer you selected for each question. For multiple-choice questions, the response number serves as your score for that category (i.e. choice # 2 is worth 2 points). For “check all that apply questions,” please see scoring criteria for each question in the chart below. Once all responses have been completed, add up the answers and record the total.
QUESTION ANSWER/SCORE
1. Genetic Diversity of Crops
2. Natural Area Conservation 3. Management of Riparian Areas (If you don’t have any
riparian areas on your property, give yourself 4 points)
4. Pasture Management
5. Crop Field Management
6. Adjacent Area Management
7. GMOs
Total Score
Total Possible Points 25
Interpretation: The next step in understanding your farm’s performance in the category of Biodiversity is to compare your results to best practices. Below is a table that ranks your performance from best practice (green) to practices that require improvement (red). Compare the number of points you received for your practices compared to optimal practices.
Point Range Interpretation
Green 21 – 25 Best practices regarding Biodiversity are currently being employed on this farm.
Yellow 16 – 20 Farm is using some good practices regarding Biodiversity; however there are some key areas that should be improved upon.
Red 6 – 15 Biodiversity management practices should be carefully evaluated and a strong effort should be made to adopt improved practices in several areas.
22
17 Vandermeer, J., Perfecto, I. Breakfast of biodiversity. 1995. 18 World Wildlife Fund. “Endangered Species.” 31 Oct. 2003 <http://www.worldwildlife.org/species/species.cfm>. 19 US Fish and Wildlife Service. “Summary of Listed Species and Recovery Plans as of 9/1/2003.” Threatened and Endangered Species System 7 Dec. 2003 http://ecos.fws.gov/tess_public/html/boxscore.html>. 20 Natureserve.org. “Biodiversity Insights > U.S. Species at Risk: A State-by-State View.” 15 Nov. 2003 <http://www.natureserve.org/conservation/usSpeciesatRisk.jsp#>. 21 Ibid. 22 Ibid. 23 Fish and Wildlife Service. “Threatened and Endangered Species System.” 15 Nov. 2003 <http://ecos.fws.gov/tess_public/TESSWebpageUsaLists?state=VT>. 24 Ferguson, Mark. Vermont Nongame and Natural Heritage Program. Personal Interview. 13 Nov. 2003. 25 Auman-Bauer, Kristie, ‘Bt Corn and Monarch butterflies.’ PA IPM News. Winter 2001. 16 Nov. 2003 <http://biotech.cas.psu.edu/articles/bt_corn_monarch.htm>. 26 Ibid. 27 Altieri, Miguel. “The ecological role of biodiversity in agroecosystems.” Agriculture, Ecosystems and Environment 74 (1999) 19-31. 28 Ibid. 29 Ibid. 30 Ibid. 31 Ellsworth, David. Assistant Professor of Plant Ecophysiology, SNRE, U Mich. Lecture 20 Nov. 2003. 32 Oregon State University website. “Diminished Crop Diversity.” 26 Aug. 2003 <http://oregonstate.edu/instruction/bi301/cropdiv.htm>. 33 Question from The Food Alliance. “Dairy Inspection Tool for the Pacific Northwest.” The Food Alliance, 2002. 34 Question adapted from The Food Alliance. “Dairy Inspection Tool for the Pacific Northwest.” The Food Alliance, 2002. 35 Wells, Anne and Morrow, Ron. Dairy Farm Sustainability Checksheet. ATTRA, March, 2001. 36 Personal Communication, Mark Ferguson, Vermont Nongame and Natural Heritage Program, 13 Nov. 2003. 37 Question adapted from The Food Alliance. “Dairy Inspection Tool for the Pacific Northwest.” The Food Alliance, 2002. 38 Ibid. 39 Ibid. 40 European Commission, “Genetically Modified Organisms.” 14 Aug. 2002 <http://europa.eu.int/comm/food/fs/gmo/gmo_index_en.html>. 41 European Union Directive 2001/18/EC, Directive 90/220/EEC. 42 “Question and Answers on the regulation of GMOs in the EU.” Memo 02/160 Revised. 1 July 2003. 3 Sept. 2003 <http://europa.eu.int/comm/dgs/health_consumer/library/press/press298_en.pdf>.. 43 Dorey, Emma. “GMO Backlash Hits US.” Nature. 4 Sept. 2003 <http://www.nature.com/cgi-taf/DynaPage.taf?file=/nbt/journal/v17/n10/full/nbt1099_941a.html>. 44 Mace, David. “Vermont Biotech Legislation Follows National Trends.” The Barre Montpelier Times Argus June 11, 2003. 2 Nov. 2003 < http://timesargus.nybor.com/Regional_News/Story/66935.html >. 45 Vogt, Donna and Parish, Mickey. “Food Biotechnology in the United States: Science, Regulation, and Issues.” Department of State website 3 Sept. 2003 <http://fpc.state.gov/6176.htm>. 46 Spinelli, Mike. Ben & Jerry’s Homemade. Personal Interview 4 Sept. 2003. 47 Humane Farming Association. “Milk Machines – Dangers in the Dairy Industry.” 4 Sept. 2003 <http://www.hfa.org/campaigns/dairy.html>. 48 Ibid.
23
COMMUNITY HEALTH EDUCATIONAL MODULE
DESCRIPTION Community health is defined as the strength of the community in which a farmer operates. Strong community relations and respect for agriculture can lead to a better quality of life for farmers. Research shows that the support received from a community can significantly impact a farmer’s job satisfaction.49 Similarly, the interests of community groups and local inhabitants must be considered by the farmer during the planning and development stages of agricultural activities, including the hiring of migrant labor, when these developments directly affect the community. Agricultural employment plays an important role in the maintenance of viable farming populations and communities. Ensuring the health and safety of the employees is an important social concern leading to an increasing number of worker safety programs and standards.50 Recent market conditions have resulted in the decrease of a permanent agricultural labor, from 9.9 million in 1950 to only 2.8 million in 1998.51 The results include sourcing of undocumented labor, impacting the stability of farming and its nearby communities. Consequently, this module evaluates a farmer’s working environment through two main criteria: 1) community relations and 2) protection of labor supply.
INCENTIVES FOR CHANGE • Benefits to farmers. In most dairy operations, labor accounts for 15% to 20% of
total costs.52 Identifying and hiring only documented labor will help the farmers and the community in the long term. Once undocumented labor are hired and trained, replacing them will be costly and inefficient to the farmer. Additionally, hiring undocumented labor is illegal across the United States and can result in significant fines. One of the most extreme cases was a farmer in Florida who was fined $150,000 for hiring undocumented workers, and then an additional $120,000 for firing forty workers who presented what appeared to be adequate paperwork.53
• Benefits to community. Strong community relations and a dependable labor
supply help the success of a farmer. Since Vermont dairy farmers contribute 80% of all farming revenues in the state, the stability of these farmers is important to the community and state economy.54 The hiring of documented or even permanent labor force will have positive repercussions on the community. These laborers are likely to have greater loyalty to the community, contributing to its economic and social viability.
ASSESSMENT QUESTIONS For all questions, please choose the answers that best identify your current management practices. Use the summary sheet on the last page of this module to evaluate overall performance.
24
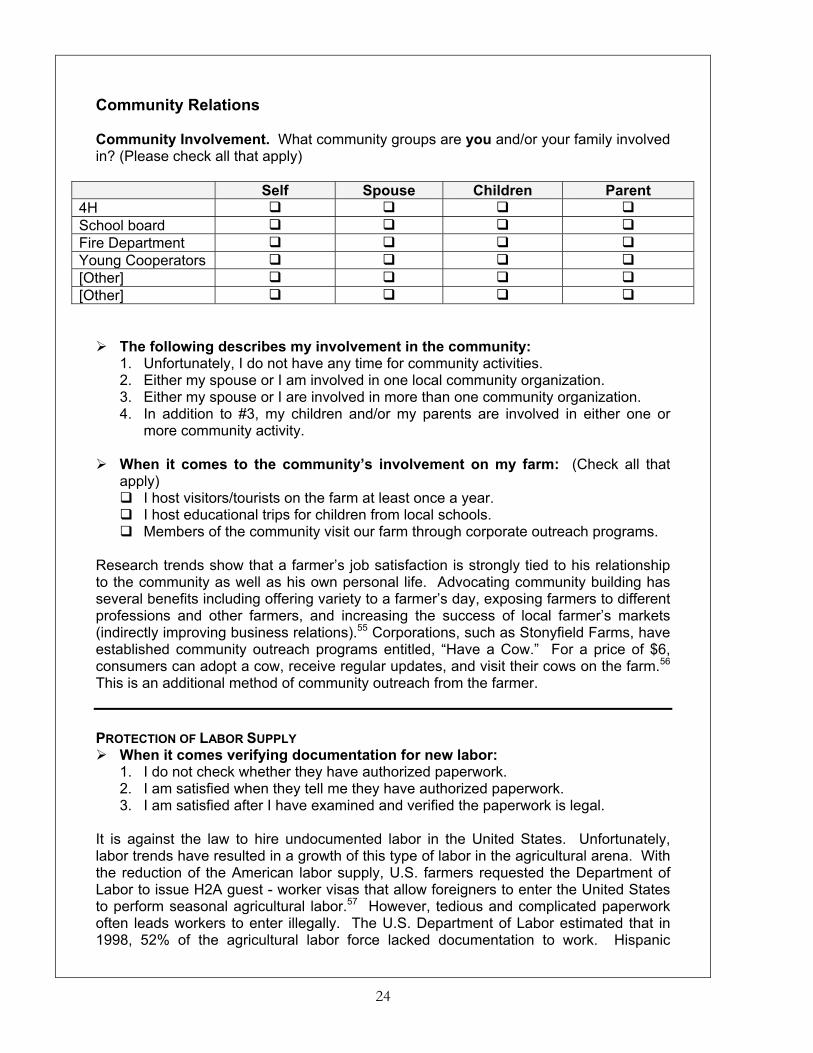
Community Relations Community Involvement. What community groups are you and/or your family involved in? (Please check all that apply)
Self Spouse Children Parent 4H School board Fire Department Young Cooperators [Other] [Other]
The following describes my involvement in the community:
1. Unfortunately, I do not have any time for community activities. 2. Either my spouse or I am involved in one local community organization. 3. Either my spouse or I are involved in more than one community organization. 4. In addition to #3, my children and/or my parents are involved in either one or
more community activity. When it comes to the community’s involvement on my farm: (Check all that
apply) I host visitors/tourists on the farm at least once a year. I host educational trips for children from local schools. Members of the community visit our farm through corporate outreach programs.
Research trends show that a farmer’s job satisfaction is strongly tied to his relationship to the community as well as his own personal life. Advocating community building has several benefits including offering variety to a farmer’s day, exposing farmers to different professions and other farmers, and increasing the success of local farmer’s markets (indirectly improving business relations).55 Corporations, such as Stonyfield Farms, have established community outreach programs entitled, “Have a Cow.” For a price of $6, consumers can adopt a cow, receive regular updates, and visit their cows on the farm.56 This is an additional method of community outreach from the farmer.
PROTECTION OF LABOR SUPPLY When it comes verifying documentation for new labor:
1. I do not check whether they have authorized paperwork. 2. I am satisfied when they tell me they have authorized paperwork. 3. I am satisfied after I have examined and verified the paperwork is legal.
It is against the law to hire undocumented labor in the United States. Unfortunately, labor trends have resulted in a growth of this type of labor in the agricultural arena. With the reduction of the American labor supply, U.S. farmers requested the Department of Labor to issue H2A guest - worker visas that allow foreigners to enter the United States to perform seasonal agricultural labor.57 However, tedious and complicated paperwork often leads workers to enter illegally. The U.S. Department of Labor estimated that in 1998, 52% of the agricultural labor force lacked documentation to work. Hispanic
25
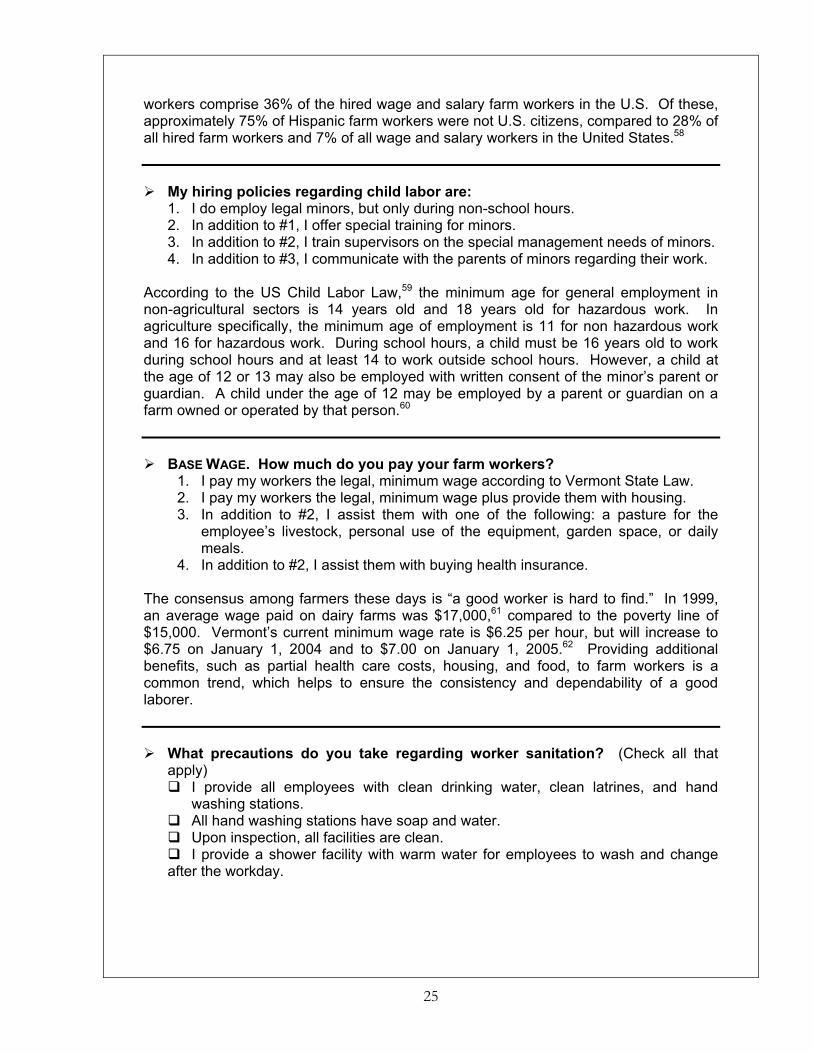
workers comprise 36% of the hired wage and salary farm workers in the U.S. Of these, approximately 75% of Hispanic farm workers were not U.S. citizens, compared to 28% of all hired farm workers and 7% of all wage and salary workers in the United States.58 My hiring policies regarding child labor are:
1. I do employ legal minors, but only during non-school hours. 2. In addition to #1, I offer special training for minors. 3. In addition to #2, I train supervisors on the special management needs of minors. 4. In addition to #3, I communicate with the parents of minors regarding their work.
According to the US Child Labor Law,59 the minimum age for general employment in non-agricultural sectors is 14 years old and 18 years old for hazardous work. In agriculture specifically, the minimum age of employment is 11 for non hazardous work and 16 for hazardous work. During school hours, a child must be 16 years old to work during school hours and at least 14 to work outside school hours. However, a child at the age of 12 or 13 may also be employed with written consent of the minor’s parent or guardian. A child under the age of 12 may be employed by a parent or guardian on a farm owned or operated by that person.60 BASE WAGE. How much do you pay your farm workers?
1. I pay my workers the legal, minimum wage according to Vermont State Law. 2. I pay my workers the legal, minimum wage plus provide them with housing. 3. In addition to #2, I assist them with one of the following: a pasture for the
employee’s livestock, personal use of the equipment, garden space, or daily meals.
4. In addition to #2, I assist them with buying health insurance.
The consensus among farmers these days is “a good worker is hard to find.” In 1999, an average wage paid on dairy farms was $17,000,61 compared to the poverty line of $15,000. Vermont’s current minimum wage rate is $6.25 per hour, but will increase to $6.75 on January 1, 2004 and to $7.00 on January 1, 2005.62 Providing additional benefits, such as partial health care costs, housing, and food, to farm workers is a common trend, which helps to ensure the consistency and dependability of a good laborer. What precautions do you take regarding worker sanitation? (Check all that
apply) I provide all employees with clean drinking water, clean latrines, and hand
washing stations. All hand washing stations have soap and water. Upon inspection, all facilities are clean. I provide a shower facility with warm water for employees to wash and change
after the workday.
26
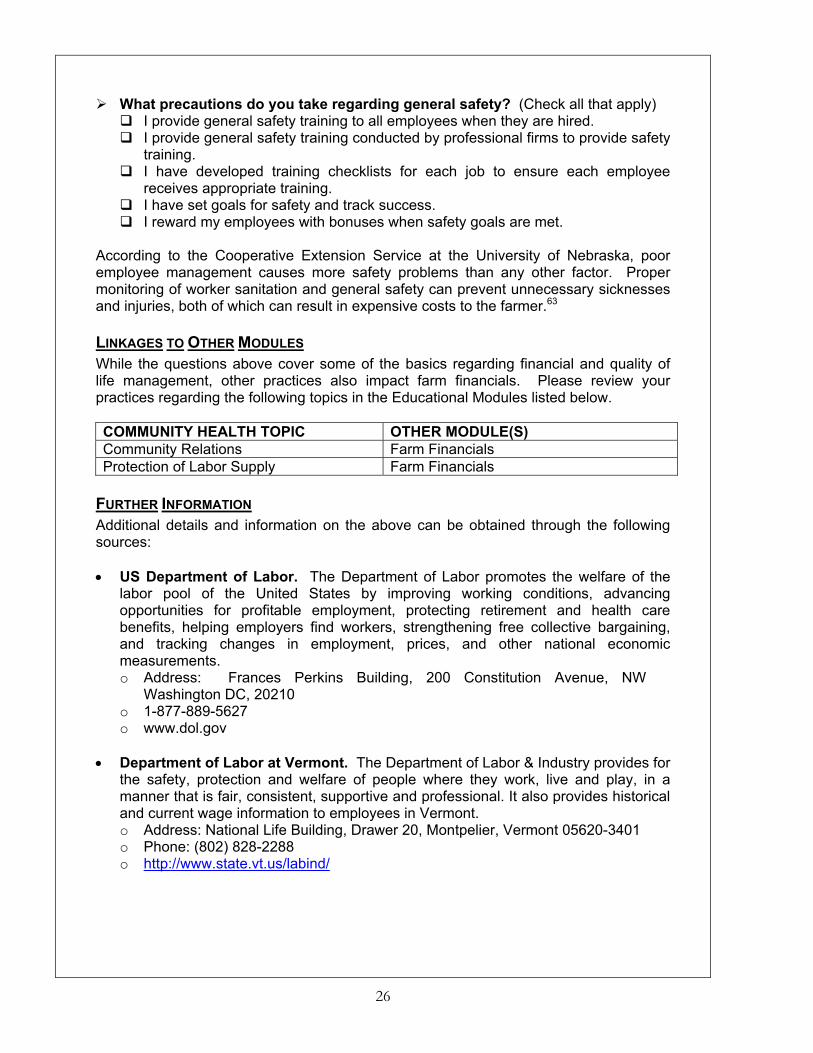
What precautions do you take regarding general safety? (Check all that apply) I provide general safety training to all employees when they are hired. I provide general safety training conducted by professional firms to provide safety
training. I have developed training checklists for each job to ensure each employee
receives appropriate training. I have set goals for safety and track success. I reward my employees with bonuses when safety goals are met.
According to the Cooperative Extension Service at the University of Nebraska, poor employee management causes more safety problems than any other factor. Proper monitoring of worker sanitation and general safety can prevent unnecessary sicknesses and injuries, both of which can result in expensive costs to the farmer.63
LINKAGES TO OTHER MODULES While the questions above cover some of the basics regarding financial and quality of life management, other practices also impact farm financials. Please review your practices regarding the following topics in the Educational Modules listed below. COMMUNITY HEALTH TOPIC OTHER MODULE(S) Community Relations Farm Financials Protection of Labor Supply Farm Financials
FURTHER INFORMATION Additional details and information on the above can be obtained through the following sources: • US Department of Labor. The Department of Labor promotes the welfare of the
labor pool of the United States by improving working conditions, advancing opportunities for profitable employment, protecting retirement and health care benefits, helping employers find workers, strengthening free collective bargaining, and tracking changes in employment, prices, and other national economic measurements. o Address: Frances Perkins Building, 200 Constitution Avenue, NW
Washington DC, 20210 o 1-877-889-5627 o www.dol.gov
• Department of Labor at Vermont. The Department of Labor & Industry provides for
the safety, protection and welfare of people where they work, live and play, in a manner that is fair, consistent, supportive and professional. It also provides historical and current wage information to employees in Vermont. o Address: National Life Building, Drawer 20, Montpelier, Vermont 05620-3401 o Phone: (802) 828-2288 o http://www.state.vt.us/labind/
27
SUMMARY RESULTS FOR COMMUNITY HEALTH Instructions: In the table below, please record the score for the answer you selected for each question. For multiple-choice questions, the response number serves as your score for that category (i.e. choice # 2 is worth 2 points). For “check all that apply questions,” please see scoring criteria for each question in the chart below. Once all responses have been completed, add up the answers and record the total.
QUESTION ANSWER/SCORE
1. Community Relations
2. Documented Labor
3. Child Labor
4. Base Wage 5. Worker Sanitation (add up the total number of boxes
checked)
6. General Safety (add up the total number of boxes checked)
Total Score
Total Possible Points 27
Interpretation: The next step in understanding your farm’s performance in the category of Community Health is to compare your results to best practices. Below is a table that ranks your performance from best practices (green) to practices that require improvement (red). Compare the number of points you received for your practices compared to optimal practices.
Point Range Interpretation
Green 23 - 27 Best practices regarding Community Health are currently being employed on this farm.
Yellow 19 - 22 Farm is using some good practices regarding Community Health; however there are some key areas that should be improved on.
Red 12 - 19 Community Health practices should be carefully evaluated and a strong effort should be made to adopt improved practices in several areas.
28
49 Heller, Martin C., Keoleian, Gregory A. “Assessing the sustainability of the US food system: a life cycle perspective.” Agricultural Systems, 76, 2003, 1007-1041. 50 Food Alliance; Certification Standards for the Food Alliance Certified Label; February 19, 2003. 51 Heller, Martin C., Keoleian, Gregory A. “Assessing the sustainability of the US food system: a life cycle perspective.” Agricultural Systems, 76, 2003, 1007-1041. 52Jeffrey F. Keown. Extension Dairy Specialist. Managing Dairy labor, Cooperative Extension , Institute of Agriculture and Natural Resources , University of Nebraska-Lincoln; April 1996 http://www.ianr.unl.edu/pubs/dairy/g1064.htm#WAGES 53 Heller, Martin C., Keoleian, Gregory A. “Assessing the sustainability of the US food system: a life cycle perspective.” Agricultural Systems, 76, 2003, 1007-1041. 54 Pelsue, Neil, and Woodruff, Katie. “Agriculture, Food, and Community in Vermont.” The University of Vermont Extension. July, 1996. 7 Dec. 2003<http://www.uvm.edu/extension/publications/factsheets/agfs2/>. 55 Heller, Martin C., Keoleian, Gregory A. “Assessing the sustainability of the US food system: a life cycle perspective.” Agricultural Systems, 76, 2003, 1007-1041. 56 Stonyfield Farms. “Have a Cow” Program. < http://www.stonyfield.com/fungames/HaveACow/> 57 Heller, Martin C., Keoleian, Gregory A. “Assessing the sustainability of the US food system: a life cycle perspective.” Agricultural Systems, 76, 2003, 1007-1041. 58 Ibid. 59 Child Labor Coalition; Child Labor in the U.S.: “An Overview of Federal Child Labor Laws;” http://www.fieldsofhope.org/world/index.asp?country=United+States+Of+America. 60 Ibid. 61 Jeffrey F. Keown. Extension Dairy Specialist. Managing Dairy labor, Cooperative Extension , Institute of Agriculture and Natural Resources, University of Nebraska-Lincoln; April 1996, http://www.ianr.unl.edu/pubs/dairy/g1064.htm#WAGES 62 Department of Labor & Industry, Vermont. “Wage and Hour Program”; <www.state.vt.us/labind/> 63 Jeffrey F. Keown. Extension Dairy Specialist. Managing Dairy labor, Cooperative Extension , Institute of Agriculture and Natural Resources, University of Nebraska-Lincoln; April 1996, http://www.ianr.unl.edu/pubs/dairy/g1064.htm#WAGES
29
ENERGY EDUCATIONAL MODULE
DESCRIPTION There are two main types of energy: renewable and non-renewable. As the name implies, a non renewable energy source is an energy resource that is not replaced or is replaced only very slowly by natural processes. Primary examples of non-renewable energy resources are the fossil fuels--oil, natural gas, and coal. Fossil fuels are continually produced by the decay of plant and animal matter, but the rate of their production is extremely slow, very much slower than the rate at which we use them. Any non-renewable energy resources that we use are not replaced in a reasonable amount of time (a lifetime or that of the next generation) and are thus considered "used up", not available to us again.64 This category can be further broken down into direct and indirect energy. Electricity is a major use of direct energy farms. Milk cooling, lighting, ventilation and vacuum pumps account for 88% of all direct energy used on dairy farms.65 Typically, total annual energy used by dairy farms is equal to 3.4 million kWh/year divided into energy intensive components as described in Figure 1.
Figure 1: Typical Energy Use by Equipment on a Dairy Farm66
Vacuum Pumps, 17%
Electrical Water Supply, 4%
Lighting, 24%
Ventilation, 22%
Feeding Equipment,
3%
Manure Handling, 4%
Misc. 1%
Milk Cooling, 25%
Indirect energy use is comprised of the following sources: fertilizer type or nutrient quantity; chemical pesticides, seeds, feed that was bought-in from outside or sold, and grazing-off recorded by number of animals and time away from the property.67 The manufacturing of chemical fertilizers and pesticides makes up almost 40% of the energy allocated to agricultural production. Renewable energy on the other hand, is “any energy resource that is naturally regenerated over a short time scale and derived directly from the sun (such as thermal, photochemical, and photoelectric), indirectly from the sun (such as wind, hydropower,
30
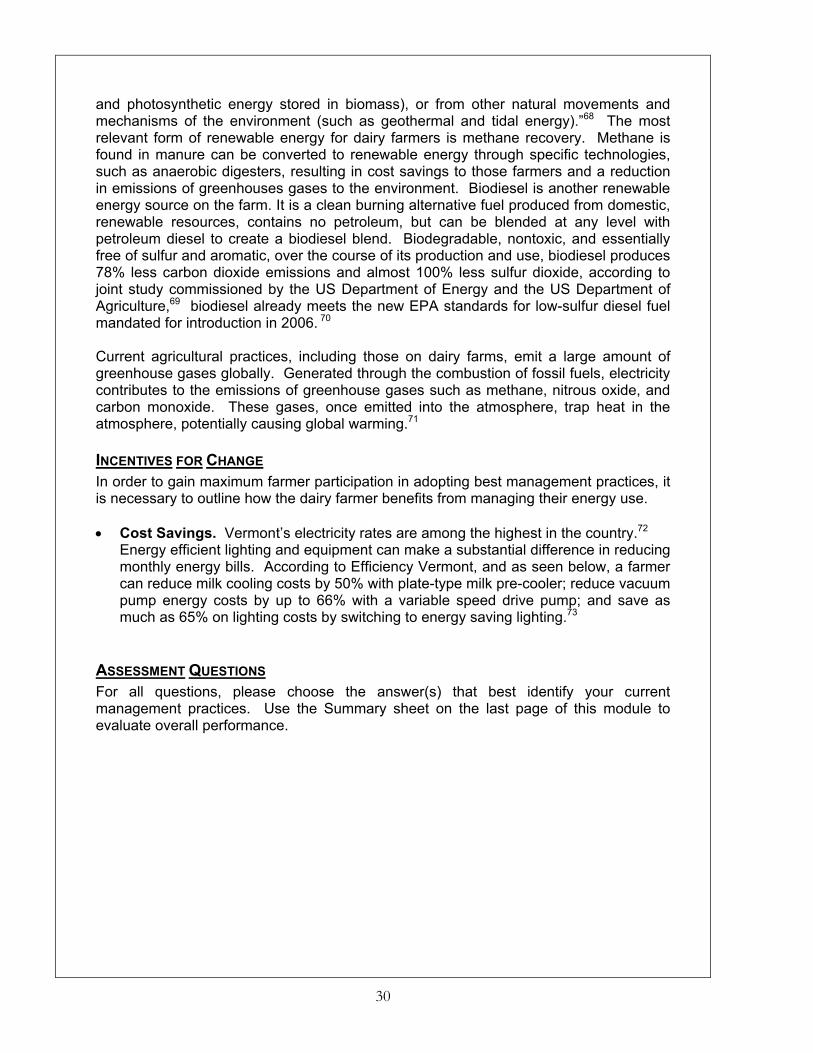
and photosynthetic energy stored in biomass), or from other natural movements and mechanisms of the environment (such as geothermal and tidal energy).”68 The most relevant form of renewable energy for dairy farmers is methane recovery. Methane is found in manure can be converted to renewable energy through specific technologies, such as anaerobic digesters, resulting in cost savings to those farmers and a reduction in emissions of greenhouses gases to the environment. Biodiesel is another renewable energy source on the farm. It is a clean burning alternative fuel produced from domestic, renewable resources, contains no petroleum, but can be blended at any level with petroleum diesel to create a biodiesel blend. Biodegradable, nontoxic, and essentially free of sulfur and aromatic, over the course of its production and use, biodiesel produces 78% less carbon dioxide emissions and almost 100% less sulfur dioxide, according to joint study commissioned by the US Department of Energy and the US Department of Agriculture,69 biodiesel already meets the new EPA standards for low-sulfur diesel fuel mandated for introduction in 2006. 70 Current agricultural practices, including those on dairy farms, emit a large amount of greenhouse gases globally. Generated through the combustion of fossil fuels, electricity contributes to the emissions of greenhouse gases such as methane, nitrous oxide, and carbon monoxide. These gases, once emitted into the atmosphere, trap heat in the atmosphere, potentially causing global warming.71
INCENTIVES FOR CHANGE In order to gain maximum farmer participation in adopting best management practices, it is necessary to outline how the dairy farmer benefits from managing their energy use. • Cost Savings. Vermont’s electricity rates are among the highest in the country.72
Energy efficient lighting and equipment can make a substantial difference in reducing monthly energy bills. According to Efficiency Vermont, and as seen below, a farmer can reduce milk cooling costs by 50% with plate-type milk pre-cooler; reduce vacuum pump energy costs by up to 66% with a variable speed drive pump; and save as much as 65% on lighting costs by switching to energy saving lighting.73
ASSESSMENT QUESTIONS For all questions, please choose the answer(s) that best identify your current management practices. Use the Summary sheet on the last page of this module to evaluate overall performance.
31
Calculate the amount you spend on energy and machinery as a percentage of gross income: o PART 1: From your Schedule F Income Tax Filing add items in the table below. o PART 2: Divide Part 1 by gross income. Items Dollar Amount ($) Chemicals Custom hire (machine work) Depreciation on buildings and equipment Fertilizers and lime Fuel Rent or lease of vehicles, machinery and equipment
Repairs and maintenance Utilities Total Dollars Spent: Total Gross Income: Total Dollars Spent/Total Gross Income x 100 = % Percentage of Total Income
1. My total dollars spent per total gross income is greater than 50%. 2. My total dollars spent per total gross income is between 25% and 50%. 3. My total dollars spent per total gross income is between 10% and 25%. 4. My total dollars spent per total gross income is less than 10%.
Recording the amount of money spent on electricity and other energy sources can help homeowners and business managers understand just how much they spend on energy-related services, often prompting a move towards increasing energy efficiency to reduce costs.74 When it comes to lighting:75
1. I use only standard lighting in my barns and outbuildings (i.e. mercury vapor yard lights).
2. I have converted a portion of my lights to more energy efficient alternatives, such as high-pressure sodium yard lights.
I have already converted all of my lights to energy efficient models (such as high pressure sodium yard lights).
When it comes to milking cows:
1. I use a traditional vacuum pump. 2. I am saving money to buy a variable speed drive controller. 3. I already use a variable speed drive controller.
According to one farmer member in the St. Albans Coop, the use of a variable speed pump has reduced somatic cell count in his milk, upgraded the quality of milk and increased the dollar value he receives for the milk.76
32
When it comes to ventilation in the barn: 1. I use the standard, mechanical equipment. 2. I am saving money to be able to convert to more energy efficient equipment. 3. I have converted a portion of my barn to be ventilated by more energy efficient
equipment. 4. I have already converted my barn(s) to be ventilated by more energy efficient
equipment. In recent years, mechanical ventilation in large freestall barns has become one of the largest peak energy users on dairy farms. Switching to efficient fans can produce savings of 12% to 15% in both smaller barns and large freestall barns.77 When it comes to milk cooling equipment:
1. I use the standard, milk cooling equipment. 2. I am saving money to use a ‘plate milk pre-cooler’. 3. I have already converted to using a plate milk pre-cooler to reduce my energy
usage during milk cooling.
Energy conservation measures on farms include variable speed pumps, plate milk pre-coolers and energy efficient lighting technology. According to farm surveys conducted by EnSave, a Vermont based electric company, the two main areas of resistance to adopting these technologies include labor shortages and high upfront costs.78 However, as indicated in the table below, the upfront costs of installing new technology can be offset over on the average of five years. For example, a variable speed pump drive will cost a farmer approximately $3401 to install. However, by installing this technology, the farmer will save almost 10,000 kWh, or $1061/year in energy bills. At this savings rate, the cost of installing the pump will be returned to the farmer within five years on average. Data detailing these savings is listed in Table 2.
Table 2: Summary of Energy Savings for Energy Conservation Measures79
Annual kWh
Estimated Annual Savings
Estimated Installed
Cost
Average Payback Years (range)
Install VSD on Vacuum Pump 9,988 $1,061 $3,401 4.73 years Add Refrigeration Heat Recovery 5,781 $579 $2,861 5.00 years Install Plate Milk Pre-cooler 9,414 $948 $2472 4.22 years Install Energy Efficient Lighting 3,491 $344 $1,473 4.50 years
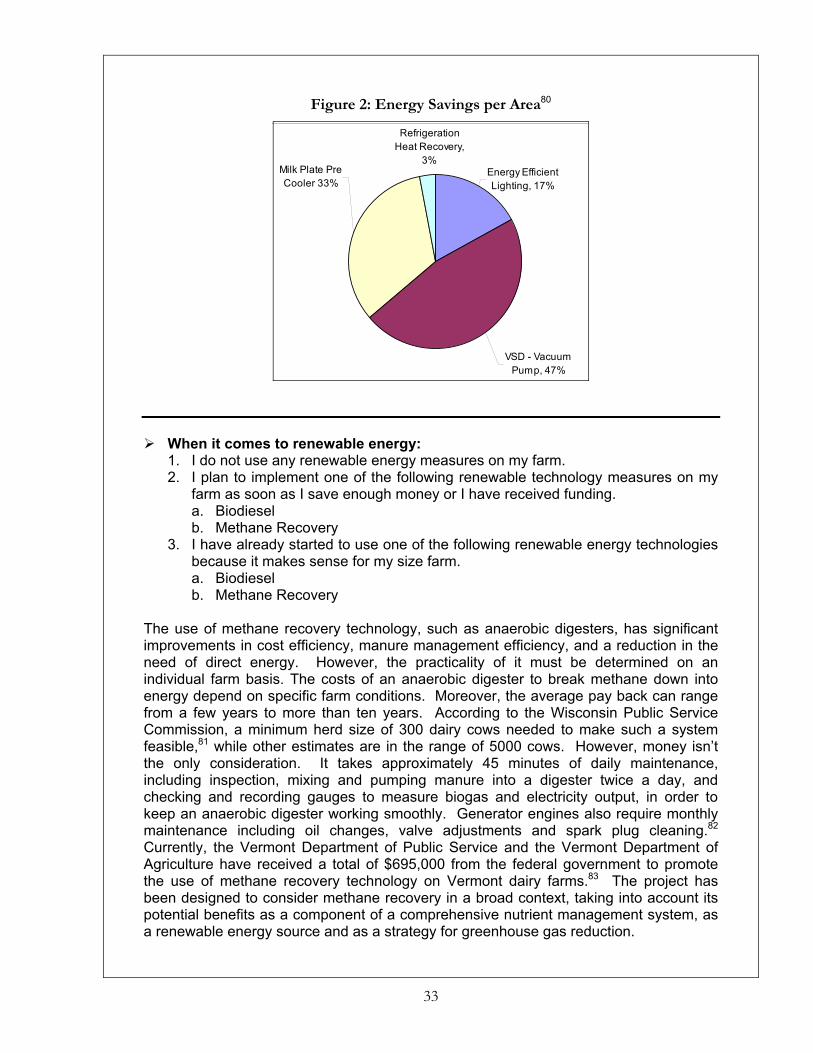
Total Savings 28,674 $2,931 $10,207 4.6 years *These numbers are based on the average costs in the northeast region in 2002. These energy conservation measures result in the savings by percentage as shown in Figure 2.
33
Figure 2: Energy Savings per Area80
Refrigeration Heat Recovery,
3%Energy Efficient Lighting, 17%
VSD - Vacuum Pump, 47%
Milk Plate Pre Cooler 33%
When it comes to renewable energy:
1. I do not use any renewable energy measures on my farm. 2. I plan to implement one of the following renewable technology measures on my
farm as soon as I save enough money or I have received funding. a. Biodiesel b. Methane Recovery
3. I have already started to use one of the following renewable energy technologies because it makes sense for my size farm. a. Biodiesel b. Methane Recovery
The use of methane recovery technology, such as anaerobic digesters, has significant improvements in cost efficiency, manure management efficiency, and a reduction in the need of direct energy. However, the practicality of it must be determined on an individual farm basis. The costs of an anaerobic digester to break methane down into energy depend on specific farm conditions. Moreover, the average pay back can range from a few years to more than ten years. According to the Wisconsin Public Service Commission, a minimum herd size of 300 dairy cows needed to make such a system feasible,81 while other estimates are in the range of 5000 cows. However, money isn’t the only consideration. It takes approximately 45 minutes of daily maintenance, including inspection, mixing and pumping manure into a digester twice a day, and checking and recording gauges to measure biogas and electricity output, in order to keep an anaerobic digester working smoothly. Generator engines also require monthly maintenance including oil changes, valve adjustments and spark plug cleaning.82 Currently, the Vermont Department of Public Service and the Vermont Department of Agriculture have received a total of $695,000 from the federal government to promote the use of methane recovery technology on Vermont dairy farms.83 The project has been designed to consider methane recovery in a broad context, taking into account its potential benefits as a component of a comprehensive nutrient management system, as a renewable energy source and as a strategy for greenhouse gas reduction.
34
Biodiesel is a clean air, renewable energy source that is more expensive than petroleum diesel, however it is the least cost strategy when compared with other alternative fuel systems. Consumer benefits include the following: 1) because it is more lubricating than petroleum diesel fuel, biodiesel can extend the life of diesel engines; 2) it does not require any major engine modifications or special storage/handling procedures; 3) it can be made from domestically produced, renewable oilseed crops such as soybeans, as well as from recycled vegetable oil that has already used for frying; and 4) when burned in a diesel engine, biodiesel replaces the exhaust odor of petroleum diesel with the pleasant smell of popcorn, French fries, or donuts.84
LINKAGES TO OTHER MODULES While the questions above cover some of the basics regarding energy management, other practices also impact energy use. Please review your practices regarding the following topics in the Educational Modules listed below. ENERGY TOPIC OTHER MODULE(S) Energy Farm Financials Product Quality Animal Welfare Manure Management Nutrient Management
FURTHER INFORMATION Additional details and information on the above can be obtained through the following sources: EnSave Energy Performance Inc. This energy calculator shows farmers all the
aspects that can lead to energy savings on the farm. – Address: 65 Millet Street, Suite 105, Richmond, VT 05477 – Tel: 800-732-1399; Fax: 802-434-7011 – http://www.ensave.com/EnergyCalculators.htm/
Efficiency Vermont. This is a source of quick information about lowering costs with energy efficiency in new equipment or in existing or new building designs. It recently began to provide 0% financing to supplement financial incentives and technical assistance for dairy farms.
– Address: 255 S. Champlain Street, Suite 7, Burlington VT 05401 – 1-888-921-5990 – http://www.efficiencyvermont.com/
Consumer's Guide to Small Wind Electric Systems in Vermont – http://www.eere.energy.gov/windpoweringamerica/pdfs/small_wind/small_
Vermont Alternative Energy Council. – 147 Allen Brook Lane, Suite 104, Williston, VT 05495 – (P) 802.879.4896/ (F) 802.879.5486 – http://www.vaec2000.com/
36
SUMMARY RESULTS FOR ENERGY Instructions: In the table below, please record the score for the answer you selected for each question. For multiple-choice questions, the response number serves as your score for that category (i.e. choice # 2 is worth 2 points). For “check all that apply questions,” please see scoring criteria for each question in the chart below. Once all responses have been completed, add up the answers and record the total.
QUESTION ANSWER/SCORE
1. Percentage of Income
2. Lighting
3. Variable Speed Driver
4. Ventilation
5. Milk Cooling
6. Renewable Energy
Total Score
Total Possible Points 20
Interpretation: The next step in understanding your farm’s performance in the category of Energy Module is to compare your results to best practices. Below is a table that ranks your performance from best practice (green) to practices that require improvement (red). Compare the number of points you received for your practices compared to optimal practices.
Point Range Interpretation
Green 16 - 20 Best practices regarding Energy are currently being employed on this farm.
Yellow 14 – 15 Farm is using some good practices regarding Energy; however there are some key areas that should be improved on.
Red 6 – 13 Energy practices should be carefully evaluated and a strong effort should be made to adopt improved practices in several areas.
37
64 http://www.cpast.org/Articles/fetch.adp?topicnum=12. Corporation for Public Access to Science and Technology. Non Profit based in St. Louis, MO that publishes scientific and technical information on the web for a general audience. 65 Ludington, David and Eric L. Johnson. Dairy Farm Energy Audit Summary Report. Prepared for New York State Energy Research and Development Authority. July 2003. 66 Ibid. 67 Heller, Martin and Gregory A. Keoleian. “Assessing the Sustainability of the U.S. Food System: A life Cycle Perspective. Center for Sustainable Systems, School of Natural Resources and Environment, University of Michigan. ScienceDirect. May 14, 2002 68 Texas Renewable Energy Industries Association; Definition of Renewable Energy. <http://www.treia.org/redefinition.htm>. 69 National Biodiesel Board; What is Biodiesel. December 2003. <www.biodiesel.org/resources/faqs/default.shtm>. 70 Ibid. 71 Australian Greenhouse Office; Greenhouse Emissions from Dairy Farms. 10 Oct. 2003. <http://www.greenhouse.gov.au/agriculture/factsheets/fs_dairy.html>. 72 Vermont Department of Energy, Vermont Electricity Rates, 2000. <http://www.eere.energy.gov/state_energy/states_currates.cfm?state=VT>. 73 Efficiency Vermont. Dairy Farms: Top Energy Saving Methods. <www.efficiencyvermont.com/index.cfm?L1=84&L2=165&L3=278&sub=bus> 74 Appropriate Technology Transfer of Rural Agriculture; Dairy Farm Sustainability Check List; www.attra.ncat.org. March 2001. 75 Ludington, David and Eric L. Johnson. Dairy Farm Energy Audit Summary Report. Prepared for New York State Energy Research and Development Authority. July 2003. 76 Visit to the St. Albans Cooperative Creamery; 8 Nov.. 2003. 77 EnSave Energy Performance; 10 Nov. 2003, <http://www.ensave.com>. 78 Ibid. 79 Ludington, David and Eric L. Johnson. Dairy Farm Energy Audit Summary Report. Prepared for New York State Energy Research and Development Authority. July 2003. 80 Ibid. 81 Wisconsin Public Service Corporation; Methane Gas Recovery: Is it Right for Your Farm? < http://www.wisconsinpublicservice.com/farm/gasrecovery.asp > 82 Ibid. 83 Forward, Jeffrey. Vermont Methane Project Quarterly Report. January 2001. <http://www.state.vt.us/psd/ee/4th2000.pdf>; January 2001 84University of Vermont Environmental Council; “What is Biodiesel.” <http://esf.uvm.edu/envcncl/referlibrary/biodiesel.html>; July 13 2001.
38
39
FARM FINANCIALS EDUCATIONAL MODULE
DESCRIPTION Farm Financials is a module designed to assess the financial stability of a farming enterprise. This section describes the merits of monitoring financial performance of the farms, through key ratios, and the subsequent quality of life the farmer leads and is able to provide for his or her family. By monitoring financial performance, farmers can better control costs by creating business plans for managing and perhaps even growing their businesses. Appropriate business management that allows for a healthy work-life balance is also integral to a farmer’s well-being and overall quality of life. Quality of life is not only influenced by personal wealth, but also by a farmer’s ability to spend time with family, friends or helping the community. According to the Farm Financial Standards Council (FFSC), there are five main areas that are used to assess the financial health and stability of a farm. These five areas can be determined by sixteen different financial ratios. For the purposes of this module, we will focus on the five most commonly used by farmers and lending institutions when applying for loans.85
Term Definition Financial Ratio 1. Liquidity Does a farmer have the ability to pay his or her
bills and interest payments on time without affecting business?
Current Ratio
2. Solvency Does a farmer have the ability to repay all his or her debt if all his or her assets were sold? In weak economic times, usually leading to an increase in debt, can a farmer continue to conduct business?
Equity to Asset Ratio
3. Profitability Does a farmer have the ability to make a profit from his or her goods?
Rate of Return on Farm Assets
4. Repayment Capacity
Can a farmer repay his or her term farm debt?
Term and Debt Capital Lease Coverage
5. Financial Efficiency
Does a farmer generate the maximum amount of revenues and profits possible on his or her farm?
Financial Efficiency
A farmer can assess his or her financial performance in two ways: using the cash method or an accrual accounting method. Using the cash method, a farmer calculates his or her financial position based upon his or her bank account balance. For example, if a farmer buys a tractor for $80,000 today, he or she pays $80,000 out of his or her bank account. While this is a dependable method for everyday households, when it comes to businesses, the benefits of this tractor can be extended over ten years, reducing the financial burden to only $8,000 in any single year. This ability to account for expenditures over time is known as the accrual method. Most lending institutions utilize
40
the accrual method and provide farmers accrual-based financial statements, which include balance sheets, income statements, and cash flow or earnings statements. A balance sheet lists a farm’s assets (the value of a farm’s financial resources), liabilities (the financial claims of lenders, input suppliers, etc.), and equity (the owner’s financial stake in the business) at a specific date in time. An income statement lists a farm’s revenue and expenses over a period of time. And finally, a cash flow statement lists a farm’s cash supply over a period of time, and an earnings statement provides a summary of net worth.
INCENTIVES FOR CHANGE • Long Term Cost Reductions. Strategic money management can allow for new
capital expenditures on the farm, leading to an increase in efficiency and a long-term decrease in costs. This type of investment can span a number of areas including new tractors, tilling equipment, milk cleaning and production equipment, and energy saving lighting.
• Quality of Life Improvements. Financial planning, dual incomes, and health
insurance can all mitigate the pressures and stress on the average U.S. farmer. Moreover, a balanced work schedule provides the farmer and his or her family necessary time to spend on non-farming activities, which include community involvement, time with family, vacations, and personal hobbies.
ASSESSMENT QUESTIONS For all questions, please choose the categories that best identify your current management practices. Use the Summary sheet on the last page of this module to evaluate overall performance. FINANCIAL STABILITY The following ratios are used to assess financial stability and are calculated based on FFSC definitions. Sources of the financial information come from one of three places: (1) the balance sheet, (2) the income statement, or 3) the cash flow or earnings statement.
41
CURRENT RATIO86 (Please fill in the following information)
Amount ($) Source (1) Total current farm assets? Balance Sheet (2) Total current farm liabilities? Balance Sheet Divide (1)/(2) =
PLEASE SELECT THE APPROPRIATE ANSWER BASED UPON YOUR RESULTS:
1. My current ratio is less than 1. 2. My current ratio is between 1 and 1.50. 3. My current ratio is greater than 1.50.
As a measurement of liquidity, the current ratio measures whether or not a farmer has the ability to pay the bills and interest payments on time without affecting business. This metric is calculated using the following equation:
Total current farm assets / Total current farm liabilities. Farms enjoying a competitive position generally have a current ratio of greater than 1.50 whereas farms with a current ratio of less than 1 should seek financial guidance to improve performance.87 EQUITY TO ASSET RATIO88 (Please fill in the following information)
Amount ($) Source (1) Total farm equity? Balance Sheet (2) Total farm assets? Balance Sheet Divide (1)/(2) x 100 =
PLEASE SELECT THE APPROPRIATE ANSWER BASED UPON YOUR RESULTS:
1. My equity to asset ratio is less than 30%. 2. My equity to asset ratio is between 30% and 70%. 3. My equity to asset ratio is greater than 70%.
As a measure of solvency, the equity to asset ratio measures the proportion of total farm assets financed by the farmer’s own equity (as opposed to financed by debt). This metric is calculated using the following equation:
Total farm equity / Total farm assets.
Farms enjoying a competitive position generally have an equity to asset ratio of greater than 70% whereas farms with an equity to asset ratio of less than 30% should seek financial guidance to improve performance.89
42
RATE OF RETURN ON FARM ASSETS90 (Please fill in the following information)
Amount ($) Source (1) Net income (excluding gains/losses from sale of assets) Income Statement
(2) Farm interest expense Income Statement (3) Owner withdrawals for unpaid labor and management Income Statement
(4) Average total farm assets Balance Sheet (5) Calculate: (1) +(2) – (3)
Divide (5)/(4) x 100 =
PLEASE SELECT THE APPROPRIATE ANSWER TO ONE OF THE FOLLOWING QUESTIONS BASED UPON YOUR RESULTS. I own most of my assets and:
1. My rate of return on farm assets is less than 1%. 2. My rate of return on farm assets is between 1% and 5%. 3. My rate of return on farm assets is greater than 5%.
I lease or rent most of my assets and: 1. My rate of return on farm assets is less than 3%. 2. My rate of return on farm assets is between 3% and 12%. 3. My rate of return on farm assets is greater than 12%.
Rate of Return on Farm Assets measures whether or not a farmer has the ability to make a profit from goods sold. This metric is calculated using the following equation:
(Net farm income from operation + Farm interest expense – Owner withdrawals for unpaid labor and management)/Average total farm assets.
The “average rate of return on farm assets for farms in the US is between 3-6%”.91 Farms (with mostly owned assets) enjoying a competitive position generally have a rate of return on farm assets ratio of greater than 5% whereas farms with a rate of return on farm assets of less than 1% should seek financial guidance to improve performance.92 Farms (with mostly leased or rented assets) enjoying a competitive position generally have a rate of return on farm assets ratio of greater than 12% whereas farms with a rate of return on farm assets of less than 3% should seek financial guidance to improve performance.93
43
TERM DEBT & CAPITAL LEASE COVERAGE RATIO94 (Please fill in the following
information) Amount ($) Source (1) Net income from operations (excluding gains/losses from sale of assets)
Cash Flow or Earnings Statement
(2) Total miscellaneous revenue (if not included in net income from operations)
Cash Flow or Earnings Statement
(3) Total miscellaneous expense (if not included in net income from operations)
Cash Flow or Earnings Statement
(4) Total non farm income Cash Flow or Earnings Statement
(5) Depreciation/amortization expense Cash Flow or Earnings Statement
(6) Interest on term debt Cash Flow or Earnings Statement
(7) Interest on capital leases Cash Flow or Earnings Statement
(8) Total income tax expense Cash Flow or Earnings Statement
(9) Total owner withdrawals Cash Flow or Earnings Statement
(10) Annual scheduled principal and interest payments on term debt
Cash Flow or Earnings Statement
(11) Annual scheduled principal and interest payments on capital leases
PLEASE SELECT THE APPROPRIATE ANSWER BASED UPON YOUR RESULTS:
1. My term debt & capital lease ratio is less than 110%. 2. My term debt & capital lease ratio is between 110% and 150%. 3. My term debt & capital lease ratio is greater than 150%.
Better known as repayment capacity, this ratio measures whether or not a farmer can repay term farm debt. This metric is calculated using the following equation:
(Net farm income from operations +/- total miscellaneous revenue/expense + total non-farm income + depreciation/amortization expense + interest on term debt + interest on capital leases – total income tax expense – owner withdrawals (total))/ (Annual scheduled principal and interest payments on term debt + annual scheduled principal and interest payments on capital leases).
Farms enjoying a competitive position generally have a term debt and capital lease ratio of less than 110% whereas farms with a term debt and capital lease ratio of greater than 150% should seek financial guidance to improve performance.95
44
OPERATING EXPENSE RATIO96 (Please fill in the following information) Amount ($) Source (1) Total Operating Expenses Income Statement (2)Depreciation and Amortization Expense Income Statement
(3) Revenues Income Statement (4) Calculate: (1) – (2) Income Statement
Divide: (4)/(3)
PLEASE SELECT THE APPROPRIATE ANSWER TO ONE OF THE FOLLOWING QUESTIONS BASED UPON YOUR RESULTS. I own most of my assets and:
1. My operating expense ratio is greater than 80%. 2. My operating expense ratio is greater than 65% but less than 80%. 3. My operating expense ratio is less than 65%.
I lease or rent most of my assets and:
1. My operating expense ratio is greater than 85%. 2. My operating expense ratio is greater than 75% but less than 85%. 3. My operating expense ratio is less than 75%.
This ratio measures whether a farmer generates the maximum amount of revenues and profits possible from the farm. This metric is calculated using the following equation:
(Total operating expenses – depreciation and amortization expense)/ Revenues.
“A benchmark for the operating expense ratio is between 65-80%--a ratio over 80% often indicates profitability problems, while less than 65% indicates great efficiency.”97 Farms (with mostly owned assets) enjoying a competitive position generally have an operating expense ratio of less than 65% whereas farms with an operating expense ratio of greater than 80% should seek financial guidance to improve performance.98 Farms (with mostly leased or rented assets) enjoying a competitive position generally have an operating expense ratio of less than 75% whereas farms with a ratio of greater than 85% should seek financial guidance to improve performance.99
FARM INCOME (Fill in the chart below and answer the following question)
Income ($) My Income Spouse’s Income Child’s Income Total Income My Income/ Total Income Spouse’s Income/Total Income
45
OUR FAMILY’S INCOME IS SUFFICIENT FOR PAYING FOR (Please check all that apply): Food Clothing Mortgage and monthly bills Health insurance A savings account
Milk price fluctuations have contributed greatly to the rise in off-the-farm family income. Additional income can provide several benefits such as: 1) offsetting low farm returns; 2) providing for basic necessities such as health insurance and maintenance of the farm; and 3) possibly raising living standards and protecting against fluctuations in farm income. In recent years, almost 60% of US Farm households had either the farmer, spouse, or both employed in off-farm work.100 Moreover, approximately 80% had higher cash incomes from off-farm earnings (including wages, rent, interest) than from farming operations.101
WORK/LIFE BALANCE (Please fill in the following information and answer the following question) MON TUES WED THURS FRI SAT SUN Total # hrs working on farm
# of hours spent with family
# of hours of spent on leisure activities
Total % on Farm
PLEASE CHECK ALL THAT APPLY:
I work more than 70 hours/week on the farm. I spend more than 10 hours/week with my family each week. I spend more than 5 hours/week on leisure activities such as hunting,
volunteering, etc. I have taken a vacation in the past year with my family.
A farmer must consider his or her financial stability in relation to his or her work/life balance. While the appropriate amount of time to spend with family is based upon individual preference, the general consensus is that the more “family time” a person can accumulate, the happier he or she will be. The response from farmers is overwhelmingly that spending time with children is an esteemed goal and influences a farmer’s participation in farming practices that lead to a reduction of labor time required on the farm.102
46
ATTITUDE TOWARDS ADOPTING NEW PRACTICES
1. New farming practices are costly and risky. Therefore I have not considered them in a while.
2. I would like to implement new farming techniques and have done a lot of reading on different options; however, money is a constraint.
3. I am very open to new farming technology and seek out new information. When a new technology makes sense for my farm, I implement it.
PLANNING FOR THE FUTURE (Please check all that apply)103 I am not involved with the future planning of the farm; decisions are made by my
family. I am in the process of improving the current conditions of the barn for the cows. I want to increase the number of cows on the farm. I am considering additional crops on the farm to diversify sources of income. I have a plan for when milk prices fluctuate greatly. I am constantly looking for ways to save money on the farm.
To increase the stability of his or her enterprise, a farmer should investigate new practices and complete business plans, similar to any other business. According to ATTRA, farm planning and production goals are on-going processes that require farm families to define a goal as well as a path to achieve those goals.104 Research indicates that simply by taking the time to consider long term business planning can be motivation enough to affect change.105 These actions are increasingly important given current low milk prices. Since 1960, Vermont has lost over 80% of its dairy farms primarily due to changing prices of milk and competing uses for land and labor.106 While production per cow has risen steadily, farmers’ profits have been squeezed, since the costs of producing milk have increased at a substantially faster rate than the price of milk.107 Therefore business planning must account for rapid changes in order to ensure a farmer’s success.
LINKAGES TO OTHER MODULES While the questions above cover some of the basics regarding financial and quality of life management, other practices also impact farm financials. Please review your practices regarding the following topics in the Educational Modules listed below. FARM FINANCIAL TOPIC OTHER MODULE(S) Farm Financials Energy Quality of Life Community Health
FURTHER INFORMATION Additional details and information on the above can be obtained through the following programs or sources. • Center for Farm Financial Management, University of Minnesota.
http://www.cffm.umn.edu/. This website provides information on financial and business planning.
47
• Doehring, Todd A. “Analyzing the Efficiency of Your Operation,” AEC, 2001
http://www.centrec.com/resources/Articles/FinAnalysisFarmRanches/Efficiency.pdf. This document walks through how to calculate and measure each FFSC metric for efficiency.
• Doehring, Todd A. “Analyzing the Profitability of Your Operation,” AEC, 2001
http://www.centrec.com/resources/Articles/FinAnalysisFarmRanches/Profitability.pdf. This document walks through how to calculate and measure each FFSC metric for profitability.
• Pennsylvania State University. “Green Milk Successfully Test-Marketed at Mid-
Atlantic Stores.” http://aginfo.psu.edu/news/may00/greenmilk.html. This article describes a program which pays farmers a premium if they produce milk using environmentally friendly management practices. The program, called the Environmental Quality Initiative Inc., is a joint venture of the Chesapeake Bay Foundation, Pennsylvania State University, the Rodale Institute, the Pennsylvania Association for Sustainable Agriculture and the US EPA. The program pays farmers a five-cent premium per half gallon to encourage participation and offset any costs incurred due to changes in management practices. .
• Purdue University Cooperative Extension Service. "Farm Business Management for
the 21st Century. Measuring and Analyzing Farm Financial Performance." http://www.agecon.purdue.edu/extension/programs/fbm21/EC712entry.htm This site provides additional measures for farm financial performance including cash flow analysis, debt service analysis, and information on how to respond to financial difficulty.
• Virginia Cooperative Extension Service. http://www.ext.vt.edu/resources/. This page
includes information on a variety of topics related to farm financials. Sections of interest include Financial Management and Farm Business Management and Marketing. These sections cover specific financial topics such as estate planning, equipment leasing economics, and much more.
• Kohl, David. Summary of Key Ratios and Benchmarks. Not dated. This table
developed by David Kohl and shown on the following page summarizes additional key financial ratios, their calculations, and corresponding benchmarks for the agriculture industry. It includes fifteen of the sixteen farm financial ratios advocated by the FFSC plus one additional ratio. This additional ratio, the California Working Capital Rate, is used to calculate liquidity.
48
Summary of Key Ratio Calculations and Benchmarks
Repayment Analysis Calculation Green Yellow Red
Term Debt and Lease Coverage Ratio
[(NFIFO* + Gross Non-Farm Revenue + Depreciation Expense + Interest on Term Debts and Capital Leases) - Income Tax Expense - Family Living Withdrawals] / Scheduled Annual Principal and Interest Payments on Term Debt and Capital Leases
>150%110% to
150% <110%
Debt Payment / Income Ratio**Scheduled Annual Principal and Interest Payments on Term Debt and Capital Leases / (NFIFO* + Gross Non-Farm Revenue + Depreciation Expense + Interest on Term Debts and Capital Leases)
<25% 25% to 50% >50%
Liquidity Analysis
Current Ratio Total Current Farm Assets / Total Current Farm Liabilities > 1.50 1.00 to 1.50 < 1.00
Working Capital Total Current Farm Assets - Total Current Farm Liabilitiescompare to business expenses, absolute amount depends on scope of operation
California Working Capital Rule** Working Capital / Total Expenses > 50% 20% to 50% <20%
Solvency Analysis
Debt / Asset Ratio Total Farm Liabilities / Total Farm Assets <30% 30% to 70% >70%
Equity / Asset Ratio Total Farm Equity / Total Farm Assets >70% 30% to 70% <30%
Debt / Equity Ratio Total Farm Liabilities / Total Farm Equity <42% 42% to 230% >230%
Profitability Analysis
Rate of Return on Farm Assets (ROA) (mostly owned)
(NFIFO* + Farm Interest Expense - Operator Management Fee) / Average Total Farm Assets >5% 1% to 5% <1%
Rate of Return on Farm Assets (ROA) (mostly rented / leased)
(NFIFO* + Farm Interest Expense - Operator Management Fee) / Average Total Farm Assets >12% 3% to 12% <3%
Rate of Return on Farm Equity (ROE)
(NFIFO* - Operator Management Fee) / Average Total Farm Equitylook at trends and compare to other farm
Asset Turnover Ratio Gross Revenue / Average Total Farm Assetsdepends heavily on type of operation and
whether it is owned / leased
Operating Expense / Revenue Ratio (mostly owned)
Operating Expenses [excluding interest and depreciation] / Gross Revenue <65% 65% to 80% >80%
Operating Expense / Revenue Ratio (mostly rented / leased)
Operating Expenses [excluding interest and depreciation] / Gross Revenue <75% 75% to 85% >85%
Depreciation Expense Ratio Depreciation Expense / Gross Revenuecompare to capital replacement and term
debt repayment margin
Interest Expense Ratio Interest Expense / Gross Revenue <12% 12% to 20% >20%
Net Farm Income From Operations Ratio
NFIFO* / Gross Revenuelook at trends, varies due to cyclical nature
of agricultural prices and incomes
* NFIFO = Net Farm Income From Operations excluding gains or losses from the disposal of farm capital assets** Not a ratio recommended by the Farm Financial Standards Taskforce and Council, but widely used
49
SUMMARY RESULTS FOR FARM FINANCIALS AND QUALITY OF LIFE Instructions: In the table below, please record the score for the answer you selected for each question. For multiple-choice questions, the response number serves as your score for that category (i.e. choice # 2 is worth 2 points). For “check all that apply questions,” please see scoring criteria for each question in the chart below. Once all responses have been completed, add up the answers and record the total.
QUESTION ANSWER/SCORE
1. Current Ratio
2. Equity to Asset Ratio
3. Rate of Return on Farm Assets
4. Term Debt & Capital Lease Coverage Ratio
5. Operating Expense Ratio
6. Work/Life Balance
7. Attitude Towards Adopting New Practices
8. Farm Income
9. Planning for the Future
Total Score
Total Possible Points 33
Interpretation: The next step in understanding your farm’s performance in the category of Farm Financials and Quality of Life Module is to compare the results to best practices. Below is a table that ranks your performance from best practice (green) to practices that require improvement (red). Compare the number of points you received for your farm to optimal practices.
Point Range Interpretation
Green 28 – 33 Best practices regarding Farm Financials are currently being employed on this farm.
Yellow 20 – 27 Farm is using some good practices regarding Farm Financials; however there are some key areas that should be improved on.
Red 6 – 19 Farm Financials should be carefully evaluated and a strong effort should be made to adopt improved practices in several areas.
50
85 Kohl, David. “RE: Research on Sustainability of Dairy Farming for Ben and Jerry's Ice Cream.” E-mail to Mindy Murch. 7 July 2003. 86 This question is based on ratios described in (1) Farm Financial Standards Council. Financial Guidelines for Agricultural Producers. Revised, December 1997; and (2) Kohl, David. Summary of Key Ratios and Benchmarks. Not dated. 87 Ibid. 88 Ibid. 89 Kohl, David. Summary of Key Ratios and Benchmarks. Not dated. 90 This question based on ratios described by (1) Farm Financial Standards Council. Financial Guidelines for Agricultural Producers. Revised, December 1997 and (2) Kohl, David. Summary of Key Ratios and Benchmarks. Not dated. 91 Doehring, Todd A. Analyzing the Profitability of Your Operation, AEC, 2001. 19 Nov. 2003 <http://www.centrec.com/resources/Articles/FinAnalysisFarmRanches/Profitability.pdf>. 92 Kohl, David. Summary of Key Ratios and Benchmarks. Not dated. 93 Ibid. 94 This question is based on ratios described in (1) Farm Financial Standards Council. Financial Guidelines for Agricultural Producers. Revised, December 1997; and (2) Kohl, David. Summary of Key Ratios and Benchmarks. Not dated. 95 Kohl, David. Summary of Key Ratios and Benchmarks. Not dated. 96 This question is based on ratios described in (1) Farm Financial Standards Council. Financial Guidelines for Agricultural Producers. Revised, December 1997; and (2) Kohl, David. Summary of Key Ratios and Benchmarks. Not dated. 97 Doehring, Todd A. Analyzing the Efficiency of Your Operation, AEC, 2001. 19 Nov. 2003 <http://www.centrec.com/resources/Articles/FinAnalysisFarmRanches/Efficiency.pdf>. 98 Kohl, David. Summary of Key Ratios and Benchmarks. Not dated. 99 Ibid. 100 Weersink, A., et al. “Multiple Job Holdings Among Dairy Farm Families in New York and Ontario.” Agricultural Economics 18. 1998. 101 Ibid. 102 Kroma, Margaret M. and Cornelia Butler Flora. 2001. “An Assessment of SARE-funded Farmer Research on Sustainable Agriculture in the North Central U.S.” American Journal of Alternative Agriculture. 16 (2): 73-80. 7 Dec. 2003 <http://www.ag.iastate.edu/centers/rdev/pubs/flora/asses-sare.htm>. 103 Wells, Anne and Morrow, Ron. “Dairy Farm Sustainability Checksheet.” ATTRA, March, 2001. 104 Ibid. 105 Ibid. 106 Pelsue, Neil, and Woodruff, Katie. “Agriculture, Food, and Community in Vermont.” The University of Vermont Extension. July, 1996. 7 Dec. 2003<http://www.uvm.edu/extension/publications/factsheets/agfs2/>. 107 Ibid.
51
NUTRIENT MANAGEMENT EDUCATIONAL MODULE
DESCRIPTION Nutrients are needed to sustain healthy animals and crops but overuse or mismanagement of nutrients, in particular nitrogen and phosphorus, can lead to nutrient pollution of ground or surface waters. Purchased feed and fertilizer are by far the largest sources of nutrient imports onto a farm, accounting for 89.5% of imported nitrogen and 96% of imported phosphorus.108 Reliance on these external nutrient sources is becoming problematic in that 59-81% of imported nitrogen and phosphorus remain on a dairy farm over one year.109 This results in a build-up of nutrients in the soil and an increased chance that nutrients will be transported to water sources, resulting in environmental harm to surface and ground water. While Vermont dairy farms are certainly not the only source of this pollution, contributions from farmland can be significant and participation from the dairy farmer community is therefore essential to improving overall water quality. In Vermont, Lake Champlain, a critical water resource, is experiencing a serious decline in water quality, in part due to sediment and nutrients from agricultural runoff from barnyards, manured and fertilized fields and cropland erosion. Also, many drinking water wells have been found to have nitrate-nitrogen levels exceeding the Vermont public health standard.110 Adopting best practices for nutrient management is important to maintaining ground water that is safe for drinking and surface waters that can support healthy aquatic ecosystems, function as industrial and commercial water supplies, and provide recreational enjoyment. This module is devoted to controlling direct nutrient use on farms, specifically with respect to nutrient applications to fields. Recommendations regarding nutrient management plans, use of fertilizer and manure, and use of dietary phosphorus supplements are intended as an introduction to best management practices to improve farm performance and environmental health. Actual changes to nutrient management should be made in cooperation with experts, such as UVM extension representatives, feed or fertilizer specialists, or other consultants. Controlling water pollution from other nutrient sources, such as manure or silage storage, is addressed in the Water Management module.
INCENTIVES FOR CHANGE • Cost savings. Appropriate nutrient management can reduce unnecessary feed and
fertilizer purchases, improving crop production efficiency and farm profitability. The Vermont Dairy Farm Sustainability Project found that, by reducing phosphate fertilizer application by 40% (average reduction over a 3 year period), farms could reduce total fertilizer expenditures by an average of $2800/farm or $27/acre, while maintaining farm yields.111 One farm decreased phosphate fertilizer use by 8.3 tons/year for savings of $4200/year.112
• Improved on-farm water quality. Minimizing impact on surface and ground water is
beneficial to the extent that these water resources become inputs on the farm. Maintaining healthy drinking water can reduce the chance for illness, and associated costs, from contaminated water.
52
• Regulatory environment and funding. The EPA recently passed water quality legislation requiring that farms with large ‘concentrated animal feeding operations’ (CAFO) obtain a permit for operation. However, in order to get a permit, a farmer must first develop and implement a comprehensive nutrient management plan. While Vermont’s current limit of “large” CAFO operations is 675 milking cows, there is discussion of reducing this number to 200. Additionally, regulation of phosphorus in Vermont requires that farmers take action to reduce the amount of phosphorus coming onto the farm.113 As this and other water quality legislation becomes more stringent, dairy farms will increasingly need to demonstrate nutrient management best practices.
ASSESSMENT QUESTIONS For all questions, please choose the categories that best identify your current management practices. Use the Summary sheet on the last page of this module to evaluate overall performance. NUTRIENT MANAGEMENT & RECORD KEEPING:
1. No nutrient management plan exists for the farm. Nutrient use is driven by compliance with applicable state or local regulations governing nutrient use.
2. Nutrient management plan is based on some soil testing and recommendations of the University of Vermont or another credible source. Recommended nutrient application rates are exceeded by 5-25% as ‘insurance’ for a good yield level.
3. In addition to #2, the plan is based on soil tests ever 1-3 years and recommended application rates not exceeded by more than 10%. Detailed nutrient records are kept (soil test results, crop yields, nutrient application rates and timing, etc.).
4. In addition to #3, recommended application rates are never exceeded. Additionally, detailed records are used to guide and improve the nutrient management plan on an annual basis.
Record keeping can help farmers further understand, monitor, and therefore improve, farm performance. It also demonstrates good management and can provide valuable data if management practices are ever challenged. While a bit of effort needs to be invested up front, implementation and maintenance of a nutrient management and record-keeping plan will ultimately save both time (e.g. records are readily available when needed for taxes or other purposes) and money in the long term. A nutrient management plan, developed in conjunction with the UVM Extension service, consultant or other expert resource, covers multiple nutrient flows on farms, including use of manure, fertilizer, and feed and supplements. Some best practices associated with nutrient management plans are captured in the questions in this module. MANURE APPLICATION RATE:
1. Application rates are unknown or manure is applied until all manure is used up (without regard to nutrient requirements of field or crop).
2. Application rates are determined by crop-specific phosphorus needs (per UVM or other published standards) and realistic yield goals (goals are within 10% of 5-year average yield). To prevent over-application, some excess manure may be applied to neighboring fields or otherwise properly disposed of.
53
3. In addition to #2, application rates are loosely determined by soil nutrient need according to soil tests performed every 3-5 years. To prevent over-application, most excess manure is applied to neighboring fields or otherwise properly disposed of.
4. In addition to #3, rates are determined by strictly following application recommendations from soil tests conducted every 1-3 years and application reflects manure nutrient content, as determined by laboratory analysis. To prevent over-application, all excess manure is applied to neighboring fields or otherwise properly disposed of.
Manure is a valuable source of nitrogen, phosphorus and potassium for crop production but it is important that the use of manure on fields focuses on crop utilization of manure nutrients rather than manure waste disposal. Over-application of manure can result in build up of nutrients in the soil and increased potential that nutrients will be leached through the soil to groundwater or transported to surface waters via runoff. The amount of manure applied should therefore be closely matched to the needs of each field. Any excess manure remaining after application should be applied to neighboring fields or otherwise properly disposed of. As a benchmark for the amount of land that will be needed for your farm, best practice requires .5 to 1.0 animal units (AU) per acre of cropland that is environmentally, economically, and agronomically suitable for the application of manure.114 One AU is equivalent to 1,000 pounds so a 1,400-pound dairy cow would be 1.4 AU’s.115 To more closely match manure application rates to soil and crop needs, the farmer should base application rates on the following: o Soil Testing: Soil testing, conducted at least every 3 years, is the best way to
determine soil nutrient content and other characteristics that affect crop uptake of nutrients. UVM offers soil test kits that provide information on soil pH, available phosphorus, aluminum (which affects plant uptake of phosphorus) and other nutrients, and soil fertility recommendations. At $9/sample, soil testing is a non-time-intensive, non-costly way to better understand and manage on-farm nutrients.
o Manure Nutrient Content: The percentage of nutrients in manure will vary, depending on such factors as type of cow, composition of feed, additions of other substances to manure, and collection and storage methods. Because of the wide potential variation in nutrient content, a manure nutrient analysis, which can be done for $30 at UVM, is highly recommended as the best means of determining exact nutrient content for precision crop nutrient applications. If such an analysis is not possible, using published averages for manure nutrient levels is the next best alternative.
o Type of Crop and Crop Yield: Different crops and yield levels will result in varying crop nutrient needs. Manure use should be based on nutrient need of the crop being grown, together with realistic yield goals (within 10% of average yields from the last 5 years). Ideally, nutrient content should be matched with crop need and soil nutrient content per the results of soil testing. However, using general published standards is the next best alternative.
54
COMMERCIAL FERTILIZER APPLICATION RATE: 1. Application is based on historical practice; specific application rate is unknown. 2. Rates are determined by crop-specific nutrient needs (per UVM or other
published standards) and realistic yield goals (goals are within 10% of 5-year average yield).
3. In addition to #2, application rates are loosely determined by soil nutrient need according to soil tests performed every 3-5 years and manure nutrient credits and legume nitrogen credits (per UVM guidelines published standards) are reflected in application rates.
4. In addition to #2 (not #3), rates are determined by strictly following application recommendations from soil tests (conducted every 1-3 years) and by annual Pre-Sidedress Nitrate Tests. Every effort is made to use only on-farm nutrient sources (manure, compost, cover crops, etc.).
Given that manure is an excellent and abundant source of crop nutrients, every effort should be made to effectively utilize manure (or other on-farm, organic nutrient sources) to satisfy crop nutrient need. However, and when inorganic commercial fertilizer is needed to supplement manure nutrients, precisely matching it to crop need will minimize fertilizer costs and nutrient build-up in soils. As discussed in the “Manure Application Rate” section, soil testing and closely following corresponding nutrient recommendations is a best management practice. These nutrient recommendations should take into account crop type and yield (as discussed above) as well as the following: o Manure and Legume Nutrient Credits: Fertilizer rates should be adjusted for nutrients
provided by manure, both present and past applications, and by legume crops such as alfalfa, clover or soybeans. A percentage of nitrogen from manure applications remains in the soil in the years following application and legume crops also add nitrogen to the soil. This amount of nitrogen must be taken into account and fertilizer application rates need to be adjusted accordingly so as not to provide more nutrients than necessary for the soil. A soil test is the preferred and most accurate means of assessing soil nutrient content and corresponding need. In the absence of that, UVM published standards for manure and legume nitrogen credits are the next better alternative.
o Pre-Sidedress Nitrate Test (PSNT): The PSNT, a soil sample taken when corn plants are 8-12 inches tall, is a way to accurately understand precise nitrogen needs of the crops and to adjust nitrogen fertilizer levels for specific field conditions. The PSNT should be done on an annual basis and, at a cost of $6/sample, is not a costly investment toward proper fertilizer application levels.
MANURE & PHOSPHORUS FERTILIZER APPLICATION TIMING & TECHNIQUES: 1. Application is performed without regard to weather or proximity to on-farm water
sources. Manure and phosphorus fertilizer is not incorporated into soil. 2. Some effort is made to avoid application near water sources or prior to heavy
rains (that could result in manure runoff); manure and phosphorus fertilizer is incorporated after 7 days.
55
3. Nutrients are never applied if heavy rain is expected and are not applied to frozen soils; buffer strips separate fields and nearby water sources. Manure and phosphorus fertilizer is incorporated within 4 to 7 days.
4. Nutrients are never applied if heavy rain is expected and are not applied to frozen soils; buffer strips separate fields and nearby water sources and manure not applied to edge of field. Manure and phosphorus fertilizer is incorporated within 1 to 3 days.
Every effort should be made to prevent manure ponding and runoff to surface water, adjacent property, or drainage ditches. It is therefore very important to incorporate manure soon after application to prevent runoff, particularly on sloped land, and to avoid applying manure if heavy rain is expected, since the rain may simply wash the manure off the field if it is sitting on the surface of the soil. Furthermore, avoiding application close to water sources and using buffer strips between fields and water sources can prevent manure and runoff from reaching the water. Quickly incorporating manure is also valuable to making sure that it can ‘do its job,’ since ammonium nitrogen can evaporate out of manure if it is left on the surface. It has been found that 70% of nitrogen is retained if manure is incorporated within one day. Only 40% remains if incorporated in 2 to 3 days and only 20% of nitrogen is left in manure if it is incorporated in 4 to 7 days.116 Manure should never be applied to frozen soils because it cannot be easily incorporated, leading to higher runoff potential and nutrient loss. An effort should be made to spread manure earlier in the season (i.e. well before the December 15 manure spreading ban) to ensure that application to frozen soils is avoided.
NITROGEN FERTILIZER APPLICATION TIMING & TECHNIQUES: 1. Broadcast applications are made without consideration to weather. Timing is not
planned to optimize crop utilization of nutrients. 2. Application is based in part on some precision application techniques (sidedress
or band applications) and/or proper timing to optimize crop utilization of nutrients (multiple delayed or split applications with starter fertilizer, if appropriate). An effort is made to not apply fertilizer prior to heavy rain.
3. Per #2, application strategy relies almost exclusively on precision application techniques and proper timing to optimize crop utilization of nutrients. Fertilizer is never applied prior to heavy rain.
Timing fertilizer applications to maximize crop uptake and utilizing precision application methods are other ways of ensuring the most efficient use of commercial inorganic fertilizer. The use of starter fertilizer and split applications of fertilizer should be matched to soil and climate characteristics as well as to PSNT results to maximize their benefits.
FERTILIZER & MANURE APPLICATION EQUIPMENT: 1. Application equipment has never been calibrated and application rates
unmonitored. No effort is made to prevent spillage.
56
2. Application equipment is calibrated periodically and application rates are monitored somewhat. Spillage is controlled and minimized. Spills, if any, are cleaned up promptly.
3. Application equipment is adjusted and calibrated at least once a year and application rates monitored closely. Spillage is minimized and spills, if any, are cleaned up promptly.
Efforts to match nutrient application amounts to soil and crop need would be wasted if the nutrient application equipment is not calibrated or otherwise cannot be relied on to provide accurate information on nutrient application rates (e.g. due to spills or leaks). As such, best management practice calls for regular calibration of the equipment, close monitoring of application rates, and avoidance of any spillage or leaks.
USE OF PHOSPHORUS SUPPLEMENTS: 1. Dietary phosphorus is not closely monitored, or is maximized to guarantee
production levels. 2. Dietary phosphorus levels are monitored but exceed National Research Council
(NRC) 2001 guideline levels. 3. Diets are strictly regulated and monitored to ensure that cows are receiving no
more than the NRC recommended amount of dietary phosphorus. Numerous studies have found that closely following National Research Council 2001117 recommendations for dietary phosphorus can reduce current phosphorus levels for dairy cows (which frequently exceed required amounts) without affecting production levels. The result is dramatically reduced phosphorus levels in manure, which can allow for better matching of manure nutrients to soil and crop need. Important: Any phosphorus reduction strategy must result from a collaborative effort between farmers, feed and fertilizer consultants, veterinarians and manure haulers.
LINKAGES TO OTHER MODULES Nutrient issues are very closely tied to Water Management, Soil Health and, to a lesser extent, Animal Welfare. The table below identifies where you can find more information on some of the topics mentioned in this module. NUTRIENT MANAGEMENT TOPIC OTHER MODULE(S) Manure Storage Water Management Fertilizer Storage Water Management Dietary Phosphorus Animal Welfare Soil Testing Soil Health
FURTHER INFORMATION Additional details and information on the above can be obtained through the following programs. • University of Vermont Extension Program provides laboratory testing, nutrient
recommendations for field crops in Vermont and other services. Information can be accessed on the web at http://pss.uvm.edu/vtcrops/?Page=nutrientmanure.html. Soil test information is available at http://pss.uvm.edu/ag_testing/?Page=soils.html.
57
• Miner Institute (http://whminer.serverbox.net/) does research and education on dairy farm and environmental conservation best practices. They published “Feeding Strategies to Reduce Phosphorus Inputs from Dairy Sources,” which provides information on better utilizing dietary phosphorus. More information is available on the internet or by calling Kurt Cotanch at the Miner Institute at 518-846-7121, extension #123.
• Livestock and Poultry Environmental Stewardship (LPES) Curriculum provides
environmental best management practice recommendations for dairy farms (http://www.lpes.org/les_plans.html). They also provide information on the new Concentrated Animal Feeding Operations (CAFO) regulations and links to funding and additional technical resources (http://www.lpes.org/CAFO.html). You can also call 1-800-562-3618 for more information.
• The USDA Natural Resource Conservation Service (NRCS) offers nutrient
management information and tools at http://www.nrcs.usda.gov/technical/ECS/nutrient/. The program also provides funding and technical assistance for conservation efforts through Farm Bill 2002 (http://www.nrcs.usda.gov/programs/farmbill/2002/) and its affiliate programs, such as EQIP (http://www.nrcs.usda.gov/programs/eqip/). The Vermont NRCS also manages Farm*A*Syst, a program devoted to national and state-level improvements to ground water that provides comprehensive evaluation and best management sheets specifically for dairy farmers in Vermont. More information can be found at http://www.vt.nrcs.usda.gov/technical/FarmASyst/. Vermont NRCS has twelve regional field offices that can provide more assistance and information on the above. Contact the District Conservationist at the office nearest you at:
o Bennington: (802) 442-2275 o Berlin: (802) 828-4493 o Brattleboro: (802) 254-9766 o Middlebury: (802) 388-6748 o Morrisville: (802) 888-4935 o Newport: (802) 334-6090 o Rutland: (802) 775-8034 o St. Albans: (802) 527-1296 o St. Johnsbury: (802) 748-2641 o White River Junction: (802) 295-7942 o Williston: (802) 879-4785 o Vermont NRCS State Office: Dave Hoyt, Assistant State Conservationist,
802-951-6796, extension 227 • The Vermont Agency of Agriculture, Food and Markets provides a clearinghouse
of information on controlling non-point source pollution from dairy farms, including accepted agricultural practices (AAPs), best management practices (BMPs) and technical and financial assistance for projects. See http://www.vermontagriculture.com/pidnonpointsource.htm for more information. You can also call the Vermont Natural Resources Conservation Districts
o Windham, Bennington, Rutland, Windsor, Counties: 802-257-5621 o Orleans, Essex, Caledonia, Orange, Washington Counties: 802-229-2720 o Addison, Chittenden, Lamoille, Franklin, & Grand Isle Counties: 802-388-
6746
58
SUMMARY OF RESULTS FOR NUTRIENT MANAGEMENT Instructions: In the table below, please record the score for the answer you selected for each question. For multiple-choice questions, the response number serves as your score for that category (i.e. choice # 2 is worth 2 points). For “check all that apply questions,” please see scoring criteria for each question in the chart below. Once all responses have been completed, add up the answers and record the total. Once all responses have been completed, add up the answers and record the total.
Interpretation: The next step in understanding your farm’s performance in the category of Nutrient Management is to compare your results to best practices. Below is a table that ranks your performance from overall best practice (green) to general need for improvement (red). Compare the number of points you received for your practices compared to optimal practices. Point Range Interpretation
Green 21 - 25 Nutrient Management best practices are currently being employed on this farm.
Yellow 16 - 20 Farm is using some good practices regarding Nutrient Management. However there are some key areas that should be improved upon.
Red 7 - 15 Nutrient Management should be carefully evaluated and a strong effort should be made to adopt improved practices in several areas.
59
108 Weber, Greg. “Vermont Dairy Farm Sustainability Project, Inc. (VDFSP) DRAFT Summary.” Provided by Greg Weber, formerly of VDFSP, via e-mail in June 2003. 109 Klausner. 1993. Quoted in Weber, Greg. “Vermont Dairy Farm Sustainability Project, Inc. (VDFSP) DRAFT Summary.” Provided by Greg Weber, formerly of VDFSP, via e-mail in June 2003. 110 Vermont NRCS Farm*A*Syst. “Worksheet #3: Assessing the Risk of Groundwater Contamination from Fertilizer Storage and Handling.” May 1998. Vermont Natural Resources Conservation Service (NRCS). 2003. 23 Nov. 2003. <ftp://ftp-fc.sc.egov.usda.gov/VT/Technical/FarmASyst/Worksheet3-Fertilizer_Storage&Handling.pdf>. 111 Jokela, Bill. “UVM Missiquoi Water Quality Factsheets: Dairy Farmers Save Dollars and Nutrients by Participating in HUA Crop Management Service.” University of Vermont, Department of Plant and Soil Sciences. 15 Nov. 2002. 8 Dec. 2003. <http://pss.uvm.edu/vtcrops/LMWQ/Lmwq5.pdf>. 112 Vermont Dairy Farm Sustainability Project, Inc. 2002 update. 8 Dec. 2003. <http://www.sare.org/reporting/report_viewer.asp?pn=LNE01-151&ry=2002&rf=0>. 113 “Feeding Strategies to Reduce Phosphorus Inputs from Dairy Sources.” A collaboration effort published by the Willaim H. Miner Agricultural Research Institute. Provided by Diane Bothfeld of St. Albans Cooperative Creamery, Oct. 2003. 114 Vermont NRCS Farm*A*Syst. “Worksheet #13: Assessing the Risk of Groundwater Contamination from Nutrient Management.” October 1997. Vermont Natural Resources Conservation Service (NRCS). 2003. 23 Nov. 2003. < ftp://ftp-fc.sc.egov.usda.gov/VT/Technical/FarmASyst/Worksheet13-Nutrient_Management_Practices.pdf>. 115 Ibid. 116 Michigan Department of Agriculture “Generally Accepted Agriculture and Management Practices for Nutrient Utilization.” February 2002. Supplied via mail from Dr. Lee Jacobs, Department of Crop & Soil Sciences, Michigan State University. 117 The National Academies Press. “Nutrient Requirements of Dairy Cattle: Seventh Revised Edition, 2001.” 2003. 22 Nov. 2003. <http://books.nap.edu/catalog/9825.html>.
60
61
ORGANIC EDUCATIONAL MODULE
DESCRIPTION Organic farms are those certified under the USDA National Organic Program. The USDA National Organic Program is defined in the United States Federal code and is the only legally recognized standard for organic products in the United States (although programs from other countries may be granted USDA status). The National Organic Program requires that farmers meet certain criteria with regard to planning, producing, handling, labeling, and record keeping for plant and animal products. In general, these standards require a ‘natural’ approach to farming in which ecosystem processes drive growth as opposed to ‘man-made’ inputs such as synthetic fertilizers, pesticides, and other chemicals. Conversion of a herd from traditional to organic takes at least one year. Conversion of a field takes at least 3 years. Because only an accredited organization can certify a farm as organic under the requirements of the USDA National Organic Program, this module provides a summary of the regulations rather than certification questions. To obtain an application form or further information on certification, contact the Northeast Organic Farming Association of Vermont (NOFA) (see www.nofavt.org).
INCENTIVES FOR CHANGE • Benefits to the farmer. Currently, less than 2% of the U.S. food supply is grown
using organic methods.118 However, the market is growing approximately 20% per year,119 and is expected to continue growing at a high rate into the future. Therefore, the organic milk market provides a unique opportunity for farmers to differentiate their products within the milk market and sell them at a premium. Current organic milk prices are almost $20 per hundred pounds compared to $11 to $14 for conventional milk.120 Moreover, there is little difference between traditional and organic yields. Research shows that organic harvests are dependent upon the type of feed given to cows, rather than upon the type of farming system used.121 Yields may also vary depending upon the amount of grazed forage compared to high-concentrate feed.122 While the price paid to farmers per hundredweight is higher than conventional milk prices, inputs such as feed and seed are also more expensive, so this method may not necessarily be more profitable than non-organic production. Given this, and the fact that demand for organic milk may vary by season or location, it is recommended that farmers ensure adequate demand before undertaking conversion to organic. With current trends in fluctuating milk prices, however, this method does guarantee a higher price per hundredweight.
• Environmental benefits. To be certified, the USDA National Organic Program
requires that farms take action to produce their goods in an environmentally sustainable way. This Program addresses the following issues: water quality, soil health, nutrient balances, erosion, biodiversity, and animal welfare practices. Many of the requirements are specific to cropping practices, but also affect livestock production in that only organic feed may be fed to an organic herd.
62
SUMMARY OF USDA NATIONAL ORGANIC PROGRAM REGULATIONS The following metrics are taken from the USDA National Organic Program regulations and are divided into three categories: management, livestock, and cropping. It is important to note that some of the criteria laid out under the regulations are absolute, leaving no room for interpretation by the certifying official (such as no use of hormones). Other criteria lack strict definitions for compliance (such as whether or not tillage practices minimize soil erosion), leaving the certifying official to evaluate performance in each category. MANAGEMENT123
Organic production and handling system plan. A farmer must provide a management plan that includes a description of the practices and procedures to be used in raising organic crops and livestock; a list of chemicals and other inputs to be used; a description of monitoring practices; and a description of a recordkeeping system.
Separate organic and non-organic handling systems. The farmer must implement measures necessary to prevent commingling of organic and non-organic products and protect products from prohibited substances. He or she must not package goods in containers that have a synthetic fungicide preservative or fumigant or use or reuse any container that could contaminate the integrity of an organic product.
Product labeling. Only products with a certain amount of organic content may be marketed as ‘organic.’ Products sold as ‘100% organic’ must contain by weight or fluid volume 100% organically produced ingredients (excluding water and salt). Products sold as ‘organic’ must contain at least 95% organically produced products (excluding water and salt). Both 100% and 95% organic products may be labeled with the USDA organic seal. Products sold as ‘made with organic ingredients or food group(s)’ must contain at least 70% organically produced products (excluding water and salt). These products may not use the USDA seal. Products with less than 70% organically produced ingredients may identify each ingredient that is organic with the word ‘organic’ if the percentage of organic contents is shown on the information panel. These products may also not use the USDA seal.
Organic handling requirements. Mechanical or biological methods may be used to process organic products for the purpose of retarding spoilage or preparing goods for market.
Pest management in buildings and facilities. The farmer must use practices to prevent pests, including, but not limited to: removal of pest habitat, food sources, and breeding areas; preventing pest from accessing facilities; and management of temperature, light, humidity, and other factors. Pests may be controlled through: mechanical or physical controls, lures and repellents allowed under the rule, or methods not allowed under the rule if the handler and certifying agent agree on the method and the handler updates the management plan accordingly.
LIVESTOCK124
• Origin of livestock. Organic milk or milk products must be from animals that have been under organic management for at least one year. If a grower wants to convert an entire herd, he or she must provide a minimum of 80% organic feed for 9 months, followed by three months of 100% organic feed. In addition, all
63
other requirements must be met. Moreover, cows must be managed under organic requirements for at least the last third of gestation in order for newborn calves to be considered organic. The heifer that gave birth however will not be considered organic and must be removed from the farm or converted separately. Cows removed from an organic operation may not be sold as organic. All management must be continuous. Records must be maintained to identify organically managed animals.
• Livestock feed. Farmers must provide cows organic feed, including pasture and forage, and may provide non-synthetic or synthetic feed additives and supplements allowed under the rule. The farmer must not use animal drugs (including hormones) to promote growth or provide feed supplements and additives above amounts needed for nutrition and health maintenance. A farmer can not use plastic pellets for roughage; must not feed cows formulas containing urea, manure, or mammalian or poultry slaughter by-products; or use additives or supplements in violation of the Federal Food, Drug, and Cosmetic Act.
• Use of drugs, vaccinations, hormones. Milk or milk products may not be sold as organic if biologics have been administered within 30 days. Farmers may not administer any drugs other than vaccinations in the absence of illness, use growth hormones or recombinant bovine growth hormone, administer synthetic parasiticides on a routine basis, administer parasiticides to slaughter stock, administer drugs in violation of the Federal Food, Drug, and Cosmetic Act, or withhold medical treatment from a sick animal in an effort to preserve its organic status. All appropriate medications must be used to restore a sick animal to health. Cows treated with prohibited substances may not be represented as organic.
• Livestock health care practice standard. The farmer must provide and maintain health care practices. He or she must: select species and types of livestock with regard to suitability for site-specific conditions; provide a feed ration sufficient to meet nutritional requirements; establish appropriate housing, pasture conditions, and sanitation practices; provide conditions which allow for exercise, freedom of movement, and reduction of stress; perform physical alterations to minimize pain and stress; and administer vaccines and biologics if necessary.
• Livestock living conditions. The farmer will provide living conditions that accommodate the health and natural behavior of animals including access to outdoors, shade, shelter, exercise areas, fresh air, and direct sunlight, access to pasture for ruminants, and clean dry bedding. The farmer must provide shelter designed for natural maintenance, comfort behaviors, and the opportunity to exercise. Any shelter must also be designed for the appropriate temperature level, air circulation, and low potential for injury. The farmer may provide temporary confinement due to inclement weather, animals’ stage of production, conditions where health and safety may be jeopardized, or to avoid risk to soil or water quality. The farmer must manage manure in a way that optimizes recycling of nutrients and does not contribute to contamination of crops, soil or water.
CROPPING125
• Land requirements. Any parcel of land must have been managed according to the soil fertility and crop nutrient practice standard (see below) and have had no prohibited substances applied to it for at least three years preceding harvest of any organic crops.
64
• Soil fertility and crop nutrient management practice standard. The farmer must implement tillage and cultivation practices that maintain or improve the physical, chemical, and biological condition of soil and minimize soil erosion; manage crop nutrients and soil fertility through crop rotations, cover crops, and the application of plant and animal materials; and manage plant and animal material to maintain or improve soil organic matter content. Specific direction is included for use of raw animal matter, composted plant and animal materials, and uncomposted plant materials. In addition, methods for managing crop nutrients through other means are provided.
• Crop pest, weed, and disease management practices standard. The farmer must use management practices to prevent crop pests, weeds, and diseases through crop rotation, sanitation measures, and cultural practices such as selecting plant varieties that are resistant to pests, weeds, and diseases. When natural methods cannot control pests, weeds, and diseases, an allowed synthetic substance may be used as long as it is documented in the organic plan.
• Crop rotation practice standard. The farmer must implement a crop rotation including, but not limited to sod, cover crops, green manure crops, and catch crops to maintain or improve soil organic matter content, provide for pest management, manage nutrients, and provide erosion control.
LINKAGES TO OTHER MODULES While this is the only module that focuses directly on organic production, it should be noted that organic practices can positively impact other sustainable agriculture indicators such as Animal Welfare, Soil Health, Water Management, Nutrient Management, and Pest Management as described below. ORGANIC TOPIC OTHER MODULE(S) Livestock Feed Nutrient Management Livestock Health Care Practice Standard Animal Welfare Livestock Living Conditions Animal Welfare Soil Fertility and Crop Nutrient Management Practice Standard
Soil Health
Soil Fertility and Crop Nutrient Management Practice Standard
Water Management
Soil Fertility and Crop Nutrient Management Practice Standard
Nutrient Management
Crop Pest, Weed, and Disease Management Practices Standard
Pest Management
Crop Rotation Practice Standard Nutrient Management
FURTHER INFORMATION Additional details and information on the above can be obtained through the following programs or sources. • Northeast Organic Farming Association of Vermont.
http://www.nofavt.org/index.cfm. This non-profit association of farmers, gardeners, and consumers works to organic farming in Vermont. It is also the only accredited certifying organization in Vermont.
65
• Appropriate Technology Transfer for Rural Areas (ATTRA). “Organic Farming Source List.” http://attra.ncat.org/organic.html#list. ATTRA specializes in developing sustainable agricultural information and tools. This page provides a number of documents focused on organic farming including: organic fruits, vegetables, flowers, herbs, field crops and livestock. It also has documents focusing on organic practices for pests, soil and fertilizer health, and marketing.
• Appropriate Technology Transfer for Rural Areas (ATTRA). “An Organic and
Sustainable Practices Workbook and Resource Guide for Livestock Systems, April 2002.” http://attra.ncat.org/attra-pub/PDF/livestockworkbook.pdf. ATTRA specializes in developing sustainable agricultural information and tools. This workbook explains the range of practices and materials allowed under the USDA National Organic Program regulations. It is a great tool for helping farmers contemplating conversion to organic production.
• USDA. “The National Organic Program” homepage.
http://www.ams.usda.gov/nop/indexIE.htm. This USDA site provides the full regulation text, questions and answers, a list of certifying agents, and other information on the National Organic Program.
66
118 Dimitri, Carolyn, and Greene, Catherine. Recent Growth Patterns in the U.S. Organic Foods Market. USDA Economic Research Service. Washington, DC, 2002. 30 Nov. 2003 <http://www.ers.usda.gov/publications/aib777/> 119 Ibid 120 Smallheer, Susan. “Organic milk called a cure for Vt. Dairies.” The Barre Montpelier Times Angus on the Web. 6 July 2003. 7 Aug. 2003 <http://www.timesargus.com/Story/66645.html>. 121 Research-station of Öjebyn. Swedish University of Agricultural Sciences. 22 Nov. 2003 <http://www.njv.slu.se/sections/animal/organic.cfm>. 122 Cederberg, Christel and Berit, Mattsson. “Life cycle assessment of milk production – a comparison of conventional and organic farming.” Journal of Cleaner Production, Vol. 8 (2000). 123 Adapted from USDA National Organic Program. “Regulatory Text Only.” National Organic Program 7 CFR 205. 22 Nov. 2003 <www.ams.usda.gov/nop/NOP/standards/FullRegTextOnly.html>. 124 Ibid. 125 Ibid.
67
PEST MANAGEMENT EDUCATIONAL MODULE
DESCRIPTION Since its introduction to agriculture in the 1940’s,126 chemical pesticides have been the dominant approach to controlling and eliminating pests, resulting in more consistent crop yields as well as a reduction in labor needed to manage the crops. Pesticides include herbicides, insecticides, fungicides, rodenticides, and plant growth regulators. While pesticide use has increased, traditional pest management methods, such as crop rotation and growing a variety of crops, have been phased out. However, there is growing concern regarding the use of pesticides as they “…can cause harm to humans, animals, or the environment because they are designed to kill or otherwise adversely affect living organisms.”127 These concerns lead to an alternative approach, called Integrated Pest Management (IPM). The California Healthy Schools Act of 2000 defines IPM as "…a pest management strategy that focuses on long-term prevention or suppression of pest problems through a combination of techniques such as monitoring for pest presence and establishing treatment threshold levels, using non-chemical practices to make the habitat less conducive to pest development, improving sanitation, and employing mechanical and physical controls. Pesticides that pose the least possible hazard and are effective…are used only after careful monitoring indicates they are needed according to pre-established guidelines and treatment thresholds.128 Elements of IPM are integrated into the Assessment Questions below. Field corn is susceptible to the Western corn rootworm (WCRW) and of specific interest to Vermont dairy farmers, as 95% of Vermont’s 95,000 acres of field corn is fed to lactating dairy cows.129 The traditional approach is to apply pesticide at the time of planting or use Bacillus thuringiensis (Bt) corn instead, which has negative impacts on biodiversity (see Biodiversity Module). The University of Vermont Extension Service is researching alternative IPM approaches for the WCRW and plans to provide educational sessions and coordinate trips to fields managed under this alternative system.130
INCENTIVES FOR CHANGE • Human benefits. From a health perspective, there are diseases related to significant
exposure of pesticides as well as afflictions related to minimal exposure of pesticides, but over longer periods of time. Children are especially at risk. There are “increasing amounts of data that suggest links between pesticide exposure and cancers in children”131 as well as Parkinson’s disease.132 In addition to cancers, other suspected affects of chronic exposure, even at low levels, include damage to immune systems and the nervous system. Those working and living in close proximity to treated fields may be at significant risk, depending on factors such as the pesticide type, weather conditions during application, and frequency of application.
• Environmental benefits. In addition to concerns regarding the elimination of the
natural predators of the pests, environmental concerns include possible contamination of ground and surface water. This could then affect human health, marine life and many other species that rely upon these water sources.
68
• Cost savings. With repeated pesticide use, the effectiveness on pests decreases. From 1945 to 1989, pesticide use in the US increased 10 times, but total crop loss from pests almost doubled from 7 to 13%.133 The decrease in effectiveness occurs because the target pest builds up resistance and/or because competitors or predators of the target pest are also eliminated by the pesticide.134 Moving towards IPM provides cost benefits by taking advantage of nature’s own system, versus purchasing chemicals.
ASSESSMENT QUESTIONS For all questions, please choose the categories that best identify your current management practices. Use the Summary sheet on the last page of this module to evaluate overall performance. PEST IDENTIFICATION135
1. Farmer has not been trained to identify pests OR does not seek advice from a professional consultant when managing pests.
2. Farmer knows key pest species of crops and has been trained in pest identification, but does not routinely use scouting information to manage pests.
3. Farmer knows key pest species of crops, has been trained in pest identification, OR employs certified consultant.
4. Farmer and consultant (if hired) understand key pest life cycle factors and exploit “weak links” for effective management. Pest identification and scouting information are always used to manage pests and beneficial organisms.
To maximize pesticide efficiency, it is best to determine what the target pest is. Once correctly identified by the farmer or a specialist, it is better to apply the pesticide specific to that pest, but only when there is evidence (through scouting) that the pest is causing problems. The best practice in terms of when to apply the pesticide includes an understanding of when the pest is most susceptible based on the optimal timeframe (day/night, weather conditions, etc.). By combining all these practices, the farmer will require less pesticide, incur lower costs, and create fewer human and environmental impacts. PESTICIDE SELECTION136
1. Only pesticides registered in the state as ‘approved’ for the target pests and affected crop are used. Pesticide mixtures prohibited by the label are not used.
2. In addition to #1, all pesticides at risk of pest resistance development are rotated with other pesticides of a different chemical class, starting with the first year of use. Pesticides at high risk of resistance development are used sparingly.
3. In addition to #2, pesticides labeled “Danger” are avoided. The timing of applications and selection of pesticide materials correspond to scouting records.
4. When a control measure is needed, every effort is made to use beneficial organisms or cultural controls, using reduced toxicity pesticides (labeled “Caution”) as a last resort.
When determining which pesticide to use, consideration should be given to the effectiveness of the pesticide. Factors that can decrease the effectiveness of the
69
pesticide include: (1) built-up resistance by pests and (2) accidental elimination of benign, natural competitors or predators of the pest. To minimize the development of resistance by pest to pesticides, farmers should rotate the type of pesticide that is used and understand which types of pesticides the pest is able to more readily resist. Another concern addressed here, is the level of toxicity with regard to human health. Using pesticides labeled “Danger” and “Caution” should be avoided whenever possible. TIMING OF PESTICIDE APPLICATION137
1. Pesticide application is based only on calendar date or stage of crop development.
2. Pesticide application is made at first sign of pests. 3. Pesticide application is based on pest population levels determined by scouting,
but treatment threshold is not used. 4. Pesticide applications are made only when pests reach a predetermined
treatment threshold. “Weak link” of pest’s life cycle is targeted for pesticide applications.
Another way to decrease the amount of pesticides used while reducing costs and achieving the same outcome is to understand how to determine when pesticides should be applied. The easiest and least efficient method is to apply pesticide annually at certain time periods. In contrast a best practice is to plan ahead of time what level of pest presence will prompt you into action. When this level is achieved, the timing of the application is aligned with when the pest is most susceptible. This practice allows for optimal pesticide efficiency, which translates into cost savings and minimal threat to humans and the environment.
WEATHER CONDITIONS138 1. Weather forecasts are not considered when planning to spray. Spraying occurs
in weather conditions contrary to the pesticide bottle label, such as windy days or imminent rain.
2. Weather forecasts are considered when planning to spray. Pesticide application is made during rain-free periods and at low wind speeds.
3. Weather forecasts are used to plan pesticide applications. No spraying is done when wind would move it off target. Applications are made during label-required rain-free periods.
What happens to pesticides post-application is of great importance. There is significant concern regarding the entry of these chemicals into the water system, which can happen if there is no or minimal consideration given to the rain forecast. Wind can also carry the pesticide to non-target areas, such as the barn area or farmer’s house. Inadvertent exposure to these chemicals should be avoided whenever possible. By considering the weather, pesticide application can be more concise and efficient.
70
RECORD KEEPING139
1. All legal requirements for pesticide record keeping are met, including date, field identification, target pest, pesticide name and EPA number, formulation, rate and number of acres treated.
2. Pesticide record keeping includes regular weekly pest scouting records. 3. The timing of applications and the selection of pesticide materials correspond to
scouting records. 4. Application records include reference to decisions about the materials selected
based on pesticide toxicity rankings. Pesticide records are tabulated annually to indicate progress in reducing overall use of high toxicity pesticides.
Keeping accurate and up to date records is important for regulations but also can aid in better understanding of your current pesticide management practices. Once a baseline is established, opportunities to decrease pesticide usage or increase its efficiency can be identified. SPECIFIC MANAGEMENT PRACTICES TO CONTROL FLIES (Please check all that apply)
Powder cows Capture flies by using fly strips Eliminate wet seepage areas Handle and store manure properly Maximize sanitation in and around structures Use biological controls (such as fly parasites)
SPECIFIC MANAGEMENT PRACTICES TO CONTROL WEEDS (Please check all that apply)
Conduct weed scouting Prepare and update weed maps twice per season Rank weeds in order of abundance or importance Plan and manage ground cover or soil quality to prevent weeds and weed seed
immigration Plant crops using a precision system, which allows for precise mechanical weed
removal
One aspect of IPM is to modify the habitat so it is less conducive to pest development, improves sanitation, and employs mechanical and physical controls.140 Such management practices for controlling flies and weeds are identified in the above questions. Some practices are less time and/or resource intensive than others and are more applicable and/or easier to implement, but they all work to minimize use of pesticides. As a farmer who switched to IPM as part of a research project commented, "You have to change with the times. That’s why I got involved with the IPM project," explains Iverson. "You have to be able to adapt to survive in farming these days, whether it’s portable computers or the new soft chemicals. They’re here to stay."141
71
LINKAGES TO OTHER MODULES Pest management issues are tied to nutrients, biodiversity and water management. The table below identifies where you can find more information on some of the topics mentioned in this module.
PEST MANAGEMENT TOPIC OTHER MODULE(S) Crop Rotation Soil Health GMOs Competitors or Predators of Target Pest
Biodiversity
FURTHER INFORMATION Additional details and information on the above can be obtained through the following programs. • University of Vermont Extension Program is conducting research on Integrated
Pest Management. Information on the program’s current efforts can be accessed on the web at http://pss.uvm.edu/ipm/.
• Farm*A*Syst, managed through the Vermont Natural Resources Conservation
Council, is devoted to national and state-level improvements to pest management and provides comprehensive evaluation and best management sheets specifically for dairy farmers in Vermont. More information can be found at their web-site, http://www.vt.nrcs.usda.gov/technical/FarmASyst/.
• The Food Alliance. http://www.thefoodalliance.org/. This organization certifies
producers, which use socially and environmentally responsible farming practices. The certification process includes sections on natural area management, watershed management, crop management, pest management, pastureland management, and animal welfare. Details on pest management are included under pesticide applications and record keeping.
• Appropriate Technology Transfer for Rural Areas (ATTRA) “Sustainable
Agriculture: An Introduction.” http://attra.ncat.org. ATTRA specializes in developing sustainable agricultural information and tools. For a summary of the practices they advocate regarding pest management, see “Sustainable Agriculture: An Introduction” at http://attra.ncat.org/attra-pub/PDF/sustagintro.pdf. Phone: 1-800-346-9140.
72
SUMMARY RESULTS FOR PEST MANAGEMENT Instructions: In the table below, please record the score for the answer you selected for each question. For multiple-choice questions, the response number serves as your score for that category (i.e. choice # 2 is worth 2 points). For “check all that apply questions,” please see scoring criteria for each question in the chart below. Once all responses have been completed, add up the answers and record the total.
QUESTION ANSWER/SCORE
1. Pest Identification
2. Pesticide Selection
3. Timing of Pesticide Application
4. Weather Conditions
5. Record Keeping 6. Specific Management Practices: Flies (Add 1 for each box
checked)
7. Specific Management Practices: Weeds (Add 1 for each box checked)
Total Score
Total Possible Points 30
Interpretation: The next step in understanding your farm’s performance in the category of Pest Management is to compare your results to best practices. Below is a table that ranks your performance from best practice (green) to practices that require improvement (red). Compare the number of points you received for your practices to optimal practices.
Point Range Interpretation
Green 26 – 30 Best practices regarding Pest Management are currently being employed on this farm.
Yellow 18 - 25 Farm is using some good practices regarding Pest Management, however there are some key areas that should be improved upon.
Red 5 - 17 Pest Management practices should be carefully evaluated and a strong effort should be made to adopt improved practices in several areas.
73
126 Heller, Martin C., Keoleian, Gregory A. “Assessing the sustainability of the US food system: a life cycle perspective.” Center for Sustainable Systems Agricultural Systems. 6 Dec. 2000. <http://css.snre.umich.edu/css_doc/CSS00-04.pdf>. March 2003. 127 US EPA. “About Pesticides” 18 June 2003. <http://www.epa.gov/pesticides/about/index.htm>. 1 Nov. 2003. 128 State of California. “Definition of IPM (Integrated Pest Management).” 2003. <http://www.cdpr.ca.gov/cfdocs/apps/schoolipm/overview/definition_ipm.cfm?crumbs_list=1,19>. 1 Nov. 2003. 129 Field Corn IPM Program.. University of Vermont. 15 Oct. 2003. <http://pss.uvm.edu/ipm/corn.html>. 130 University of Vermont <http://pss.uvm.edu/ipm/corn.html>. 131 Pesticide Use in the US. Oregon State. Oct. 2003. <http://oregonstate.edu/instruction/bi301/pesttren.hm>. 1 Nov. 2003. 132 Ibid. 133 Heller, Martin C., Keoleian, Gregory A. “Assessing the sustainability of the US food system: a life cycle perspective.” Center for Sustainable Systems Agricultural Systems. 6 Dec. 2000. <http://css.snre.umich.edu/css_doc/CSS00-04.pdf>. March 2003. 134 Central Coast Vegetable Integrated Pest Management Project, University of California Cooperative Extension. <http://ccvipmp.ucdavis.edu/media5-salinas.ipm.final.html>. 18 Oct. 2003. 135 Question from Farm*A*Syst. Pesticide Storage and Handling. 136 Question adapted from The Food Alliance. Dairy Inspection Tool for the Pacific Northwest. 2002. 137 Question from Farm*A*Syst. Pesticide Storage and Handling. 138 Ibid. 139 Question adapted from The Food Alliance. Dairy Inspection Tool for the Pacific Northwest. 2002. 140 State of California. “Definition of IPM (Integrated Pest Management).” 2003. <http://www.cdpr.ca.gov/cfdocs/apps/schoolipm/overview/definition_ipm.cfm?crumbs_list=1,19>. 1 Nov. 2003. 141 Central Coast Vegetable Integrated Pest Management Project, University of California Cooperative Extension. <http://ccvipmp.ucdavis.edu/media6-media-quotes.html>. 18 Oct. 2003.
74
75
SOIL HEALTH EDUCATIONAL MODULE
DESCRIPTION Soil health is based on a variety of characteristics, including organic matter, salinity, structure and compaction, available nutrients, pH, water holding capacity and erosion levels. Together, these characteristics allow soil to serve a variety of functions: supporting the growth of crops (and therefore animals), regulating the distribution of rain and irrigation water and providing filtration to improve water as it infiltrates through soils. Under current production methods, soil health and its corresponding contribution to farm production is under threat by increasing levels of soil degradation and erosion. The 1999 National Resources Inventory of the USDA reports that 1,700 megatonnes (million metric tonnes) of soil eroded from U.S. land in 1997.142 This is enough to fill a fully loaded freight car train that would encircle the planet seven times.143 Also, soil organic matter in some areas of North America, has declined 30-60% since the start of cultivation.144 These effects make farmers’ jobs increasingly difficult, as it becomes necessary to improve degraded soil quality with cost and time intensive inputs. Soil erosion is particularly problematic since its effects are irreversible. Healthy soils are not only important to farm production, but also to overall environmental health. When soil is eroded via runoff, sediments, in addition to being a water pollution source, can carry nutrients or pesticide residues that further pollute surface waters. Soil that is impacted worsens this problem in that impacted soils cannot absorb as much water, increasing the amount of runoff. Unhealthy soil also contributes to particulate matter air pollution when loose topsoil is transported off of the farm via wind. This module focuses on best management practices to maximize soil quality and health in order to maximize production and minimize erosion and pollution to water or air. Recommended areas of management include monitoring overall quality, minimizing erosion, maximizing organic content and preventing soil compaction.
INCENTIVES FOR CHANGE • Regulations: The most recent 2002 Farm Bill includes an amendment to the Food
Security Act of 1985 requiring that conservation systems must be implemented for agricultural operations on federally-designated “highly erodible land” (HEL). Conservation systems must protect land from excessive soil erosion and non-compliance can result in a producer becoming ineligible for numerous USDA benefits. In 1997, Vermont had approximately 125,000 acres of HEL. Conservation efforts undertaken now can mean assured compliance with this regulation and can safeguard a farmer’s operations in the future. Technical and financial assistance is often available for farmers to implement both voluntary and compliance-driven conservation initiatives. See the “Further Information” section for details.
• Cost Savings: Maintaining healthy soils encourages maximum yields, meaning that
farmers can maximize the amount of feed that they grow on the farm and correspondingly reduce costs of purchased feed. Healthy soils can also support crop growth with fewer inputs of commercial fertilizers and pesticides, thereby decreasing costs for these inputs, saving farmers time on their application and providing more
76
efficiently produced crop yields. Benefits received now will be compounded in the future as soil health becomes increasingly better and increasingly self-sustaining.
• Governmental Cost Sharing: The 2002 Farm Bill re-authorized funding to help
farmers adopt conservation strategies directed at improving soil quality, water quality, air quality and wildlife habitat. Through this program, farmers can be paid to implement new practices that will benefit their operations as well as the environment. For example, soil quality improvement practices can reduce impact to the environment and improve farmers’ yields, thus improving revenues and lowering costs overall. Cost sharing is generally up to 75%, though certain farmers may be eligible for 90%, and incentive payments can last up to three years to promote continued use and long-term adoption of management strategies. In 1993, the USDA Natural Resources Conservation Services allotted $5,692,454 for technical assistance and $4,134,600 for financial assistance in Vermont.
ASSESSMENT QUESTIONS For all questions, please choose the categories that best identify your current management practices. Use the Summary sheet on the last page of this module to evaluate overall performance. SOIL ORGANIC MATTER
1. Soil organic matter is not monitored and inorganic fertilizers are used to provide a large portion of crop nutrients.
2. Some effort is made to increase soil organic matter through a) restricted tillage practices, b) cover crops, c) use of least oxidizing inorganic fertilizers or precision fertilizer applications, d) crop rotations, or e) use of manures or composts on fields.
3. A strong effort is made to maximize and maintain soil organic matter. Soil is tested for organic content and two practices from #2 are used as appropriate to soil need.
4. As per #3, and use of inorganic fertilizer is completely or almost completely eliminated.
The elements of soil that were once alive are termed as ‘soil organic matter.’ Organic matter is essential to soil health and productivity due to the myriad of services and benefits it provides. Examples include stabilizing and holding the soil together; improving the soil’s ability to store and transmit air, water and nutrients to crops; and helping to prevent soil compaction. The net benefits are more productive crop harvests with fewer inputs, reduced runoff, and minimized soil erosion.
Cover crops contribute to soil organic content by increasing the plant material that is left on the soil and by preventing erosion of topsoil that is rich in organic material. Tillage and overuse of inorganic fertilizers, particularly nitrogen, accelerates the rate of decomposition of organic material in the soil, thereby causing loss of this material at a faster rate. These practices should therefore be minimized. Manures, which increase organic matter in the soil, should be used to supply soil with needed nutrients.
77
USE OF COVER CROPS AND VEGETATIVE AREAS 1. No effort is made to vegetate areas of bare soil on the farm; cover crops are
never used. 2. Some effort is made to vegetate areas of bare soil on the farm. Soil is covered
some of the time/in some areas by vegetative plantings, buffer strips, pasture, other perennial crops and seasonal crops. Cover crops are sometimes used.
3. Bare soil on the farm is kept to a minimum via vegetative plantings, buffer strips, pasture, other perennial crops and seasonal crops. Cover crops are used every year to maximize soil coverage and soil benefits.
4. As per #3, and cover crop type and timing are strategically chosen, based on farm characteristics such as soil type and traditional crop grown, to maximize benefits to soil.
Plantings such as cover or perennial crops, grass, and hay hold soil in place, prevent compaction of soil, improve tilth,1 and curb nutrient loss. Plant cover is also beneficial in that it increases organic matter and biological activity in the soil, which is beneficial to soil quality and plant growth. When cover crops are legumes such as alfalfa, clover or soybeans, they provide an added benefit of fixing nitrogen into the soil for use by future crops. Cover crops provide the additional benefit that yields can be sold or used as feed for cows. It is important to manage any plantings well by maintaining appropriate practices with respect to nutrient application and pesticide use. CROP ROTATION
1. Crops are not rotated and most fields have corn or other high intensity row crops. 2. Crops are rotated every four or more years and rotation tends to include high
intensity row crops and with small grain (oats, wheat, etc.) crops. 3. Crops are rotated at least once every three years and rotation includes row crops
and grass or legume forage crops. Some effort is made to utilize crop rotation to optimize nutrient and pest management.
4. Crops are rotated at least once every three years and grass or legume forage crops are grown more often than row crops. Crop rotations are specifically planned to optimize nutrient and pest control.
Crop rotation leads to greater quantity and diversity of soil organic material, improves nutrient availability, and can help control pests. Including legume crops in the rotation will provide the needed diversity while also fixing nitrogen in the soil. Other crops can also help prevent nutrient leaching. The Michigan State University Agriculture Experiment Station found that, with regard to nutrient leaching, wheat never loses more than 20 pounds of nitrogen per acre per year, as compared to continuous corn, which leaches up to 100 pounds.145 Various rotations may reduce nitrogen leaching 30-50% as compared to growing continuous corn.146 Crop rotation is beneficial economically, in that it can improve amount and diversity of yields and reduces the need for costly commercial fertilizers and pest-control chemicals.
1 Tilth is defined as soil’s suitability to support plant or root growth by means of proper pore spaces for air and water filtration and movement and ability to hold adequate amounts of water and nutrients
78
TILLAGE PRACTICES 1. Tillage practices are undertaken without consideration of impacts to soil. 2. An effort is made to minimize/alter tillage use to benefit soil quality. Conservation
tillage is used to maintain crop residue on soil; tillage is never done on wet soil; tillage is restricted to specific portion of fields (strip tillage); or tillage is avoided completely.
3. Tillage is strictly restricted as per one or more methods in #2, and resulting soil quality is monitored.
4. Perennial crops or crop rotation system is used, allowing for a no-till farming operation.
Adjusting tillage practices is beneficial for reducing soil compaction, minimizing erosion and improving organic matter content, all of which are environmentally and economically beneficial to the farmer. Soil compaction can restrict plant roots (reducing uptake of water and nutrients), affect moisture and soil temperatures (affecting organic matter and nutrient release), and decrease infiltration of water, which increases the levels of runoff and erosion. Tillage should never be done on wet soil, as it is particularly susceptible to compaction versus dry soil. Conservation tillage leaves at least 30% of the soil surface covered by crop residues after planting, thereby protecting it from erosion and contributing to the organic matter and beneficial biological activity in the soil. Additionally, no-till or strip-tillage2 practices minimize the area being tilled, thus minimizing soil compaction and removal of plant residues. Restrictive tillage practices can also result in cost savings by reducing the amount of fuel needed to run the equipment or eliminating the need to own and maintain the equipment. SOIL CONSERVATION/EROSION PREVENTION
1. No consideration is given to the problem or prevention of soil erosion. Erosion rates are unknown.
2. An effort has been made to evaluate soil erosion, per the following evidence: presence of channels/gullies on fields, soil deposits at field margins or base of sloping areas, surface-crusted areas, exposure of lighter colored subsoil, and/or bare soil and loss of soil around plant roots.
3. In addition to #2, at least one step has been taken to minimize erosion, such as utilizing diversion ditches, maintaining vegetated buffer strips around bodies of water, using conservation tillage or creating windbreaks.
4. In addition to at least two actions from #3, at least one other action is taken: no-till or strip-till methods, mulches are used, manure or composts incorporated into fields, perennial crops are used on farm.
Soil erosion is the physical removal of surface soil material. Erosion can negatively impact crop production by contributing to the breakdown of soil structure and resulting in the loss of the uppermost soil layer. This top layer of soil has the highest levels of organic matter and biological activity, both of which are important for plant growth and overall soil health. It is very important to minimize erosion on the farm even if signs are 2 Strip-tillage is defined as less than full-width tillage of varying intensity that is conducted parallel to the row direction. Generally no more than one-fourth of the plow layer is disturbed by this practice.
79
not obvious that erosion is occurring. The loss of just 1/32 of an inch of topsoil, very difficult to notice on a farm, can equal a loss of 5 tons of soil per acre.147 Soil loss can be mitigated in several ways: o Diversion ditches or windbreaks reduce soil loss by diverting excess water or wind
from reaching vulnerable soils. o Vegetated buffer strips can ‘catch’ runoff from fields, including soil, sediments, and
nutrients, to help prevent water pollution and soil loss from farms. o Adjusting tillage practices can help by leaving more crop residues on the soil,
contributing to soil organic matter content and decreasing soil compaction and removal of plant residues, all of which minimize soil erosion.
o Mulches and manure or composts cover the soil and increase organic matter content, protecting soil from erosion and improving its quality. Perennial crops provide compound benefits by covering the soil and holding it in place with their roots.
SOIL QUALITY MONITORING
1. Soil quality on farm is not monitored. 2. Soil quality (including nutrient levels, salinity, and pH) is measured via soil tests
every 5+ years but test results don’t necessarily guide farm practices. 3. Soil quality is measured via soil tests every 3 years and test results and
corresponding UVM recommendations guide farm practices. 4. Soil quality is measured via soil tests every 1-3 years and farm practices strictly
follow corresponding UVM recommendations. Regular soil testing (done at least once every 3 years) is the best way to ensure that soil remains healthy and productive, maximizing benefits to your farm. UVM and other experts offers soil test kits, analysis services and corresponding management recommendations that provide information such as soil pH, organic matter, available phosphorus and other nutrient levels, and fertility recommendations. At UVM, a basic soil test costs $9/sample and additional tests can be run for nominal fees (e.g. tests for organic matter cost an additional $3). It is important to not only do the tests, but also to follow recommendations associated with the results. Results of these tests may include recommendations for nutrient application rates or improve soil characteristics such as pH or organic matter content. Maintaining high soil quality is increasingly beneficial over time as the soil is able to do the job that it is intended with fewer inputs (including time and money) from the farmer. If done every 1 to 3 years, soil testing is a non-time-intensive, inexpensive way to better understand and manage soil quality.
80
LINKAGES TO OTHER MODULES Soil Health issues are closely tied to Biodiversity and Nutrient Management. The table below identifies where you can find more information on some of the topics mentioned in this module. SOIL HEALTH TOPIC OTHER MODULE(S) Use of Inorganic Fertilizers Nutrient Management Soil Testing Nutrient Management Manure Use on Fields Nutrient Management Cover Crops Biodiversity Buffer Strips Biodiversity
FURTHER INFORMATION Additional details and information on the above can be obtained through the following programs. • The USDA Natural Resources Conservation Service provides information on soil
quality, offers tools for assessing soil quality and recommends best practices for improving soil quality. Information can be found at http://soils.usda.gov/sqi/soil_quality/what_is/index.html.
• NRCS also operates a Conservation Reserve Program (CRP), which provides
technical and financial assistance to eligible farmers and ranchers to address soil, water, and related natural resource concerns on their lands in an environmentally beneficial and cost-effective manner. See http://www.vt.nrcs.usda.gov/programs/CRP/ and http://www.fsa.usda.gov/dafp/cepd/crp.htm for more information.
• The Environmental Quality Incentives Program (EQIP), also run by the NRCS,
was re-authorized by the 2002 Farm Bill to provide cost sharing up to 75% for farmers to implement conservation practices that address soil, water, air, wildlife and other natural resource concerns. Incentive payments may last up to 3 years to encourage farmers to continue utilizing new management practices. See http://www.nrcs.usda.gov/programs/eqip/ for more information.
• Vermont NRCS has twelve regional field offices that can provide more assistance
and information on all of the above. Contact the District Conservationist at the office nearest you:
o Bennington: (802) 442-2275 o Berlin: (802) 828-4493 o Brattleboro: (802) 254-9766 o Middlebury: (802) 388-6748 o Morrisville: (802) 888-4935 o Newport: (802) 334-6090 o Rutland: (802) 775-8034 o St. Albans: (802) 527-1296 o St. Johnsbury: (802) 748-2641 o White River Junction: (802) 295-7942 o Williston: (802) 879-4785
81
o Vermont NRCS State Office: Dave Hoyt, Assistant State Conservationist, 802-951-6796, extension 227
• The Vermont Agency of Agriculture, Food and Markets provides a clearinghouse
of information on controlling non-point source pollution and runoff from dairy farms, including accepted agricultural practices (AAPs), best management practices (BMPs) and technical and financial assistance for projects. See http://www.vermontagriculture.com/pidnonpointsource.htm for more information. You can also call the Vermont Natural Resources Conservation Districts
o Windham, Bennington, Rutland, Windsor, Counties: 802-257-5621 o Orleans, Essex, Caledonia, Orange, Washington Counties: 802-229-2720 o Addison, Chittenden, Lamoille, Franklin, & Grand Isle Counties: 802-388-
6746
82
SUMMARY OF RESULTS FOR SOIL HEALTH Instructions: In the table below, please record the score for the answer you selected for each question. For multiple-choice questions, the response number serves as your score for that category (i.e. choice # 2 is worth 2 points). For “check all that apply questions,” please see scoring criteria for each question in the chart below. Once all responses have been completed, add up the answers and record the total.
QUESTION ANSWER/SCORE
1. Soil Organic Matter
2. Use of Cover Crops and Vegetative Areas
3. Crop Rotation
4. Tillage Practices
5. Soil Conservation/Erosion Prevention
6. Soil Quality Monitoring
Total Score
Total Possible Points 24
Interpretation: The next step in understanding your farm’s performance in the category of Soil Health is to compare your results to best practices. Below is a table that ranks your performance from best practice (green) to practices that require improvement (red). Compare the number of points you received for your practices compared to optimal practices. Point Range Interpretation
Green 21 - 24 Soil Health best practices are currently being employed on this farm.
Yellow 15 - 20 Farm is using some good practices regarding Soil Health. However there are some key areas that should be improved upon.
Red 6 - 14 Soil Health practices should be carefully evaluated and a strong effort should be made to adopt improved practices in several areas.
83
142 Heller, Martin C., Keoleian, Gregory A. “Assessing the sustainability of the US food system: a life cycle perspective.” Agricultural Systems, 76, 2003, 1007-1041. 143 Ibid. 144 USDA Agricultural Research Service Website. National Programs Soil Resource Management “Component II: Nutrient Management.” 25 Oct. 2003 <http://www.nps.ars.usda.gov/programs/programs.htm?npnumber=202&docid=349>. 145 Magdevski, Sonja. “Cropping Systems Can Benefit the Soil.” Futures: Sustainable Agriculture. Fall/Winter 2000/Spring/Summer 2001, Vol. 18, No. 3/vol.19, nos. 1,2,3. Michigan State University Agricultural Experiment Station Website. 25 Nov. 2003. 3 Dec. 2003. < http://www.maes.msu.edu/Futures/fall_winter2001.pdf>. 146 Ibid. 147 “Soil Quality Resource Concerns: Soil Erosion” USDA NRCS Soil Quality Information Sheet. USDA Natural Resources Conservation Service Website. Soil Quality Information Sheet. “Soil Quality Resource Concerns: Soil Erosion” April 1996. 19 Nov. 2003. < http://soils.usda.gov/sqi/files/sq_two_1.pdf>.
84
85
WATER MANAGEMENT EDUCATIONAL MODULE
DESCRIPTION The availability of clean, high quality water is essential to life. Prevention of water pollution is critical to maintain ground water that is safe for drinking. Surface waters must also be protected to maintain healthy aquatic ecosystems, provide industrial and municipal water supplies, and support recreational enjoyment. In Vermont, Lake Champlain, a critical water resource, is experiencing a serious decline in water quality, in part due to sediment and nutrients from agricultural runoff. Many drinking water wells have been found to have nitrate-nitrogen levels exceeding the Vermont public health standard (caused by nitrogen leaching through soil).148 Nitrate contamination can make drinking water unsafe for babies or young livestock and fecal bacteria in drinking water (from manure) can cause infectious diseases such as dysentery, typhoid and hepatitis.149 While Vermont dairy farms are certainly not the only source of this pollution, contributions from these sources can be significant and participation from the dairy farmer community is therefore essential to correcting this water quality problem. Though Vermont does not have a shortage of water, the availability of potable water is increasingly becoming a concern. A drought in Frederick County, MD, last summer illustrates that “while water may be abundant in many areas, it is not limitless, and even our nation’s most water-rich regions can run dry.”150 While irrigation is a significant user of water, it is important to note that livestock are as well. Even in Vermont, sources say the “Demand for ground water from the bedrock aquifer is continuously increasing as new sources of surface water decrease and the cost of surface-water treatment increases.”151 This module will focus on best management practices dairy farmers can use to minimize and prevent water pollution and, to a lesser extent, to promote appropriate water use. General areas to be covered include preventing pollution from livestock yards, storage areas and milkhouse waste, general land management strategies and management of water use.
INCENTIVES FOR CHANGE • Regulations. As water pollution becomes an ever-larger issue throughout the U.S.,
legislation supporting the Clean Water Act is becoming increasingly broad reaching and stringent. In 2002, the EPA approved a new regulation requiring that certain “concentrated animal feeding operations” implement best management practices to improve water quality in order to gain a permit to operate. In Vermont, there are many programs to address the water quality issues of Lake Champlain, and dairy farmers may find themselves subject to increasing pressure and/or regulations to take steps to improve water quality.
• Governmental cost sharing. USDA and state-level programs provide support in the
form of cost sharing, technical assistance and economic incentives to implement NPS pollution management practices. Recently, 40% percent of section 319 Clean Water Act grants were used to control agricultural NPS pollution.152 The National Environmental Quality Incentives Program (EQIP) authorizes the Secretary of
86
Agriculture to provide cost-sharing incentives up to $450,000 per farmer to implement management practices that will protect water quality.153
• Cost Savings: Conserving and reusing water can have economical benefits. While
current prices for water are reasonable, as water shortages become more common, frequent occurrences, water costs will increase. Therefore, the more water that can be collected, conserved, and reused, the more flexibility the farmer has regarding water demand.
• Improved On-farm Water Quality: Minimizing impact on surface and ground water
is beneficial to the extent that these water resources become inputs on the farm. Maintaining healthy drinking water can reduce the chance for illness, and associated costs, from contaminated water.
ASSESSMENT QUESTIONS For all questions, please choose the categories that best identify your current management practices. Use the Summary sheet on the last page of this module to evaluate overall performance. LIVESTOCK YARD MANAGEMENT
1. Livestock yard is unroofed and on course-textured (sands, sandy loam) soil less than 100 feet from on-farm water sources. Yard is rarely cleaned and runoff water is uncontrolled.
2. Livestock yard is open or partially roofed on medium- or fine-textured soils (loam, silt loam, clay loams, clay) greater than 100 feet from on-farm water sources. Yard is cleaned once a month and some effort is made to collect runoff water or divert to manure storage area.
3. Livestock yard is open or partially roofed on concrete or medium- or fine-textured soils greater than 100 feet from on-farm water sources. Yard is cleaned once per week and has protective barriers to prevent runoff. An effort is made to prevent water from entering/flooding yard and any runoff is collected or diverted to manure storage area.
4. Livestock yard is open or partially roofed on concrete greater than 100 feet from on-farm water sources. Yard is cleaned at least once per day and water is diverted so that flooding or runoff from yard never occurs.
Livestock yards (barnyards, holding areas and feedlots) are concentrated areas of livestock wastes and are therefore vital to protection of water quality. These yards, especially when on permeable soils or near on-farm water sources, can cause nitrate and bacteria contamination in ground or surface water. To minimize the possibility of contaminants leaching to groundwater or running off to surface water, such yards should be located on concrete or fine- to medium textured soils over 100 feet from water sources such as wells, surface water, adjacent property, drainage ditches, or other areas that could result in the runoff reaching water sources. The best means to achieve this is to prevent flooding in livestock yards by diverting rain and/or floodwaters from the area. Having a roof over the yard or otherwise diverting water from yard is the best way to prevent runoff. This is especially important if yards are on a slope. If it is impossible to prevent runoff completely, other practices, such as keeping the yard clean, diverting runoff to manure storage areas or collecting and re-using runoff (e.g. as nutrients on fields), can minimize potential pollution to water sources.
87
MANURE STORAGE SYSTEM
1. Storage structures allow for contact of stored material with porous/non-clay soils (because of leakage/cracks or overflow) and are subject to flooding. Storage structures are located without regard to proximity to on-farm water sources.
2. Storage structures are lined with clay or cement, though some leakage may occur due to cracks or overflow. Some effort is made to divert water from site and proximity of storage structures to bodies of water is considered in their placement.
3. Storage structures are lined with clay or cement, are of sufficient capacity to hold all materials, and cracks/leaking are minimized. Some effort is made to divert water from site and proximity of storage structures to bodies of water is considered in their placement.
4. Storage structures are lined with clay or cement, are of sufficient capacity to hold all materials, and are maintained to allow for no leakage. Water is prevented from entering/flooding storage area. Storage structures are all located downslope and at a maximum distance from bodies of water.
FERTILIZER STORAGE SYSTEM
1. Storage structures allow for contact of stored material with porous/non-clay soils (because of leakage/cracks or overflow) and are subject to flooding. Storage structures are located without regard to proximity to on-farm water sources.
2. Storage structures are lined with clay or cement, though some leakage may occur due to cracks or overflow. Some effort is made to divert water from site and proximity of storage structures to bodies of water is considered in their placement.
3. Storage structures are lined with clay or cement, are of sufficient capacity to hold all materials, and cracks/leaking are minimized. Some effort is made to divert water from site and proximity of storage structures to bodies of water is considered in their placement.
4. Storage structures are lined with clay or cement, are of sufficient capacity to hold all materials, and are maintained to allow for no leakage. Water is prevented from entering/flooding storage area. Storage structures are all located downslope and at a maximum distance from bodies of water.
SILAGE STORAGE SYSTEM
1. Storage structures allow for contact of stored material with porous/non-clay soils (because of leakage/cracks or overflow) and are subject to flooding. Storage structures are located without regard to proximity to on-farm water sources.
2. Storage structures are lined with clay or cement, though some leakage may occur due to cracks or overflow. Some effort is made to divert water from site and proximity of storage structures to bodies of water is considered in their placement.
3. Storage structures are lined with clay or cement, are of sufficient capacity to hold all materials, and cracks/leaking are minimized. Some effort is made to divert water from site and proximity of storage structures to bodies of water is considered in their placement.
4. Storage structures are lined with clay or cement, are of sufficient capacity to hold all materials, and are maintained to allow for no leakage. Water is prevented from
88
entering/flooding storage area. Storage structures are all located downslope and at a maximum distance from bodies of water.
Storage areas for manure, fertilizer and silage can be potential sources of water pollution if not managed properly. It has been found that silage leachate and cow manure have 140 and 200 times the oxygen depleting potential of untreated municipal sewage, which can lead to eutrophication in water bodies.154 Silage leachate is also highly acidic and leachate from 300 tons of high-moisture silage has been compared to the daily sewage generated by a city of 80,000 people.155 The best way to prevent such pollution is to ensure that storage systems are well-maintained (allowing for no leakage of stored material), are of adequate size (to avoid spillage due to overflows), are not subject to water infiltration or runoff, and do not allow for contact of stored material with porous or course-textured soils. Runoff prevention can be achieved by using closed or covered storage and by ensuring that diversion ditches or other techniques are used to prevent moving water from coming into contact with the stored material. If it is impossible to prevent runoff completely, other practices, such as collecting and re-using runoff as fertilizer, can minimize potential pollution to water sources. Finally, locating these storage systems an adequate distance (preferably at least 100 feet) from wells, surface water, adjacent property, drainage ditches, or other areas that could result in runoff reaching water sources, can prevent or minimize water pollution. Protection of farm inputs such as silage and fertilizer can also improve efficiency and cost-effectiveness on farms. For example, preventing water from coming into contact with silage can help to maintain the freshness and quality of the silage, thereby minimizing additional feed costs. Preventing impact to fertilizers can also ensure that these materials remain useful for their intended life. MILKHOUSE WASTE
1. All waste is poured down a drain that leads to the municipal drainage system or is sent to a leach field, usually also washing down feed and manure.
2. Most waste is diverted to the manure storage area, though some goes to the municipal drainage system or is sent to a leach field. No effort is made to remove excess feed and manure from the parlor prior to wash down.
3. All waste is diverted to the manure storage area, though the first rinse is sometimes used as fertilizer. Some effort is made to remove excess feed and manure from the parlor prior to wash down.
4. All waste is diverted to the manure storage area. Any field application of first rinse is matched to field nutrient needs. Most manure and excess feed is removed from the parlor prior to wash down.
Water used to clean the milkhouse and milkhouse equipment contains high levels of organic matter, nutrients, chemicals and microorganisms, which can contaminate water with ammonia, nitrate, phosphorus, detergents and disease-causing organisms if not disposed of properly.156 Milkhouse wastewater is made nutrient-rich by virtue of having high amounts of milk residues or being washed down the drain with manure and feed. This nutrient-rich water can lead to pollution if it is untreated before it reaches water supplies. To minimize this potential impact to water, wastewater should be diverted to manure storage areas. Nutrient-rich first rinse water can also be re-used by applying it directly to fields as fertilizer. When applying first rinse to fields, care should be taken to match field nutrient needs with nutrient content of first rinse. Cleaning the parlor of feed
89
and excess manure prior to wash down will minimize the amount of this material that enters water and can minimize the volume of water needed for cleaning. PROTECTING ON-FARM WATER SOURCES
1. There is no effort made to protect on-farm bodies of water (lakes, ponds, streams, creeks).
2. Some ‘buffer areas’ (uncultivated land with some natural vegetation) are utilized to absorb farm runoff water and protect some water sources.
3. Buffer areas are utilized along edges of all water sources and an effort is made to maximize vegetation in these areas in order to maximize absorption of runoff water. Cows are generally prevented from entering the water.
4. Buffer areas with maximum vegetation are utilized along edges of all water sources and the width of buffer strips is increased if water is at the bottom of a downslope. Cows are prevented from entering the water at any time.
Buffer areas are natural, uncultivated areas on the farm that are covered with vegetation (either planted or naturally occurring). Maintenance of these areas around water sources on the farm serves to further protect these water sources from pollution due to runoff. The protection comes from the fact that the buffer areas can potentially halt the flow of runoff water or absorb it before it reaches surface waters. Buffer areas should be as large as possible in order to maximize the benefits they provide. When they are at the bottom of a slope (i.e. protecting water at the base of a slope), it is especially important that they be as wide and densely vegetated as possible. It is important to note that buffer areas should be untreated by chemicals or nutrients and instead developed and managed in a way that they do not need additional inputs to flourish. In this way buffer areas can benefit from the addition of nutrients to their soils via the absorption of runoff waters. Buffer areas also have the additional benefit of adding to the biodiversity (variance of flora and fauna) on a farm. In addition to buffer strips, preventing cows from entering water is vital to maintaining water quality. Cows can be harmful to water quality to the extent that they urinate or excrete manure into the water or track these and other substances, such as bedding or feed, into water via their legs or hooves. Cows should not come into contact with water sources at any time. WATER USE PLAN157
1. Water use on the farm is not monitored or planned. 2. Water use on the farm is monitored and reported to users with suggestions for
decreasing use. 3. In addition to #2, water use on the farm is budgeted and includes action steps to
improve water use efficiency by minimizing runoff, water loss, and erosion and pest problems. Areas monitored include wash down and milking equipment clean up, drinking, cooling and irrigation.
4. In addition to #3, imported water use on the farm is minimized by recycling, conserving, and/or collecting water and/or using low demand systems. Water use is further minimized by planting water-conserving varieties and/or ground covers.
90
While there appears to be plenty of water available for a reasonable to cheap price, it is important to start thinking about a water use plan. As more and more water shortages are realized, water costs are expected to increase. If the market is used to dictate price, this competition, especially in Western states, is expected to have significant impacts on agriculture.158 Once a baseline is established, then proactive steps can be taken in a methodical manner. Also, while water appears to be a plentiful resource, it is important to determine if this is actually true by investigating the health of a farm’s specific watershed. WATER USE MANAGEMENT STRATEGIES (Please check all that apply) I recycle water on the farm, such as using wastewater to flush feeding areas and
free-stall barns (ensuring that resulting water flow is directed to the manure storage area). I use grass-based and/or seasonal dairying to eliminate the need to wash off
manure from high use areas. I use a housing system that keeps cows clean which eliminates the need to wash
cows before milking. I use water to cool milk by passing it through the cooler plate, while
simultaneously heating water that the cows will drink. Using certain management strategies can decrease water use. There are strategies regarding irrigation as well as reuse and recycling water from different activities. While recognizing that irrigation is not a top concern in Vermont, it is worth noting that corn is one of the top six crops in the US that requires 70% of the irrigation.159 More applicable to Vermont are the management strategies that focus on either reducing the need for water (via type of dairying or housing system) or by reusing wastewater.
LINKAGES TO OTHER MODULES Water quality issues are tied to Nutrient Management, Soil Health, Biodiversity and Animal Welfare. The table below identifies where you can find more information on some of the topics mentioned in this module.
WATER MANAGEMENT TOPIC OTHER MODULE(S) Buffer Areas Soil Health & Biodiversity Field Nutrient Applications Nutrient Management
FURTHER INFORMATION Additional details and information on the above can be obtained through the following programs. • Livestock and Poultry Environmental Stewardship (LPES) Curriculum provides
environmental best management practice recommendations for dairy farms (http://www.lpes.org/les_plans.html). They also provide information on the new Concentrated Animal Feeding Operations (CAFO) regulations and links to funding and additional technical resources (http://www.lpes.org/CAFO.html). Call 1-800-562-3618 for more information.
• The USDA Natural Resource Conservation Service (NRCS) offers nutrient
management information and tools at
91
http://www.nrcs.usda.gov/technical/ECS/nutrient/. The program also provides funding and technical assistance for conservation efforts through Farm Bill 2002 (http://www.nrcs.usda.gov/programs/farmbill/2002/) and its affiliate programs, such as EQIP (http://www.nrcs.usda.gov/programs/eqip/). The Vermont NRCS also manages Farm*A*Syst, a program devoted to national and state-level improvements to ground water that provides comprehensive evaluation and best management sheets specifically for dairy farmers in Vermont. More information can be found at http://www.vt.nrcs.usda.gov/technical/FarmASyst/. Vermont NRCS has twelve regional field offices that can provide more assistance and information on the above. Contact the District Conservationist at the office nearest you at:
o Bennington: (802) 442-2275 o Berlin: (802) 828-4493 o Brattleboro: (802) 254-9766 o Middlebury: (802) 388-6748 o Morrisville: (802) 888-4935 o Newport: (802) 334-6090 o Rutland: (802) 775-8034 o St. Albans: (802) 527-1296 o St. Johnsbury: (802) 748-2641 o White River Junction: (802) 295-7942 o Williston: (802) 879-4785 o Vermont NRCS State Office: Dave Hoyt, Assistant State Conservationist,
802-951-6796, extension 227 • The Vermont Department of Environmental Conservation Water Quality
Division provides a newsletter pertaining to water quality as well as information on best management practices, grants and educational opportunities. See http://www.vtwaterquality.org/ for more information or contact the Water Quality Division at 802-241-3770 or 802-241-3777.
• The Vermont Agency of Agriculture, Food and Markets provides a clearinghouse
of information on controlling non-point source pollution from dairy farms, including accepted agricultural practices (AAPs), best management practices (BMPs) and technical and financial assistance for projects. See http://www.vermontagriculture.com/pidnonpointsource.htm for more information. You can also call the Vermont Natural Resources Conservation Districts
o Windham, Bennington, Rutland, Windsor, Counties: 802-257-5621 o Orleans, Essex, Caledonia, Orange, Washington Counties: 802-229-2720 o Addison, Chittenden, Lamoille, Franklin, & Grand Isle Counties: 802-388-
6746
92
SUMMARY OF RESULTS FOR WATER MANAGEMENT Instructions: In the table below, please record the score for the answer you selected for each question. For multiple-choice questions, the response number serves as your score for that category (i.e. choice # 2 is worth 2 points). For “check all that apply questions,” please see scoring criteria for each question in the chart below. Once all responses have been completed, add up the answers and record the total.
QUESTION ANSWER/SCORE
1. Livestock Yard Management
2. Manure Storage System 3. Fertilizer Storage System (If no fertilizer is stored on property,
give yourself 4 points)
4. Silage Storage System
5. Milkhouse Waste
6. Protecting On-Farm Water Sources
7. Water Use Plan 8. Water Use Management Strategies (1 point for each box
checked)
Total Score
Total Possible Points 32
Interpretation: The next step in understanding your farm’s performance in the category of Water Management is to compare your results to best practices. Below is a table that ranks your performance from best practice (green) to practices that require improvement (red). Compare the number of points you received for your practices compared to optimal practices. Point Range Interpretation
Green 27 - 32 Best practices regarding Water Management are currently being employed on this farm.
Yellow 20 - 26 Farm is using some good practices regarding Water Management, however there are some key areas that should be improved upon.
Red 7 - 20 Water Management should be carefully evaluated and a strong effort should be made to adopt improved practices in several areas.
93
148 Vermont NRCS Farm*A*Syst. “Worksheet #3: Assessing the Risk of Groundwater Contamination from Fertilizer Storage and Handling.” May 1998. Vermont Natural Resources Conservation Service (NRCS). 2003. 23 Nov. 2003. <ftp://ftp-fc.sc.egov.usda.gov/VT/Technical/FarmASyst/Worksheet3-Fertilizer_Storage&Handling.pdf>. 149 Vermont NRCS Farm*A*Syst. “Worksheet #8: Assessing the Risk of Groundwater Contamination from Barn Yard Management.” May 1998. Vermont Natural Resources Conservation Service (NRCS). 2003. 23 Nov. 2003. < ftp://ftp-fc.sc.egov.usda.gov/VT/Technical/FarmASyst/Worksheet8_Barnyard_Management.pdf>. 150 U.S. Water Scarcity Problems Highlighted At Congressional Hearing. 8 May 2003. 19 Nov. 2003. <http://www.house.gov/transportation/press/press2003/release97.html>. 151 USGS Homepage. “Water Resources of New Hampshire and Vermont, New Hampshire Bedrock Aquifer Assessment.” 31 May 2000. 10 Oct. 2003. <http://nh.water.usgs.gov/CurrentProjects/bedrock.htm>. 152 US EPA Website. 3 Dec 2003. Non-Point Source Pointers (Factsheets) “Pointer #6 EPA841-F-96-004F: Managing Nonpoint Source Pollution from Agriculture” 23 Nov. 2003. <http://www.epa.gov/OWOW/NPS/facts/point6.htm>. 153 NRCS National Environmental Policy Act (NEPA) Documents. “Environmental Quality Incentives Program (EQIP): Risk Assessment for the EQIP Program.” December 10, 2002. USDA Natural Resources Conservation Service. 23 Nov. 2003. <http://www.nrcs.usda.gov/programs/Env_Assess/EQIP/EQIP_RA_121002.pdf >. 154 Region 5 Water, Water Quality Impacts Website. US EPA. 4 Sept. 2003. 19 Nov. 2003. <http://www.epa.gov/r5water/npdestek/npdcafowaterqualityimpacts.htm>. 155 Vermont NRCS Farm*A*Syst. “Worksheet #9: Assessing the Risk of Groundwater Contamination from Silage Storage.” Sept. 1997. Vermont Natural Resources Conservation Service (NRCS). 2003. 23 Nov. 2003. < ftp://ftp-fc.sc.egov.usda.gov/VT/Technical/FarmASyst/Worksheet9-Silage_%20Storage.pdf>. 156 Vermont NRCS Farm*A*Syst. “Worksheet #10: Assessing the Risk of Groundwater Contamination from Milkhouse Wastewater Treatment.” Dec. 1997. Vermont Natural Resources Conservation Service (NRCS). 2003. 23 Nov. 2003. < ftp://ftp-fc.sc.egov.usda.gov/VT/Technical/FarmASyst/Worksheet10-Milkhouse_Wastewater_Treatment.pdf>. 157 Question adapted from The Food Alliance. Dairy Inspection Tool for the Pacific Northwest. 2002. 158 USDA Agricultural Research Service Website. National Programs Water Quality & Management “Program Summary: Program Direction.” 6 June 2003. <http://www.ars.usda.gov/research/programs/programs.htm?NP_CODE=201>. 159 Ibid.