67
SUSTAINABLE AMERICA Food/Fuel Public Poll Key Findings March 2013

SUSTAINABLE AMERICA
Food/Fuel Public Poll
Key Findings March 2013

Methodology Timing: Quantitative Online Survey: February 22 – March 6, 2013
Objectives: Measure public understanding and attitudes of the nature of the food and fuel supply
in the United States, as well as the intersection of the two.
Audiences: Registered voters in the United States spread across the country and distributed according to U.S. census data by age, gender, and income.
Geographies and Methodology:
BAV Consulting conducted a national quantitative online survey with
1,001 respondents across the United States.
All of the results, except where indicated, are shown in percentages.
*Margin of error is shown at the 95% confidence level
**In this report, ‘All’ refers to an census-weighted average of demographic groups.
United States
Registered Voters n-size MoE*
National (All) 1,001 +/- 3.10% 18-24 year-olds 129 +/- 8.63%
25-29 100 +/- 9.80% 30-34 110 +/- 9.34% 35-44 200 +/- 6.93% 45-54 200 +/- 6.93% 55-64 170 +/- 7.52% 65+ 92 +/- 10.22%

Key Findings
1. 56% think growing food to expand the fuel supply is a good thing, just 19% oppose 2. Half of American voters support using corn-based ethanol in the nation’s
transportation fuel supply, 18% oppose 3. 84% of voters think energy independence should be a national goal 4. 6 in 10 support an “all of the above” national energy strategy including fossil fuels
and renewables 5. 7 in 10 say good fuel economy is ‘very important’ when thinking about their next
vehicle 6. Battery issues and high cost dominate concerns about electric cars 7. Knowledge about where to buy alternative fuels for vehicles remains low 8. 6 in 10 Americans know someone personally who has struggled recently to afford
food 9. Two-thirds of Americans are concerned about food shortages following natural
disasters 10. 45% of Americans oppose the use of GMOs in food production, 36% support 11. Printed food expiration dates responsible for nearly half of discarded food in
American homes 12. 60% say reducing food waste at restaurants and grocery stores is the best way to
increase food availability in the U.S.

FOOD FUEL
LINKAGE
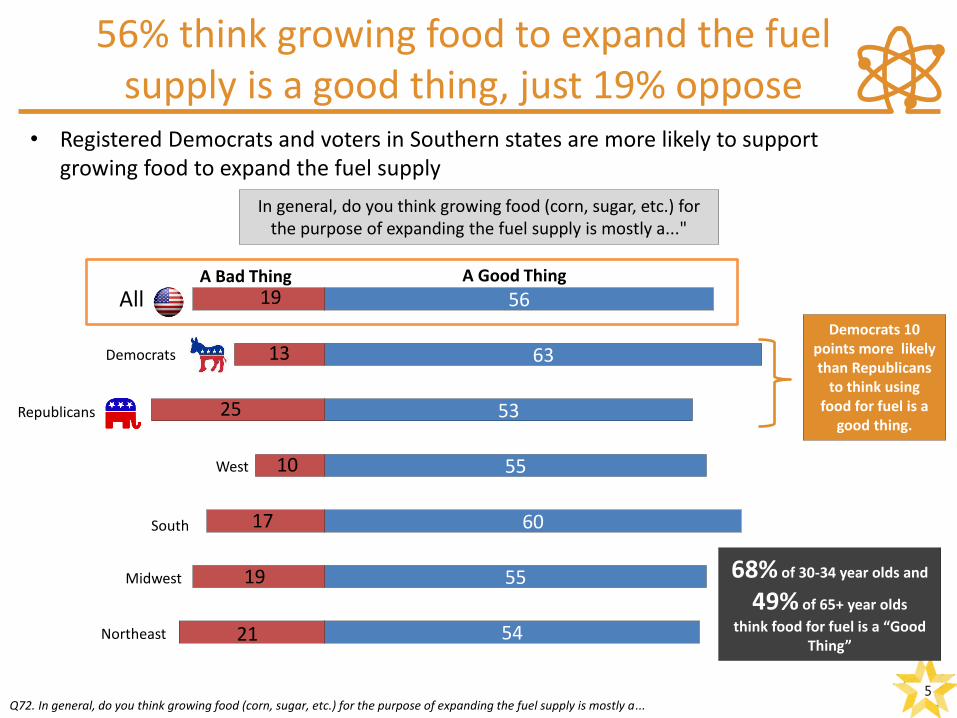
56% think growing food to expand the fuel supply is a good thing, just 19% oppose
5
In general, do you think growing food (corn, sugar, etc.) for the purpose of expanding the fuel supply is mostly a..."
Q72. In general, do you think growing food (corn, sugar, etc.) for the purpose of expanding the fuel supply is mostly a...
54
55
60
55
53
63
56 All
Democrats
Republicans
West
South
Midwest
Northeast
A Bad Thing A Good Thing 19
13
25
10
17
19
21
• Registered Democrats and voters in Southern states are more likely to support growing food to expand the fuel supply
Democrats 10 points more likely than Republicans
to think using food for fuel is a
good thing.
68% of 30-34 year olds and
49% of 65+ year olds
think food for fuel is a “Good Thing”

Strongly support
17%
Somewhat support
32% Neither support nor
oppose 24%
Somewhat oppose
9%
Strongly oppose
9%
Don’t know 9%
Half support using corn-based ethanol in the nation’s transportation fuel supply, 18% oppose
6
Do you favor or oppose the use of corn-based ethanol in our nation’s transportation fuel supply?
Among all respondents
• Support for ethanol varies more by ideological divides than demographic or geographic groups, which are largely consistent; strong opposition to ethanol is weak
Q73. Do you favor or oppose the use of corn-based ethanol in our nation’s transportation fuel supply?
6%
8%
13%
13%
9%
11%
11%
11%
36%
32%
29%
30%
20%
19%
16%
18%
Democrats
Liberals
Republicans
Conservatives
Strongly oppose Somewhat oppose
Somewhat support Strongly support
Democrats most supportive of ethanol use

FUEL PRODUCTION
AND CONSUMPTION

84% of voters think energy independence should be a national goal
8
“Which of the following statements come closer to your opinion about American energy independence?”
Q53 - Which of the following statements come closer to your opinion about American energy independence?
84%
76% 80% 82% 80%
90% 87%
94%
85% 85%
16%
24% 20% 18% 20%
10% 13%
6%
15% 15%
ALL 18-24 25-29 30-34 35-44 45-54 55-64 65+ DEM GOP
Energy Independence Global market
• Support for energy independence is bipartisan and is stronger among older voters
No difference of opinion between the two major
political parties
9 in 10 voters 45 and older support national energy
independence

6 in 10 support an “all of the above” national energy strategy including fossil fuels and renewables
9
“Which of the following statements come closer to your opinion about research and
development into alternative fuels?”
• Renewables-only drops with age, as “all of the above” rises. Liberal voters are far more likely to support prioritizing renewables than any other group.
Q54 - Which of the following statements come closer to your opinion about research and development into alternative fuels?
29% 29%
37% 35%
33%
25% 26%
17%
48%
19%
13%
20%
14% 10%
18%
10% 10% 12%
6%
20%
58%
51% 49%
55%
50%
65% 64%
71%
46%
61%
ALL 18-24 25-29 30-34 35-44 45-54 55-64 65+ Liberal Conservative
Research and development into alternative and renewable fuels is crucial for the future of our country and should be our nationalpriority.Oil and natural gas development should be our national priority; research and development to develop alternative and renewable fuels ismostly a distraction.We need an "all of the above" strategy that includes both alternative and renewable fuels and a continued search for existing domesticoil and natural gas.
“All
of
the
abo
ve”
stra
tegy
Re
new
able
s O
il/ga
s
Voters 45 and older most likely to support and “all of
the above” approach Self-described “Liberals” opt for renewables as
national priority

7 in 10 say good fuel economy is ‘very important’ when thinking about their next vehicle
10
“When you think about the next vehicle you plan to buy/lease, how important is it to you that the vehicle gets good fuel economy (high number of miles traveled per gallon of gasoline or equivalent)?”
• Fuel economy is seen as universally important, with the youngest and oldest respondents most likely to see it is “very important” to their purchasing decision
Q46 - When you think about the next vehicle you plan to buy/lease, how important is it to you that the vehicle gets good fuel economy (high number of miles traveled per gallon of gasoline or equivalent)?
3%
3%
25%
28%
32%
33%
31%
31%
23%
29%
73%
69%
67%
65%
68%
61%
76%
68%
65+
55-64
45-54
35-44
30-34
25-29
18-24
All
Not at all important Not very important Somewhat important Very important
76% of Women
and
62% of Men say
good fuel economy is “very important”

Battery issues and high cost dominate concerns about electric cars
11 0% 10% 20% 30% 40% 50% 60% 70% 80%
Dangerous
Odd looking
Won’t be able to resell it
Unproven technology
Limited number of models available (no minivans, trucks, etc.)
Batteries will wear out over time and have to be replaced
Batteries will run out while out driving
Too expensive
All
18-24
25-29
30-34
35-44
45-54
55-64
65+
“What, if anything, concerns you about electric cars?”
Q52 - What, if anything, concerns you about electric cars?
• 70% of rural respondents expressed concern about batteries running out while driving, compared to 63% in the suburbs and 59% in the city

65% 40% 42% 36% 63% 31% 38%
0%
10%
20%
30%
40%
50%
60%
70%
Ethanol (E85) Liquid PetroleumGas (LPG)
Biodiesel (BD orB20)
Liquid Natural Gas(LNG)
Electricity (FastCharge)
CompressedNatural Gas (CNG)
Hydrogen (H2 orHY)
All 18-24 25-29 30-34 35-44 45-54 55-64 65+
Knowledge about where to buy alternative fuels for vehicles remains low
12
“You indicated that you are somewhat or very familiar with these alternative fuels. If you wanted to use each of these fuels, would you know where to go to purchase it?” (Showing % “Yes”)
• Among respondents already familiar with alternative fuels, fewer than half in most cases know where they would go to buy each one.
G57 - You indicated that you are somewhat or very familiar with these alternative fuels. If you wanted to use each of these fuels, would you know where to go to purchase it?
No more than 3 in 10 of any
group knew where to buy Hydrogen
Total Awareness (% Very or Somewhat Familiar)

FOOD PRODUCTION,
CONSUMPTION, AND WASTE
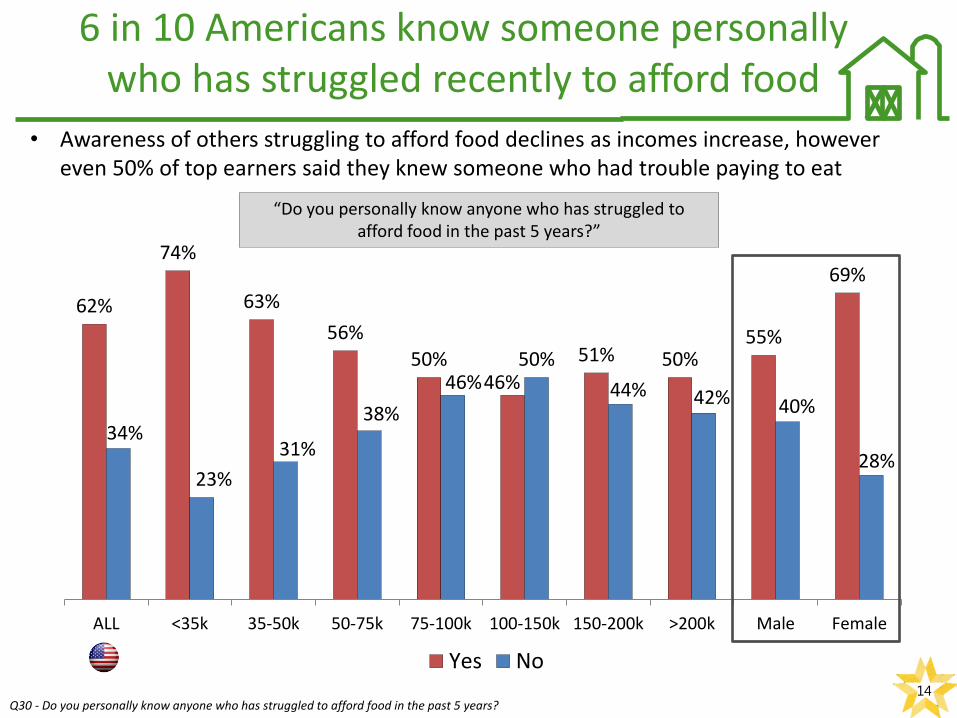
6 in 10 Americans know someone personally who has struggled recently to afford food
14
“Do you personally know anyone who has struggled to afford food in the past 5 years?”
Q30 - Do you personally know anyone who has struggled to afford food in the past 5 years?
62%
74%
63%
56%
50% 46%
51% 50% 55%
69%
34%
23%
31%
38%
46% 50%
44% 42% 40%
28%
ALL <35k 35-50k 50-75k 75-100k 100-150k 150-200k >200k Male Female
Yes No
• Awareness of others struggling to afford food declines as incomes increase, however even 50% of top earners said they knew someone who had trouble paying to eat

Two-thirds of Americans are concerned about food shortages following natural disasters
15
“How worried are you, if at all, about the possibility of food shortages following natural disasters?”
• Fear about food shortages is closely aligned with income; 70% of respondents making less than $35k/year are at least somewhat worried
Q65 - How worried are you, if at all, about the possibility of food shortages following natural disasters?
22%
18%
17%
18%
13%
12%
15%
18%
48%
47%
51%
51%
46%
39%
38%
48%
21%
24%
22%
25%
34%
44%
35%
25%
6%
8%
8%
4%
7%
5%
4%
6%
<35k
35-50k
50-75k
75-100k
100-150k
150-200k
200k+
All
Very worried Somewhat worried Not very worried Not at all worried
Only 31% nationwide unworried about shortages

45% of Americans oppose the use of GMOs in food production, 36% support
16
Strongly support
8%
Somewhat support
28%
Somewhat oppose
23%
Strongly oppose
22%
Don’t know 19%
“Do you support the use of ‘Genetically Modified Organisms’ (GMO’s) in food production?”
Among all respondents
• Those who “strongly oppose” GMOs outweigh those who “strongly support” their use by nearly 3:1
Q32 - Do you support the use of "Genetically Modified Organisms" (GMO’s) in food production?
16%
27%
19%
27%
35%
20%
12%
5%
Men
Women
Strongly oppose Somewhat oppose Somewhat support Strongly support
GMO support much stronger among men; 54% of women oppose their use, compared to 35% of men
25% Support 54% Oppose
35% Oppose 47% Support
16% of Americans say they are very familiar with GMOs
29% say they are not at all familiar with them.

Printed expiration dates responsible for nearly half of discarded food in American homes
17
“At what point do you decide you are going to throw away uneaten food?”
• 30-34 year olds are most likely to adhere to printed food expiration dates; respondents age 65 and older least likely to follow dates printed on food items
Q39 - At what point do you decide you are going to throw away uneaten food?
4%
5%
4%
4%
6%
5%
4%
6%
5%
5%
8%
11%
11%
6%
17%
17%
14%
11%
14%
10%
11%
13%
22%
13%
22%
18%
22%
23%
18%
20%
48%
53%
46%
52%
58%
59%
69%
55%
18-24
25-29
30-34
35-44
45-54
55-64
65+
All
A few days before the date printed on the product When the product reaches the "Sell by" date
When the product reaches the "Best by" date When the product reaches the "Use by" date
A few days after the date printed on the product When the item just doesn’t "smell/look/taste right" any more
“Doesn’t smell/look/taste right” “Few days after
printed date” “Use-by” “Best-by” “Sell-by”
Food throw out unnecessarily early
27% of Americans say they are
more concerned about food waste now compared to last year

60% say reducing food waste at restaurants and grocery stores is the best way to increase food availability in the U.S.
18
“What do you see as the best way to increase the availability of food in the U.S? Please select all that apply.”
• Waste reduction trumps increasing efficiency as the best way to increase food availability in the U.S; just 2 in 10 see diverting food for fuel as a threat to food output
Q63 - What do you see as the best way to increase the availability of food in the U.S? Please select all that apply.
0% 10% 20% 30% 40% 50% 60% 70%
Increase productivity at large-scale, commercial farms
Reduce the amount of food that is diverted for fuel
Promote organic farming
Promote alternative farming methods
Increase the availability of urban farms
Stronger efforts to reduce food waste at the farm
Promote smaller, local farms
Stronger efforts to reduce food waste in restaurants and grocery stores
All
18-24
25-29
30-34
35-44
45-54
55-64
65+
Food diverted for fuel not perceived as a drain
on food supply

ADDITIONAL FINDINGS

2%
2%
2%
3%
3%
4%
4%
8%
8%
19%
46%
Terrorism and national security
Immigration
Food prices
Taxes
Other
Fuel costs
Education
Health care
Moral values / family values
Deficit and government spending
Economy and jobs
Food and Fuel Issues Seen as Important, but Not Most Important to Americans
20
What do you think is the most important issue facing this country today?
Food and Fuel costs seen as important to most, but are seen as “most important”
by relatively few
Q9. What do you think is the most important issue facing this country today? Q10-19. Now please tell us how important you think each of the following issues are to our country, in your opinion. Please use the scale below where 1 means “Not at all important” and 7 means “Extremely Important.”
49%
58%
58%
64%
68%
69%
73%
75%
82%
91%
Immigration
Moral values / family values
Terrorism and national security
Food prices
Fuel costs
Taxes
Education
Health care
Deficit and government spending
Economy and jobs
Now please tell us how important you think each of the following issues are to our country, in your opinion. Please use the scale below where 1 means “Not at all important” and 7 means “Extremely Important.” (Showing % answering 6 or 7)

Resource Prices and Availability
21
In general, do you feel like the price of each of the following is going up, going down, or
staying the same?
Q20-25 Metric A. In general, do you feel like the price of each of the following is going up, going down, or staying the same? Q20-25 Metric B. In general, do you feel like the availability of each of the following is getting better, getting worse, or staying the same?
In general, do you feel like the availability of each of the following is getting better, getting
worse, or staying the same?
46%
52%
55%
67%
70%
86%
90%
28%
39%
24%
15%
26%
12%
8%
5%
2%
8%
1%
2%
1%
1%
Alternative fuels
Water
Natural gas
Heating oil (for homeheating purposes)
Electricity
Food
Transportation fuel(gasoline, diesel)
Going down Staying the same Going up
6%
9%
9%
5%
19%
6%
28%
36%
26%
16%
21%
18%
23%
16%
Availability
Getting Better
Getting Worse
Alternative fuels are seen by fewer as rising in price

Corn for Fuel, Fuel for Food
22
What percent of all of the corn produced each year in the United States do you think goes to
produce fuel for transportation, etc.?
Q66. What percent of all of the corn produced each year in the United States do you think goes to produce fuel for transportation, etc.? Q67. What percent of all of the energy resources used each year in the United States do you think is used to produce food?
What percent of all of the energy resources used each year in the United States do you think
is used to produce food?
22
38%
44%
39% 39% 39% 37%
35% 35% 35%
41% 39%
43% 43% 42% 41%
38% 36%
34% 35%
43%
All 18-24 25-29 30-34 35-44 45-54 55-64 65+ Male Female
% of corn used for fuel % of energy resources used for food

45% 48%
50%
39%
48% 47%
43%
38%
54%
40%
43%
55% 52%
50%
61%
52% 53%
57%
62%
46%
60% 57%
All 18-24 25-29 30-34 35-44 45-54 55-64 65+ City Suburb Rural
I worry more about food prices getting too high than I do about gasoline prices.
I worry more about gasoline prices getting too high than I do about food prices.
Food, Fuel Price Worries
23
Which of the following two scenarios come closer to your opinion?
Q74. Which of the following two scenarios come closer to your opinion? 23
Wo
rry
mo
re a
bo
ut
foo
d p
rice
s
Wo
rry
mo
re a
bo
ut
fuel
pri
ces
Suburban and rural voters are far more concerned about fuel prices than food prices

Attitudes and Behaviors
24
How well do each of these statements describe you? Please use the scale below where 1 means “Does not describe me at all” and 7
means “Describes me exactly.” (Showing % 6 and 7)
Q75-89 Metric A. How well do each of these statements describe you? Please use the scale below where 1 means “Does not describe me at all” and 7 means “Describes me exactly.”
16%
19%
22%
23%
24%
28%
31%
34%
35%
41%
45%
58%
61%
64%
67%
I only buy locally-grown produce
I often use alternative forms of transportation instead of driving a car
I buy organic foods whenever possible
I pay close attention to developments in the use of alternative fuels
I only buy produce while it is "in season"
I always look to see where the food I buy was grown or produced
I am confident that the foods I normally eat will always be available when I want to buy them
I often worry about the environmental consequences of producing the gasoline we use to driveour cars
I always turn off my vehicle’s engine if I know I will be idling for more than 30 seconds
I am concerned about climate change
It is a priority in my daily life to use as little energy resources (gasoline, electricity, etc.) as I can
I worry that our country is too dependent on oil as a source of energy
I worry about rising food prices
I pay close attention to gasoline prices
I believe our country needs to do more to promote energy independence
Fuel Topics
Food Topics

Organizational Favorability
25
How favorable are you toward this company or organization?
Q90-104 Metric A. How familiar are you with this company or organization? Q90-104 Metric B. How favorable are you toward this company or organization?
39% 46% 49%
68% 77% 80% 81% 84% 84% 84% 87% 89% 90% 91% 91%
Favorab
le U
nfa
vora
ble
83% 84% 38% 21% 7% 11% 9% 17% 17% 30% 9% 28% 15% 12% 31%
Awareness (% Very or Somewhat Familiar)

0%
10%
20%
30%
40%
50%
60%
70%
80%
90%
100%
Hybridgasoline/electric
engine
Flex-fuel vehicle (ableto run on different
forms of fuel used inthe same tank)
Plug-in electric engine Natural gas engine Bio-diesel engine Hydrogen
All 18-24 25-29 30-34 35-44 45-54 55-64 65+
Interest in Alternative Fuel Vehicles
26
“When you think about the next vehicle you plan to buy/lease, are you considering a vehicle with any of the following features? Please select all that apply.” (Asked of
all respondents except those planning to buy a traditional gas/diesel vehicle)
Q47 - Which of the following statements describes your next vehicle? Q48 - When you think about the next vehicle you plan to buy/lease, are you considering a vehicle with any of the following features? Please select all that apply.
• Gas/electric hybrids remain most popular among non-gas/diesel-only vehicles
I am planning to buy a
traditional gasoline or
diesel vehicle
52%
I am planning to buy an
alternative fuel vehicle
15%
I don’t know yet
33%
“Which of the following statements describes your next vehicle?”
0% 10% 20% 30% 40% 50% 60% 70%
Unusual nature
Fast speed
Access to carpool lanes in some areas
Unique and interesting look
I think they’re cool
They are quiet
Convenience of ‘filling up’ at home for less than the price of gasoline
High fuel economy (MPG-equivalent)
No pollution
Avoids using gasoline
Better for the environment
65+ 55-64 45-54
35-44 30-34 25-29
18-24 ALL
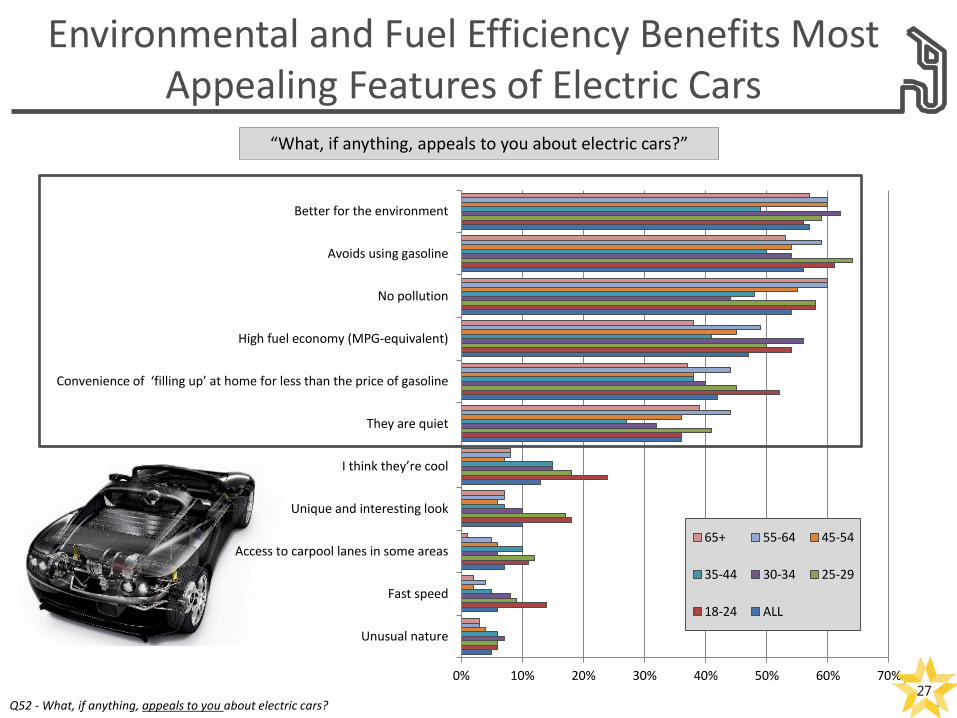
Environmental and Fuel Efficiency Benefits Most Appealing Features of Electric Cars
27
“What, if anything, appeals to you about electric cars?”
Q52 - What, if anything, appeals to you about electric cars?

Food Waste: National vs. Personal
28
“What percent of all of the [food produced every year in the United States]/[food you bring home from the grocery store] do you think goes to waste (uneaten, spoils, etc.)?”
Q36 - What percent of all of the food produced every year in the United States do you think goes to waste (uneaten, spoils, etc.)? Q38. What percent of the food you bring home from the grocery store do you think goes to waste (uneaten, spoils, etc.)?
• Most Americans believe they waste significantly less food, on average, than the country does as a whole.
41
45 48
44 43
39 38
33
18
22
25
20 19
17
13 10
ALL 18-24 25-29 30-34 35-44 45-54 55-64 65+
US Personal

Most wish grocery stores offered smaller quantities of certain foods
29
“What, if anything, could grocery stores do to help you waste less food? Please select all that apply. “
Q41 - What, if anything, could grocery stores do to help you waste less food? Please select all that apply.
0% 10% 20% 30% 40% 50% 60% 70% 80%
Give me advice on how to properly store my food
Make expiration dates less confusing
Offer "Bulk Food" bins where I can scoop our exactly the amount I needof a certain kind of food or ingredient (For instance spices, flour, sugar,
oats, nuts, etc.)
Replace incentives to buy larger quantities like "buy one, get one free"offers by offering sales on individual products
Offer incentives to encourage buying things later when they are needed(i.e. "Buy one now, get one later.")
Offer certain foods in smaller quantities
65+
55-64
45-54
35-44
30-34
25-29
18-24
ALL

APPENDIX

Appendix: Most Important Issue
31
Q9. What do you think is the most important issue facing this country today? ALL 18-24 25-29 30-34 35-44 45-54 55-64 65+ City Suburb Rural
Economy and jobs 46% 42% 40% 47% 45% 50% 48% 45% 49% 46% 42%
Deficit and government spending 19% 14% 19% 21% 17% 19% 17% 30% 17% 19% 22%
Taxes 3% 5% 4% 3% 3% 2% 2% 0% 3% 3% 2%
Health care 8% 5% 10% 8% 7% 8% 11% 5% 8% 9% 7%
Fuel costs 4% 4% 4% 4% 4% 3% 4% 3% 3% 3% 6%
Education 4% 9% 6% 7% 5% 2% 1% 1% 6% 4% 3%
Terrorism and national security 2% 1% 3% 3% 3% 2% 3% 4% 3% 2% 2%
Immigration 2% 3% 1% 1% 1% 3% 2% 1% 2% 2% 2%
Moral values / family values 8% 10% 7% 3% 10% 7% 7% 6% 7% 7% 9%
Food prices 2% 4% 2% 1% 2% 3% 0% 0% 1% 2% 2%
Other 3% 2% 5% 3% 3% 2% 4% 5% 3% 3% 3%

Appendix: Issue Importance
32
Q10-19. Now please tell us how important you think each of the following issues are to our country, in your opinion. Please use the scale below where 1 means "Not at all important" and 7 means "Extremely Important.” (Showing top 2 box) ALL 18-24 25-29 30-34 35-44 45-54 55-64 65+ City Suburb Rural
Economy and jobs 91% 88% 85% 90% 86% 95% 93% 95% 88% 92% 93%
Deficit and government spending 82% 81% 74% 82% 81% 81% 83% 85% 77% 82% 86%
Taxes 69% 69% 65% 66% 67% 72% 71% 70% 68% 69% 70%
Health care 75% 65% 73% 73% 72% 78% 88% 76% 77% 76% 74%
Fuel costs 68% 59% 57% 64% 71% 67% 78% 78% 62% 69% 76%
Education 73% 77% 72% 73% 69% 71% 79% 66% 76% 69% 74%
Terrorism and national security 58% 52% 46% 51% 59% 62% 65% 70% 57% 57% 63%
Immigration 49% 40% 46% 36% 48% 56% 52% 63% 50% 47% 52%
Moral values / family values 58% 55% 56% 49% 58% 61% 62% 65% 60% 55% 64%
Food prices 64% 57% 54% 59% 65% 68% 70% 74% 66% 59% 71%

Appendix: Resource Prices
33
Q20-25. In general, do you feel like the price of each of the following is going up, going down, or staying the same? (Showing “Going Up”) ALL 18-24 25-29 30-34 35-44 45-54 55-64 65+ City Suburb Rural
Food 86% 79% 72% 79% 86% 94% 94% 91% 84% 85% 92% Transportation fuel (gasoline,
diesel)' 90% 81% 84% 85% 90% 93% 95% 98% 84% 91% 96%
Electricity 70% 58% 51% 65% 72% 79% 75% 74% 68% 67% 75%
Natural gas 55% 54% 43% 49% 56% 63% 56% 56% 55% 49% 67% Heating oil (for home heating
purposes) 67% 50% 52% 60% 71% 74% 78% 73% 63% 65% 77%
Water 52% 41% 42% 39% 57% 58% 61% 50% 52% 51% 53%
Q20-25. “Going Down” ALL 18-24 25-29 30-34 35-44 45-54 55-64 65+ City Suburb Rural
Food 1% 3% 1% 1% 3% 0% 1% 0% 2% 1% 0% Transportation fuel (gasoline,
diesel)' 1% 4% 0% 2% 1% 0% 1% 0% 2% 1% 0%
Electricity 2% 0% 7% 1% 2% 1% 2% 0% 2% 2% 1%
Natural gas 8% 8% 5% 6% 8% 6% 9% 11% 9% 8% 5% Heating oil (for home heating
purposes) 1% 2% 1% 1% 2% 1% 1% 1% 2% 2% 0%
Water 2% 3% 2% 1% 3% 1% 2% 1% 2% 3% 0%

Appendix: Resource Availability
34
Q20-25.In general, do you feel like the availability of each of the following is getting better, getting worse, or staying the same? (Showing “Getting Better”) ALL 18-24 25-29 30-34 35-44 45-54 55-64 65+ City Suburb Rural
Food 9% 12% 18% 11% 9% 5% 5% 5% 12% 7% 7% Transportation fuel (gasoline,
diesel)' 6% 6% 5% 6% 6% 4% 6% 8% 7% 5% 5%
Electricity 9% 11% 14% 8% 7% 5% 10% 9% 10% 8% 8%
Natural gas 19% 14% 20% 16% 16% 14% 22% 35% 18% 17% 21% Heating oil (for home heating
purposes) 5% 8% 9% 7% 7% 1% 3% 4% 8% 3% 5%
Water 28% 34% 32% 27% 25% 29% 29% 21% 27% 30% 25%
Q20-25. “Getting Worse” ALL 18-24 25-29 30-34 35-44 45-54 55-64 65+ City Suburb Rural
Food 26% 28% 22% 19% 24% 33% 27% 19% 25% 24% 29% Transportation fuel (gasoline,
diesel)' 36% 44% 34% 30% 36% 37% 36% 34% 37% 35% 37%
Electricity 16% 14% 11% 13% 17% 24% 11% 12% 18% 14% 15%
Natural gas 18% 29% 12% 15% 20% 22% 10% 13% 19% 17% 19% Heating oil (for home heating
purposes) 21% 25% 15% 12% 23% 27% 21% 19% 22% 21% 22%
Water 16% 22% 12% 16% 16% 17% 12% 18% 17% 15% 17%

Appendix: Food Store Choice
35
Q26. Where do you normally buy your food? Please select all that apply. ALL 18-24 25-29 30-34 35-44 45-54 55-64 65+ City Suburb Rural Traditional grocery store
(Safeway, Walmart
Supercenter, Albertson’s,
Food Lion, Ralph’s, Kroger,
etc.) 93% 88% 93% 93% 91% 94% 96% 93% 91% 93% 96%
Natural/health/organic foods
grocery store (Whole Foods,
Trader Joe’s, etc.) 21% 25% 25% 28% 21% 21% 13% 16% 26% 22% 13%
Wholesalers (Costco, Sam’s
Club, etc.) 35% 45% 34% 41% 31% 33% 31% 33% 33% 38% 31%
Deep discount stores (Aldi,
Dollar Tree, ShopRite, etc.) 26% 32% 20% 28% 27% 27% 26% 18% 28% 26% 25%
Convenience stores (7-11,
Wawa, etc.) 10% 18% 13% 15% 10% 9% 5% 3% 14% 9% 8%
Food delivery services 3% 6% 3% 5% 4% 3% 1% 0% 5% 3% 2%
Farmers’ markets 25% 20% 26% 30% 24% 25% 27% 28% 23% 25% 29%
I grow my own food 13% 12% 10% 16% 13% 13% 12% 13% 8% 10% 23%
Urban farms 2% 1% 1% 1% 4% 1% 2% 1% 2% 1% 3%
Community Supported
Agriculture 3% 3% 6% 3% 4% 2% 2% 2% 5% 1% 4%
Other 3% 1% 2% 2% 3% 2% 5% 6% 3% 3% 2%
None of these 0% 1% 0% 1% 0% 0% 0% 0% 0% 0% 0%

Appendix: Food Transportation and Cost
36
Q27. What means of transportation do you use most to buy your food? ALL 18-24 25-29 30-34 35-44 45-54 55-64 65+ City Suburb Rural Drive my own car or ride in
someone else’s car 88% 78% 81% 90% 87% 89% 94% 93% 79% 90% 95%
Ride a bicycle 1% 1% 3% 1% 1% 1% 1% 1% 2% 1% 0%
Walk 5% 6% 11% 3% 6% 4% 2% 3% 9% 4% 2%
Take public transportation
(bus or subway) 3% 6% 5% 3% 1% 4% 1% 1% 5% 2% 2%
Have food delivered by a
service 1% 2% 0% 3% 0% 0% 0% 0% 1% 1% 0%
Someone else buys my food
for me 1% 7% 0% 0% 2% 0% 0% 0% 2% 2% 0%
Other 1% 1% 0% 0% 2% 2% 2% 1% 3% 1% 1%
Q28. In miles, approximately how far do you normally travel (one way) to buy your food? ALL 18-24 25-29 30-34 35-44 45-54 55-64 65+ City Suburb Rural
Average number of miles 8 10 6 11 13 6 5 6 10 5 12
Q29. Approximately how much does your household spend each month on groceries? ALL 18-24 25-29 30-34 35-44 45-54 55-64 65+ City Suburb Rural
Average amount in dollars 352 314 344 369 368 364 347 335 335 350 375
Q30. Do you personally know anyone who has struggled to afford food in the past 5 years? ALL 18-24 25-29 30-34 35-44 45-54 55-64 65+ City Suburb Rural
Yes 62% 66% 60% 62% 65% 57% 64% 57% 62% 59% 67%

Appendix: GMO Support
37
Q31. How familiar are you with the term "Genetically Modified Organisms" (GMOs) as they relate to food production? ALL 18-24 25-29 30-34 35-44 45-54 55-64 65+ City Suburb Rural
Very familiar 16% 27% 21% 19% 17% 15% 9% 9% 19% 16% 14%
Somewhat familiar 32% 39% 37% 38% 29% 28% 26% 33% 34% 30% 32%
Not very familiar 19% 17% 20% 23% 18% 20% 19% 18% 21% 20% 17%
Not at all familiar 29% 13% 21% 19% 32% 35% 40% 36% 23% 32% 33%
Don't know 3% 3% 1% 1% 4% 2% 5% 4% 3% 2% 5%
Q32. Do you support the use of "Genetically Modified Organisms" (GMO’s) in food production? ALL 18-24 25-29 30-34 35-44 45-54 55-64 65+ City Suburb Rural
Strongly support 8% 7% 15% 8% 11% 6% 5% 10% 10% 8% 7%
Somewhat support 28% 28% 28% 33% 25% 23% 31% 32% 24% 31% 27%
Somewhat oppose 23% 30% 16% 28% 22% 21% 22% 20% 23% 24% 20%
Strongly oppose 22% 22% 26% 20% 23% 23% 19% 19% 22% 19% 28%
Don't know 19% 12% 15% 11% 20% 26% 22% 19% 20% 18% 18%
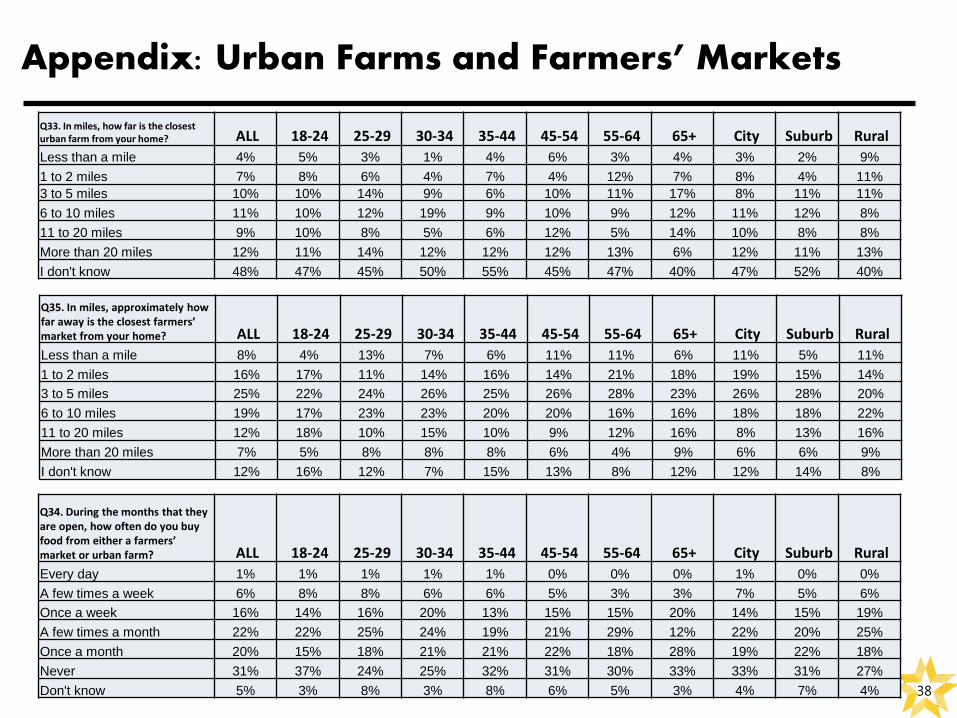
Appendix: Urban Farms and Farmers’ Markets
38
Q33. In miles, how far is the closest urban farm from your home? ALL 18-24 25-29 30-34 35-44 45-54 55-64 65+ City Suburb Rural
Less than a mile 4% 5% 3% 1% 4% 6% 3% 4% 3% 2% 9%
1 to 2 miles 7% 8% 6% 4% 7% 4% 12% 7% 8% 4% 11%
3 to 5 miles 10% 10% 14% 9% 6% 10% 11% 17% 8% 11% 11%
6 to 10 miles 11% 10% 12% 19% 9% 10% 9% 12% 11% 12% 8%
11 to 20 miles 9% 10% 8% 5% 6% 12% 5% 14% 10% 8% 8%
More than 20 miles 12% 11% 14% 12% 12% 12% 13% 6% 12% 11% 13%
I don't know 48% 47% 45% 50% 55% 45% 47% 40% 47% 52% 40%
Q35. In miles, approximately how far away is the closest farmers’ market from your home? ALL 18-24 25-29 30-34 35-44 45-54 55-64 65+ City Suburb Rural
Less than a mile 8% 4% 13% 7% 6% 11% 11% 6% 11% 5% 11%
1 to 2 miles 16% 17% 11% 14% 16% 14% 21% 18% 19% 15% 14%
3 to 5 miles 25% 22% 24% 26% 25% 26% 28% 23% 26% 28% 20%
6 to 10 miles 19% 17% 23% 23% 20% 20% 16% 16% 18% 18% 22%
11 to 20 miles 12% 18% 10% 15% 10% 9% 12% 16% 8% 13% 16%
More than 20 miles 7% 5% 8% 8% 8% 6% 4% 9% 6% 6% 9%
I don't know 12% 16% 12% 7% 15% 13% 8% 12% 12% 14% 8%
Q34. During the months that they are open, how often do you buy food from either a farmers’ market or urban farm? ALL 18-24 25-29 30-34 35-44 45-54 55-64 65+ City Suburb Rural
Every day 1% 1% 1% 1% 1% 0% 0% 0% 1% 0% 0%
A few times a week 6% 8% 8% 6% 6% 5% 3% 3% 7% 5% 6%
Once a week 16% 14% 16% 20% 13% 15% 15% 20% 14% 15% 19%
A few times a month 22% 22% 25% 24% 19% 21% 29% 12% 22% 20% 25%
Once a month 20% 15% 18% 21% 21% 22% 18% 28% 19% 22% 18%
Never 31% 37% 24% 25% 32% 31% 30% 33% 33% 31% 27%
Don't know 5% 3% 8% 3% 8% 6% 5% 3% 4% 7% 4%
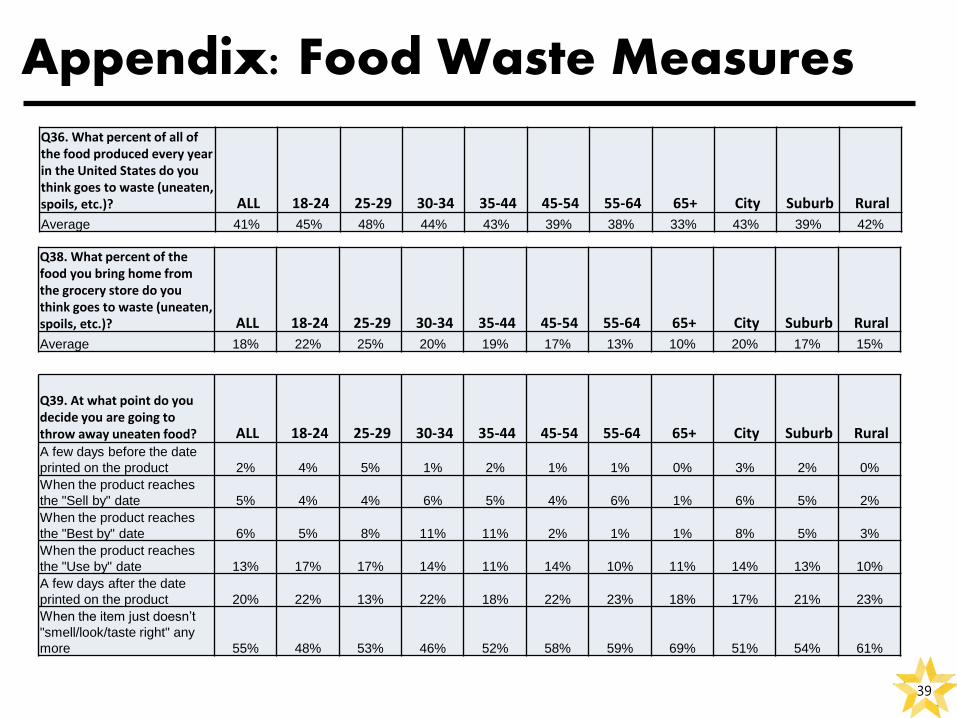
Appendix: Food Waste Measures
39
Q36. What percent of all of the food produced every year in the United States do you think goes to waste (uneaten, spoils, etc.)? ALL 18-24 25-29 30-34 35-44 45-54 55-64 65+ City Suburb Rural
Average 41% 45% 48% 44% 43% 39% 38% 33% 43% 39% 42%
Q39. At what point do you decide you are going to throw away uneaten food? ALL 18-24 25-29 30-34 35-44 45-54 55-64 65+ City Suburb Rural A few days before the date
printed on the product 2% 4% 5% 1% 2% 1% 1% 0% 3% 2% 0%
When the product reaches
the "Sell by" date 5% 4% 4% 6% 5% 4% 6% 1% 6% 5% 2%
When the product reaches
the "Best by" date 6% 5% 8% 11% 11% 2% 1% 1% 8% 5% 3%
When the product reaches
the "Use by" date 13% 17% 17% 14% 11% 14% 10% 11% 14% 13% 10%
A few days after the date
printed on the product 20% 22% 13% 22% 18% 22% 23% 18% 17% 21% 23%
When the item just doesn’t
"smell/look/taste right" any
more 55% 48% 53% 46% 52% 58% 59% 69% 51% 54% 61%
Q38. What percent of the food you bring home from the grocery store do you think goes to waste (uneaten, spoils, etc.)? ALL 18-24 25-29 30-34 35-44 45-54 55-64 65+ City Suburb Rural
Average 18% 22% 25% 20% 19% 17% 13% 10% 20% 17% 15%

Appendix: Food Waste
40
Q40. When you do have to throw away unused food, what do you regret about it? Please select all that apply. ALL 18-24 25-29 30-34 35-44 45-54 55-64 65+ City Suburb Rural Wasted money I spent
buying the food 80% 80% 77% 82% 77% 83% 83% 78% 74% 82% 84%
Energy resources it took to
get the food to my plate 16% 23% 23% 19% 17% 11% 13% 13% 21% 14% 14%
Landfill space and other
resources required to
dispose of the food 15% 22% 17% 15% 16% 15% 13% 5% 17% 17% 9%
General environmental
consequences of wasted
food 20% 28% 29% 22% 17% 20% 16% 15% 22% 22% 16%
That there are people without
enough to eat who could
have used it 53% 55% 59% 59% 48% 50% 54% 49% 53% 56% 46%
That my refrigerator is
disorganized and I didn’t see
it in time 19% 25% 13% 27% 21% 17% 16% 14% 17% 21% 19%
Other 1% 1% 0% 0% 2% 1% 2% 1% 0% 2% 2%
None that I can think of 4% 4% 4% 3% 4% 6% 2% 3% 5% 3% 3%
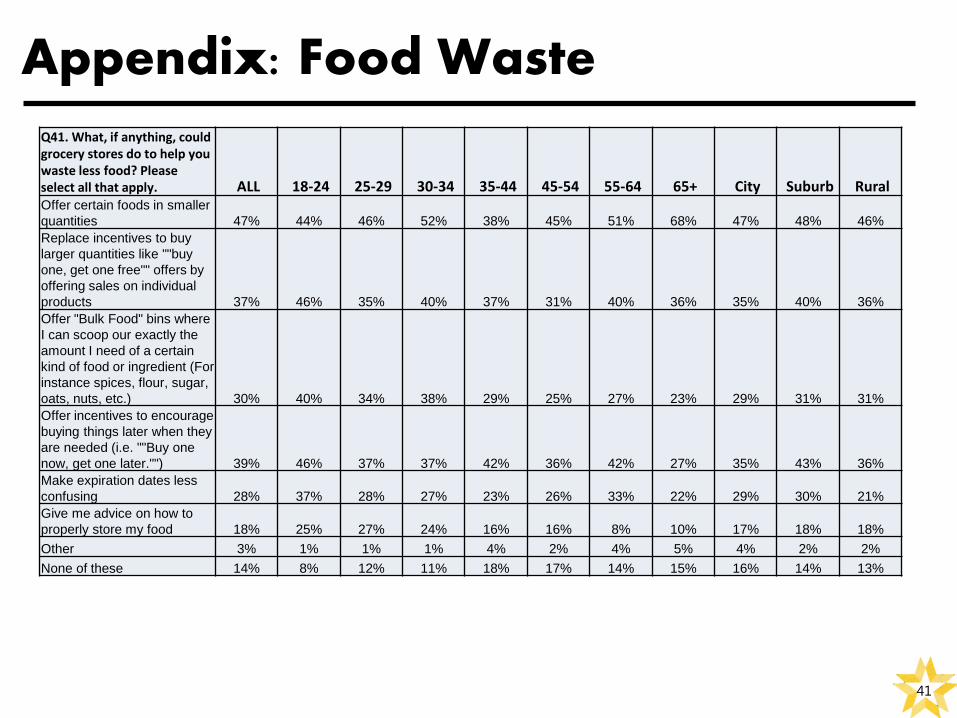
Appendix: Food Waste
41
Q41. What, if anything, could grocery stores do to help you waste less food? Please select all that apply. ALL 18-24 25-29 30-34 35-44 45-54 55-64 65+ City Suburb Rural Offer certain foods in smaller
quantities 47% 44% 46% 52% 38% 45% 51% 68% 47% 48% 46%
Replace incentives to buy
larger quantities like ""buy
one, get one free"" offers by
offering sales on individual
products 37% 46% 35% 40% 37% 31% 40% 36% 35% 40% 36%
Offer "Bulk Food" bins where
I can scoop our exactly the
amount I need of a certain
kind of food or ingredient (For
instance spices, flour, sugar,
oats, nuts, etc.) 30% 40% 34% 38% 29% 25% 27% 23% 29% 31% 31%
Offer incentives to encourage
buying things later when they
are needed (i.e. ""Buy one
now, get one later."") 39% 46% 37% 37% 42% 36% 42% 27% 35% 43% 36%
Make expiration dates less
confusing 28% 37% 28% 27% 23% 26% 33% 22% 29% 30% 21%
Give me advice on how to
properly store my food 18% 25% 27% 24% 16% 16% 8% 10% 17% 18% 18%
Other 3% 1% 1% 1% 4% 2% 4% 5% 4% 2% 2%
None of these 14% 8% 12% 11% 18% 17% 14% 15% 16% 14% 13%

Appendix: Food Waste
42
Q42. What, if anything, do you personally do to reduce the amount of food that goes to waste? Please select all that apply. ALL 18-24 25-29 30-34 35-44 45-54 55-64 65+ City Suburb Rural Use see-through storage
containers in the refrigerator 32% 40% 32% 32% 27% 31% 32% 37% 31% 30% 39%
Have a "clean-plate" club or
other reward for finishing
food that is served 7% 7% 14% 9% 7% 6% 5% 6% 12% 5% 6%
Freeze excess food for use
at a later time 68% 57% 70% 59% 59% 72% 81% 80% 63% 66% 77%
Carefully plan meals and
snacks 43% 38% 44% 48% 41% 43% 42% 48% 38% 43% 50%
Carefully plan shopping lists
before going to the store 50% 48% 48% 52% 47% 45% 56% 55% 43% 50% 56%
Make sure my refrigerator is
properly sealed and that the
temperature is correct 31% 29% 31% 27% 26% 35% 37% 35% 28% 32% 33%
Find new ways to use food
that is about to go bad 38% 42% 41% 40% 38% 37% 40% 31% 37% 34% 48%
Use leftovers as ingredients
in future meals 62% 55% 57% 61% 57% 63% 69% 76% 55% 60% 74%
Serve smaller portions 26% 26% 25% 26% 20% 26% 33% 34% 25% 25% 31%
Compost what ultimately
does go bad 17% 19% 20% 14% 16% 19% 17% 16% 15% 15% 25%
Eat at home rather than go to
a restaurant 56% 57% 60% 58% 49% 57% 57% 62% 52% 55% 63%
Other 3% 1% 0% 2% 4% 4% 3% 3% 3% 3% 2%
None of these 2% 3% 3% 4% 4% 1% 0% 2% 4% 2% 0%

Appendix: Food Waste
43
Q42a. In thinking about wasting food, how would you describe your general concern about this issue relative to last year? ALL 18-24 25-29 30-34 35-44 45-54 55-64 65+ City Suburb Rural
More concerned 27% 32% 29% 24% 25% 27% 26% 30% 29% 24% 30%
Just as concerned 65% 57% 65% 69% 64% 65% 69% 64% 63% 67% 63%
Less concerned 5% 7% 2% 5% 6% 7% 3% 5% 5% 5% 5%
Don't know 3% 4% 4% 2% 4% 2% 3% 1% 2% 3% 3%
Q42b. Have you read anything or heard anything from your social networks to indicate that wasting food is an important environmental issue? ALL 18-24 25-29 30-34 35-44 45-54 55-64 65+ City Suburb Rural
Yes 13% 20% 14% 17% 14% 12% 8% 11% 16% 13% 9%
No 76% 74% 80% 76% 77% 76% 79% 67% 73% 76% 80%
Don't know/Does not apply 11% 6% 6% 7% 9% 13% 12% 22% 11% 10% 10%
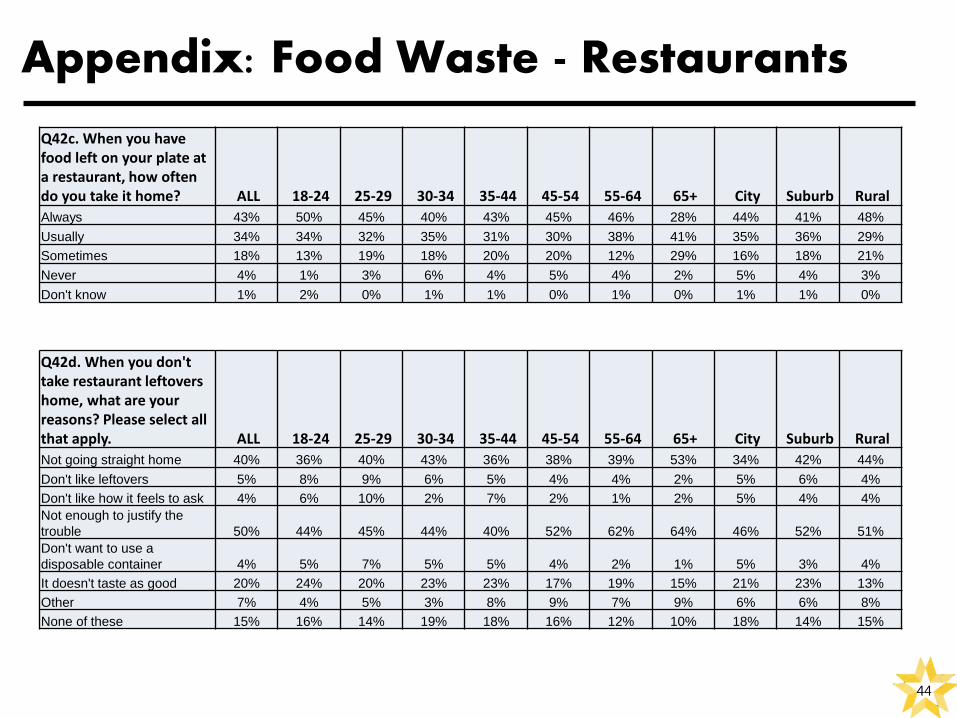
Appendix: Food Waste - Restaurants
44
Q42c. When you have food left on your plate at a restaurant, how often do you take it home? ALL 18-24 25-29 30-34 35-44 45-54 55-64 65+ City Suburb Rural
Always 43% 50% 45% 40% 43% 45% 46% 28% 44% 41% 48%
Usually 34% 34% 32% 35% 31% 30% 38% 41% 35% 36% 29%
Sometimes 18% 13% 19% 18% 20% 20% 12% 29% 16% 18% 21%
Never 4% 1% 3% 6% 4% 5% 4% 2% 5% 4% 3%
Don't know 1% 2% 0% 1% 1% 0% 1% 0% 1% 1% 0%
Q42d. When you don't take restaurant leftovers home, what are your reasons? Please select all that apply. ALL 18-24 25-29 30-34 35-44 45-54 55-64 65+ City Suburb Rural
Not going straight home 40% 36% 40% 43% 36% 38% 39% 53% 34% 42% 44%
Don't like leftovers 5% 8% 9% 6% 5% 4% 4% 2% 5% 6% 4%
Don't like how it feels to ask 4% 6% 10% 2% 7% 2% 1% 2% 5% 4% 4%
Not enough to justify the
trouble 50% 44% 45% 44% 40% 52% 62% 64% 46% 52% 51%
Don't want to use a
disposable container 4% 5% 7% 5% 5% 4% 2% 1% 5% 3% 4%
It doesn't taste as good 20% 24% 20% 23% 23% 17% 19% 15% 21% 23% 13%
Other 7% 4% 5% 3% 8% 9% 7% 9% 6% 6% 8%
None of these 15% 16% 14% 19% 18% 16% 12% 10% 18% 14% 15%

Appendix: Fuel Issues
45
Q43. Approximately how much does your household spend each month on transportation fuels (gasoline/diesel/alternatives for personal cars/trucks)? ALL 18-24 25-29 30-34 35-44 45-54 55-64 65+ City Suburb Rural
Average 209 200 200 218 292 210 154 129 220 195 219
Q43. Approximately how many miles per day do you drive? If you don't drive at all, please enter 0. ALL 18-24 25-29 30-34 35-44 45-54 55-64 65+ City Suburb Rural
Average 31 30 29 31 41 30 23 25 36 28 29
Q45. Are you considering buying/leasing a new or used vehicle for yourself or a member of your household in the next...? ALL 18-24 25-29 30-34 35-44 45-54 55-64 65+ City Suburb Rural
0 – 6 months 10% 13% 10% 11% 11% 11% 8% 6% 9% 11% 9%
6 months – 1 year 16% 22% 23% 18% 12% 19% 13% 10% 18% 17% 14%
1 – 2 years 18% 20% 15% 16% 21% 15% 18% 19% 17% 18% 18%
3 – 5 years 14% 13% 18% 14% 11% 11% 15% 25% 13% 16% 13%
More than 5 years 9% 4% 13% 13% 11% 8% 11% 6% 8% 10% 10%
Not planning to buy/lease a
vehicle 24% 20% 17% 22% 27% 24% 29% 29% 28% 21% 27%
Don't know 8% 9% 4% 7% 7% 12% 7% 5% 7% 7% 10%

Appendix: Fuel Issues
46
Q46. When you think about the next vehicle you plan to buy/lease, how important is it to you that the vehicle gets good fuel economy (high number of miles traveled per gallon of gasoline or equivalent)? ALL 18-24 25-29 30-34 35-44 45-54 55-64 65+ City Suburb Rural
Very important 68% 76% 61% 68% 65% 67% 69% 73% 76% 65% 64%
Somewhat important 29% 23% 31% 31% 33% 32% 28% 25% 22% 33% 32%
Not very important 1% 0% 3% 1% 1% 0% 3% 2% 1% 1% 2%
Not at all important 1% 1% 0% 0% 1% 1% 0% 0% 1% 0% 0%
Don't know/does not apply 1% 0% 5% 0% 0% 0% 0% 0% 0% 1% 1%
Q47. Which of the following statements describes your next vehicle? ALL 18-24 25-29 30-34 35-44 45-54 55-64 65+ City Suburb Rural I am planning to buy a
traditional gasoline or diesel
vehicle 52% 58% 42% 58% 61% 50% 47% 39% 52% 48% 58%
I am planning to buy an
alternative fuel vehicle 15% 16% 25% 18% 14% 12% 13% 8% 19% 14% 11%
I don't know yet 33% 27% 33% 24% 26% 37% 40% 52% 28% 38% 31%

Appendix: Fuel Issues
47
Q48. When you think about the next vehicle you plan to buy/lease, are you considering a vehicle with any of the following features? Please select all that apply. ALL 18-24 25-29 30-34 35-44 45-54 55-64 65+ City Suburb Rural Hybrid gasoline/electric
engine 76% 61% 69% 79% 80% 71% 83% 91% 80% 78% 65%
Plug-in electric engine 31% 37% 33% 45% 31% 24% 34% 15% 30% 33% 25%
Flex-fuel vehicle (able to run
on different forms of fuel
used in the same tank) 44% 42% 34% 50% 46% 51% 41% 42% 35% 46% 53%
Natural gas engine 29% 29% 35% 39% 43% 23% 20% 14% 26% 31% 27%
Bio-diesel engine 18% 25% 21% 32% 14% 17% 13% 12% 22% 16% 17%
Hydrogen 11% 23% 10% 11% 10% 10% 6% 12% 10% 13% 9%
Other 2% 0% 0% 0% 2% 7% 4% 0% 2% 3% 2%
None of these 8% 16% 13% 7% 2% 13% 4% 0% 7% 7% 11%
Q49. You mentioned that you are considering buying/leasing a vehicle that does not run on a standard gasoline or diesel engine. How far from your home is the closest fueling or charging station for the vehicle you are considering? ALL 18-24 25-29 30-34 35-44 45-54 55-64 65+ City Suburb Rural
Less than a mile 7% 15% 12% 0% 0% 5% 16% 0% 16% 3% 4%
1 to 2 miles 10% 8% 14% 9% 9% 8% 13% 5% 15% 9% 5%
3 to 5 miles 11% 17% 8% 19% 15% 2% 7% 16% 15% 10% 8%
6 to 10 miles 9% 7% 22% 30% 5% 5% 3% 5% 7% 10% 12%
11 to 20 miles 7% 10% 8% 6% 11% 9% 3% 0% 9% 7% 8%
More than 20 miles 3% 0% 0% 5% 8% 3% 0% 5% 2% 3% 6%
I don't know 52% 44% 35% 30% 53% 68% 58% 68% 37% 58% 58%
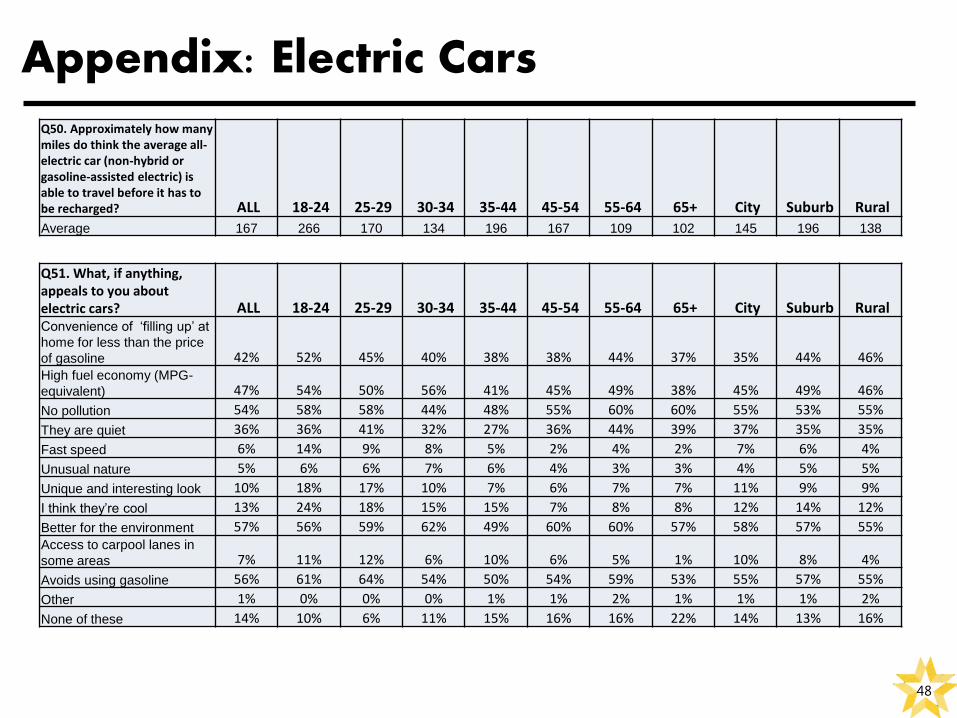
Appendix: Electric Cars
48
Q51. What, if anything, appeals to you about electric cars? ALL 18-24 25-29 30-34 35-44 45-54 55-64 65+ City Suburb Rural Convenience of ‘filling up’ at
home for less than the price
of gasoline 42% 52% 45% 40% 38% 38% 44% 37% 35% 44% 46% High fuel economy (MPG-
equivalent) 47% 54% 50% 56% 41% 45% 49% 38% 45% 49% 46%
No pollution 54% 58% 58% 44% 48% 55% 60% 60% 55% 53% 55%
They are quiet 36% 36% 41% 32% 27% 36% 44% 39% 37% 35% 35%
Fast speed 6% 14% 9% 8% 5% 2% 4% 2% 7% 6% 4%
Unusual nature 5% 6% 6% 7% 6% 4% 3% 3% 4% 5% 5%
Unique and interesting look 10% 18% 17% 10% 7% 6% 7% 7% 11% 9% 9%
I think they’re cool 13% 24% 18% 15% 15% 7% 8% 8% 12% 14% 12%
Better for the environment 57% 56% 59% 62% 49% 60% 60% 57% 58% 57% 55% Access to carpool lanes in
some areas 7% 11% 12% 6% 10% 6% 5% 1% 10% 8% 4%
Avoids using gasoline 56% 61% 64% 54% 50% 54% 59% 53% 55% 57% 55%
Other 1% 0% 0% 0% 1% 1% 2% 1% 1% 1% 2%
None of these 14% 10% 6% 11% 15% 16% 16% 22% 14% 13% 16%
Q50. Approximately how many miles do think the average all-electric car (non-hybrid or gasoline-assisted electric) is able to travel before it has to be recharged? ALL 18-24 25-29 30-34 35-44 45-54 55-64 65+ City Suburb Rural
Average 167 266 170 134 196 167 109 102 145 196 138

Appendix: Electric Cars
49
Q52. What, if anything, concerns you about electric cars? ALL 18-24 25-29 30-34 35-44 45-54 55-64 65+ City Suburb Rural
Too expensive 65% 63% 61% 63% 64% 63% 70% 73% 59% 67% 70% Batteries will run out while
out driving 63% 59% 61% 57% 62% 64% 68% 72% 59% 63% 70% Batteries will wear out over
time and have to be replaced 52% 52% 50% 47% 45% 53% 57% 67% 48% 53% 58%
Won’t be able to resell it 17% 15% 15% 8% 17% 17% 22% 25% 17% 18% 16%
Dangerous 11% 12% 17% 12% 11% 11% 6% 13% 10% 11% 13%
Unproven technology 22% 25% 22% 16% 20% 18% 25% 28% 17% 25% 21%
Odd looking 13% 22% 13% 16% 16% 10% 7% 6% 12% 15% 12% Limited number of models
available (no minivans,
trucks, etc.) 31% 27% 32% 37% 32% 33% 29% 25% 27% 32% 33%
Other 7% 5% 4% 5% 7% 11% 8% 7% 7% 6% 11%
None of these 6% 10% 6% 7% 6% 8% 4% 1% 8% 5% 5%

Appendix: Independence and Alternatives
50
Q53. Which of the following statements come closer to your opinion about American energy independence? ALL 18-24 25-29 30-34 35-44 45-54 55-64 65+ City Suburb Rural The government should
implement policies with the goal
of achieving energy
independence for the U.S. 84% 76% 80% 82% 80% 90% 87% 94% 81% 85% 86%
Energy independence is
unattainable and the U.S. would
be better served importing
energy at the best price on the
global market. 16% 24% 20% 18% 20% 10% 13% 6% 19% 15% 14%
Q54. Which of the following statements come closer to your opinion about research and development into alternative fuels? ALL 18-24 25-29 30-34 35-44 45-54 55-64 65+ City Suburb Rural Research and development into
alternative and renewable fuels
is crucial for the future of our
country and should be our
national priority. 29% 29% 37% 35% 33% 25% 26% 17% 33% 30% 22%
Oil and natural gas
development should be our
national priority; research and
development to develop
alternative and renewable fuels
is mostly a distraction. 13% 20% 14% 10% 18% 10% 10% 12% 15% 12% 13%
We need an ""all of the above""
strategy that includes both
alternative and renewable fuels
and a continued search for
existing domestic oil and natural
gas. 58% 51% 49% 55% 50% 65% 64% 71% 52% 58% 64%

Appendix: Importance of Alternatives
51
Q55. How much do you agree or disagree with the following statement, “I would be willing to switch to a different company for shipping (e.g. Postal Service, UPS, FedEx) if I knew the company was incorporating more alternative fuel vehicles into its fleet.” ALL 18-24 25-29 30-34 35-44 45-54 55-64 65+ City Suburb Rural
Strongly agree 15% 17% 17% 14% 18% 12% 11% 14% 19% 13% 13%
Somewhat agree 42% 44% 48% 51% 38% 42% 40% 31% 43% 44% 37%
Somewhat disagree 15% 18% 12% 14% 11% 12% 16% 22% 12% 16% 17%
Strongly disagree 8% 10% 7% 8% 10% 8% 7% 8% 8% 7% 12%
Don't know 20% 11% 15% 13% 22% 26% 26% 24% 18% 21% 21%

Appendix: Awareness of Alternatives
52
Q57-62a. Please look at the list of alternative fuels below and indicate how familiar you are with each. (Showing Very and Somewhat Familiar) ALL 18-24 25-29 30-34 35-44 45-54 55-64 65+ City Suburb Rural
Ethanol (E85) 65% 63% 65% 63% 60% 66% 66% 68% 61% 63% 71%
Biodiesel (BD or B20) 42% 49% 45% 38% 39% 43% 43% 38% 41% 42% 45%
Liquid Petroleum Gas (LPG) 40% 33% 38% 35% 32% 45% 47% 55% 42% 36% 45%
Compressed Natural Gas
(CNG) 31% 27% 29% 27% 27% 34% 37% 39% 33% 30% 31%
Electricity (Fast Charge) 63% 71% 70% 68% 61% 61% 59% 61% 65% 62% 66%
Hydrogen (H2 or HY) 38% 51% 48% 42% 36% 33% 32% 32% 41% 37% 38%
Liquid Natural Gas (LNG) 36% 32% 38% 26% 30% 40% 43% 44% 37% 34% 38%
Q57-62a. You indicated that you are somewhat or very familiar with these alternative fuels. If you wanted to use each of these fuels, would you know where to go to purchase it? ALL 18-24 25-29 30-34 35-44 45-54 55-64 65+ City Suburb Rural
Ethanol (E85) 55% 50% 58% 60% 54% 51% 56% 63% 56% 51% 61%
Biodiesel (BD or B20) 39% 44% 50% 45% 33% 37% 32% 42% 49% 32% 41%
Liquid Petroleum Gas (LPG) 49% 39% 56% 52% 58% 47% 40% 51% 58% 36% 57%
Compressed Natural Gas
(CNG) 33% 29% 51% 46% 43% 26% 27% 20% 37% 31% 31%
Electricity (Fast Charge) 34% 33% 44% 48% 42% 21% 29% 23% 38% 33% 30%
Hydrogen (H2 or HY) 20% 26% 27% 29% 27% 12% 10% 3% 28% 14% 21%
Liquid Natural Gas (LNG) 36% 35% 40% 56% 45% 24% 34% 32% 45% 26% 41%

Appendix: Food Availability
53
Q63. What do you see as the best way to increase the availability of food in the U.S? Please select all that apply. ALL 18-24 25-29 30-34 35-44 45-54 55-64 65+ City Suburb Rural Increase the availability of
urban farms 39% 42% 36% 36% 38% 37% 45% 34% 37% 39% 42%
Promote organic farming 26% 41% 34% 28% 24% 24% 20% 14% 28% 26% 24%
Promote smaller, local farms 48% 49% 48% 51% 40% 49% 54% 44% 44% 48% 52%
Increase productivity at large-
scale, commercial farms 20% 23% 27% 14% 18% 15% 28% 15% 22% 18% 20%
Stronger efforts to reduce food
waste in restaurants and
grocery stores 60% 60% 62% 57% 58% 59% 60% 67% 59% 61% 60%
Stronger efforts to reduce food
waste at the farm 39% 44% 42% 33% 34% 41% 42% 36% 40% 37% 41%
Reduce the amount of food that
is diverted for fuel 21% 24% 21% 18% 20% 21% 18% 25% 19% 22% 21%
Promote alternative farming
methods 27% 25% 30% 32% 23% 29% 26% 31% 25% 26% 32%
Other 6% 6% 3% 5% 8% 5% 6% 9% 5% 6% 6%
Nothing, the U.S. has more than
enough food to feed everyone 9% 6% 6% 12% 11% 10% 10% 11% 9% 10% 10%

Appendix: Food/Fuel Issues
54
Q64. How much, if at all, do you consider the fuel (oil, gasoline, diesel) inputs that went into the food you buy? (Fuel to transport the food, operate the tractors, etc.) ALL 18-24 25-29 30-34 35-44 45-54 55-64 65+ City Suburb Rural 1 – I don't think about it at all
when I buy food 30% 32% 34% 29% 28% 29% 31% 29% 29% 34% 24%
2 16% 20% 7% 14% 19% 14% 19% 10% 14% 17% 14%
3 24% 23% 28% 27% 22% 25% 22% 26% 27% 23% 23%
4 17% 10% 18% 21% 19% 19% 13% 20% 17% 14% 23%
5 – I think about it every time I
buy food 9% 11% 8% 8% 9% 7% 8% 11% 9% 7% 11%
Don't know 4% 4% 5% 1% 2% 5% 6% 4% 4% 4% 5%
Q65. How worried are you, if at all, about the possibility of food shortages following natural disasters? ALL 18-24 25-29 30-34 35-44 45-54 55-64 65+ City Suburb Rural
Very worried 18% 22% 17% 13% 22% 16% 19% 14% 18% 15% 24%
Somewhat worried 48% 40% 52% 47% 41% 51% 53% 53% 49% 46% 49%
Not very worried 25% 31% 22% 29% 26% 22% 22% 29% 23% 30% 20%
Not at all worried 6% 6% 4% 8% 8% 9% 4% 3% 8% 6% 5%
Don't know 2% 1% 5% 2% 4% 1% 2% 1% 2% 3% 2%
Food/Fuel ALL 18-24 25-29 30-34 35-44 45-54 55-64 65+ City Suburb Rural Q66. What percent of all of the
corn produced each year in the
United States do you think goes to
produce fuel for transportation,
etc.? (Average) 38% 44% 39% 39% 39% 37% 35% 35% 39% 37% 39%
Q67. What percent of all of the
energy resources used each year
in the United States do you think
is used to produce food? (Avg) 39% 43% 43% 42% 41% 38% 36% 34% 42% 38% 39%

Appendix: Food/Fuel Price Linkage
55
Q68. If the price of food goes up in America, how much of an effect do you think it has on the price of gasoline? ALL 18-24 25-29 30-34 35-44 45-54 55-64 65+ City Suburb Rural
1 – No effect at all 7% 5% 4% 5% 8% 9% 9% 9% 5% 7% 11%
2 13% 16% 10% 15% 11% 11% 17% 12% 11% 17% 10%
3 25% 27% 30% 31% 20% 26% 23% 22% 25% 28% 20%
4 23% 16% 31% 24% 29% 21% 17% 25% 27% 21% 22%
5 – Very strong effect 26% 29% 18% 26% 26% 27% 28% 27% 27% 22% 32%
Don't know 6% 8% 7% 0% 6% 6% 6% 5% 5% 6% 5%
Q69. If the price of gasoline goes up in America, how much of an effect do you think it has on the price of food? ALL 18-24 25-29 30-34 35-44 45-54 55-64 65+ City Suburb Rural
1 – No effect at all 1% 1% 1% 0% 1% 1% 1% 0% 1% 1% 0%
2 3% 4% 8% 4% 1% 2% 1% 1% 2% 3% 2%
3 11% 16% 16% 16% 14% 4% 10% 8% 13% 13% 7%
4 29% 27% 33% 33% 29% 31% 24% 26% 33% 31% 20%
5 – Very strong effect 54% 48% 38% 47% 52% 60% 63% 62% 49% 49% 71%
Don't know 2% 5% 5% 0% 2% 2% 2% 2% 3% 3% 1%

Appendix: Food/Fuel Supply
56
Q70. How much do you agree or disagree with the following statement, "There will always be enough food for people to eat in America.” ALL 18-24 25-29 30-34 35-44 45-54 55-64 65+ City Suburb Rural
Agree completely 10% 14% 9% 10% 10% 8% 7% 14% 13% 9% 7%
Somewhat agree 31% 32% 25% 32% 32% 27% 34% 34% 30% 34% 25%
Somewhat disagree 33% 33% 38% 33% 27% 38% 32% 33% 35% 31% 35%
Disagree completely 21% 17% 24% 18% 24% 22% 20% 17% 17% 19% 28%
Don't know 6% 5% 4% 7% 7% 6% 7% 1% 5% 7% 5%
Q71. How much do you agree or disagree with the following statement, ""There will always be an ample supply of affordable energy (oil, gasoline, natural gas, alternatives, etc.) in America to maintain our current consumption habits. ALL 18-24 25-29 30-34 35-44 45-54 55-64 65+ City Suburb Rural
Agree completely 7% 8% 8% 6% 9% 7% 5% 9% 11% 6% 7%
Somewhat agree 19% 17% 24% 25% 22% 14% 19% 18% 24% 19% 14%
Somewhat disagree 34% 38% 34% 26% 32% 36% 36% 42% 33% 36% 34%
Disagree completely 33% 30% 32% 36% 32% 37% 34% 29% 29% 34% 38%
Don't know 5% 7% 2% 8% 5% 6% 6% 3% 4% 6% 7%

Appendix: Ethanol/Food for Fuel
57
Q72. In general, do you think growing food (corn, sugar, etc.) for the purpose of expanding the fuel supply is mostly a... ALL 18-24 25-29 30-34 35-44 45-54 55-64 65+ City Suburb Rural
Good thing 56% 54% 56% 68% 54% 56% 56% 49% 57% 56% 55%
Bad thing 19% 23% 17% 10% 18% 22% 20% 24% 20% 19% 21%
Don't know 25% 23% 27% 22% 27% 22% 24% 28% 24% 25% 25%
Q73. Do you favor or oppose the use of corn-based ethanol in our nation’s transportation fuel supply? ALL 18-24 25-29 30-34 35-44 45-54 55-64 65+ City Suburb Rural
Strongly support 17% 19% 19% 17% 16% 19% 16% 12% 19% 14% 20%
Somewhat support 32% 28% 39% 42% 27% 32% 32% 35% 28% 36% 31%
Neither support nor oppose 24% 26% 24% 24% 25% 21% 26% 16% 28% 23% 19%
Somewhat oppose 9% 9% 5% 5% 9% 10% 8% 17% 8% 9% 10%
Strongly oppose 9% 6% 5% 3% 10% 12% 11% 16% 7% 10% 12%
Don't know 9% 13% 9% 9% 13% 5% 7% 4% 10% 8% 8%
Q74. Which of the following two scenarios come closer to your opinion? ALL 18-24 25-29 30-34 35-44 45-54 55-64 65+ City Suburb Rural I worry more about food prices
getting too high than I do about
gasoline prices. 45% 48% 50% 39% 48% 47% 43% 38% 54% 40% 43%
I worry more about gasoline
prices getting too high than I do
about food prices. 55% 52% 50% 61% 52% 53% 57% 62% 46% 60% 57%

Appendix: Personal Attitudes
58
Q75-89. : How well do each of these statements describe you? Please use the scale below where 1 means "Does not describe me at all" and 7 means "Describes me exactly.” (Showing 6 and 7) ALL 18-24 25-29 30-34 35-44 45-54 55-64 65+ City Suburb Rural
I worry about rising food prices 61% 52% 53% 53% 57% 64% 71% 68% 63% 54% 71%
I always look to see where the food I buy was grown or produced 28% 26% 27% 24% 28% 27% 32% 38% 29% 27% 31%
I am confident that the foods I normally eat will always be available when I want to buy them 31% 27% 29% 29% 37% 23% 37% 40% 34% 32% 27%
I buy organic foods whenever possible 22% 30% 30% 23% 27% 18% 10% 21% 27% 21% 19%
I only buy locally-grown produce 16% 15% 12% 19% 19% 13% 17% 16% 20% 14% 14%
I only buy produce while it is "in season" 24% 22% 33% 24% 24% 22% 24% 20% 28% 22% 24%
I am concerned about climate change 41% 29% 41% 45% 44% 39% 46% 43% 42% 41% 40%
I worry that our country is too dependent on oil as a source of energy 58% 50% 51% 52% 58% 57% 65% 69% 56% 59% 57%
I pay close attention to gasoline prices 64% 54% 53% 58% 63% 64% 74% 83% 62% 61% 73%
I often use alternative forms of transportation instead of driving a car 19% 25% 29% 20% 22% 14% 15% 11% 28% 17% 12%
I believe our country needs to do more to promote energy independence 67% 48% 55% 63% 65% 72% 82% 83% 66% 65% 75%
It is a priority in my daily life to use as little energy resources (gasoline, electricity, etc.) as I can' 45% 35% 37% 40% 45% 45% 56% 59% 47% 42% 49%
I pay close attention to developments in the use of alternative fuels 23% 27% 30% 20% 24% 17% 24% 25% 28% 20% 22%
I always turn off my vehicle’s engine if I know I will be idling for more than 30 seconds 35% 36% 32% 30% 33% 32% 39% 42% 32% 36% 35%
I often worry about the environmental consequences of producing the gasoline we use to drive our cars 34% 40% 34% 31% 36% 29% 31% 38% 39% 32% 29%

Appendix: Organization Awareness
59
Q90-104. How familiar are you with this company or organization? Are you... (Showing Very and Somewhat Familiar) ALL 18-24 25-29 30-34 35-44 45-54 55-64 65+ City Suburb Rural
Sustainable America 15% 20% 25% 22% 18% 7% 10% 4% 18% 14% 12%
Natural Resources Defense Council 17% 18% 30% 20% 20% 15% 11% 10% 21% 15% 16%
The Nature Conservancy 28% 18% 34% 30% 34% 27% 27% 32% 29% 28% 29%
Feeding America 31% 33% 46% 42% 34% 23% 23% 22% 32% 29% 31%
Foodtank 12% 13% 22% 19% 12% 5% 12% 5% 18% 9% 9%
Tesla Motors 30% 36% 44% 32% 33% 20% 24% 30% 35% 30% 22%
US Farmers & Ranchers Alliance 17% 17% 23% 21% 21% 17% 9% 10% 20% 15% 17%
U.S. Composting Council 9% 10% 19% 18% 12% 4% 3% 0% 14% 8% 5%
Exxon Mobil 84% 73% 82% 88% 88% 88% 80% 85% 83% 82% 89%
BP 83% 74% 83% 83% 78% 93% 82% 86% 81% 83% 86%
Green Plains Renewable Energy 11% 14% 19% 17% 18% 4% 5% 6% 15% 9% 10%
Pacific Ethanol 9% 13% 22% 13% 12% 6% 4% 0% 13% 9% 8%
Abengoa Bioenergy 7% 12% 20% 14% 10% 3% 0% 0% 14% 6% 2%
Monsanto 38% 31% 44% 29% 31% 44% 41% 51% 34% 42% 35%
Archer Daniels Midland (ADM) 21% 16% 25% 20% 17% 26% 23% 24% 20% 25% 15%
Appendix: Organization Favorability
60
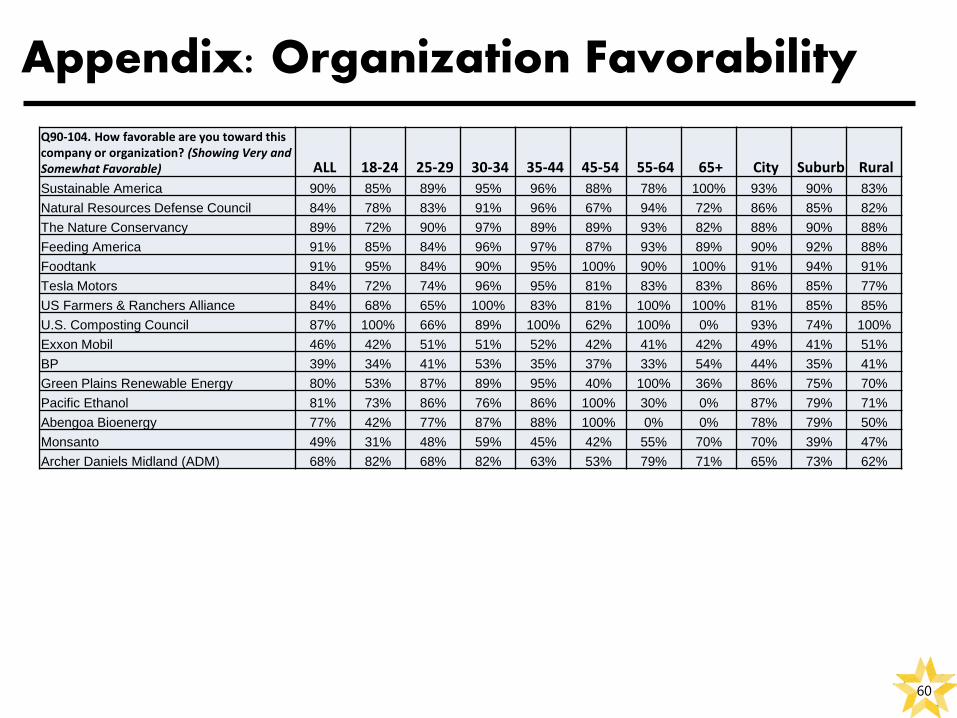
Q90-104. How favorable are you toward this company or organization? (Showing Very and Somewhat Favorable) ALL 18-24 25-29 30-34 35-44 45-54 55-64 65+ City Suburb Rural
Sustainable America 90% 85% 89% 95% 96% 88% 78% 100% 93% 90% 83%
Natural Resources Defense Council 84% 78% 83% 91% 96% 67% 94% 72% 86% 85% 82%
The Nature Conservancy 89% 72% 90% 97% 89% 89% 93% 82% 88% 90% 88%
Feeding America 91% 85% 84% 96% 97% 87% 93% 89% 90% 92% 88%
Foodtank 91% 95% 84% 90% 95% 100% 90% 100% 91% 94% 91%
Tesla Motors 84% 72% 74% 96% 95% 81% 83% 83% 86% 85% 77%
US Farmers & Ranchers Alliance 84% 68% 65% 100% 83% 81% 100% 100% 81% 85% 85%
U.S. Composting Council 87% 100% 66% 89% 100% 62% 100% 0% 93% 74% 100%
Exxon Mobil 46% 42% 51% 51% 52% 42% 41% 42% 49% 41% 51%
BP 39% 34% 41% 53% 35% 37% 33% 54% 44% 35% 41%
Green Plains Renewable Energy 80% 53% 87% 89% 95% 40% 100% 36% 86% 75% 70%
Pacific Ethanol 81% 73% 86% 76% 86% 100% 30% 0% 87% 79% 71%
Abengoa Bioenergy 77% 42% 77% 87% 88% 100% 0% 0% 78% 79% 50%
Monsanto 49% 31% 48% 59% 45% 42% 55% 70% 70% 39% 47%
Archer Daniels Midland (ADM) 68% 82% 68% 82% 63% 53% 79% 71% 65% 73% 62%
Appendix: Demographics
61
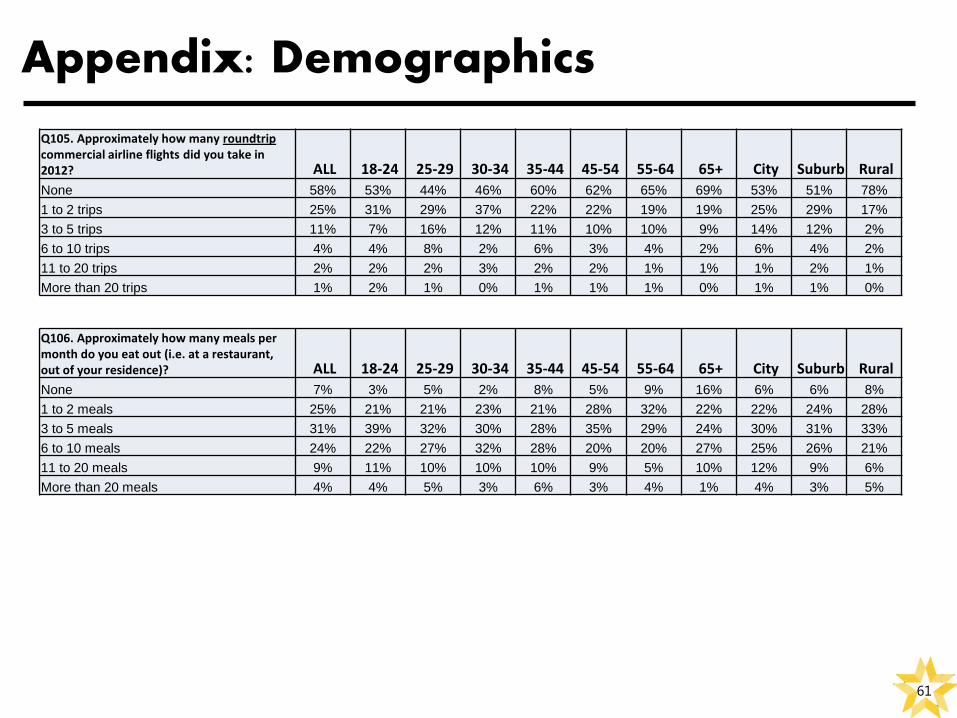
Q105. Approximately how many roundtrip commercial airline flights did you take in 2012? ALL 18-24 25-29 30-34 35-44 45-54 55-64 65+ City Suburb Rural
None 58% 53% 44% 46% 60% 62% 65% 69% 53% 51% 78%
1 to 2 trips 25% 31% 29% 37% 22% 22% 19% 19% 25% 29% 17%
3 to 5 trips 11% 7% 16% 12% 11% 10% 10% 9% 14% 12% 2%
6 to 10 trips 4% 4% 8% 2% 6% 3% 4% 2% 6% 4% 2%
11 to 20 trips 2% 2% 2% 3% 2% 2% 1% 1% 1% 2% 1%
More than 20 trips 1% 2% 1% 0% 1% 1% 1% 0% 1% 1% 0%
Q106. Approximately how many meals per month do you eat out (i.e. at a restaurant, out of your residence)? ALL 18-24 25-29 30-34 35-44 45-54 55-64 65+ City Suburb Rural
None 7% 3% 5% 2% 8% 5% 9% 16% 6% 6% 8%
1 to 2 meals 25% 21% 21% 23% 21% 28% 32% 22% 22% 24% 28%
3 to 5 meals 31% 39% 32% 30% 28% 35% 29% 24% 30% 31% 33%
6 to 10 meals 24% 22% 27% 32% 28% 20% 20% 27% 25% 26% 21%
11 to 20 meals 9% 11% 10% 10% 10% 9% 5% 10% 12% 9% 6%
More than 20 meals 4% 4% 5% 3% 6% 3% 4% 1% 4% 3% 5%

Appendix: Demographics
62
Q107. Do you own a "flex-fuel" vehicle? A "flex-fuel" vehicle is designed to burn regular fuel or a blend of up to 85% ethanol (called E85). ALL 18-24 25-29 30-34 35-44 45-54 55-64 65+ City Suburb Rural
Yes 9% 4% 12% 11% 9% 9% 13% 10% 11% 7% 12%
No 85% 86% 81% 85% 88% 87% 84% 82% 82% 89% 83%
Don't know 5% 10% 6% 4% 3% 5% 4% 8% 6% 4% 6%
Q108. How often do you fill your "flex-fuel" vehicle with E85? ALL 18-24 25-29 30-34 35-44 45-54 55-64 65+ City Suburb Rural
All the time 20% 18% 21% 10% 35% 28% 15% 0% 33% 9% 17%
Most of the time 14% 18% 29% 7% 27% 5% 9% 9% 24% 9% 10%
About half of the time 14% 0% 37% 32% 11% 0% 12% 0% 17% 20% 3%
Occasionally 8% 0% 7% 8% 0% 26% 4% 10% 0% 14% 13%
Almost never 10% 23% 7% 8% 17% 10% 4% 12% 6% 14% 10%
I’ve never put E85 in my ""flex-fuel""
vehicle 26% 41% 0% 34% 5% 25% 36% 57% 16% 30% 33%
I don't know 8% 0% 0% 0% 5% 5% 20% 12% 5% 5% 14%
Q109. Do you have a vegetable garden at home? ALL 18-24 25-29 30-34 35-44 45-54 55-64 65+ City Suburb Rural
Yes 36% 32% 31% 35% 37% 35% 39% 39% 27% 33% 51%
No 64% 68% 69% 65% 63% 65% 61% 61% 73% 67% 49%
Q110. Do you have any children under the age of 18 living at home? ALL 18-24 25-29 30-34 35-44 45-54 55-64 65+ City Suburb Rural
Yes 33% 24% 45% 54% 54% 28% 12% 5% 32% 33% 34%
No 67% 76% 55% 46% 46% 72% 88% 95% 68% 67% 66%

Appendix: Demographics
63
Q111. What is the last grade in school you completed? ALL 18-24 25-29 30-34 35-44 45-54 55-64 65+ City Suburb Rural
Grade school 0% 0% 1% 0% 0% 0% 0% 0% 0% 0% 0%
Some high school 2% 3% 4% 2% 2% 2% 1% 0% 2% 2% 4%
High school graduate 17% 24% 11% 11% 16% 16% 17% 21% 16% 14% 21%
Some college 30% 51% 26% 27% 26% 25% 29% 29% 30% 29% 31%
Technical school 6% 1% 2% 6% 6% 8% 7% 7% 4% 5% 10%
College graduate 32% 18% 47% 44% 37% 30% 28% 26% 38% 32% 25%
Graduate school 13% 3% 10% 10% 13% 18% 17% 17% 10% 18% 8%
Q112. What is your current employment status? ALL 18-24 25-29 30-34 35-44 45-54 55-64 65+ City Suburb Rural
Working full time 40% 24% 47% 52% 52% 53% 31% 8% 40% 46% 31%
Working part time 13% 19% 19% 13% 13% 11% 9% 6% 15% 12% 11%
Retired 17% 0% 0% 0% 1% 7% 45% 83% 14% 14% 25%
Student 6% 37% 7% 2% 3% 0% 1% 0% 8% 7% 4%
Not employed, but looking for work 12% 14% 12% 15% 15% 16% 7% 1% 13% 12% 11%
Not employed and not looking for work 12% 6% 15% 17% 16% 13% 9% 2% 10% 9% 19%
Q113. How do you usually get to work? ALL 18-24 25-29 30-34 35-44 45-54 55-64 65+ City Suburb Rural
Drive my own vehicle by myself 75% 67% 70% 80% 76% 78% 75% 77% 68% 79% 78%
Drive my own vehicle with others or ride in
a carpool with others. 6% 11% 6% 6% 8% 5% 3% 0% 7% 4% 10%
Take public transportation 7% 11% 13% 6% 4% 8% 4% 8% 11% 7% 1%
Walk 4% 7% 8% 1% 3% 2% 9% 0% 8% 2% 4%
I mostly telecommute 5% 0% 3% 5% 5% 5% 7% 9% 4% 6% 4%
None of the above 2% 4% 0% 3% 3% 1% 1% 7% 2% 2% 3%
Q114. Approximately how many miles, one-way, is your place of work from your home? ALL 18-24 25-29 30-34 35-44 45-54 55-64 65+ City Suburb Rural
Average 15 13 10 17 20 14 11 18 14 16 15

Appendix: Demographics
64
Q115. Which of the following do you consider yourself? ALL 18-24 25-29 30-34 35-44 45-54 55-64 65+ City Suburb Rural
Strong Democrat 18% 14% 21% 17% 18% 15% 25% 18% 21% 18% 16%
Lean Democrat 23% 28% 20% 25% 23% 21% 26% 17% 26% 24% 18%
Strong Republican 14% 13% 15% 13% 15% 13% 11% 18% 11% 14% 19%
Lean Republican 15% 12% 13% 15% 13% 20% 13% 23% 12% 16% 18%
Independent 26% 30% 27% 28% 26% 27% 22% 23% 27% 26% 25%
Other 3% 3% 3% 3% 5% 4% 2% 1% 3% 2% 5%
Q116. Regardless of political party, in terms of your political ideology, would you say you are... ALL 18-24 25-29 30-34 35-44 45-54 55-64 65+ City Suburb Rural
Very conservative 15% 16% 22% 11% 19% 15% 8% 14% 19% 11% 16%
Somewhat conservative 20% 19% 22% 17% 18% 21% 19% 25% 20% 19% 20%
Moderate 37% 39% 28% 39% 37% 37% 40% 36% 30% 40% 40%
Somewhat liberal 17% 14% 17% 19% 14% 17% 20% 19% 17% 19% 13%
Very liberal 12% 12% 11% 14% 12% 11% 13% 6% 14% 10% 11%
Q117. Do you live in a city, suburb just outside a city, or a less developed or rural area, not near a city? ALL 18-24 25-29 30-34 35-44 45-54 55-64 65+ City Suburb Rural
City 31% 36% 34% 28% 33% 33% 24% 28% 100% 0% 0%
Suburb 46% 44% 42% 54% 43% 48% 45% 43% 0% 100% 0%
More rural, less developed 23% 21% 24% 18% 24% 19% 31% 29% 0% 0% 100%
Appendix: Demographics
65
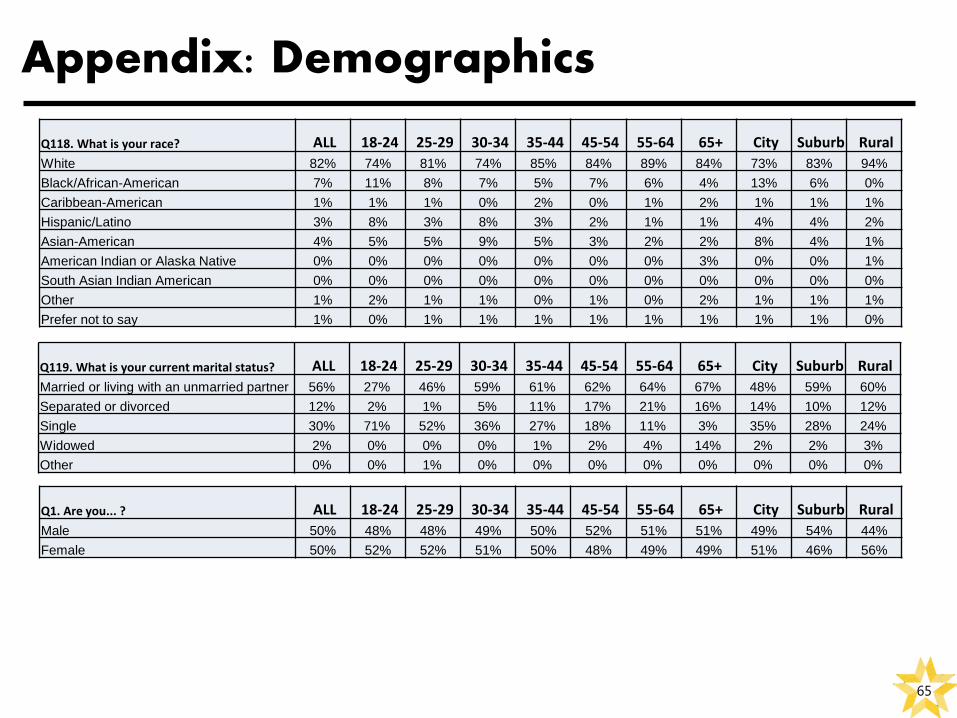
Q118. What is your race? ALL 18-24 25-29 30-34 35-44 45-54 55-64 65+ City Suburb Rural
White 82% 74% 81% 74% 85% 84% 89% 84% 73% 83% 94%
Black/African-American 7% 11% 8% 7% 5% 7% 6% 4% 13% 6% 0%
Caribbean-American 1% 1% 1% 0% 2% 0% 1% 2% 1% 1% 1%
Hispanic/Latino 3% 8% 3% 8% 3% 2% 1% 1% 4% 4% 2%
Asian-American 4% 5% 5% 9% 5% 3% 2% 2% 8% 4% 1%
American Indian or Alaska Native 0% 0% 0% 0% 0% 0% 0% 3% 0% 0% 1%
South Asian Indian American 0% 0% 0% 0% 0% 0% 0% 0% 0% 0% 0%
Other 1% 2% 1% 1% 0% 1% 0% 2% 1% 1% 1%
Prefer not to say 1% 0% 1% 1% 1% 1% 1% 1% 1% 1% 0%
Q119. What is your current marital status? ALL 18-24 25-29 30-34 35-44 45-54 55-64 65+ City Suburb Rural
Married or living with an unmarried partner 56% 27% 46% 59% 61% 62% 64% 67% 48% 59% 60%
Separated or divorced 12% 2% 1% 5% 11% 17% 21% 16% 14% 10% 12%
Single 30% 71% 52% 36% 27% 18% 11% 3% 35% 28% 24%
Widowed 2% 0% 0% 0% 1% 2% 4% 14% 2% 2% 3%
Other 0% 0% 1% 0% 0% 0% 0% 0% 0% 0% 0%
Q1. Are you... ? ALL 18-24 25-29 30-34 35-44 45-54 55-64 65+ City Suburb Rural
Male 50% 48% 48% 49% 50% 52% 51% 51% 49% 54% 44%
Female 50% 52% 52% 51% 50% 48% 49% 49% 51% 46% 56%
Appendix: Demographics
66
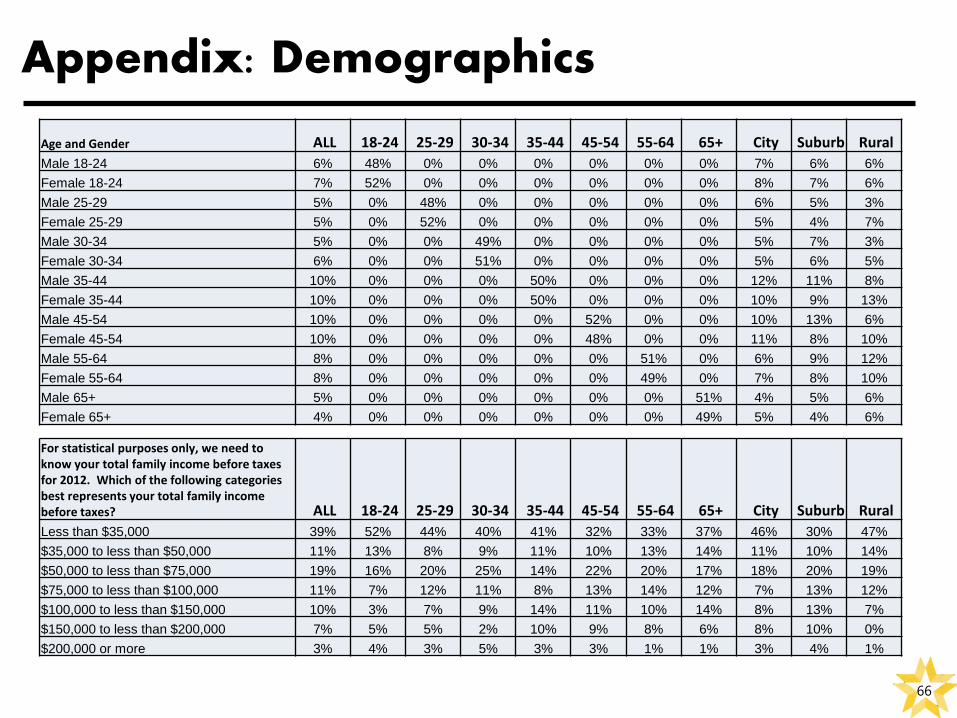
Age and Gender ALL 18-24 25-29 30-34 35-44 45-54 55-64 65+ City Suburb Rural
Male 18-24 6% 48% 0% 0% 0% 0% 0% 0% 7% 6% 6%
Female 18-24 7% 52% 0% 0% 0% 0% 0% 0% 8% 7% 6%
Male 25-29 5% 0% 48% 0% 0% 0% 0% 0% 6% 5% 3%
Female 25-29 5% 0% 52% 0% 0% 0% 0% 0% 5% 4% 7%
Male 30-34 5% 0% 0% 49% 0% 0% 0% 0% 5% 7% 3%
Female 30-34 6% 0% 0% 51% 0% 0% 0% 0% 5% 6% 5%
Male 35-44 10% 0% 0% 0% 50% 0% 0% 0% 12% 11% 8%
Female 35-44 10% 0% 0% 0% 50% 0% 0% 0% 10% 9% 13%
Male 45-54 10% 0% 0% 0% 0% 52% 0% 0% 10% 13% 6%
Female 45-54 10% 0% 0% 0% 0% 48% 0% 0% 11% 8% 10%
Male 55-64 8% 0% 0% 0% 0% 0% 51% 0% 6% 9% 12%
Female 55-64 8% 0% 0% 0% 0% 0% 49% 0% 7% 8% 10%
Male 65+ 5% 0% 0% 0% 0% 0% 0% 51% 4% 5% 6%
Female 65+ 4% 0% 0% 0% 0% 0% 0% 49% 5% 4% 6%
For statistical purposes only, we need to know your total family income before taxes for 2012. Which of the following categories best represents your total family income before taxes? ALL 18-24 25-29 30-34 35-44 45-54 55-64 65+ City Suburb Rural
Less than $35,000 39% 52% 44% 40% 41% 32% 33% 37% 46% 30% 47%
$35,000 to less than $50,000 11% 13% 8% 9% 11% 10% 13% 14% 11% 10% 14%
$50,000 to less than $75,000 19% 16% 20% 25% 14% 22% 20% 17% 18% 20% 19%
$75,000 to less than $100,000 11% 7% 12% 11% 8% 13% 14% 12% 7% 13% 12%
$100,000 to less than $150,000 10% 3% 7% 9% 14% 11% 10% 14% 8% 13% 7%
$150,000 to less than $200,000 7% 5% 5% 2% 10% 9% 8% 6% 8% 10% 0%
$200,000 or more 3% 4% 3% 5% 3% 3% 1% 1% 3% 4% 1%

Appendix: Demographics
67
Q5/Q6. Region ALL 18-24 25-29 30-34 35-44 45-54 55-64 65+ City Suburb Rural
Northeast 26% 23% 28% 21% 27% 21% 32% 25% 23% 28% 24%
Midwest 24% 24% 27% 28% 27% 25% 20% 19% 24% 22% 30%
South 27% 28% 24% 26% 25% 31% 25% 32% 25% 29% 27%
West 23% 24% 21% 24% 21% 22% 23% 24% 28% 21% 18%


