25
Sustainable Brazil Brazil’s perspectives in the agricultural industry

Sustainable BrazilBrazil’s perspectives in the agricultural industry
Introduction 3
What should we expect from agribusiness? 4 Challenges for the Sector 8
Brazil’s Trajectory 13
The Market in 2030 17
Table of Contents

This is the fifth* in a series of publications that analyze the prospects of the Brazilian economy over the next two decades, with special attention to its strategic sectors, determined both based on their importance in wealth creation and the long-term opportunities they represent. In this context, Brazil’s prospects in the agricultural industry, the subject of this publication, occupy a privileged position both due to their importance in generating income and jobs and their role in Brazil’s position in world trade.
The approach takes into account Brazil’s potential in its interactions with the world market in order to outline scenarios through the year 2030. A deep understanding of the behavior of the principal determining factors of the global situation is a prerequisite for valid projections of Brazilian growth. A set of data encompassing a universe of one hundred countries was analyzed, not just in economic terms, but also in terms of demographic dynamics, quality of life, human resources and natural resources. The subjects addressed in the publications are the following:
The potential of the housing market;
Economic growth and consumer potential;
The challenges of the energy market;
The outlook for manufacturing competitiveness;
Brazil’s perspectives in the agricultural industry.
This study, carried out jointly by Ernst & Young Terco and the Getulio Vargas Foundation, also attempts to define the concept of development for Brazil over the coming decades. Thus, this study looks at long-term trends in which the effects of crises like the current one, begun in the US housing market and taking on global dimensions, represent temporary deviations that are smoothed out over the time period considered for the projections.
More important that asking how much the country will grow is asking if it will grow well, leveraging its potential to the maximum, but in a sustainable way. The conditions for this are given, and this publication provides valuable insight into discussions on the perspectives of the Brazilian economy and on corporate planning.
Introduction
*This publication has been produced in 2009. Since then, the Sustainable Brazil series has six publications. The latest survey, titled “Sustainable Brazil - Social and Economic Impacts of the 2014 World Cup”, was launched in 2010.

What should we expect from agribusiness?
Trends Through 2030 Our understanding of the relationship between industrial growth and development has changed significantly in recent decades. Up until the 1970s, progress was synonymous with the presence of automotive, machine and equipment sectors, and agricultural production was considered typical of countries in the initial stages of development. Environmental imperatives and the struggle against social inequality have slowly eroded this view.
Important events in recent years -- such as the depletion of agricultural land in various regions, changes in demographic dynamics, environmental concerns and the search for alternative sources of energy -- have placed agricultural activities in a strategic position in defining the future of national economies and international trade flows. This dynamic has been seen on a global scale, in two large trends.
From the point of view of demand, new consumption habits have appeared, with growing requirements for food safety and the sustained use of natural resources -- a fact
observed notably in developed countries. In emerging economies, the rapid growth of the population’s average income has generated additional pressures on the demand for food. This means that the agricultural industry product market is not only expanding, but has assumed a qualitative profile different than that seen in the past. At the same time, products in the food industry chain have also become alternative energy sources, such as raw materials for biofuels, increasing its strategic role.
The second trend is in the supply of agricultural goods. Technological change has occurred to meet demand, at scales and standards required by the international market. Biotechnology, information technology, business and supply chain management methods are, today, all more relevant technological inputs for the agricultural industry. The case of beef is typical. Sale to richer countries requires detailed identification of the origin of the cattle.
In face of the growing shortage of arable land, a fundamental question for the scenario of the
4 SUSTAINABLE BRAZIL BRAZIL’S PERSPECTIVES IN THE AGRICULTURAL INDUSTRY

The progressive increase in family income, especially in poorer countries, will create millions of new consumers.
coming decades is the ability of technological advances to allow the agricultural industry to respond adequately to the growth and changes in demand. In the case of Brazil, it is crucial that the current agricultural productivity dynamic is identified, along with its prospects for the coming decades.
As seen in the second publication in this series, the world growth profile for the coming decades will be convergent, or in other words, the largest GDP expansion rates will be
seen in countries that, today, have the lowest income levels (such as China and India) or medium income levels (like Mexico and Brazil). This indicates an intense growth in consumption, since the progressive increase in family income, greater in the poorer countries, will result in millions of new consumers. However, the relation between food consumption and income evolution has an additional effect to be considered. The percentage of a family’s total income spent on food will fall as income increases. In rich
countries, consumption of these products is not very sensitive to family income increases.
In general, significant growth in international trade of agricultural products and agricultural raw materials is expected through 2030. But this growth should be less than increases in income and total consumption, which highlights the importance of correct mapping of business opportunities in this segment in the coming decades.
Food expenses* and per capita income in 2007
Per capita income (constant US$)
% of
exp
ense
s sp
ent
on f
ood
Source: Getulio Vargas Foundation, based on FAOStat data. * Food expense data is for 2005
50,00040,00030,00020,00010,0000
0.6
0.5
0.4
0.3
0.2
0.1
Chile
Italy
Japan
BRAZIL
Nigeria
India
Bolivia
PeruSpain
France
Germany
United States

Brazil’s Specialty The agribusiness chain will increase significantly in Brazil.
In 2005, Brazil’s agricultural GDP reached R$ 438 billion, or 23.8% of national income. In richer countries, like the US, agriculture represents only 16.7%. Analyzing the conditioning factors through 2030, two additional aspects deserve emphasis due to their impact on international trade conditions. The first is negotiations on trade barriers imposed on agricultural industry products in different markets. The second is the evolution of climatic changes.
The results of government policies and corporate strategies related to an increase in agricultural
industry productivity will certainly be affected by these two factors. In Brazil, policies to increase biofuel production will be more successful if climate alterations become important and less successful if protectionist practices interfere. Similarly, the expansion in Brazil’s share of the world meat market does not depend exclusively on local efforts to improve the sanitary conditions of national herds, but also on the opening of interesting markets, such as Japan.
Market share indicators allow a first assessment of the current performance of the Brazilian agricultural industry. The competitiveness of a company or an entire sector, especially in the case of the agricultural industry, can be defined as the ability to attain and maintain market share in a sustained,
profitable way, looking at profits with respect to competitors and demand expansion rates.
From 1995 through 2005, for example, Brazil became the world export leader of alcohol and chicken and stayed at the head of the sugar, coffee and orange juice markets. In the case of beef, Brazil advanced significantly, having the second largest share of world exports in 2005, at the same time it lost its leading position in exports of soy oil.
Brazil has achieved significant advances in markets that, in 1995, were considered nontraditional for the agribusiness exporting segment. This is the case of processed food, which had a small export base and grew rapidly in the foreign market. Simultaneously, the less dynamic
0
0.5
1.0
1.5
2.0
Source: Getulio Vargas Foundation
Increase in agricultural and livestock raising productivity between 1960 and 2005
In %
Banglad
esh
BRAZILChin
aInd
ia
Argenti
na
Turke
yIra
n
Guatem
ala
Indon
esia
Ethiop
iaPeru
Nigeria
Canad
a
United
States
Maurit
ius
2.0
1.8
1.5 1.5
1.31.2 1.2
1.11.0
0.9 0.90.8 0.8 0.8
0.7
6 SUSTAINABLE BRAZIL BRAZIL’S PERSPECTIVES IN THE AGRICULTURAL INDUSTRY
sectors correspond to traditional Brazilian exports, like orange juice, soy oil and coffee, whose annual growth rates were small or negative.
Promising Market Shares Planning for government policies for the sector must respond to two decisive questions on the scenario for the Brazilian agricultural industry. Will the performance over the last ten years continue in the coming decades? What are the opportunities and challenges for the sector in the global context?
Assessing the principal players in the food and agricultural raw material sectors, Brazil had the largest productivity gains in the agriculture and livestock raising sector from 1960 to 2005. In this period, productivity rose at a rate of more than 2% annually, a rate greater than that of China (1.8%), India and Argentina (1.5%), the United States and Canada (0.8%).
In recent years, especially since the 1990s, these productivity gains resulted in a deliberate increase in exports, as seen with cellulose, and an increase in the importance of food processing and innovation.
Productivity gains throughout the agricultural industry chain will continue to lead to greater market share, both for processed products and agricultural raw products. Thus, sustaining competitiveness in the sector depends on the capacity to respond to international
market challenges, which requires innovation and technological advantages.
A critical factor affecting agricultural industry performance is the high protectionism levels practiced by important markets, but there is reason for optimism. As discussed in the second publication in this series, the reference scenario of this study forecasts average growth of the Brazilian GDP of 4% annually, and 3.5% annual growth of the world GDP, in a context in which trade flows increase along with pressure for environmentally correct choices. The confluence of these factors lead us to assume greater trade openness, with slow, gradual opening in the coming decades.
As we will describe in more detail in the last chapter, Brazilian agricultural exports will grow at an average annual rate of 1.3% through 2030: 1% per year for processed food and 2% per year for raw materials. These percentages are greater than the annual average growth of world food imports (0.9%) and agricultural raw materials (1.2%), which would imply a continuous increase in Brazil’s market share. Domestic consumption is estimated to expand at a rate of 3.8% through 2030. Taking into consideration that the demand for food is not closely related to increases in family income, consumption should increase 2.9% per year, with an emphasis on protein and processed products.
7

Challenges for the Sector
The Production Chain Estimates of the outlook for the agricultural industry involve assessment of recent performance. This chapter discusses the principal questions in the sector in order to provide a basis for the scenarios and guide corporate planning.
The term agribusiness appeared for the first time at the end of the 1950s, coined by the American economists John H. Davis and Ray A. Goldberg, and refers to all activities related to agriculture and livestock farming and its products in a chain that begins with the production of agricultural inputs, involves activities in the field and manufacturing, and ends with
distribution to the final consumer. This last stage includes the food and retail food sectors. The agricultural industry, the principal object of this study, is one of the links in this chain and includes processing and industrialization of agricultural, livestock and forest products. Primary activities have lost ground in generating value in relation to the country’s agricultural industry sector.
The agricultural industry’s share in the Brazilian GDP grew from 3.8% in 2000 to 4.4% in 2005 according to estimates based on national accounts. This trend is related principally to an increase in eating out, and eating prepared and frozen food. In the United States, for example, the percentage of family expenses spent on food consumed
at home fell from 14.1% in 1970 to 7.5% in 2003; the average for rich countries fell from 22% to 13% during the same period.
This situation is distinct from that seen today in developing countries. In Venezuela and Thailand, for example, the percentage of expenses spent on food eaten at home was about 30% in 2003, which indicates a large potential market for processed food. In Brazil, the percentage of expenses spent on food eaten at home is currently relatively low, at 11.9% in 2005. An analysis of the changes in consumption of Brazilian families, developed in the second publication of this series, projected that this percentage would decrease to 9.7% in 2030.
Suppliers of raw materials
Farming, livestock raising and plant extraction
The agriculturalindustry
Distribution and consumption
The agribusiness chain in Brazil, % of GDP (2005)
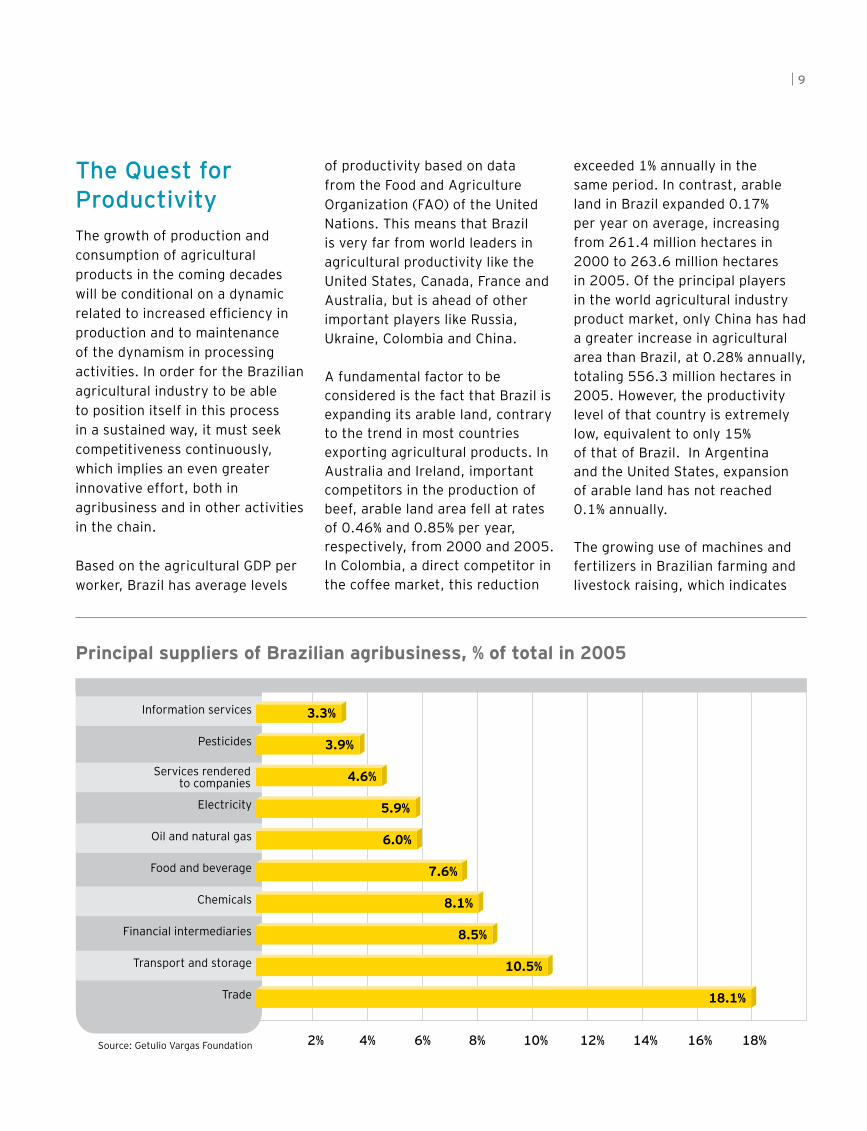
Principal suppliers of Brazilian agribusiness, % of total in 2005
Produtos
Crescimentodas importações
mundiais
Manufaturas
Aço
Produtos químicos
Equipamentos de transporte**
Equipamentos de escritório e telecomunicações
3.7%
5.2%
4.1%
2.7%
7.9%
Crescimento das exportações
brasileiras
Exportações brasileiras em 2030. US$ bilhões
1.8%
1.9%
1.4%
1.5%
2.3%
Source: Getulio Vargas Foundation
15.88
10.72
29.50
5.38
182.67
2.9% 13.3% 4.4% 3.2%
Trade
Transport and storage
Financial intermediaries
Chemicals
Food and beverage
Oil and natural gas
Electricity
Services rendered to companies
Pesticides
Information services
18.1%
10.5%
8.5%
8.1%
7.6%
6.0%
5.9%
4.6%
3.9%
3.3%
2% 4% 6% 8% 10% 12% 14% 16% 18%
8 SUSTAINABLE BRAZIL BRAZIL’S PERSPECTIVES IN THE AGRICULTURAL INDUSTRY
The Quest for Productivity The growth of production and consumption of agricultural products in the coming decades will be conditional on a dynamic related to increased efficiency in production and to maintenance of the dynamism in processing activities. In order for the Brazilian agricultural industry to be able to position itself in this process in a sustained way, it must seek competitiveness continuously, which implies an even greater innovative effort, both in agribusiness and in other activities in the chain. Based on the agricultural GDP per worker, Brazil has average levels
of productivity based on data from the Food and Agriculture Organization (FAO) of the United Nations. This means that Brazil is very far from world leaders in agricultural productivity like the United States, Canada, France and Australia, but is ahead of other important players like Russia, Ukraine, Colombia and China.
A fundamental factor to be considered is the fact that Brazil is expanding its arable land, contrary to the trend in most countries exporting agricultural products. In Australia and Ireland, important competitors in the production of beef, arable land area fell at rates of 0.46% and 0.85% per year, respectively, from 2000 and 2005. In Colombia, a direct competitor in the coffee market, this reduction
exceeded 1% annually in the same period. In contrast, arable land in Brazil expanded 0.17% per year on average, increasing from 261.4 million hectares in 2000 to 263.6 million hectares in 2005. Of the principal players in the world agricultural industry product market, only China has had a greater increase in agricultural area than Brazil, at 0.28% annually, totaling 556.3 million hectares in 2005. However, the productivity level of that country is extremely low, equivalent to only 15% of that of Brazil. In Argentina and the United States, expansion of arable land has not reached 0.1% annually.
The growing use of machines and fertilizers in Brazilian farming and livestock raising, which indicates
Suppliers of raw materials
Farming, livestock raising and plant extraction
The agriculturalindustry
Distribution and consumption
The agribusiness chain in Brazil, % of GDP (2005)
Principal suppliers of Brazilian agribusiness, % of total in 2005
Produtos
Crescimentodas importações
mundiais
Manufaturas
Aço
Produtos químicos
Equipamentos de transporte**
Equipamentos de escritório e telecomunicações
3.7%
5.2%
4.1%
2.7%
7.9%
Crescimento das exportações
brasileiras
Exportações brasileiras em 2030. US$ bilhões
1.8%
1.9%
1.4%
1.5%
2.3%
Source: Getulio Vargas Foundation
15.88
10.72
29.50
5.38
182.67
2.9% 13.3% 4.4% 3.2%
Trade
Transport and storage
Financial intermediaries
Chemicals
Food and beverage
Oil and natural gas
Electricity
Services rendered to companies
Pesticides
Information services
18.1%
10.5%
8.5%
8.1%
7.6%
6.0%
5.9%
4.6%
3.9%
3.3%
2% 4% 6% 8% 10% 12% 14% 16% 18%
9

10
a significant change in production methods. For example, from 2000 to 2005, nitrogen fertilizer use in the country increased from 6.7 to 7.8 metric tons per thousand hectares, an annual growth rate of 5.2%. But Brazil is still far from the intensive use seen in productive countries like Germany, France and Ireland -- and the difference is even more accentuated in comparison with China and the United States.
The Key to the Future Technological innovation is the principal foundation of sustainable competitiveness in all areas of
industrial activity, and the recent performance of the Brazilian agricultural industry proves this. The most successful and most promising segments are those that better interact with the international competitive environment, with a quest for state-of-the-art technology, either in relation to products, production processes, or management techniques.
However, the Brazilian agricultural industry is not seen as a great generator of innovation. According to data from the Industrial Survey of Technological Innovation (Pintec-IBGE/2005), only one
third of companies in the food industry implemented innovations in products and processes between 2003 and 2005. In this last year, the money spent by these companies on innovative activities was on the order of 1.7% of their net revenues and, specifically on internal R&D activities, spending was just a tad over 0.1% of revenues -- a level corresponding to one sixth of a percent of that of the Brazilian manufacturing industry as a whole. In the United States, spending on R&D for all manufacturers was 3.6% of net sales -- in the food and wood industries, for example, spending was 0.7% and 0.8%, respectively.
R&D spending as a proportion of sales, 2005 (%)
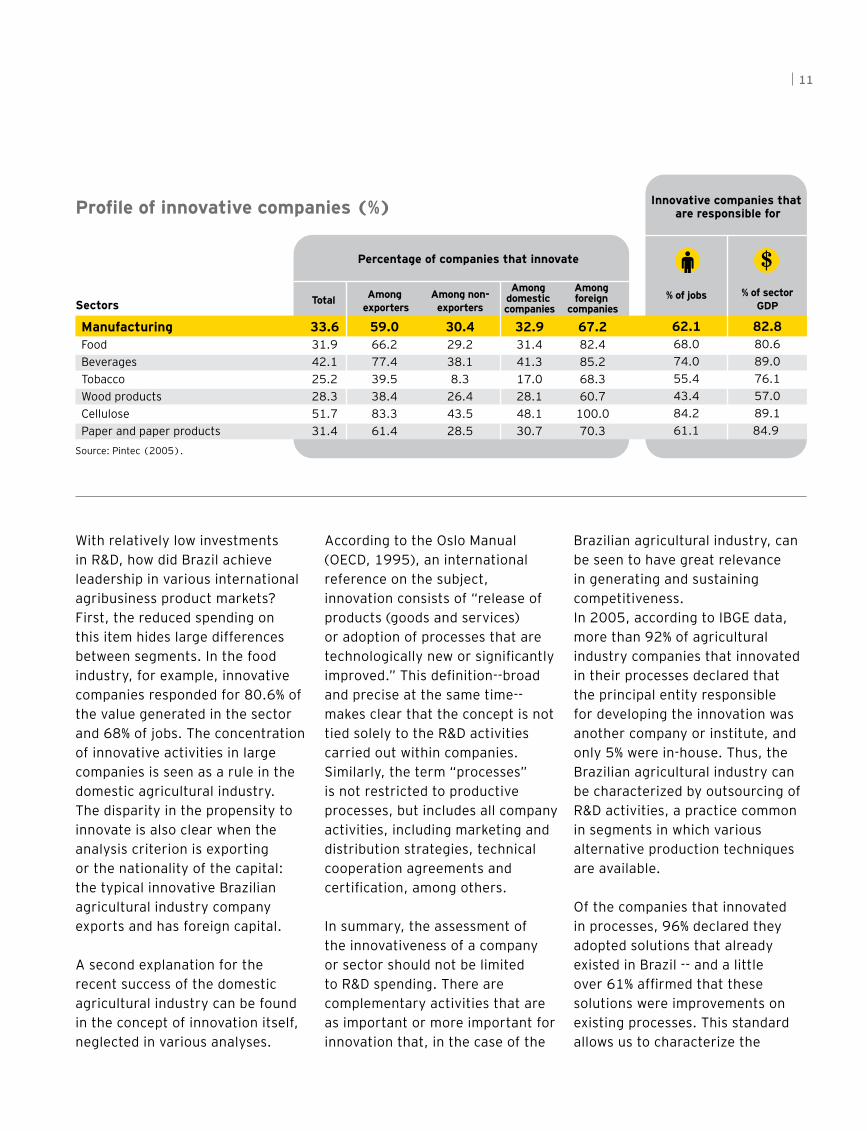
Profile of innovative companies (%)
Source: Pintec (2005).
Source: Pintec (2005). Eurostat and National Science Foundation. Division of Science Resources Statistics (2007). (*) Beverages and tobacco together.
Manufacturing
Food
Beverages
Tobacco
Cellulose and paper
Wood products
ManufacturingFoodBeveragesTobaccoWood productsCellulosePaper and paper products
0.1
0.1
0.2
0.2
0.1
1.5
0.5
0.9
0.5
n.a.
Percentage of companies that innovate
33.631.942.125.228.351.731.4
Total
59.066.277.439.538.483.361.4
Among exporters
30.429.238.18.3
26.443.528.5
Among non-exporters
32.931.441.317.028.148.130.7
Among domestic companies
67.282.485.268.360.7
100.070.3
Among foreign
companiesSectors
Sectors
Innovative companies that are responsible for
% of jobs
62.168.074.055.443.484.261.1
% of sector GDP
82.880.689.076.157.089.184.9
0.7
0.7*
n.a.
0.8
0.6
3.6
5.1
Brazil
United States
Europe
SUSTAINABLE BRAZIL BRAZIL’S PERSPECTIVES IN THE AGRICULTURAL INDUSTRY
11
With relatively low investments in R&D, how did Brazil achieve leadership in various international agribusiness product markets? First, the reduced spending on this item hides large differences between segments. In the food industry, for example, innovative companies responded for 80.6% of the value generated in the sector and 68% of jobs. The concentration of innovative activities in large companies is seen as a rule in the domestic agricultural industry. The disparity in the propensity to innovate is also clear when the analysis criterion is exporting or the nationality of the capital: the typical innovative Brazilian agricultural industry company exports and has foreign capital.
A second explanation for the recent success of the domestic agricultural industry can be found in the concept of innovation itself, neglected in various analyses.
According to the Oslo Manual (OECD, 1995), an international reference on the subject, innovation consists of “release of products (goods and services) or adoption of processes that are technologically new or significantly improved.” This definition--broad and precise at the same time--makes clear that the concept is not tied solely to the R&D activities carried out within companies. Similarly, the term “processes” is not restricted to productive processes, but includes all company activities, including marketing and distribution strategies, technical cooperation agreements and certification, among others.
In summary, the assessment of the innovativeness of a company or sector should not be limited to R&D spending. There are complementary activities that are as important or more important for innovation that, in the case of the
Brazilian agricultural industry, can be seen to have great relevance in generating and sustaining competitiveness. In 2005, according to IBGE data, more than 92% of agricultural industry companies that innovated in their processes declared that the principal entity responsible for developing the innovation was another company or institute, and only 5% were in-house. Thus, the Brazilian agricultural industry can be characterized by outsourcing of R&D activities, a practice common in segments in which various alternative production techniques are available.
Of the companies that innovated in processes, 96% declared they adopted solutions that already existed in Brazil -- and a little over 61% affirmed that these solutions were improvements on existing processes. This standard allows us to characterize the
R&D spending as a proportion of sales, 2005 (%)
Profile of innovative companies (%)
Source: Pintec (2005).
Source: Pintec (2005). Eurostat and National Science Foundation. Division of Science Resources Statistics (2007). (*) Beverages and tobacco together.
Manufacturing
Food
Beverages
Tobacco
Cellulose and paper
Wood products
ManufacturingFoodBeveragesTobaccoWood productsCellulosePaper and paper products
0.1
0.1
0.2
0.2
0.1
1.5
0.5
0.9
0.5
n.a.
Percentage of companies that innovate
33.631.942.125.228.351.731.4
Total
59.066.277.439.538.483.361.4
Among exporters
30.429.238.18.3
26.443.528.5
Among non-exporters
32.931.441.317.028.148.130.7
Among domestic companies
67.282.485.268.360.7
100.070.3
Among foreign
companiesSectors
Sectors
Innovative companies that are responsible for
% of jobs
62.168.074.055.443.484.261.1
% of sector GDP
82.880.689.076.157.089.184.9
0.7
0.7*
n.a.
0.8
0.6
3.6
5.1
Brazil
United States
Europe
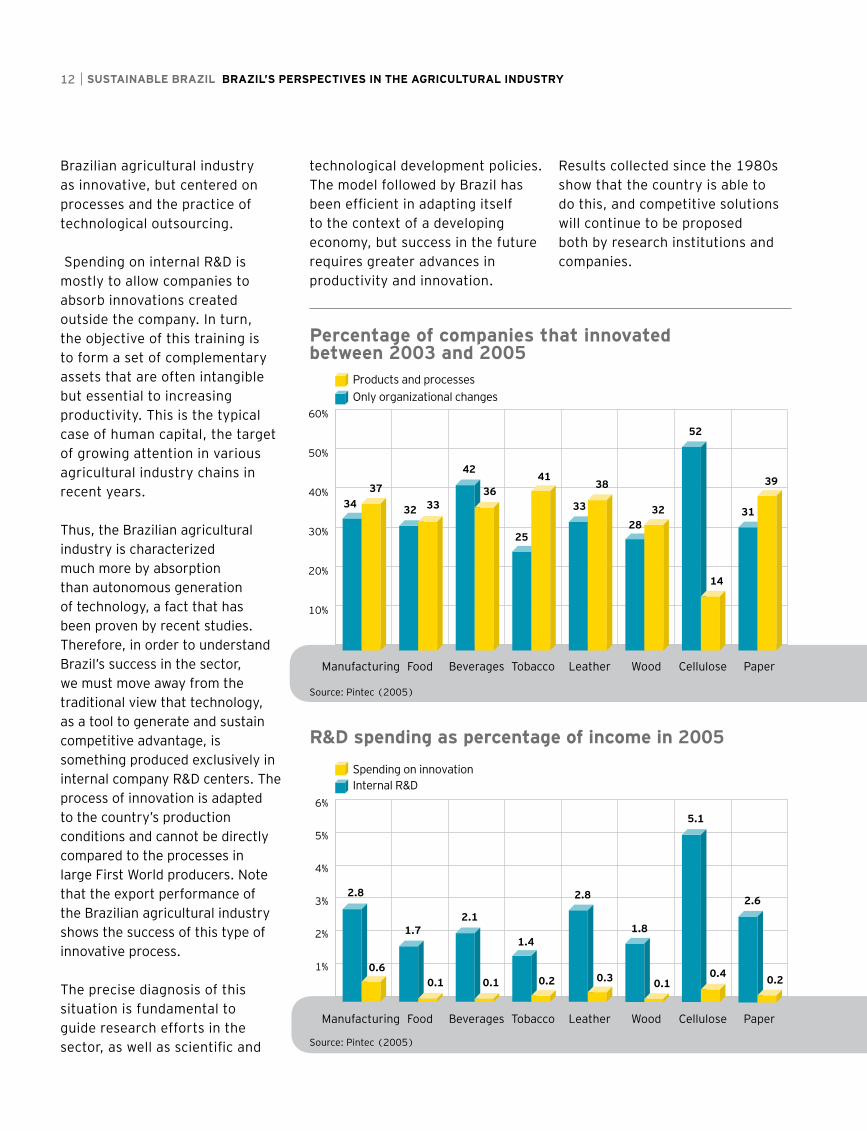
Brazilian agricultural industry as innovative, but centered on processes and the practice of technological outsourcing. Spending on internal R&D is mostly to allow companies to absorb innovations created outside the company. In turn, the objective of this training is to form a set of complementary assets that are often intangible but essential to increasing productivity. This is the typical case of human capital, the target of growing attention in various agricultural industry chains in recent years.
Thus, the Brazilian agricultural industry is characterized much more by absorption than autonomous generation of technology, a fact that has been proven by recent studies. Therefore, in order to understand Brazil’s success in the sector, we must move away from the traditional view that technology, as a tool to generate and sustain competitive advantage, is something produced exclusively in internal company R&D centers. The process of innovation is adapted to the country’s production conditions and cannot be directly compared to the processes in large First World producers. Note that the export performance of the Brazilian agricultural industry shows the success of this type of innovative process.
The precise diagnosis of this situation is fundamental to guide research efforts in the sector, as well as scientific and
Percentage of companies that innovated between 2003 and 2005
R&D spending as percentage of income in 2005
Source: Pintec (2005)
Source: Pintec (2005)
10%
20%
30%
40%
50%
60%
PaperCelluloseWoodLeatherTobaccoBeveragesFoodManufacturing
PaperCelluloseWoodLeatherTobaccoBeveragesFoodManufacturing
1%
2%
3%
4%
5%
6%
Spending on innovation Internal R&D
Products and processes Only organizational changes
3437
32 33
42
36
25
41
33
38
2832
52
14
31
39
2.8
0.6
1.7
0.1
2.1
0.1
1.4
0.2
2.8
0.3
1.8
0.1
5.1
0.4
2.6
0.2
technological development policies. The model followed by Brazil has been efficient in adapting itself to the context of a developing economy, but success in the future requires greater advances in productivity and innovation.
Results collected since the 1980s show that the country is able to do this, and competitive solutions will continue to be proposed both by research institutions and companies.
12 SUSTAINABLE BRAZIL BRAZIL’S PERSPECTIVES IN THE AGRICULTURAL INDUSTRY

Brazil’s Trajectory
Notable Advances The country’s world agricultural industry exports increased sharply in recent years. In 1995, Brazil occupied the 9th position in the global ranking, responsible for less than 3% of world exports. In 2005, the last year with complete data,
Brazil’s share had increased to 4.8%, placing it in 4th position.
This performance was sustained by an agricultural industry export growth rate of 10.2% per year on average during the period. This was the largest growth rate among the principal players in the market
and more than double the world average of 4.4%.
But does this allow us to call the Brazilian agricultural industry competitive? Is this level of competitiveness sustainable?
In the economics literature, the
2005
The 20 largest agricultural exporters:market share and annual growth, 1995-2005
Source: FAOStat
United StatesFranceNetherlandsBrazilSpainItalyCanadaAustraliaChinaArgentinaMexicoIrelandIndiaTurkeyUkraineChileSouth AfricaRussiaGreeceColombia
14.0%8.0%6.9%2.8%
2.9%3.4%3.2%3.0%3.6%2.3%1.4%1.9%1.1%1.1%0.5%0.5%0.7%0.5%0.8%0.8%
Country Average annual growth (%)1995
(%) of world market
1
2
3
4
5
6
7
8
9
10
11
12
13
14
15
16
17
18
19
20
1
2
3
9
8
5
6
7
4
10
12
11
13
14
19
18
17
20
16
15
10.2%7.4%6.8%4.8%
3.9%3.9%3.7%3.3%3.0%2.5%1.8%1.6%1.2%1.1%0.7%0.7%0.7%0.6%0.6%0.6%
1.2%
3.5%
4.3%
10.2%
7.3%
5.7%
6.0%
5.5%
2.8%
5.0%
7.0%
2.9%
5.3%
4.7%
8.8%
8.5%
4.2%
7.6%
1.4%
0.9%
13

discussion of a precise definition of competitiveness is vast and sometimes inconclusive. Recently, a practical approach to the question has been adopted, defining competitiveness, both in a sector and of each company individually, as the ability to attain, and sustainability and profitably maintain market share. The performance of the Brazilian agricultural industry clearly reveals a marked presence in the international markets.
In recent years, performance has not been tied to specific economic policies, as occurred in the 1980s with the large devaluations of the national currency and the abundant supply of official credits. From 1995-2005, there were important changes in economic policy and, especially after 2003, a currency valuation process has taken place without interrupting the increase in the Brazilian share.
Opportunities and Challenges The dynamics of international food and agricultural raw material markets is marked by two trends, based both on the needs of consumers in the developed world and by the large increase in consumption in developing countries. The appearance of new food consumption habits -- due to the growing concerns related to nutritional aspects and the greater awareness of consumers of sustained use of natural resources -- is the driver of this market in
developed countries. In poorer countries, the trend is different. The rapid growth of the average family income in economies with large populations, such as China and India, has resulted in large numbers of new consumers, a process also observed in Brazil, both in poorer regions like the Northeast and on the periphery of large metropolises in the Southeast. These new consumers frequently prefer food products with a higher level of processing, to the detriment of natural items. As a consequence of this process, the agricultural industry product market is not only expanding, but changing qualitatively.
In terms of supply, an increase in efforts towards efficiency and sustained competitiveness through technology is strategic. This has been the response of agricultural industry companies to the new demand trends, at the scale and standards demanded by the international market. Technology has entered the agricultural industry chain in different segments, including biotechnology, generating strategic inputs such as altered seeds, and information technology and methods for company and supply chain management, which are essential to distribution efficiency. In various situations, the adoption of technical innovations is an explicit requirement to entering various food and agricultural raw material markets.
14 SUSTAINABLE BRAZIL BRAZIL’S PERSPECTIVES IN THE AGRICULTURAL INDUSTRY

From the point of view of the Brazilian agricultural industry and that of developing countries in general, add to these trends a third factor: protectionist trade barriers. Various agricultural industry products, from beef to fuel alcohol, are faced with various barriers in very important markets such as the United States, Japan and Europe.
The response of Brazilian companies to the challenges and the current dynamic in the food and agricultural raw material market has been adequate. Its advance in the international markets is proof of this. However, the protectionist policies of developed countries could represent an obstacle to free competition in the coming decades. The establishment of more obstacles to agricultural industry product trade, for example, would mean a setback in relation to the general objective of balanced world trade enabling underdeveloped and developing countries to enter the world scenario under better conditions.
New elements appear in the international debate on the flow of goods from agribusiness. Products that previously belonged to the food industry are now seen as clean, renewable energy sources in the form of biofuels, a fact that alters their strategic role both for producing and consuming countries, and the energy question becomes more important as awareness of the environmental problem grows.
The increase in agricultural products seen recently shows how controversial the subject is. The use of areas traditionally dedicated to food production may influence the world supply of food. But the pressure for clean, renewable energy alternatives is a determining factor in the fight against developed countries’ agricultural trade barriers, and could open markets for primary products from third world economies. In this context, Brazil’s position is very favorable because it has average agricultural productivity and fertilizer use levels. Thus, an increase in the supply of biofuels does not necessarily represent a threat to food production, since the earth’s productivity can be increased relatively easily.
Reference Assumptions As we have seen, the question of the sustained competitiveness of Brazilian agribusiness rests on two pillars that are fundamental for the creation of the scenarios: the continuity in efficiency gains throughout the chain and the increased access to large, dynamic markets. In relation to efficiency, Brazilian agriculture and livestock raising is seeing a progressive rise in investment rate similar to that of the overall economy through 2030, increasing its level of mechanization, use of information technology and improvements in production and distribution methods.
15

If the agricultural industry maintains its innovation through technological outsourcing, it will continue to increase its share of the added value of the agribusiness chain, responding satisfactorily both to the growing environmental and nutritional demands of consumers in developed countries and the growing volumes of food demanded by developing countries. The increased awareness of the environmental dynamic will continue to highlight the importance of alternative sources of energy and the non-predatory production of food. The dynamism revealed by the position of the Brazilian agricultural industry in international markets in the last decade is a basis for these affirmations.
In contrast, protectionism should be treated with relative
conservatism. The reference hypothesis is that current trade barrier levels, whether explicit or not, will lower slowly during the period of our projections. There are no elements in the current international negotiation dynamics that would allow us to be more optimistic.
In the projections presented below, whether or not Brazil is able to sustain agricultural industry competitiveness in international markets will depend much more on increases in productivity throughout the chain than greater access to markets. And, even if the conservative hypothesis on the degree of protectionism is unnecessary due to greater openness, access to these markets would be expected to benefit the large players in a relatively homogeneous way.
16 SUSTAINABLE BRAZIL BRAZIL’S PERSPECTIVES IN THE AGRICULTURAL INDUSTRY
The Market in 2030
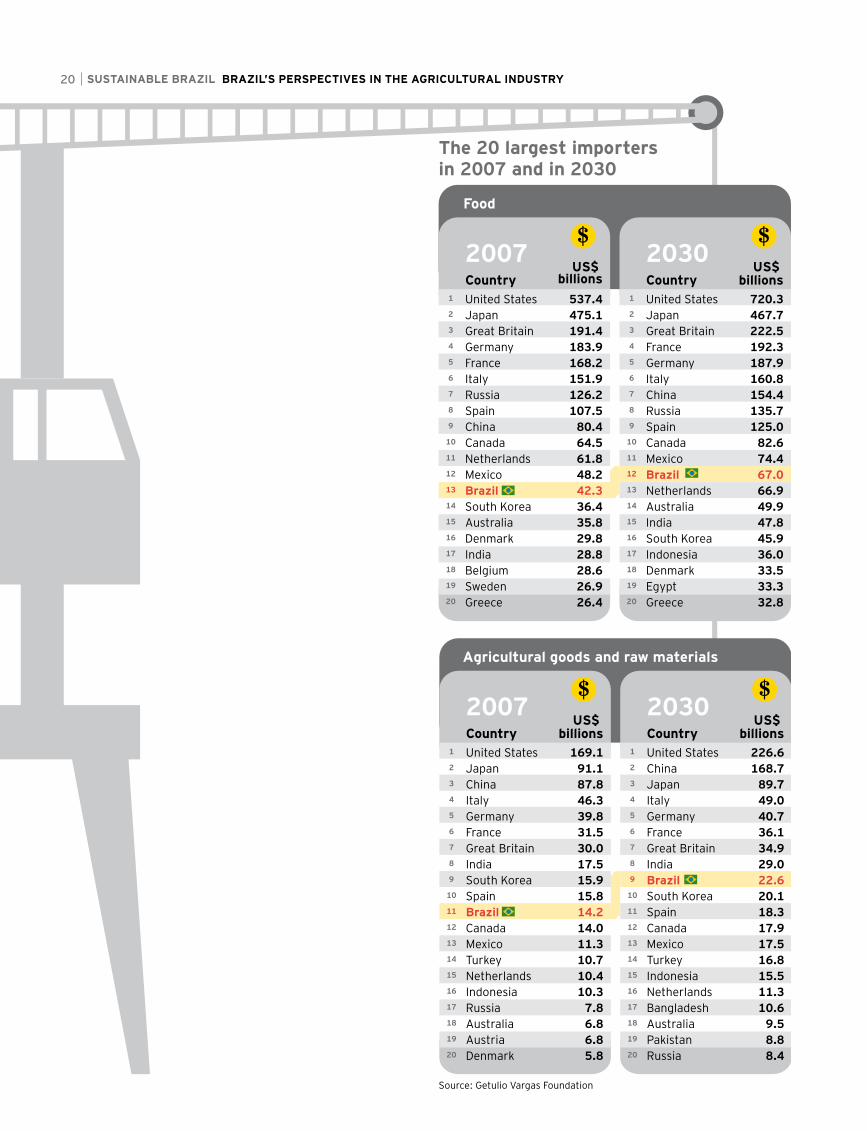
Large Importers
Between 1990 and 2007, world food imports grew 7.8%, or 0.4% per year. Growth was much greater in countries with large populations and rapid economic growth, like India (5.9%) and China (3.4%). In absolute terms, however, these countries are responsible for relatively low percentages of total food imports: 1.2% and 3.6%, respectively, in 2007. Currently, the large importers are the United States (18.7%) and Japan (16.5%), followed at a distance by the United Kingdom (6.7%), Germany (6.4%) and France (5.8%).
On the horizon through 2030, projections for world imports of food and agricultural raw materials, based on the reference scenario in this study, indicate a loss of share relative to most rich countries except the United States, accompanied by a gain by countries like China, India and Brazil.
The profile of the agricultural raw materials market is different from that of food. From 1990 through 2007, world imports fell 1.4% annually. In Brazil, these imports fell 2.2% annually. Countries such as China and India had inverse
trends, with an annual growth of 1.5% and 1% during the period, respectively. The concentration in the international market is even greater than in the case of food. The United States, Japan and China together were responsible for almost 50% of imports of agricultural raw materials in 2007.
According to the reference scenario, these market shares should change in the coming decades. The United States is expected to maintain its current share of 23%. Japan’s share, however, should decrease from 12.5% to 9.5%, typical of most rich countries. China’s share will increase drastically, from 12% to 17.4% of world imports of agricultural raw materials.
There are two general trends in the international market of agricultural industry products:
Food imports should grow more in populous, emerging countries -- notably China and India -- that, through 2030, will see increases in per capita income and the number of new consumers. However, in absolute terms, markets in rich countries like the United States and Japan will remain important. Even rapid Chinese growth from 2007
to 2030 will not cause it to pass countries like Italy and it will remain in 7th position in the ranking of the largest importers.
In the agricultural raw materials market, although the performance of poorer countries is still more favorable, the United States will maintain a share of almost one forth of world imports. China, however, will rise to second position in the ranking, responsible for 17.5% of the demand on the international market.
Thus, companies in the market must be prepared to supply emerging countries without neglecting the large markets of the rich countries, which will continue to be important importers, especially of high-value-added products.
Distinct DynamicsHaving presented the general outline of the scenario through 2030, which factors explain the contrast between the dynamics of the international markets of food and agricultural raw materials? As a rule, imports of agricultural raw materials such as leather,
17
Growth of agricultural industry exports
Growth of food exports
Growth of agricultural raw material exports
* At 2005 prices
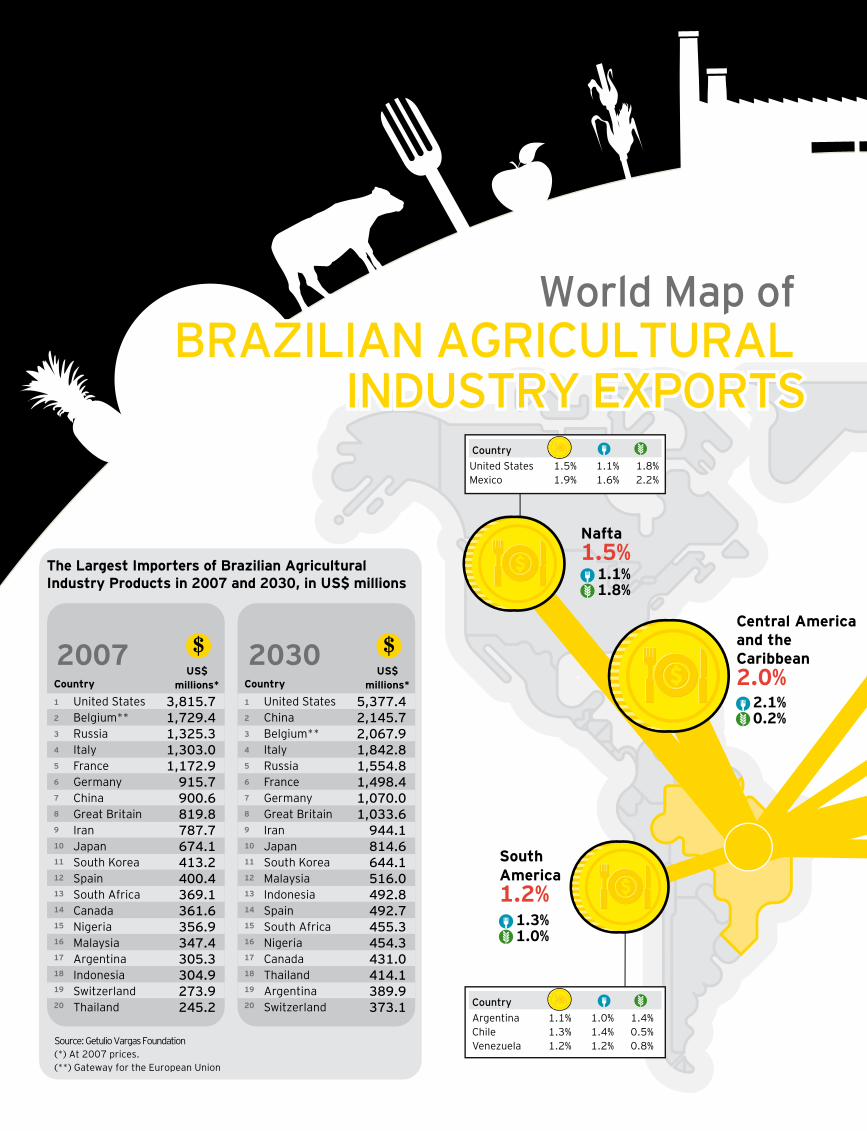
World Map of BRAZILIAN AGRICULTURAL
INDUSTRY EXPORTS
World Map of BRAZILIAN AGRICULTURAL
INDUSTRY EXPORTS
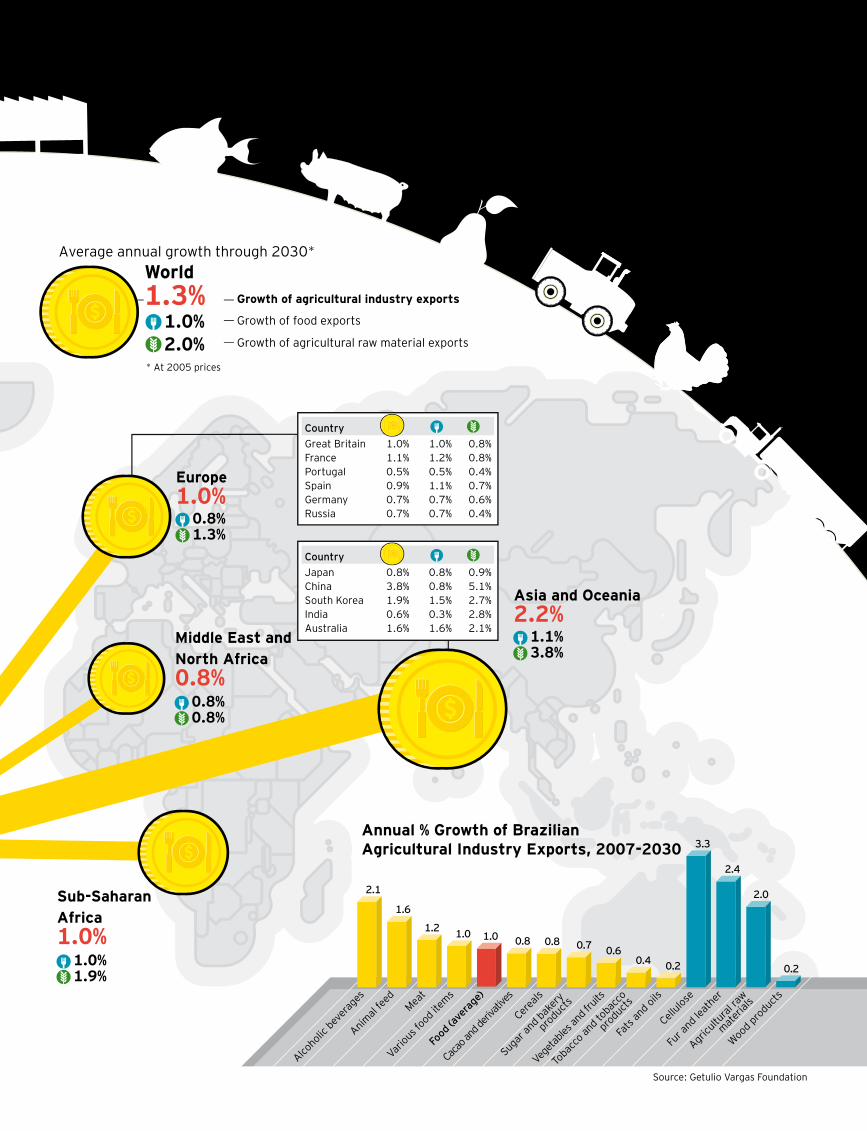
Average annual growth through 2030*
1.0% 2.0%
World1.3%
The Largest Importers of Brazilian Agricultural Industry Products in 2007 and 2030, in US$ millions
2030Country
US$ millions*
1
2
3
4
5
6
7
8
9
10
11
12
13
14
15
16
17
18
19
20
United StatesChinaBelgium**ItalyRussiaFranceGermanyGreat BritainIranJapanSouth KoreaMalaysiaIndonesiaSpainSouth AfricaNigeriaCanadaThailandArgentinaSwitzerland
5,377.4 2,145.7 2,067.9 1,842.8 1,554.8 1,498.4 1,070.0 1,033.6
944.1 814.6 644.1 516.0 492.8 492.7 455.3 454.3 431.0 414.1 389.9 373.1
2007Country
US$ millions*
1
2
3
4
5
6
7
8
9
10
11
12
13
14
15
16
17
18
19
20
United StatesBelgium**RussiaItalyFranceGermanyChinaGreat BritainIranJapanSouth KoreaSpainSouth AfricaCanadaNigeriaMalaysiaArgentinaIndonesiaSwitzerlandThailand
3,815.7 1,729.4 1,325.3 1,303.0 1,172.9
915.7 900.6 819.8 787.7 674.1 413.2 400.4 369.1 361.6 356.9 347.4 305.3 304.9 273.9 245.2
Annual % Growth of Brazilian Agricultural Industry Exports, 2007-2030
ArgentinaChileVenezuela
1.1%1.3%1.2%
1.0%1.4%1.2%
1.4%0.5%0.8%
Country
Great BritainFrancePortugalSpainGermanyRussia
1.0%1.1%0.5%0.9%0.7%0.7%
1.0%1.2%0.5%1.1%0.7%0.7%
0.8%0.8%0.4%0.7%0.6%0.4%
Country
JapanChinaSouth KoreaIndiaAustralia
0.8%3.8%1.9%0.6%1.6%
0.8%0.8%1.5%0.3%1.6%
0.9%5.1%2.7%2.8%2.1%
Country
United States Mexico
1.5%1.9%
1.1%1.6%
1.8%2.2%
Country
0.8% 1.3%
Europe 1.0%
1.1% 3.8%
Asia and Oceania 2.2%
0.8% 0.8%
Middle East and North Africa 0.8%
1.0% 1.9%
Sub-Saharan Africa 1.0%
1.3% 1.0%
South America1.2%
2.1% 0.2%
Central America and the Caribbean2.0%
1.1% 1.8%
Nafta1.5%
Alcoholic
bevera
ges
Animal
feed
Meat
Various f
ood items
Food
(ave
rage
)
Cacao a
nd de
rivati
ves
Cereals
Sugar an
d bakery
products
Vegeta
bles a
nd fr
uits
Toba
cco an
d toba
cco
products
Fats
and oils
Cellulose
Fur a
nd leath
er
Wood products
2.1
1.6
1.2 1.0 1.0 0.8 0.8 0.7 0.60.4 0.2
3.3
2.4
2.0
0.2
Agricultu
ral ra
w
mate
rials
Source: Getulio Vargas Foundation(*) At 2007 prices.(**) Gateway for the European Union
Growth of agricultural industry exports
Growth of food exports
Growth of agricultural raw material exports
* At 2005 prices
World Map of BRAZILIAN AGRICULTURAL
INDUSTRY EXPORTS
World Map of BRAZILIAN AGRICULTURAL
INDUSTRY EXPORTS
Average annual growth through 2030*
1.0% 2.0%
World1.3%
The Largest Importers of Brazilian Agricultural Industry Products in 2007 and 2030, in US$ millions
2030Country
US$ millions*
1
2
3
4
5
6
7
8
9
10
11
12
13
14
15
16
17
18
19
20
United StatesChinaBelgium**ItalyRussiaFranceGermanyGreat BritainIranJapanSouth KoreaMalaysiaIndonesiaSpainSouth AfricaNigeriaCanadaThailandArgentinaSwitzerland
5,377.4 2,145.7 2,067.9 1,842.8 1,554.8 1,498.4 1,070.0 1,033.6
944.1 814.6 644.1 516.0 492.8 492.7 455.3 454.3 431.0 414.1 389.9 373.1
2007Country
US$ millions*
1
2
3
4
5
6
7
8
9
10
11
12
13
14
15
16
17
18
19
20
United StatesBelgium**RussiaItalyFranceGermanyChinaGreat BritainIranJapanSouth KoreaSpainSouth AfricaCanadaNigeriaMalaysiaArgentinaIndonesiaSwitzerlandThailand
3,815.7 1,729.4 1,325.3 1,303.0 1,172.9
915.7 900.6 819.8 787.7 674.1 413.2 400.4 369.1 361.6 356.9 347.4 305.3 304.9 273.9 245.2
Annual % Growth of Brazilian Agricultural Industry Exports, 2007-2030
ArgentinaChileVenezuela
1.1%1.3%1.2%
1.0%1.4%1.2%
1.4%0.5%0.8%
Country
Great BritainFrancePortugalSpainGermanyRussia
1.0%1.1%0.5%0.9%0.7%0.7%
1.0%1.2%0.5%1.1%0.7%0.7%
0.8%0.8%0.4%0.7%0.6%0.4%
Country
JapanChinaSouth KoreaIndiaAustralia
0.8%3.8%1.9%0.6%1.6%
0.8%0.8%1.5%0.3%1.6%
0.9%5.1%2.7%2.8%2.1%
Country
United States Mexico
1.5%1.9%
1.1%1.6%
1.8%2.2%
Country
0.8% 1.3%
Europe 1.0%
1.1% 3.8%
Asia and Oceania 2.2%
0.8% 0.8%
Middle East and North Africa 0.8%
1.0% 1.9%
Sub-Saharan Africa 1.0%
1.3% 1.0%
South America1.2%
2.1% 0.2%
Central America and the Caribbean2.0%
1.1% 1.8%
Nafta1.5%
Alcoholic
bevera
ges
Animal
feed
Meat
Various f
ood items
Food
(ave
rage
)
Cacao a
nd de
rivati
ves
Cereals
Sugar an
d bakery
products
Vegeta
bles a
nd fr
uits
Toba
cco an
d toba
cco
products
Fats
and oils
Cellulose
Fur a
nd leath
er
Wood products
2.1
1.6
1.2 1.0 1.0 0.8 0.8 0.7 0.60.4 0.2
3.3
2.4
2.0
0.2
Agricultu
ral ra
w
mate
rials
Source: Getulio Vargas Foundation(*) At 2007 prices.(**) Gateway for the European Union
Source: Getulio Vargas Foundation
United StatesChinaJapanItalyGermanyFranceGreat BritainIndiaBrazilSouth KoreaSpainCanadaMexicoTurkeyIndonesiaNetherlandsBangladeshAustraliaPakistanRussia
226.6168.7
89.749.040.736.134.929.022.620.118.317.917.516.815.511.310.6
9.58.88.4
CountryUS$
billions
20301
2
3
4
5
6
7
8
9
10
11
12
13
14
15
16
17
18
19
20
Food
Agricultural goods and raw materials
United StatesJapanGreat BritainGermanyFranceItalyRussiaSpainChinaCanadaNetherlandsMexicoBrazilSouth KoreaAustraliaDenmarkIndiaBelgiumSwedenGreece
537.4475.1191.4183.9168.2151.9126.2107.5
80.464.561.848.242.336.435.829.828.828.626.926.4
CountryUS$
billions2007
1
2
3
4
5
6
7
8
9
10
11
12
13
14
15
16
17
18
19
20
United States JapanGreat Britain FranceGermanyItalyChinaRussiaSpainCanadaMexicoBrazilNetherlandsAustraliaIndiaSouth Korea IndonesiaDenmarkEgyptGreece
720.3467.7222.5192.3187.9160.8154.4135.7125.0
82.674.467.066.949.947.845.936.033.533.332.8
CountryUS$
billions
20301
2
3
4
5
6
7
8
9
10
11
12
13
14
15
16
17
18
19
20
United StatesJapanChinaItalyGermanyFranceGreat BritainIndiaSouth KoreaSpainBrazilCanadaMexicoTurkeyNetherlandsIndonesiaRussiaAustraliaAustriaDenmark
169.191.187.846.339.831.530.017.515.915.814.214.011.310.710.410.3
7.86.86.85.8
CountryUS$
billions
20071
2
3
4
5
6
7
8
9
10
11
12
13
14
15
16
17
18
19
20
Source: Getulio Vargas Foundation
The 20 largest importers in 2007 and in 2030
20 SUSTAINABLE BRAZIL BRAZIL’S PERSPECTIVES IN THE AGRICULTURAL INDUSTRY

cellulose and alcohol should rise more than food. This relatively favorable performance is explained by two factors.
Firstly, we assumed a moderate reduction in trade barriers in rich countries, a fact that tends to benefit some of the more important segments in this market, driving world trade. Additionally, the global demand for these products responds slower to an increase in income, especially in poorer countries. In these poorer economies, growth should occur with increased family income and and higher degrees of urbanization. These processes
also generate growing demand for processed food, energy, and for packaging and products from the graphics industry.
The growth rate of real salaries from 2007 through 2030 will be slower in countries like Japan (1.1%) and greater in countries like Brazil (2.5%), South Korea (2.8%) and China (6.2%).
The apparent exception to the rule is the United States, whose annual salary growth rate will remain high in relation to the standard of rich countries (1.6% annually), without the demand for agricultural raw materials growing faster than the
world average through 2030. This situation can be explained by the lack of increases in urbanization and changes in consumption habits seen in developing countries.
It is relatively easy to understand the reasons why world food imports are expected to grow slower than family consumption. Food consumption grows less strongly with increases in income as families increase their standard of living. This process generates fewer impacts on the demand for food than on general consumption levels. As a result of this trend, family consumption should grow worldwide at 2.8% per year from
Worldwide family consumption should grow on average 2.8% yearly through 2030, compared to an increase in food imports of only 0.9% annually.
The market for food, beverages and tobacco in 2007 and 2030By income class, (%) of total
Income under R$ 1,000
From R$ 1,000 to R$ 2,000
From R$ 2,000 to R$ 4,000
From R$ 4,000 to R$ 8,000
From R$ 8,000 to R$ 16,000
From R$ 16,000to R$ 32,000
More than R$ 32,000
Source: Getulio Vargas Foundation (*) At 2007 prices
5%
10%
15%
20%
25%
30%
35%
29.0%26.9%
21.6%
13.0%
6.7%
2.4%0.3%
12.5%
21.7%
25.7%
19.6%
12.5%
6.8% 1.3%
20072030

2007 to 2030, but food imports should grow at about 1% annually. In Brazil, despite the projected increase in the GDP (4.0% yearly) and in food consumption (2.9% yearly), food imports will increase at lower rates (2.0% yearly) as a result of the good performance of domestic agricultural and livestock production and the agricultural industry.
22
World Import Map
Annual growth through 2030
Region/CountryEurope
Great BritainFrancePortugalSpainGermanyRussia
NAFTA United States MexicoCentral America and the CaribbeanSouth America Argentina Brazil Chile VenezuelaAsia and Oceania Japan China South Korea India AustraliaSub-Saharan AfricaMiddle East and North AfricaWorld
0.4%0.6%0.6%0.2%0.6%0.0%0.3%1.2%1.4%1.8%1.6%1.9%1.5%2.0%1.7%1.9%1.2%
-0.1%3.1%0.5%2.9%1.3%2.4%1.7%1.0%
0.5%0.7%0.6%0.2%0.7%0.1%0.3%1.3%1.3%1.9%1.5%1.9%1.5%2.0%1.8%1.9%0.9%
-0.1%2.9%1.0%2.2%1.4%2.3%1.6%1.0%
0.3%0.5%0.6%0.1%0.1%
-0.3%-0.4%0.7%0.6%1.6%1.8%1.9%1.6%2.0%1.3%1.8%2.1%
-0.5%3.3%
-1.1%3.8%0.4%3.1%2.2%1.2%
The agricultural industry Food Agricultural raw
materials
Source: Getulio Vargas Foundation
Domestic DemandThe tendency of the demand for food increasing slower than increases in income can be seen on a smaller scale in Brazil since there are income ranges in which food consumption does not adequately satisfy nutritional necessities. Through 2030, we estimate that
the Brazilian GDP will increase at a rate of 4.0% annually and average income at 3.1% annually. At the same time, worldwide family consumption will grow 3.8% yearly. Food consumption is projected to increase only 3.0% annually (2.5% for unprocessed foods and 3.1% for processed food). This means that, taking into account the country and its various income ranges, for each 10% increase in the GDP, food consumption should increase 7.5%. Note, however, that these estimates hide large differences when products and income ranges are analyzed in detail.
For example, considering the worldwide consumption of food for all family income ranges, for each 10% increase in income, the demand for sugar increases only 0.7%. However, the demand for beef increases 6.7% in the same situation. This is because increases in income change family food consumption habits.
The reference scenario estimates that the lowest family income ranges (up to R$ 1,000 and from R$ 1,000 to R$ 2,000, in 2007 values) will slowly rise into average total consumption levels due to the slow increase in family income. The large consumption growth rates of the intermediate ranges, projected through 2030, should drive a standard of food consumption more concentrated on protein, to the detriment of carbohydrates and fats. The domestic demand for protein-rich foods will grow at slower rates. There will be important growth in per capita consumption of items such as
SUSTAINABLE BRAZIL BRAZIL’S PERSPECTIVES IN THE AGRICULTURAL INDUSTRY
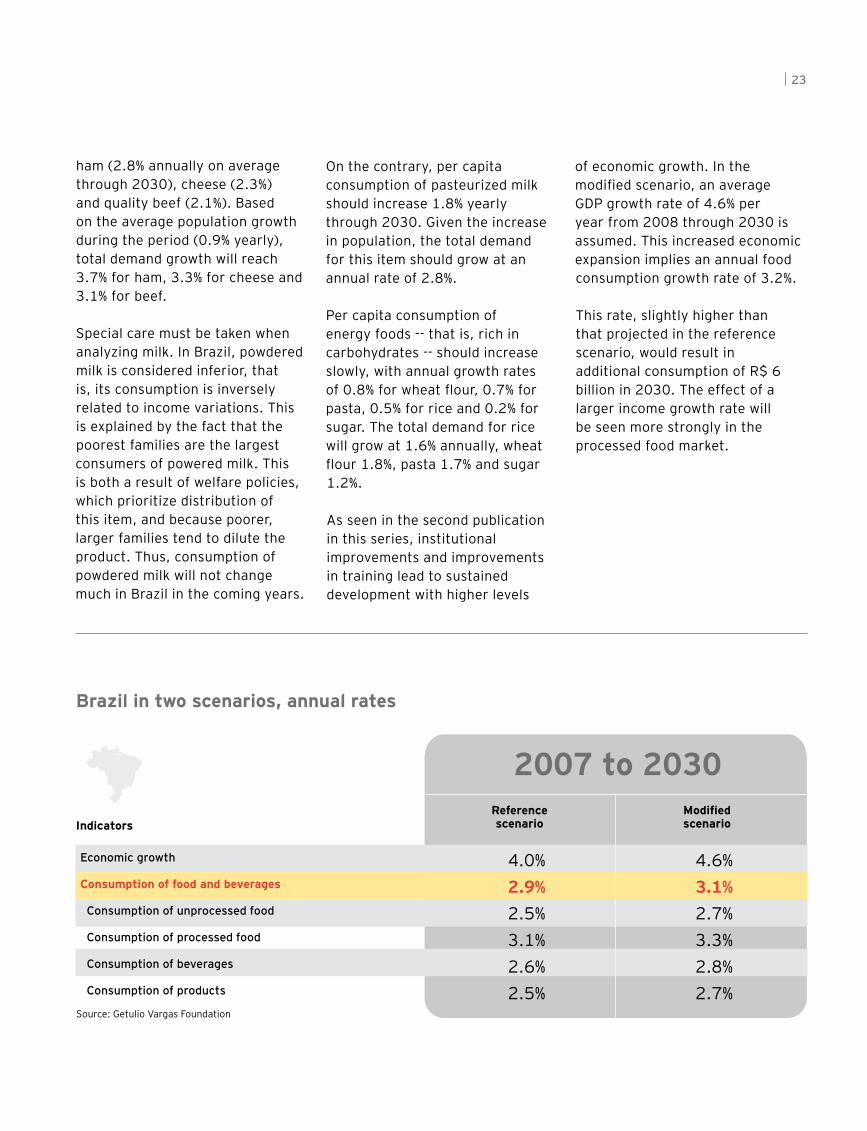
ham (2.8% annually on average through 2030), cheese (2.3%) and quality beef (2.1%). Based on the average population growth during the period (0.9% yearly), total demand growth will reach 3.7% for ham, 3.3% for cheese and 3.1% for beef.
Special care must be taken when analyzing milk. In Brazil, powdered milk is considered inferior, that is, its consumption is inversely related to income variations. This is explained by the fact that the poorest families are the largest consumers of powered milk. This is both a result of welfare policies, which prioritize distribution of this item, and because poorer, larger families tend to dilute the product. Thus, consumption of powdered milk will not change much in Brazil in the coming years.
23
2007 to 2030 Referencescenario
Modifiedscenario
4.0%2.9%2.5%3.1%2.6%2.5%
4.6%3.1%2.7%3.3%2.8%2.7%
Economic growth
Consumption of food and beverages
Consumption of unprocessed food
Consumption of processed food
Consumption of beverages
Consumption of products
Indicators
Source: Getulio Vargas Foundation
Brazil in two scenarios, annual rates
On the contrary, per capita consumption of pasteurized milk should increase 1.8% yearly through 2030. Given the increase in population, the total demand for this item should grow at an annual rate of 2.8%.
Per capita consumption of energy foods -- that is, rich in carbohydrates -- should increase slowly, with annual growth rates of 0.8% for wheat flour, 0.7% for pasta, 0.5% for rice and 0.2% for sugar. The total demand for rice will grow at 1.6% annually, wheat flour 1.8%, pasta 1.7% and sugar 1.2%.
As seen in the second publication in this series, institutional improvements and improvements in training lead to sustained development with higher levels
of economic growth. In the modified scenario, an average GDP growth rate of 4.6% per year from 2008 through 2030 is assumed. This increased economic expansion implies an annual food consumption growth rate of 3.2%.
This rate, slightly higher than that projected in the reference scenario, would result in additional consumption of R$ 6 billion in 2030. The effect of a larger income growth rate will be seen more strongly in the processed food market.

24 SUSTAINABLE BRAZIL BRAZIL’S PERSPECTIVES IN THE AGRICULTURAL INDUSTRY
Our offices
São Paulo | SPCondomínio São LuizAv. Presidente Juscelino Kubitschek, 1.830 Torre I - 5º ao 10º e 13º andares, Torre II - 5º ao 7º e 10º andaresTorre III - 11º andarItaim Bibi - ZIP Code: 04543-900+55 11 2573 3000
Av. Das Nações Unidas, 12.995 13°, 14°, 15 e 16º andares Brooklin Novo - ZIP Code: 04578-000+55 11 3054 0000
Av. Maria Coelho Aguiar, 215 Bloco B - 4º Andar Jd São Luis - ZIP Code: 05804-900+55 11 2573 3000
Campinas | SPGalleria Corporate Av. Dr. Carlos Grimaldi, 1.701 - 3° andar 3A Fazenda São Quirino - ZIP Code: 13091-908+55 19 2117 6450
Rio de Janeiro | RJCentro Empresarial Botafogo Praia de Botafogo, 300 - 13º andarBotafogo - ZIP Code: 22250-040+55 21 2109 1400
Rua do Ouvidor, 88 - 6º andar Centro - ZIP Code: 20040-030+55 21 2222 3100
Praia de Botafogo, 228, Ala B - 13º andar Botafogo - ZIP Code: 22359-900+55 21 3736 9500
Belo Horizonte | MGEdifício Asamar R. Paraíba, 1.000 - 10° andarFuncionários - ZIP Code: 30130-141+55 31 3055 7750
Rua Bernardo Guimarães, 245 - 17º andar Funcionários - ZIP Code: 30140-080+55 31 3508 7200
Blumenau | SCEdifício California CenterR. Dr. Amadeu da Luz, 100 8° andar, conjunto 801 Centro ZIP Code: 89010-160+55 47 2123 7600
Brasília | DFEdifício Brasil 21 Setor Hoteleiro Sul - Quadra 06 conjunto A, bloco A - 1º andar - sala 105ZIP Code: 70316-106 +55 61 2104 0100
Goiânia | GOAv. República do Líbano, 1551 4º andar, sala 402 Setor Oeste - ZIP Code: 74125-125+55 62 3212 0210
Curitiba | PRCondomínio Centro Século XXIR. Visconde de Nacar, 1.440 - 14º andarCentro - ZIP Code: 80410-201 +55 41 3593 0700
Porto Alegre | RSCentro Empresarial Mostardeiro Av. Mostardeiro, 322 - 10º andarMoinhos de Vento - ZIP Code: 90430-000+55 51 2104 2050
Recife | PEEdifício Empresarial Center IIIR. Antônio Lumack do Monte, 128 - 14° andar Boa Viagem - ZIP Code: 51020-350+55 81 3092 8300
Salvador | BAEdifício Guimarães Trade Av. Tancredo Neves, 1.189 - 17° andar Pituba - ZIP Code: 41820-021+55 71 3496 3500
Rua da Alfazema, 761 - 2º andar Salas 201, 202 e 210 Caminho das Árvores - ZIP Code: 41820-710+55 71 2203 4350

Ernst & Young Terco
Assurance | Taxes | Transactions | Advisory Services | Middle Market | Government | Financial Services
About Ernst & Young
Ernst & Young is a global leader in assurance, tax, transaction and advisory services. Worldwide, our 144,000 people are united by our shared values and an unwavering commitment to quality. We make a difference by helping our people, our clients and our wider communities achieve their potential.
In Brazil, Ernst & Young Terco is the most complete company for advisory and assurance services in Brazil, boasting 3,500 professionals that support and serve over 3,400 large-, medium- and small-sized companies, 111 of which are listed on CVM (in June 2010) and are part of the special portfolio of the assurance team.
www.ey.com.br
© 2011 EYGM Limited. All Rights Reserved.
This is a publication of the Branding & Communication Department.
The full or partial reproduction of the contents of this publication is allowed provided the source is quoted.
25


