JRER Vol. 34 No. 1 – 2012 Sustainable Building Certification and the Rent Premium: A Panel Data Approach Authors Alexander Reichardt, Franz Fuerst, Nico B. Rottke, and Joachim Zietz Abstract This paper investigates whether obtaining sustainable building certification entails a rental premium for commercial office buildings and tracks its development over time. To this aim, both a difference-in-differences and a fixed-effects model approach are applied to a large panel dataset of office buildings in the United States in the 2000–2010 period. The results indicate a significant rental premium for both ENERGY STAR and LEED certified buildings. Controlling for confounding factors, this premium is shown to have increased steadily from 2006 to 2008, followed by a moderate decline in the subsequent periods. The results also show a significant positive relationship between ENERGY STAR labeling and building occupancy rates. The emergence and rapid growth of voluntary certification systems such as ENERGY STAR and LEED in the United States are reflective of a paradigm shift towards increased environmental awareness in the commercial real estate industry. The main objective of these certifications is to impart information on a building’s degree of energy efficiency and sustainability to both occupiers and investors. Although environmental certification has only recently emerged from a niche market to becoming a mainstream phenomenon, a number of prominent pricing studies of green buildings have been conducted recently. Apart from case studies of individual properties, several cross-sectional and pooled studies, which are reviewed below, have demonstrated that certified buildings command higher rental rates compared to non-certified buildings. However, a potential shortcoming of these studies is that pricing dynamics cannot be studied in a cross-sectional framework as it only provides a snapshot of environmental labeling and certification at a certain point in time. More importantly, it is difficult to rule out in a cross-sectional study that any observed price premia were genuinely caused by eco-certification and not by unobserved pre-existing characteristics that subsequently cause both certification and higher prices.
Transcript
J R E R � V o l . 3 4 � N o . 1 – 2 0 1 2
S u s t a i n a b l e B u i l d i n g C e r t i f i c a t i o n a n d
t h e R e n t P r e m i u m : A P a n e l D a t a
A p p r o a c h
A u t h o r s Alexander Reichardt , Franz Fuers t ,
Nico B. Rot tke, and Joachim Zietz
A b s t r a c t This paper investigates whether obtaining sustainable buildingcertification entails a rental premium for commercial officebuildings and tracks its development over time. To this aim, botha difference-in-differences and a fixed-effects model approachare applied to a large panel dataset of office buildings in theUnited States in the 2000–2010 period. The results indicate asignificant rental premium for both ENERGY STAR and LEEDcertified buildings. Controlling for confounding factors, thispremium is shown to have increased steadily from 2006 to 2008,followed by a moderate decline in the subsequent periods. Theresults also show a significant positive relationship betweenENERGY STAR labeling and building occupancy rates.
The emergence and rapid growth of voluntary certification systems such asENERGY STAR and LEED in the United States are reflective of a paradigm shifttowards increased environmental awareness in the commercial real estate industry.The main objective of these certifications is to impart information on a building’sdegree of energy efficiency and sustainability to both occupiers and investors.Although environmental certification has only recently emerged from a nichemarket to becoming a mainstream phenomenon, a number of prominent pricingstudies of green buildings have been conducted recently. Apart from case studiesof individual properties, several cross-sectional and pooled studies, which arereviewed below, have demonstrated that certified buildings command higher rentalrates compared to non-certified buildings. However, a potential shortcoming ofthese studies is that pricing dynamics cannot be studied in a cross-sectionalframework as it only provides a snapshot of environmental labeling andcertification at a certain point in time. More importantly, it is difficult to rule outin a cross-sectional study that any observed price premia were genuinely causedby eco-certification and not by unobserved pre-existing characteristics thatsubsequently cause both certification and higher prices.
1 0 0 � R e i c h a r d t , F u e r s t , R o t t k e , a n d Z i e t z
This study takes the analysis of the effects of ENERGY STAR labeling and LEEDcertification on a property’s rental rates and occupancy rates one step further byapplying panel data regressions, specifically difference-in-differences (DID) andfixed-effects models. These models allow controlling for unobserved effects,thereby mitigating a potential omitted variable bias present in many cross-sectionalstudies. Fixed-effects models also provide an estimate of the dynamic behavior ofthe rent premium over time. A relatively long time series of nearly ten years ofquarterly observations is used to estimate a ‘green’ rental premium index for alarge sample of labeled buildings. A key expectation is that the rent premium forlabeled and certified buildings has been growing over time fueled by risingconcerns for the environment, higher energy prices, and heightened interest inmore sustainable properties. However, the sharp decline in the economy in2007 and the following quarters may have had a dampening effect on rentpremiums.
The sample includes 7,140 buildings, 1,768 of which are certified and 5,372 arenon-certified control buildings. The buildings are located in the 10 largestmetropolitan markets across the U.S. The DID models show a significant rentpremium for ENERGY STAR rated buildings from 2004 to 2007. The fixed-effectsmodels suggest an average rent premium of 2.5% for an ENERGY STAR ratingand 2.9% for LEED certification over the observation period. Rent premiums forbuildings with an ENERGY STAR rating emerge in 2006. They continuouslyincrease until the second quarter of 2008, when the average rent premium reaches7%, but then decrease in the wake of the economic crisis. ENERGY STAR labelsalso have a significant and positive effect on occupancy rates.
The remainder of the paper is organized as follows. Section two gives anintroduction to the LEED certification and ENERGY STAR labeling systemsand explores how the quality of the characteristics associated with buildingcertification may translate into higher rents. The empirical and theoretical literatureare then reviewed. Section three describes the data and model specification of theDID and panel data regressions followed by a discussion of the results. The paperconcludes with an outlook on the future research necessary for establishing a firmempirical link between sustainability and the rental value of a commercialproperty.
� B a c k g r o u n d a n d R e s e a r c h P r o b l e m
In commercial real estate markets, a number of voluntary labeling and certificationschemes exist. The main objective of these labels and certificates is to reduceinformation asymmetries between landlord and tenant or seller and buyerconcerning important sustainability features of a building. Each certificationscheme has a particular focus on certain aspects of sustainability, be it energyefficiency, greenhouse gas emissions or sustainable materials and processes. The
S u s t a i n a b l e B u i l d i n g C e r t i f i c a t i o n � 1 0 1
J R E R � V o l . 3 4 � N o . 1 – 2 0 1 2
following section reviews the two prevailing certification systems for officebuildings in the U.S.: ENERGY STAR and LEED.
S u s t a i n a b l e B u i l d i n g C e r t i f i c a t i o n
An obvious difference between the ENERGY STAR and LEED programs is thatthe former solely focuses on the energy efficiency of buildings whereas the latterencompasses a broader concept of sustainability.1
ENERGY STAR is a federal program established by the U.S. EnvironmentalProtection Agency (EPA) and the U.S. Department of Energy and has beenavailable for commercial buildings since 1999. The ENERGY STAR label isawarded if a building’s energy efficiency scores in the top quartile based on EPA’sNational Energy Performance Rating System. The energy efficiency of a buildingis compared to the values achieved by a group of its peers and is rated on a scalefrom 1 to 100. Buildings must earn a score of at least 75 to earn the ENERGYSTAR label. The amount of ENERGY STAR rated space has increased from 575million square feet in 2006 to 1,400 million square feet in 2009 (ENERGY STAR,2009). As of April 2010, 3,847 office buildings have earned an ENERGY STARrating.
The LEED certification system was developed by the U.S. Green Building Council(USGBC) in 1999. This scheme awards points for satisfying specific sustainabilitycriteria in seven categories. These categories relate to sustainable sites, waterefficiency, energy and atmosphere, materials and resources, indoor environmentalquality, innovation in design, and regional priority. According to the number ofpoints reached by a building, different levels of LEED certification are conferred.For example, the four levels of LEED v3 for New Construction and MajorRenovation are certified (40–49 points), silver (50–59 points), gold (60–69points), and platinum (80 points and above). The number of LEED certifiedbuildings has increased considerably since 2005. Data collected by the USGBCindicate that in December 2005, a total of 468 buildings had been LEED certifiedand 1,903 were registered for certification. By mid-2009, 3,073 buildings had beencertified and 27,066 had been registered. By April 2010, these numbers hadincreased to a total of 5,384 certified and 27,167 registered buildings.2
Empirical studies of cost premiums for construction and refurbishment report arelatively wide range of values. While most studies find a relatively low costpremium of 0 to 3% for most LEED standards (Kats, 2003; Matthiessen andMorris, 2007; Miller, Pogue, Gough, and Davis, 2008), other studies documenthigher costs for LEED certification, between 4.5% and 11% depending on thecertification standard (Northbridge Environmental Management Consultants,2003). However, most studies show that the reduced operating costs of thebuildings more than offset the additional construction costs over the buildings’lifecycle. A controversially discussed study by ConSol (2008) arrives at a less
1 0 2 � R e i c h a r d t , F u e r s t , R o t t k e , a n d Z i e t z
optimistic conclusion. Applying energy models to a typical suburban officebuilding, ConSol conclude that a building specification with an energy efficiencytarget 30% better than current building codes require would not be able to recoupthe cost within a 10-year period.
A d v a n t a g e s A s c r i b e d t o S u s t a i n a b l e O f f i c e B u i l d i n g s
Rapid growth in both public attention and the number of certified buildings hasbeen enhanced by the corporate social responsibility (CSR) activities of largemultinational corporations. Companies pursue CSR strategies for a variety ofreasons. Several studies show a strong positive relationship between CSR andcorporate financial performance (Orlitzky, 2003). Companies pursuing a strongCSR agenda may also be able to attract more investors and customers (Milgromand Roberts, 1989). Within their CSR strategies, an increasing number ofcompanies now focus on sustainable buildings. For instance, Eichholtz, Kok, andQuigley (2009) identify the government, the environmentally sensitive oil industry,and legal and financial services as the largest consumers of sustainable space. Inaddition, Pivo and McNamara (2005) report that institutional real estate investorsare increasingly realizing the financial benefits associated with responsibleproperty investing (RPI).
Tenants of sustainable space hypothetically benefit from a number of advantages.A major economic benefit of sustainable space is reduced energy use. Theassociated cost savings can be large if one considers that energy savings of up to30% are possible for much of the commercial building stock (Kats, 2003).3 Anumber of studies show that LEED certified buildings use considerably less energythan conventional buildings (Fowler and Rauch, 2008; Turner and Frankel, 2008).Other studies, however, find that the energy use of LEED certified buildings variesconsiderably or that these buildings do not necessarily save energy (Barrientos,Bhattacharjee, Martinez, and Duffy, 2007; Newsham, Mancini, and Birt, 2009;Scofield, 2009). Pivo and Fischer (2010) find that utility expenses in ENERGYSTAR buildings were 12.9% lower per square foot per year.
Further advantages include image and reputation increases for the tenants(Frombrun and Schanley, 1990), increased worker productivity and retention ratesof employees, reduced staff turnover, and reduced employee absenteeism (Turbanand Greening, 1997; Romm and Browning, 1998; Miller, Pogue, Gough, andDavis, 2009). Although hard to quantify and often neglected, these advantagescan be of significant value to occupants as employee costs make up approximately80% of the total costs of enterprises. Studies have shown that employeeproductivity can be increased by 2%–10% when relocating from a conventionalbuilding to a sustainable building (Lucuik, 2005). In a similar vein, Romm andBrowning (1998) have shown that an increase in employee productivity by 1%can provide savings to the company that exceed their entire energy bill.
S u s t a i n a b l e B u i l d i n g C e r t i f i c a t i o n � 1 0 3
J R E R � V o l . 3 4 � N o . 1 – 2 0 1 2
An economic advantage of sustainability for investors in commercial real estateis that sustainable buildings are likely to have longer economic lives, a lowermarketability risk, and a lower risk of technical and regulatory obsolescence(Eichholtz, Kok, and Quigley, 2010a). Finally, energy-efficient buildings caninsure against future energy price increases and tighter government regulations.
However, while studies across several industries have found evidence of a generalwillingness to pay a premium for goods and services with reduced environmentalimpact (Teisl, Roe, and Hicks, 2002; Maguire, Owens, and Simon, 2004;Casadesus-Masanell, Crooke, Reinhardt, and Vasishth, 2009), it should beemphasized that the existence of the benefits described above does not necessarilyguarantee economic efficiency or an increase in social welfare. For example,Kotchen (2006) demonstrates that green markets can have detrimental effects onenvironmental quality and social welfare under certain conditions. Mahenc (2007)contends that green products are likely to be overpriced when consumers cannotascertain the true environmental performance of a product. Producers may welltake advantage of the asymmetric information by signaling a clean product andraising the price above the full information equilibrium price. This may be thecase with some types of sustainable buildings where actual environmentalperformance is not known in advance by buyers or tenants. For example, a recentstudy by Scofield (2009) shows that LEED office buildings do not use less sourceenergy (total amount of raw fuel that is required to operate the building) thancomparable non-LEED buildings. Ibanez and Grolleau (2009) find that eco-labeling may achieve a positive environmental outcome, but eco-labeling alone isunlikely to be sufficient for internalizing all negative externalities.
While it is not within the scope of this study to test whether any rent premiumsfound in the empirical analysis are due to overpricing or do indeed reflectgenuinely superior economic benefits or utility, the analysis tests whether tenantsare willing to pay a premium for occupying eco-certified buildings.4
M a r k e t D y n a m i c s o f S u s t a i n a b l e B u i l d i n g s
Several recent economic and societal trends appear to have favored the rise ofgreen buildings. Pivo and Fischer (2010) argue that the shift in the demand forenergy-efficient buildings is due to the increase in energy prices since 1998.Accompanied by an increased awareness of environmental issues and toughergovernment regulations, sustainability has thus become an integral part of buildingdesign. An inspection of the media coverage reveals that references to the term‘green building’ have increased dramatically since 2005.5 At the same time, agrowing body of knowledge has emerged that emphasizes the benefits ofsustainable buildings (Jones Lang LaSalle, 2008).
In the short run, due to the construction, renovation, and certification lag, thesupply of eco-certified space is assumed to be inelastic. Although the number of
1 0 4 � R e i c h a r d t , F u e r s t , R o t t k e , a n d Z i e t z
LEED and ENERGY STAR rated buildings has grown considerably since 2005,their share of the national office building stock is still relatively small. Figures onthe proportion of eco-certified buildings in the total market differ widely. McGrawHill Construction (2009) reports that only about 1% of buildings are certified. Amore recent query of the CoStar system (January 2011) suggests that 11.8% ofoffice space is either LEED or ENERGY STAR rated. Regardless of the exactpercentage, it is clear that demand for eco-certified space has outstripped supplyin recent years, which drives the rent premia found in previous studies. In themedium and long run, however, the supply of sustainable space is likely toincrease, which may erode any fraction of the rent premium that is attributable tocurrent excess demand. It is debatable whether the segment of state-of-the-artcertified properties with the highest environmental performance will alwayscommand a premium above and beyond mere cost savings that originates fromimage gains and product differentiation irrespective of increased supply andmarket penetration levels of sustainable buildings in the future. In 2008, thesustainable market was about 10%–12% of non-residential construction.Projections for the U.S. show that, in 2013, green buildings will make up around20%–25% of total construction (McGraw Hill Construction, 2009). This trend isreinforced by the fact that an increasing number of jurisdictions requires somedegree of certification for new construction.
Apart from these demand and supply dynamics, the downturn in financial marketssince 2007 has led to a sharp decrease in office rents and may also have affectedrent premiums for environmental certification.6 Although the pressure oncompanies to behave in a socially responsible manner is undiminished,sustainability may no longer be on top of companies’ agendas as economicproblems and cost-cutting measures prevail (McNamara, 2009). Kahn and Kotchen(2010), for example, find that increasing unemployment rates are associated witha reduced concern for climate change. A study by Knight Frank (2008) showsthat sustainable factors had fallen to last place among leasing priorities in 2008.However, surveys conducted after the onset of the financial crisis show that tenantstend to maintain their long-term sustainability commitments (Panel Intelligence,2008). This also holds true for real estate related decisions (Jones Lang LaSalle,2008). The time series dimension in the data permits an analysis of how the rentpremium interacts with the trends outlined above.
E x i s t i n g S t u d i e s
A number of cross-sectional studies, drawing on the CoStar database, use hedonicOLS regressions to determine the rent and sales price premia associated withsustainable building certification. Miller, Spivey, and Florance (2008) compare afiltered sample of Class A buildings to 927 certified Class A buildings whilecontrolling for size, location, and age of the buildings. They find rent premiumsfor ENERGY STAR and LEED of 6% and 10%, respectively, although theseresults are not statistically significant at conventional levels. An important
S u s t a i n a b l e B u i l d i n g C e r t i f i c a t i o n � 1 0 5
J R E R � V o l . 3 4 � N o . 1 – 2 0 1 2
limitation of this study is that it does not control for micro location effects. Wiley,Benefield, and Johnson (2010) focus on the effect of certification on asking rents,occupancy rates, and sales prices in Class A buildings in 46 office markets acrossthe U.S. They also use a hedonic OLS approach and find rent premiums of 15%to 18% for LEED and 7% to 9% for ENERGY STAR depending on the modelspecification. Furthermore, 10%–11% higher occupancy rates for an ENERGYSTAR rating and 16%–18% for LEED certification are found. For sale prices, theauthors identify premia of $130 and $30 per sq. ft. for LEED and ENERGYSTAR, respectively. Eichholtz, Kok, and Quigley (2010a) also use a hedonicframework to test the effect of certification on the contract rents of 10,000 officebuildings, including 694 certified buildings. In order to find comparable buildingswithin the CoStar database, they use GIS techniques with a radius of 0.25 milesaround each certified building. They find a rent premium of 3.3% for ENERGYSTAR labeling. No significant rent premium is detected for LEED certification.When using effective rents instead of contract rents to control for the differentvacancies in certified and non-certified buildings, they identify a rent premium of10% for ENERGY STAR and 9% for LEED. Fuerst and McAllister (2011a) usehedonic regression models and estimate a rent premium of approximately 6% forLEED certification and 5% for ENERGY STAR while controlling for a largenumber of location- and property-specific factors. In a follow-up study with anupdated dataset, Fuerst and McAllister (2011b) use a robust regression frameworkto handle influential outliers in the treatment and control samples and find asignificant rental premium of 3%–5% for office buildings with an ENERGY STARrating or LEED certification and a 9% premium for the emerging group of dualcertified buildings. However, when the authors apply a fractional logit model tothe larger and updated dataset, they find only very limited support for their earlierfinding of an occupancy rate premium in eco-certified buildings (Fuerst andMcAllister, 2009). Pivo and Fischer (2010) use the NCREIF database and identify5.2% higher rents and 1.3% higher occupancy rates for ENERGY STAR ratedbuildings.7 Eichholtz, Kok, and Quigley (2010b) show that the large increase incertified buildings and the recent downturn in real estate markets have notsignificantly affected the returns of certified buildings relative to comparablebuildings.
� D a t a a n d M e t h o d o l o g y
D a t a
The data are drawn from the CoStar database and include both certified and non-certified buildings. The CoStar database includes approximately 66 billion squarefeet of commercial space in 2.8 million buildings, which makes it the largest realestate database for the U.S. For each building in the sample, data are collectedon building-specific characteristics, historical building performance, and officemarket and economic data for the MSA in which the building is located.
1 0 6 � R e i c h a r d t , F u e r s t , R o t t k e , a n d Z i e t z
The data set includes all ENERGY STAR labeled and LEED certified buildingswith consistent data in the 10 largest metropolitan markets across the U.S. Thesemarkets are New York City, Los Angeles (including Orange County), Washington,D.C., Chicago, Dallas, Boston, San Francisco, Atlanta, Philadelphia, andHouston.8 These urban areas capture a large share of the national office market,yet are sufficiently diverse regarding their industry composition, climaticconditions, and vintage of office stock to allow for generalization of the results.As a control group, non-certified buildings are selected that are in the samegeographic area (submarket) as the certified buildings. To achieve comparability,only certified buildings in submarkets with at least 10 non-certified buildings areconsidered. Based on these selection criteria, the sample comprises a total of 7,140buildings of which 1,584 are ENERGY STAR labeled, 337 are LEED certified,and the remainder consists of non-certified buildings. All variables that are time-varying, such as rents, vacancy rates, and unemployment rates, are collectedquarterly from 2000:Q1 to 2009:Q4. This generates 40 observations per cross-section unit. For the DID models, data are also collected on the buildingcharacteristics. Information on the year of certification is obtained from CoStarand the ENERGY STAR homepage.9 MSA-specific market conditions andunemployment rates come from CoStar and the Bureau of Labor Statistics.
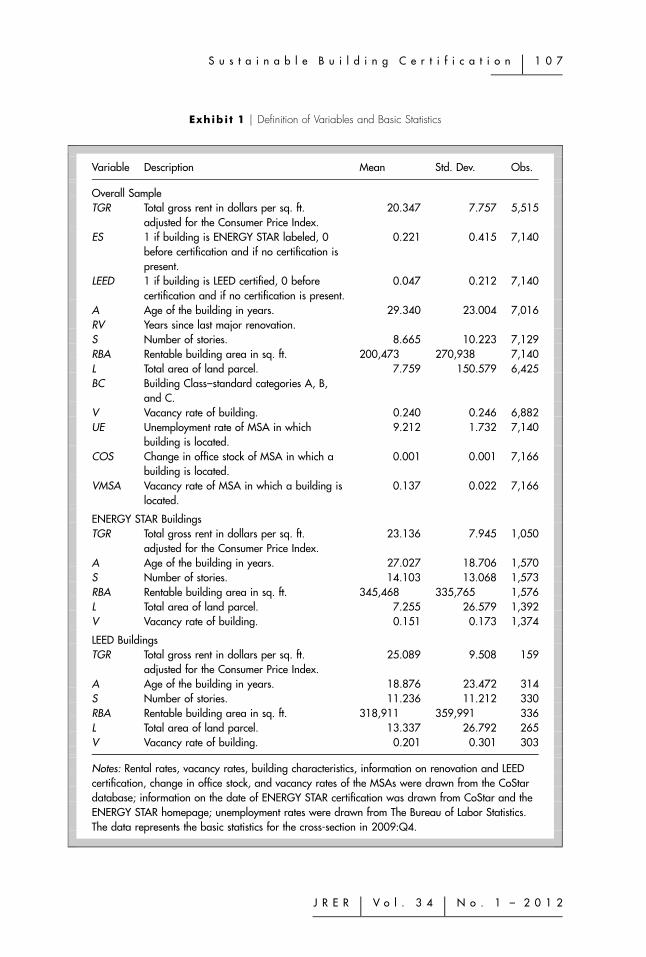
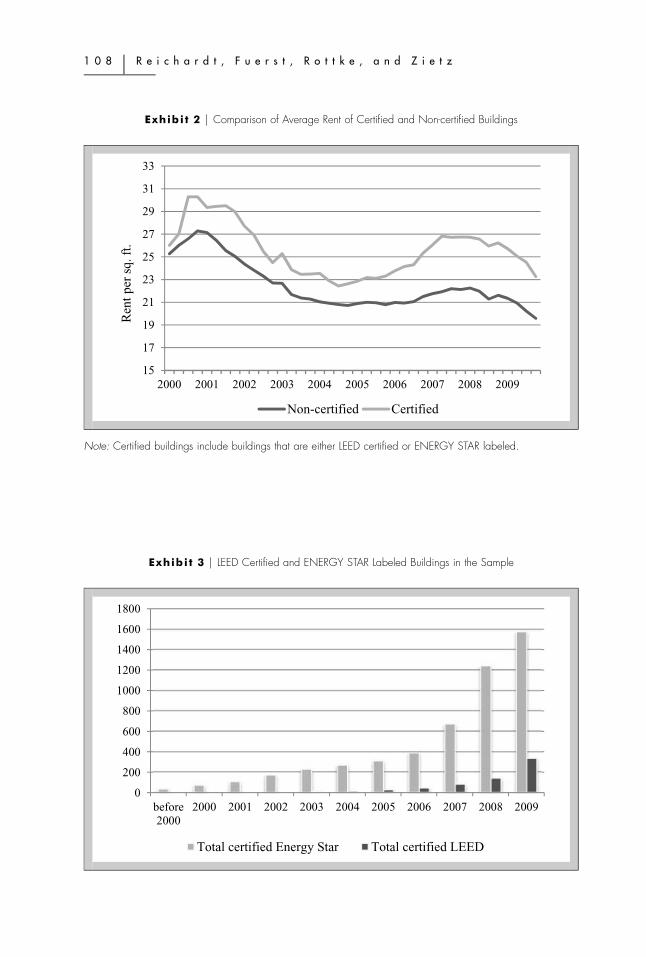
Exhibit 1 provides the variable definitions and basic statistics, along with acomparison of building features, rents, and vacancy rates of certified buildingswith those of the non-certified buildings. In 2009:Q4, average rent per square footin ENERGY STAR buildings is $2.8 higher than the sample average. LEEDcertified buildings have an even larger nominal rent premium of $4.75 per squarefoot. Exhibit 2 compares the average rent of certified buildings with that of non-certified buildings over time. Over the entire observation period, certified buildingshave a higher average rent level than the non-certified control buildings. However,from 2006 onwards, the difference between both rental rate series increases.
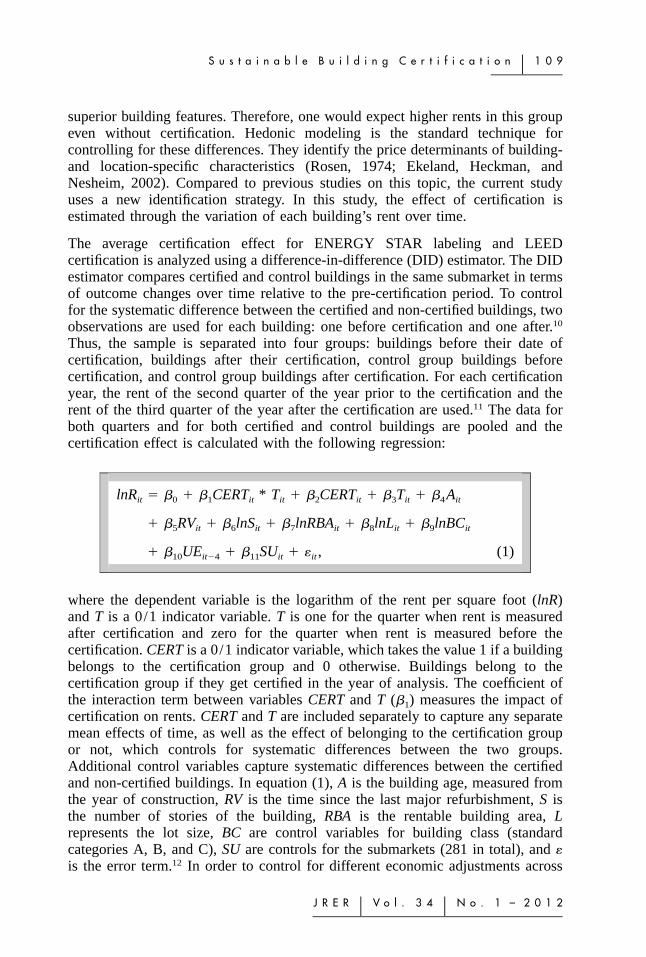
ENERGY STAR buildings are marginally newer than the buildings in the non-certified sample, whereas LEED buildings are, on average, 10.5 years newer thanthe non-certified buildings. ENERGY STAR buildings are also taller, have a higherrentable building area and a lower vacancy rate than the non-certified controlbuildings. LEED certified buildings tend to be larger, have a greater land area anda lower vacancy rate than the non-certified buildings. Exhibit 3 shows how thenumber of ENERGY STAR and LEED certified buildings in the sample increasesover time. In the ENERGY STAR case, most certifications take place in 2007,2008, and 2009, which emphasizes the increased interest in the topic in recentyears. In the LEED case, most buildings in the sample are also certified after2007.
M e t h o d o l o g y
A simple comparison of average rents shows that certified buildings commandhigher rents, but it does not indicate causation as certified buildings tend to have
S u s t a i n a b l e B u i l d i n g C e r t i f i c a t i o n � 1 0 7
J R E R � V o l . 3 4 � N o . 1 – 2 0 1 2
Exhibi t 1 � Definition of Variables and Basic Statistics
Variable Description Mean Std. Dev. Obs.
Overall SampleTGR Total gross rent in dollars per sq. ft.
adjusted for the Consumer Price Index.20.347 7.757 5,515
ES 1 if building is ENERGY STAR labeled, 0before certification and if no certification ispresent.
0.221 0.415 7,140
LEED 1 if building is LEED certified, 0 beforecertification and if no certification is present.
0.047 0.212 7,140
A Age of the building in years. 29.340 23.004 7,016RV Years since last major renovation.S Number of stories. 8.665 10.223 7,129RBA Rentable building area in sq. ft. 200,473 270,938 7,140L Total area of land parcel. 7.759 150.579 6,425BC Building Class–standard categories A, B,
and C.V Vacancy rate of building. 0.240 0.246 6,882UE Unemployment rate of MSA in which
building is located.9.212 1.732 7,140
COS Change in office stock of MSA in which abuilding is located.
0.001 0.001 7,166
VMSA Vacancy rate of MSA in which a building islocated.
0.137 0.022 7,166
ENERGY STAR BuildingsTGR Total gross rent in dollars per sq. ft.
adjusted for the Consumer Price Index.23.136 7.945 1,050
A Age of the building in years. 27.027 18.706 1,570S Number of stories. 14.103 13.068 1,573RBA Rentable building area in sq. ft. 345,468 335,765 1,576L Total area of land parcel. 7.255 26.579 1,392V Vacancy rate of building. 0.151 0.173 1,374
LEED BuildingsTGR Total gross rent in dollars per sq. ft.
adjusted for the Consumer Price Index.25.089 9.508 159
A Age of the building in years. 18.876 23.472 314S Number of stories. 11.236 11.212 330RBA Rentable building area in sq. ft. 318,911 359,991 336L Total area of land parcel. 13.337 26.792 265V Vacancy rate of building. 0.201 0.301 303
Notes: Rental rates, vacancy rates, building characteristics, information on renovation and LEEDcertification, change in office stock, and vacancy rates of the MSAs were drawn from the CoStardatabase; information on the date of ENERGY STAR certification was drawn from CoStar and theENERGY STAR homepage; unemployment rates were drawn from The Bureau of Labor Statistics.The data represents the basic statistics for the cross-section in 2009:Q4.
1 0 8 � R e i c h a r d t , F u e r s t , R o t t k e , a n d Z i e t z
Exhibi t 2 � Comparison of Average Rent of Certified and Non-certified Buildings
15
17
19
21
23
25
27
29
31
33
2000 2001 2002 2003 2004 2005 2006 2007 2008 2009
Ren
t p
er s
q. ft
.
Non-certified Certified
Note: Certified buildings include buildings that are either LEED certified or ENERGY STAR labeled.
Exhibi t 3 � LEED Certified and ENERGY STAR Labeled Buildings in the Sample
0
200
400
600
800
1000
1200
1400
1600
1800
before2000
2000 2001 2002 2003 2004 2005 2006 2007 2008 2009
Total certified Energy Star Total certified LEED
S u s t a i n a b l e B u i l d i n g C e r t i f i c a t i o n � 1 0 9
J R E R � V o l . 3 4 � N o . 1 – 2 0 1 2
superior building features. Therefore, one would expect higher rents in this groupeven without certification. Hedonic modeling is the standard technique forcontrolling for these differences. They identify the price determinants of building-and location-specific characteristics (Rosen, 1974; Ekeland, Heckman, andNesheim, 2002). Compared to previous studies on this topic, the current studyuses a new identification strategy. In this study, the effect of certification isestimated through the variation of each building’s rent over time.
The average certification effect for ENERGY STAR labeling and LEEDcertification is analyzed using a difference-in-difference (DID) estimator. The DIDestimator compares certified and control buildings in the same submarket in termsof outcome changes over time relative to the pre-certification period. To controlfor the systematic difference between the certified and non-certified buildings, twoobservations are used for each building: one before certification and one after.10
Thus, the sample is separated into four groups: buildings before their date ofcertification, buildings after their certification, control group buildings beforecertification, and control group buildings after certification. For each certificationyear, the rent of the second quarter of the year prior to the certification and therent of the third quarter of the year after the certification are used.11 The data forboth quarters and for both certified and control buildings are pooled and thecertification effect is calculated with the following regression:
lnR � � � � CERT * T � � CERT � � T � � Ait 0 1 it it 2 it 3 it 4 it
� � RV � � lnS � � lnRBA � � lnL � � lnBC5 it 6 it 7 it 8 it 9 it
� � UE � � SU � � , (1)10 it�4 11 it it
where the dependent variable is the logarithm of the rent per square foot (lnR)and T is a 0/1 indicator variable. T is one for the quarter when rent is measuredafter certification and zero for the quarter when rent is measured before thecertification. CERT is a 0/1 indicator variable, which takes the value 1 if a buildingbelongs to the certification group and 0 otherwise. Buildings belong to thecertification group if they get certified in the year of analysis. The coefficient ofthe interaction term between variables CERT and T (�1) measures the impact ofcertification on rents. CERT and T are included separately to capture any separatemean effects of time, as well as the effect of belonging to the certification groupor not, which controls for systematic differences between the two groups.Additional control variables capture systematic differences between the certifiedand non-certified buildings. In equation (1), A is the building age, measured fromthe year of construction, RV is the time since the last major refurbishment, S isthe number of stories of the building, RBA is the rentable building area, Lrepresents the lot size, BC are control variables for building class (standardcategories A, B, and C), SU are controls for the submarkets (281 in total), and �is the error term.12 In order to control for different economic adjustments across
1 1 0 � R e i c h a r d t , F u e r s t , R o t t k e , a n d Z i e t z
MSAs, the unemployment rate (UE) of the MSA in which a building is locatedis included.
For ENERGY STAR labeling, the DID analysis is performed for the labeling years2004 to 2008; for LEED, it is performed for the years 2008 and 2009. For eachcertification year, the control sample only comprises buildings that never getcertified and that are located in the same submarket as the certified buildings. Thesame type of analysis is used to check the impact of certification on rents and onthe outcome variable occupancy rate.
In a next step, the two-period model is extended to multiple time periods and thefixed-effects approach is used to determine the effect of certification.13 The timeseries now includes quarterly data from 2000:Q1 to 2009:Q4. A major attractionof the fixed-effects model over pure cross-sectional regressions is the ability tocontrol for unobserved heterogeneity and to consider dynamic aspects. The fixed-effects model assumes that the unobserved individual characteristics are potentiallycorrelated with the observed regressors. This unobserved effect cannot beconsistently estimated and, therefore, is removed through time-demeaning thedata. Pooled OLS can now be applied on the time-demeaned variables to estimatethe unbiased effect of certification. Time-invariant building characteristics as thenumber of stories, the rentable building area, or submarket indicator variablescannot be explicitly included in the hedonic model as they would drop out in thetransformation.14 However, building fixed-effects account for all time-invariantvariables of the building, including location.
The log-linear hedonic model, which relates office rents to time-variant buildingcharacteristics and economic conditions, takes the following functional form:
lnR � � � � ES � � LEED � � A � � RVit 0 1 it 2 it 3 it 4 it
� � V � � V � � V � � V � � UE5 it�1 6 it�2 7 it�3 8 it�4 9 it�4
� � COS � � VMSA � c � c � � , (2)10 it 11 it i t it
where the dependent variable is the logarithm of the rent per square foot (lnR).The focus variables ENERGY STAR (ES) and LEED certification are 0/1 indicatorvariables, which take the value of 1 for all quarters after a building is certifiedand 0 before that or if no certification is present at any time.15 Several buildingcharacteristics are controlled for, such as the age of the building (A) or whethera building has been renovated (RV). V controls for the past vacancy rate of thebuilding as landlords are likely to adjust their rents in response to previous vacancyrates. Previous studies have found an inverse relationship between the vacancyrates and rents, including those by Glascock, Jahanian, and Sirmans (1990) andMills (1992). Building fixed effects (ci) are included in all models to account for
S u s t a i n a b l e B u i l d i n g C e r t i f i c a t i o n � 1 1 1
J R E R � V o l . 3 4 � N o . 1 – 2 0 1 2
all time-invariant variables. Time fixed effects (ct) are included in the models tocontrol for macroeconomic changes over time, which have an influence on allbuildings. In addition, the models account for different unemployment rates (UE)in the ten markets. For some models, variations in the office market conditionsare controlled with the change in office stock (COS) and the vacancy rate (VMSA)of the different MSAs. Equation (2) is also estimated with the occupancy rate asthe dependent variable.
In a next step, the age of the ENERGY STAR and/or LEED certification isexamined to see if it causes any differential pricing effects. This is accomplishedby including in equation (2) an interaction term between the certification variableand an indicator variable for the year of certification. This variable is set to 1 inall periods if a building is labeled or certified in a specific year and 0 otherwise.The interaction term is 1 for all quarters after a building is labeled or certified,but only for those buildings that are labeled or certified in the year specified bythe indicator variable.16 Repeating this analysis for each labeling and certificationyear permits determination of the rent premium for each cohort of ENERGYSTAR rated and LEED certified buildings (buildings labeled or certified in a givenyear). Equation (3) is an example to illustrate the procedure:
lnR � � � � ES � � ES * I(ES Label � 2006)it 0 1 it 2 it
� � LEED � � A � � RV � � V � � V3 it 4 it 5 it 6 it�1 7 it�2
� � V � � V � � UE � c � c � � . (3)8 it�3 9 it�4 10 it�4 i t it
�1 � �2 is the rent premium for buildings that receive the ENERGY STAR labelin 2006. This analysis is performed for ENERGY STAR labels from 2004 to 2009and for LEED certifications for the years 2008 and 2009.
The relatively long time series per cross-section unit also allow an analysis ofhow the average rent premium has changed over time. As mentioned in theprevious section, it is expected a priori that the average rent premium has increasedin recent years in line with heightened public and industry awareness ofenvironmental and energy efficiency issues. An inspection of media reports onLEED and ENERGY STAR shows that the take-off phase for these productsoccurred in the first half of 2006. To illustrate the evolution of differential greenpricing, a green rental premium index is estimated from 2004:Q4 to 2009:Q4 byincluding interaction terms between the ENERGY STAR variable and an indicatorvariable for each quarter, starting with 2004:Q4. The coefficient of each interactionterm represents then the marginal rent premium of the corresponding quarter overthe previous period. By adding the coefficients of all previous quarters up to andincluding quarter t, the effect of certification in quarter t can be determined. Inequation (4),
1 1 2 � R e i c h a r d t , F u e r s t , R o t t k e , a n d Z i e t z
lnR � � � � ES � � ES * I(t � 2004:4)it 0 1 it 2 it
� � ES * I(t � 2005:1) � � ES * I(t � 2005:2) � ..., (4)3 it 4 it
�1 is the effect of ENERGY STAR labeling before 2004:Q4. The effect ofENERGY STAR labeling on rents in 2004:Q4 can be calculated by �1 � �2; theeffect in 2005:Q1 by calculating �1 � �2 � �3, and so forth.
� R e s u l t s
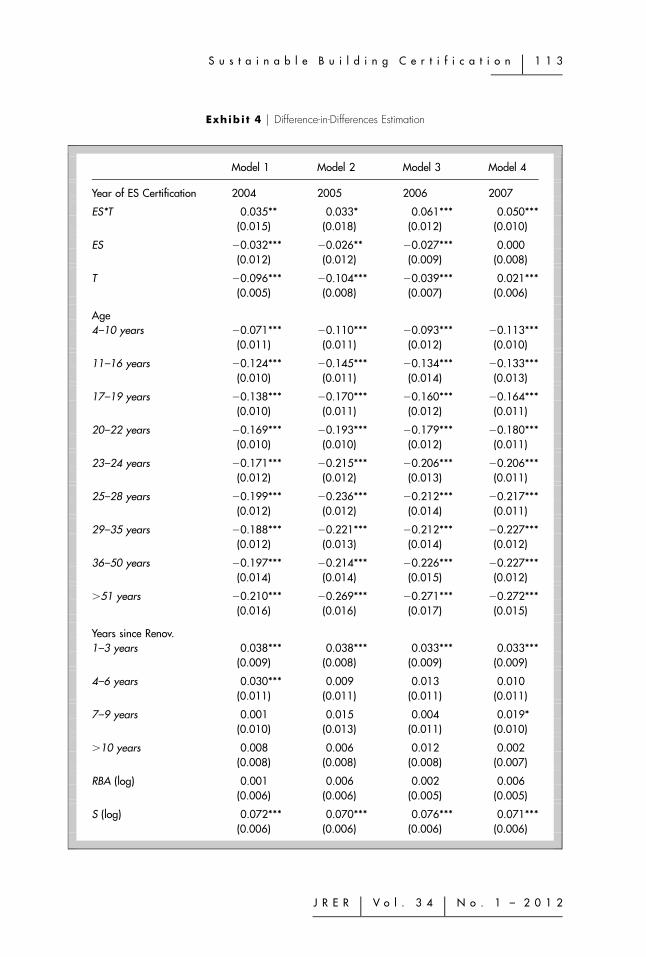
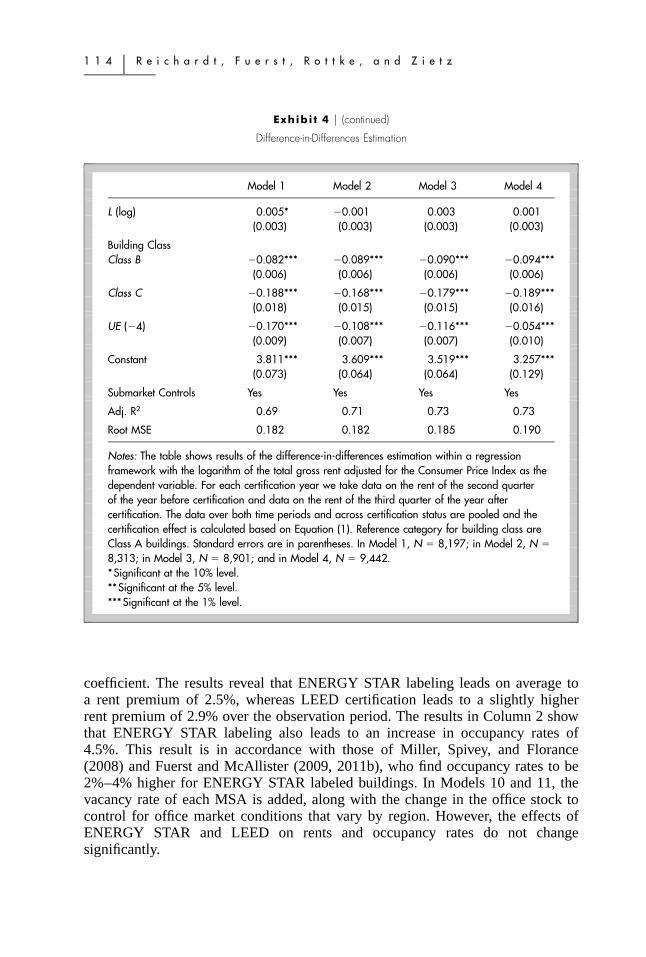
Exhibits 4 and 5 show the results of the DID estimations from 2004 to 2008 forENERGY STAR labels and for 2008 and 2009 for LEED certification. Eachregression includes the focus variable for certification, the building characteristics,and a set of submarket indicator variables. Column 1 in Exhibit 4 presents theresults of the DID estimation for ENERGY STAR labeling in 2004 using thepooled data observed in 2003:Q2 and 2005:Q3. The model explains about 69%of the variation in rents and the coefficients of the hedonic variables for buildingquality, age, and size are consistent with expectations.17 The age categories allhave negative coefficients as the base case relates to newly constructed buildings.Buildings that have previously been renovated command higher rents. Thecoefficient of the interaction term between ES and T (ES*T) gives the effect ofENERGY STAR labeling in 2004. The results indicate that an ENERGY STARlabel in 2004 increases the rent by 3.5%. The same analysis is performed inModels 2, 3, 4, and 5 for ENERGY STAR labels awarded in 2005, 2006, 2007,and 2008, respectively. For ENERGY STAR labels obtained in 2005, 2006, and2007, there are rental premiums of 3.3%, 6.1%, and 5.0%, respectively. The rentpremium is insignificant for the 2008 cohort. ENERGY STAR labels also lead toa significant increase in occupancy rates: 3.4%, 3.3%, and 2.8% in the years 2006,2007, and 2008, respectively.
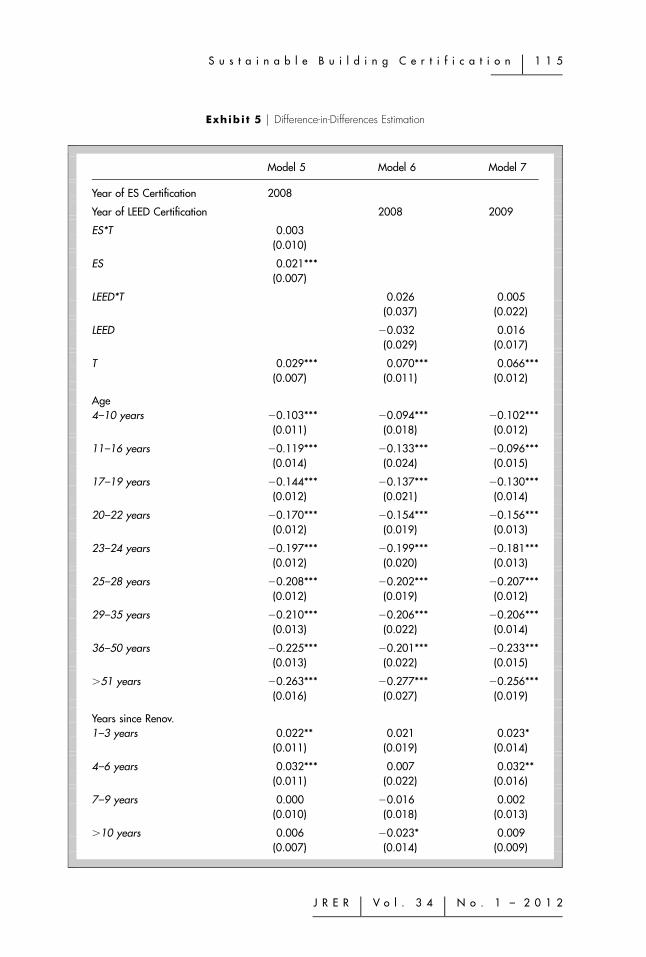
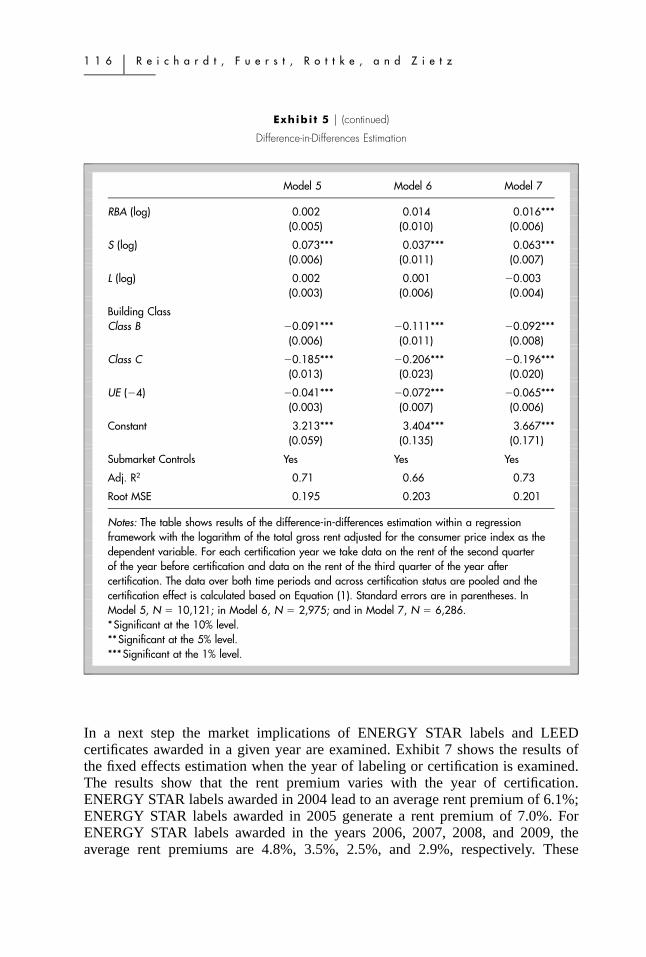
Since many LEED buildings in the sample have been certified in 2008 and 2009,the DID models are computed separately for those years. The results of Models6 and 7, however, do not show a significant rent premium for LEED certificationin those years, nor is there a significant effect of LEED certification on theoccupancy rates for these years.
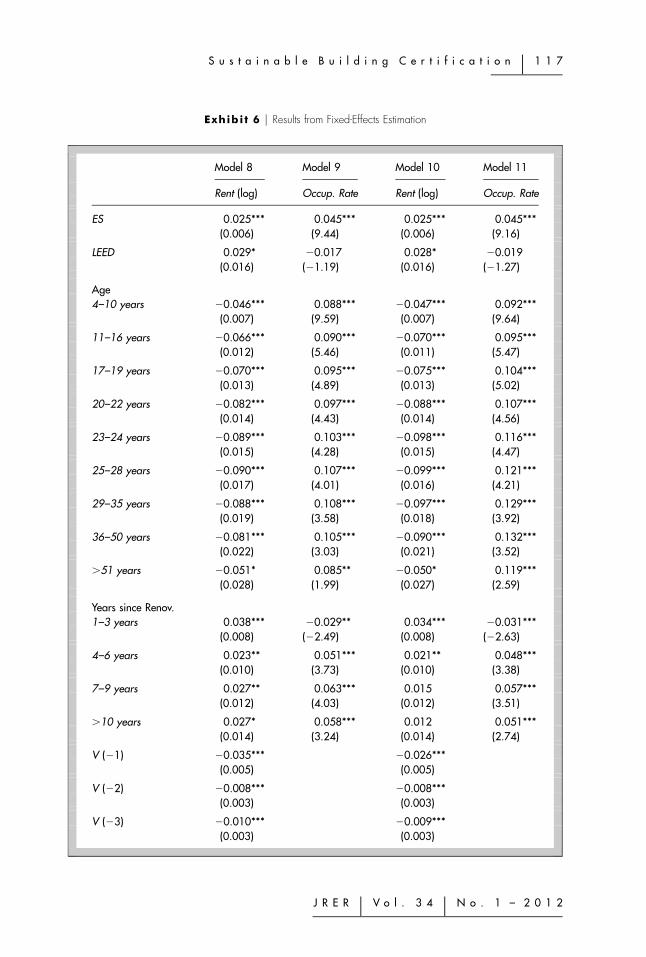
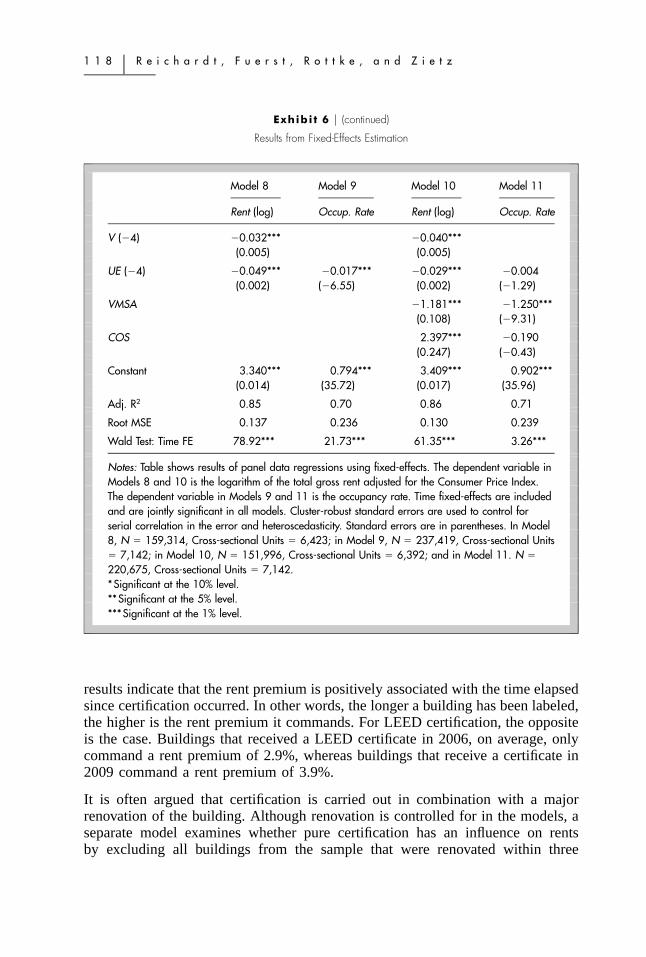
Exhibit 6 presents the results of the fixed-effects models that relate the log rentper square foot and the occupancy rate to the time-varying hedonic characteristicsof the building. Altogether the models explain some 85% of the rent and 70% ofthe occupancy rate. The time fixed-effects are jointly significant in all models.Column 1 shows the results for the rent estimation. The coefficients of the agecategories and renovation have the expected signs. Previous vacancy rates have asignificant and negative influence as high vacancy rates force building owners tolower rents. The unemployment rate has a statistically significant negative
S u s t a i n a b l e B u i l d i n g C e r t i f i c a t i o n � 1 1 3
Notes: The table shows results of the difference-in-differences estimation within a regressionframework with the logarithm of the total gross rent adjusted for the Consumer Price Index as thedependent variable. For each certification year we take data on the rent of the second quarterof the year before certification and data on the rent of the third quarter of the year aftercertification. The data over both time periods and across certification status are pooled and thecertification effect is calculated based on Equation (1). Reference category for building class areClass A buildings. Standard errors are in parentheses. In Model 1, N � 8,197; in Model 2, N �
8,313; in Model 3, N � 8,901; and in Model 4, N � 9,442.*Significant at the 10% level.**Significant at the 5% level.***Significant at the 1% level.
coefficient. The results reveal that ENERGY STAR labeling leads on average toa rent premium of 2.5%, whereas LEED certification leads to a slightly higherrent premium of 2.9% over the observation period. The results in Column 2 showthat ENERGY STAR labeling also leads to an increase in occupancy rates of4.5%. This result is in accordance with those of Miller, Spivey, and Florance(2008) and Fuerst and McAllister (2009, 2011b), who find occupancy rates to be2%–4% higher for ENERGY STAR labeled buildings. In Models 10 and 11, thevacancy rate of each MSA is added, along with the change in the office stock tocontrol for office market conditions that vary by region. However, the effects ofENERGY STAR and LEED on rents and occupancy rates do not changesignificantly.
S u s t a i n a b l e B u i l d i n g C e r t i f i c a t i o n � 1 1 5
J R E R � V o l . 3 4 � N o . 1 – 2 0 1 2
Exhibi t 5 � Difference-in-Differences Estimation
Model 5 Model 6 Model 7
Year of ES Certification 2008
Year of LEED Certification 2008 2009
ES*T 0.003(0.010)
ES 0.021***(0.007)
LEED*T 0.026 0.005(0.037) (0.022)
LEED �0.032 0.016(0.029) (0.017)
T 0.029*** 0.070*** 0.066***(0.007) (0.011) (0.012)
Age4–10 years �0.103*** �0.094*** �0.102***
(0.011) (0.018) (0.012)
11–16 years �0.119*** �0.133*** �0.096***(0.014) (0.024) (0.015)
17–19 years �0.144*** �0.137*** �0.130***(0.012) (0.021) (0.014)
20–22 years �0.170*** �0.154*** �0.156***(0.012) (0.019) (0.013)
23–24 years �0.197*** �0.199*** �0.181***(0.012) (0.020) (0.013)
25–28 years �0.208*** �0.202*** �0.207***(0.012) (0.019) (0.012)
29–35 years �0.210*** �0.206*** �0.206***(0.013) (0.022) (0.014)
36–50 years �0.225*** �0.201*** �0.233***(0.013) (0.022) (0.015)
�51 years �0.263*** �0.277*** �0.256***(0.016) (0.027) (0.019)
Years since Renov.1–3 years 0.022** 0.021 0.023*
(0.011) (0.019) (0.014)
4–6 years 0.032*** 0.007 0.032**(0.011) (0.022) (0.016)
7–9 years 0.000 �0.016 0.002(0.010) (0.018) (0.013)
�10 years 0.006 �0.023* 0.009(0.007) (0.014) (0.009)
1 1 6 � R e i c h a r d t , F u e r s t , R o t t k e , a n d Z i e t z
Notes: The table shows results of the difference-in-differences estimation within a regressionframework with the logarithm of the total gross rent adjusted for the consumer price index as thedependent variable. For each certification year we take data on the rent of the second quarterof the year before certification and data on the rent of the third quarter of the year aftercertification. The data over both time periods and across certification status are pooled and thecertification effect is calculated based on Equation (1). Standard errors are in parentheses. InModel 5, N � 10,121; in Model 6, N � 2,975; and in Model 7, N � 6,286.*Significant at the 10% level.**Significant at the 5% level.***Significant at the 1% level.
In a next step the market implications of ENERGY STAR labels and LEEDcertificates awarded in a given year are examined. Exhibit 7 shows the results ofthe fixed effects estimation when the year of labeling or certification is examined.The results show that the rent premium varies with the year of certification.ENERGY STAR labels awarded in 2004 lead to an average rent premium of 6.1%;ENERGY STAR labels awarded in 2005 generate a rent premium of 7.0%. ForENERGY STAR labels awarded in the years 2006, 2007, 2008, and 2009, theaverage rent premiums are 4.8%, 3.5%, 2.5%, and 2.9%, respectively. These
S u s t a i n a b l e B u i l d i n g C e r t i f i c a t i o n � 1 1 7
J R E R � V o l . 3 4 � N o . 1 – 2 0 1 2
Exhibi t 6 � Results from Fixed-Effects Estimation
Model 8 Model 9 Model 10 Model 11
Rent (log) Occup. Rate Rent (log) Occup. Rate
ES 0.025*** 0.045*** 0.025*** 0.045***(0.006) (9.44) (0.006) (9.16)
Wald Test: Time FE 78.92*** 21.73*** 61.35*** 3.26***
Notes: Table shows results of panel data regressions using fixed-effects. The dependent variable inModels 8 and 10 is the logarithm of the total gross rent adjusted for the Consumer Price Index.The dependent variable in Models 9 and 11 is the occupancy rate. Time fixed-effects are includedand are jointly significant in all models. Cluster-robust standard errors are used to control forserial correlation in the error and heteroscedasticity. Standard errors are in parentheses. In Model8, N � 159,314, Cross-sectional Units � 6,423; in Model 9, N � 237,419, Cross-sectional Units� 7,142; in Model 10, N � 151,996, Cross-sectional Units � 6,392; and in Model 11. N �
220,675, Cross-sectional Units � 7,142.*Significant at the 10% level.**Significant at the 5% level.***Significant at the 1% level.
results indicate that the rent premium is positively associated with the time elapsedsince certification occurred. In other words, the longer a building has been labeled,the higher is the rent premium it commands. For LEED certification, the oppositeis the case. Buildings that received a LEED certificate in 2006, on average, onlycommand a rent premium of 2.9%, whereas buildings that receive a certificate in2009 command a rent premium of 3.9%.
It is often argued that certification is carried out in combination with a majorrenovation of the building. Although renovation is controlled for in the models, aseparate model examines whether pure certification has an influence on rentsby excluding all buildings from the sample that were renovated within three
S u s t a i n a b l e B u i l d i n g C e r t i f i c a t i o n � 1 1 9
J R E R � V o l . 3 4 � N o . 1 – 2 0 1 2
Exhibi t 7 � Market Implications of ENERGY STAR Labels and LEED Certificates Awarded in a Given Year
Year of First Label/Certificate
ENERGY STAR
Coeff. Std. Err.
LEED
Coeff. Std. Err.
2004 0.061*** �0.022
2005 0.070*** 0.018
2006 0.048** 0.019 0.029* 0.016
2007 0.035*** 0.011 �0.042 0.043
2008 0.025*** 0.008 0.063 0.052
2009 0.029*** 0.008 0.039*** 0.015
Notes: Table shows the results of the fixed-effects estimation with an interaction term between thecertification variable and an indicator variable for the year of certification.*Significant at the 10% level.**Significant at the 5% level.***Significant at the 1% level.
Exhibi t 8 � Derived Average Rent Premium of ENERGY STAR Labeling Over Time
Rent Premium Std. Err. Rent Premium Std. Err.
2004:Q4 �0.009 0.010 2007:Q3 0.056*** 0.009
2005:Q1 �0.012 0.009 2007:Q4 0.066*** 0.009
2005:Q2 �0.008 0.009 2008:Q1 0.070*** 0.010
2005:Q3 �0.008 0.008 2008:Q2 0.070*** 0.010
2005:Q4 0.002 0.012 2008:Q3 0.054*** 0.007
2006:Q1 0.006 0.012 2008:Q4 0.049*** 0.007
2006:Q2 0.015 0.012 2009:Q1 0.045*** 0.007
2006:Q3 0.009 0.009 2009:Q2 0.045*** 0.007
2006:Q4 0.025** 0.009 2009:Q3 0.045*** 0.007
2007:Q1 0.036** 0.011 2009:Q4 0.037*** 0.007
2007:Q2 0.052*** 0.010
Notes: The rent premiums are estimated with a fixed-effects model including interaction termsbetween the ENERGY STAR variable and indicator variables for each quarter from 2004:Q4 to2009:Q4.*Significant at the 10% level.**Significant at the 5% level.***Significant at the 1% level.
12
0�
Re
ic
ha
rd
t,
Fu
er
st
,R
ot
tk
e,
an
dZ
ie
tz
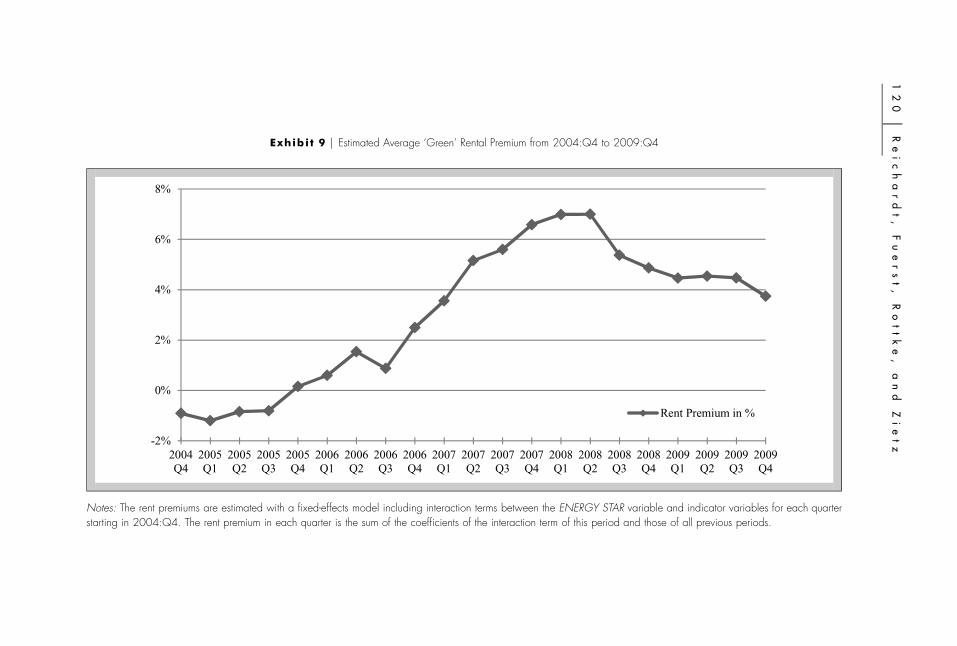
Exhibi t 9 � Estimated Average ‘Green’ Rental Premium from 2004:Q4 to 2009:Q4
-2%
0%
2%
4%
6%
8%
2004Q4
2005Q1
2005Q2
2005Q3
2005Q4
2006Q1
2006Q2
2006Q3
2006Q4
2007Q1
2007Q2
2007Q3
2007Q4
2008Q1
2008Q2
2008Q3
2008Q4
2009Q1
2009Q2
2009Q3
2009Q4
Rent Premium in %
Notes: The rent premiums are estimated with a fixed-effects model including interaction terms between the ENERGY STAR variable and indicator variables for each quarterstarting in 2004:Q4. The rent premium in each quarter is the sum of the coefficients of the interaction term of this period and those of all previous periods.
S u s t a i n a b l e B u i l d i n g C e r t i f i c a t i o n � 1 2 1
J R E R � V o l . 3 4 � N o . 1 – 2 0 1 2
years prior to certification. The results of the fixed-effects models do not differfrom the results presented above, which suggests that the effect predominantlycomes from certification, not from renovation.
The entire dynamic behavior of the rent premium for ENERGY STAR is mappedin the next step. Exhibit 8 shows the rent premium for each quarter from 2004:Q4 to 2009:Q4 using the model described by equation (4). The resultingcoefficients are illustrated in the ‘green’ rental premium index in Exhibit 9. Theresults indicate that no statistically significant rent premium can be identifiedbefore 2006:Q4 when for the first time a rent premium of 2.5% for ENERGYSTAR is found. The rent premium increases in subsequent periods and reaches7% in the first half of 2008. These results are in line with the demand and supplydynamics of eco-certified buildings presented earlier and suggest that increasedpublic awareness and the demand for sustainable buildings in 2006 and 2007 maybe driving the rent premium. The results further show that the strong economicdownturn had an effect on the rent premium. Although the rent premium forENERGY STAR labeled buildings remains positive, it decreases to 3.7% at theend of 2009.
� C o n c l u s i o n
Expanding on previous cross-sectional studies, this paper provides furtherevidence on the dynamics of the rent premium of LEED certification andENERGY STAR labeling in the U.S. Difference-in-differences (DID) and fixed-effects models are used to determine the effect of LEED and ENERGY STAR onrents of commercial office buildings. The results of the empirical analysis confirmthe expectation of a rent premium. The results of the DID estimation confirm arent premium for ENERGY STAR from 2004 to 2007. The results of the fixed-effects models suggest that an ENERGY STAR label increases rents by 2.5% andan LEED certification by 2.9%, averaged over all time periods in the analysis.There is also a positive relationship between rent premium and the time since anENERGY STAR label was awarded. For LEED certification, the opposite is thecase. The rent premium for ENERGY STAR rated buildings changes considerablyover time. It strongly increases from 2006:Q4 until 2008:Q2, when the rentpremium peaks at 7%. In subsequent periods, the rent premium decreases. Thereis also a positive relationship between an ENERGY STAR rating and occupancyrates.
Regarding future work, it will be interesting to study the further development ofdifferential green pricing. Certification standards are likely to evolve further andit seems likely that a distinct group of certified buildings will persist even as thegeneral stock of buildings becomes more energy-efficient through new regulationsand incentives. The interaction effects of multiple certifications and environmentalbenchmarks for individual properties on pricing are also likely to gain importanceas a marker of distinction in environmental performance. Within this area, furtherstudies might consider the effect of ENERGY STAR labeling and re-certification
1 2 2 � R e i c h a r d t , F u e r s t , R o t t k e , a n d Z i e t z
to capture the rapidly evolving standards. There is also scope for enriching theexisting econometric models with additional variables, such as lease arrangementsand actual energy consumption patterns that are not accessible to researchers todate, but may increase our understanding of dynamic pricing patterns for energyefficiency and sustainability features in real estate markets and contribute to thebroader body of literature on the differential pricing of eco-labeled products.
� E n d n o t e s1 A number of terms is used synonymously for sustainability in the real estate industry,
the most common of these being green building, energy efficiency, eco-efficiency,environmental efficiency, zero carbon, and high performance building. Most of theseterms focus primarily on environmental aspects, while sustainability set out to be a muchbroader concept that also considers economic and social aspects (Elkington, 1998).Lutzkendorf and Lorenz (2007) define a sustainable building to be a building withoptimized lifecycle costs, which avoids or minimizes the harm to the environment,occupants, and neighbors of the building.
2 These numbers are taken from the USGBC project list, available at http: / /www.usgbc.org/LEED/Project/CertifiedProjectList.aspx.
3 The savings can be particularly large for tenants with net lease arrangements. However,only approximately 18% of the certified and non-certified buildings used for this studyhave a net lease contract that is roughly in line with the general market share.
4 Eichholtz, Kok, and Quigley (2010a, 2010b) disentangle the rent premium in more detail.However, the information on the historic energy consumption of both the certifiedbuildings and the control buildings, which is necessary to disentangle the premium inthis study, are not available to the authors.
5 A search in newspapers for ‘green building’ via LexisNexis shows that the number ofhits increases from 1,010 hits in 2000 to 2,896 in 2005 and to more than 3,000 in 2006.A search via newslibrary.com, which includes 3,312 newspapers and other news sourcesin the U.S., returns 402 hits in 2000, 3,501 hits in 2005, 13,939 in 2007, and 18,432 in2009. A search in the Google news archive also reveals a drastic increase from 2006 to2008.
6 The average rent of the ten markets in the analysis decreases by 7.7% from 2008:Q1 to2009:Q4.
7 Pivo and Fischer (2010) use panel regression as a robustness test to confirm theirfindings. However, no details are given about their model specifications.
8 According to a ranking by Betterbricks and Cushman & Wakefield (2010), six of thesemarkets are among the top 10 ‘‘greenest’’ cities regarding green building adoption andimplementation.
9 http: / /www.energystar.gov/ index.cfm?fuseaction�labeled buildings.locator.10 Similar to the fixed-effects estimation, DID allows to control for unobserved
heterogeneity as DID assumes that this unobserved heterogeneity is time-invariant andis canceled out through differencing (Revallion, 2008).
11 A comprehensive sensitivity analysis is conducted that uses the previous and thefollowing periods to estimate the DID. The results, however, do not change significantly.
S u s t a i n a b l e B u i l d i n g C e r t i f i c a t i o n � 1 2 3
J R E R � V o l . 3 4 � N o . 1 – 2 0 1 2
12 An important caveat is that the submarket indicator variables do not control perfectlyfor unobserved spatial heterogeneity. Although submarket boundaries are intended todelineate relatively homogenous market areas, it is possible that intra-submarketvariations in locational quality and accessibility might give rise to biased results ifcertified buildings were systematically located in the best and most accessible locationswithin submarkets. In the DID model, two conditions would have to be met for this biasto arise: (1) certified buildings are systematically located in the best micro-locationswhile non-certified buildings are found in worse locations and (2) price and rental pathsof good and bad micro-locations diverge over time due to factors that are not capturedby the control variables. Considering the relatively small number of certified buildingscompared to control buildings, a bias seems highly unlikely. However, to rule this outempirically, detailed accessibility measures would have to be obtained and included inthe model. Such measures are now available from CoStar for a subset of about 40% ofthe properties considered in the analysis. Apart from the reduction in sample size, thereis a danger that this might introduce selection bias as the properties for which thisinformation is available are probably a non-random subset of the sample. Hence, thispossibility is not pursued further.
13 Fixed-effects models are used because the Hausman test rejects the consistency of therandom effects estimator at high levels of statistical significance. In this study the fixed-effects models are estimated by de-meaning all variables, not by using the least squaresdummy variable method.
14 The fixed-effects estimator (within estimator) exploits the variation of the data over timeas it measures the association between individual-specific deviations of regressors fromtheir time-averaged values and individual-specific deviations of the dependent variablefrom its time-averaged values. Time-invariant variables, therefore, drop out of the model.
15 The indicator variable for ENERGY STAR certification takes the value 1 after the firstcertification. Multiple certifications are not captured in the model. In a separate model,however, an indicator variable is integrated into the model that takes the value 1 if abuilding is ENERGY STAR labeled more than once. The ENERGY STAR variable isthen interacted with the indicator variable for multiple certifications. The results showthat buildings that have multiple ENERGY STAR labels command a higher rentpremium than building that have only one ENERGY STAR label. Accordingly, the fixed-effects estimation shows that buildings with only one ENERGY STAR label do notcommand a statistical significant rent premium, whereas buildings with multipleENERGY STAR labels command a rent premium of 3.3%. This issue should be furtherexplored in future research.
16 Building, which are ENERGY STAR labeled in 2006, should serve as an example here:The ENERGY STAR variable is 1 from the ENERGY STAR labeling onwards. Theindicator variable for ENERGY STAR labeling in 2006 is 1 in every period for thosebuildings, which receive the ENERGY STAR label in 2006, 0 for all other buildings.The interaction term between those variables, thus, is 1 from 2006 onward for thosebuildings which receive the ENERGY STAR label in 2006.
17 Earlier studies on the determinants of rents, for example, include those by Clapp (1980),Frew and Judd (1988), Bollinger, Ihlanfeldt, and Bowes (1998), and Slade (2000).
� R e f e r e n c e sBarrientos, J.L., U. Bhattacharjee, T. Martinez, and J.J. Duffy. Green Buildings inMassachusetts: Comparison between Actual and Predicted Energy Performance.Proceedings of the American Solar Energy Society, 2007.
1 2 4 � R e i c h a r d t , F u e r s t , R o t t k e , a n d Z i e t z
Bollinger, C.R., K.R. Ihlanfeldt, and D.R. Bowes. Spatial Variation in Office Rents withinthe Atlanta Region. Urban Studies, 1998, 35:7, 1097–1118.
Casadesus-Masanell, R., M. Crooke, F. Reinhardt, and V. Vasishth. Households’ Willingnessto Pay for ‘‘Green’’ Goods: Evidence from Patagonia’s Introduction of Organic CottonSportswear. Journal of Economic & Management Strategy, 2009, 18:1, 203–33.
Clapp, J.M. The Intrametropolitan Location of Office Activities. Journal of RegionalScience, 1980, 20:3, 387–99.
ConSol. Achieving 30% and 50% over ASHRAE 90.1-2004 in a Low-Rise Office Building.Study prepared for NAIOP, 2008.
Betterbricks and Cushman & Wakefield. Green Building Opportunity Index: NationalOverview: Central Business Districts, 2010. http: / /betterbricks.com/images/gbi pdf/GreenBuildingIndex-NationalOverview.pdf.
Eichholtz, P., N. Kok, and J.M. Quigley. Why Companies Rent Green: CSR and the Roleof Real Estate. Academy of Management Annual Meeting Proceedings, 2009, 1–6.
——. Doing Well by Doing Good? Green Office Buildings. American Economic Review,2010a, 100:5, 2492–2509.
——. Sustainability and the Dynamics of Green Building: New Evidence on the FinancialPerformance of Green Office Buildings in the USA. RICS Research Report, October 2010b.
Ekeland, I., J.J. Heckman, and L. Nesheim. Identifying Hedonic Models. AmericanEconomic Review, 2002, 92:2, 304–09.
Elkington, J. Cannibals with Forks: The Triple Bottom Line of 21st Century Business. NewSociety Publishers, Gabriola Island, Canada, 1998.
ENERGY STAR. ENERGY STAR Snapshot: Measuring Progress in the Commercial andIndustrial Sectors. Fall 2009.
Environmental Information Administration. Annual Energy Outlook 2010—WithProjections to 2035. March 2009.
Fowler, K.M. and E.M. Rauch. Assessing Green Building Performance: A Post OccupancyEvaluation of 12 GSA Buildings. Pacific Northwest National Laboratory, Richland,Washington, 2008.
Frew, J. and G.D. Jud. The Vacancy Rate and Rent Levels in the Commercial Office Market.Journal of Real Estate Research, 1988, 3:11, 1–8.
Frombrun, C. and M. Schanley. What’s in a Name? Reputation Building and CorporateStrategy. The Academy of Management Journal, 1990, 33:2, 233–58.
Fuerst, F. and P. McAllister. An Investigation of the Effect of Eco-Labeling on OfficeOccupancy Rates. Journal of Sustainable Real Estate, 2009, 1:1, 49–64.
——. Green Noise or Green Value? Measuring the Effects of Environmental Certificationon Office Values. Real Estate Economics, 2011a, 39:1, 45–69.
——. Eco-Labeling in Commercial Office Markets: Do LEED and ENERGY STAR OfficesObtain Multiple Premiums? Ecological Economics, 2011b, 70:6, 1220–30.
Glascock, J., S. Jahanian, and C.F. Sirmans. An Analysis of Market Rents: Some EmpiricalEvidence. Real Estate Economics, 1990, 18:1, 105–19.
Ibanez, L. and G. Grolleau. Can Ecolabeling Schemes Preserve the Environment?Environmental and Resource Economics, 2008, 40:2, 233–49.
Jones Lang LaSalle. Global Trends in Sustainable Real Estate: An Occupier’s Perspective.February 2008.
S u s t a i n a b l e B u i l d i n g C e r t i f i c a t i o n � 1 2 5
J R E R � V o l . 3 4 � N o . 1 – 2 0 1 2
Kahn, M.E. and M.J. Kotchen. Environmental Concern and the Business Cycle: TheChilling Effect of Recession. NBER Working Paper No. 16241. July 2010, www.nber.org/papers/w16241.
Kats, G. The Costs and Financial Benefits of Green Buildings—A Report to California’sSustainable Building task Force, Capital E, October 2003.
Knight, Frank LLP. Central London Occupier Survey. September 2008.
Kotchen, M.J. Green Markets and Private Provision of Public Goods. Journal of PoliticalEconomy, 2006, 114:4, 816–34.
Lucuik, M. A Business Case for Green Buildings in Canada. Report presented to IndustryCanada. March 2005.
Lutzkendorf, T. and D. Lorenz. Integrating Sustainability into Property Risk Assessmentsfor Market Transformation. Building Research & Information, 2007, 35:6, 644–61.
Maguire, K.B., N. Owens, and N.B. Simon. The Price Premium for Organic Babyfood: AHedonic Analysis. Journal of Agricultural and Resource Economics, 2004, 29:1, 132–49.
Mahenc, P. Are Green Products Over-priced? Environmental and Resource Economics,2007, 38:4, 461–73.
Matthiessen, L. and P. Morris. Cost of Green Revisited: Reexamining the Feasibility andCost Impact of Sustainable Design in the Light of Increased Market Adoption. DavisLangdon, 2007.
McGraw Hill Construction. Green Outlook 2009: Trends Driving Change, 2009.
McNamara, P. The Death of Social Responsible in Property is Much Exaggerated. UNEPFinance Initiative, Property Working Group, 2009.
Milgrom, P. and J. Roberts. Price and Advertising Signals of Product Quality. Journal ofPolitical Economy, 1986, 94:4, 796–821.
Miller, N., J. Spivey, and A. Florance. Does Green Pay Off? Journal of Real Estate PortfolioManagement, 2008, 14:4, 385–99.
Miller, N., D. Pogue, Q.D. Gough, and S.M. Davis. Green Building and Productivity.Journal of Sustainable Real Estate, 2009, 1:1, 65–91.
Mills, E. Office Rent Determinants in the Chicago Area. Real Estate Economics, 1992,20:2, 156–71.
Newsham, G.R., S. Mancini, and B.J. Birt. Do LEED-certified Buildings Save Energy?Yes, but..., Energy and Buildings, 2009, 41:8, 897–905.
Northbridge Environmental Management Consultants. Analyzing the Cost of ObtainingLEED Certification. Study prepared for the American Chemistry Council, 2003.
Orlitzky, M., F.L. Schmidt, and S.L. Rynes. Corporate Social and Financial Performance:A Meta-analysis. Organization Studies, 2003, 24:3, 403–41.
Panel Intelligence. Quarterly Sustainability Tracking Study, November 2008.
Pivo, G. and P. McNamara. Responsible Property Investing. International Real EstateReview, 8:1, 2005, 128–43.
Pivo, G. and J.D. Fischer. Income, Value and Returns in Socially Responsible OfficeProperties. Journal of Real Estate Research, 2010, 32:3, 243–70.
Ravallion, M. Evaluating Anti-Poverty Programs. Handbook of Development Economics,2007, 4, 3787–3846.
Romm, J. and W.D. Browning. Greening the Building and the Bottom Line: IncreasingProductivity Through Energy-Efficient Design, 1999.
1 2 6 � R e i c h a r d t , F u e r s t , R o t t k e , a n d Z i e t z
Rosen, K. Hedonic Prices and Explicit Markets: Production Differentiation in PureCompetition. Journal of Political Economy, 1974, 82:1, 34–55.
Scofield, J. Do LEED-certified Buildings Save Energy? Not Really..., Energy and Buildings,2009, 41:12, 1386–90.
Slade, B.A. Office Rent Determinants During Market Decline and Recovery. Journal ofReal Estate Research, 2000, 20:3, 357–80.
Teisl, M.F., B. Roe, and R.L. Hicks. Can Eco-Labels Tune a Market? Evidence fromDolphin-Sage Labeling. Journal of Environmental Economics and Management, 2002, 43:3, 339–59.
Turban, D.B. and D.W. Greening. Corporate Social Performance and OrganizationalAttractiveness to Prospective Employees. Academy of Management Journal, 1997, 40:3,658–72.
Turner, C. and M. Frankel. Energy Performance of LEED for New Construction Buildings.New Buildings Institute, Vancouver, 2008.
Wiley, J.A., J.D. Benefield, and K.H. Johnson. Green Design and the Market forCommercial Office Design. Journal of Real Estate Finance and Economics, 2010, 41:2,228–43.
We would like to thank the CoStar Group for providing us with access to theirdatabase. The authors are also grateful to John L. Glascock and the participants ofthe 26th Conference of the American Real Estate Society in Naples for their commentsand suggestions on an earlier version of this paper. Three anonymous referees andthe editor of this journal provided valuable comments and guidance that improvedthe quality of this article.
Alexander Reichardt, EBS University, Wiesbaden, Germany or [email protected].
Franz Fuerst, University of Cambridge, Cambridge, CB3 9EP, United Kingdom [email protected].
Nico B. Rottke, EBS University, Wiesbaden, Germany and University of CentralFlorida, Orlando, FL 32816 or [email protected].
Joachim Zietz, Middle Tennessee State University, Murfreesboro, TN 37129 and EBSUniversity, Wiesbaden, Germany or [email protected].