91
The Jerusalem Institute for Israel Studies The Center for Environmental Policy Sustainable Development Indicators in Israel Summary Report Phase I Editor: Eran Feitelson 2004

The Jerusalem Institute for Israel StudiesThe Center for Environmental Policy
Sustainable Development Indicatorsin Israel
Summary Report Phase I
Editor: Eran Feitelson
2004

The Center for Environmental Policy Seriesno. 9
Sustainable Development Indicators in Israel
Summary Report Phase I
Editor: Eran Feitelson
This book was made possible by funds granted by the Charles H. Revson Foundation.
The statements made and the views expressed are solely the responsibility
of the authors.
© 2004, The Jerusalem Institute for Israel Studies
The Hay Elyachar House
20 Radak St., Jerusalem 92186
http://www.jiis.org.il

Contents
PAPERS IN ENGLISH
Abstract ............................................................................................................. v
Sustainable Development Indicators for Measuring Israel’sQuality of Life: Assessing the Relevance of Sustainable IndicatorResearch at the Local and National LevelsClive Lipchin and Alon Tal .............................................................................. vii
Indicators of Sustainable Development: A Review of the ExistingState of KnowledgeJonathan Chenoweth ...................................................................................... xxxi
Air Quality Indicators for IsraelMordechai Peleg ............................................................................................ lxxii
PAPERS IN HEBREW
Chapter 1: Objectives and Methodology of the StudyEran Feitelson ........................................................................................... 9
Part I: Popular Approaches to Characterizing SustainableDevelopment Indicators: The Case of Israel ................................ 17
Chapter 2: Indicators of Sustainable Development:A Review of the Existing State of Knowledge (Abstract)Jonathan Chenoweth ............................................................................... 19
Chapter 3: Sustainable Development Indicators for MeasuringIsrael’s Quality of Life (Abstract)Clive Lipchin and Alon Tal ..................................................................... 22

iv
Toward a System of Sustainable Development Indicators in Israel
Chapter 4: An Inventory of Existing Data in IsraelShahar Solar ............................................................................................ 24
Chapter 5: Israel and the Sustainable Development IndicatorProject in the Mediterannean Sea Basin, MAP/BPOrit Mindali and Yossi Gamlieli ............................................................. 34
Part II: Recommended Indicators in Selected Sectors .............................. 43
Chapter 6: Indicators for the Sustainable Developmentof Land ResourcesAmos Benin ............................................................................................ 45
Chapter 7: Open Space IndicatorsMoti Kaplan ............................................................................................ 62
Chapter 8: Biological Diversity IndicatorsTamar Dayan, Ro’i Gutman and Yael Mandlik ...................................... 88
Chapter 9: Indicators for the Sustainable Developmentof Mining Raw MaterialsAmir Eidelman ...................................................................................... 109
Chapter 10: Water Sector IndicatorsSaul Arlosoroff and Yossi Margoninsky ............................................... 119
Chapter 11: Air Quality Indicators (Abstract)Mordechai Peleg ................................................................................... 134
Chapter 12: Transportation Indicators for the Analysis andEvaluation of Environmental ImpactsIlan Solomon ......................................................................................... 136
Part III: Proposal for a Sustainable Development Indicator System .......173
Chapter 13: Indicators Derived from the SustainableDevelopment StrategyEran Feitelson ....................................................................................... 175
Chapter 14: Proposal for a Sustainable Development IndicatorSystem in IsraelEran Feitelson ....................................................................................... 183
Chapter 15: Directions for Further StudyEran Feitelson ....................................................................................... 198
Appendices
1. Participants in the Workshops ................................................................................. 200
2. Means for Advancing the Sustainable Development Strategy ................................ 202
Notes ............................................................................................................................ 203

v
Abstract
Indicators are signposts that can point the way to sustainable development. Althoughthere is no agreed and exact definition of sustainable development, indicators mayshow the direction toward which we are moving and even pave the road towardsustainable development. This report summarizes the first phase of a projectdesigned to identify the indicators which should be monitored from the point ofview of sustainable development.
The study was based on three primary efforts. The first effort focused onthe assessment of existing knowledge in Israel and its adaptation to acceptedindicator systems worldwide. For this purpose, a table was prepared which compilesIsrael’s existing environmental information by categories, level of availability,quality, continuity of the data, frequency of collection, and organizations whichcollect the information. Second, a survey of indicator systems accepted worldwidewas carried out which assessed the applicability of the system proposed by theMediterranean Action Plan. It was concluded that it is not desirable to merelyimplement a strategy developed by international bodies, but rather to create asystem which would optimally respond to conditions in Israel.
The third effort identified indicators necessary in Israel, in two main ways:position papers were prepared on the indicators necessary to identify seven primarysectors from an environmental viewpoint in Israel. On the basis of each paper, anexpert workshop on the specific area was held and the comments raised in theworkshop were then integrated into the proposed indicators in this area. In addition,indicators which may facilitate follow-up of the implementation of the draft strategyfor sustainable development, which was prepared in Israel, were identified. Theseincluded indicators designed to monitor the achievement of the strategy’s targetsand indicators designed to monitor the seven structural processes contradictingsustainable development, which were identified within the strategy.
On the basis of these three efforts, a preliminary system of sustainabledevelopment indicators is proposed for Israel. The indicators are classifiedaccording to six subjects: (I) monitoring economic growth; (II) monitoring thelevel of social and environmental equity in the present generation; (III) the capacityto cope with environmental subjects; (IV) the protection of the interests of futuregenerations (especially their ability to shape their own future according to their

vi
Toward a System of Sustainable Development Indicators in Israel
desires); (V) the efficiency of natural resource utilization; and (VI) indicators onthe quality of life of the present generation.
The indicator system presented in this report is preliminary. It still requirescompletions in several areas as well as a review to assess its suitability to its goals.These tasks will be the focus of the study in the second phase.

vii
Sustainable Development Indicators for MeasuringIsrael’s Quality of Life:
Assessing the Relevance of Sustainable Indicator Researchat the Local and National Levels
Clive Lipchin and Alon Tal
IntroductionAcross the globe, sustainable community indicators are becoming an invaluablepart of community and national planning.1 Indicators are important tools forcountries as they move toward implementation of sustainable developmentprograms pursuant to the UN Commission for Sustainable Development’s Agenda21 program. Israel is a part of this trend.
According to most criteria, Israel has the leading economy in the MiddleEast. According to the UNDP 2001 Human Development Report, Israel ranks 22out 162 countries and is considered a country with “high human development.”2
The attendant rise in standard of living brings costs as wells as benefits. Quantitativegrowth at the expense of qualitative development can be seen in many areas of thecountry; traffic congestion, air and water pollution and the loss of open space andurban sprawl. These and other environmental problems constitute symptoms ofboth the robust economy and high standard of living.
The environmental side effects of development raise questions about “qualityof life.” Quality of life, is to a certain extent a subjective dynamic and thus difficultto characterize, but invariably it involves choices that affect both the present andthe future. Current demands by the population for private vehicles or single-familyhomes may hold immediate benefits for consumers, but the cost of such lifestylechoices will be felt by future generations in lower air quality, congestion and lossof open space. Sustainable development therefore, seeks to balance quantitativegrowth with qualitative development both in the present and in the future. As yetin Israel, there is no systematic, intergenerational process in place to prioritize andcoordinate efforts to enhance the country’s overall quality of life.

viii
Toward a System of Sustainable Development Indicators in Israel
What are Sustainable Indicators?Sustainable development is an endeavor to ensure that “progress” is balanced;that economic growth does not come at the expense of public health, environmentalquality, or social equity. In working towards sustainability, aspects critical to thequality of life of a community such as health, economy, education, and environmentcan be measured and evaluated using indicators - numeric measures of communityhealth and well being. Without indicators, we have no objective measures of ourprogress towards sustainability. As a society, we are overly reliant upon economicindicators like GNP and the stock market indices. These offer only a very limitedunderstanding of our overall progress. We need broader indicators that recognizethe linkages among economy, environment, health, and culture.
It is impossible to move forward without understanding the linkages amongeconomic, social and environmental factors. The development of indicators helpsto bring these linkages to the forefront allowing for policy makers to make policiesin a broader and sounder framework. Traditional measures of quality of life lookedat these activities in isolation. A sustainable development approach using indicators,allows for the linkages of these activities and integrates them into ultimate qualityof life indexes (Figs. 1 and 2).
Figure 1: Traditional measures of quality of lifeSource: www.sustainablemeasures.com

ix
Figure 2: Sustainable development highlights linkages.Source: www.sustainablemeasures.com
Not all quantifiable information constitutes a meaningful sustainable indicator.An indicator must be valid and understandable to a broad spectrum of users, detectproblems and raise public awareness so the need for change, where necessary, istaken seriously. Valid indicators may vary across different communities, reflectingdifferent cultures, values or geographical realities. Hence, the process by whichstakeholders, representing diverse interests come together to develop a set ofindicators, can create indicators that are cohesive and representative of the countryas a whole. One of the purposes of this paper is to identify organizations that canmake use of indicators. Because quality of life measures affect us all, organizationsfrom business and industry, social and public services, government and non-government organizations and the environment need to be included in developingindicators. In cutting a swathe across all sectors of the country, we propose thatindicators should3:
♦ Reflect something basic and fundamental to the long-term cultural,economic, environmental, or social health of the country over generations.
♦ Be accepted as a valid sign of sustainability or distress by experts andpracticing professionals.
Sustainable Development Indicators for Measuring Israel’s Quality of Life

x
Toward a System of Sustainable Development Indicators in Israel
♦ Be meaningful and understandable to the public.
♦ Be attractive to the local media so that the press can publicize them and usethem to monitor and analyze trends.
♦ Lend themselves to accurate measurment. Data and statistics must be relevantto the geographic area and, preferably, comparable to other countries withsimilar standards of living. If data are not readily available, a practical methodof data collection or measurement should be developed.
♦ Be logically or scientifically defensible. Understandable rationales shouldexist for using the specific indicator and for drawing general conclusionsfrom it.
♦ Clearly communicate trends over time and space. As tools for sustainabledevelopment, indicators should clearly tell us whether or not we are movingtoward or away from sustainability or remaining stable.
Sustainable Indicators at Two LevelsMany organizations have promoted the development of indicators; among themare the OECD, UNCSD and the UK Department of Environment.4 Like the HumanDevelopment Index, indicators like these can provide an accounting system thatallows one to rank and compare countries. Such indicators has relevance forinternational level policy making, especially in the light of globalization. Manytrade and environmental treaties and policies are incorporating sustainabledevelopment into their mandates. Indicators designed for the macro-level can helpcountries to close the gap between less and more sustainable countries. They canalso be used by world bodies as pressure points to improve quality of life standardsin less sustainable countries. A limiting factor of these measures is their relevanceat the local level.
Yet, policy instituted at the national level should also reflect the interests ofthe local level. The development of indicators that are locally specific providesvaluable feedback to policy makers at the national level. Consequently, indicatorsshould be developed at two levels: national and local. These two systems must actin a coordinated way at both horizontal and vertical levels whereby transparentbottom-up and top-down processes exist.
xi
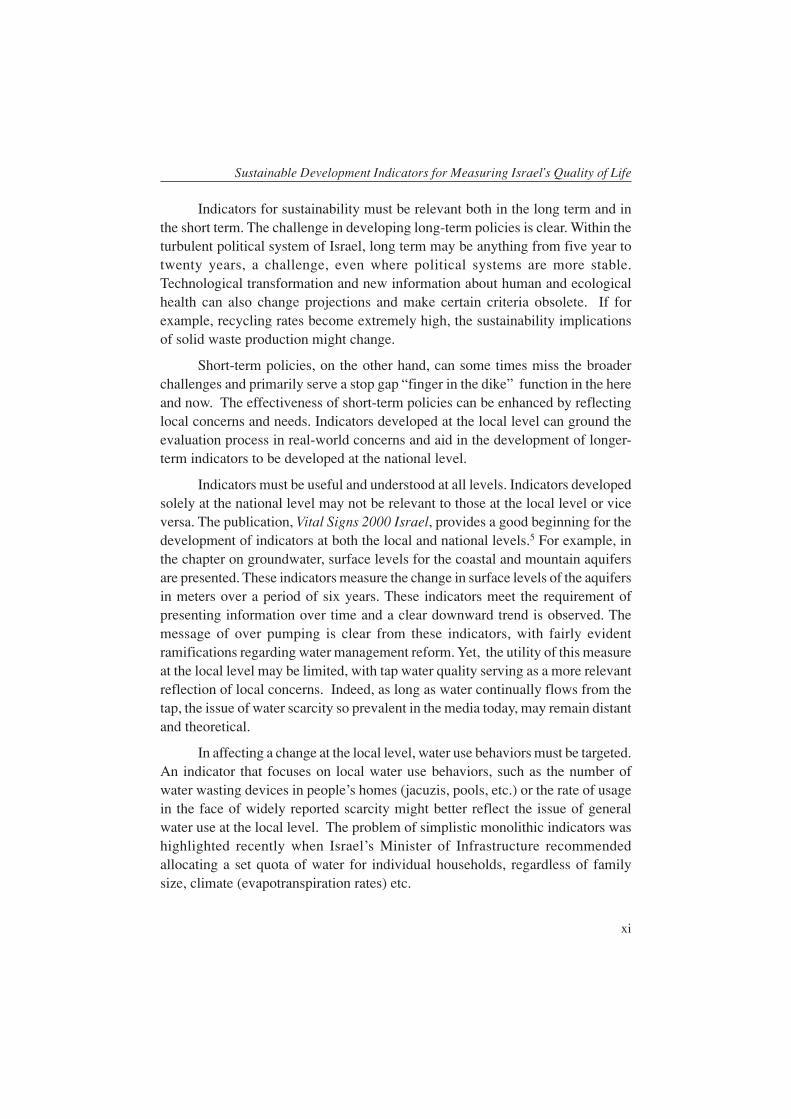
Indicators for sustainability must be relevant both in the long term and inthe short term. The challenge in developing long-term policies is clear. Within theturbulent political system of Israel, long term may be anything from five year totwenty years, a challenge, even where political systems are more stable.Technological transformation and new information about human and ecologicalhealth can also change projections and make certain criteria obsolete. If forexample, recycling rates become extremely high, the sustainability implicationsof solid waste production might change.
Short-term policies, on the other hand, can some times miss the broaderchallenges and primarily serve a stop gap “finger in the dike” function in the hereand now. The effectiveness of short-term policies can be enhanced by reflectinglocal concerns and needs. Indicators developed at the local level can ground theevaluation process in real-world concerns and aid in the development of longer-term indicators to be developed at the national level.
Indicators must be useful and understood at all levels. Indicators developedsolely at the national level may not be relevant to those at the local level or viceversa. The publication, Vital Signs 2000 Israel, provides a good beginning for thedevelopment of indicators at both the local and national levels.5 For example, inthe chapter on groundwater, surface levels for the coastal and mountain aquifersare presented. These indicators measure the change in surface levels of the aquifersin meters over a period of six years. These indicators meet the requirement ofpresenting information over time and a clear downward trend is observed. Themessage of over pumping is clear from these indicators, with fairly evidentramifications regarding water management reform. Yet, the utility of this measureat the local level may be limited, with tap water quality serving as a more relevantreflection of local concerns. Indeed, as long as water continually flows from thetap, the issue of water scarcity so prevalent in the media today, may remain distantand theoretical.
In affecting a change at the local level, water use behaviors must be targeted.An indicator that focuses on local water use behaviors, such as the number ofwater wasting devices in people’s homes (jacuzis, pools, etc.) or the rate of usagein the face of widely reported scarcity might better reflect the issue of generalwater use at the local level. The problem of simplistic monolithic indicators washighlighted recently when Israel’s Minister of Infrastructure recommendedallocating a set quota of water for individual households, regardless of familysize, climate (evapotranspiration rates) etc.
Sustainable Development Indicators for Measuring Israel’s Quality of Life

xii
Toward a System of Sustainable Development Indicators in Israel
Disaggregating this data along socioeconomic and sociodemographic lineswill help to pinpoint where water use is high and where it is low. Scaling theseindicators up to measures of decreasing water levels in the country’s aquifers createsthe necessary linkage to the operational decision at the national level. In addition,creating linkages among these indicators on water use with respect to their widerassociation with the economy (investments in alternative technologies), society(health effects as a consequence of water quality) and the environment (degradedecosystems such as the Lake Kinneret and Dead Sea systems) increase the utilityof indicators to both the public and policy-makers. The inclusivity that linkagesprovide allow for the development of policies that are not target-specific but rathersolution-specific. In other words, policy development in remediating the watershortage must include both supply and demand side management where bothsuppliers and consumers are targeted together with the encompassing environmentalattributes.
Public Awareness and Involvement
Indicators can potentially be powerful tools for involving the public in quality oflife issues. Directly involving representatives or formally incorporated NGOs inthe development of indicators will help ensure that the indicators represent theneeds and priorities of the community. Community involvement is a key componentof building trust among governmental and business institutions and the public.Indicator development that involves the public from the beginning stages ofdevelopment educates and empowers the public, making them part of the decisionmaking process. Indicators can also help in improving public knowledge aboutlocal infrastructure or environmental factors. For example, an understanding andawareness regarding the source and treatment of drinking water can help to allayfears when crises occur. Indicators can also act as public relations tools wherecommunities can report on their progress with respect to sustainable development.
At the same time, the limitations of non-professionals and the general publicshould be considered when crafting a series of indicators. For example, air qualityis an amorphous concept which can be defined in many ways, depending on thegasses or particulate matter which is being measured. If, for example, one wishesto define air pollution according to carbon monoxide levels, (today the only airemission standard in effect for private cars) then Israel’s air is in good shape and

xiii
growing cleaner. If, however, NOx, fine particulates or ambient ozone drive theindicator equation, then deterioration is alarming. The U.S. EPA pioneered acomposite air quality indicator in order to help local authorities provide healthadvisories and warn the vulnerable sectors of the public about pollution episodes.6
This single measure enable the public to immediately understand when the air isunfit for breathing, and saves them from deciphering different measurements anddeciding which might affect their health and which are innocuous.
During a recent visit to Israel, the chairman of Germany’s Green Partyexplained that none of the environmental positions which were advocated by hisparty, originated from the Green Party itself. Rather, the scientific community setthe agenda and provided the relevant data for formulating policy positions.7 Thisview constitutes an ideal in a country where salient data are unavailable or analysisand interpretation remain ambiguous. Along with the growing demands for publicinvolvement in planning and policy decisions, comes a responsibility of makingan informed and thoughtful contribution. Indicators should enhance the integrityof the public’s participation, providing an empirical scientific basis for the positionswhich are ultimately advocated.
In sum, the information conveyed by a locally developed indicator shouldbe self-explanatory. It should also provide temporal and spatial information in aclear and visible way, be accessible and of interest to the media, be scaled up andlinked to a national indicator and be linked to other indicators across sectors. Thedevelopment of indicators for solid waste can serve as an example. Vital Signs2000 Israel has developed indicators on per capita waste production and wastecomposition.8 These indicators have been developed at a national level and showtrends of waste composition in percentage over time.
The indicator on per capita waste production measured in kilograms is aworthy attempt of a locally developed indicator. This indicator compares per capitawaste production across selected cities in the country. It does not however, includethe types of waste, nor the potential for recycling, waste-to-energy incinerationpotential, etc. It does, show, however, which communities are producing more orless waste. Linking this indicator to other indicators that measure social andeconomic factors such as per capita income and the specific waste recycling effortsof a given community (or nationally) will produce a clearer picture on wasteproduction. The linkages will also help policy makers in drafting an integratedwaste management strategy.
Sustainable Development Indicators for Measuring Israel’s Quality of Life

xiv
Toward a System of Sustainable Development Indicators in Israel
Assessing the Relevance of Sustainable Indicators forEnvironmental Organizations
In order to receive an initial indication of the value of research that wouldcharacterize sustainable indicators for Israel, we surveyed a broad range ofenvironmental organizations on the relevance of sustainable indicators to theirwork. The assumption behind the survey was that it is important when developingindicators and publishing results that the endeavor does not remain academic.Because indicators are tools that help decision-makers and can galvanize the public,bringing them into the public policy discourse, it is imperative that they areunderstood by the public and perceived as relevant. We developed a surveyquestionnaire that sought to ascertain the most urgent environmental problems(which the public would presumably want monitored) and the way in whichindicators might help to address these problems (appendix 1). We also askedquestions on how indicators can be help organizations in their own work. Theresults are encouraging for sustainable indicator advocates and suggests that thereis an appetite if not a hunger for the kinds of information which sustainableindicators are intended to provide.
According to the organizations surveyed, the most pressing environmentalproblems facing the country are air quality, water scarcity and water quality; theleast pressing are noise and loss of biodiversity (table 1). As a first cut, thisinformation can help in concentrating efforts on indicator development in thosesectors with the highest relevance.

xv
Table 1: Survey responses on environmental concerns facing Israel.
Respondents were representatives of local environmental organizations (n=15).
Responses are in percentages.
Environmental Concern Rank
Most Urgent Less LeastUrgent Urgent Urgent
Air quality 80.00 13.33 6.67 0
Water Quality 93.33 6.67 0 0
Urban sprawl 20.00 53.33 26.67 0
Open space 66.67 20.00 13.33 0
Transportation (e.g.: road
congestion, pollution etc.) 53.33 46.67 0 0
Noise 26.67 33.33 40.00 0
Energy shortage 13.33 46.67 33.33 0
Solid waste disposal 26.67 46.67 26.67 0
Pesticide Use 60.00 20.00 20.00 0
Hazardous waste treatment 60 20.00 20.00 0
Loss of biodiversity 6.67 46.67 46.67 0
Water scarcity 73.33 26.67 0 0
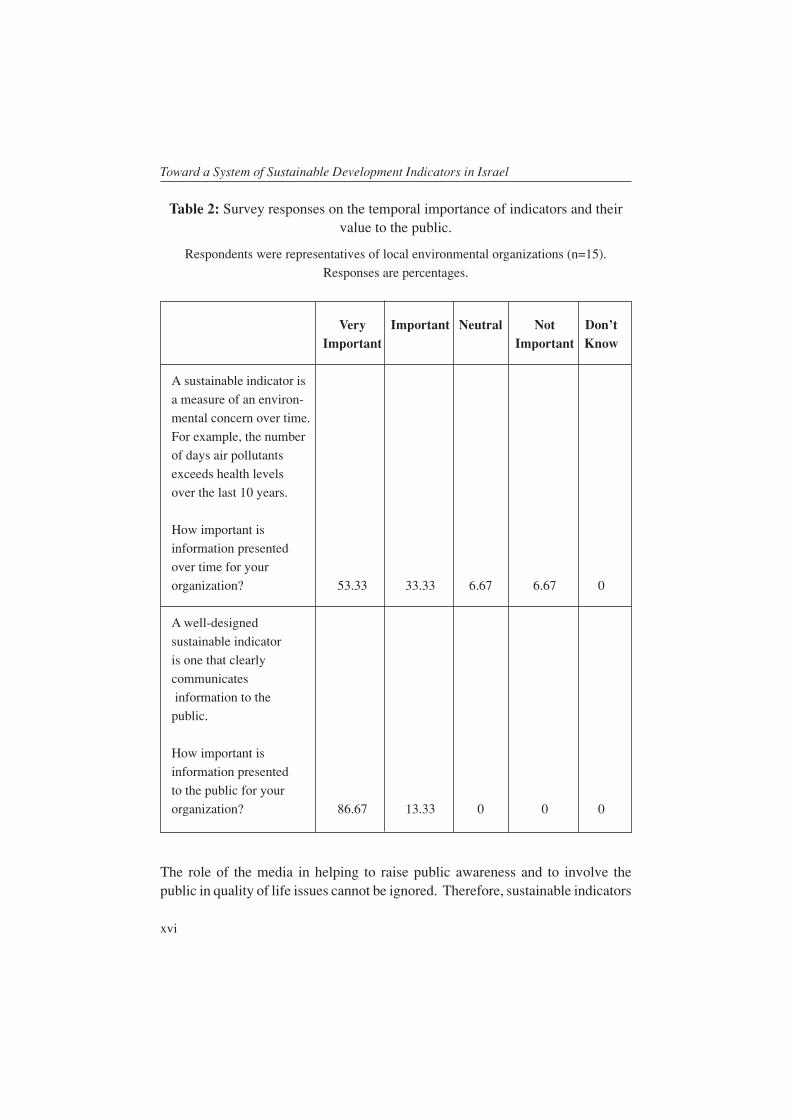
The ability of indicators to clearly produce and communicate trends was consideredvery important (53.33% of responses). Using indicators to clearly presentinformation to the public was also considered very important (86.67% of responses).These results are encouraging for the need for indicators at this time (table 2).
Sustainable Development Indicators for Measuring Israel’s Quality of Life
xvi
Toward a System of Sustainable Development Indicators in Israel
Table 2: Survey responses on the temporal importance of indicators and theirvalue to the public.
Respondents were representatives of local environmental organizations (n=15).
Responses are percentages.
Very Important Neutral Not Don’tImportant Important Know
A sustainable indicator is
a measure of an environ-
mental concern over time.
For example, the number
of days air pollutants
exceeds health levels
over the last 10 years.
How important is
information presented
over time for your
organization? 53.33 33.33 6.67 6.67 0
A well-designed
sustainable indicator
is one that clearly
communicates
information to the
public.
How important is
information presented
to the public for your
organization? 86.67 13.33 0 0 0
The role of the media in helping to raise public awareness and to involve thepublic in quality of life issues cannot be ignored. Therefore, sustainable indicators

xvii
should have the media in mind when they are developed. Already, the HaAretznewspaper’s consistent publishing of Kinerret water levels or sulfur dioxide levelsin urban centers suggests that the press is willing to provide coverage ofenvironmental indicators if they believe their readers will see them as relevantand valid.
According to table 3, from the environmental organizations’ perspective,the most effective media source for communicating indicator results to the publicis television. Newspapers are considered next, with radio third. Forty percent ofresponses considered the Internet as being ineffective in communicating results tothe public. It is advisable to involve the media at all stages of the indicatordevelopment process and not just at the dissemination of results. Public acceptanceof the results is likely to be greater when the public has been informed from thebeginning of the process.
Table 3: Survey responses on the effectiveness of various media sources incommunicating sustainable indicator results to the public.
Respondents were representatives of local environmental organizations (n=15).
Responses are percentages.
Public Medium Most Effective Not LeastEffective Effective Effective
Newspapers 66.67 33.33 0.00 0.00
Television 93.33 6.67 0.00 0.00
Radio 46.67 46.67 6.67 0.00
Community meetings 20.00 53.33 26.67 0.00
The Internet 26.67 33.33 40.00 0.00
Public dialogue 13.33 46.67 26.67 13.33
As mentioned previously, involvement of NGOs in indicator development isessential, especially for indicators at the local level. The inclusion of NGOs
Sustainable Development Indicators for Measuring Israel’s Quality of Life

xviii
Toward a System of Sustainable Development Indicators in Israel
active at the local level is an important resource for tapping into the concerns andpriorities of the public. This should not prove to be a problem in Israel. The majorityof the organizations surveyed were willing to help in indicator development(66.67% of responses, table 4).
Table 4: Survey responses on the willingness to help in the data gatheringprocess for a sustainable indicators project.
Respondents were representatives of local environmental organizations (n=15).
Responses are percentages.
Response
Willing 66.67
Neutral 13.33
Not willing 13.33
Don’t know 6.67
Finally, we asked the organizations whether or not indicators would be beneficialto the work of the organizations themselves. Over two-thirds of the organizationssurveyed indicated that indicators would be helpful in their work in communicatingwith the public. This attests to the importance of local indicators. Eighty percentof those surveyed indicated that indicators would be helpful in communicatingwith government agencies and ministries. This bears out the relevance for scalingup local indicators to national indicators and for the importance of linkages. Inaddition, over two-thirds of those surveyed indicated that indicators would assistthem in seeking funding for their activities (table 5).

xix
Table 5: Survey responses on whether or not a sustainable indicators projectwould be beneficial to environmental organizations.
Respondents were representatives of local environmental organizations (n=15).
Responses are percentages.
Statement Helpful Neutral Not helpful Don’t know
Would quality of life
measures such as
sustainable indicators
be helpful in your work
in communicating with
the public? 66.67 13.33 13.33 6.67
Would quality of life
measures such as
sustainable indicators
be helpful in your work
in communicating with
government agencies
and ministries? 80.00 20.00 0 0
Would quality of life
measures such as
sustainable indicators
be helpful in your work
in seeking funding for
your organization’s
activities? 66.67 20.00 13.33 0
A recent survey of environmental NGOs in Israel detected a striking growth in thenumber of formal organizations operating within Israel during the past decade.9 Itwas estimated that well over a hundred environmental groups are active in a seriousmanner, most at the local level. Only 28% of the 51 organizations sampled had
Sustainable Development Indicators for Measuring Israel’s Quality of Life

xx
Toward a System of Sustainable Development Indicators in Israel
budgets below $5,000. This suggests a remarkable strengthening of environmentalpresence at the grass roots, who will increasingly provide a key clientele for theindicators results when they are measured and publicized.
Table 6 presents the names of the organizations surveyed and the number ofyears they have been active.
Table 6
Name Number of Years Active
χ¯˘È· ÌÈÈÁ ÈÏÚ· ¯Úˆ ˙„‚‡ 72
‰·È·Ò· ˙ÂÎÈ‡Ï ˜ÈÏ 4
‰ÙÈ Ï‡¯˘ÈÏ ‰ˆÚÂÓ‰ 33
ω˜‰ ÌÚ ‰ÈÈ˘Ú˙‰ ȯ˘˜Ï ‰˙ÂÓÚ‰ 13
ÒÂÓ‡ 10
ÌÈ‚‰Â ڷˉ ˙¢¯
ÌÈÓÏ Èχ¯˘È‰ „‚‡‰ 6 months
χ¯˘È· ‰·È·Ò‰ ˙ÂÎȇ ÔÚÓÏ ‰ÏÎÏΉ ˜˘Ó‰ ̯ÂÙ 10
ÌÈÈÁ‰Â ‰·È·Ò‰ ˙ÂÎÈ‡Ï ÌÈ·„˙Ó‰ È‚¯‡ ̯ÂÙ 7
Ï˘‰ ÊÎ¯Ó 3
ˆÈ 80
˙·„˙Ó ˙„·ÂÚ ÌÈ˘ Ô‚¯‡ ≠ ˙ÓÚ 80
‡ÓÈȘ≠˙· ÌÈÏ˘Â¯È 3 and half
Ô¯ËÏ· ÌȯÂÙȈ ˙„È„ ¯˜ÁÏ Ï¢È·‰ ÊίӉ
˙·ÏÎÏ ˙Èχ¯˘È‰ ˙„Á‡˙‰‰ 30
xxi
A Proposed Methodology for Developing Indicators
It has been suggested by some that indicators can be used to develop an index forquality of life akin to a nation’s GDP that measures economic performance. Suchan index, produced on a monthly or annual basis, can communicate to the publictheir community’s or country’s progress with respect to sustainable development.An index based on a common methodology can also be used to compare sustainabledevelopment across countries. As accounting systems move toward internalizingexternalities in analyzing market trends i.e.: including both man-made and naturalcapital, the need for sustainable development indexes will rise. The Institute forInnovation in Social Policy at Fordham University in the USA allows one tocompute a single measure of the overall quality of life based on indicators.10 Bycreating a longitudinal database for each indicator, changes in overall quality oflife over the last twenty to thirty years, depending on available data, can be tracked.
The Institute for Innovation in Social Policy (IISP) has developed a creativeprocess for aggregating disparate measures of quality of life into a single indicator.This provides a relatively objective overall score of quality of life for a given year.By tracking that overall measure over time, one can assess the overall directionand rate of change of quality of life. It is imperative that indicators presentinformation over time. An indicator should not be a “snap shot” of how we aredoing but rather a “serial” of where we are going. In other words, a valuableindicator is one that provides a trend.
Performance on each indicator is ranked on a scale of 0 to 100%. A rank of0% represents the worst measured performance of that indicator for the studiedtime period. A rank of 100% represents the highest measured performance for thatindicator. Indicator rankings are then averaged together for each year to producean annual ranking. Separate rankings can also be produced for a variety of indicatorsubsets. For example there can be separate tallies for the subcategories economy,environment, health, and culture.
Data sources will most likely focus heavily upon existing governmentaldata such as the Central Bureau of Statistics in Jerusalem. A good source of locallydisaggregated data is the publication of physical and socioeconomic data for localauthorities in Israel by the Central Bureau of Statistics in Jerusalem. These dataare for all communities in the country of 5,000 and over population. Currently,two publications exist, one presenting data for 1995 and the other for 1998.11 Afirst priority nonetheless should be to seek data sources that provide annual data
Sustainable Development Indicators for Measuring Israel’s Quality of Life

xxii
Toward a System of Sustainable Development Indicators in Israel
for as many years as possible. One cannot present a trend with two data points.Longitudinal data are essential for using the IISP methodology.
While there is clear benefits to utilizing available information, in no way shouldpresent monitoring and data collection drive the ultimate decision forcharacterizing sustainable indicators. To do so would be to cripple theinitiative from the outset. Israel would find itself like the proverbial fool,looking for his lost coins under the street lamp, not because he thought it wasthere, but because the street there was already lit. A sustainable indicatorsresearch initiative should define what new street lights need to be posted andwhat areas of uncertainty need to be illuminated.
ConclusionToday, sustainable development is an established component of Israel’s ostensiblepublic policy agenda. To reach this general objective, a higher level of resolutionis required, sustainability, ultimately has to leave the level of general definitionand be characterized in a measurable fashion. Indicators for sustainabledevelopment are tools that policy-makers can use to develop sustainabledevelopment programs for measuring quality of life.
Israel is about to embark on an indicator program. To maximize theeffectiveness of indicators as tools for measuring quality of life we advocate thatindicators be more than simple accounting measures. We suggest indicators shouldbe developed at both a national and a local level, that the public be involved in thedevelopment process and be informed of the results, that clear linkages among theenvironment, economy and society are presented and that local indicators reflectnational indicators and vice versa.

xxiii
Appendix 1: Sustainable Development Indicators for
Measuring Israel’s Quality of Life
Survey Questionnaire for Environmental Organizations in Israel
Dear:
The Jerusalem Institute for Israel Studies and the Hebrew University are developinga project on sustainable development indicators as a means of measuring Israel’squality of life. A sustainable development indicator is a numeric measure ofcommunity health and well being. A sustainable development indicator is differentfrom traditional indicators of a country’s progress such as GNP in that it takes intoaccount the linkages that exist among the economy, environment and society.Understanding how these three sectors interact with each other is critical indetermining the quality of life of the citizens of Israel.
An example of an indicator is the following on air quality. This indicator,from the Maine Economic Growth Council’s Measure of Growth 2001 report,clearly shows the number of days in Maine where air quality conditions wereunhealthy. This indicator clearly shows an improving trend of air quality overtime with an expected benchmark of zero poor air quality days in 2005. Theinformation presented by this indicator can be clearly understood by the generalpublic as a statement on the condition of the air they breathe.
Air quality is clearly linked to both society and economy. Poor air qualitycan mean increases in asthma rates in children; this can affect their attendance atschool and can result in poor school performance. Because quality of life measuressuch as the one above affect us all, they must be valid and understandable to abroad spectrum of users, detect problems and raise public awareness so the needfor change where necessary, is taken seriously. This survey therefore, seeks yourinput on the development of indicators for Israel.
Sustainable Development Indicators for Measuring Israel’s Quality of Life

xxiv
Toward a System of Sustainable Development Indicators in Israel
Source: www.mdf.org/megc/
We are interested in your opinions and views to the questions below. There are noright or wrong answers to the questions. This questionnaire is confidential and theinformation collected is for research purposes only.
Thank you in advance for your participation.
xxv
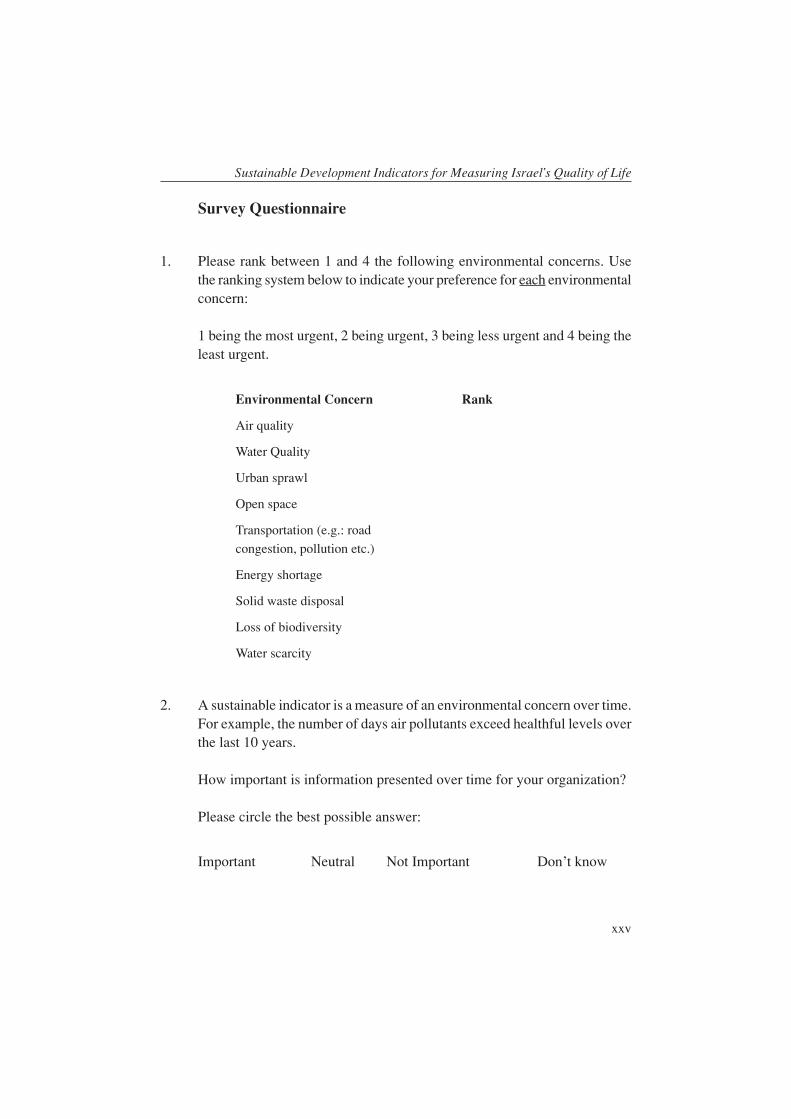
Survey Questionnaire
1. Please rank between 1 and 4 the following environmental concerns. Usethe ranking system below to indicate your preference for each environmentalconcern:
1 being the most urgent, 2 being urgent, 3 being less urgent and 4 being theleast urgent.
Environmental Concern Rank
Air quality
Water Quality
Urban sprawl
Open space
Transportation (e.g.: road
congestion, pollution etc.)
Energy shortage
Solid waste disposal
Loss of biodiversity
Water scarcity
2. A sustainable indicator is a measure of an environmental concern over time.For example, the number of days air pollutants exceed healthful levels overthe last 10 years.
How important is information presented over time for your organization?
Please circle the best possible answer:
Important Neutral Not Important Don’t know
Sustainable Development Indicators for Measuring Israel’s Quality of Life

xxvi
Toward a System of Sustainable Development Indicators in Israel
3. A well-designed sustainable indicator is one that clearly communicatesinformation to the public.
How important is information presented to the public for your organization?
Please circle the best possible answer:
Important Neutral Not Important Don’t know
4. In order to effectively communicate with the public, sustainable indicatorsmust be publicized in the media. Use the ranking system below to indicateyour preference for each public medium:
1 being the most effective, 2 being effective, 3 being not effective and 4being the least effective.
Public Medium Rank
Newspapers
Television
Radio
Community meetings
The Internet
5. Gathering the relevant data for a sustainable indicator is an important partin developing indicators.
How willing to help is your organization in the data gathering process?
Please circle the best possible answer:
Willing Neutral Not Willing Don’t know

xxvii
6. Would quality of life measures such as sustainable indicators be helpful inyour work in communicating with the public?
Please circle the best possible answer:
Helpful Neutral Not Helpful Don’t know
7. Would quality of life measures such as sustainable indicators be helpful inyour work in communicating with government agencies and ministries?
Please circle the best possible answer:
Helpful Neutral Not Helpful Don’t know
8. Would quality of life measures such as sustainable indicators be helpful inyour work in seeking funding for your organization’s activities?
Please circle the best possible answer:
Helpful Neutral Not Helpful Don’t know
9. Could you please provide the following information about your organization:
Briefly describe the main activity of your organization:
____________________________________________________________
____________________________________________________________
____________________________________________________________
Please indicate the number of years your organization has been in operation:
___________
Sustainable Development Indicators for Measuring Israel’s Quality of Life

xxviii
Toward a System of Sustainable Development Indicators in Israel
May we contact you again for further information?
Yes No
Would you be interested in receiving a copy of the final report on sustainabledevelopment indicators for Israel?
Yes No
You have now completed the questionnaire. Thank you for yourcooperation.

xxix
Notes
1 Carlin, S. and Weinstein R. (1998). Sustainable Indicators: A Review of NationalMethods and Suggestions for Long Island. Brookville, NY: Institute of SustainableDevelopment at Long Island University andInstitute for Sustainable Development at Long Island University, (2000) Indicators ofCommunity Sustainability: The City of Glen Cove, Long Island. Brookville, NY: Institutefor Sustainable Development at Long Island University.
2 www.undp.org/hdr2001, The Human Development Index (HDI) is a composite indexof a country’s population life expectancy, education and GDP, Norway ranks first with theUSA at sixth.
3 Sustainable Seattle, 1995. Indicators of a Sustainable Community: A status report onlong-term cultural, economic, and environmental health
4 Refer to Chenoweth (2001) for more details on these and other indicator systems.Chenoweth, J. (2001) Indicators for Sustainable Development in Israel. Working Paper#1, The Jerusalem Institute for Israel Studies, The Israel Environment Policy Center
5 Khenin, D., Ettinger, A., Epstein, M. and Hanson, M. (2000) Vital Signs 2000 Israel(The Chapters on Israel). The Heschel Center. (In Hebrew)
6 U.S. EPA, U.S. Environmental Protection Agency, Fiscal Year 1999, AnnualPerformance Report, Washington , D.C. (2000).
7 Reinhard Buetikofer, (2001)“Public Awareness in Germany — The Green Party,” inIncreasing Environmental Awareness in Israel and Palestine, (IPCRI-Jerusalem)..
8 Hanson, M. (2000) Domestic Waste In: Khenin, D., Ettinger, A., Epstein, M. andHanson, M. (2000) Vital Signs 2000 Israel (The Chapters on Israel). The Heschel Center.(In Hebrew)
9 Orr Karassin, (2001) “NonGovernment Organizations fot the Quality of theEnvironment and Life in Israel, A Survey,” National Environmental Priorities in Israel ,Neeman Institute/Life and Environment, Haifa.
10 Miringoff, Marc, et.al. 1999. The Social Health of the Nation: How America is ReallyDoing. Oxford Univ. Press.
Sustainable Development Indicators for Measuring Israel’s Quality of Life

xxx
Toward a System of Sustainable Development Indicators in Israel
A report on the social state of Connecticut in 1996 was developed based on this methodology.See the following URL for details:http://info.med.yale.edu/chldstdy/CTvoices/kidslink/kidslink2/reports/socialstate/ssindex.html
11 Local Authorities in Israel 1995, Physical Data. Central Bureau of Statistics, Jerusalem,Publication No.: 1046 and Local Authorities in Israel 1998, Physical Data. Central Bureauof Statistics, Jerusalem, Publication No.: 1134
xxxi
Indicators of Sustainable Development:
A Review of the Existing State of Knowledge
Jonathan Chenoweth
AbstractAs part of the process of working towards sustainable development there is a needto measure the level of sustainability of society and development, as well as trendsover time in a simplified format. Indicators serve the functions of simplification,quantification, and communication of complex information. One of the most widelyknown methodologies for the selection of indicators is the Pressure-State-Response(PSR) framework put forward by the OECD. This model is based upon the con-cept that pressures are exerted by human activities on the state of the environmentand natural resources, with there being a response to these changes through avariety of environmental, economic, and sectoral policies. Due to the limitationsof the PSR framework, such as it assumption of simple linear linkages betweenthe different pressures, states, and response categories of the framework, or itsinadequate attention towards economic and social aspects of sustainable develop-ment, this framework can only serve as a general indication of what sustainabilityindicators might encompass.
Variations on the PSR framework include the Driving force- state- response(DSR) framework adopted by the UN Commission on Sustainable Development(UNCSD). This framework recognizes that human activities can be positive ornegative, and permits the inclusion of economic, social, and institutional aspectsrelating to sustainable development. Testing of the DSR framework developed bythe UNCSD by individual countries has revealed that the many of the indicatorsselected do not reflect sustainable development, as it is generally conceived, spe-cifically enough, and the lack of any integration of social, economic, and environ-mental issues within this framework was found to be a major shortcoming. Alter-native frameworks to the PSR, DSR and other derived frameworks are under de-velopment by national bodies, such as the French Institute of the Environment,and seek to avoid the limitations of these frameworks.

xxxii
Toward a System of Sustainable Development Indicators in Israel
Reference values are useful in assisting with the interpretation of indicatorswhile the aggregation of indicators can be useful when trying to access overallprogress towards sustainable development; both can be difficult to achieve in away that is meaningful. Issues of scale make the selection of indicators difficult aswhat is appropriate at a national scale may be meaningless at a local scale, andpractical considerations can limit the types of indicators that can be incorporatedinto an indicator framework. The development of a central indice of sustainabledevelopment for a national framework is not useful as the purpose at this level isnot to compare countries but rather to identify the existing situation and internaltrends within the country.
IntroductionThe concept of sustainable development has gained prominence over the last twodecades, with notions of sustainability being included in many governmentpolicies around the world. As part of this process of working towards sustainabledevelopment, there has been a growing need to find ways to measure the real levelof sustainability of society and development. This has led to the search formethods of selecting sustainable development indicators, as well as indicatorsthemselves.
Definitions
According to Lusigi (1995) sustainability is not a new concept but is tied in withthe basic human desire to survive; the notion of sustainable yield, however, hasbeen applied scientifically to resources management since the late 19th century.More recently, the concept of sustainability has served as a significant focus ofrenewed environmental attention (Simpson, 1996).
There is no universally accepted definition of sustainable development withthere being more than 70 definitions of the term given in the literature (UNEP,1995). There are two frequently cited and relatively widely accepted definitionsof sustainable development. One of these is the definition given by the WorldCommission on Environment and Development (1987, p43) in Our CommonFuture (or the Brundtland report) stating that “Sustainable development is devel-opment that meets the needs of the present without compromising the ability offuture generations to meet their own needs”. The other major internationally ac-

xxxiii
cepted working definition of sustainable development is the whole of Agenda 21,the document resulting from the United Nations Conference on Environment andDevelopment held in Rio de Janeiro in June 1992 (Dahl, 1997). It is a very wideranging definition that covers issues ranging from housing provision, social struc-tures, equal opportunity, and greater empowering of indigenous people, women,and young people in environmental decision making (Simpson, 1996).
In the context of the Mediterranean, the UNEP proposed that sustainabledevelopment could be considered as “Development which is respectful of the en-vironment, technically appropriate, economically viable and socially acceptableto the meet the needs of present generations without endangering the possibilityof future generations to satisfy theirs” (UNEP, 1995, p9).
The definition of sustainable development is further developed (andcomplicated) by some authors, such as Serafy (1996) and Noel and O’Connor(1998) who use terms strong and weak sustainability. Weak sustainability holdsthat sustainability can be maintained by substituting human and manufacturedcapital for natural capital, whereas the concept of strong sustainability holds thathuman capital is not a substitute for natural capital since the two are distinct anddifferent (Noel & O’Connor, 1998). Depending upon which of these two defini-tions is chosen, there is a significant effect on how indicators of sustainability arechosen and used.
The above definitions of sustainability provide a clear indication of what ismeant by the term sustainable development but they do not necessarily provide asimple definition that readily allows the degree of sustainability to be measured orto permit a development to be assessed as sustainable or unsustainable. Beingable to do this is critical, however, if a meaningful set of indicators of sustainabledevelopment are to be compiled and used by policy makers. An alternative (andcomplementary) way of defining sustainability might be to form a negativedefinition and say that sustainable development is any development which is notunsustainable in the long term. This definition, advanced in the Israeli SustainableDevelopment Strategy, would have the advantage that it is easier to define what isunsustainable than agree upon what is sustainable.
Use of Sustainability Indicators
Concepts of sustainable development always involve timescales, but because mostforms of development will involve the use of some resources which are renewable
Indicators of Sustainable Development: A Review of the Existing State of Knowledge
xxxiv
Toward a System of Sustainable Development Indicators in Israel
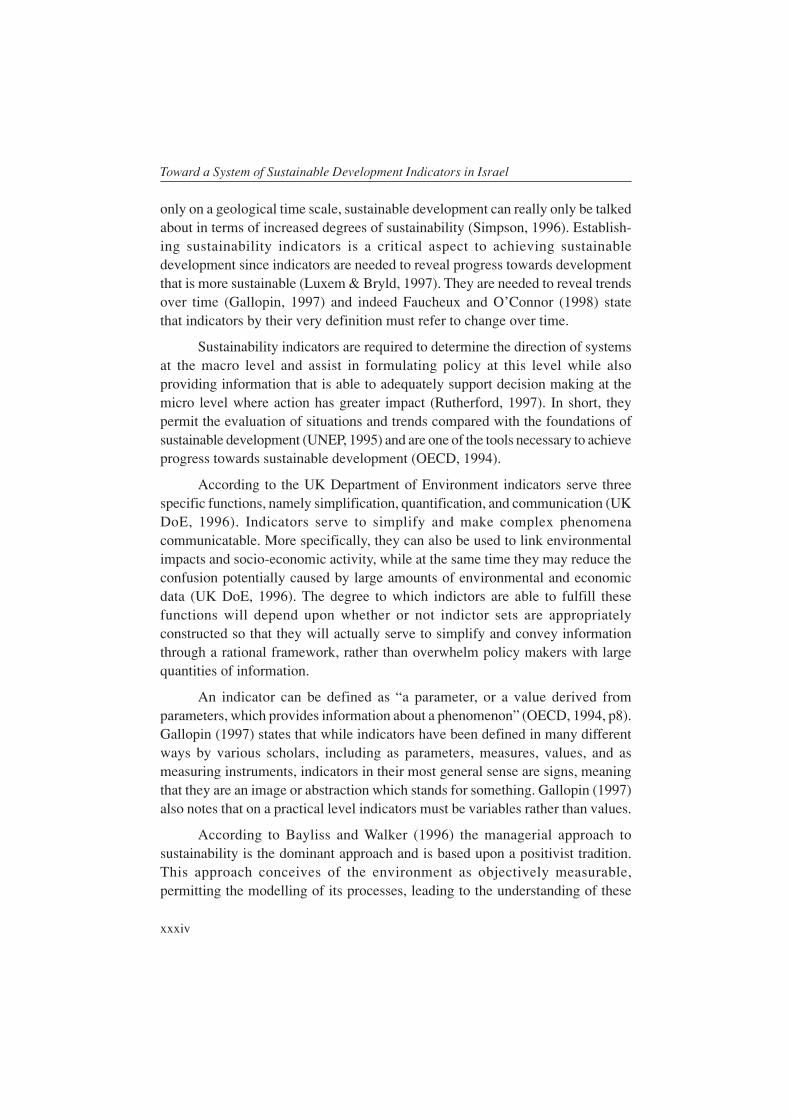
only on a geological time scale, sustainable development can really only be talkedabout in terms of increased degrees of sustainability (Simpson, 1996). Establish-ing sustainability indicators is a critical aspect to achieving sustainabledevelopment since indicators are needed to reveal progress towards developmentthat is more sustainable (Luxem & Bryld, 1997). They are needed to reveal trendsover time (Gallopin, 1997) and indeed Faucheux and O’Connor (1998) statethat indicators by their very definition must refer to change over time.
Sustainability indicators are required to determine the direction of systemsat the macro level and assist in formulating policy at this level while alsoproviding information that is able to adequately support decision making at themicro level where action has greater impact (Rutherford, 1997). In short, theypermit the evaluation of situations and trends compared with the foundations ofsustainable development (UNEP, 1995) and are one of the tools necessary to achieveprogress towards sustainable development (OECD, 1994).
According to the UK Department of Environment indicators serve threespecific functions, namely simplification, quantification, and communication (UKDoE, 1996). Indicators serve to simplify and make complex phenomenacommunicatable. More specifically, they can also be used to link environmentalimpacts and socio-economic activity, while at the same time they may reduce theconfusion potentially caused by large amounts of environmental and economicdata (UK DoE, 1996). The degree to which indictors are able to fulfill thesefunctions will depend upon whether or not indictor sets are appropriatelyconstructed so that they will actually serve to simplify and convey informationthrough a rational framework, rather than overwhelm policy makers with largequantities of information.
An indicator can be defined as “a parameter, or a value derived fromparameters, which provides information about a phenomenon” (OECD, 1994, p8).Gallopin (1997) states that while indicators have been defined in many differentways by various scholars, including as parameters, measures, values, and asmeasuring instruments, indicators in their most general sense are signs, meaningthat they are an image or abstraction which stands for something. Gallopin (1997)also notes that on a practical level indicators must be variables rather than values.
According to Bayliss and Walker (1996) the managerial approach tosustainability is the dominant approach and is based upon a positivist tradition.This approach conceives of the environment as objectively measurable,permitting the modelling of its processes, leading to the understanding of these

xxxv
processes that is required for their management. Indictor frameworks permitissues relating to environmental problems and their associated interconnections tobe considered systematically (UK DoE, 1996).
Sustainability is often considered under the three broad headings of eco-nomic, social, and ecological sustainability, with these categories referring to boththe system to be sustained as well as the types of units that may be used tomeasure the sustainability of the system (Faucheux & O’Connor, 1998). Faucheuxet al (1998) argue, however, that methods which have received much popularattention, such as assessing sustainability through indicators which focus uponchanges in capital stocks, both natural and manufactured, are empirically suspectin their approach.
Hodge et al (1995) examine the indicator needs of the different elementswithin a society, including individuals and households, communities, corpora-tions, and the government. They note that all of these different groups within asociety require indicators that allows them to assess how their activities impactupon the environment if they are to be aware of how their individual decisionsimpact upon the sustainability of development.
Sustainability indicators are related to but not the same as indicators used instate-of-the-environment reporting. State-of-the-environment reporting has gonefrom having a narrow focus on environmental and resource use in the 1970s to anexamination of the relations between environmental and socio-economic proc-esses within an overall focus upon sustainable development (Bosch, 2000).
Sustainable Development Indictor FrameworksAdopting some sort of methodological framework for the selection and orderingof indicators is of fundamental importance if a meaningful set of indicators is tobe selected which will permit effective assessment of progress towardssustainable development.
The Pressure-State-Response Framework
Just as there is no universally accepted definition of sustainable development,there is not yet a universally accepted framework that permits assessment of whetherdevelopment is becoming more or less sustainable (UK DoE, 1996). One of the
Indicators of Sustainable Development: A Review of the Existing State of Knowledge

xxxvi
Toward a System of Sustainable Development Indicators in Israel
more widely known and discussed methodologies for the selection of indicators isthe Pressure-State-Response (PSR) framework put forward by the Organisationfor Economic Co-operation and Development (OECD). This model is based uponthe concept that pressures are exerted by human activities on the state of theenvironment and natural resources, with there being a response to these changesthrough a variety of environmental, economic and sectoral policies (OECD, 1994).The PSR framework refers to three broad categories of sustainability indicators,indicators of environmental pressures, indicators of environmental conditions, andindicators of societal responses. Indicators of environmental pressures, (relatingto the pressure category of the PSR framework), describe environmentalpressures resulting from human activities (OECD, 1994). Indicators of environ-mental conditions, relating to the state category of the PSR framework, describethe quality of the environment and the quality and quantity of natural resourceswith such indicators intended to give an overview of the state of the environmentand its development over time (OECD, 1994). Indictors of societal responses,relating to the response category of the PSR framework, measure the degree towhich society, both through individual and collective actions, is responding toenvironmental concerns (OECD, 1994). The OECD (1994) notes that althoughthe PSR framework is based on the concept of causality and tends to suggestlinear relationships of human-environment interaction, this should not preventmore complex human-environmental interactions being observed.
A summary of the OECD indicators, showing how they relate to the PSRframework is given in Table 2.1.

xxxvii
Tables 2.1: Summary of the OECD indicators. (Source: OECD, 1994, p14).
Issue Pressure: State: Response:Indicators of Indicators of Indicators ofenvironmental environmental societal responsespressures conditions
Climate Change -Index of -Atmospheric -Energy efficiencygreenhouse gas concentration of -Energy intensityemissions greenhouse gases -Economic and-CO2 emissions -Global mean fiscal instruments
temperature
Ozone layer -Index of apparent -Atmospheric -CFC recovery ratedepletion consumption of concentrations of
ozone deleting ozone depletingsubstances substances-Apparent -Ground levelconsumption of UV-B radiationCFCs and halons
Eutrophication -Emissions of N -BOD / DO, -% of populationand P in water concentrations of connected toand soil N and P in inland biological and / or-N from fertilizer water and in chemical sewageuse and from marine waters. treatment plantslivestock -% of population-P from fertilizer connected to sewageuse and from treatment plantslivestock -User charges for
waste water treatment-Market share ofphosphate-freedetergents
Acidification -Index of acidify- -Exceedance of -% of car fleeting substances critical loads of equipped with-Emissions of pH in water and catalytic convertersNOx and SOx soil -Capacity of SOx
-Concentrations in and NOx abatementacid precipitation equipment of
stationary sources
Indicators of Sustainable Development: A Review of the Existing State of Knowledge

xxxviii
Toward a System of Sustainable Development Indicators in Israel
Issue Pressure: State: Response:Indicators of Indicators of Indicators ofenvironmental environmental societal responsespressures conditions
Toxic -Emissions of -Concentration of -Changes of toxiccontamination heavy metals heavy metals and contents in products
-Emissions of organic compounds production andorganic compounds in environmental processes-Consumptionof media and in living -Market share ofpesticides species unleaded petrol
-Concentration ofheavy metals inrivers
Urban -Urban air emissions: -Population -Green spaceenvironmental SOx, NOx, VOC exposure to air -Economic, fiscal, andquality -Traffic density pollution and noise regulatory instruments
(urban and national) -Ambient water -Water treatment-Degree of conditions in and noise abatementurbanization urban areas expenditures
Biodiversity / -Habitat alteration -Threatened or -Protected areas aslandscape and land extinct species as a % of national
conversion from a share of total territory and typenatural state species known of ecosystem
Waste -Waste generation: Not Applicable -Waste minimizationmunicipal, -Recycling rateindustrial, nuclear, -Economic andand hazardous fiscal instruments,
expenditures
Water resources -Intensity of use -Frequency, duration -Water prices andof water resources and extent of user charges for
water shortages sewage treatment
Forest resources -Actual harvest / -Area, volume and -Forest area manage-productive capacity structure of forests ment and protection
Fish resources -Fish catches -Size of spawning -Forest area manage-stocks ment and protection

xxxix
Issue Pressure: State: Response:Indicators of Indicators of Indicators ofenvironmental environmental societal responsespressures conditions
Soil degradation -Erosion risks: -Degree of top -Rehabilitated areas(desertification potential and actual soil lossesand erosion) land use for
agriculture-Changes in land use
General -Population growth Not Applicable -Environmentalindicators not and density expendituresattributable to -Growth of GDP -Pollution controlspecific issues -Private final and abatement
consumption expendituresexpenditure -Public opinion-Industrial production-Structure of energy-Road traffic volumes-Stock of roadvehicles-Agriculturalproduction
Problems with the PSR framework
The above framework outlined in Table 1.1 outlines a large number of potentialindicators of changes in pressures, states, and responses relating to human inter-action with the environment. Unfortunately for many of the indicators given, meas-urement in any meaningful way is either extremely complex or even impractical,and for other indicators careful and detailed definitions are needed first beforethey can be used. Examples include “Green space” appearing in the Responsesection of the Urban environmental quality category. Quantifiably measuring thisin a meaningful way across time within a single country or city, or in a compari-son of several countries is problematic since the value of green space to societydoes not depend so much upon its total area but the relative significance of thegreen spaces which are preserved. Green space in the central business district of alarge city has much greater significance than green reservations appearing in a
Indicators of Sustainable Development: A Review of the Existing State of Knowledge

xl
Toward a System of Sustainable Development Indicators in Israel
predominantly rural area. The value of any given piece of green space will alsodepend upon how it is managed or developed. Wasteland does not necessarilyhave the same value to a community as well managed parkland. Similarly, thepreservation of small areas of habitat that support endangered species is moresignificant than the preservation of large areas of less critical land, and wildlifecorridors can also have a significance beyond which can be measured in land areaalone.
Other problematic variables appearing in the OECD list of indicatorsinclude “Population exposure to air pollution”, which is again difficult to measuremeaningfully. Similarly “Water treatment and noise abatement expenditures” isalso problematic. A decrease in spending may be good since it might indicate thatproblems are decreasing, thus requiring reduced expenditure, or may indicate thatsustainability is decreasing due to reduced attention being applied to a significantand continuing problem.
“Waste minimization” and “Recycling rate” are also extremely complicated.For some products, life cycle analysis may indicate that recycling is not the mostenvironmentally sustainable option, and in some countries or regions, recyclinggenerally may have a greater economic and environmental cost than benefit. Thiswould frequently be the case, for example, in desert regions where population issparse. In such regions, transport and processing costs (both economic andenvironmental) for recycling will be high while landfill sites may be plentiful.Similarly, in relation to water prices, rising prices may represent increased or de-creased sustainability and will depend upon the conditions present in a country,both economic and environmental.
With the examples of problems outlined above, the pressure, state, responseframework can only serve as a general indication of what sustainability indicatorsmight encompass, rather than a definitive and practical set of indicators. Further-more because significant further development on a country-by-country basis orregion-by-region basis is still required, the different practical sets of indicatorsthat are developed based on this framework will not necessarily be comparablebetween regions or countries.
There is a significant amount of discussion in the literature relating to thePSR framework of the OECD. Mortensen (1997) notes that the term “pressure” isnot an exact description of human impacts in relation to sustainable developmentsince such impacts may be both positive and negative. Rutherford (1997) alsonotes problems with the framework, pointing out that there are problems linkingpressures, states, and responses within single countries (due to external environ-

xli
mental impacts) which have caused many analysts to conclude that it is best tofocus only on pressure indicators. Others, like Gallopin (1997), note that users ofthe PSR framework are often tempted to use the simple linear linkages of thedifferent pressures, states, and responses suggested by the frameworkmechanistically with this resulting in invalid inferences and wrong policy recom-mendations. The feedback loop between environmental and human interactions ismissing from the PSR framework (UNEP, 1995). Certainly the linkages suggestedby the pressure, state, response framework are rather simplistic and possibly notparticularly useful in assisting policy makers. Another problem with the PSR frame-work of the OECD is that the indictors are essentially descriptive, and contain nothreshold values or norms against which sustainability can be evaluated (Boisvertet al., 1998).
The UK Department of the Environment (1996) in relation to the PSR frame-work and its own selection of sustainability indicators found that it was necessaryto modify the framework in order to assess progress towards sustainable develop-ment as a whole rather than just the more limited environmental focus of the PSRframework. The indicators chosen by the Department of the Environment werechosen to also reflect the state of the economy as well as that of the environment(UK DoE, 1996). In a similar vein, Gallopin (1997) adds that even whenconsidered as an environmental indicator framework only, the PSR framework isuseful for ordering indicators but the task of establishing indicators withfunctional causality of human and environmental interactions remains. Doing this,however, is critical to forming an indicator framework that can effectively assistpolicy makers.
Variations to the PSR framework
The PSR framework of the OECD has formed the basis of other sustainable devel-opment indicator frameworks which have been developed subsequently or adoptedby individual countries. Notable among these is the Driving force — State —Response (DSR) framework that was adopted by the United Nations Commissionon Sustainable Development in 1995 (Mortensen, 1997). This framework isessentially an adaptation of PSR framework of the OECD. It recognizes that theimpact of human activities can be both positive and negative, unlike the term“pressure” of the PSR framework (Mortensen, 1997). The term driving force alsopermits the inclusion of economic, social, and institutional aspects relating tosustainable development.
Indicators of Sustainable Development: A Review of the Existing State of Knowledge

xlii
Toward a System of Sustainable Development Indicators in Israel
The different categories of sustainable development and every chapter ofAgenda 21 is reflected in the DSR framework in which there is a distinctionbetween the different categories of sustainable development, namely social,economic, environmental, and institutional. A number of criteria for the selectionof indicators for the framework by the United Nations Commission on Sustain-able Development are outlined by Mortensen (1997). The indicators selected onthe basis that they are:
primarily national in scale or scope
relevant for assessing progress towards sustainable development
readily understandable
within the general capacities of national governments
conceptually well-founded
limited in number but adaptable to future requirements
relevant to Agenda 21
largely reflective of international consensus
dependant upon accessible data.
Approximately 130 indicators were approved by the United Nations Commissionon Sustainable Development at its third work session in April 1995 (UnitedNations Commission on Sustainable Development, 1996). The indicators of theDSR framework are not linked causally either horizontally or vertically by thisframework. Mortensen (1997) states that this has the advantage that the frame-work does not make simplistic assumptions on the basis of difficult to establishcausal links, and when the framework is used indicators can be selected on thebasis of whether or not they fulfil the criteria outlined only rather than to fill out aspecific cell in a framework.
Berger (1997) notes that there may be serious difficulties with the DSRframework if it assumes that rapid environmental change is always the result ofhuman activity while natural change is gradual, benevolent and predictable. Heargues that when assessing progress towards sustainable development, the effectsof natural processes and change must also be acknowledged. Such considerationsmust certainly apply to processes such as climate change, where scientificevidence suggests huge natural variation in the past.
xliii
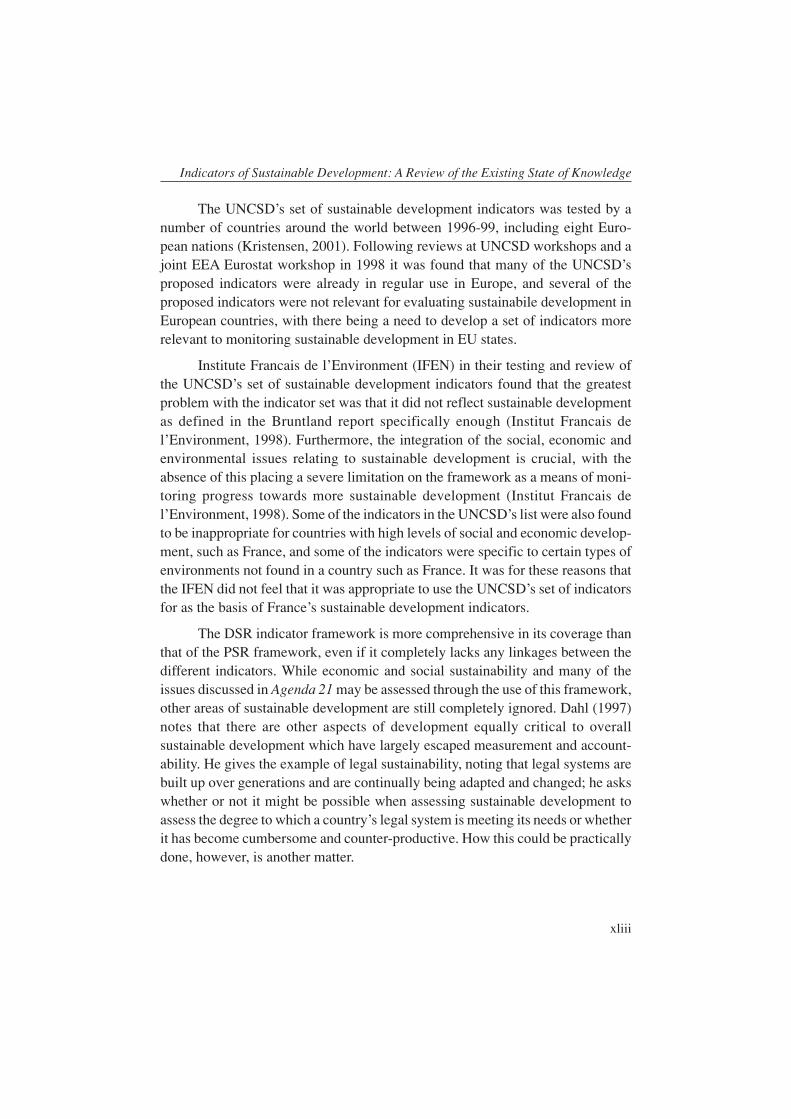
The UNCSD’s set of sustainable development indicators was tested by anumber of countries around the world between 1996-99, including eight Euro-pean nations (Kristensen, 2001). Following reviews at UNCSD workshops and ajoint EEA Eurostat workshop in 1998 it was found that many of the UNCSD’sproposed indicators were already in regular use in Europe, and several of theproposed indicators were not relevant for evaluating sustainabile development inEuropean countries, with there being a need to develop a set of indicators morerelevant to monitoring sustainable development in EU states.
Institute Francais de l’Environment (IFEN) in their testing and review ofthe UNCSD’s set of sustainable development indicators found that the greatestproblem with the indicator set was that it did not reflect sustainable developmentas defined in the Bruntland report specifically enough (Institut Francais del’Environment, 1998). Furthermore, the integration of the social, economic andenvironmental issues relating to sustainable development is crucial, with theabsence of this placing a severe limitation on the framework as a means of moni-toring progress towards more sustainable development (Institut Francais del’Environment, 1998). Some of the indicators in the UNCSD’s list were also foundto be inappropriate for countries with high levels of social and economic develop-ment, such as France, and some of the indicators were specific to certain types ofenvironments not found in a country such as France. It was for these reasons thatthe IFEN did not feel that it was appropriate to use the UNCSD’s set of indicatorsfor as the basis of France’s sustainable development indicators.
The DSR indicator framework is more comprehensive in its coverage thanthat of the PSR framework, even if it completely lacks any linkages between thedifferent indicators. While economic and social sustainability and many of theissues discussed in Agenda 21 may be assessed through the use of this framework,other areas of sustainable development are still completely ignored. Dahl (1997)notes that there are other aspects of development equally critical to overallsustainable development which have largely escaped measurement and account-ability. He gives the example of legal sustainability, noting that legal systems arebuilt up over generations and are continually being adapted and changed; he askswhether or not it might be possible when assessing sustainable development toassess the degree to which a country’s legal system is meeting its needs or whetherit has become cumbersome and counter-productive. How this could be practicallydone, however, is another matter.
Indicators of Sustainable Development: A Review of the Existing State of Knowledge

xliv
Toward a System of Sustainable Development Indicators in Israel
Other issues that indictors of sustainability could assess include social co-hesion, and moral, ethical, and spiritual sustainability as these are all central tohuman interaction and must support development (Dahl, 1997). Dahl (1997) sug-gests that a society might appear to be materially successful while it is losing itsmoral core, and then later decline into anarchy. Spiritual and cultural sustainabilitymust play an indirect but critical role in a society working towards developmentthat is more sustainable since spiritual and cultural beliefs can have a major im-pact on daily patterns of life. Where such beliefs induce non-sustainable trends orpractices, overall progress towards sustainability might be hindered. Examples ofthis might include beliefs and practices that promote unsustainable birth rates orthe use of products derived from endangered plants and animals. Deriving indica-tors to measure spiritual and cultural sustainability is likely to be even more prob-lematic than doing this for legal sustainability.
The first set of indicators of sustainable development produced by theUNCSD was revised during 1999 and 2000, with a new core set of 57 indicatorsthen being proposed (Kristensen, 2001). This set is structured into 15 themes,such as health or atmosphere, and 38 sub-themes. Examples of sub-themes for thehealth theme include sanitation and drinking water, while sub-themes for atmos-phere include climate change, ozone layer depletion and air quality (Kristensen,2001).
Alternatives to the PSR (and variations) framework
The work of the French Institute of the Environment
At the French Institute of the Environment (IFEN) it is believed that there are fourpossible ways to deal with the development of sustainable development indicators(Lavoux et al., pers. comm., 2001). These are:
- Recycling of environmental indicators.
- Making use of international experiences at producing sustainable developmentindicators, including the work of the UNCSD, OECD, and others.
- Developing performance indicators that relate to sustainable developmentstrategies.
- Starting from scratch to build a new system of sustainable developmentindicators.

xlv
The first option, recycling environmental indicators was thought by the IFEN tobe too narrow since it doesn’t permit the adequate consideration of the social andeconomic aspects of sustainable development, while the third option, developingperformance indicators that relate to a sustainable development strategy is onlypossible in countries with an officially accepted (and detailed) strategy of sustain-able development.
The second and fourth of the above options were adopted by IFEN in theirdevelopment of sustainable development indicators (Lavoux et al., pers. comm.,2001). The second option, making use of international experiences in the develop-ment of sustainable development indicators, in particular the PSR and its derivedframeworks was not adopted for the basis of sustainable development indicatorsas such, but rather as the basis of environmental reporting due to the limitations ofthis framework noted in the previous section. Hence, a PSR type framework (andother international experiences) are used by the IFEN for environmental reportingsimultaneously together with the IFEN’s own framework that is specific tosustainable development indicators (Lavoux et al., pers. comm., 2001).
The IFEN has produced a modular sustainable development indicator frame-work structure, consisting of ten modules (Rechatin et al., 1997). These are:
1. Assessing development
2. Linking flows and stocks
3. Status of heritage
4. Geographical distribution
5. Links with the external world
6. Social distribution of assets and nuisances
7. Access to heritage assets
8. Description of preference and grievances
9. Trust / mistrust in the future
10. Resilience and flexibility
These modules and how they interrelate is outlined in a schematic diagram / modelin Figure 2.1. The object is to assess to what extent the dynamics and structure ofa given type of development (module 1) are likely to meet the needs of presentand future generations (modules 6 to 9) while also ensuring appropriate renewal
Indicators of Sustainable Development: A Review of the Existing State of Knowledge

xlvi
Toward a System of Sustainable Development Indicators in Israel
of required capital and assets in their different forms (modules 2 to 5) (Rechatin etal., 1997). In addition, module 10, attempts to introduce the notion ofunforeseeable circumstances and assesses how the activity system described isable to respond to external events. Although the modules are inter-linked, they areassembled in such a way as to allow each one to be described and assessedindependently of the others (Rechatin et al., 1997).
Figure 2.1: The IFEN modular framework for sustainable development indicators. (Source: Rechatin, C., Theys, J., Lavoux, T., & Piveteau, V., (1997) Indicators of sustainable Development: A synopsis of work abroad and key points of Discussion, IFEN, Orleans, France.

xlvii
The core module, assessing development, focuses upon assessing the extent towhich an increase in an activity is associated with an increase in resource use orpollution (Rechatin et al., 1997). This module also assesses the scale of activities,products, or services which are linked to the environment. A time element isincluded and thus a distinction is made between investment and consumer goods,durable and non-durable goods, in terms of pollution between persistent and non-persistent pollution, and for resource use whether nor not use is reversible or nonreversible.
Modules 2 to 5 focus upon the quality of heritage and capital (Rechatin etal., 1997). Module 2, linking flows and stocks, links data on flows of naturalresources, investment, pollution, etc. with data on stocks. This permits ratios, suchas pollution flow / pollution stock, or resource use / stock increase, to be calculated.This module also allows assessments of rates of capital recharge, and the balancebetween labour demand and supply. Module 3 focuses upon the current state ofheritage, linking up national and local approaches to construct indicators of wealth.Module 4, geographical distribution, permits the inclusion of indicators of densityand indicators of carrying capacity, and permits inter-zone comparisons. Module5 takes the geographical dimension a step further by linking national data withinternational and global data (Rechatin et al., 1997).
Modules 6 to 9 encompass indicators relating to the meeting of the needs ofpresent and future generations (Rechatin et al., 1997). They focus upon questionsof needs and their fulfillment rather than heritage and wealth issues. Module 6,social distribution of assets and nuisances, links output from productive systemsto the fulfillment of present and future needs, while considering distributionmechanisms between both current and future generations. Module 7 looks ataccess to heritage assets, while module 8 describes the relationships betweenpreferences and their fulfillment together with associated institutional regulatorymechanisms, building up a picture of preferences and mechanisms for handlingdissatisfaction. Module 9, trust / mistrust in the future, adds a temporal dimensionto the consideration of preferences by describing to what extent do preferencesreflect a bias in favour of the present or of the future (Rechatin et al., 1997). Thismodule contains indicators measuring things such as long-term interest rates, debtand savings ratios, etc.
Module 10, reliance and flexibility, differs from the other modules whichare all based upon continuity in trends. This module assesses the ability of a society,an economy, or an ecosystem to adapt to unforeseeable event and major upheavals(Rechatin et al., 1997).
Indicators of Sustainable Development: A Review of the Existing State of Knowledge

xlviii
Toward a System of Sustainable Development Indicators in Israel
At this stage France is envisaging a maximum of 80 indicators of sustain-able development. While it is recognized that a smaller number of indicators isgood theoretically, this is very difficult to achieve in practice (Lavoux et al., pers.comm., 2001). These indicators are being selected by committees, beginning in1998-99 with three committees (Lavoux et al., pers. comm., 2001). The threecommittees were economic, social, and geographical scales and the environment,with about 20 to 30 people in each committee. The committees tried to bemultidisciplinary in their approach rather than just focus on their specific area.Initially they worked separately before a plenary session of the combinedcommittees was held. As a result of this brainstorming session, a preliminary listof 20 headings was produced. In 2000-01 about ten people were involved in brain-storming exercises to produce a list of 300 indicators. This list has subsequentlyshortened to 80 indicators, with the modular structure outlined above beingdeveloped.
Interpretation and use of indicators
The OECD (1994) notes that different users of indicators will have different needsbut that generally indicators are only one form of environmental evaluation andshould be supplemented with qualitative and other information. The UNEP (1995)adds that indicators should be presented to users clearly in appropriate formats,such as maps for geographical data and graphics for statistical trends. Niessen etal (1995) make essentially the same point when they state that it is crucial to useappropriate visualization techniques. As larger numbers of indicators are includedwithin an indicator framework this must become ever more important.
The IFEN in France expects that its sustainable development indicatorswill be used for the benefit of the public, decision makers, researchers, and so on(Lavoux et al., pers. comm., 2001). Being able to influence decision makers isseen as being important, with decision makers being particularly sensitive to pub-lic opinion. Therefore working with the media to reach the public and thus indi-rectly reach decision makers is necessary.
Targets for indicators
The UK Department of the Environment (1996) argues that the interpretation ofindicators is facilitated by having targets or guideline levels against which indica-

xlix
tors can be compared, with such targets ideally corresponding to paths that can besustained in the long term. This same concept is also discussed by the Niessen etal (1995) who refer to the term reference values, the desired numerical or nominalvalue of indicators. They argue that without adequate reference values changes inindicator values do not necessarily have any meaning. Reference values also fa-cilitate comparisons across environmental issues.
Alternatively to having target values against which indicators are measured,a more practical alternative may be to have values which indicate non-sustainability.This relates back to the alternative definition of sustainability proposed in theintroduction whereby sustainable is defined as something which is notunsustainable. Such values of non-sustainability may need to be two tiered. Thefirst tier would be the value for an indicator which if maintained in the long termis unsustainable but which if exceeded in the short term is of relatively minorconcern. The second tier would be the value for an indicator beyond whichessentially irreparable damage on society or the environment is inflicted. In termsof a nation’s economic growth, slight negative growth is not un-sustainable in theshort term but is unsustainable in the long term. Complete economic collapse,however, is completely unsustainable even in the short term. In terms of waterresources use, water can be pumped at a level above the average annual rate ofreplenishment from a reservoir or aquifer during times of drought, thus passingthe first tier of non-sustainability, but if such a rate of pumping continuesindefinitely then permanent damage to the water resources will eventually besustained.
Aggregation of indicators
According to Dahl (1997), building an overall perspective when assessing progresstowards sustainable development requires the assembly of many specificdimensions and interrelationships, with this aggregation raising complex techni-cal and methodogical issues. Despite the problems that doing this raises, Samuel-Johnson et al (2000) argue that there is a need for an environmental sustainabilityindex, expressed as a single measure for each economy, which would functionsimilarly to that of Gross Domestic Product, acting as a benchmark for judgingprogress towards sustainable development rather than economic growth.
Traditionally, economic approaches of aggregation have involved convert-ing all measures into monetary values but this requires the generation of surrogatevalues for non-market goods (Dahl, 1997). Another issue raised by Dahl (1997) is
Indicators of Sustainable Development: A Review of the Existing State of Knowledge
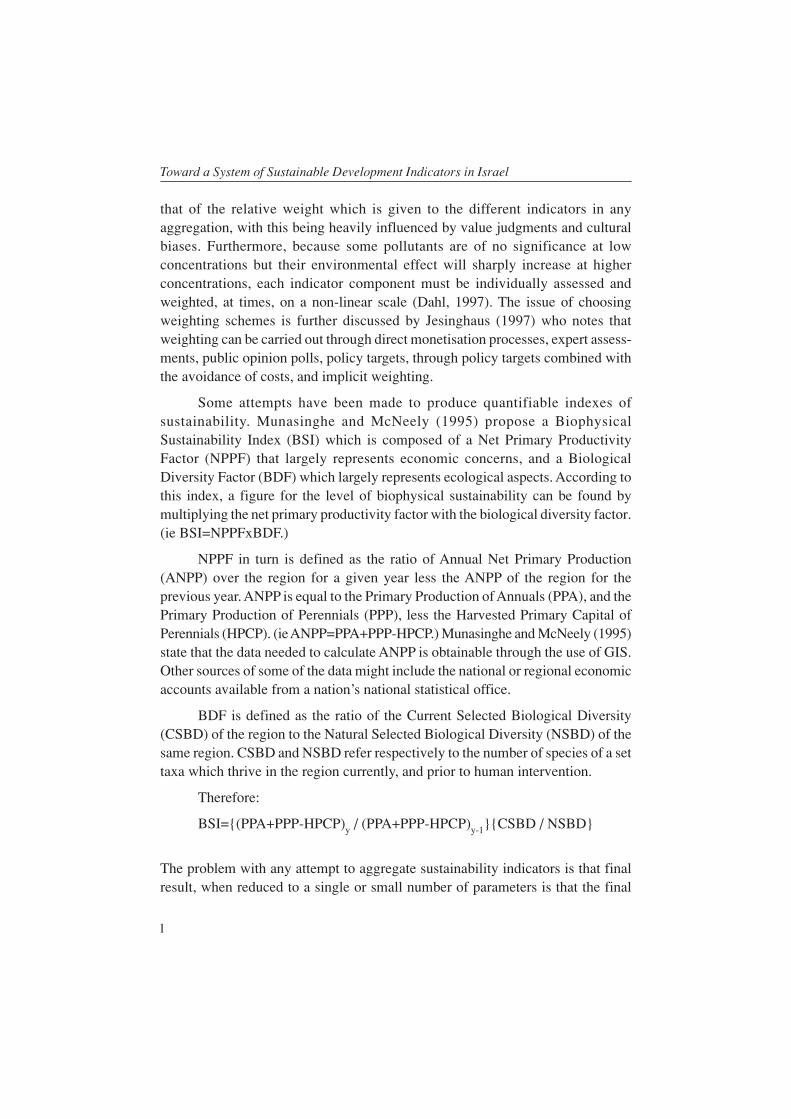
l
Toward a System of Sustainable Development Indicators in Israel
that of the relative weight which is given to the different indicators in anyaggregation, with this being heavily influenced by value judgments and culturalbiases. Furthermore, because some pollutants are of no significance at lowconcentrations but their environmental effect will sharply increase at higherconcentrations, each indicator component must be individually assessed andweighted, at times, on a non-linear scale (Dahl, 1997). The issue of choosingweighting schemes is further discussed by Jesinghaus (1997) who notes thatweighting can be carried out through direct monetisation processes, expert assess-ments, public opinion polls, policy targets, through policy targets combined withthe avoidance of costs, and implicit weighting.
Some attempts have been made to produce quantifiable indexes ofsustainability. Munasinghe and McNeely (1995) propose a BiophysicalSustainability Index (BSI) which is composed of a Net Primary ProductivityFactor (NPPF) that largely represents economic concerns, and a BiologicalDiversity Factor (BDF) which largely represents ecological aspects. According tothis index, a figure for the level of biophysical sustainability can be found bymultiplying the net primary productivity factor with the biological diversity factor.(ie BSI=NPPFxBDF.)
NPPF in turn is defined as the ratio of Annual Net Primary Production(ANPP) over the region for a given year less the ANPP of the region for theprevious year. ANPP is equal to the Primary Production of Annuals (PPA), and thePrimary Production of Perennials (PPP), less the Harvested Primary Capital ofPerennials (HPCP). (ie ANPP=PPA+PPP-HPCP.) Munasinghe and McNeely (1995)state that the data needed to calculate ANPP is obtainable through the use of GIS.Other sources of some of the data might include the national or regional economicaccounts available from a nation’s national statistical office.
BDF is defined as the ratio of the Current Selected Biological Diversity(CSBD) of the region to the Natural Selected Biological Diversity (NSBD) of thesame region. CSBD and NSBD refer respectively to the number of species of a settaxa which thrive in the region currently, and prior to human intervention.
Therefore:
BSI={(PPA+PPP-HPCP)y / (PPA+PPP-HPCP)y-1}{CSBD / NSBD}
The problem with any attempt to aggregate sustainability indicators is that finalresult, when reduced to a single or small number of parameters is that the final
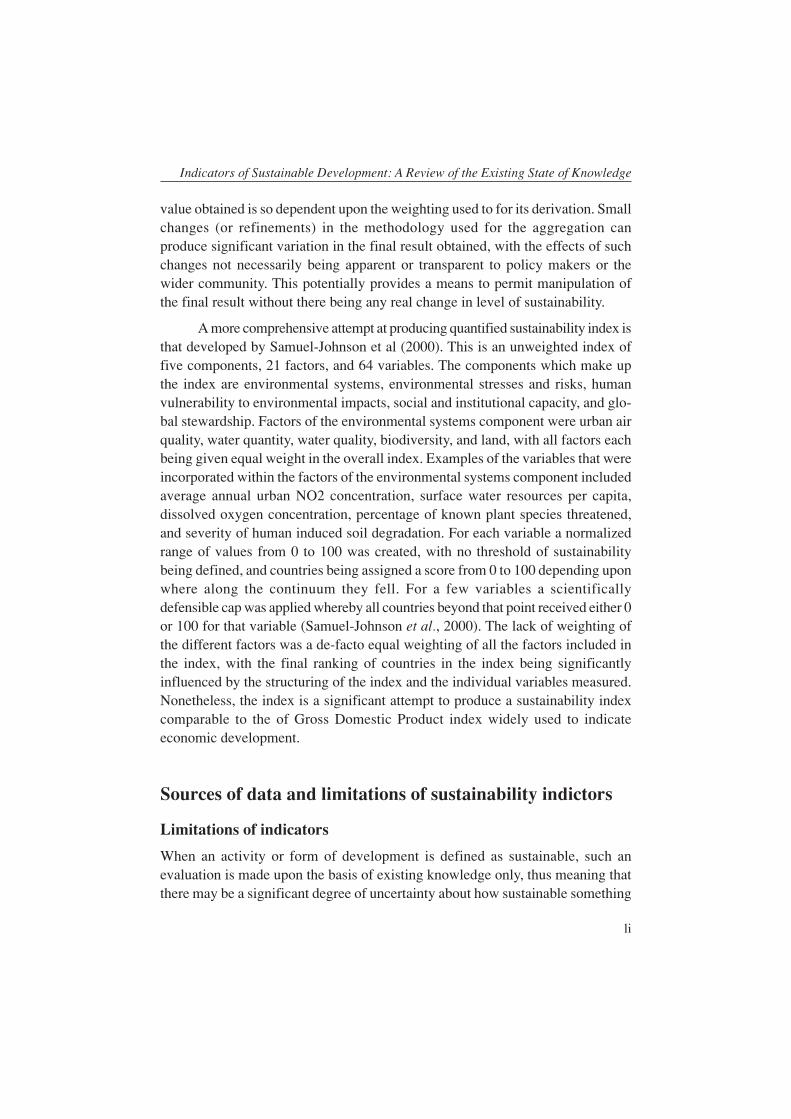
li
value obtained is so dependent upon the weighting used to for its derivation. Smallchanges (or refinements) in the methodology used for the aggregation canproduce significant variation in the final result obtained, with the effects of suchchanges not necessarily being apparent or transparent to policy makers or thewider community. This potentially provides a means to permit manipulation ofthe final result without there being any real change in level of sustainability.
A more comprehensive attempt at producing quantified sustainability index isthat developed by Samuel-Johnson et al (2000). This is an unweighted index offive components, 21 factors, and 64 variables. The components which make upthe index are environmental systems, environmental stresses and risks, humanvulnerability to environmental impacts, social and institutional capacity, and glo-bal stewardship. Factors of the environmental systems component were urban airquality, water quantity, water quality, biodiversity, and land, with all factors eachbeing given equal weight in the overall index. Examples of the variables that wereincorporated within the factors of the environmental systems component includedaverage annual urban NO2 concentration, surface water resources per capita,dissolved oxygen concentration, percentage of known plant species threatened,and severity of human induced soil degradation. For each variable a normalizedrange of values from 0 to 100 was created, with no threshold of sustainabilitybeing defined, and countries being assigned a score from 0 to 100 depending uponwhere along the continuum they fell. For a few variables a scientificallydefensible cap was applied whereby all countries beyond that point received either 0or 100 for that variable (Samuel-Johnson et al., 2000). The lack of weighting ofthe different factors was a de-facto equal weighting of all the factors included inthe index, with the final ranking of countries in the index being significantlyinfluenced by the structuring of the index and the individual variables measured.Nonetheless, the index is a significant attempt to produce a sustainability indexcomparable to the of Gross Domestic Product index widely used to indicateeconomic development.
Sources of data and limitations of sustainability indictors
Limitations of indicators
When an activity or form of development is defined as sustainable, such anevaluation is made upon the basis of existing knowledge only, thus meaning thatthere may be a significant degree of uncertainty about how sustainable something
Indicators of Sustainable Development: A Review of the Existing State of Knowledge

lii
Toward a System of Sustainable Development Indicators in Israel
is (Lusigi, 1995). The UK Department of the Environment (1996) argues thatindicators are simplifications which relate only to areas which can be readilyquantified and aggregated, with this meaning that issues which are easilymeasured and quantified (like pollutant concentrations) will be focused upon.Difficult to measure issues (like the quality of land management) will be largelyignored in sustainability indicators. Conversely, however, when there are too manyindicators there is a risk that trends will be obscured (UK DoE, 1996, Rutherford,1997).
One of the major potential problems and limitations when compilingsustainability indicators is that monitoring data relating to appropriate parametersmay be unavailable. Bayliss and Walker (1996) note that monitoring programmesof countries are developed over many years and at times parameters monitoredmay relate more to historic concerns rather than contemporary issues. Indicatorswhich are chosen will be biased towards readily available information or informa-tion which can be obtained at a reasonable cost (Gallopin, 1997).
Data incompatibility
At the international level there are frequently problems of data incompatibilitybetween different countries (Bayliss & Walker, 1996). The problem is compoundedby the fact that monitoring methodologies used for collecting the data are oftenunavailable despite being essential for meaningful comparisons. In the reportproduced by the United Nations Commission on Sustainable Development (1996)for each indicator listed there is a brief discussion of data availability and datasources, indicating whether or not suitable data is available (and compatible)internationally and what the best sources of such data are. Without suchinformation being presented in an indicator framework, the framework is ofquestionable practical application.
Issues of scale
The UNEP (1995) raises the question about whether the concept of sustainabledevelopment, something which must be applied as a global concept, has any realmeaning at the local level. They argue that although it will only be viable ifimplemented globally, it is at the local level at which actions for its implementa-tion must be carried out. Essentially, every country is interlinked economically

liii
and environmentally with the rest of the world to a greater or lesser extent, withsustainability thus also being inter-linked, but the implementation of sustainabledevelopment occur through local actions.
Gallopin (1997) argues that different kinds of indicators will be relevant todifferent scales, with some indicators that are useful at one scale being meaning-less at others. This same point is taken up by the UK Department of the Environ-ment (1996) when they state that the indicators they present in their listing arenational indicators and are not necessarily suitable for indicating sustainabledevelopment trends within a particular geographic area. Some indictors in theirlisting, however, such as pollutants could be measured both nationally and locally,permitting local areas to see how they compare with the national average (UKDoE, 1996). The term “national” of course varies considerably in its meaningfrom country to country, with many small countries being smaller than theindividual regions within large countries. This makes the development of a set ofindicators specifically for national use in multiple countries and also for compar-ing between countries very problematic
The UK Department of the Environment (1996) argues that for indicatorssuitable for assessing progress towards sustainable development at the local levelit is important that a national consensus about what should be monitored be estab-lished in order to permit comparisons between different areas, even though localareas are free to set their own assessment processes. This same principle mustapply at the international level, where it is important that countries try to adoptcompatible sustainability indicator frameworks and actual indicators so thatsustainability can be assessed on a global scale. As Simpson (1996) remarks, whatmay be sustainable at the local level may not be at the global level, giving theexample of carbon dioxide emissions. A similar principle must apply regionallywith some forms of resources use, such as international water resources, wheresustainable use on a national basis can be meaningless. Transboundary issues ofsustainability can only meaningfully be assessed on a transboundary basis whichfor some issues and regions may be extremely difficult.
Indicator selection
A few writers give specific lists of criteria for the selection of indicators ofsustainable development. Gallopin (1997) lists the universal requirements anddesirable properties of indicators as:
Indicators of Sustainable Development: A Review of the Existing State of Knowledge

liv
Toward a System of Sustainable Development Indicators in Israel
- the values of each indicators must be measurable or observable.
- data must be either obtainable through measuring and monitoring or alreadyavailable.
- the methodology of data management and indicator construction must betransparent and standardized.
- financial, human and technical means for monitoring the indicators should beavailable.
- the indicators must be cost effective.
- political acceptability of the indicators at their scale of use must be achieved ifthey are to be used by decision makers.
- public participation in the use of indicators is desirable.
Mortensen (1997) lists the criteria for selecting indictors as used by the UnitedNations Commission on Sustainable Development as:
- indicators should be primarily national in scale or scope.
- relevant to the objective of assessing progress towards sustainable develop-ment.
- understandable and unambiguous.
- within the capacities of national governments.
- conceptually well founded.
- limited in number but adaptable to future requirements.
- relevant to Agenda 21 and covering all aspects of sustainable development.
- representative of international consensus as much as possible.
- use suitable data which are already readily available or can be obtained atreasonable cost.
The UK Department of the Environment (1996) also lists criteria for indicatorselection, based upon the work of the OECD. In terms of policy relevance andutility for users an indicator should:

lv
- provide provide a representative picture of environmental conditions, pressures,or responses.
- be understandable and show trends over time.
- be responsive to environmental change.
- provide a basis for international comparisons.
- be national in scope or applicable at this scale.
- have reference values for comparison.
In terms of analytical soundness, according to the UK Department of Environ-ment (1996), indicators should:
- be theoretically sound technically and scientifically.
- be based on international standards and international consensus about its validity.
- be capable of being linked to economic models, forecasting and informationsystems.
In terms of measurability, according to the UK Department of Environment (1996),indicators should:
- be based upon readily available data or data available at reasonable cost.
- depend upon adequately documented data of known quality.
- use data updated at regular intervals according to reliable procedures.
Conclusion
The review of theory and existing sets of indicators of sustainable developmentsuggests that the development of theoretical ideas relating to indicator frameworksis considerably more advanced than the development of actual frameworks.Essentially there is a significant gap between theory and practice and no frame-work exists which encompasses all of the ideas and concepts developed in thetheory. The OECD framework, for example, really only relates to one aspect ofsustainability, environmental issues, although this framework does attempt some
Indicators of Sustainable Development: A Review of the Existing State of Knowledge
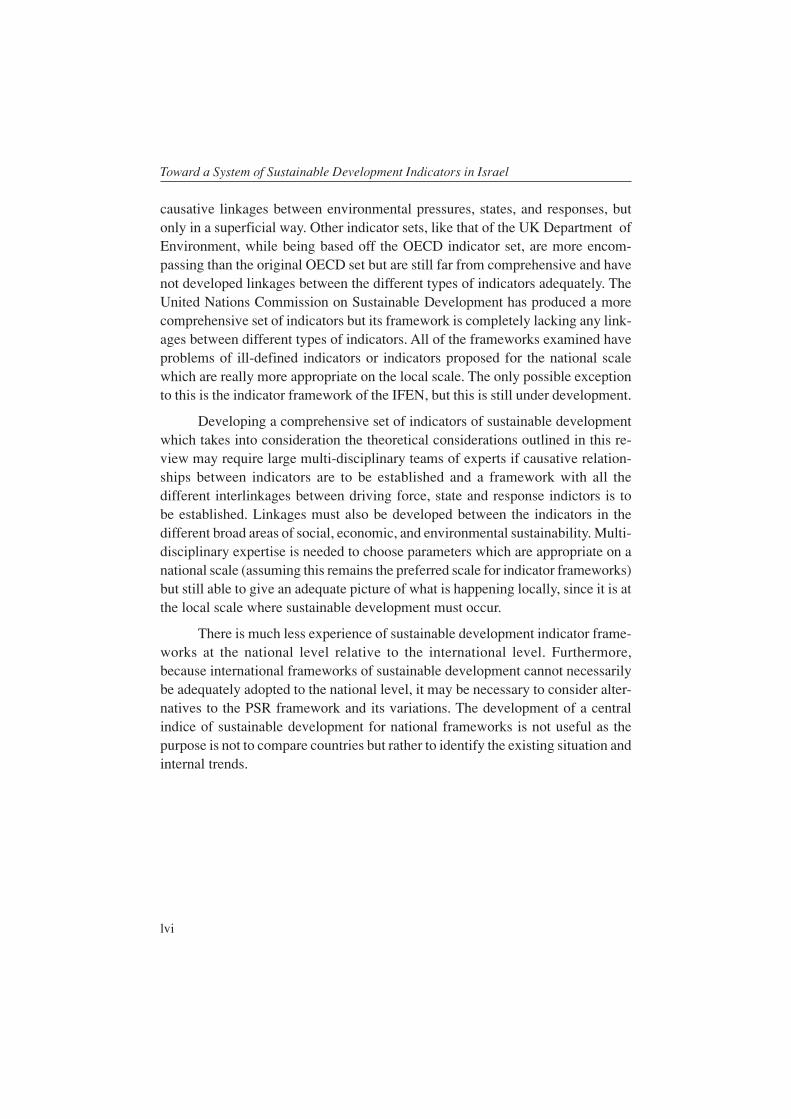
lvi
Toward a System of Sustainable Development Indicators in Israel
causative linkages between environmental pressures, states, and responses, butonly in a superficial way. Other indicator sets, like that of the UK Department ofEnvironment, while being based off the OECD indicator set, are more encom-passing than the original OECD set but are still far from comprehensive and havenot developed linkages between the different types of indicators adequately. TheUnited Nations Commission on Sustainable Development has produced a morecomprehensive set of indicators but its framework is completely lacking any link-ages between different types of indicators. All of the frameworks examined haveproblems of ill-defined indicators or indicators proposed for the national scalewhich are really more appropriate on the local scale. The only possible exceptionto this is the indicator framework of the IFEN, but this is still under development.
Developing a comprehensive set of indicators of sustainable developmentwhich takes into consideration the theoretical considerations outlined in this re-view may require large multi-disciplinary teams of experts if causative relation-ships between indicators are to be established and a framework with all thedifferent interlinkages between driving force, state and response indictors is tobe established. Linkages must also be developed between the indicators in thedifferent broad areas of social, economic, and environmental sustainability. Multi-disciplinary expertise is needed to choose parameters which are appropriate on anational scale (assuming this remains the preferred scale for indicator frameworks)but still able to give an adequate picture of what is happening locally, since it is atthe local scale where sustainable development must occur.
There is much less experience of sustainable development indicator frame-works at the national level relative to the international level. Furthermore,because international frameworks of sustainable development cannot necessarilybe adequately adopted to the national level, it may be necessary to consider alter-natives to the PSR framework and its variations. The development of a centralindice of sustainable development for national frameworks is not useful as thepurpose is not to compare countries but rather to identify the existing situation andinternal trends.

lvii
Appendix 1: Lists of indicators
In addition to the list of OECD indicators some other lists of indicators are givenbelow.
Table 2.2: Indicators of sustainable development for the United Kingdom,as presented in the UK Department of the Environment.
(Source: UK DoE, 1996).
Broad Aims Sub category Key indicators
A healthy economy The economy -Gross Domestic Productshould be maintained -Structure of the economyto promote quality of -Expenditure components oflife while at the same GDP and personal savingstime protecting human -Consumer expenditurehealth and the environ- -Inflationment in the UK and -Employmentoverseas, with all -Government borrowing and debtparticipants in all -Pollution abatement expendituresectors paying the -Infant mortalityfull social and -Life expectancyenvironmental costsof their decisions Transport use -Car use and total passenger
travel-Short journeys-Real changes in the cost oftransport-Freight traffic
Leisure and tourism -Leisure journeys-Air travel
Overseas trade UK imports and exports
Indicators of Sustainable Development: A Review of the Existing State of Knowledge

lviii
Toward a System of Sustainable Development Indicators in Israel
Broad Aims Sub category Key indicators
Non-renewable Energy -Depletion of fossil fuelsresources should be -Capacity of nuclear andused optimally renewable fuels
-Primary and final energyconsumption-Energy consumption and output-Industrial and commercial sectorconsumption-Road transport energy use-Residential energy use-Fuel prices in real terms
Land use -Land covered by urbandevelopment-Household numbers-Re-use of land in urban uses fordevelopment-Stock and reclamation of land-Road building-Out-of-town retail floor space-Regular journeys-Regeneration expenditure-Green spaces in urban areas
Renewable resources Water resources -Licensed abstractions andshould be used effective rainfallsustainably -Low flow alleviation
-Abstractions by use-Abstractions for public watersupply-Demand and supply of publicwater-Abstractions for spray irrigation
Forestry -Forest cover-Timber production-Ancient semi-natural woodland-Tree health-Forest management

lix
Broad Aims Sub category Key indicators
Fish resources -Fish stocks-Minimum Biological AcceptableLevel (MBAL)-Fish catches
Damage to the Climate change -Global greenhouse gas radiativecarrying capacity of forcing ratethe environment and -Global temperature changethe risk to human health -Emissions of greenhouse gases and biodiversity from -Power station emissions ofthe effects of human carbon dioxideactivity should beminimized. Ozone layer -Calculated chlorine loading
depletion -Measured ozone depletion-Emissions of ozone depletingsubstances-CFCs consumption
Acid deposition -Exceedences of provisionalcritical loads for acidity-Power station emissions ofsulphur dioxide and nitrogenoxides-Road transport emissions ofnitrogen oxides
Air -Ozone concentrations-Nitrogen dioxide concentrations-Particulate matter concentrations-Volatile organic compoundemissions-Carbon monoxide emissions-Black smoke emissions-Lead emissions-Expenditure on air pollutionabatement
Indicators of Sustainable Development: A Review of the Existing State of Knowledge

lx
Toward a System of Sustainable Development Indicators in Israel
Broad Aims Sub category Key indicators
Freshwater quality -River quality — chemical andbiological-Nitrates in rivers andgroundwater-Phosphorus in rivers-Pesticides in rivers andgroundwater-Pollution incidents-Pollution prevention and control-Expenditure on waterabstraction, treatment anddistributionExpenditure on sewage treatment
Marine -Estuarial water quality-Concentrations of key pollutants-Contaminants in fish-Bathing water quality-Inputs of contaminants-Oil spills and operationaldischarges
Wildlife and -Native species at riskhabitats -Breeding birds
-Plant diversity in semi-improvedgrassland-Area of chalk grassland-Plant diversity in hedgerows-Habitat fragmentation-Lakes and ponds-Plant diversity in streamsides-Mammal populations-Dragonfly distributions-Butterfly distributions
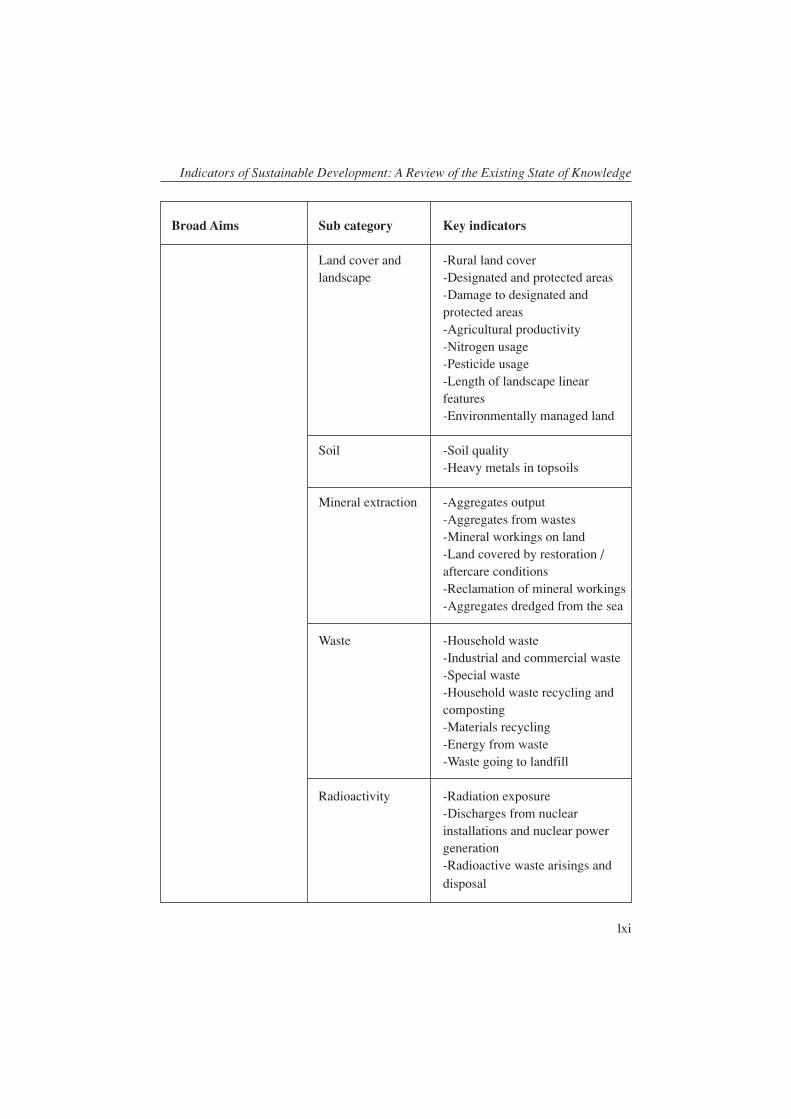
lxi
Broad Aims Sub category Key indicators
Land cover and -Rural land coverlandscape -Designated and protected areas
-Damage to designated andprotected areas-Agricultural productivity-Nitrogen usage-Pesticide usage-Length of landscape linearfeatures-Environmentally managed land
Soil -Soil quality-Heavy metals in topsoils
Mineral extraction -Aggregates output-Aggregates from wastes-Mineral workings on land-Land covered by restoration /aftercare conditions-Reclamation of mineral workings-Aggregates dredged from the sea
Waste -Household waste-Industrial and commercial waste-Special waste-Household waste recycling andcomposting-Materials recycling-Energy from waste-Waste going to landfill
Radioactivity -Radiation exposure-Discharges from nuclearinstallations and nuclear powergeneration-Radioactive waste arisings anddisposal
Indicators of Sustainable Development: A Review of the Existing State of Knowledge

lxii
Toward a System of Sustainable Development Indicators in Israel
Despite the length of the above list, a number of critical indicators have not beenincluded. For example, the section specifying indicators of economic sustainabilitydoes not include any indicator for assessing the distribution of wealth nor theprerelevence of poverty in society, but this is critical to achieving sustainableeconomic development, and use of public transport is not assessed in a meaning-ful way. Other indicators in the list are too general in their present form to be ofreal use to policy making. For example, the indicator “Depletion of fossil fuels”would be a more useful indicator of progress towards sustainability if it were splitup into each of the major fossil fuel types.
The greatest problem with the above list of indicators is that many of theindictors listed can only be meaningfully measured on a point specific or local /regional basis, meaning that any national figure that might be produced would bealmost meaningless. Examples of such indictors, to name but a few are tree health,particulate matter concentrations, river quality, habitat fragmentation, and heavymetals in top soils. To measure many of these measures on a national basis wouldeach require major studies that would not permit a meaningful national figure tobe derived.
Table 2.3: Indicators of sustainable development as developed by theUnited Nations Commission on Sustainable Development.
(Source: UNCSD, 1996).
Chapters of Driving force State ResponseAgenda 21 indicators indicators indicators
Category: Social
Chapter 3: -Unemployment -Head count indexCombating poverty rate of poverty
-Squared povertygap index-Gini index ofincome inequality-Ratio of averagefemale wage tomale wage

lxiii
Chapters of Driving force State ResponseAgenda 21 indicators indicators indicators
Chapter 5: -Population -PopulationDemographic growth rate densitydynamics and -Net migration ratesustainability -Total fertility
Chapter 36: -Rate of change -Children reaching -GDP spent onPromoting of school-age grade 5 of educationeducation, public population primary educationawareness and -Primary school -School lifetraining enrolment ratio expectancy
(gross and net) -Differences-Secondary school between male andenrolment ration female school(gross and net) enrolment ratios-Adult literacy -Women perrate hundred men in
the labour force
Chapter 6: -Basic sanitation: -ImmunisationProtecting and percent of against infectiouspromoting human population with childhood diseaseshealth adequate excreta -Contraceptive
disposal facilities prevalence-Access to safe -Proportion ofdrinking water potentially-Life expectancy hazardousat birth chemicals-Adequate birth monitored in foodweight -National health-Infant mortality expenditurerate devoted to local-Maternal health caremortality rate -Total national-Nutritional status health expenditureof children related to GNP
Indicators of Sustainable Development: A Review of the Existing State of Knowledge

lxiv
Toward a System of Sustainable Development Indicators in Israel
Chapters of Driving force State ResponseAgenda 21 indicators indicators indicators
Chapter 7: -Rate of growth of -Percent of -InfrastructurePromoting urban population population in expenditure persustainable -Per capita urban areas capitahuman settlement consumption of -Areas anddevelopment fossil fuel by population of
motor vehicle urban formal andtransport informal-Human and settlementseconomic loss due -Floor areasto natural disasters per person
-House price toincome ratio
Category: Economic
Chapter 2: -GDP per capita -EnvironmentallyInternational -Net investment adjusted Netco-operation to share in GDP Domestic Productaccelerate -Sum of exports -Share ofsustainable and imports as a manufactureddevelopment in percent of GDP goods in totalcountries and merchandiserelated domestic exportspolicies
Chapter 4: -Annual energy -Proven mineralChanging consumption reservesconsumption -Share of natural -Proven fossil fuelpatterns resource intensive energy reserves
industries in -Lifetime ofmanufacturing proven energyvalue-added reserves
-Intensity ofmaterial use-Share of

lxv
Chapters of Driving force State ResponseAgenda 21 indicators indicators indicators
manufacturingvalue-added inGDP-Share ofconsumption ofrenewable energyresources
Chapter 33: -Net resources -Debt / GNP -EnvironmentalFinancial transfer / GNP -Debt service / protectionresources and -Total ODA given export expenditures as amechanisms or received as a percent of GDP
percentage of GNP -Amount of new oradditional fundingfor sustainabledevelopment
Chapter 34: -Capital goods -Share of -Technical co- Transfer of imports environmentally operation grantsenvironmentally -Foreign direct sound capitalsound technology, investments goods importsco-operation andcapacity building
Category: Environmental
Chapter 18: -Annual -Groundwater -Waste-waterProtection of the withdrawals of reserves treatment coveragequality and supply ground and -Concentration of -Density ofof freshwater surface water faecal coliform hydrologicalresources -Domestic in freshwater networks
consumption of -Biochemicalwater per capita oxygen demand
in water bodies
Indicators of Sustainable Development: A Review of the Existing State of Knowledge

lxvi
Toward a System of Sustainable Development Indicators in Israel
Chapters of Driving force State ResponseAgenda 21 indicators indicators indicators
Chapter 17: -Population growth -MaximumProtection of the in coastal areas sustained yieldoceans, all kinds -Discharges of oil for fisheriesof seas and coastal into coastal waters -Algae indexareas -Releases of
nitrogen andphosphorus tocoastal waters
Chapter 10: -Land use change -Changes in land -DecentralisedIntegrated condition local-level naturalapproach to the resourcesplanning and managementmanagement ofland resources
Chapter 12: -Population living -National monthlyManaging fragile below poverty rainfall indexecosystems: line in dryland -Satellite derivedcombating areas vegetation indexdesertification -Land affectedand drought by desertification
Chapter 13: -Population -Sustainable use ofManaging fragile change in natural resourcesecosystems: mountain areas in mountain areassustainable -Welfare ofmountain mountaindevelopment populations
Chapter 14: -Use of agricultu- -Arable land per -AgriculturalPromoting ral pesticides capita educationsustainable -Use of fertilizers -Area affected byagriculture and -Irrigation percent salinisation andrural development of arable land water logging
-Energy use inagriculture

lxvii
Chapters of Driving force State ResponseAgenda 21 indicators indicators indicators
Chapter 11: -Wood harvesting -Forest area -Managed forestCombating intensity change area ratiodeforestation -Protected forest
area as a percentof total forest area
Chapter 15: -Threatened -Protected area as aConversation of species as a percent of total areabiological diversity percent of total
native species
Chapter 16: -R&D expenditureEnvironmentally for biotechnologysound management -Existence ofof biotechnology national biosafety
regulations orguidelines
Chapter 9: -Emissions of -Ambient -Expenditure onProtection of the greenhouse gasses concentrations air pollutionatmosphere -Emissions of of pollutants in abatement
sulphur oxides urban areas-Emissions ofnitrogen oxides-Consumption ofozone depletingsubstances
Chapter 21: -Generation of -Expenditure onEnvironmentally industrial and waste managementsound management municipal solid -Waste recyclingof solid wastes and waste and reusesewage-related -Household waste -Municipal wasteissues disposal per capita disposal
Chapter 19: -Chemically -Number ofEnvironmentally induced acute chemicals bannedsound management poisonings or severelyof toxic chemicals restricted
Indicators of Sustainable Development: A Review of the Existing State of Knowledge
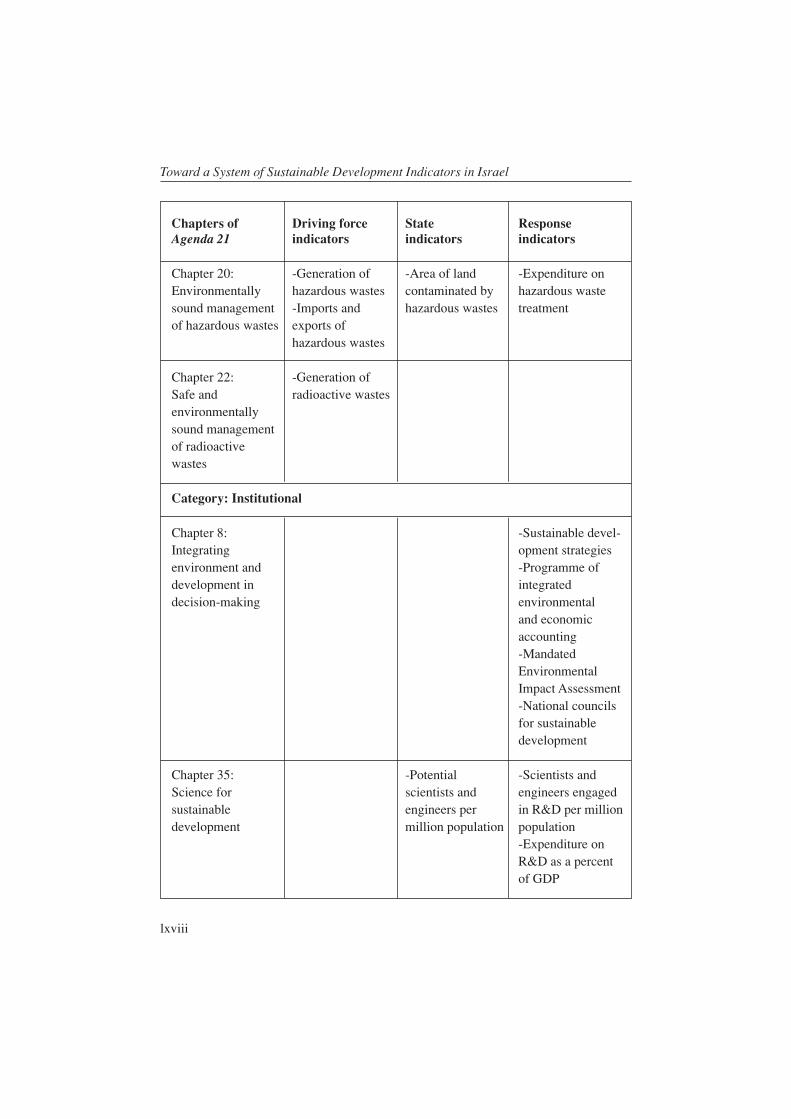
lxviii
Toward a System of Sustainable Development Indicators in Israel
Chapters of Driving force State ResponseAgenda 21 indicators indicators indicators
Chapter 20: -Generation of -Area of land -Expenditure onEnvironmentally hazardous wastes contaminated by hazardous wastesound management -Imports and hazardous wastes treatmentof hazardous wastes exports of
hazardous wastes
Chapter 22: -Generation ofSafe and radioactive wastesenvironmentallysound managementof radioactivewastes
Category: Institutional
Chapter 8: -Sustainable devel-Integrating opment strategiesenvironment and -Programme ofdevelopment in integrateddecision-making environmental
and economicaccounting-MandatedEnvironmentalImpact Assessment-National councilsfor sustainabledevelopment
Chapter 35: -Potential -Scientists andScience for scientists and engineers engagedsustainable engineers per in R&D per milliondevelopment million population population
-Expenditure onR&D as a percentof GDP

lxix
Chapters of Driving force State ResponseAgenda 21 indicators indicators indicators
Chapter 37:Nationalmechanisms andinternational co-operation forcapacity building indeveloping countries
Chapter 38:Internationalinstitutionalarrangements
Chapter 39: -Ratification ofInternational legal global agreementsinstruments and -Implementationmechanisms of ratified global
agreements
Chapter 40: -Main telephone -Programmes forInformation of lines per 100 national environ-decision-making inhabitants mental statistics
Chapter 23-32: -Representation ofStrengthening major groups inthe role of major national councilsgroups for sustainable
development-Representatives ofethnic minoritiesand indigenouspeople in nationalcouncils forsustainabledevelopment-Contribution ofNGOs to sustainabledevelopment
Indicators of Sustainable Development: A Review of the Existing State of Knowledge

lxx
Toward a System of Sustainable Development Indicators in Israel
Like the set of indicators produced by the UK Department of the Environmentmany of the indictors in the set produced by the United Nations Commission onSustainable Development are more relevant and meaningful if assessed on a localbasis. While the indictor set of the United Nations Commission on SustainableDevelopment is more encompassing than that of the UK Department of the Envi-ronment many of the indictors listed are very vague and of little use withoutfurther definition. Examples of such indictors include “Amount of new oradditional funding for sustainable development”, “Share of environmentally soundcapital goods imports”, or “Sustainable use of natural resources in mountain areas”.Defining and measuring these in a meaningful and useful way would be challenging.Some indicators listed, such as “Main telephone lines per 100 inhabitants” arebecoming less relevant as use of cellar phone technologies around the worldincreases, and similarly indicators relating to access to technologies such as theinternet are not included.
Table 2.4: Indicators of sustainable development as developed by theMediterranean Commission on Sustainable Development.
(Source: Mediterranean Commission on Sustainable Development, 1999).
Indicator
Population growth rate
Total fertility rate
Women per hundred men in the labour force
Difference between male and female school enrolment ratios
Life expectancy at birth
Infant mortality rate
Main telephone lines per 100 inhabitants
Annual energy consumption per capita
Rate of growth of urban population
Urbanisation rate
Forest area change
External Debt / GDP
Arable land per capita
Irrigation percent of arable land
Energy intensity

lxxi
The indicator set produced by the Mediterranean Commission on SustainableDevelopment has the advantage of being relatively concise and data is readilyavailable in most countries. The indicator set, when compared to those of the UKDepartment of the Environment or the United Nations Commission onSustainable Development is very limited in its scope and the potential to providea real assessment of progress towards sustainable development in a country.
Indicators of Sustainable Development: A Review of the Existing State of Knowledge

lxxii
Toward a System of Sustainable Development Indicators in Israel
Air Quality Indicators for Israel
Mordechai Peleg
Introduction
The question of deteriorating air quality is not a new problem and has been aroundfor centuries. Early documents from the first and second century in Israel showclearly that people reacted strongly against sources of air pollution . The MishnahLaw called for a minimal distance of 50 cubits (some 30 meters) from a pollutingsource to a neighbor’s residence. In the case of tanneries the prevailing wind needsto be a considering factor. Not only health and nuisance affects were consideredbut also the effects of air pollutants on materials. For example, in Jerusalem, kilnsand furnaces were not allowed, to avoid soiling of the walls and buildings.Shakespeare (c. 1600) also lamented the problem of bad air quality in his play onHamlet (Act II, Scene 2). In 1661, a noted scientist and diarist by the name ofJohn Evelyn wrote a small booklet in which he described the damaging effects inLondon of air pollution arising from the combustion of coal.
However, only in the 20th century, and especially the last few decades, haveextensive experimental and epidemiological studies been carried out to verify theseeffects scientifically. In 1952, London was affected by a very serious smog (theword smog was coined to describe the “smoke-fog” of the famous so-called Londonpea-soupers) incident that caused almost 2000 excess deaths during a ten-dayperiod. An epidemiological study showed for the first time a direct correlationbetween the excess mortality rate observed during the smog incident and theincreased sulfur dioxide and smoke (soot) levels. This type of incident, whichbecame known as the London type or “classical” smog, was identified as beingdue to industrial and household fuel (coal, petroleum) combustion emissions ofsulfur dioxide and particulate. The time of occurrence of the worst episodes wasduring the winter months (increased pollution emission) and especially in the earlymorning when dispersion conditions were very bad. The health effects were lungand throat irritation and under extreme conditions, such as in London during winterof 1952, increased mortality.

lxxiii
While the London smog was known for hundreds of years it was only in1943 that major smogs were first reported in Los Angeles. The smog incidentscaused major eye irritation and reduced visibility. However, in contrast to theLondon type smog, this type of smog was observed to occur during summer andbecome more extreme around midday. Intensive experiments identified the mainsmog component as being ozone. Since ozone is a secondary pollutant and notemitted directly, extensive research was required to identify the causes of ozoneproduction. The source of the ozone precursor emissions was attributed to motorvehicle fuel combustion that emits nitrogen oxides and hydrocarbons. The abovecompounds undergo photochemical reactions under the influence of sunlight toproduce ozone. This type of smog became known as the Los Angeles orphotochemical type smog.
Intensive efforts were made both in London and Los Angeles, and otherplaces where these two smog types were observed, to reduce their affects. In Londonstrict enforcement of a smokeless fuel law and other stringent limitations helpedto effectively reduce the seriousness of smog incidents. Similarly in California,strict vehicle emission controls and transportation strategies were introduced whichsuccessfully reduced ozone production and hence the seriousness of the smogoccurrences. The above shows in spite of the increased development that hasoccurred both in London and Los Angeles it has been possible to maintain or evenimprove the air quality with respect to specific pollutants. Thus development neednot necessarily go hand in hand with decreasing air quality.
Although important steps have been made in attempting to maintain or evenimprove a reasonable air quality standard, it is still necessary to continue protectingthe air we breathe. Further, as our scientific knowledge of atmospheric processesexpands, evidence of possible new detrimental effects on air quality is beingsuggested.
Air Pollutants
The main air pollutants that affect the air quality in Israel are discussed in thefollowing section. The pollutants can be collected into two classifications. Primarypollutants that are emitted directly into the atmosphere and secondary pollutantsthat are formed in the atmosphere from directly emitted precursors. The primarypollutants to be considered due to their detrimental effects are sulfur dioxide, carbonmonoxide, lead, fine particulates and two volatile organic compounds, benzene
Air Quality Indicators for Israel

lxxiv
Toward a System of Sustainable Development Indicators in Israel
and 1-3 butadiene. In addition two secondary pollutants, ozone and sulfateparticulates will be evaluated. The sources of the different pollutant vary, rangingfrom large single sources (electricity power plants, oil refineries, industrial) toarea sources (transportation, residential heating). Certain sources emit from elevatedstacks (such as power plants) and affect areas large distance downwind of thesource while other sources affect directly only regions adjacent to the emittingareas (such as transportation).
The review of the different pollutants will include information on the sourcesfor each pollutant, the detrimental effects of the pollutant, their present ambientlevels, future emission trends and other relevant information.
1. Carbon Monoxide
Carbon monoxide (CO) is a gas formed by the incomplete combustion of carboncontaining fuels. In general, the more efficient the combustion process, the lowerthe carbon monoxide emission. The main outdoor source of carbon monoxide iscurrently road transport, in particular gasoline powered vehicles, which in 1997accounted for 90% of carbon monoxide emissions in Israel. Thus it is expectedthat high levels of carbon monoxide will be found in the vicinity of main roadsand in city centers and only limited amounts in rural areas.
The main threats to human health from exposure to carbon monoxide arethe formation of carboxyhaemoglobin, which substantially reduces the capacityof the blood to carry oxygen and deliver it to the tissues, and blockage of importantbiochemical reactions in cells. People who have an existing disease that affectsthe delivery of oxygen to the heart or brain (e.g. coronary artery disease (angina))are likely to be at particular risk if these delivery systems are further impaired bycarbon monoxide.
Carbon monoxide levels reported by the Israeli Ministry of the Environmentfor the year 1999, showed a maximum half-hour values ranging between 2.4 and8.2 mg/m3 for urban sites and between 13.0 and 21.3 mg/m3 for curbside sites onmajor traffic roads. The levels recorded for 8-hour exposure times were in therange 1.9 to 4.1 mg/m3 and 7.8 and 11.7 mg/m3 for urban and curbside sites,respectively. The Israeli ambient standard for half-hour exposure is 60 mg/m3 and11 mg/m3for 8-hours. The maximum levels for urban sites which were measuredin the center of downtown Jerusalem (Kikar Safra) were less than 15% for thehalf-hour standard and 38% with respect to the 8-hour requirement. For the curbside

lxxv
sites the maximum-recorded levels were adjacent to a main road in Tel-Aviv andreached 35% for the half-hourly standard and slightly above (106%) the 8-hourambient standard. The annual carbon monoxide values for urban sites variedbetween 0.8 and 1.8 mg/m3 and for the curbside sites between 1.5 and 3.1 mg/m3,(no Israeli annual ambient standard exists for carbon monoxide).
The number of vehicles on the roads in Israel has doubled from one to twomillion between 1990 and 2001. However since 1994 the amount of carbonmonoxide has been reduced by about 25%. This can be attributed to the introductionof catalytic converters in all gasoline driven vehicles introduced into Israel since1994. The catalytic converter reduces the amount of carbon monoxide emitted byalmost 80%. Since as stated above, the main source of carbon monoxide is fromgasoline-powered vehicles it appears that introduction of the catalytic convertershas been successful in enabling continued increase in vehicle use without causingincreased carbon monoxide pollution levels.
2. Sulfur Dioxide
Sulfur dioxide is a gas at normal temperature and pressure. It dissolves in water togive an acidic solution, which is readily oxidized to sulfuric acid. The predominantsource of sulfur dioxide is the combustion of sulfur-containing fossil fuels,principally coal and heavy oils. Most of the sulfur dioxide emissions in Israel(> 90%) are from major power plants and industries. These emissions are fromelevated stacks and thus dispersion and dilution of this pollutant occurs before theplume reaches ground level. Depending on the height of the stacks, the pollutionemitted affects areas tens or even hundreds of kilometers downwind of the plants.Most of the present measuring sites for sulfur dioxide in Israel are situated in thevicinity of the power plants in order to monitor the effects of these plants on thesurroundings.
Sulfur dioxide causes constriction of the airways by stimulating nerves inthe lining of the nose, throat and airways of the lung. The latter effect is particularlylikely to occur in those suffering from asthma and chronic lung disease. The effectsof sulfur dioxide on sensitive subjects appear almost immediately at the start ofexposure.
Although declining emissions over recent years have reduced the importanceof sulfur dioxide as a phytotoxic pollutant, it still plays a role in damage toecosystems. This is particularly significant in combination with other stresses,
Air Quality Indicators for Israel

lxxvi
Toward a System of Sustainable Development Indicators in Israel
such as cold. Potential effects include the degradation of chlorophyll, reducedphotosynthesis, raised respiration rates and changes in protein metabolism. Sulfurdioxide also accelerates the natural weathering and corrosion of buildings andbuilding materials. Various studies have shown that limestone has been degradingat the rate of 1mm/decade due to acid rainfall. Although levels of pollutants in airare falling, the levels being recorded currently, together with the accumulatedpollution deposition of the last 200 years, mean that stonework has continued todeteriorate at this historic rate.
Sulfur dioxide levels reported by the Israeli Ministry of the Environmentfor the year 1999 varied greatly between the various sites. Maximum half-hourvalues ranged from less than 100 µg/m3 at rural sites to above 500 µg/m3 for sitesadjacent to large power plants. The levels recorded for 24-hour exposure rangefrom below 25 µg/m3 to more than 100 µg/m3. The annual averages varied frombelow 5 µg/m3 for rural sites to around 30 µg/m3 for urban sites. The higher values,such as recorded for Haifa and Ashdod could be attributed to the direct impact ofpower plant emission plumes. The lower values that were recorded at rural sitesalso showed the effects of power plant pollution. However due to greater distancetraveled by the plume to the site substantial dilution has occurred and thus thepollution levels are greatly reduced.
The Israeli ambient standard for SO2 is 500 µg/m3 for half-hour exposure(it should be noted that 45 exceedances of the SO2 standard of 1 hour periods arepermitted annually if they do not exceed 1000 µg/m3), 0.280 µg/m3 for 24-hourperiod and 0.060 µg/m3 for the annual average. Thus levels above the ambientstandard were recorded only for the half hour periods. Since very little sulfurdioxide is emitted from vehicles there is no purpose in measuring curbside levelsas for carbon monoxide.
The Ministry of the Environment reports that between 1980 and 1997 sulfurdioxide emissions have increased by only 14% in spite of more than a doubling inelectricity production and increased industrial activity. This can be attributed tothe increased use of low sulfur content fuels (1%) and the implementation of anintermittent control system (ICS) for the large power plants, especially for Haifaand Ashdod, which decrees the switch to very low sulfur (0.5%) fuel whenmeteorological conditions indicate bad dispersion conditions. Further, the newercoal fired power plants (80% of the power generated) do not pose a significantproblem due to the tall stacks and the low sulfur content of the coal. These elevatedstacks emit the pollution at heights hundreds of meters above ground level and

lxxvii
therefore undergo large dispersion and dilution before hitting the ground. Furtherthe new plant now in operation in Ashkelon includes scrubbers which effectivelyreduce the sulfur dioxide emitted out of the stacks.
In their 1995 report the UK EPAQS recommended an air quality standardof 100ppb (266µg/m3) measured over a 15-minute averaging period. Thisrecommendation is intended to reduce the exposure of the population, includingindividuals who may be particularly susceptible, to levels of sulfur dioxide atwhich harmful effects are unlikely to occur. The EPAQS acknowledged that anaveraging time of just a few minutes might be desirable, but concluded that a 15minute averaging time with a standard of 100ppb (266µg/m3) represented anacceptable compromise between desirability and practicability. Thus in the futureit is possible that also in Israel the ambient sulfur dioxide standard may becomemore stringent.
3. Nitrogen Oxides
All combustion processes in air produce oxides of nitrogen. This is due to thereaction at high temperatures, present in combustion processes, between thenitrogen and oxygen in the air to form primarily nitrogen oxide, which thenundergoes rapid transformation to the nitrogen dioxide. Nitrogen dioxide (NO2)and nitric oxide (NO) are both oxides of nitrogen and together are referred to asNOx Road transport is thought to account for about 50% of total emissions ofnitrogen oxides, the electricity supply industry for about 40% and the industrialand commercial sectors for about 10%. It should be emphasized that the nitrogenoxides emitted from coal fueled power plants and large industries is via high stacks,which assists dispersion and dilution of the pollutant before the plume touches theground. Thus while about 40% of the NOx emitted in Israel are from the powerplants its affects at ground level are limited. Therefore in cities, road transport isthought to account for over 80% of emissions. While NOx is important as aprecursor of ozone formation, it is however only nitrogen dioxide that is associatedwith adverse effects upon human health.
At relatively high concentrations, nitrogen dioxide causes inflammation ofthe airways. There is evidence to show that long-term exposure to nitrogen dioxidemay affect lung function and that exposure to nitrogen dioxide enhances theresponse to allergens in sensitized individuals. Both nitrogen dioxide and nitricoxide are absorbed by vegetation. Their effects on plants are additive and the
Air Quality Indicators for Israel

lxxviii
Toward a System of Sustainable Development Indicators in Israel
scientific consensus is that they should be treated together. Nitrogen is an essentialplant nutrient and low exposure to nitrogen oxides can promote growth. However,higher exposures can cause adverse effects including leaf or needle damage andreduced growth. The point at which damage begins depends on the species, on itsnutritional state and on other environmental factors.
Nitrogen oxide levels reported by the Israeli Ministry of the Environmentfor the year 1999 varied greatly between the various sites. Maximum half-hourvalues ranged between 200 µg/m3 to more than 2000 µg/m3 for urban sites whileall the curbside sites showed maximum values all above 2000 µg/m3 and at onesite almost 3000 µg/m3. The levels recorded for 24-hour exposure for the urbansites varied widely, ranging from below 50 µg/m3 to more than 800 µg/m3 whilethe curbside stations were all around 1000 µg/m3. The annual averages variedfrom below 10 µg/m3 for rural sites to above 100 µg/m3 for urban sites while thecurbside sites varied between 150 to 500 µg/m3. The very high nitrogen oxidesvalues recorded for the curbside and central city sites are all due almost exclusivelyto vehicle pollution.
The Israeli ambient standard for NOx is 940 µg/m3 for half-hour exposureand 560 µg/m3 for 24-hour period. No Israeli standard exists for nitrogen dioxidealthough the NOx calculations are based on the assumption that all the oxides arepresent as only nitrogen oxide. The above measurements show that pollution levelsfor nitrogen oxides exceed both the 1/2 hour and 24-hour standards. No annualstandard has been designated for the nitrogen oxides.
In the UK, objectives for nitrogen dioxide reflect evidence that it may haveboth acute (short-term) and chronic (long-term) effects on health, particularly inpeople with asthma. As a result, two provisional objectives have been set: 200µg/m3 as a 1 hour mean, not to be exceeded more than 18 times per year; and 40µg/m3
as an annual mean. An annual mean of 30µg/m3 of nitrogen oxides has beensuggested as a critical level at which the majority of species should be protected.These limits are much lower than the present Israeli standards.
Nitrogen oxides emissions have more than tripled in the last twenty years.This increase can be attributed to the rising consumption of gasoline and especiallydiesel fuels. This rise was however partially offset by the decreased use of heavyresidential oil and the introduction of catalytic converters on private cars. While40% of the nitrogen oxides emissions are from the large power plants situatedalong the Israeli coast only a limited affect is felt at ground levels due to the highstack emission heights. As seen above nitrogen oxides (NOx) emissions are a major

lxxix
source of air pollution violations especially close to main traffic arteries. Theproblem is especially severe in the Dan metropolitan area where hundreds ofviolations of nitrogen oxide standards are recorded each year. Over 200,000 vehiclesare registered in the Tel Aviv area alone, and another 400,000 vehicles enter citylimits every day from peripheral areas. The pollution emitted by vehicles in thisregion also causes a secondary pollution cloud, especially ozone, which impactsinland areas such as Modi‘in, Bet Shemesh, Jerusalem and even Beersheba.
The problem of elevated nitrogen oxides levels due to vehicular pollution iscompounded in Israel by the composition of Israel’s vehicle fleet that includesgrowing numbers of diesel vehicles, scooters and older cars. Most of the country’strucks, buses and commercial vehicles are diesel powered and a trend of growth inthe number of private diesel cars has been noted in recent years. It should beemphasized that these vehicles emit significant quantities of nitrogen oxides —more than ten to twenty times those emitted by gasoline vehicles equipped withcatalytic converters. Without serious intervention of governmental bodies theproblem of nitrogen oxides pollution, and with that also the ozone problem, willcontinue to grow.
4. Particulates (PM10 and PM2.5)
Unlike the individual gaseous pollutants, which are single, well-defined substances,particles (PM10 and PM2.5, the 10 and 2,5 refer to particulate aerodynamic diameterof 10 and 2.5 microns respectively) in the atmosphere are composed of a widerange of materials arising from a variety of sources. The particles may be regardedas having three predominant source types; primary particles, arising fromcombustion sources (road traffic, production and industry); secondary particles,mainly sulfate and nitrate formed by chemical reactions in the atmosphere; andcoarse particles, suspended soils and dusts, biological particles and particles fromconstruction work. Analysis of concentrations of PM10 shows it is composed ofeach of the three source types. In general terms, the three source types each makeup roughly one third of total long-term average PM10 concentrations at urbanbackground locations. However, the relative contribution of each source type variesfrom day to day, depending on meteorological conditions and quantities ofemissions from mobile and static sources. The fine particle fraction (PM2.5) iscomposed predominantly of primary and secondary particles. Particles in the rangefrom PM2.5 — PM10 generally consist of coarse particles. It should be noted thatduring a number of days during the year, especially during spring, Israel is strongly
Air Quality Indicators for Israel

lxxx
Toward a System of Sustainable Development Indicators in Israel
affected by desert sand storm episodes that cause strongly elevated particulatelevels.
Particulate air pollution is associated with a range of effects on healthincluding effects on the respiratory and cardiovascular systems, asthma andmortality. A number of epidemiological studies have concluded that particulateair pollution episodes are responsible for causing excess deaths among those withpre-existing lung and heart disease, and that there is a relationship betweenconcentrations of PM10 and health effects, such that the higher the concentrationof particles, the greater the effect on health. There is emerging evidence to suggestthat the health effects of particles are due principally to fine particles (PM2.5).While most air quality standards refer to PM10 as providing an appropriate level ofprotection for public health. However, recently it is being recognized that PM2.5
might better represent the toxic fraction of particulate air pollution, and that aPM2.5 standard may be a desirable objective.
Particulate levels reported by the Israeli Ministry of the Environment forthe year 1999 showed maximum daily averages of PM10 that ranged from 200 to500 for all the measuring sites. The PM 2.5 values were lower and varied between70 to 140 µg/m3. The annual PM10 averages varied from 30 to 70 µg/m3 while thePM2.5 values remained in the limited range of 20 to 30 µg/m3 for all sites.
The Israeli ambient standard for PM10 is 150 µg/m3 for 24-hour period and0.060 µg/m3 for the annual average. There is at present no Israeli standard forPM2.5. Levels above the 24-hour ambient standard were recorded for all 15monitoring sites and a third of the sites recorded annual averages above the standard.Part, if not all, of the above standard levels measured, especially for the 24-hourperiods can be attributed to natural sources and not anthropogenic causes. A questionthat still remains to be answered is the proportion between naturally emittedparticulates and anthropogenic source particulates.
5. Ozone
Ozone is not emitted directly from any man-made source in any significantquantities. It arises from chemical reactions in the atmosphere caused by theinfluence of sunlight. In the stratosphere, where ozone plays a beneficial role byshielding the earth from harmful ultra-violet radiation, sunlight acting initially onoxygen molecules produces ozone. The balance between ozone and oxygen in thestratosphere is currently being disturbed by migration upwards of chemicals such

lxxxi
as chlorofluorocarbons. They remove ozone and may therefore increase the amountof ultra-violet light reaching the earth’s surface. Some ozone occasionally reachesthe lower layers of the atmosphere from intrusions of air from the stratosphere.But it is primarily formed by a complicated series of chemical reactions initiatedby sunlight. Oxides of nitrogen (NOx) and VOCs (volatile organic carbons), derivedmainly from man-made sources, react to form ozone. The VOCs are produced bycombustion, various industrial processes, other activities such as solvent use, andgasoline distribution and handling. NOX and VOCs are the most importantprecursors causing elevated levels of ozone. Production can also be stimulated bycarbon monoxide, methane, or other VOCs that arise from plants, trees and naturalsources. The ozone potential varies according to the specific organic compound.Ozone is also a greenhouse gas, so NOx and VOCs can be considered indirectgreenhouse gases. The photochemical reactions that cause ozone formation do nottake place instantaneously, but over several hours or even days depending on theVOCs. Once ozone has been produced it may persist up to a limited number ofdays. In consequence, ozone measured at a particular location may have arisenfrom VOC and NOx emissions hundreds of kilometers away, and may then travelfurther for similar distances. Maximum concentrations, therefore, generally occurdownwind of the source areas of the precursor pollutant emissions. Indeed, inurban areas, where concentrations of traffic gases may be high, nitric oxide (NO)from exhaust emissions may react with ozone to form nitrogen dioxide (NO2) thusreducing ozone concentrations. However, as the air movement carries the primarypollutants away, more ozone is generated and concentrations rise in the downwindareas. In urban areas with intensive traffic movement the ozone levels may belower than in adjacent rural regions.
In terms of ozone measured at ground level, these photochemical episodesof high ozone concentrations are superimposed on a baseline that varies slightlythroughout the year but averages for Israel around 60 — 80 µg/m3. This is madeup partly of ozone transported from the stratosphere, and some ozone produced inthe troposphere (the region of the atmosphere, about 10 km deep, between theEarth’s surface and the stratosphere) from naturally occurring and man-madeprecursors (in broadly equal proportions). There is evidence that this baseline hasroughly doubled since the turn of the century, largely due to the increase in man-made NOx emissions in the whole of the northern hemisphere. The baseline isclose to levels at which effects have been observed on crops and plants.
Exposure to high concentrations of ozone may cause slight irritation to theeyes and nose. If very high levels of exposure (1,000-2,000µg/m3) are experienced
Air Quality Indicators for Israel

lxxxii
Toward a System of Sustainable Development Indicators in Israel
over several hours, damage to the airway lining followed by inflammatory reactionsmay occur. There is also evidence that minor changes in the airways may occur atlower concentrations, down to about 160µg/m3).
Ozone levels reported by the Israeli Ministry of the Environment for theyear 1999 showed limited variations between the various sites. Maximum half-hour values ranged between 150 µg/m3 to 280 µg/m3 while the eight-hour averagesranged between 115 µg/m3 to almost 200 µg/m3. The annual averages variedbetween about 40 to 80 µg/m3. The lower levels were generally observed for thedensely populated urban sites, such as Tel Aviv. The Israeli ambient standard forO3 is 230 µg/m3 for half-hour exposure period and 160 µg/m3 for the 8-hourlyaverage. Almost half of the monitoring sites (25 in number) reported ozone levelsabove the half hour ambient standard while only three sites exceeded the 8-hourstandard.
Until recently very limited ozone monitoring has been performed in Israeloutside of the coastal region. From measurements performed using an instrumentedaircraft it has been shown that the ozone levels increase, as expected with increasingdistance from the precursor emission areas close in the coastal regions. Further itappears that ozone levels are increasing with time and a serious effort is requiredto reduce precursor emissions and especially those of the nitrogen oxides.
6. Lead
Lead is the most widely used non-ferrous metal and has a large number of industrialapplications, both in its elemental form and in alloys and compounds. The singlelargest use globally is in the manufacture of batteries. As the compound tetraethyllead, it has been used as a petrol additive to enhance the octane rating. Most ofairborne emissions of lead have arisen from gasoline powered engine vehicles.Industry, in particular secondary non-ferrous metal smelters, may contribute toemissions of lead in industrial areas. For Israel lead pollution from vehiclesgenerally outweighed any other emissions. The reduction in the lead content inleaded petrol and the increasing use of unleaded gasoline has led to significantreductions in ambient urban lead levels.
Exposure to high levels of lead may result in toxic biochemical effects inhumans which in turn cause problems in the synthesis of haemoglobin, effects onthe kidneys, gastrointestinal tract, joints and reproductive system, and acute orchronic damage to the nervous system. The possible effect of lead on brain

lxxxiii
development in children, and hence their intellectual development, is the greatestcause for concern. Studies of populations of young children in the UK suggestthat there may be a loss of up to about 2 IQ points for a rise in blood lead from 10to 20 µg/dl (µg/dl = microgram’s per deciliter (deciliter = 100 milliliters). Theadvice of the UK Department of Health’s Committee on Toxicity was that it is notpossible to identify a threshold for effects of lead on health.
No continuous monitoring of lead is performed in Israel. The Israeli ambientstandards for lead are 5.0 µg/m3 for 24-hour periods, 1.5 µg/m3 monthly averageand 0.5 µg/m3 as annual mean. A recent study performed by scientists from theHebrew University of Jerusalem measured lead levels along the main Jerusalem -Tel Aviv highway. The results, averaged over the entire trip during peak trafficloads, ranged between 0.2 to almost 1 µg/m3. These levels are all well below the24 hour standard and even the monthly standard. Since the above values wererecorded inside the vehicle itself and during peak traffic loads it can safely beassumed that also the yearly average standard for lead will not be exceeded. Thereduction of ambient lead in the atmosphere can be attributed to the introductionof lead-less fuel (a necessary requirement for all vehicles that have catalyticconverters) and the reduction (from 0.42 to 0.25 and now to 0.15 gm/liter) in theamount of lead allowed in the normal gasoline. However it should be noted thatthe lead compound known, as tetra-alkyl lead, is still being added to Octane 96fuel that is still used by the older model cars. This, today, is the main source oflead in the atmosphere in Israel. While plans were made to reduce and finally stopsupplying the above fuel by the year 2003, this has not been implemented andIsrael remains the only country in the west still producing gasoline containinglead. However even though the number of vehicles on the road has steeply increasedthe amount of lead emitted to the atmosphere has decreased.
7. Benzene
Benzene is a volatile organic compound. The main atmospheric source is thecombustion and distribution of gasoline, of which it is a minor constituent. Benzeneis also formed during the combustion process from aromatics in the gasoline. Dieselfuel is a relatively small source. The amount of benzene in gasoline is regulated inIsrael since September 2001 to an upper limit of 1 % by volume by legislation.EU legislation requires that the amount of benzene in gasoline be below 1%. Themain outdoor sources of benzene are from vehicle exhausts; gasoline refining and
Air Quality Indicators for Israel

lxxxiv
Toward a System of Sustainable Development Indicators in Israel
distribution; and uncontrolled emissions from fuel station forecourts without vaporrecovery systems.
Benzene is a recognized genotoxic human carcinogen. Studies of industrialworkers exposed in the past to high levels of benzene have demonstrated an excessrisk of leukaemia that increased in relation to their working lifetime exposure. NoIsraeli ambient standard exists for benzene and no monitoring of this compound isat present taking place in Israel. Because it is a genotoxic carcinogen, no absolutelysafe level can be specified for ambient air concentrations of benzene. In the UK arecommended an air quality standard for benzene has been suggested as 16.25µg/m3 as a running annual mean, a level that was concluded to represent an exceedinglysmall risk to health. However a report of the UK Department of Health’s Committeeon Carcinogenicity suggested that exposure to benzene should be kept as low aspracticable, and ecommended a target of 3.25µg/m3, also as a running annual mean.
8. 1,3-Butadiene
1,3-Butadiene is a gas at normal temperatures and pressures and trace amounts arepresent in the atmosphere, deriving mainly from the combustion of gasoline andof other materials. Although 1,3-butadiene is used in industry, mainly in theproduction of synthetic rubber for tires, motor vehicles are its predominant source.
The health effect, which is of most concern in relation to 1,3-butadieneexposure, is the induction of cancers of the lymphoid system and blood-formingtissues, lymphomas and leukaemias. Like benzene, 1,3-butadiene is a genotoxiccarcinogen, and so no absolutely safe level can be defined. The UK EPAQSnevertheless believed that a standard could be set at which any risks to the healthof the population are exceedingly small. They recommended an air quality standardof 2.25 µg/m3 as a running annual mean. No Israeli ambient standard exists for1,3-Butadiene and no monitoring of this compound is at present taking place inIsrael.
9. Sulfate
Sulfate is a secondary pollutant produced by photochemical transformation ofsulfur dioxide. The process is relatively slow and takes the order of several hoursand even days to covert the sulfur dioxide to the sulfate particulate. The depositionrate of this particulate is slow and thus once formed can remain in the atmosphere

lxxxv
for several days. This means that the sulfate can be transported thousands ofkilometers from the original emission region of the sulfur dioxide. Israel has beenshown to be the recipient of relatively large quantities of sulfate caused by pollutionemissions over Europe. In fact, measurements have shown that the eastern partsof the Mediterranean Basin have very high sulfate levels and as high as measuredat even the most polluted sites in Europe or the USA.
Exposure to acidic aerosols such as sulfate particulates has been suggestedby several investigators as posing a serious potential health threat. The possibleassociation between fine particulates (those with aerodynamic diameter equal toor less than 2.5 µm – PM2.5), sulfate particulates and health effects was clearlydemonstrated in a study based on 15 years of air pollution and mortality data in sixU.S. cities. The study indicated an increase of about 26% in mortality rate occurredin the more polluted of the cities (PM2.5 and particulate sulfate long-term averageconcentration for the measuring period of about 30 µg m-3 and 13 µg m-3
respectively) as compared with the least polluted cities (12 µg m-3 PM2.5 and 5µg m-3 sulfate). A latter extended study on data from 151 U.S. metropolitan areas(covering more than half a million adults) indicated an adjusted relative mortalityrisk of 15% for the most polluted areas (about 25 µg m-3 PM2.5 and 15 µg m-3
sulfate) as compared with the least polluted regions (~ 10 µg m-3 PM2.5 and 5µg m-3 sulfate). Analysis of epidemiological data has suggested that rises of 10µg m-3 in particulate levels are accompanied by an increase in relative risk ofmortality of about 1% in the exposed population, including elevated risks fromboth respiratory (around 3-4%) and cardiac (around 1-4%) causes. All the above,strongly indicates that fine particulates and especially sulfate particulates are aserious risk factor for respiratory and cardiovascular diseases. It should be pointedout that the same should apply for the acidic nitrate particulate but much lessinformation is available at this stage to support or negate this proposition.
No continuous measurements are being performed at present for thispollutant although an Israeli ambient standard of 25 g m-3 for a 24 hours exposuretime exists. A number of research studies have been performed at various sites inCentral Israel that showed levels above the ambient standard are occasionallyobserved. Although inland sites show higher sulfate levels than observed at theIsraeli coast, the main contribution to the sulfate in Israel is from long transportedair masses originating over Israel.
Air Quality Indicators for Israel

lxxxvi
Toward a System of Sustainable Development Indicators in Israel
Criteria for Air Quality Indicators
The purpose of the indicators, as the name suggests, is to follow trends in airquality in order to determine the state of air quality over Israel and based on thatinformation to decide the strategies to be taken to maintain sustainable development.
Air Quality Ambient Level Indicator
As stated previously there are several different types of air pollutants that originatefrom various sources. Some pollutants affect areas adjacent to the emission sourceswhile other pollutants affect regions kilometers downwind from the pollutionorigins (due to high stack heights). Certain pollutants are not directly emitted butare formed later after series of photochemical reactions. These secondary pollutantscan pollute regions tens of kilometers downwind from the precursor origins (i.e.ozone) or even thousands of kilometers away (i.e. sulfate).
Further, meteorological conditions strongly affect the ambient pollutionlevels. Thus changing meteorological conditions need to be taken into considerationwhen formulating air quality indicators. This affects the question of the time periodthat needs to be considered for reporting. Dispersion conditions are at their worstduring the winter months, thus higher ambient pollution levels are expected duringthe winter than for summer. Thus generally an annual average is taken as a goodindicator since it comprises all the different seasons. However since the annualaverage is made up from the monthly averages it may be advantages to record ona permanent basis the monthly averages as well as the annual values.
Another possible method for air quality indicators is reporting the numberof times a certain concentration level is exceeded. The ambient air quality standardfor each specific pollutant is generally used as the cutoff level, although this neednot necessarily be the case. Further, different time intervals can be chosen, suchas half hourly or daily etc. It should however be pointed out that since the numberof values exceeding the ambient standard levels are very limited, except for curbsideNOx measurements, this type of indicator may not necessarily reflect trends in airquality. A preferable approach would be to report the indicators both as 50% andalso 95% percentile values with respect to the ambient standards. This methodwould better represent the trends in air quality since changing pollution levelsmight increase or decrease the 50% percentile value without necessarily affectingthe 95% or 100% level values.

lxxxvii
Air quality monitoring has been performed in Israel for more than twentyyears. Most of the early monitoring has been performed in the proximity of thelarge electricity power plants, Haifa, Hadrera, Ashdod and Ashkelon. The mainpurpose of the above air quality measurements was to monitor the possible effectsof the power plan emissions on the adjacent areas (range of some 10 - 15kilometers). Consortiums of local town authorities operate these monitoring sites.The parameters monitored were essentially sulfur dioxide and nitrogen oxides. Inaddition the Israeli Electricity Corporation operated measuring equipment tomonitor pollution levels caused by the power plants. In 1994 the Israeli Ministryof the Environment decided on the setting up of a national air quality network thatwould include 24 new stations in addition to the existing stations, which would beincorporated into the network. The new stations expanded the type of monitoringperformed to include pollution from transportation (curbside), urban pollution,photochemical and background rural pollution levels. Today almost 100 monitoringsites exist in Israel. The parameters being monitored on a continuous level are;carbon monoxide, sulfur dioxide, nitrogen oxides, nitrogen dioxide, ozone,particulates (PM10 and PM2.5) and benzene (only one site). A national controlcenter has been setup in Ramla that accumulates all the air quality data for Israel.It should therefore be no problem to choose appropriate monitoring sites for whichdata should be available for the years ahead.
The choice of monitoring sites to be included as indicators is of greatimportance. Sites to be included need to be representative for the specific pollutantwhether urban, rural or curbside. It is further suggested that where possible anaverage of a number of stations be taken to represent each pollutant. The monitoringequipment needs to provide continuous data for at least 80-90 % of the year andany missing data should not be for any continuous time period that would bias theannual average.
Efficiency Factor Indicator
A second approach, not based on continuous ongoing ambient level monitoring,would be an efficiency factor obtained by calculating values representing thepollution emitted per, for example, energy generated or kilometer traveled. Thistype of indicator would show whether the pollution emitted per unit energygenerated was decreasing although the total pollution emitted might increase dueto increasing anthropogenic activity.
Air Quality Indicators for Israel

lxxxviii
Toward a System of Sustainable Development Indicators in Israel
However such values are not readily available and will require intensivedata accumulation and calculations based on a number of assumptions. The simplestvalues to obtain would be the SO2 and NOx emitted per KW energy producedsince both the pollution emitted and energy supplied are available from theElectricity Company. However since these pollutants are emitted from elevatedstacks, their affects on ambient air quality is rather limited although it represents50% of the total fuel consumed in the country.
An important indicator would be the amount of nitrogen oxides emitted perkilometer traveled or per traveler kilometer. The latter unit would also reflect theinfluence of public transport on the pollution load. This type of indicator requiresdata regarding, amount of fuel consumed, total vehicle kilometers traveled, vehicletype distribution (vehicle age, with or without catalytic converters etc), emissionfactors etc. The evaluation of a meaningful value is therefore not a simple matterand would require substantial manpower.
Likewise the evaluation of an efficiency factor for particulates such as PM10
or PM2.5 is not a simple matter and would meet with similar problems as notedpreviously.
Further the above method is not applicable for evaluation with respect toozone since it is a secondary pollutant.
While the use of an efficiency type factor is inviting it appears that it mightbe both difficult and time consuming to obtain meaning full values.
Pollutant Indicator Types
1. Carbon Monoxide
This pollutant does not appear to be a critical indicator for air quality. Since itsmain source is from gasoline powered vehicles, it will have only limited interestas an indicator for changes in emissions rates from mainly privately owned vehicles.It is suggested that only the curbside values be included as indicators.
2. Sulfur Dioxide
The main source of this pollutant is power plants and heavy industries and affectsarea kilometers away from the pollution source. It can therefore affect both urban

lxxxix
and rural areas. Thus this pollutant should be included both for urban and ruralsites.
3. Nitrogen Oxides
This is probably the major pollutant problem in Israel today, especially in urbanareas. It is suggested that this pollutant be reported for two different types of sites,curbside and urban. The curbside sites will give a measure of the pollution duemainly to transportation along busy roads, while the urban value will reflect thepollution to which town dwellers are subjected. The curbside NOx/NO value is acritical indicator for sustainable development with respect to transportationmanagement. Since any increase or decrease in nitrogen oxides levels resultingfrom vehicular emission will be immediately reflected in the curbside values. Thevalue for rural exposure reflects the precursor effects on ozone formation and itmay also be worthwhile to record this value.
The question exists which species to include as indicators, NO2 or NOx orboth. As stated above it is only the NO2 species that has direct health effects,however the NOx value is an indicator of the ozone formation potential. Further itshould be noted that for the curbside station the main component to the NOx is NOwhile for an urban site the NO2 would be predominant. Since both parameters areavailable from the monitoring sites it seems appropriate to include them both inthe air quality indicator list.
4. Particulate (PM10 and PM2.5)
This pollutant could well be the pollutant with the most potential detrimental healtheffects, which should be included in the indicator list. However due to the largeinfluence of particulates from natural sources it is difficult to extract theanthropogenic contribution to the particulate loading. However since the PM2.5
represents the smaller particulates and especially the sulfate and nitrate, it may beless influenced by the larger sized natural dust and sand particles. Since both thePM10 and PM2.5 are being monitored in Israel it appears appropriate to considerincluding both parameters in the indicator list.
5. Ozone
This is an important indicator both in itself and also due to the fact that it is anindirect indicator for precursor levels and especially for the nitrogen oxides. Care
Air Quality Indicators for Israel

xc
Toward a System of Sustainable Development Indicators in Israel
will be needed in deciding which measuring sites should be included in the averages.Only monitoring stations, which are outside of the main area of the precursoremissions, are of any value for inclusion in the indicator calculations.
6. Lead
For all practical purposes this is not an important indicator. Coupled with the factthat no continuous monitoring is at present being performed in Israel we see noreason to include this parameter in the air quality indicator list.
7. Benzene
This parameter has only recently started to be given serious attention and only oneinstrument is at present in continuous operation in Israel. However it probablethat additional monitoring will become available in the future. The unit in operationin Israel is intended to measure aromatic compounds emit in the Haifa Bay whichincludes the oil refineries. Thus it is uncertain at the present if results from thissite can be used as an indicator for benzene levels over Israel.
8. 1 3-Butadiene
This parameter has recently been given serious attention in Europe and especiallyin the UK. In Israel no measurements are at present being performed for thisparameter. Thus at present this parameter cannot be included in the list.
8. Sulfate
Using the sulfate parameter as an indicator of particulates should be considered.Only recently have commercial monitors become available for this purpose.However only limited experience is at present available, which can allow anaccurate evaluation of this monitor for continuous measurements. The advantageof monitoring this parameter is that it gives a direct measure of an anthropogenicparticulate and has almost no contribution from natural sources. However, asmentioned previously, the main contribution to the sulfate levels is from Europeso this parameter will be an indicator of the impact of outside pollution sources onIsrael. If data from monitoring of the sulfate becomes available in Israel it shouldbe considered as a suitable candidate for inclusion as an indicator.

xci
Recommendations
It is recommended that the main effort for air quality be based on data readilyavailable from the Israeli air quality monitoring network operated by the Ministryof the Environment. This network operates more than twenty stations covering allof Israel (excluding the Negev) and provides accurate and continuous data. Furtherthe network can be expected to continue to provide data in the future. It shouldalso be possible to utilize the existing data base to calculate the index for previousyears. If required it may be possible to include monitoring stations operated byother organizations. However this may only complicate the calculations and thenational network provides sufficient information to calculate a meaningful airquality indicator.
It is recommended that the indicator be reported in the following manner:
The pollutants to be reported are those continuously reported by the nationalmonitoring network and include: SO2, NO2, O3, CO, PM10 and/or PM2.5.
The values to report will be the 50% and 95% percentile value for each ofthe various pollutants. This method of reporting is preferred to the number ofvalues above the 100% ambient standard, since it will give better trend indications.
The percentiles will be reported with respect to the relevant various timestandard exposure periods (half-hourly, eight-hourly and daily).
The indicators will be reported as monthly and also yearly values.
The results will be reported for three different area types, urban, rural andcurbside (traffic sites). The values for each of the three types will be averagedover a number of representative monitoring stations for each type.
The number of pollutants reported can be expanded as new monitoringequipment (such as benzene) becomes operational.
While an efficiency pollution factor indicator would also be attractive, inpractice it is difficult to implement. As an alternative, it is recommended thattrends in population growth, energy generation, fuel consumption, vehicle densityetc. be provided in parallel to the air quality indicators. Comparison of the twosets of data will allow conclusions regarding increasing or decreasing pollutionefficiency.
Air Quality Indicators for Israel


![Where is Israel?. Important Information Capital: Jerusalem Largest City: Jerusalem Amount of People: 7,825,600 [97 th ]](https://static.documents.pub/doc/80x56/56649e635503460f94b5f683/where-is-israel-important-information-capital-jerusalem-largest-city-jerusalem.jpg)


