40
Sustainable Energy Action Plan (Corporate) 2020 – 2030
Sustainable Energy Action Plan (Corporate) 2020 – 2030
Acknowledgement of Country
City of Stirling kaadatj Nyoongar moort Nyoongar boodja-k Wadjak boodja-k, Mooro boodja-k.
Ngalak kaadatj Nyoongar nedingar wer birdiya, baalap barn boodja-k wer kaaratj boodja-k koora koora wer yeyi.
Ngalak kaadatj baalabang malayin wer nakolak baalap yang ngalany-al City of Stirling dandjoo Nyoongar moort-al kolbang koorliny.
The City of Stirling acknowledges the Wadjak people of the Nyoongar nation as the traditional custodians of Mooro country. We pay our respects to Aboriginal and Torres Strait Islander Elders past and present, for they hold the memories, the traditions, the culture and the hopes for Aboriginal Australia.
The City is committed to forging stronger relationships and a deeper respect for Aboriginal and Torres Strait Islander Australians. By acknowledging and respecting the diversity and history of our Aboriginal and Torres Strait Islander community, we will continue to realise our vision for reconciliation.
ContentsSnapshot of our plan 5
Our strategy 6
Background 7
Our climate is changing 8
Our energy and emissions profile 10
Energy and emissions trends 11
Energy supply – electricity 12
Energy supply – gas 14
Energy supply – fuel 15
Carbon emissions target 16
Renewable electricity target 17
Energy conservation and efficiency program 18
Renewable energy program 20
Engagement program 22
Data and monitoring program 24
Action plan and timeframe 26
Measuring our progress 30
Appendices 32
Glossary 38
References 38

4
Solar PV systems reduce the City's carbon emissions and energy costs.
Sustainable Energy Action Plan (Corporate) 2020 - 2030 | 5
Snapshot of our Plan
Our vision • The City is a recognised innovator and leader in
the local government sector, taking action to reduce carbon emissions and invest in renewable energy
• The City conserves energy and its facilities, fleet, parks and reserves are energy efficient
• The City is 100 per cent powered by renewable energy
• Our people are engaged and take positive action
• Our data enables strategic decision making and reporting
• The City produces net zero emissions.
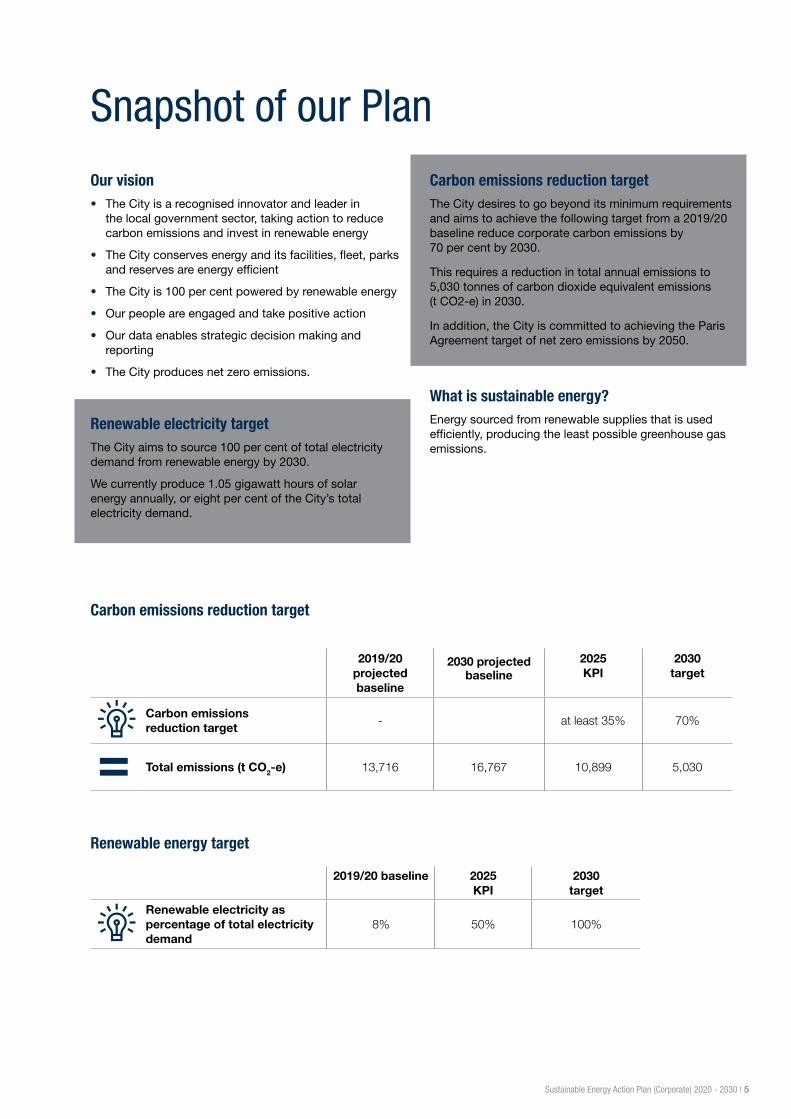
Renewable electricity targetThe City aims to source 100 per cent of total electricity demand from renewable energy by 2030.
We currently produce 1.05 gigawatt hours of solar energy annually, or eight per cent of the City’s total electricity demand.
Carbon emissions reduction targetThe City desires to go beyond its minimum requirements and aims to achieve the following target from a 2019/20 baseline reduce corporate carbon emissions by 70 per cent by 2030.
This requires a reduction in total annual emissions to 5,030 tonnes of carbon dioxide equivalent emissions (t CO2-e) in 2030.
In addition, the City is committed to achieving the Paris Agreement target of net zero emissions by 2050.
What is sustainable energy?Energy sourced from renewable supplies that is used efficiently, producing the least possible greenhouse gas emissions.
Carbon emissions reduction target
Renewable energy target
2019/20 baseline 2025 KPI
2030 target
Renewable electricity as percentage of total electricity demand
8% 50% 100%
2019/20 projected baseline
2030 projected baseline
2025 KPI
2030 target
Carbon emissions reduction target
- at least 35% 70%
Total emissions (t CO2-e) 13,716 16,767 10,899 5,030
6
Our strategy
Reduce energy consumption and increase energy efficiency • Facilities - Upgrade and optimise equipment for
energy efficient heating, cooling, ventilation and lighting systems and install smart control systems. New facilities will have high thermal performance building fabrics
• Parks – Upgrade and optimise irrigation systems and flood lighting for maximum energy efficiency
• Fleet – Increase number of efficient hybrid and plugin hybrid vehicles. Switch passenger vehicles and trucks to electric to reduce energy consumption.
Increase generation and utilisation of renewable energy • Solar – Escalate installations of solar PV systems on
rooftops and in carparks
• Gas – Switch from gas supplies to geothermal heating systems or heat pumps powered by renewable electricity. Cease installs of new gas systems
• Fleet - Transition to electric vehicles, from fossil-fuel based fuel supplies to renewable electricity and install charging infrastructure
• Batteries – Trial and showcase emerging battery technology to store renewable electricity and shift timing of energy loads
• Power purchase agreement – Procure renewable electricity to bridge the gap that cannot be generated or stored by the City.
Deeper engagement with City officers, our value chain and the community • City Officers – Enable City officers to reduce emissions
through raising awareness, building knowledge and skills, and providing mechanisms for action
• Contractors and suppliers – Implement sustainable procurement requirements in the value chain for energy efficiency and renewable energy
• Community – Join the Cities Power Partnership and increase community awareness of the City’s energy actions.
Improve data management for strategic decision making and reporting • Data – Improve energy data quality and monitoring
system
• Reporting – Improve energy and emissions reporting internally and to the community.
Sustainable Energy Action Plan (Corporate) 2020 - 2030 | 7
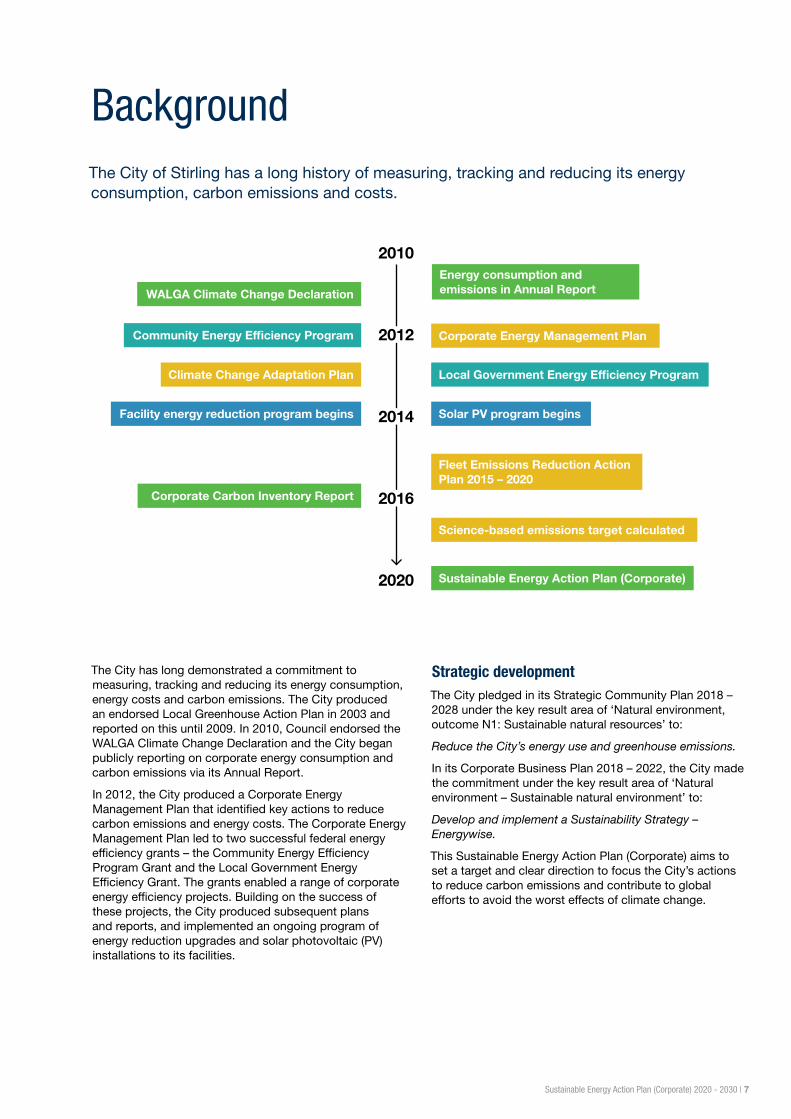
BackgroundThe City of Stirling has a long history of measuring, tracking and reducing its energy consumption, carbon emissions and costs.
The City has long demonstrated a commitment to measuring, tracking and reducing its energy consumption, energy costs and carbon emissions. The City produced an endorsed Local Greenhouse Action Plan in 2003 and reported on this until 2009. In 2010, Council endorsed the WALGA Climate Change Declaration and the City began publicly reporting on corporate energy consumption and carbon emissions via its Annual Report.
In 2012, the City produced a Corporate Energy Management Plan that identified key actions to reduce carbon emissions and energy costs. The Corporate Energy Management Plan led to two successful federal energy efficiency grants – the Community Energy Efficiency Program Grant and the Local Government Energy Efficiency Grant. The grants enabled a range of corporate energy efficiency projects. Building on the success of these projects, the City produced subsequent plans and reports, and implemented an ongoing program of energy reduction upgrades and solar photovoltaic (PV) installations to its facilities.
Strategic development The City pledged in its Strategic Community Plan 2018 – 2028 under the key result area of ‘Natural environment, outcome N1: Sustainable natural resources’ to:
Reduce the City’s energy use and greenhouse emissions.
In its Corporate Business Plan 2018 – 2022, the City made the commitment under the key result area of ‘Natural environment – Sustainable natural environment’ to:
Develop and implement a Sustainability Strategy – Energywise.
This Sustainable Energy Action Plan (Corporate) aims to set a target and clear direction to focus the City’s actions to reduce carbon emissions and contribute to global efforts to avoid the worst effects of climate change.
2010
2012
2014
2020
2016
Energy consumption and emissions in Annual Report
Corporate Energy Management Plan
WALGA Climate Change Declaration
Community Energy Efficiency Program
Climate Change Adaptation Plan
Facility energy reduction program begins
Corporate Carbon Inventory Report
Fleet Emissions Reduction Action Plan 2015 – 2020
Local Government Energy Efficiency Program
Science-based emissions target calculated
Sustainable Energy Action Plan (Corporate)
Solar PV program begins
8
Our climate is changing“The science is clear: climate change is occurring and greenhouse gas emissions from human activities are the dominant cause.” (WALGA Climate Change Policy 2018)
Australia’s climate is changing; we are facing a more uncertain climate future with more frequent and extreme weather events. Some Australian councils, such as Darwin, Hobart, Melbourne and Sydney City councils, have declared this a ‘climate emergency’.
Since 1910, the temperature has warmed by around one degree Celsius, resulting in the increased frequency of extreme heat events and marine heatwaves. Sea levels around Australia are rising, increasing the risk of inundation in coastal areas. In Western Australia, 2018 was the sixth warmest year on record, with mean maximum temperatures above average across the state and a decrease in the April to October rainfall across the South West (Bureau of Meteorology, 2018).
Carbon emissions and climate changeGreenhouse gas emissions (carbon emissions) continue to increase globally and are acknowledged by the scientific community as the main contributor to climate change.
The energy that powers the City of Stirling’s operations and services comes from both non-renewable and renewable sources. When the City uses non-renewable energy supplies (grid-powered electricity, natural gas, and fuel in the form of diesel, petrol and LPG), carbon emissions are released into the air.
There is a finite amount of carbon emissions the earth’s atmosphere can absorb before critical temperature thresholds are reached; this is estimated to be 1,010 gigatonnes of carbon dioxide equivalent emissions (Gt CO2-e) to keep average temperature increase to below two degrees Celsius and 400 Gt CO2-e to keep average temperature increase to below 1.5 degrees Celsius (Science-based Targets initiative, 2017). This sets a ‘carbon budget’ for governments, regardless of growth in population or services.
United Nations Paris Agreement Australia is a signatory at a federal level to the United Nations Paris Agreement 2016, which sets a goal to hold the rise in global average temperature to well below two degrees Celsius above pre-industrial levels, and to pursue efforts to limit the increase even further to 1.5 degrees Celsius.
The Australian Federal Government has set a target to reduce carbon emissions by 26 per cent to 28 per cent by 2030 (on a 2005 base year). Australia is not on track to achieve this, with the latest Department of Environment and Energy report stating emissions may be reduced by only 16 per cent by 2030 (Department of the Environment and Energy, 2019).
Local government has a key role to play in contributing to national and international emissions reduction targets. In its Climate Change Policy 2018, the Western Australian Local Government Association (WALGA) recognises that local government is “in a unique position to drive and implement mitigation programs, foster innovation and support sustainability”.
The City is committed to aligning with the Paris Agreement target of net zero Emissions by 2050. The City's target of 70 per cent carbon emissions reduction by 2030 aligns with this goal.
Sustainable Energy Action Plan (Corporate) 2020 - 2030 | 9
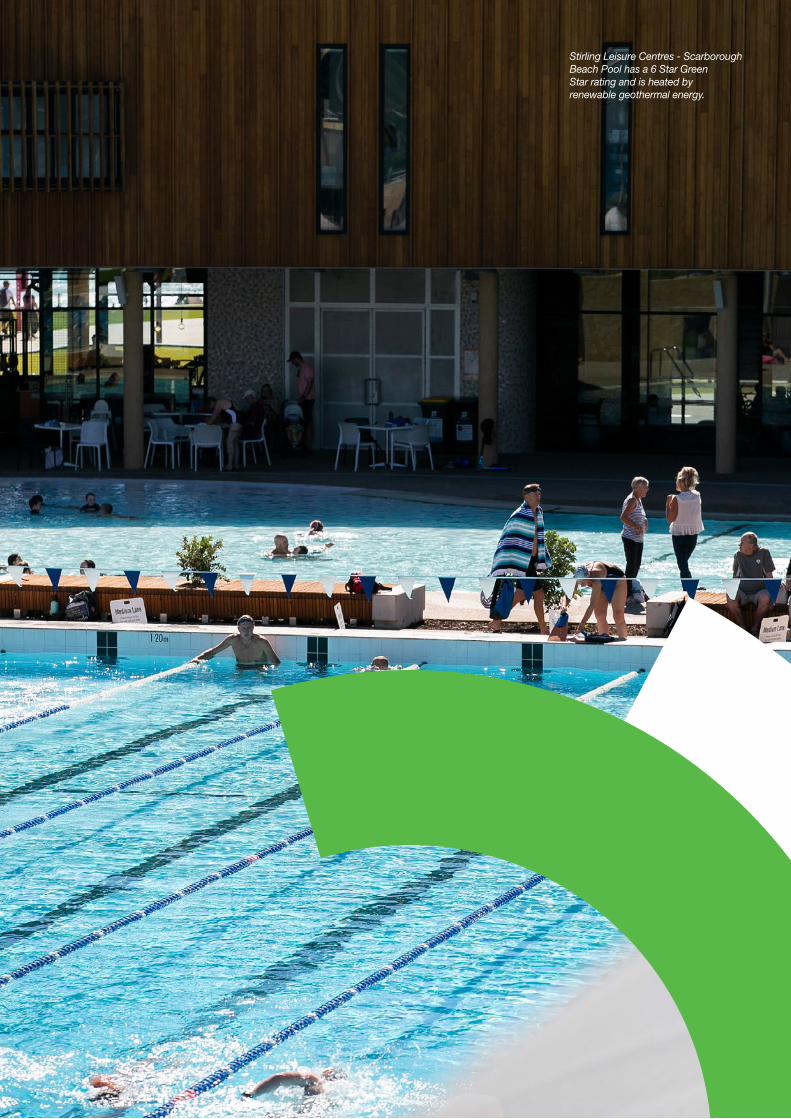
Stirling Leisure Centres - Scarborough Beach Pool has a 6 Star Green Star rating and is heated by renewable geothermal energy.
10
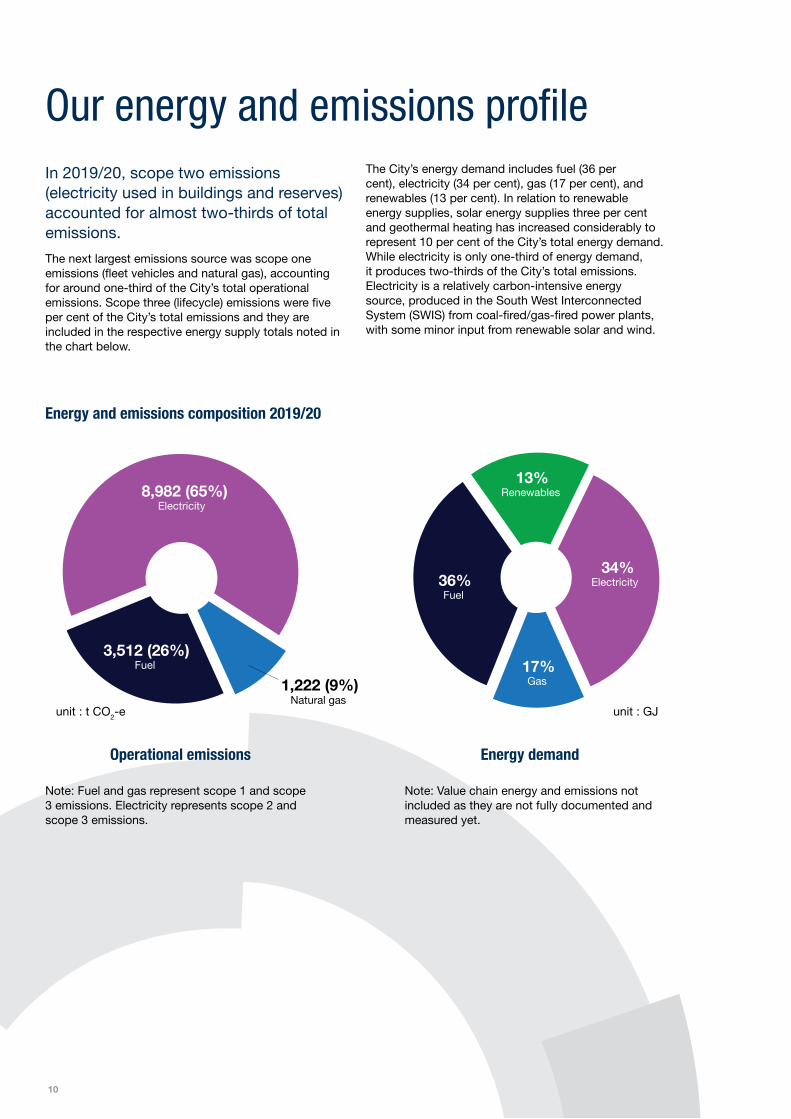
Our energy and emissions profileIn 2019/20, scope two emissions (electricity used in buildings and reserves) accounted for almost two-thirds of total emissions.
The next largest emissions source was scope one emissions (fleet vehicles and natural gas), accounting for around one-third of the City’s total operational emissions. Scope three (lifecycle) emissions were five per cent of the City’s total emissions and they are included in the respective energy supply totals noted in the chart below.
The City’s energy demand includes fuel (36 per cent), electricity (34 per cent), gas (17 per cent), and renewables (13 per cent). In relation to renewable energy supplies, solar energy supplies three per cent and geothermal heating has increased considerably to represent 10 per cent of the City’s total energy demand. While electricity is only one-third of energy demand, it produces two-thirds of the City’s total emissions. Electricity is a relatively carbon-intensive energy source, produced in the South West Interconnected System (SWIS) from coal-fired/gas-fired power plants, with some minor input from renewable solar and wind.
1,222 (9%)Natural gas
8,982 (65%)Electricity
3,512 (26%)Fuel
34%Electricity 36%
Fuel
17%Gas
13%Renewables
Energy and emissions composition 2019/20
Operational emissions Energy demand
Note: Value chain energy and emissions not included as they are not fully documented and measured yet.
Note: Fuel and gas represent scope 1 and scope 3 emissions. Electricity represents scope 2 and scope 3 emissions.
unit : t CO2-e unit : GJ
Sustainable Energy Action Plan (Corporate) 2020 - 2030 | 11
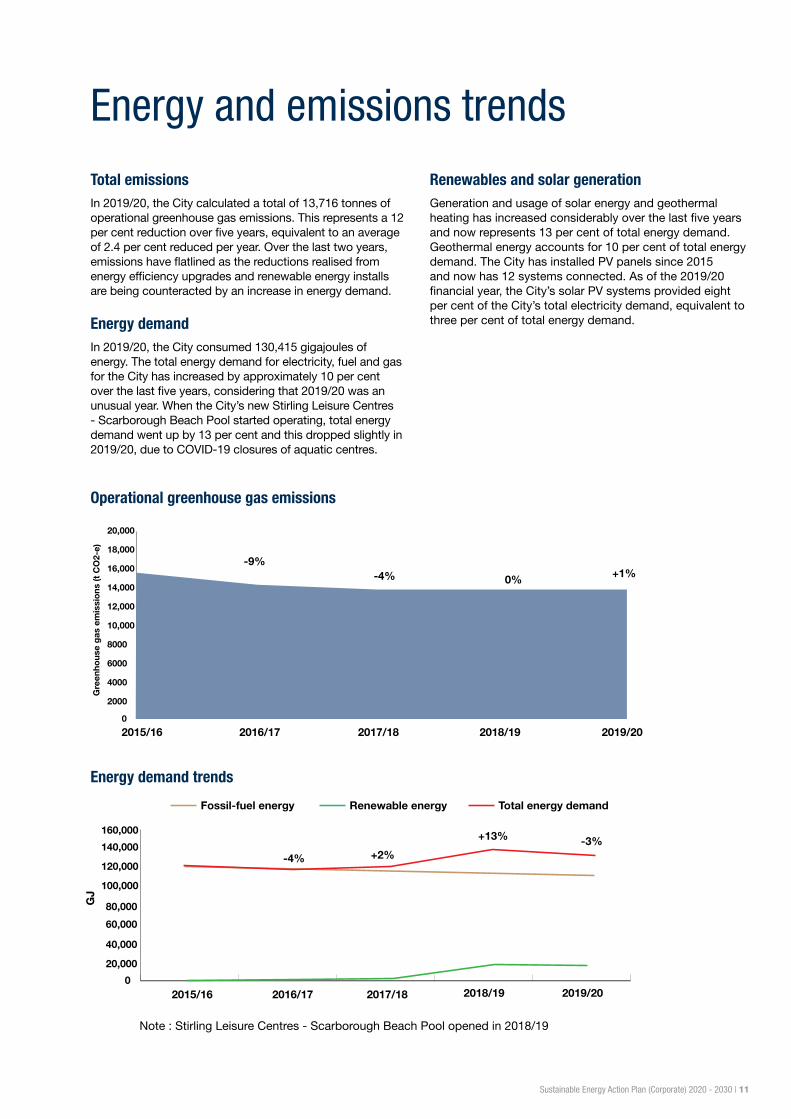
Energy and emissions trends
Total emissionsIn 2019/20, the City calculated a total of 13,716 tonnes of operational greenhouse gas emissions. This represents a 12 per cent reduction over five years, equivalent to an average of 2.4 per cent reduced per year. Over the last two years, emissions have flatlined as the reductions realised from energy efficiency upgrades and renewable energy installs are being counteracted by an increase in energy demand.
Energy demandIn 2019/20, the City consumed 130,415 gigajoules of energy. The total energy demand for electricity, fuel and gas for the City has increased by approximately 10 per cent over the last five years, considering that 2019/20 was an unusual year. When the City’s new Stirling Leisure Centres - Scarborough Beach Pool started operating, total energy demand went up by 13 per cent and this dropped slightly in 2019/20, due to COVID-19 closures of aquatic centres.
Renewables and solar generationGeneration and usage of solar energy and geothermal heating has increased considerably over the last five years and now represents 13 per cent of total energy demand. Geothermal energy accounts for 10 per cent of total energy demand. The City has installed PV panels since 2015 and now has 12 systems connected. As of the 2019/20 financial year, the City’s solar PV systems provided eight per cent of the City’s total electricity demand, equivalent to three per cent of total energy demand.
0
2000
4000
6000
8000
10,000
12,000
14,000
16,000
18,000
20,000
2015/16
Gre
enho
use
gas
em
issi
ons
(t C
O2-
e)
2016/17
-9%-4% 0% +1%
2018/192017/18 2019/20
0
20,000
40,000
60,000
80,000
100,000
120,000
140,000
160,000
GJ
Fossil-fuel energy
2018/19 2019/20
Renewable energy Total energy demand
2015/16 2016/17 2017/18
-4% +2%
+13% -3%
Operational greenhouse gas emissions
Energy demand trends
Note : Stirling Leisure Centres - Scarborough Beach Pool opened in 2018/19
12
Energy efficiency works at Stirling Leisure Centres - Leisurepark - Balga – were partly funded by government grants and continue to reduce the City's energy consumption and carbon emissions.
Sustainable Energy Action Plan (Corporate) 2020 - 2030 | 13
33%
28%
39%
Aquatic Centres
Buildings & Facilities
Parks & Reserve
2%
81%
17%
Aquatic centres
Buildings and facilities
Parks and reserves
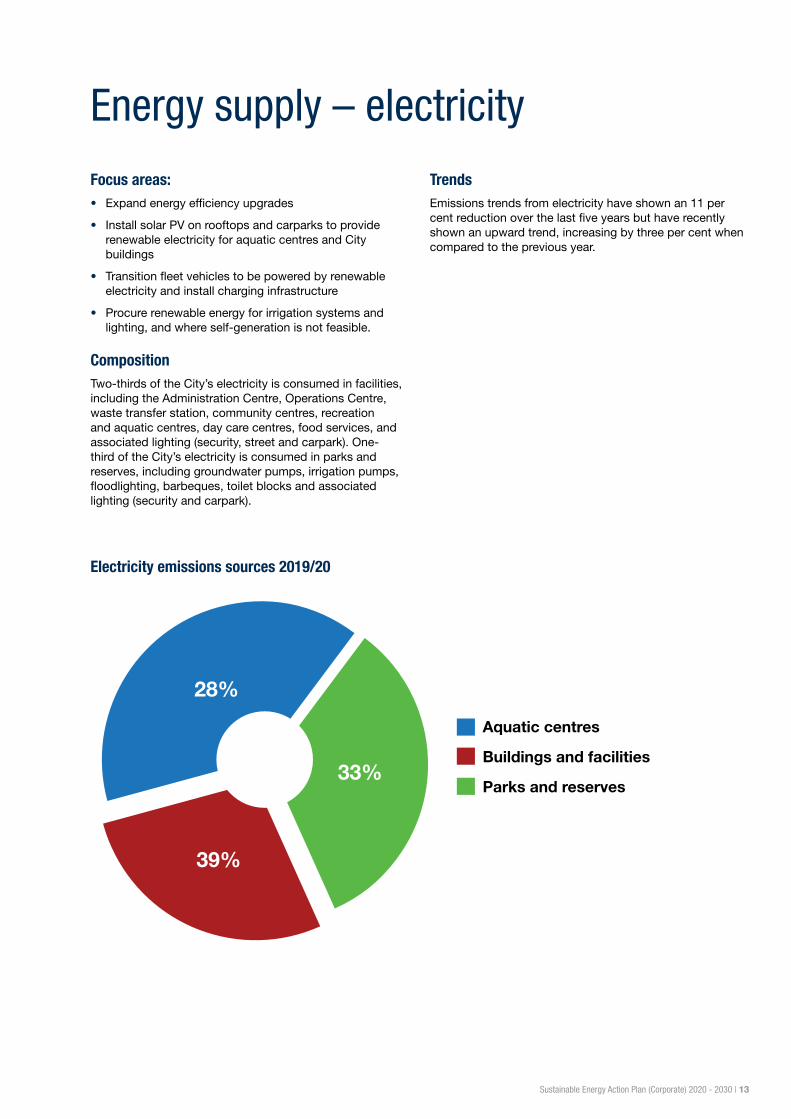
Electricity emissions sources 2019/20
Energy supply – electricity
Focus areas: • Expand energy efficiency upgrades
• Install solar PV on rooftops and carparks to provide renewable electricity for aquatic centres and City buildings
• Transition fleet vehicles to be powered by renewable electricity and install charging infrastructure
• Procure renewable energy for irrigation systems and lighting, and where self-generation is not feasible.
CompositionTwo-thirds of the City’s electricity is consumed in facilities, including the Administration Centre, Operations Centre, waste transfer station, community centres, recreation and aquatic centres, day care centres, food services, and associated lighting (security, street and carpark). One-third of the City’s electricity is consumed in parks and reserves, including groundwater pumps, irrigation pumps, floodlighting, barbeques, toilet blocks and associated lighting (security and carpark).
TrendsEmissions trends from electricity have shown an 11 per cent reduction over the last five years but have recently shown an upward trend, increasing by three per cent when compared to the previous year.
14
Energy supply – gas
Focus areas: • Reassess aquatic centre pool heating
• Switch gas to renewable supplies
• Cease new installations of gas systems.
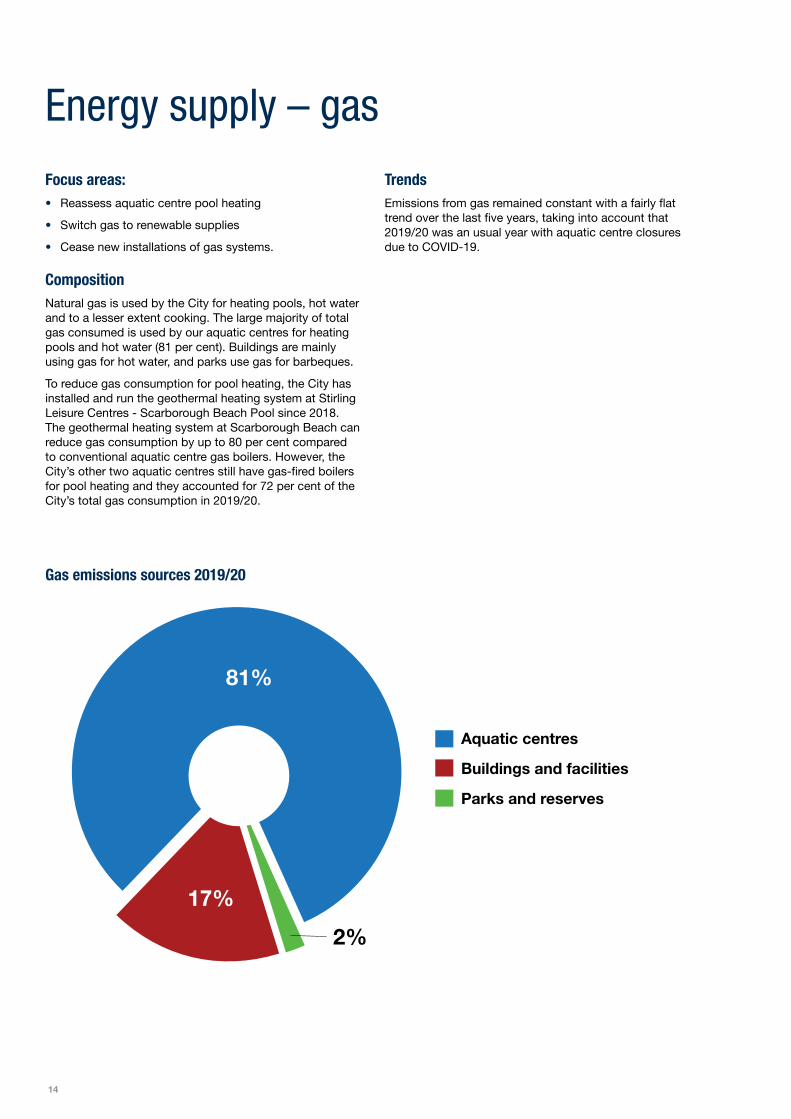
CompositionNatural gas is used by the City for heating pools, hot water and to a lesser extent cooking. The large majority of total gas consumed is used by our aquatic centres for heating pools and hot water (81 per cent). Buildings are mainly using gas for hot water, and parks use gas for barbeques.
To reduce gas consumption for pool heating, the City has installed and run the geothermal heating system at Stirling Leisure Centres - Scarborough Beach Pool since 2018. The geothermal heating system at Scarborough Beach can reduce gas consumption by up to 80 per cent compared to conventional aquatic centre gas boilers. However, the City’s other two aquatic centres still have gas-fired boilers for pool heating and they accounted for 72 per cent of the City’s total gas consumption in 2019/20.
TrendsEmissions from gas remained constant with a fairly flat trend over the last five years, taking into account that 2019/20 was an usual year with aquatic centre closures due to COVID-19.
2%
81%
17%
Aquatic centres
Buildings and facilities
Parks and reserves
Gas emissions sources 2019/20
2%
81%
17%
Aquatic centres
Buildings and facilities
Parks and reserves
Sustainable Energy Action Plan (Corporate) 2020 - 2030 | 15
36%
22%
14%
14%
14%
Energy supply – fuel
Key focus areas • Transition suitable trucks and cars over to hybrid/
electric vehicles
• Provide vehicle charging infrastructure with renewable energy
• Switch utility vehicles for SUV EV/hybrid trucks when feasible
• Monitor emerging technology improvements for electric heavy trucks and hybrid utility vehicles.
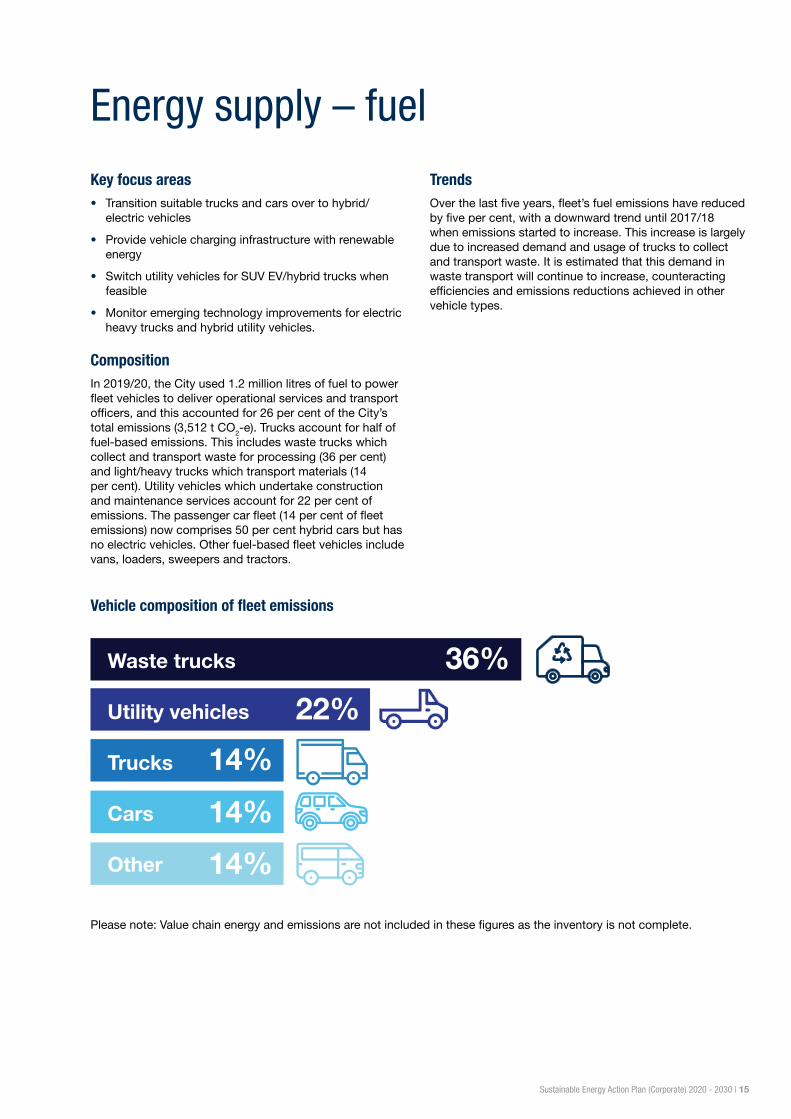
CompositionIn 2019/20, the City used 1.2 million litres of fuel to power fleet vehicles to deliver operational services and transport officers, and this accounted for 26 per cent of the City’s total emissions (3,512 t CO2-e). Trucks account for half of fuel-based emissions. This includes waste trucks which collect and transport waste for processing (36 per cent) and light/heavy trucks which transport materials (14 per cent). Utility vehicles which undertake construction and maintenance services account for 22 per cent of emissions. The passenger car fleet (14 per cent of fleet emissions) now comprises 50 per cent hybrid cars but has no electric vehicles. Other fuel-based fleet vehicles include vans, loaders, sweepers and tractors.
TrendsOver the last five years, fleet’s fuel emissions have reduced by five per cent, with a downward trend until 2017/18 when emissions started to increase. This increase is largely due to increased demand and usage of trucks to collect and transport waste. It is estimated that this demand in waste transport will continue to increase, counteracting efficiencies and emissions reductions achieved in other vehicle types.
Waste trucks
Utility vehicles
Trucks
Cars
Other
Vehicle composition of fleet emissions
Please note: Value chain energy and emissions are not included in these figures as the inventory is not complete.
16
0
2,000
4,000
6,000
8,000
10,000
12,000
14,000
16,000
18,000
Baseline2019/20
Estimatedemissionincrease by 2030
Projectedbaseline
(2030)
Geothermalheating
Contribution to 70% emissions reduction target
t C
o2_
e
Energyefficiencyprogram
Solar PV PPA Target(2030)
13,716
3,05116,767(100%)
1,051(6.3%) 906
(5.4%) 3,028(18.1%)
6,752(40.2%)
5,030(30%)
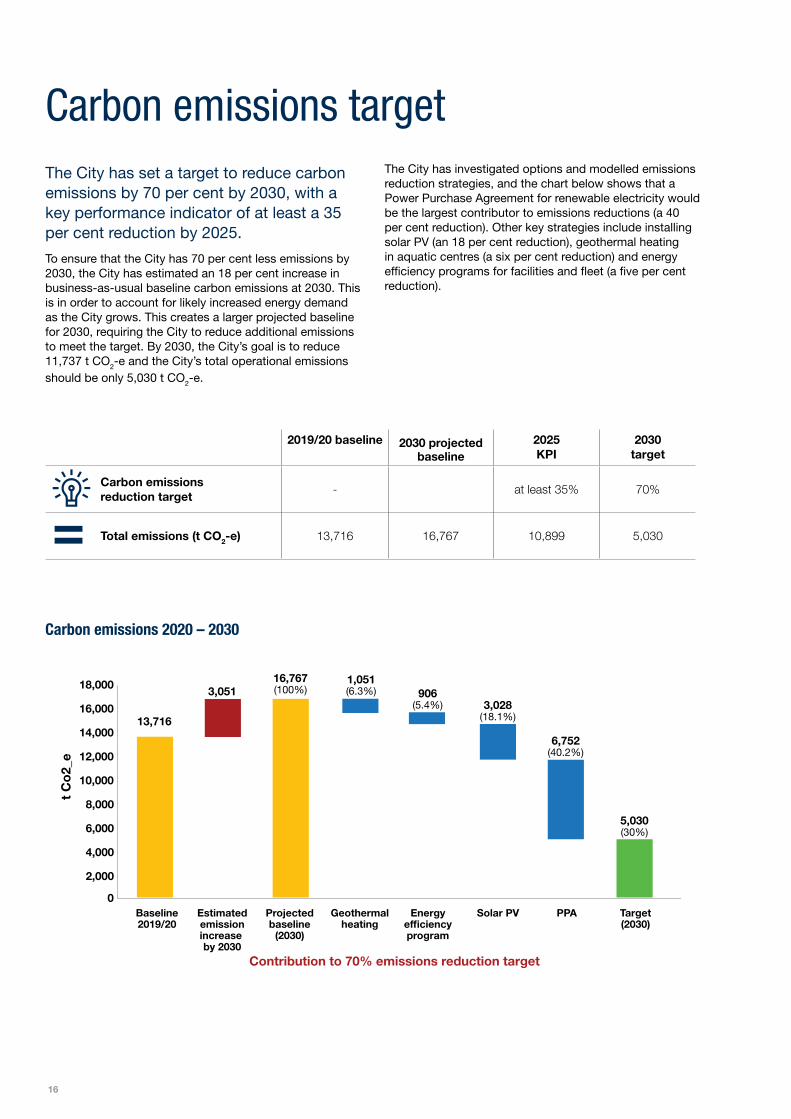
Carbon emissions targetThe City has set a target to reduce carbon emissions by 70 per cent by 2030, with a key performance indicator of at least a 35 per cent reduction by 2025.
To ensure that the City has 70 per cent less emissions by 2030, the City has estimated an 18 per cent increase in business-as-usual baseline carbon emissions at 2030. This is in order to account for likely increased energy demand as the City grows. This creates a larger projected baseline for 2030, requiring the City to reduce additional emissions to meet the target. By 2030, the City’s goal is to reduce 11,737 t CO2-e and the City’s total operational emissions should be only 5,030 t CO2-e.
The City has investigated options and modelled emissions reduction strategies, and the chart below shows that a Power Purchase Agreement for renewable electricity would be the largest contributor to emissions reductions (a 40 per cent reduction). Other key strategies include installing solar PV (an 18 per cent reduction), geothermal heating in aquatic centres (a six per cent reduction) and energy efficiency programs for facilities and fleet (a five per cent reduction).
Carbon emissions 2020 – 2030
2019/20 baseline 2030 projected baseline
2025 KPI
2030 target
Carbon emissions reduction target
- at least 35% 70%
Total emissions (t CO2-e) 13,716 16,767 10,899 5,030
Sustainable Energy Action Plan (Corporate) 2020 - 2030 | 17
0
2
4
6
8
10
12
14
16
18
Baseline electricity demand2019/20
Demandincreaseby 2030
Fleet EVincreaseby 2030
Energyefficiencyprogramby 2030
Contribution to 100% renewable electricity target
GW
h
Estimatedelectricitydemand(2030)
Solar PV PPAsupply
12.87(79%)
2.86
1.29 0.8016.22(100%)
5.34(33%)
10.88(67%)
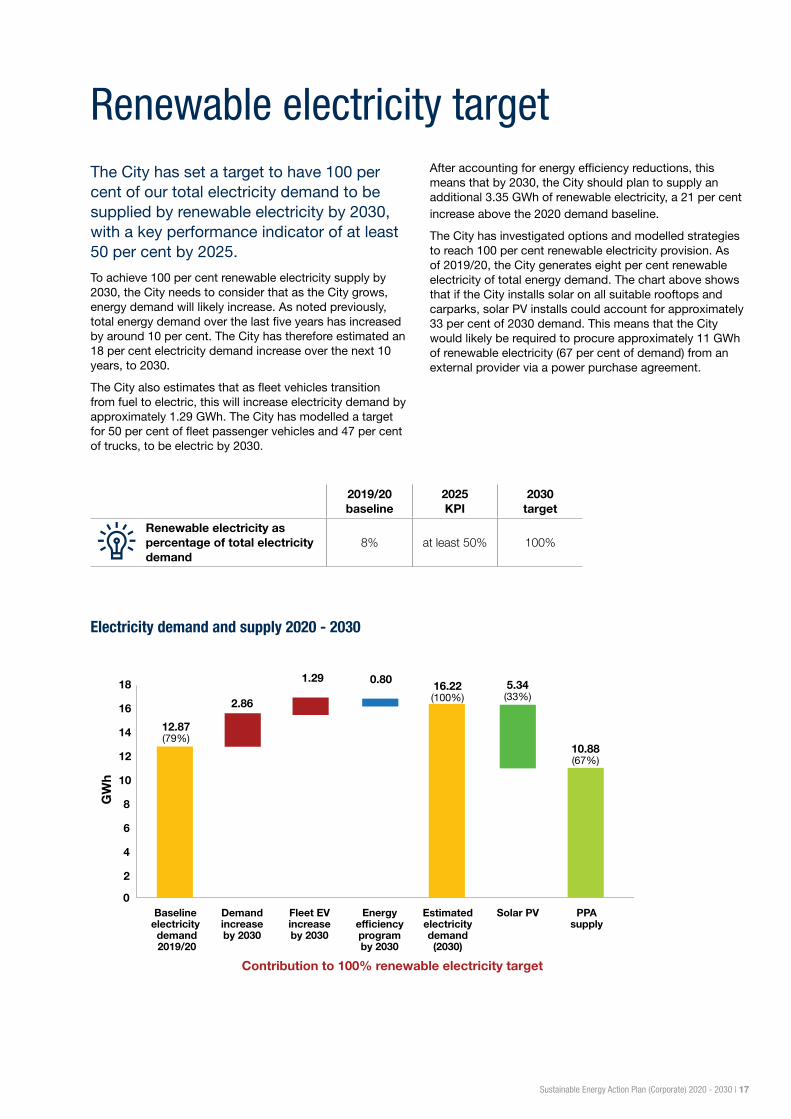
Renewable electricity targetThe City has set a target to have 100 per cent of our total electricity demand to be supplied by renewable electricity by 2030, with a key performance indicator of at least 50 per cent by 2025.
To achieve 100 per cent renewable electricity supply by 2030, the City needs to consider that as the City grows, energy demand will likely increase. As noted previously, total energy demand over the last five years has increased by around 10 per cent. The City has therefore estimated an 18 per cent electricity demand increase over the next 10 years, to 2030.
The City also estimates that as fleet vehicles transition from fuel to electric, this will increase electricity demand by approximately 1.29 GWh. The City has modelled a target for 50 per cent of fleet passenger vehicles and 47 per cent of trucks, to be electric by 2030.
After accounting for energy efficiency reductions, this means that by 2030, the City should plan to supply an additional 3.35 GWh of renewable electricity, a 21 per cent increase above the 2020 demand baseline.
The City has investigated options and modelled strategies to reach 100 per cent renewable electricity provision. As of 2019/20, the City generates eight per cent renewable electricity of total energy demand. The chart above shows that if the City installs solar on all suitable rooftops and carparks, solar PV installs could account for approximately 33 per cent of 2030 demand. This means that the City would likely be required to procure approximately 11 GWh of renewable electricity (67 per cent of demand) from an external provider via a power purchase agreement.
Electricity demand and supply 2020 - 2030
2019/20 baseline
2025 KPI
2030 target
Renewable electricity as percentage of total electricity demand
8% at least 50% 100%
18
Energy conservation and efficiency programThe City aims to avoid energy consumption by using smart technology and control systems to reduce the amount assets are used, and for assets to be efficient and minimise energy consumption when in use, especially at night.
Key challenges • Scale and complexity: The City has a considerable
number of energy-consuming assets with varying physical characteristics, energy consumption profiles and operational controls, making it a challenge to identify the most appropriate and cost-effective energy reduction solutions.
• Retrofitting: Building fabric retrofit projects on an ageing infrastructure can be technically complex and not always cost effective.
• Diminishing returns: As more is achieved, projects become increasingly difficult to identify and the financial and carbon emissions returns diminish
• Expectations: Facility users expect a level of comfort in heating and cooling, lighting, and pool temperature. The community expects irrigated parks and lighting for recreation and sporting events.
• Conflicting priorities: Increased lighting levels (LUX) and illuminated areas at sporting grounds, walkways and carparks required to meet Australian standards may counteract savings from energy-efficient light-emitting diode (LED) installation.
• Information and communication technology (ICT): The City has an extensive network of ICT equipment, including computers, laptops, servers, printers and displays, along with diverse users and ageing and geographically spread ICT infrastructure.
• Vegetation health: Irrigation is required to keep vegetation healthy and free of pests and diseases.
• System configuration: Irrigation and floodlights are grouped into stations and the configurations do not always enable fine-tuned scheduling control.
• System compatibility: Technology to improve remote floodlighting control is not compatible with existing systems and requires hardware and software upgrades to facilitate.
• Expansion: The City continues to grow in resident numbers. Increasing and improving services to residents can increase energy consumption.
• Technical barriers: Technology has not matured yet for hybrid trucks and utility vehicles.
Completed actions – facilities • Heating, ventilation and cooling (HVAC): upgraded
HVAC systems in priority buildings to more energy efficient models. Optimised control strategies to reduce the amount that air-conditioning and heating are used. Reduced use of HVAC in transient and infrequently occupied spaces
• Building management system (BMS): upgraded BMS to monitor and manage HVAC efficiency at the City of Stirling Administration Centre, three aquatic centres and four libraries
• Maintenance schedule: developed outcome-based maintenance schedules at three aquatic centres to ensure that plant and equipment are operating at their most efficient
• Heating: efficient condensing boilers installed when boilers reach end of life
• Variable speed drives (VSDs): installed VSDs on air-conditioning condenser water pumps in priority buildings and on pool pumps in aquatic centres
• Lighting: installed high-efficiency LED lighting and automation for lighting controls (eg, motion sensors) in priority buildings
• Fixtures, fittings and equipment (FFE) list: developed a FFE list for staff to use when planning building projects and included energy-saving items
• Environmentally sustainable design (ESD): developed ESD guidelines for HVAC, lighting and water fixtures to guide staff when planning building projects
• ICT: defined specifications with a new supplier for devices with reduced power requirements. Desktop computers use only 10 per cent and monitors use half the energy of the previous devices
• ICT: installed ‘follow-me’ printing to reduce the number of printers and the amount of wasted printing.
Completed actions - fleet • Hybrid cars: procured hybrid cars which now represent
50 per cent of passenger fleet.
Sustainable Energy Action Plan (Corporate) 2020 - 2030 | 19
Completed actions – parks and reserves • Hydrozoning: developed a Water Smart Parks
Strategy to define irrigation requirements according to hydrozones, local soil moisture and weather conditions
• Irrigation schedules: utilised a centralised irrigation management system (CIMS) to remotely monitor soil moisture and weather, and to program and maintain irrigation run times
• Irrigation meters: installed R1 tariff meters on all irrigation sites (while this doesn’t reduce energy consumption, it does utilise reduced overnight electricity costs)
• Irrigation pumps: upgraded irrigation pumps and starters with the most energy-efficient fit-for-purpose options as part of a rolling 25-year asset upgrade and renewal program
• Floodlighting schedules: used CIMS software to program floodlight brightness (LUX), timing and stations according to user group requirements. Program can be manually overridden if floodlight station is no longer required and floodlight infrastructure can be switched off manually if not needed
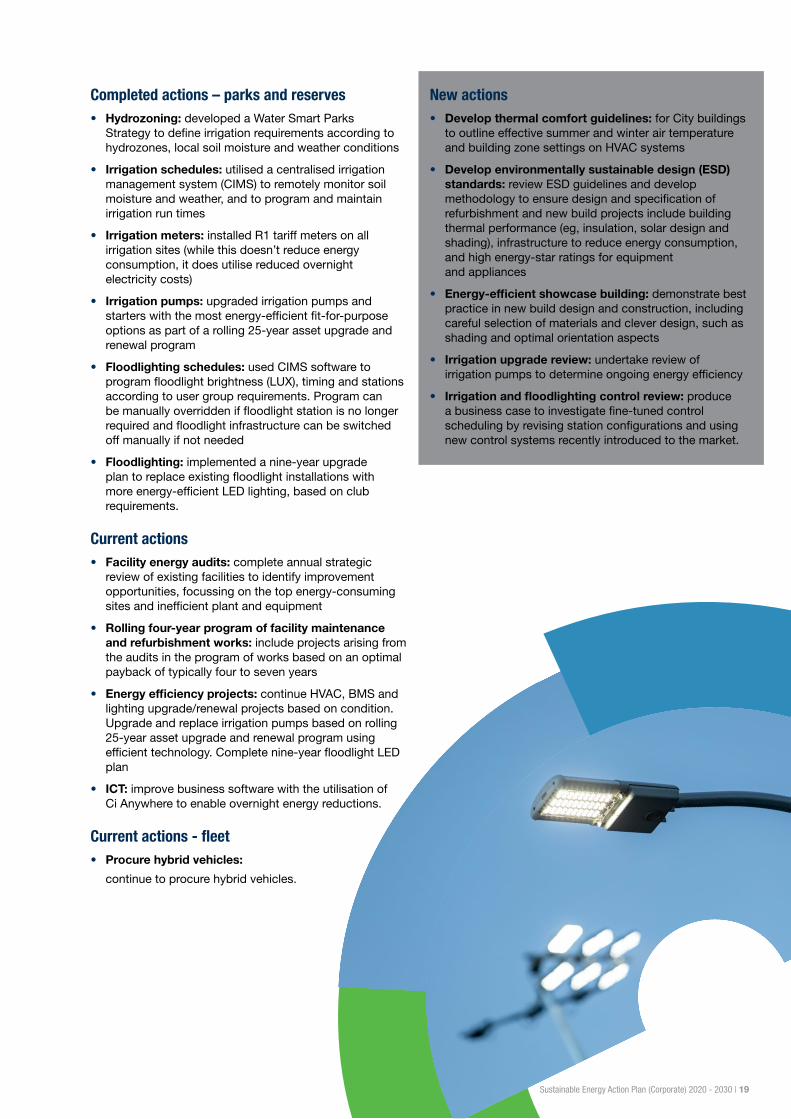
• Floodlighting: implemented a nine-year upgrade plan to replace existing floodlight installations with more energy-efficient LED lighting, based on club requirements.
Current actions • Facility energy audits: complete annual strategic
review of existing facilities to identify improvement opportunities, focussing on the top energy-consuming sites and inefficient plant and equipment
• Rolling four-year program of facility maintenance and refurbishment works: include projects arising from the audits in the program of works based on an optimal payback of typically four to seven years
• Energy efficiency projects: continue HVAC, BMS and lighting upgrade/renewal projects based on condition. Upgrade and replace irrigation pumps based on rolling 25-year asset upgrade and renewal program using efficient technology. Complete nine-year floodlight LED plan
• ICT: improve business software with the utilisation of Ci Anywhere to enable overnight energy reductions.
Current actions - fleet • Procure hybrid vehicles:
continue to procure hybrid vehicles.
New actions • Develop thermal comfort guidelines: for City buildings
to outline effective summer and winter air temperature and building zone settings on HVAC systems
• Develop environmentally sustainable design (ESD) standards: review ESD guidelines and develop methodology to ensure design and specification of refurbishment and new build projects include building thermal performance (eg, insulation, solar design and shading), infrastructure to reduce energy consumption, and high energy-star ratings for equipment and appliances
• Energy-efficient showcase building: demonstrate best practice in new build design and construction, including careful selection of materials and clever design, such as shading and optimal orientation aspects
• Irrigation upgrade review: undertake review of irrigation pumps to determine ongoing energy efficiency
• Irrigation and floodlighting control review: produce a business case to investigate fine-tuned control scheduling by revising station configurations and using new control systems recently introduced to the market.
20
Renewable energy programThe City aims to be 100 per cent powered by renewable energy sources. Renewable energy does not burn fossil fuels and therefore does not produce carbon emissions in operation.
Key challenges • Diminishing returns: As more renewables are installed,
space and opportunity for additional systems based on current technology decreases, and the cost savings and carbon emissions returns diminish.
• Capacity: The total capacity for solar PV installation on existing assets is unknown and the potential for other renewable technologies has not been determined.
• Energy use profile: Current solar PV technology has the best payback when used on-site. Facilities with low daytime energy use may not benefit.
• Cost effectiveness: Storing renewable energy (eg, via batteries) to use outside of generation hours is not yet cost effective, with an on-average 10-year warranty and 17-year payback.
• Technology: New renewable energy technology is emerging and becoming increasingly available and cost-effective. This provides opportunities but also uncertainties.
• Decentralisation: New methods to supply and purchase renewable energy, such as peer-to-peer trading and power purchase agreements (PPAs), are emerging but there is limited information on their feasibility in a Western Australian local government context.
• Site constraints: The use of renewable energy in parks and reserves is limited due to their overnight energy use profile and lack of roof or available ground space.
• Technical barrier: Technology has not matured yet for batteries and electric vehicles.
Completed actions • Solar PV: installed 12 systems on operational buildings
with a total capacity of 730 kilowatt peak (kWp)
• Solar black matting: installed solar black matting at Stirling Leisure Centres – Leisurepark – Balga to heat swimming pool water
• Solar hot water: installed 19 solar hot water systems on community facilities
• Pool heating: installed a geothermal pool heating system at Stirling Leisure Centres - Scarborough Beach Pool
• Trial of plugin-hybrid car: undertook trial of plugin hybrid pool vehicle.
Current actions • Rolling four-year program of works: continually review
new technologies and facility audits to identify priority buildings and specific renewable projects to deliver
• Projects: continue to install solar PV systems at suitable facilities until saturation point is reached.
New actions • Develop renewable energy generation plan: review
options and opportunities for generation of renewable energy, including solar PV installation on City facilities and land; geothermal on aquatic centres; wind and other renewables; batteries and peer-to-peer trading
• Solar program funding: develop detailed business case and explore funding opportunities for escalation of solar program
• Procure a power purchase agreement: review options and opportunities for a power purchase agreement (PPA). Complete a tender process to procure renewable energy to fill any gap identified by the renewable energy review and renewable energy generation plan
• Develop environmentally sustainable design (ESD) standards: incorporate renewable energy systems into the ESD guidelines for consideration for all new-build projects where the return on investment is less than seven years
• Demonstrate net-zero-emissions showcase building: include renewable energy systems that will produce more energy than the building will use
• Undertake battery storage trial: develop and implement a project to showcase battery storage on a building to determine its feasibility for wider-scale implementation
• Install geothermal energy: install more geothermal heating system in aquatic centers and introduce a geothermal space heating and cooling system. Cease installations of new gas systems
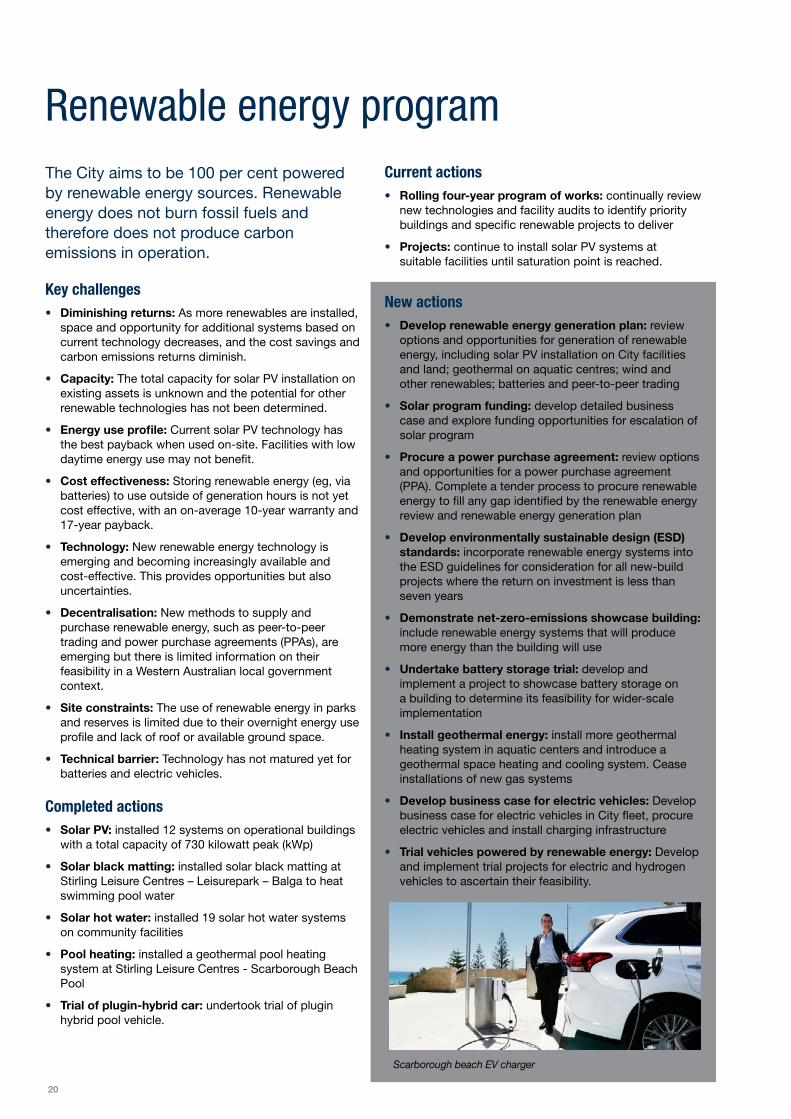
• Develop business case for electric vehicles: Develop business case for electric vehicles in City fleet, procure electric vehicles and install charging infrastructure
• Trial vehicles powered by renewable energy: Develop and implement trial projects for electric and hydrogen vehicles to ascertain their feasibility.
Scarborough beach EV charger
Sustainable Energy Action Plan (Corporate) 2020 - 2030 | 21
What are batteries, peer-to-peer trading and PPAs?Batteries allow the storage of solar energy for use outside of solar generation periods. They may enable the installation of solar panels at sites that have high evening use, such as recreational facilities and reserves hired for evening sporting events.
Peer-to-peer trading involves excess renewable energy generated at one site being sold or ‘transferred’ to other site/s. It can improve the economics of renewables by enabling the energy generated to be used across more than one site and allowing installation of larger systems than might otherwise be viable. Peer-to-peer trading is an emerging concept, and is not yet available for the City to utilise. The main barriers are regulatory (market rules), technical (metering) and market-based (establishing a pricing structure). However, these are changing quickly and opportunities may open up in the near future.
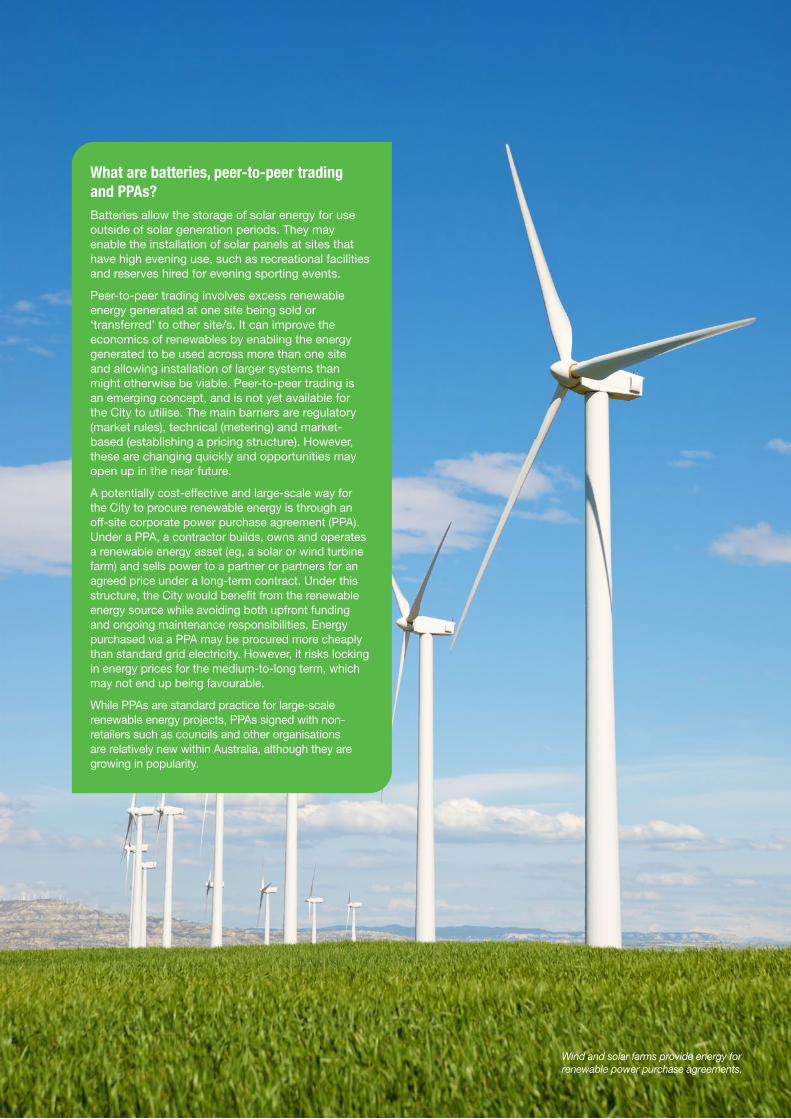
A potentially cost-effective and large-scale way for the City to procure renewable energy is through an off-site corporate power purchase agreement (PPA). Under a PPA, a contractor builds, owns and operates a renewable energy asset (eg, a solar or wind turbine farm) and sells power to a partner or partners for an agreed price under a long-term contract. Under this structure, the City would benefit from the renewable energy source while avoiding both upfront funding and ongoing maintenance responsibilities. Energy purchased via a PPA may be procured more cheaply than standard grid electricity. However, it risks locking in energy prices for the medium-to-long term, which may not end up being favourable.
While PPAs are standard practice for large-scale renewable energy projects, PPAs signed with non-retailers such as councils and other organisations are relatively new within Australia, although they are growing in popularity.
Wind and solar farms provide energy for renewable power purchase agreements.

22
Sustainable Energy Action Plan (Corporate) 2020 - 2030 | 23
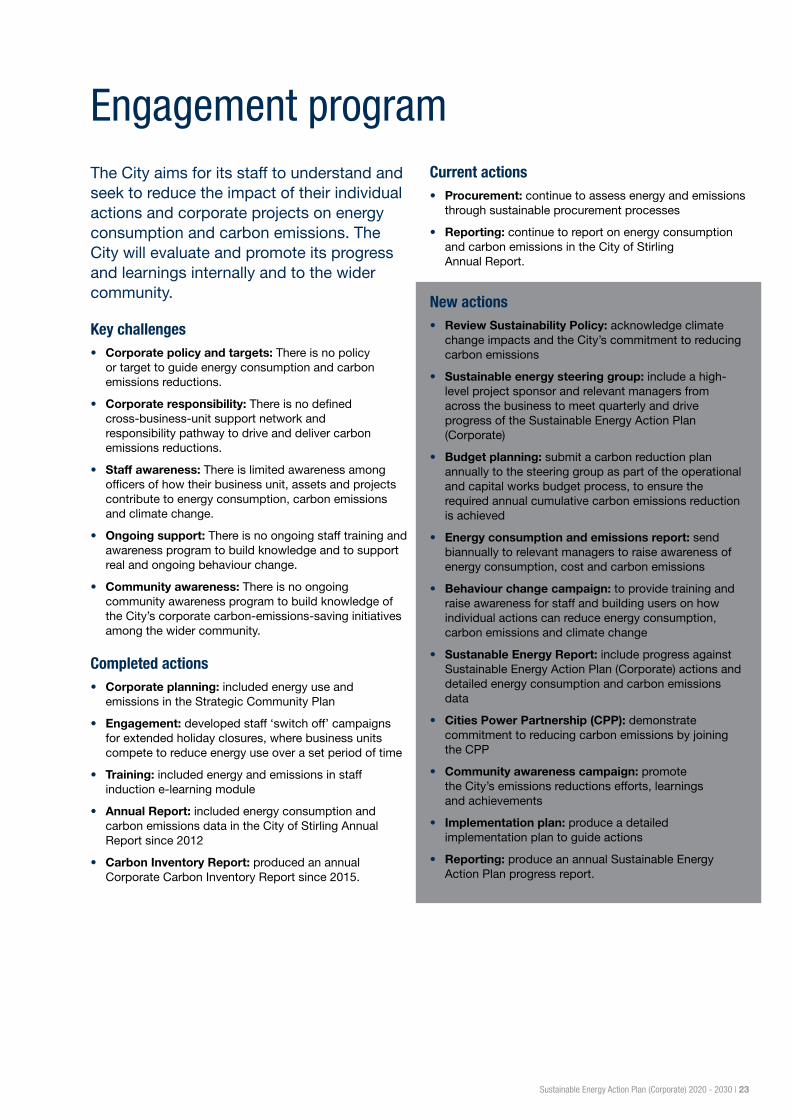
Engagement programThe City aims for its staff to understand and seek to reduce the impact of their individual actions and corporate projects on energy consumption and carbon emissions. The City will evaluate and promote its progress and learnings internally and to the wider community.
Key challenges • Corporate policy and targets: There is no policy
or target to guide energy consumption and carbon emissions reductions.
• Corporate responsibility: There is no defined cross-business-unit support network and responsibility pathway to drive and deliver carbon emissions reductions.
• Staff awareness: There is limited awareness among officers of how their business unit, assets and projects contribute to energy consumption, carbon emissions and climate change.
• Ongoing support: There is no ongoing staff training and awareness program to build knowledge and to support real and ongoing behaviour change.
• Community awareness: There is no ongoing community awareness program to build knowledge of the City’s corporate carbon-emissions-saving initiatives among the wider community.
Completed actions • Corporate planning: included energy use and
emissions in the Strategic Community Plan
• Engagement: developed staff ‘switch off’ campaigns for extended holiday closures, where business units compete to reduce energy use over a set period of time
• Training: included energy and emissions in staff induction e-learning module
• Annual Report: included energy consumption and carbon emissions data in the City of Stirling Annual Report since 2012
• Carbon Inventory Report: produced an annual Corporate Carbon Inventory Report since 2015.
Current actions • Procurement: continue to assess energy and emissions
through sustainable procurement processes
• Reporting: continue to report on energy consumption and carbon emissions in the City of Stirling Annual Report.
New actions • Review Sustainability Policy: acknowledge climate
change impacts and the City’s commitment to reducing carbon emissions
• Sustainable energy steering group: include a high-level project sponsor and relevant managers from across the business to meet quarterly and drive progress of the Sustainable Energy Action Plan (Corporate)
• Budget planning: submit a carbon reduction plan annually to the steering group as part of the operational and capital works budget process, to ensure the required annual cumulative carbon emissions reduction is achieved
• Energy consumption and emissions report: send biannually to relevant managers to raise awareness of energy consumption, cost and carbon emissions
• Behaviour change campaign: to provide training and raise awareness for staff and building users on how individual actions can reduce energy consumption, carbon emissions and climate change
• Sustanable Energy Report: include progress against Sustainable Energy Action Plan (Corporate) actions and detailed energy consumption and carbon emissions data
• Cities Power Partnership (CPP): demonstrate commitment to reducing carbon emissions by joining the CPP
• Community awareness campaign: promote the City’s emissions reductions efforts, learnings and achievements
• Implementation plan: produce a detailed implementation plan to guide actions
• Reporting: produce an annual Sustainable Energy Action Plan progress report.
24
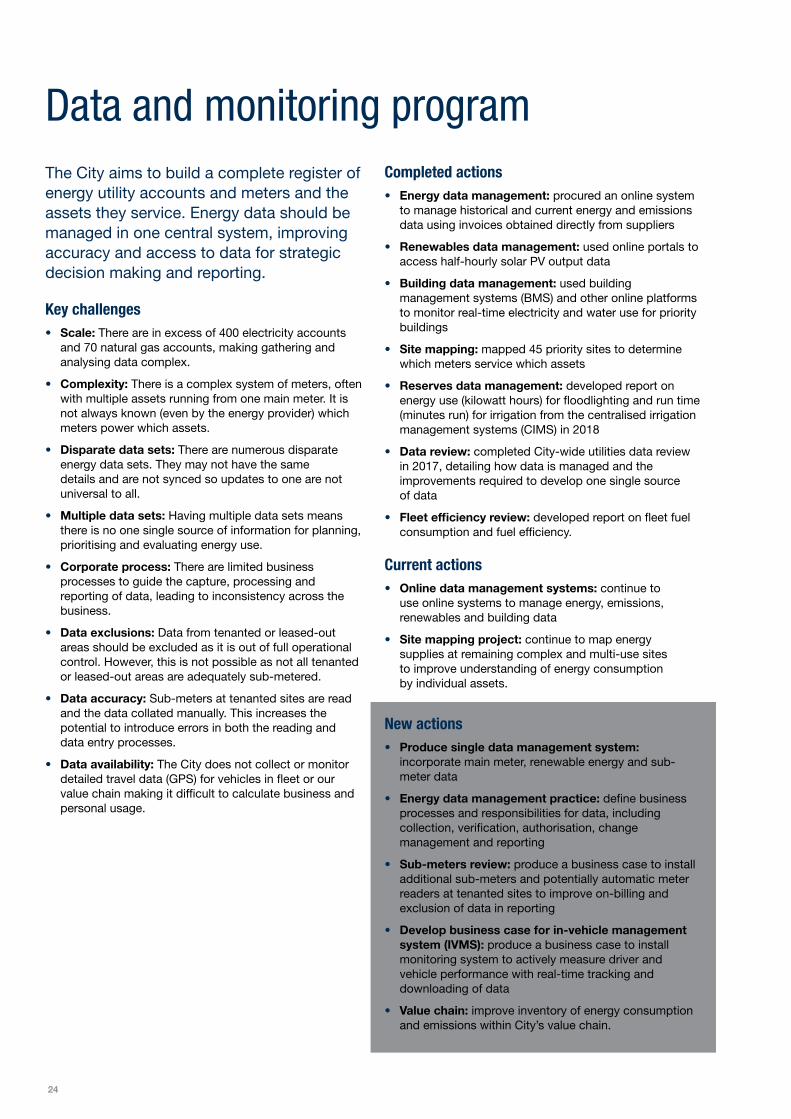
Data and monitoring programThe City aims to build a complete register of energy utility accounts and meters and the assets they service. Energy data should be managed in one central system, improving accuracy and access to data for strategic decision making and reporting.
Key challenges • Scale: There are in excess of 400 electricity accounts
and 70 natural gas accounts, making gathering and analysing data complex.
• Complexity: There is a complex system of meters, often with multiple assets running from one main meter. It is not always known (even by the energy provider) which meters power which assets.
• Disparate data sets: There are numerous disparate energy data sets. They may not have the same details and are not synced so updates to one are not universal to all.
• Multiple data sets: Having multiple data sets means there is no one single source of information for planning, prioritising and evaluating energy use.
• Corporate process: There are limited business processes to guide the capture, processing and reporting of data, leading to inconsistency across the business.
• Data exclusions: Data from tenanted or leased-out areas should be excluded as it is out of full operational control. However, this is not possible as not all tenanted or leased-out areas are adequately sub-metered.
• Data accuracy: Sub-meters at tenanted sites are read and the data collated manually. This increases the potential to introduce errors in both the reading and data entry processes.
• Data availability: The City does not collect or monitor detailed travel data (GPS) for vehicles in fleet or our value chain making it difficult to calculate business and personal usage.
Completed actions • Energy data management: procured an online system
to manage historical and current energy and emissions data using invoices obtained directly from suppliers
• Renewables data management: used online portals to access half-hourly solar PV output data
• Building data management: used building management systems (BMS) and other online platforms to monitor real-time electricity and water use for priority buildings
• Site mapping: mapped 45 priority sites to determine which meters service which assets
• Reserves data management: developed report on energy use (kilowatt hours) for floodlighting and run time (minutes run) for irrigation from the centralised irrigation management systems (CIMS) in 2018
• Data review: completed City-wide utilities data review in 2017, detailing how data is managed and the improvements required to develop one single source of data
• Fleet efficiency review: developed report on fleet fuel consumption and fuel efficiency.
Current actions • Online data management systems: continue to
use online systems to manage energy, emissions, renewables and building data
• Site mapping project: continue to map energy supplies at remaining complex and multi-use sites to improve understanding of energy consumption by individual assets.
New actions • Produce single data management system:
incorporate main meter, renewable energy and sub-meter data
• Energy data management practice: define business processes and responsibilities for data, including collection, verification, authorisation, change management and reporting
• Sub-meters review: produce a business case to install additional sub-meters and potentially automatic meter readers at tenanted sites to improve on-billing and exclusion of data in reporting
• Develop business case for in-vehicle management system (IVMS): produce a business case to install monitoring system to actively measure driver and vehicle performance with real-time tracking and downloading of data
• Value chain: improve inventory of energy consumption and emissions within City’s value chain.
Sustainable Energy Action Plan (Corporate) 2020 - 2030 | 25
Solar PV inverters and meters. The City monitors and reports on production of solar energy.
26
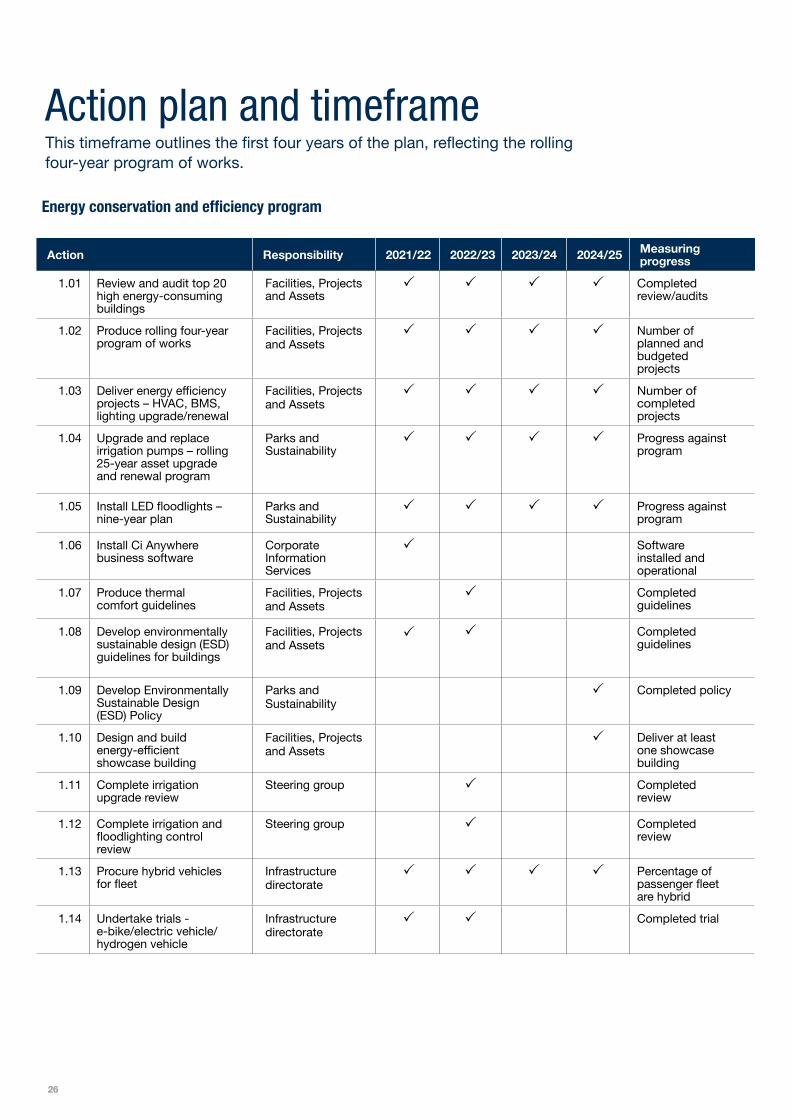
Energy conservation and efficiency program
Action Responsibility 2021/22 2022/23 2023/24 2024/25 Measuring progress
1.01 Review and audit top 20 high energy-consuming buildings
Facilities, Projects and Assets
Completed review/audits
1.02 Produce rolling four-year program of works
Facilities, Projects and Assets
Number of planned and budgeted projects
1.03 Deliver energy efficiency projects – HVAC, BMS, lighting upgrade/renewal
Facilities, Projects and Assets
Number of completed projects
1.04 Upgrade and replace irrigation pumps – rolling 25-year asset upgrade and renewal program
Parks and Sustainability
Progress against program
1.05 Install LED floodlights – nine-year plan
Parks and Sustainability
Progress against program
1.06 Install Ci Anywhere business software
Corporate Information Services
Software installed and operational
1.07 Produce thermal comfort guidelines
Facilities, Projects and Assets
Completed guidelines
1.08 Develop environmentally sustainable design (ESD) guidelines for buildings
Facilities, Projects and Assets
Completed guidelines
1.09 Develop Environmentally Sustainable Design (ESD) Policy
Parks and Sustainability
Completed policy
1.10 Design and build energy-efficient showcase building
Facilities, Projects and Assets
Deliver at least one showcase building
1.11 Complete irrigation upgrade review
Steering group Completed review
1.12 Complete irrigation and floodlighting control review
Steering group Completed review
1.13 Procure hybrid vehicles for fleet
Infrastructure directorate
Percentage of passenger fleet are hybrid
1.14 Undertake trials - e-bike/electric vehicle/hydrogen vehicle
Infrastructure directorate
Completed trial
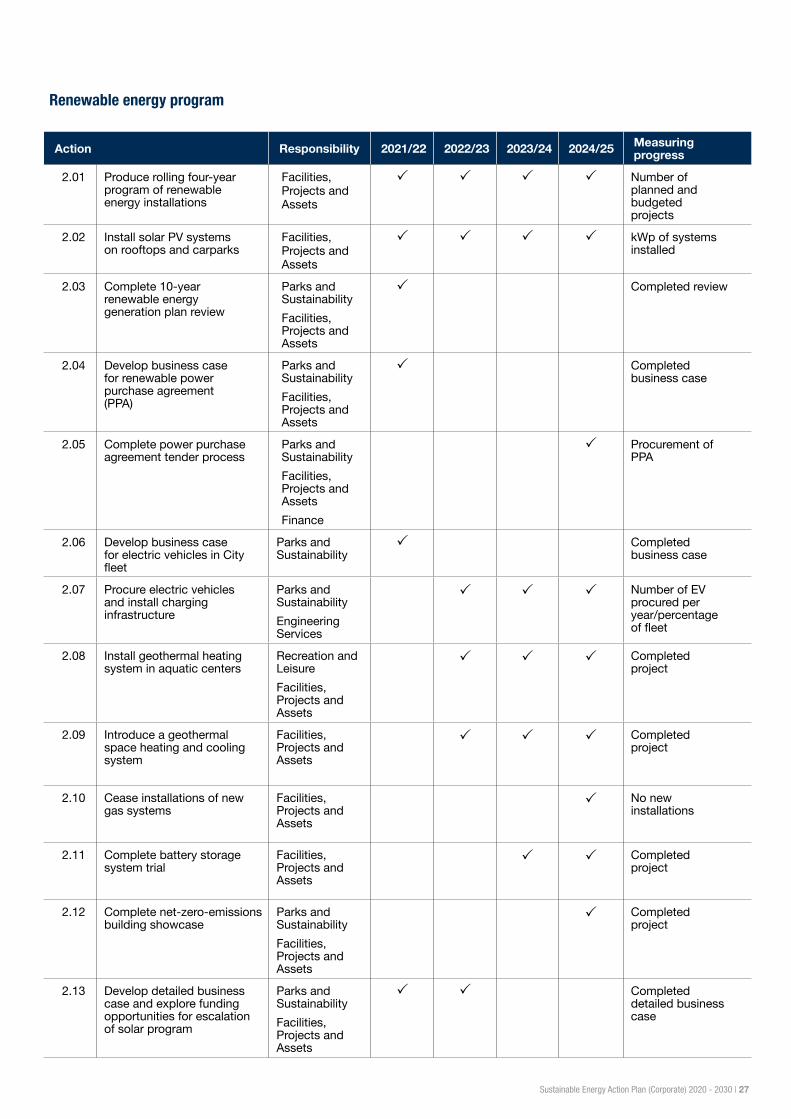
Action plan and timeframeThis timeframe outlines the first four years of the plan, reflecting the rolling four-year program of works.
Sustainable Energy Action Plan (Corporate) 2020 - 2030 | 27
Renewable energy program
Action Responsibility 2021/22 2022/23 2023/24 2024/25 Measuring progress
2.01 Produce rolling four-year program of renewable energy installations
Facilities, Projects and Assets
Number of planned and budgeted projects
2.02 Install solar PV systems on rooftops and carparks
Facilities, Projects and Assets
kWp of systems installed
2.03 Complete 10-year renewable energy generation plan review
Parks and SustainabilityFacilities, Projects and Assets
Completed review
2.04 Develop business case for renewable power purchase agreement (PPA)
Parks and SustainabilityFacilities, Projects and Assets
Completed business case
2.05 Complete power purchase agreement tender process
Parks and SustainabilityFacilities, Projects and AssetsFinance
Procurement of PPA
2.06 Develop business case for electric vehicles in City fleet
Parks and Sustainability
Completed business case
2.07 Procure electric vehicles and install charging infrastructure
Parks and SustainabilityEngineering Services
Number of EV procured per year/percentage of fleet
2.08 Install geothermal heating system in aquatic centers
Recreation and LeisureFacilities, Projects and Assets
Completed project
2.09 Introduce a geothermal space heating and cooling system
Facilities, Projects and Assets
Completed project
2.10 Cease installations of new gas systems
Facilities, Projects and Assets
No new installations
2.11 Complete battery storage system trial
Facilities, Projects and Assets
Completed project
2.12 Complete net-zero-emissions building showcase
Parks and SustainabilityFacilities, Projects and Assets
Completed project
2.13 Develop detailed business case and explore funding opportunities for escalation of solar program
Parks and SustainabilityFacilities, Projects and Assets
Completed detailed business case
28
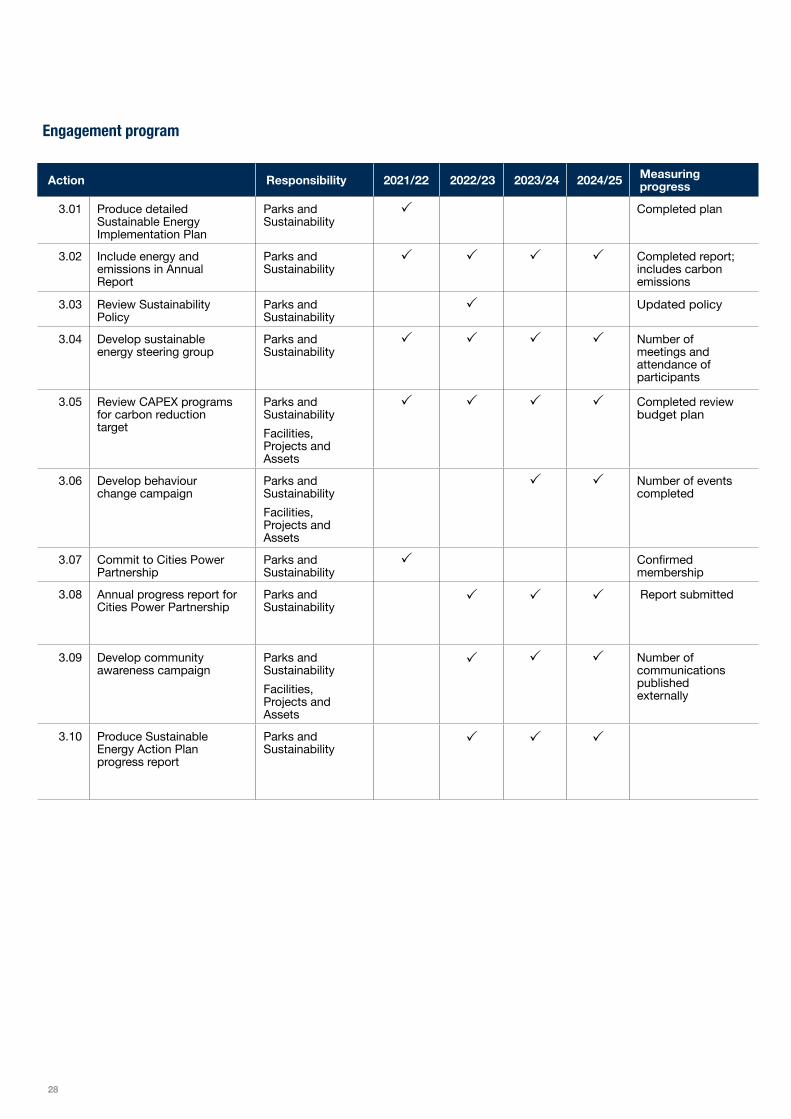
Engagement program
Action Responsibility 2021/22 2022/23 2023/24 2024/25 Measuring progress
3.01 Produce detailed Sustainable Energy Implementation Plan
Parks and Sustainability
Completed plan
3.02 Include energy and emissions in Annual Report
Parks and Sustainability
Completed report; includes carbon emissions
3.03 Review Sustainability Policy
Parks and Sustainability
Updated policy
3.04 Develop sustainable energy steering group
Parks and Sustainability
Number of meetings and attendance of participants
3.05 Review CAPEX programs for carbon reduction target
Parks and SustainabilityFacilities, Projects and Assets
Completed review budget plan
3.06 Develop behaviour change campaign
Parks and SustainabilityFacilities, Projects and Assets
Number of events completed
3.07 Commit to Cities Power Partnership
Parks and Sustainability
Confirmed membership
3.08 Annual progress report for Cities Power Partnership
Parks and Sustainability
Report submitted
3.09 Develop community awareness campaign
Parks and SustainabilityFacilities, Projects and Assets
Number of communications published externally
3.10 Produce Sustainable Energy Action Plan progress report
Parks and Sustainability
Sustainable Energy Action Plan (Corporate) 2020 - 2030 | 29
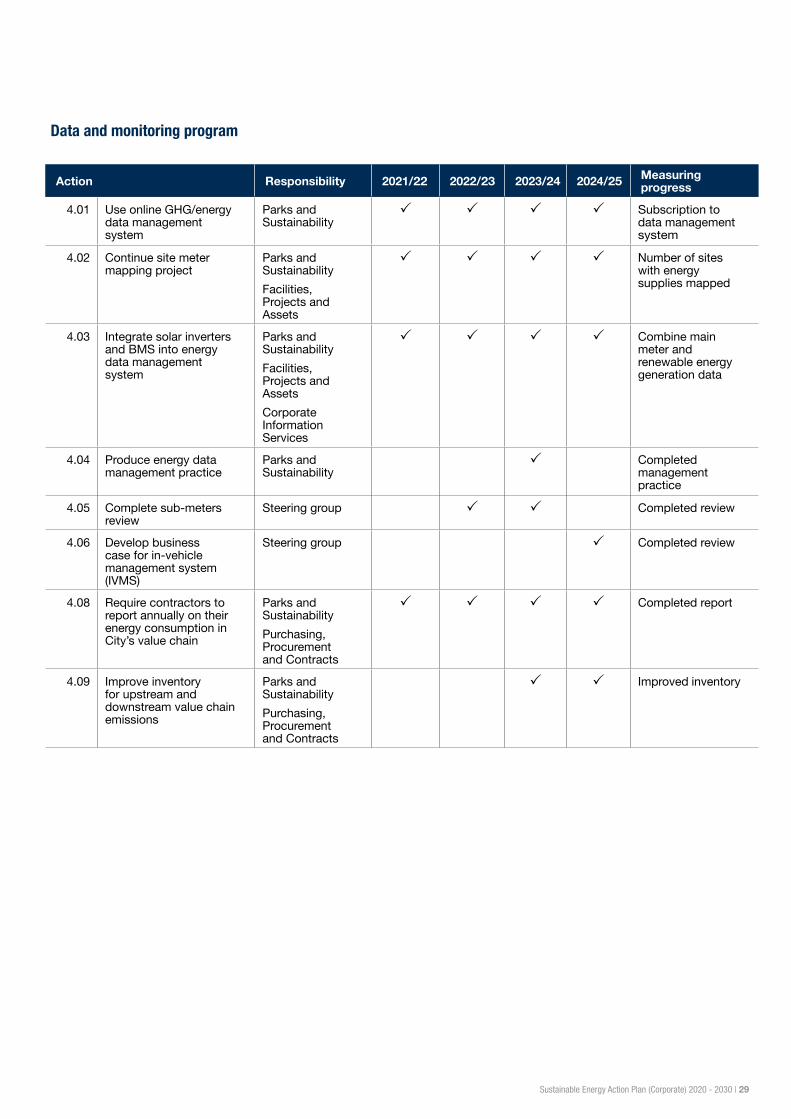
Data and monitoring program
Action Responsibility 2021/22 2022/23 2023/24 2024/25 Measuring progress
4.01 Use online GHG/energy data management system
Parks and Sustainability
Subscription to data management system
4.02 Continue site meter mapping project
Parks and Sustainability Facilities, Projects and Assets
Number of sites with energy supplies mapped
4.03 Integrate solar inverters and BMS into energy data management system
Parks and SustainabilityFacilities, Projects and AssetsCorporate Information Services
Combine main meter and renewable energy generation data
4.04 Produce energy data management practice
Parks and Sustainability
Completed management practice
4.05 Complete sub-meters review
Steering group Completed review
4.06 Develop business case for in-vehicle management system (IVMS)
Steering group Completed review
4.08 Require contractors to report annually on their energy consumption in City’s value chain
Parks and SustainabilityPurchasing, Procurement and Contracts
Completed report
4.09 Improve inventory for upstream and downstream value chain emissions
Parks and SustainabilityPurchasing, Procurement and Contracts
Improved inventory

30
Measuring our progressThe City will monitor and report annually on progress for actions in the Sustainable Energy Action Plan (Corporate).
The City will measure outcomes against targets with the following metrics:
• Energy demand - electricity, gas, fuel, renewable energy consumed at the sites (megajoules/gigawatt hours)
• Carbon emissions - total and reductions (t CO2-e)
• Renewable electricity generation (gigawatt hours)
• Renewable electricity procurement - contract volume (gigawatt hours)
• Renewable electricity as a proportion of total electricity demand (percentage)
• Fleet hybrids and electrical vehicles proportion (number of vehicles in fleet as percentage for vehicle type).
The interim KPIs will be measured in 2025 to assess whether we are on track to achieving the 2030 targets.
Success will be measured by the actions completed, a reduction in carbon emissions and achieving renewable electricity targets.
The Sustainable Energy Action Plan (Corporate) will be revised as required when there are relevant changes at the City or in the energy sector.

Sustainable Energy Action Plan (Corporate) 2020 - 2030 | 31
Irrigation consumes energy, but is essential to keep vegetation healthy and surfaces suitable for recreational users.
32
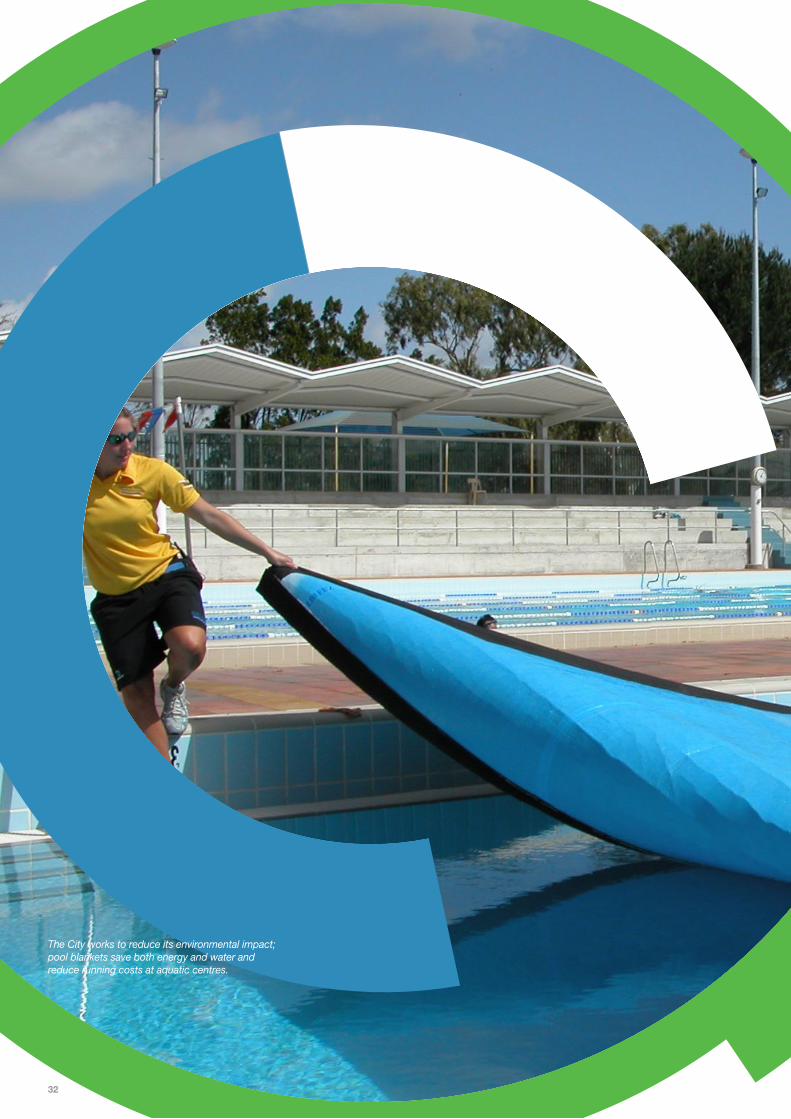
The City works to reduce its environmental impact; pool blankets save both energy and water and reduce running costs at aquatic centres.
Sustainable Energy Action Plan (Corporate) 2020 - 2030 | 33
Appendices
34
Appendix 1
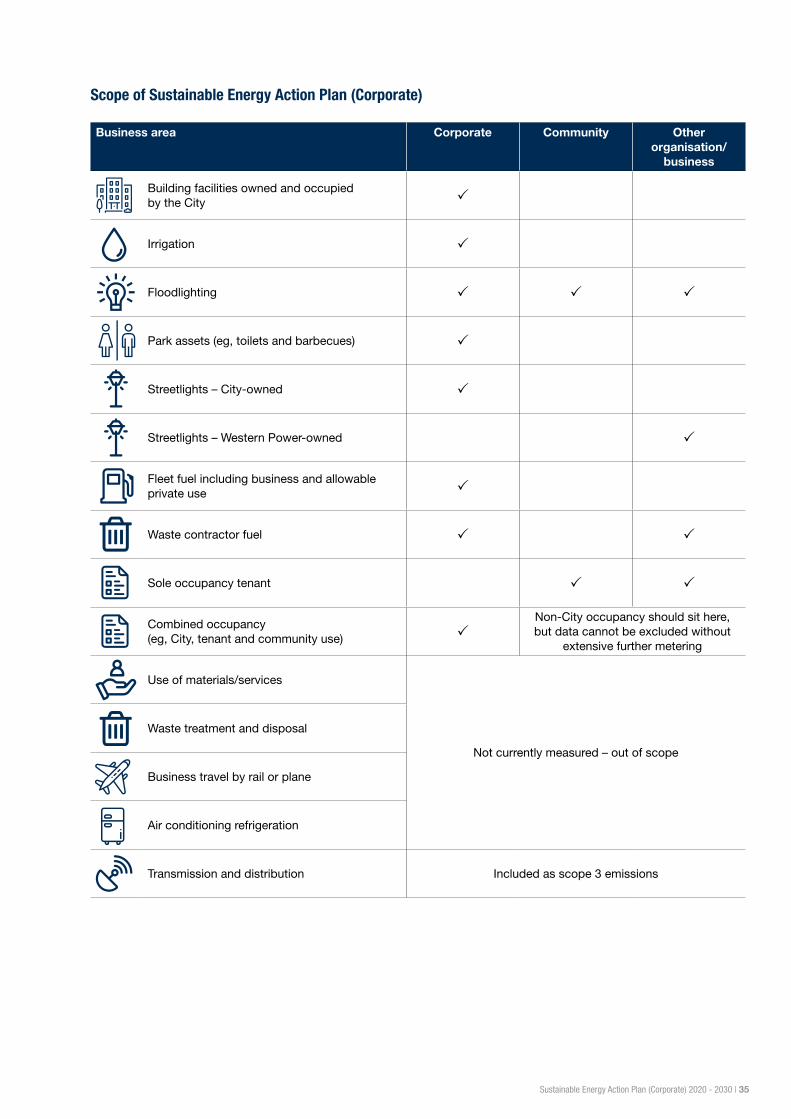
Value chain energy demand and emissions The Greenhouse Gas Protocol categorises emissions into three scopes; scope one (direct), scope two (indirect from purchasing energy) and scope three (within value chain).
Indirect value chain energy demand and emissions occur when the City provides and/or pays for services, that requires energy, which are delivered by external organisations. While the City does not have direct control of this energy demand or the emissions, it can often influence these emissions through sustainable procurement requirements and via contract management.
The Greenhouse Gas Protocol divides scope three emissions into upstream and downstream, based on financial transactions within the City.
Upstream energy and emissionsUpstream refers to the indirect energy and emissions related to purchased or acquired goods or services. The City has started an upstream inventory for procured services and their associated value chain energy and emissions, which is still to be completed.
In relation to services, we are in the early stages of requiring larger contractors to report on their energy consumption and emissions. For example, the City tracks fuel consumption of waste trucks contracted to collect and transport waste. This contract consumed 14,409 gigajoules of energy in 2019/20. This would be equivalent to eight per cent of the City’s total energy demand if the value chain were included.
The City also considers Western Power streetlights as value chain energy. Western Power owns 98 per cent of streetlights Citywide and the City has a contract to pay
for the energy used and maintenance costs. Western Power’s streetlights are not considered to be operational assets for the City as Western Power manages the run-time, installations, maintenance and replacement of their streetlights. The City has no control of these streetlights and thus has limited ability to influence their energy demand of 42,834 gigajoules for 2019/20, equivalent to 23 per cent of the City’s total energy demand if value chain were included.
Associated emissions in the value chain are as follows: streetlights produced 8,686 t CO2-e for 2019/20, equivalent to 39 per cent of the City’s total emissions; and waste trucks contracts produced 1,071 t CO2-e in 2019/20, equivalent to five per cent of the City’s total emissions. The City is not yet reporting on additional upstream embodied emissions from purchased goods, refrigerants, waste generation, business travel or employee commuting.
Downstream energy and emissionsDownstream refers to the indirect energy and emissions related to sold goods or services, for example, the energy and emissions from tenanted properties. The City is in the process of separating emissions for tenanted properties but this is often challenging due to metering arrangements.
The City will continue to identify other energy demands and emissions in the value chain which will improve the completeness of the inventory, and will report them when available. The City will not be setting reductions targets for value chain emissions until a more complete inventory is established.
Sustainable Energy Action Plan (Corporate) 2020 - 2030 | 35
Business area Corporate Community Other organisation/
business
Building facilities owned and occupied by the City
Irrigation
Floodlighting
Park assets (eg, toilets and barbecues)
Streetlights – City-owned
Streetlights – Western Power-owned
Fleet fuel including business and allowable private use
Waste contractor fuel
Sole occupancy tenant
Combined occupancy (eg, City, tenant and community use)
Non-City occupancy should sit here, but data cannot be excluded without
extensive further metering
Use of materials/services
Not currently measured – out of scope
Waste treatment and disposal
Business travel by rail or plane
Air conditioning refrigeration
Transmission and distribution Included as scope 3 emissions
Scope of Sustainable Energy Action Plan (Corporate)
36
Appendix 2 - Carbon offsetsGreen power, carbon offsets and carbon sinksGreen power is renewable energy purchased from an energy retailer at a surcharge. The City previously purchased green power for its administration building for four years from 2007. It was decided to divert the additional spend to energy efficiency and renewable energy projects.
Carbon offsets are certificates created by projects that reduce or avoid emissions that would otherwise have occurred, or actively sequester carbon from the atmosphere into permanent ‘sinks’ such as forests and soils. One carbon credit is equal to one tonne of carbon dioxide equivalent avoided, reduced or sequestered. The City purchased carbon offsets for fleet carbon emissions for five years from 2005. Offsets cannot be used to achieve science-based targets, and therefore do not contribute to the City’s carbon emissions reduction target.
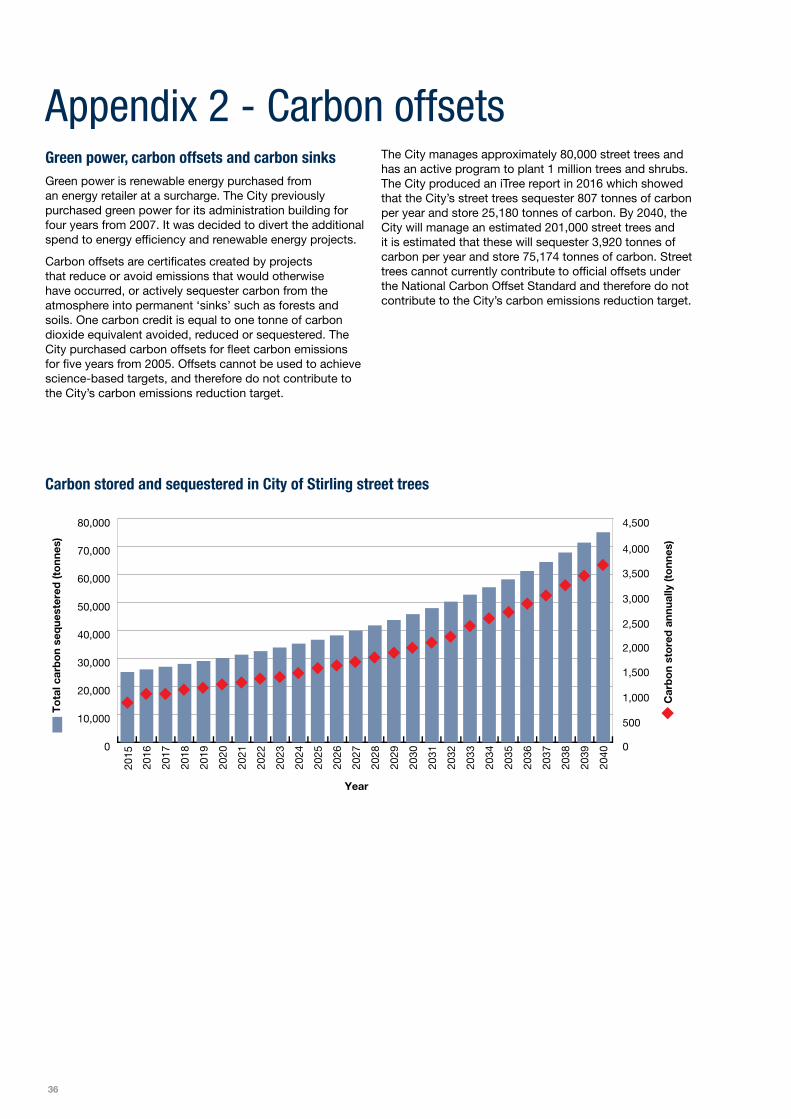
The City manages approximately 80,000 street trees and has an active program to plant 1 million trees and shrubs. The City produced an iTree report in 2016 which showed that the City’s street trees sequester 807 tonnes of carbon per year and store 25,180 tonnes of carbon. By 2040, the City will manage an estimated 201,000 street trees and it is estimated that these will sequester 3,920 tonnes of carbon per year and store 75,174 tonnes of carbon. Street trees cannot currently contribute to official offsets under the National Carbon Offset Standard and therefore do not contribute to the City’s carbon emissions reduction target.
Car
bo
n st
ore
d a
nnua
lly (t
onn
es)
Year
0
10,000
20,000
30,000
40,000
50,000
60,000
70,000
80,000
0
1,000
500
1,500
2,000
2,500
3,000
3,500
4,000
4,500
2040
2039
2038
2037
2036
2035
2034
2033
2032
2031
2030
2029
2028
2027
2026
2025
2024
2023
2022
2021
2020
2019
2018
2017
2016
2015
To
tal c
arb
on
seq
uest
ered
(to
nnes
)
Carbon stored and sequestered in City of Stirling street trees

Sustainable Energy Action Plan (Corporate) 2020 - 2030 | 37
38
GlossaryGigajoules: a gigajoule (GJ) is a standard measure of energy use equal to one thousand million joules. Electricity is measured in kilowatt hours (kWh), natural gas in megajoules (MJ) and fuel in litres (L). These are all converted to GJ to standardise the measurement for energy use among the different energy sources.
Carbon emissions: there are several greenhouses gases that contribute to climate change, including methane, nitrous oxide and carbon dioxide. These endure in the atmosphere for different periods of time. The most common greenhouse gas is carbon dioxide and scientists often standardise these gases into ‘carbon dioxide equivalents’, commonly abbreviated to ‘carbon emissions’.
CO2-e: denotes carbon dioxide equivalent emissions.
Scope one: Scope one emissions are direct from operations that are owned or controlled by the City.
Scope two: Indirect (scope two) GHG emissions include, but are not limited to, the CO2 emissions from the generation of purchased or acquired electricity, heating, cooling, and steam consumed by the City.
Scope three: Other indirect (scope three) GHG emissions are a consequence of the reporting organization’s activities, but occur from sources not owned or controlled by the City. Other indirect (scope three) GHG emissions include both upstream and downstream emissions.
Upstream and downstream scope three emissions
This standard divides scope three emissions into upstream and downstream emissions. The distinction is based on the financial transactions of the City
Upstream emissions are indirect GHG emissions related to purchased or acquired goods and services:
• Purchased goods and services: upstream emissions from production and transportation of capital goods and services purchased or acquired by the City
• Fuel and energy related activities: contractors’ energy usage for City’s projects
• Upstream transportation and distribution: energy consumption of contractor to provide service/goods to the City
• Waste generated in operations: emission of waste treatment contractors (in facilities not owned or controlled by the City)
• Business travel: emissions from the transportation of employees for business-related activities
• Employee commuting: emissions from the transportation of employees between their homes and their worksites
• Upstream leased assets: emissions from the operation of assets leased by the City.
Downstream emissions are indirect GHG emissions related to sold goods and services:
• Downstream transportation and distribution: emissions from transportation and distribution of products sold by the reporting company in the reporting year between the city’s operations and the end consumer
• Use of sold products: emissions from the end use of goods and services sold by the reporting company
• End-of-life treatment of sold products: emissions from the waste disposal and treatment of products sold by the City
• Downstream leased assets: emissions from the operation of assets owned by the reporting company (lessor) and leased to other entities
• Sustainable energy: Energy sourced from renewable supplies that is used efficiently, producing the least possible greenhouse gas emissions.
References1. Bureau of Meteorology (BOM), 2018. State of the Climate
2018. Commonwealth of Australia 2018.
2. Department of the Environment and Energy (DEE), 2018. Australia’s emissions projections 2018. Commonwealth of Australia.
3. Western Australia Local Government Association (WALGA), 2018. Climate Change Policy Statement.
4. Seed Consulting Services, 2017. iTree Eco Assessment of the City of Stirling’s Tree Database. A report prepared for the City of Stirling, Western Australia.
5. Greenhouse Gas Protocol, 2011, Corporate Value Chain (Scope 3) Accounting and Reporting Standard.

Sustainable Energy Action Plan (Corporate) 2020 - 2030 | 39
The City’s Main Administration Centre with a 100 kWp solar PV system on its roof which produces around 10 per cent of the building’s total electricity consumption.
Administration Centre 25 Cedric Street Stirling WA 6021 Telephone (08) 9205 8555
Enquiries www.stirling.wa.gov.au/enquiries Web www.stirling.wa.gov.au | /citystirlingwa
This information is available in alternative formats on request. Please contact the Customer Contact Centre
on (08) 9205 8555.


