87
The European Commission’s science and knowledge service Joint Research Centre JRC training for IUC China Sustainable Energy and Climate Action Plan (SECAP) Principles and Guidelines
The European Commission’s science and knowledge service
Joint Research Centre
JRC training for IUC China
Sustainable Energy and
Climate Action Plan (SECAP)
Principles and Guidelines
2
The 10 key principles
of a Sustainable Energy
and Climate Action
Plan
21 September Brussels 2017
The European Commission’s science and knowledge service
Joint Research Centre
3
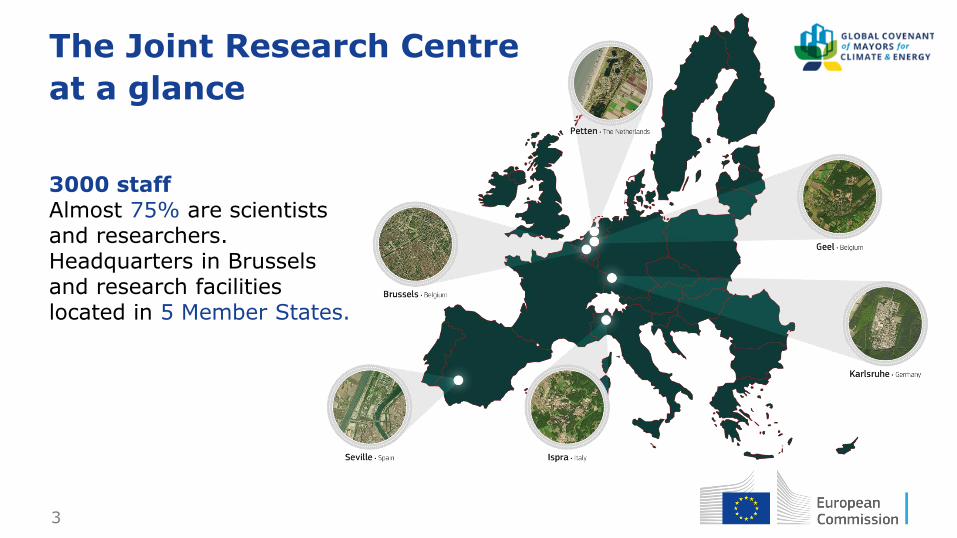
The Joint Research Centre
at a glance
3000 staff Almost 75% are scientists and researchers. Headquarters in Brussels and research facilities located in 5 Member States.
4
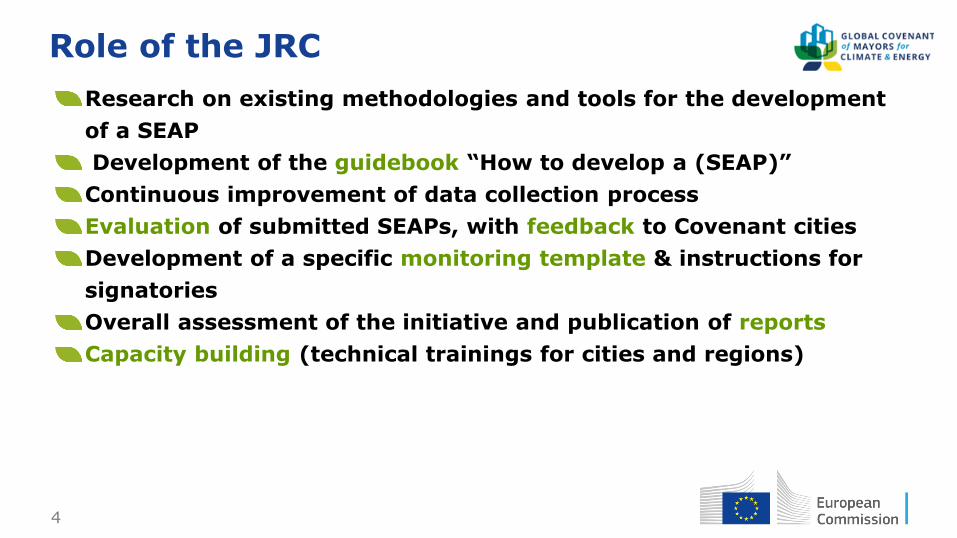
Role of the JRC
Research on existing methodologies and tools for the development
of a SEAP
Development of the guidebook “How to develop a (SEAP)”
Continuous improvement of data collection process
Evaluation of submitted SEAPs, with feedback to Covenant cities
Development of a specific monitoring template & instructions for
signatories
Overall assessment of the initiative and publication of reports
Capacity building (technical trainings for cities and regions)

5
Covenant of Mayors is a platform for inter-institutional co-
operation, built on the principles of subsidiarity
Common objectives and support is fixed at EU level, but
ACTION takes place on the local level
Energy policy in support of local and regional actors
“... By connecting with our European partners and reinforcing our
commitment to such valuable initiatives as the Covenant of
Mayors, we can work together in strengthening Europe’s green
economy…” Emer Costello, Lord Mayor of Dublin (IR)
“...It is important for me to be encouraged by others and maybe encourage people by our experience…” Bo Frank, Mayor, Växjö (SE)

6
The 10 key principles
The principles are linked to the commitments taken by Covenant
signatories and constitute key ingredients of success. They are
described in the Guidebook "How to develop a SEAP", Part I, which is
currently being updated.
7
I. Approval by the municipal council (or equivalent decision-making body)
Strong political support is essential to ensure the success of the process, from SE(C)AP design to implementation and monitoring
The 10 key principles
I
8
II. Commitment for a reduction of CO2 emissions by at least 20% by 2020 and/or 40% by 2030
The SE(C)AP must specify the CO2 reduction objective of the local authority.
Ideally also:
• A longer-term target (e.g. to 2050)
• Targets on energy savings or on local energy
production from renewables should be specified
• Sector-specific targets
II
9
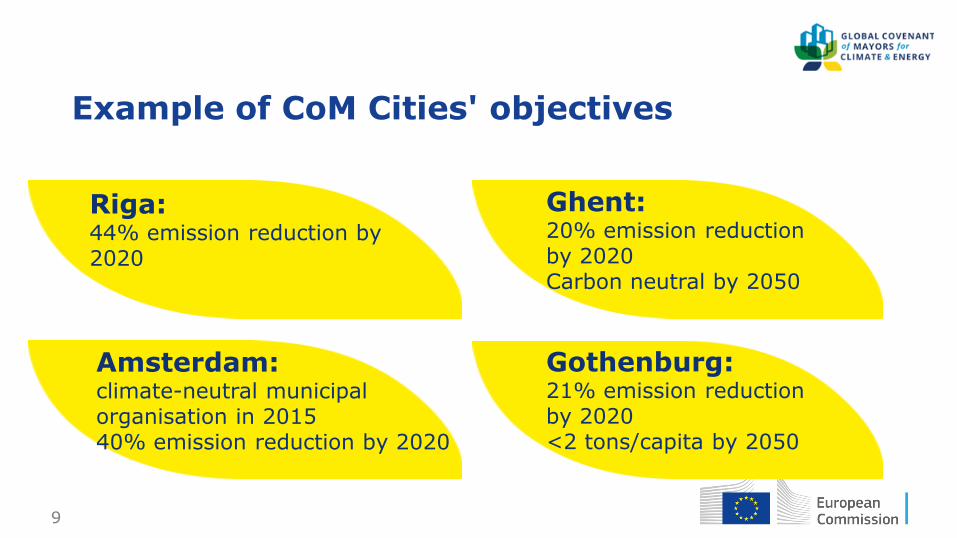
Example of CoM Cities' objectives
II
Riga: 44% emission reduction by 2020
Ghent: 20% emission reduction by 2020 Carbon neutral by 2050
Gothenburg: 21% emission reduction by 2020 <2 tons/capita by 2050
Amsterdam: climate-neutral municipal organisation in 2015 40% emission reduction by 2020
10
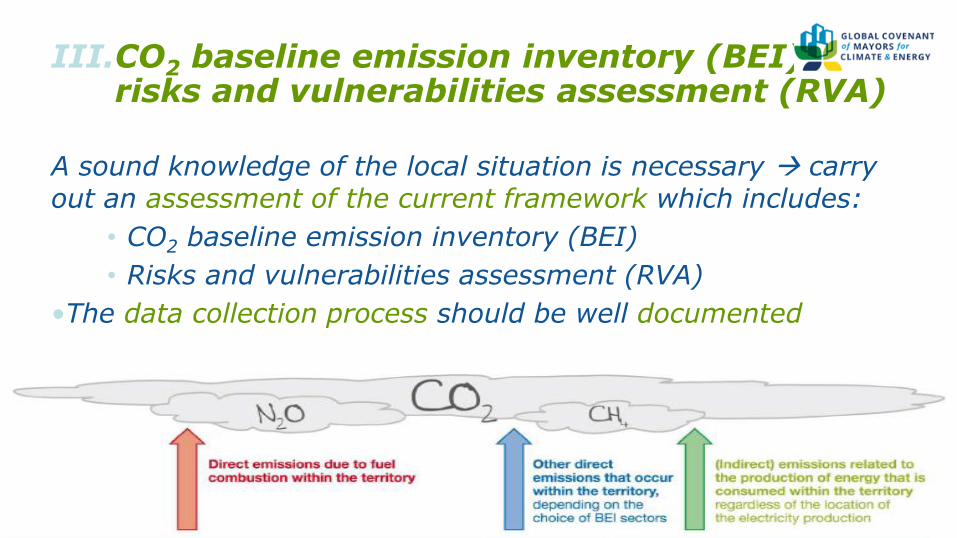
III.CO2 baseline emission inventory (BEI) and risks and vulnerabilities assessment (RVA)
A sound knowledge of the local situation is necessary carry out an assessment of the current framework which includes:
• CO2 baseline emission inventory (BEI)
• Risks and vulnerabilities assessment (RVA)
•The data collection process should be well documented
III
11
IV. Comprehensive measures that cover the key sectors of activity
The SEAP has to contain a coherent set of measures covering the key sectors of activity
Before starting the elaboration of actions and measures, the establishment of a long-term vision with clear objectives is highly recommended.
IV
12
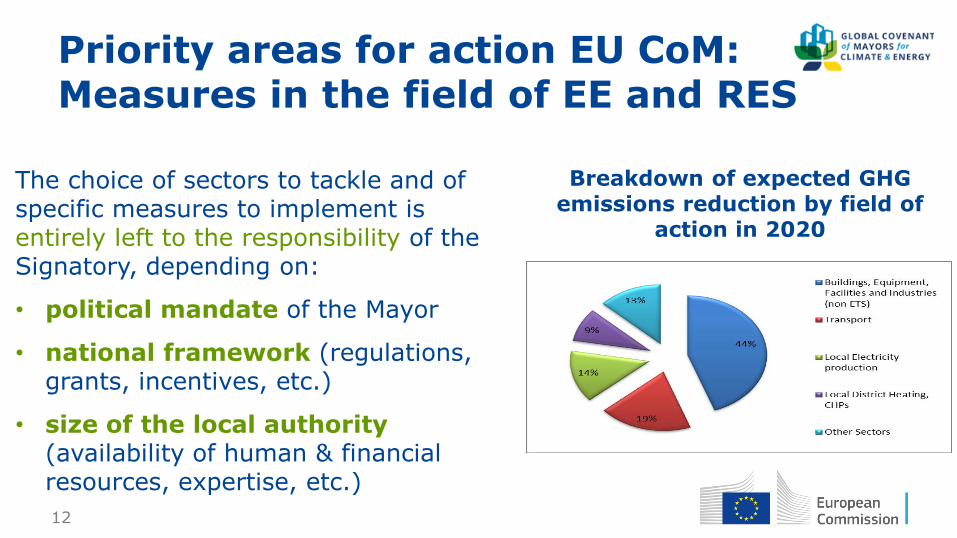
The choice of sectors to tackle and of specific measures to implement is entirely left to the responsibility of the Signatory, depending on:
• political mandate of the Mayor
• national framework (regulations, grants, incentives, etc.)
• size of the local authority (availability of human & financial resources, expertise, etc.)
Breakdown of expected GHG emissions reduction by field of
action in 2020
IV Priority areas for action EU CoM: Measures in the field of EE and RES
13
But also…
Strategic urban planning:
• The SE(C)AP can be an instrument to prevent rapid and
uncontrolled city growth, by promoting mixed land use and
encouraging sustainable mobility.
Ex. Stockholm: efficient social planning, anticipating the
increased demand for housing and transportation
Working with citizens and stakeholders:
• The SE(C)AP development and implementation requires
coordination with citizens and other actors, consensus-building
approaches, reduced duplication of efforts.
IV
14
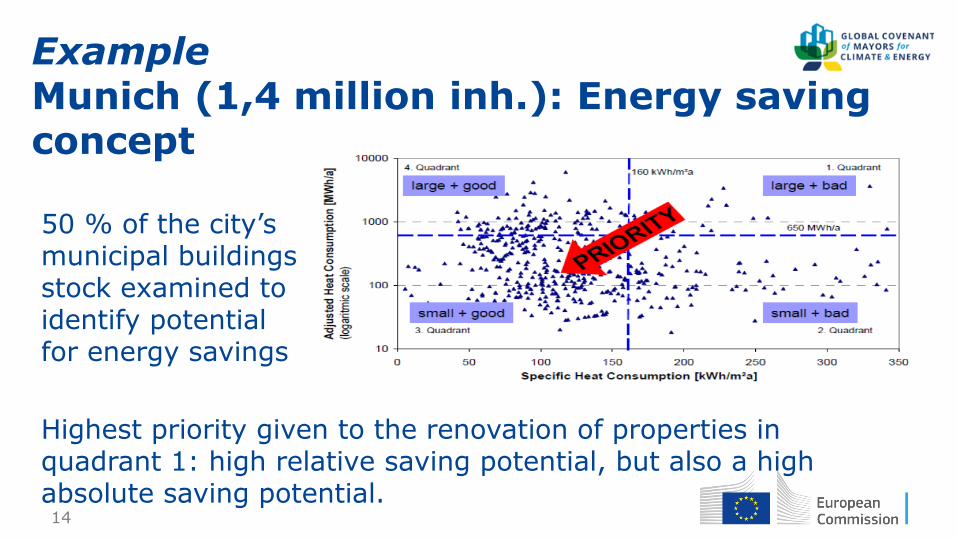
Example Munich (1,4 million inh.): Energy saving concept
Highest priority given to the renovation of properties in quadrant 1: high relative saving potential, but also a high absolute saving potential.
50 % of the city’s municipal buildings stock examined to identify potential for energy savings
IV
15
V. Strategies and actions until 2020 or
2030 (and possibly beyond)
The plan must contain a clear outline of the strategic actions that the local authority intends to take in order to reach its commitments in 2020 or 2030. It has to contain:
• Long-term strategy and goals
• Detailed measures for the next 3-5 years which translate the long-term strategy and goals into actions, with assigned responsibilities, cost estimations, impact estimations
V
16
Example Stockholm (830000 inh.):
• 90 % of buses will be powered by renewable
fuels before the end of 2020
• 100% of newly registered private cars should be
independent of fossil fuels by 2020
• The bus fleet will be fossil fuel-free by 2025
V
17
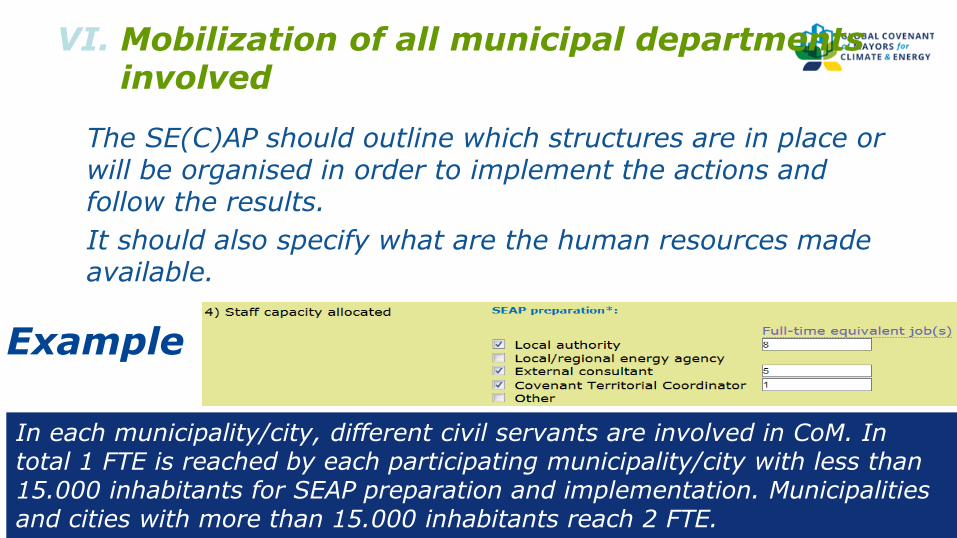
VI. Mobilization of all municipal departments involved
• The SE(C)AP should outline which structures are in place or will be organised in order to implement the actions and follow the results.
• It should also specify what are the human resources made available.
VI
In each municipality/city, different civil servants are involved in CoM. In total 1 FTE is reached by each participating municipality/city with less than 15.000 inhabitants for SEAP preparation and implementation. Municipalities and cities with more than 15.000 inhabitants reach 2 FTE.
Example
18
The city management office is responsible for the administration of the SEAP and the Environment and health administration is responsible for developing and following up the SEAP. Consultants aid in conducting background research and communication with some stakeholders. A steering committee for development of the SEAP consists of representatives from the city management office, city development administration, traffic and waste administration, city planning administration and real estate administration.
The 10 key principles
VI Example

19
VII.Engagement of all relevant stakeholders and empowerment of citizens
The plan has to describe how the civil society has been involved in its elaboration, and how they will be involved in implementation and follow up.
Build support from STAKEHOLDERS:
if they support the SEAP nothing should stop it!
The 10 key principles
VII
20
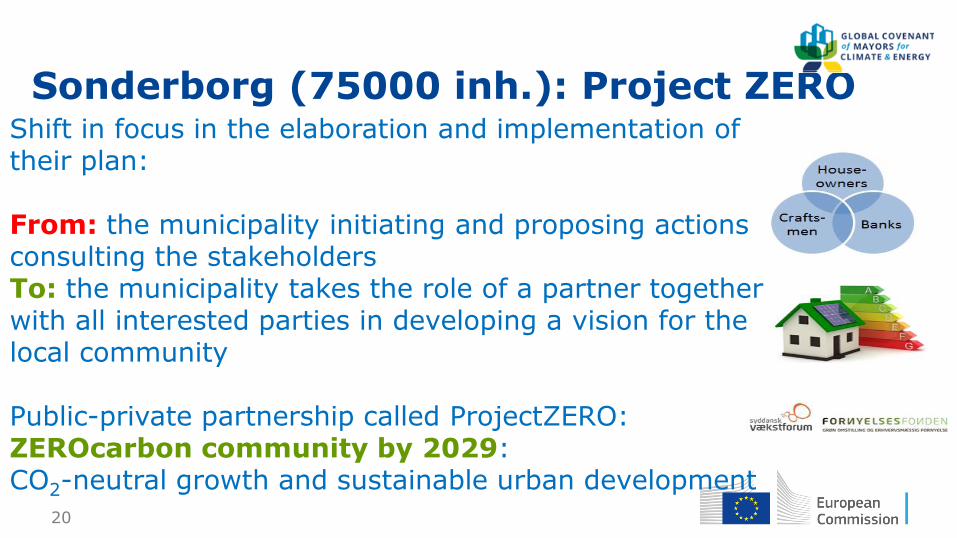
Sonderborg (75000 inh.): Project ZERO
The 10 key principles
VII
Shift in focus in the elaboration and implementation of their plan: From: the municipality initiating and proposing actions consulting the stakeholders To: the municipality takes the role of a partner together with all interested parties in developing a vision for the local community Public-private partnership called ProjectZERO: ZEROcarbon community by 2029: CO2-neutral growth and sustainable urban development

21
VIII.Financing
A plan cannot be implemented without financial resources. The plan should identify the key financing resources that will be used to finance the actions
The 10 key principles
VIII
Example
22
IX. Monitoring and reporting
The SE(C)AP should contain a brief outline on how the local authority intends to ensure the follow-up of the actions and monitor the results
• For each action, progress based indicators should be defined
• Regular adjustments of the actions based on new opportunities/findings
The 10 key principles
IX
23
X. SE(C)AP submission and filling the template
Covenant signatories commit to:
• submitting their SEAPs within 1-year following adhesion
• submitting their SECAPs within 2-year following adhesion
The SE(C)AP must be uploaded in national language via the Covenant of Mayor's website + online SEAP template in English.
The template has to be filled carefully with sufficient level of detail, and should reflect the content of the SE(C)AP.
X
24
An adaptation of the 10 key principles might be needed in order to better suit the different reality of local authorities in other regions of the world, compared to EU signatory cities.
Which key principles are already applicable?
Which ones need to be reconsidered?
The 10 key principles
Discussion

25
Baseline Emission
Inventory
(BEI)
21 September Brussels 2017
The European Commission’s science and knowledge service
Joint Research Centre
26
The Baseline Emission
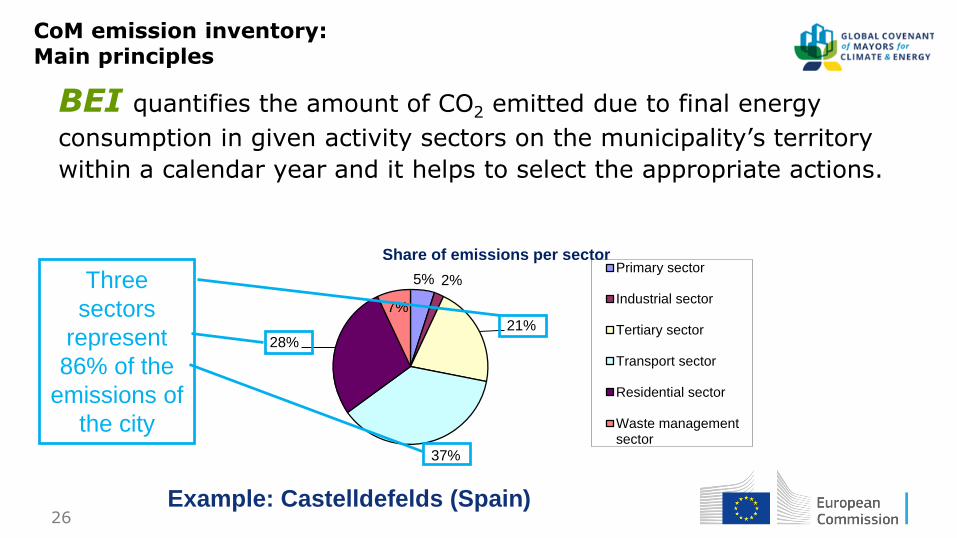
Inventory (BEI) BEI quantifies the amount of CO2 emitted due to final energy
consumption in given activity sectors on the municipality’s territory
within a calendar year and it helps to select the appropriate actions.
Example: Castelldefelds (Spain)
5% 2%
21%
37%
28%
7%
Share of emissions per sector Primary sector
Industrial sector
Tertiary sector
Transport sector
Residential sector
Waste managementsector
Three
sectors
represent
86% of the
emissions of
the city
CoM emission inventory: Main principles
27
CoM emission inventory: Main principles
28
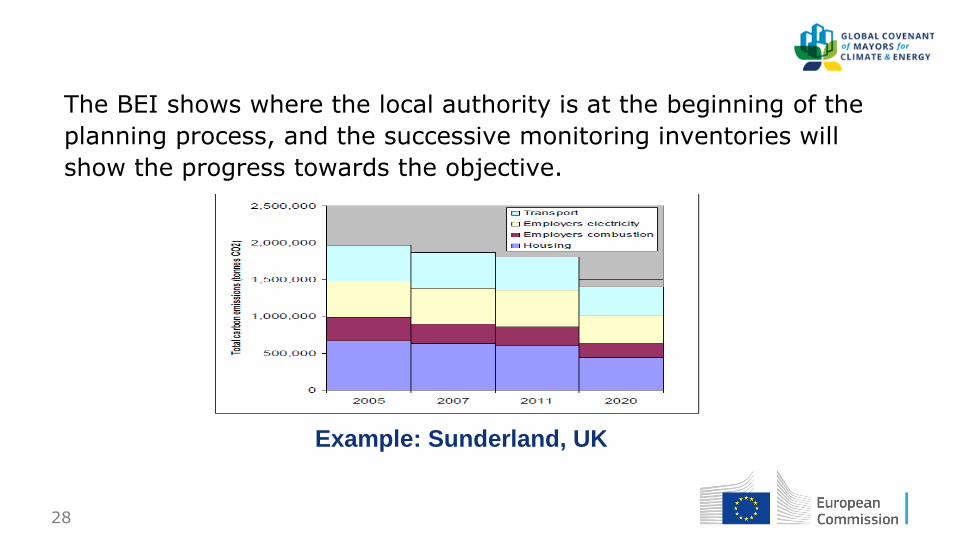
The BEI shows where the local authority is at the beginning of the
planning process, and the successive monitoring inventories will
show the progress towards the objective.
Example: Sunderland, UK
29
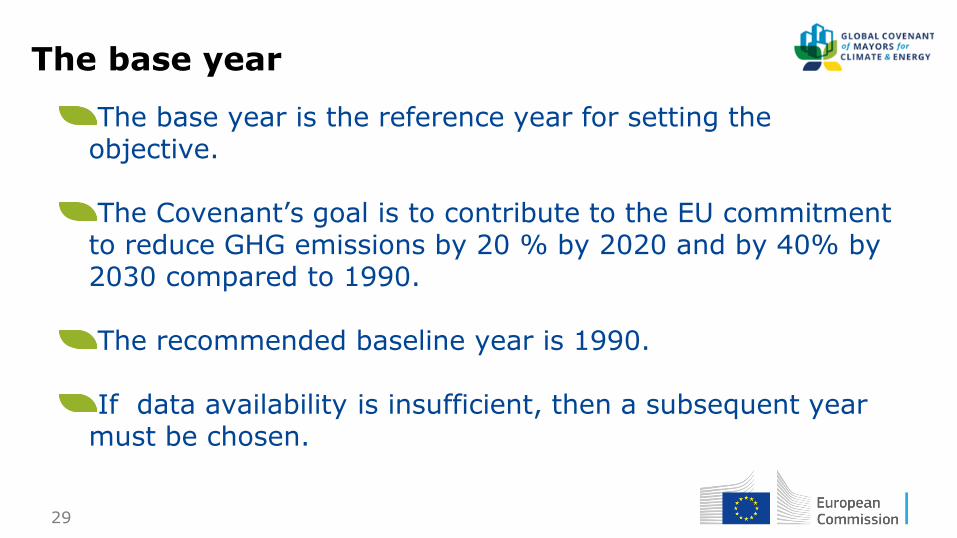
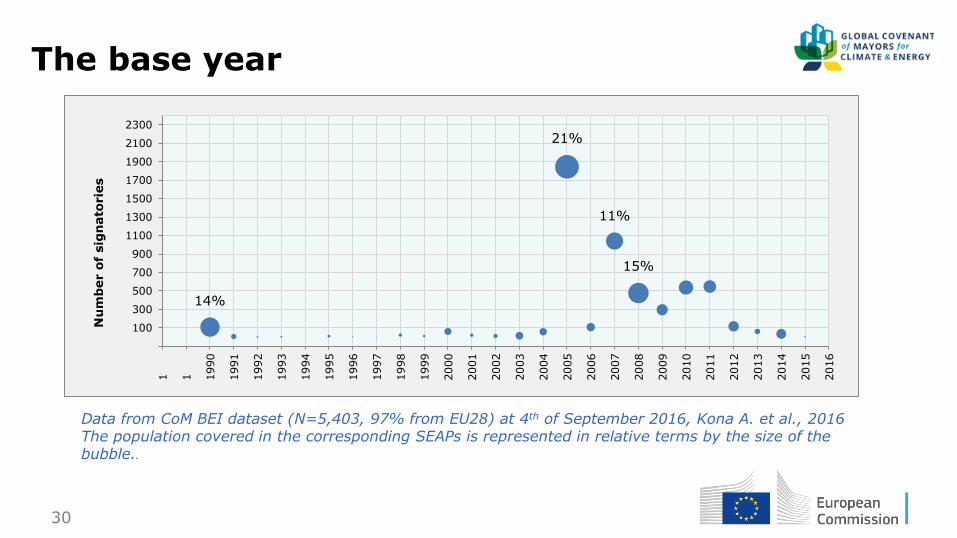
The base year is the reference year for setting the objective. The Covenant’s goal is to contribute to the EU commitment to reduce GHG emissions by 20 % by 2020 and by 40% by 2030 compared to 1990. The recommended baseline year is 1990. If data availability is insufficient, then a subsequent year must be chosen.
The base year
30
14%
21%
11%
15%
-100
100
300
500
700
900
1100
1300
1500
1700
1900
2100
2300
1988
1989
1990
1991
1992
1993
1994
1995
1996
1997
1998
1999
2000
2001
2002
2003
2004
2005
2006
2007
2008
2009
2010
2011
2012
2013
2014
2015
2016
Nu
mb
er o
f sig
nato
rie
s
Base years in CoM
Data from CoM BEI dataset (N=5,403, 97% from EU28) at 4th of September 2016, Kona A. et al., 2016 The population covered in the corresponding SEAPs is represented in relative terms by the size of the bubble..
The base year
31
For the territorial extensions of the Covenant beyond EU borders,
the local economic situation was taken into account when
recommending the base year.
For example for CoM East - originally covering countries from
Eastern Europe and Central Asia - the recommendation is to use a
more recent year which is representative of the current economic
situation.
The base year The base year
32
It is set by the administrative boundaries of the local authority
signatory of the Covenant.
The majority of CoM signatories are municipalities, but there are also higher
administrative units (e.g. provinces, regions, counties).
Definition of the boundary of the inventory
It coincides with the territory where the final energy is consumed and the one tackled by the SE(C)AP measures.
The signatory might choose not to tackle through any measures,
sectors which are otherwise included in the inventory (not recommended).
Nevertheless the target applies to all emissions included in BEI.
Definition of the boundary of the inventory
33
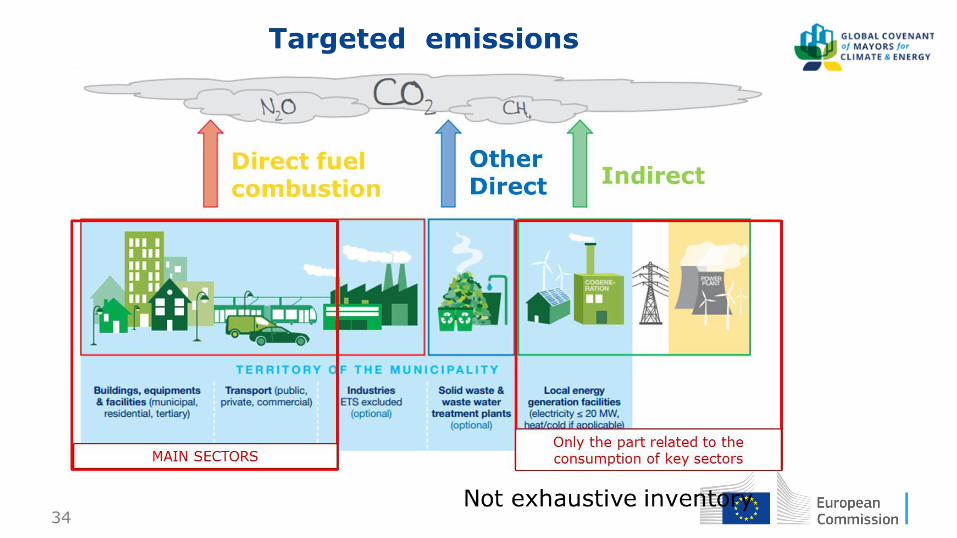
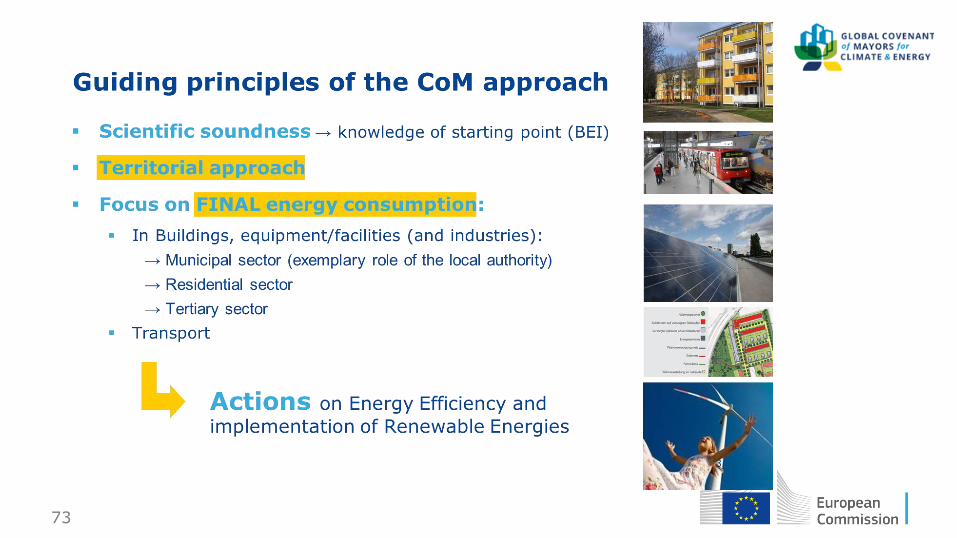
Two key principles
1) The Covenant follows essentially (but not exclusively) a
territorial approach, looking at the GHG emissions on the territory
of the local authority.
2) The focus of the Covenant is on Final Energy Consumption and
promoting distributed generation from renewable sources.
Covenant of Mayors activity sectors Covenant of Mayors activity sectors
34
35
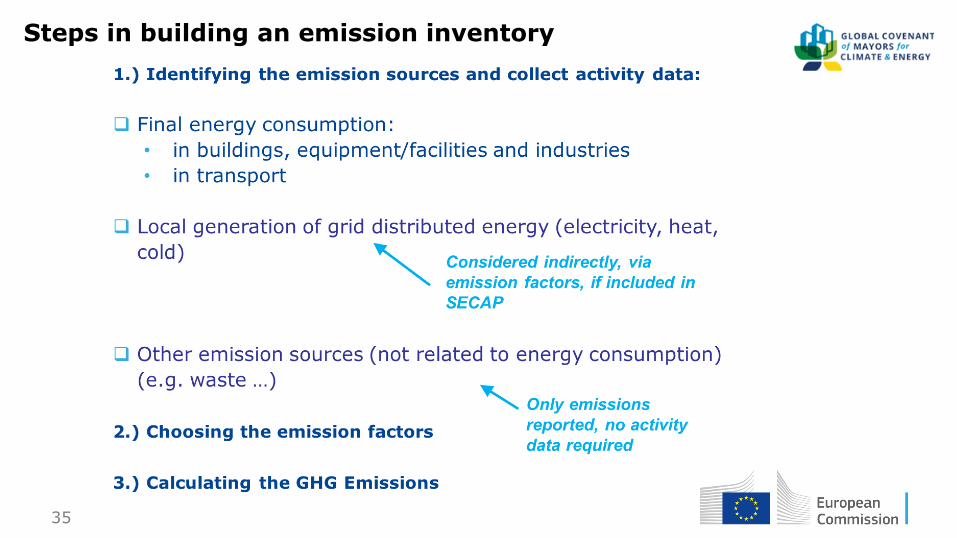
Steps in building an emission inventory
Steps in building an emission inventory
36
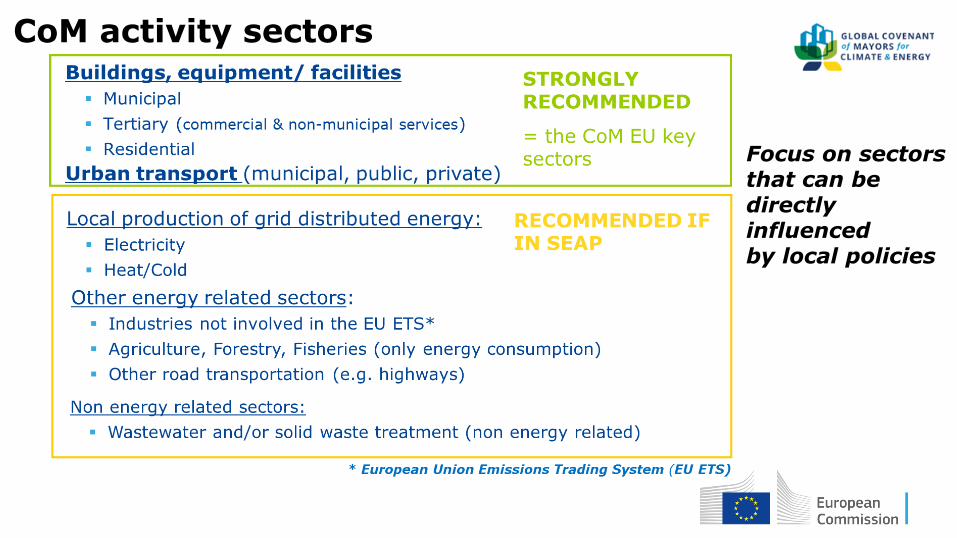
Focus on sectors
that can be directly influenced by local policies
CoM activity sectors
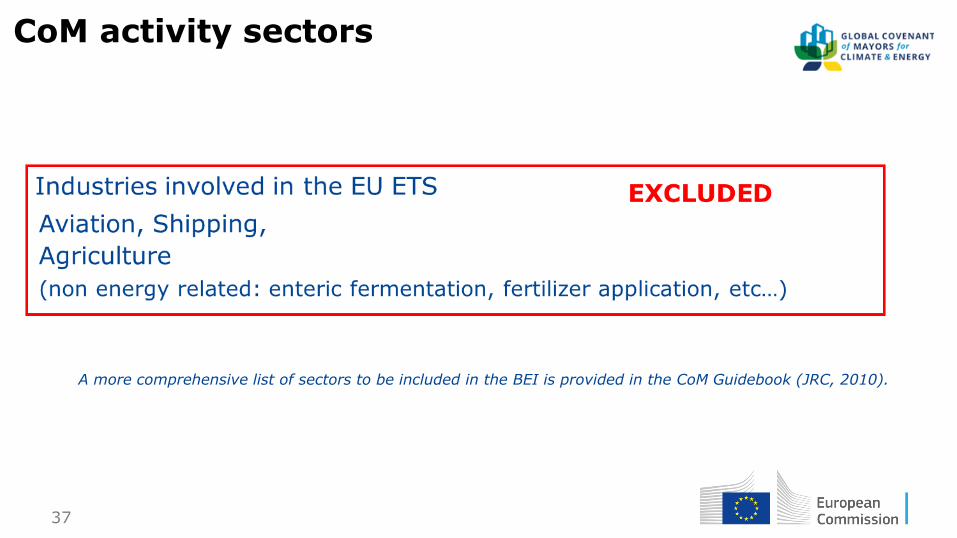
37
A more comprehensive list of sectors to be included in the BEI is provided in the CoM Guidebook (JRC, 2010).
Focus on sectors that can be directly influenced
by local policies CoM activity sectors CoM activity sectors
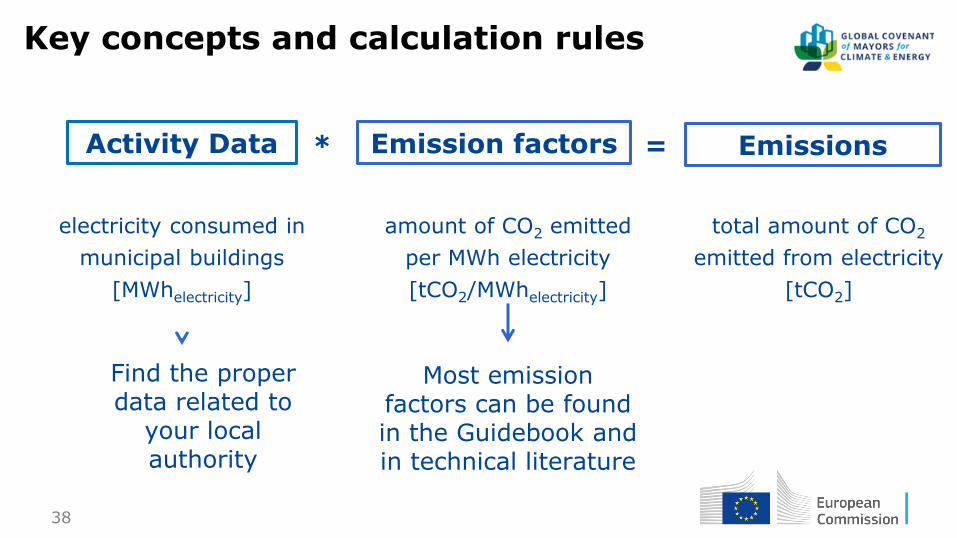
38
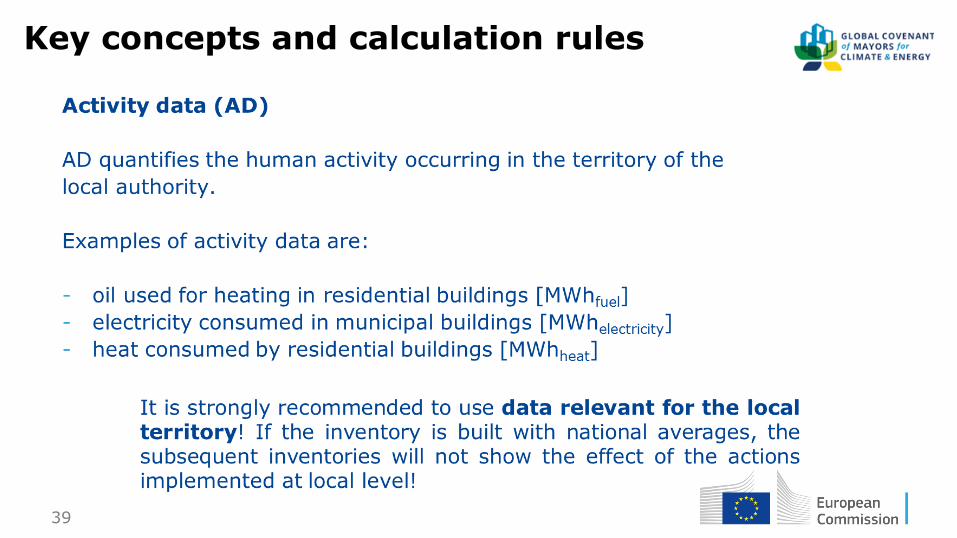
electricity consumed in
municipal buildings
[MWhelectricity]
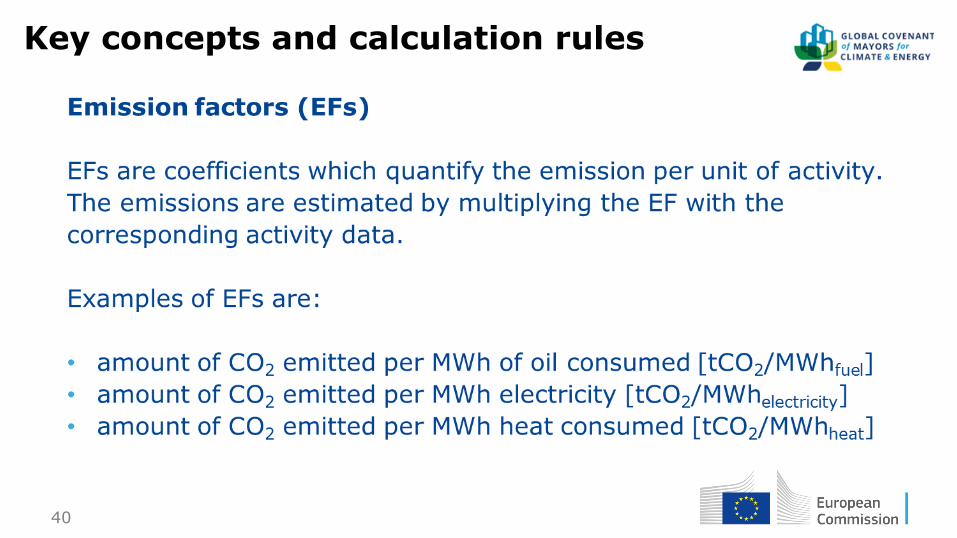
amount of CO2 emitted
per MWh electricity
[tCO2/MWhelectricity]
total amount of CO2
emitted from electricity
[tCO2]
Find the proper data related to
your local authority
Most emission factors can be found in the Guidebook and in technical literature
Key concepts and calculation rules
Activity Data Emission factors Emissions * =
Key concepts and calculation rules
39
Key concepts and calculation rules
40
Key concepts and calculation rules Key concepts and calculation rules
41
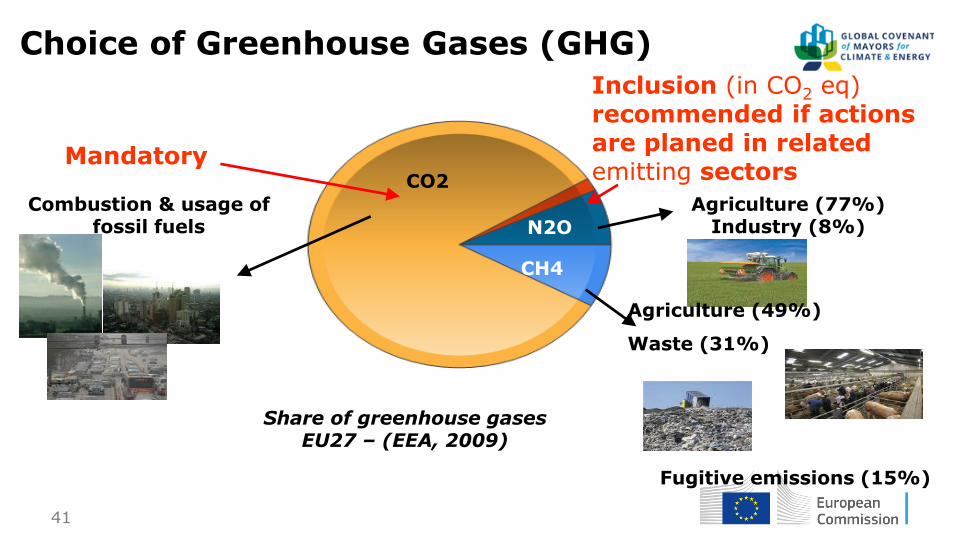
Mandatory
Combustion & usage of fossil fuels
Agriculture (77%) Industry (8%)
Agriculture (49%)
Waste (31%)
Fugitive emissions (15%)
Inclusion (in CO2 eq) recommended if actions are planed in related emitting sectors CO2
CH4
N2O
Share of greenhouse gases
EU27 – (EEA, 2009)
Choice of Greenhouse Gases (GHG)
Choice of Greenhouse Gases (GHG)
42
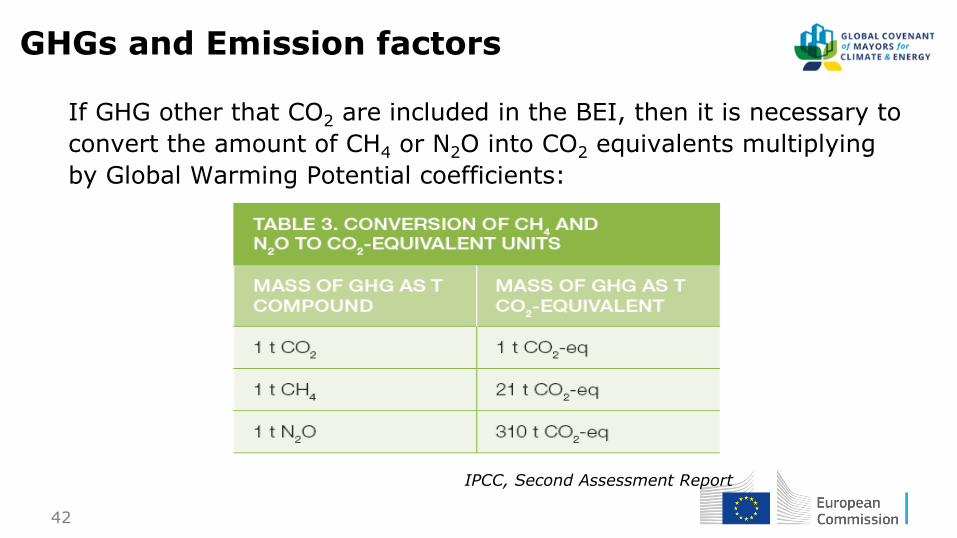
If GHG other that CO2 are included in the BEI, then it is necessary to
convert the amount of CH4 or N2O into CO2 equivalents multiplying
by Global Warming Potential coefficients:
GHGs and Emission factors
IPCC, Second Assessment Report
GHGs and Emission factors
43
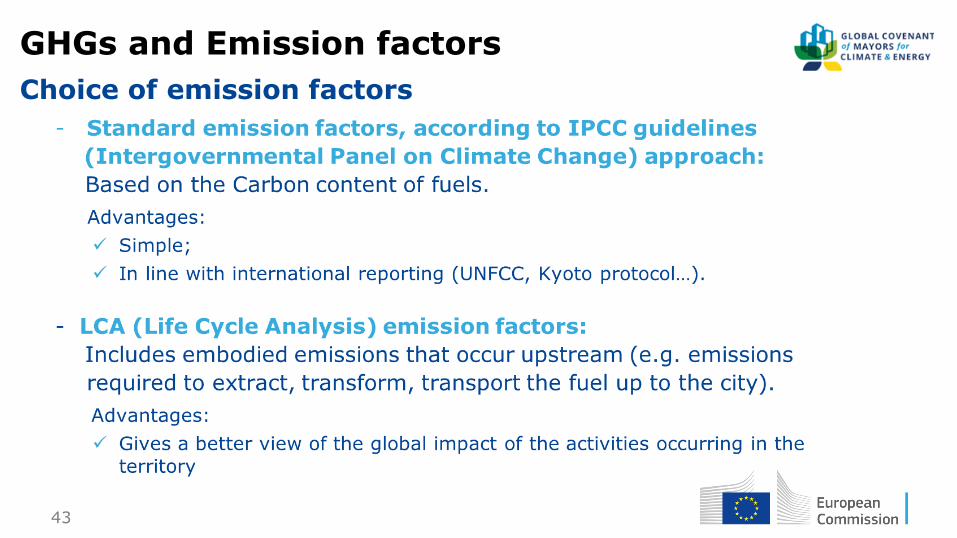
Choice of emission factors
GHGs and Emission factors
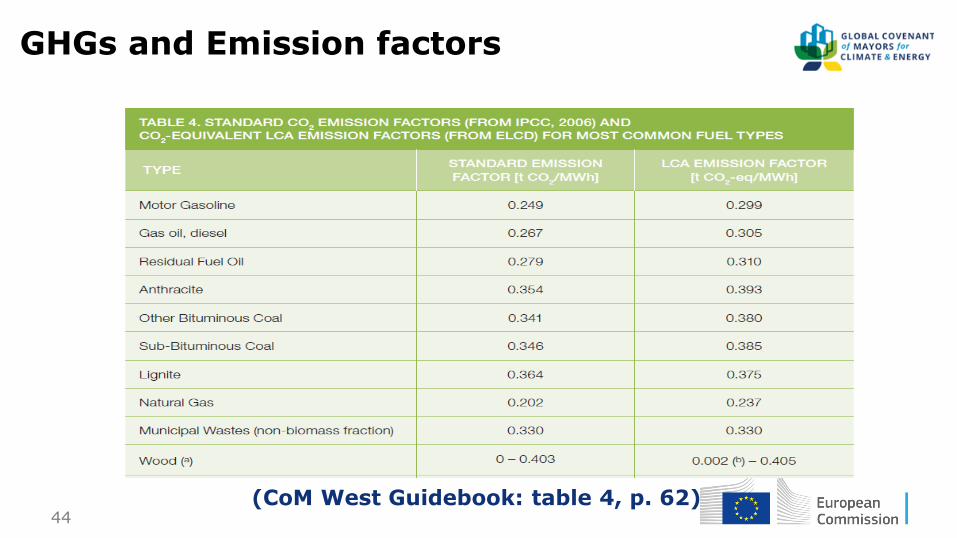
44 (CoM West Guidebook: table 4, p. 62)
GHGs and Emission factors
GHGs and Emission factors
45
Emission Factors for fuels and renewable heat
In general, biomass/biofuels are a form of renewable energy, the
use of which does not have an impact on the CO2 concentration in
the atmosphere. However, this is the case only if biomass/biofuels
are produced in a sustainable manner.
In the absence of national regulations regarding the
sustainability of biomass/biofuels, the local authority might
use the criteria set in the Directive 2009/28/EC on the
promotion of the use of energy from renewable sources.
Only biomass/biofuels that meet these criteria should be
considered as renewable in the context of the CoM.
Emission Factors for fuels and renewable heat
46
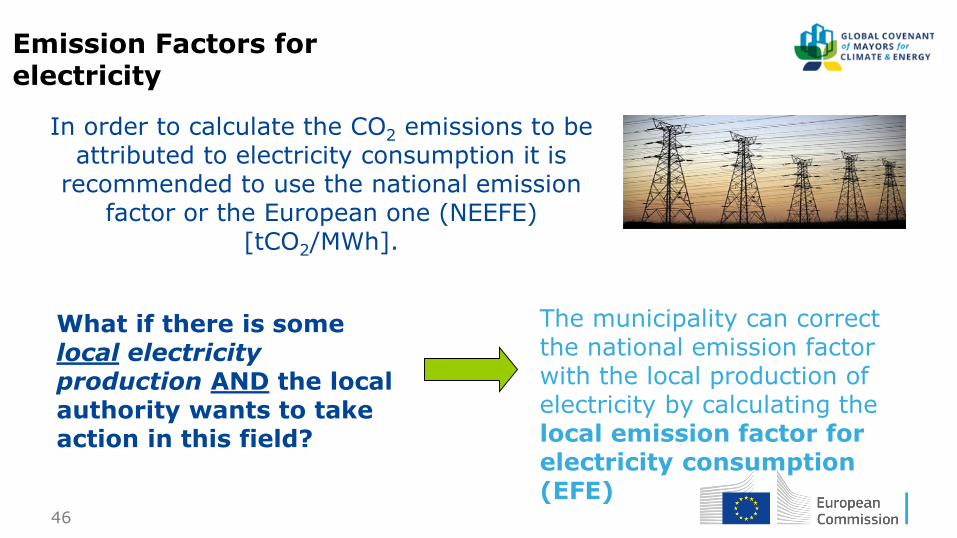
In order to calculate the CO2 emissions to be attributed to electricity consumption it is
recommended to use the national emission factor or the European one (NEEFE)
[tCO2/MWh].
What if there is some local electricity production AND the local authority wants to take action in this field?
Emission Factors for electricity
The municipality can correct the national emission factor with the local production of electricity by calculating the local emission factor for electricity consumption (EFE)
Emission Factors for electricity
47
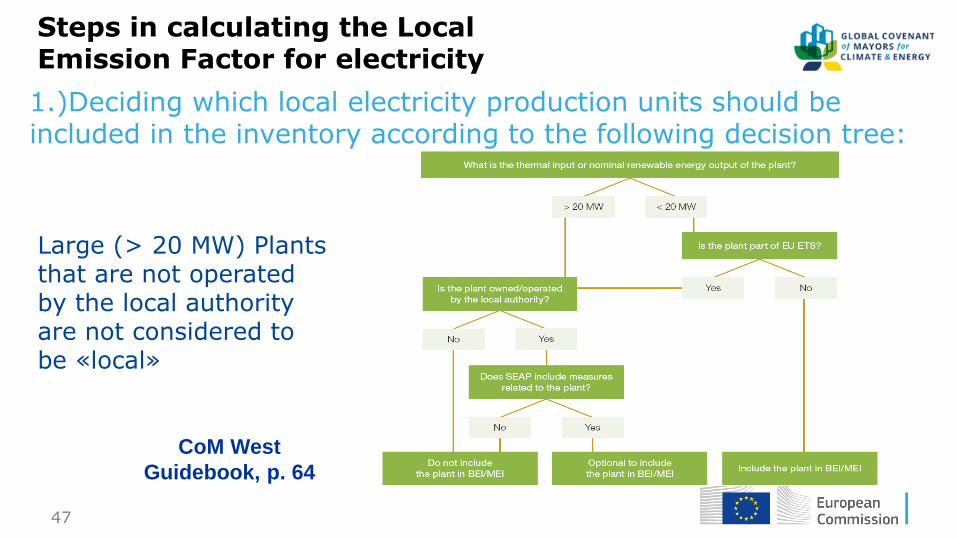
Large (> 20 MW) Plants that are not operated by the local authority are not considered to be «local»
CoM West
Guidebook, p. 64
Steps in calculating the Local Emission Factor or electricity 1.)Deciding which local electricity production units should be included in the inventory according to the following decision tree:
Steps in calculating the Local Emission Factor for electricity
48
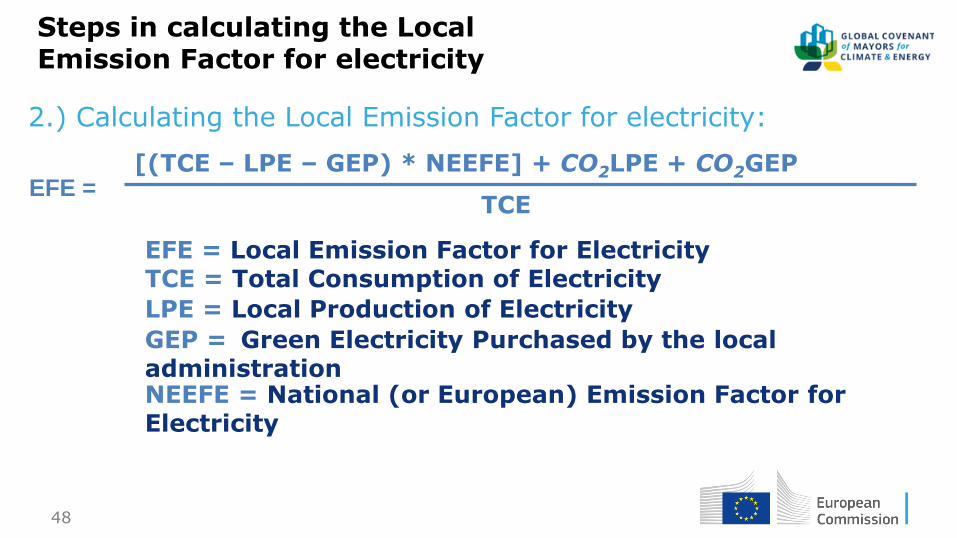
EFE = [(TCE – LPE – GEP) * NEEFE] + CO2LPE + CO2GEP
TCE
LPE = Local Production of Electricity
NEEFE = National (or European) Emission Factor for Electricity
GEP = Green Electricity Purchased by the local administration
TCE = Total Consumption of Electricity EFE = Local Emission Factor for Electricity
2.) Calculating the Local Emission Factor for electricity:
Steps in calculating the Local Emission Factor for electricity
Steps in calculating the Local Emission Factor for electricity
49
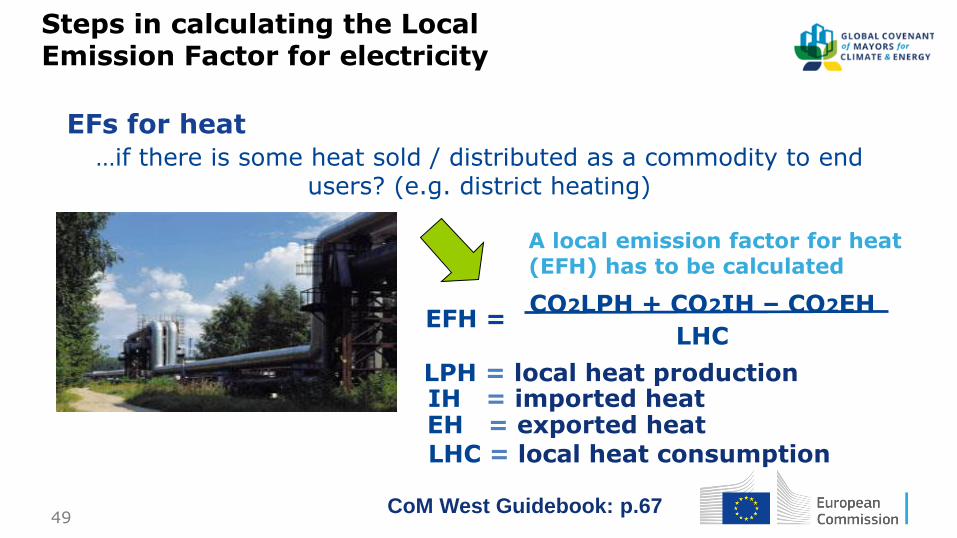
EFs for heat …if there is some heat sold / distributed as a commodity to end
users? (e.g. district heating)
A local emission factor for heat (EFH) has to be calculated
CO2LPH + CO2IH – CO2EH
LHC
CoM West Guidebook: p.67
Local Emission Factor for heat
LPH = local heat production IH = imported heat EH = exported heat
LHC = local heat consumption
EFH =
Steps in calculating the Local Emission Factor for electricity
50
Preparation of a Sustainable
Energy &Climate
Action Plan (SEACAP)
Minimum requirements for climate
adaptation reporting
21 September Brussels 2017
The European Commission’s science and knowledge service
Joint Research Centre
51 51
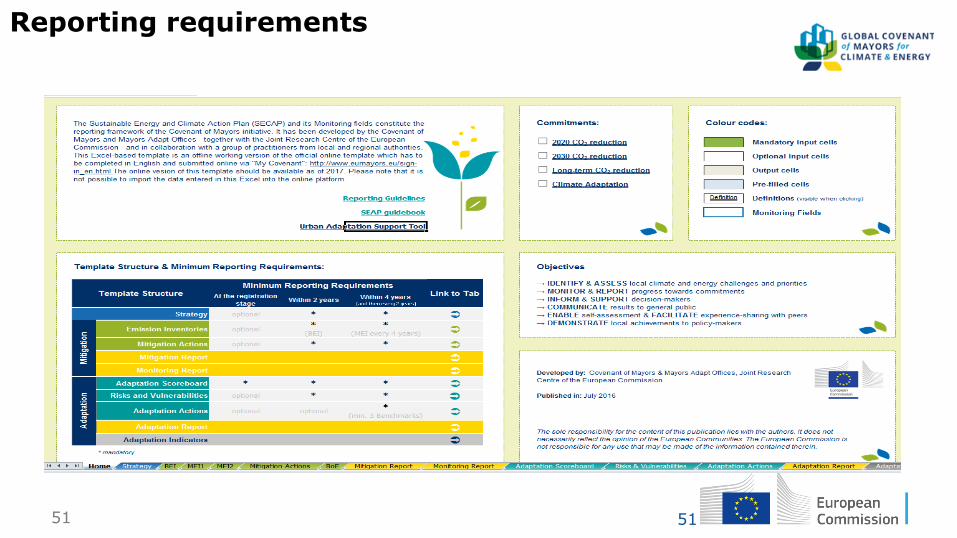
Reporting requirements
52 52
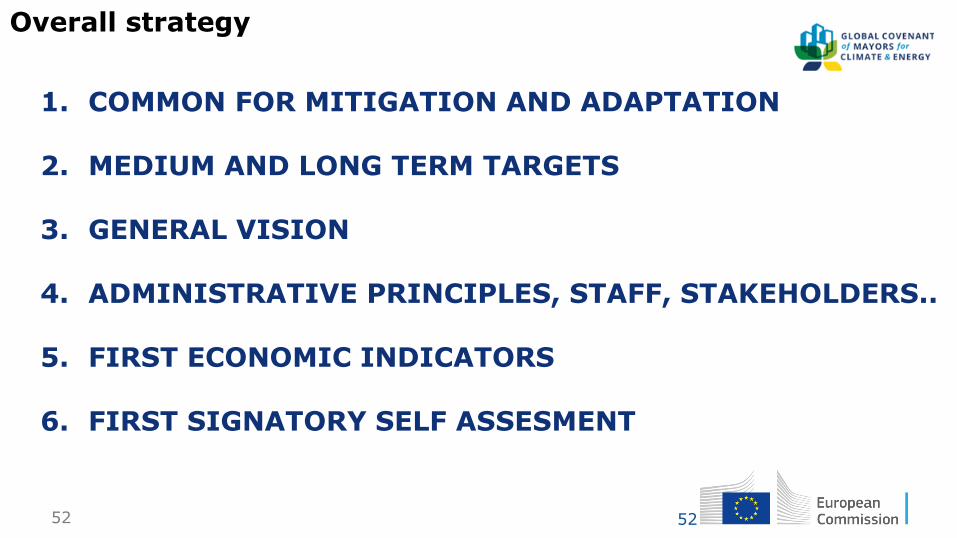
Overall strategy
1. COMMON FOR MITIGATION AND ADAPTATION
2. MEDIUM AND LONG TERM TARGETS
3. GENERAL VISION
4. ADMINISTRATIVE PRINCIPLES, STAFF, STAKEHOLDERS..
5. FIRST ECONOMIC INDICATORS
6. FIRST SIGNATORY SELF ASSESMENT
53 53
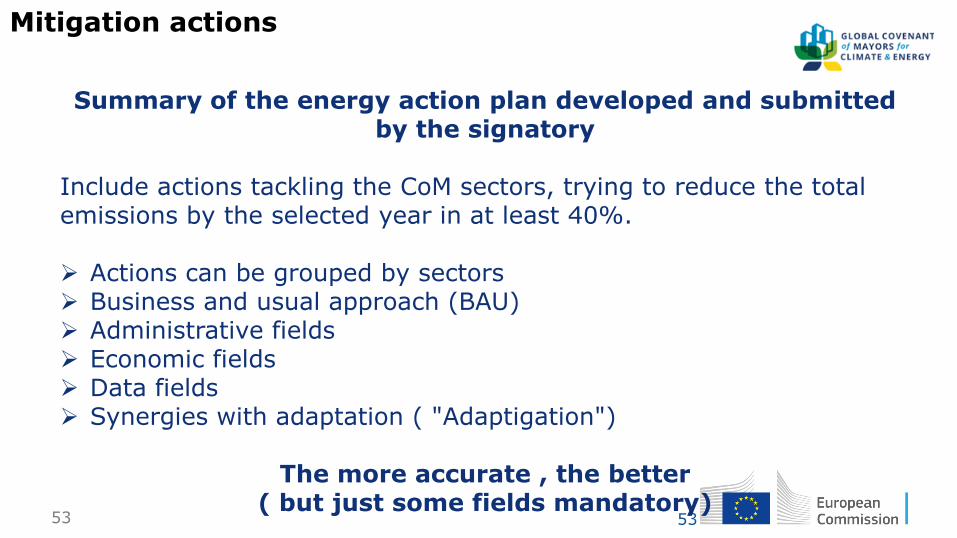
Mitigation actions
Summary of the energy action plan developed and submitted by the signatory
Include actions tackling the CoM sectors, trying to reduce the total emissions by the selected year in at least 40%. Actions can be grouped by sectors Business and usual approach (BAU) Administrative fields Economic fields Data fields Synergies with adaptation ( "Adaptigation")
The more accurate , the better ( but just some fields mandatory)
54 54
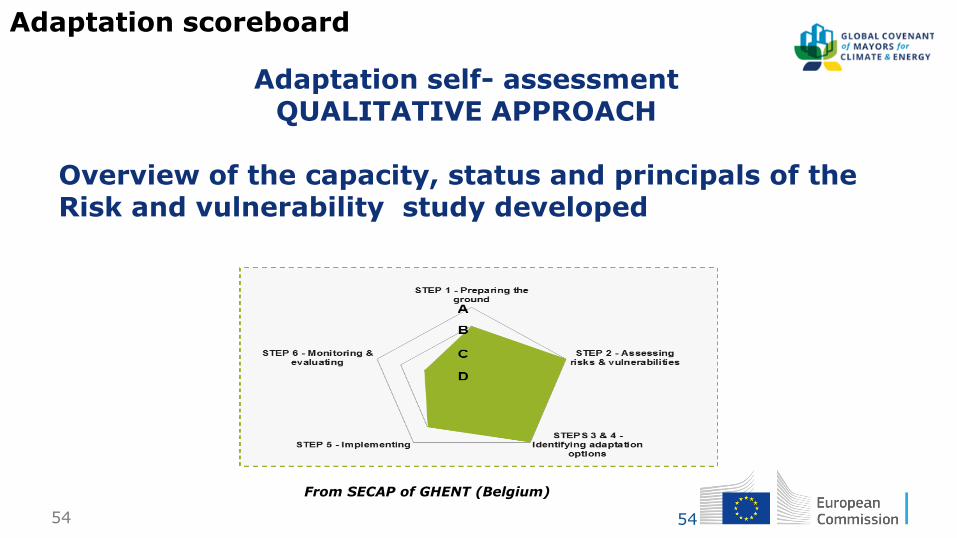
Adaptation scoreboard
Adaptation self- assessment QUALITATIVE APPROACH
Overview of the capacity, status and principals of the Risk and vulnerability study developed
From SECAP of GHENT (Belgium)
55 55
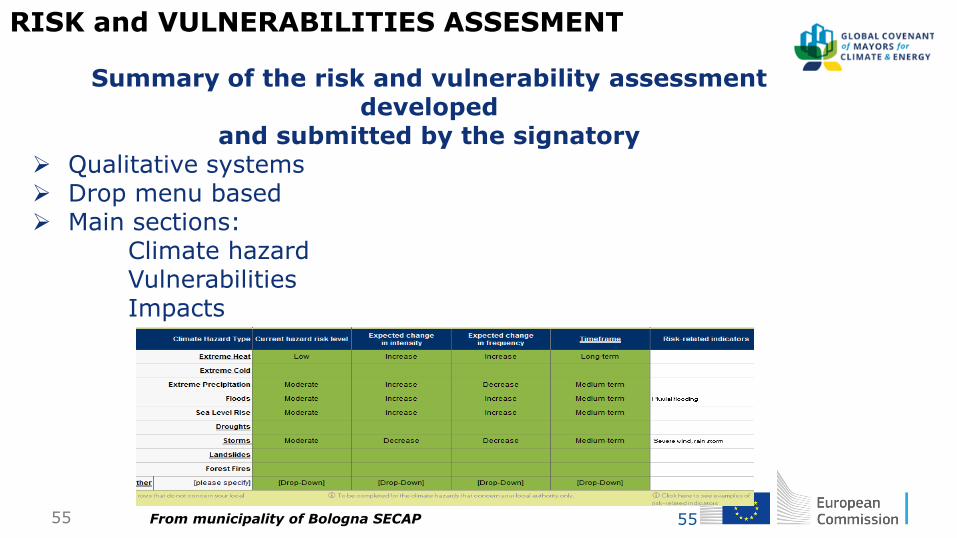
Summary of the risk and vulnerability assessment developed
and submitted by the signatory Qualitative systems Drop menu based Main sections: Climate hazard Vulnerabilities
Impacts
From municipality of Bologna SECAP
RISK and VULNERABILITIES ASSESMENT
56 56
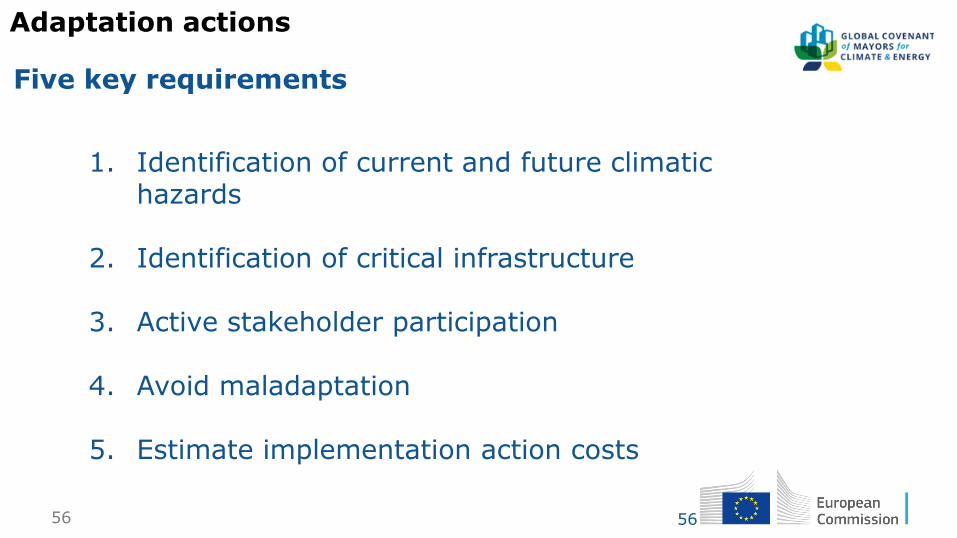
Adaptation actions
1. Identification of current and future climatic hazards
2. Identification of critical infrastructure
3. Active stakeholder participation
4. Avoid maladaptation
5. Estimate implementation action costs
Five key requirements
57 57
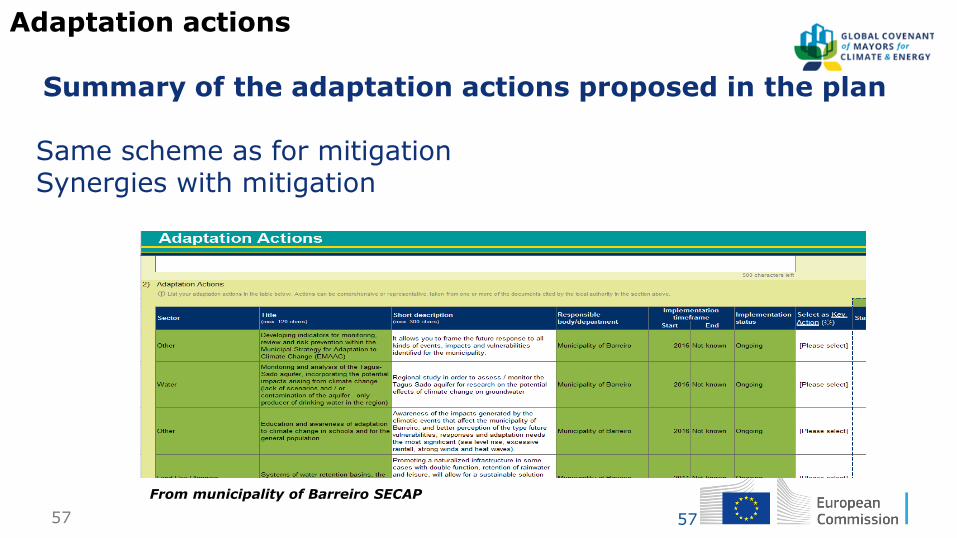
Adaptation actions Summary of the adaptation actions proposed in the plan Same scheme as for mitigation Synergies with mitigation
From municipality of Barreiro SECAP
Adaptation actions
58 58
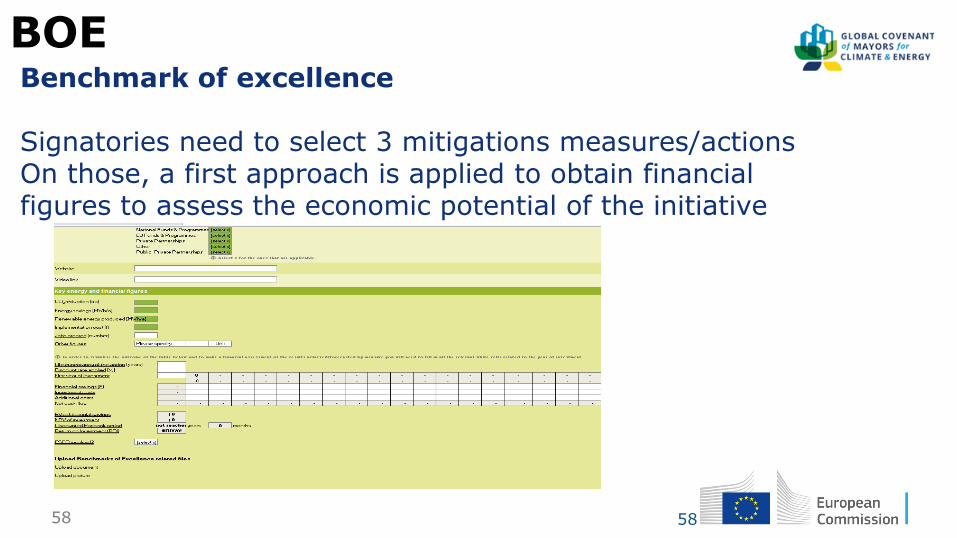
BOE Benchmark of excellence Signatories need to select 3 mitigations measures/actions On those, a first approach is applied to obtain financial figures to assess the economic potential of the initiative
59 59
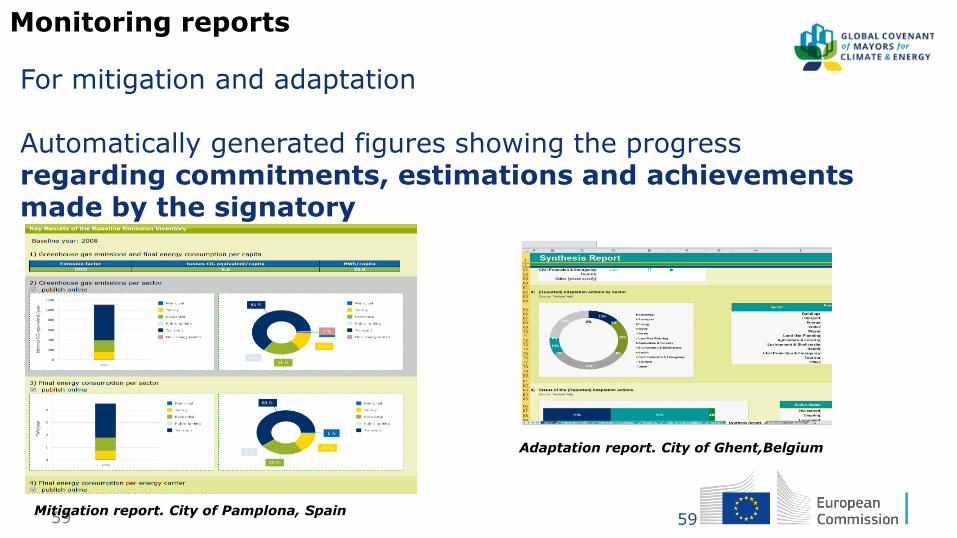
Monitoring reports
For mitigation and adaptation Automatically generated figures showing the progress regarding commitments, estimations and achievements made by the signatory
Mitigation report. City of Pamplona, Spain
Adaptation report. City of Ghent,Belgium
60
SECAP validation and
CoM monitoring
requirements in the EU
Covenant
21 September Brussels 2017
The European Commission’s science and knowledge service
Joint Research Centre
61
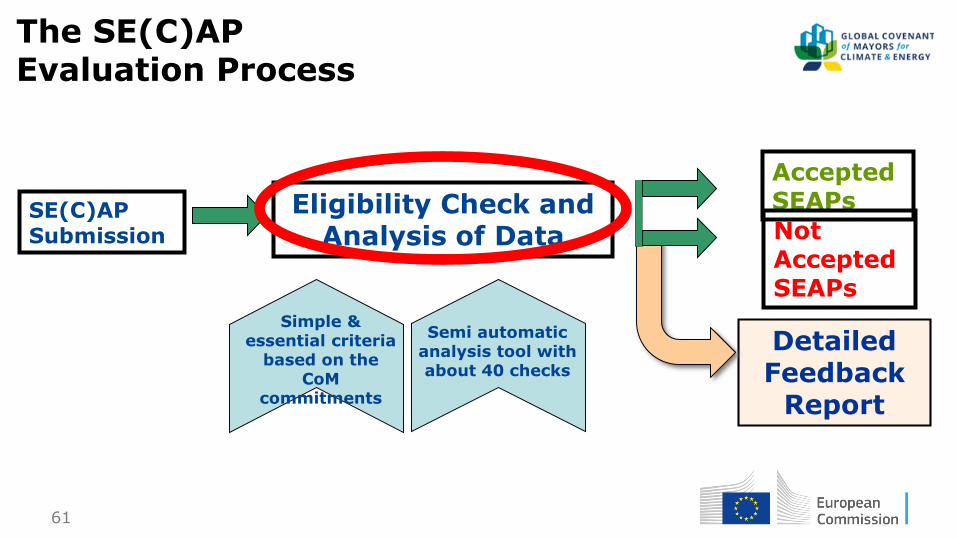
SE(C)AP Submission
Simple & essential criteria
based on the CoM
commitments
Eligibility Check and Analysis of Data
Semi automatic analysis tool with about 40 checks
Accepted SEAPs
Not Accepted SEAPs
Detailed Feedback
Report
The SE(C)AP Evaluation Process
62
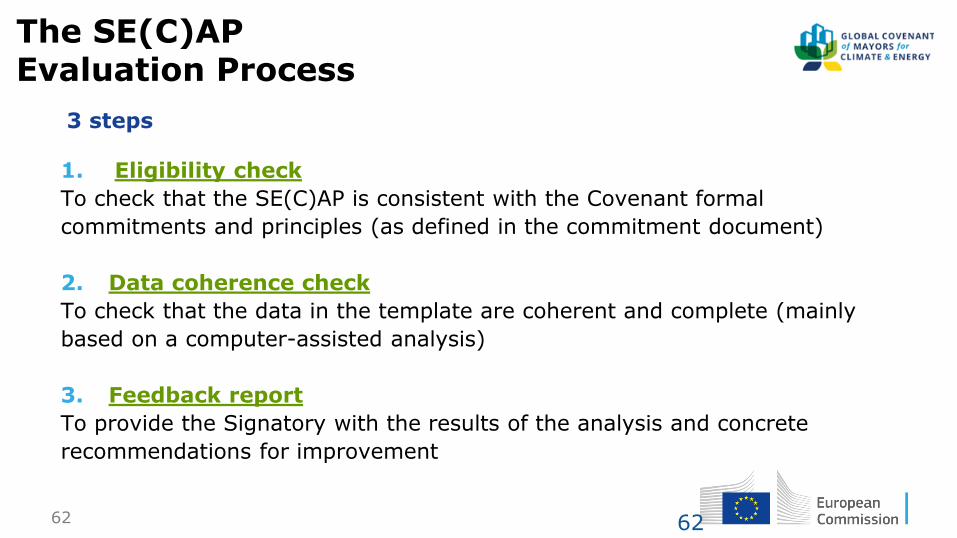
3 steps
1. Eligibility check
To check that the SE(C)AP is consistent with the Covenant formal
commitments and principles (as defined in the commitment document)
2. Data coherence check
To check that the data in the template are coherent and complete (mainly
based on a computer-assisted analysis)
3. Feedback report
To provide the Signatory with the results of the analysis and concrete
recommendations for improvement
62
The SE(C)AP Evaluation Process
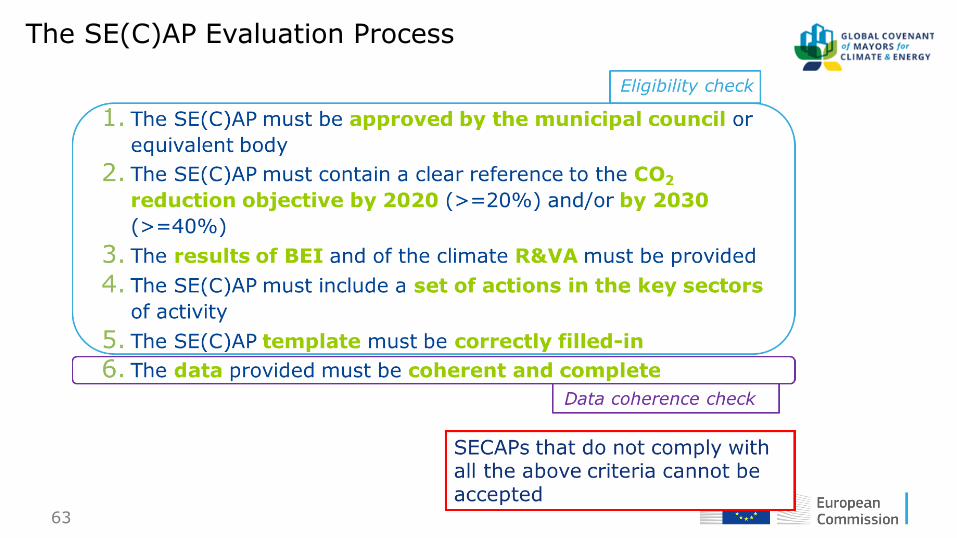
63
SE(C)AP analysis criteria The SE(C)AP Evaluation Process
64
65 65
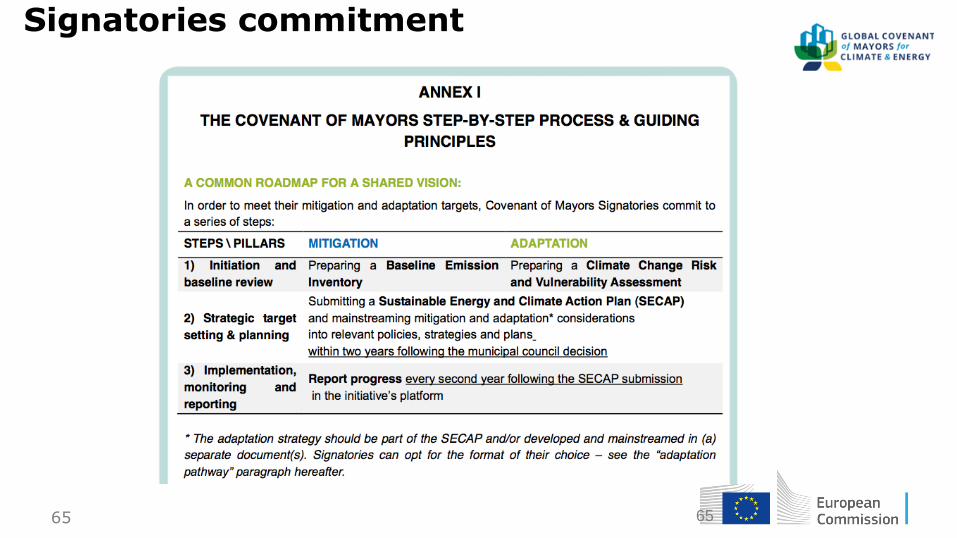
Signatories commitmentt
66
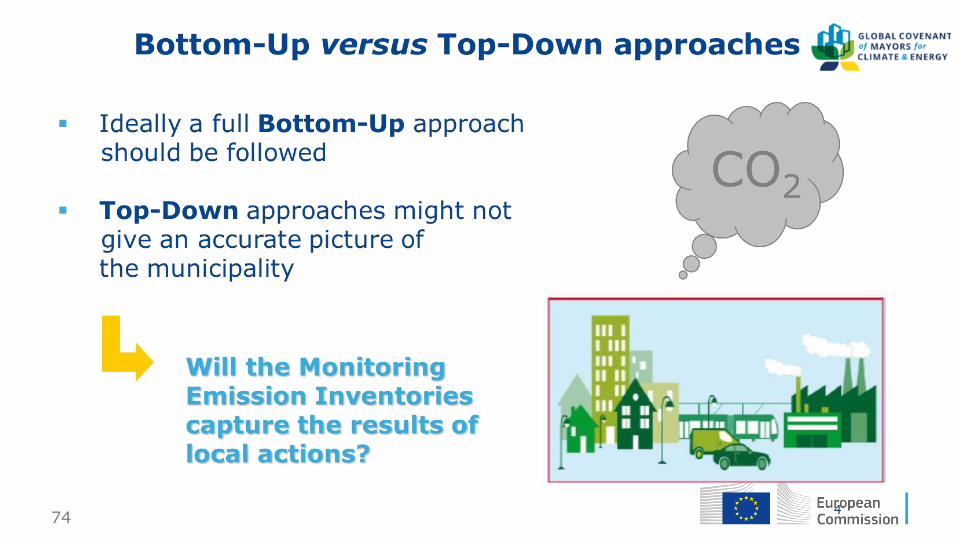
To monitor how actions defined in SE(C)APs are progressing
and evaluate their effects towards the targets
To identify the need of adjustments to the plan, e.g. corrective
measures
To take new opportunities not initially foreseen, e.g. changes
to the national/international context
Is the signatory on track to reach the
target?
Why is monitoring important? Why?
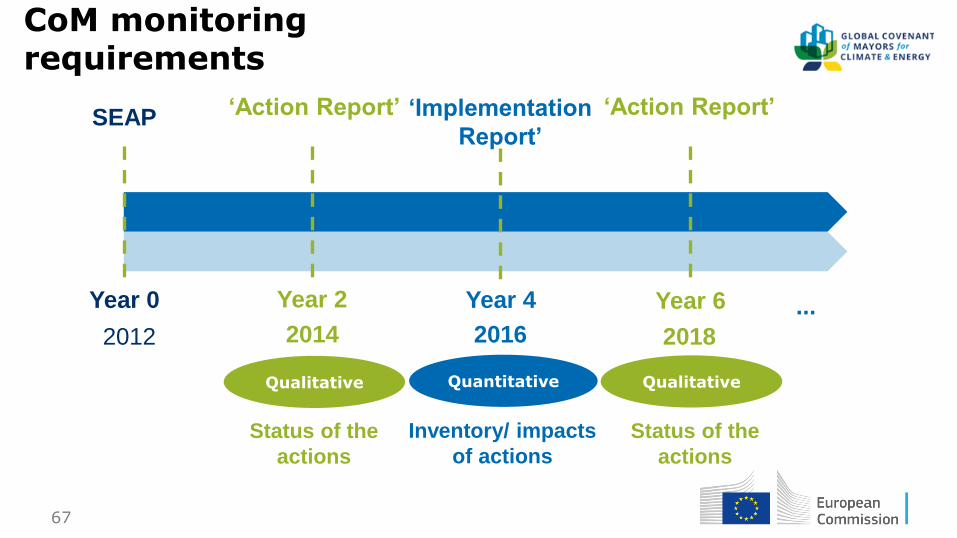
67
‘Action Report’
Year 2 Year 0
SEAP
Year 4 Year 6
2014 2016 2018
‘Implementation
Report’
Quantitative Qualitative Qualitative
...
Status of the
actions
Inventory/ impacts
of actions
Status of the
actions
‘Action Report’
CoM monitoring requirements
2012
68
Based on quantitative reports
Trends analysis
•Energy consumption
•Share of biofuels on total fuel consumption
•Share of local energy production on total energy
consumption
•Emissions
What is monitored under the CoM
69
In the context of the Covenant, the main indicators are those linked to energy consumption or level of emissions per unit of measure, e.g.: • Per capita energy consumption, by fuel and mode [MWh/capita] • Carbon intensity of transport [t CO2/pkm] or [t CO2/Vkm]
Other suggested indicators: • Public transport ridership [pkm/capita] • Car passenger traffic [pkm/capita] • Number of vehicles passing fixed point per year/month • % of population living within 400 m of a bus service • …
Performance indicators
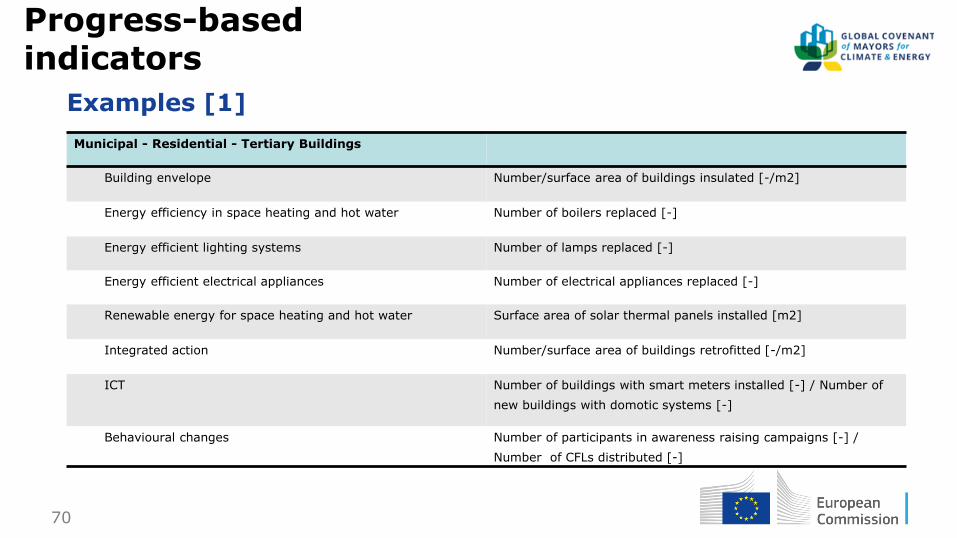
70
Examples [1]
Municipal - Residential - Tertiary Buildings
Building envelope Number/surface area of buildings insulated [-/m2]
Energy efficiency in space heating and hot water Number of boilers replaced [-]
Energy efficient lighting systems Number of lamps replaced [-]
Energy efficient electrical appliances Number of electrical appliances replaced [-]
Renewable energy for space heating and hot water Surface area of solar thermal panels installed [m2]
Integrated action Number/surface area of buildings retrofitted [-/m2]
ICT Number of buildings with smart meters installed [-] / Number of
new buildings with domotic systems [-]
Behavioural changes
Number of participants in awareness raising campaigns [-] /
Number of CFLs distributed [-]
Progress-based indicators
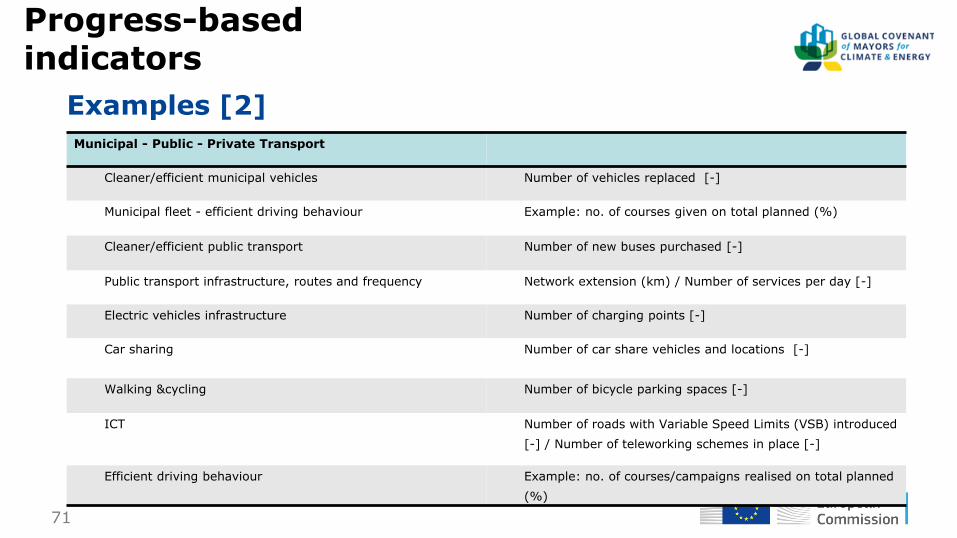
71
Municipal - Public - Private Transport
Cleaner/efficient municipal vehicles Number of vehicles replaced [-]
Municipal fleet - efficient driving behaviour Example: no. of courses given on total planned (%)
Cleaner/efficient public transport Number of new buses purchased [-]
Public transport infrastructure, routes and frequency Network extension (km) / Number of services per day [-]
Electric vehicles infrastructure Number of charging points [-]
Car sharing
Number of car share vehicles and locations [-]
Walking &cycling Number of bicycle parking spaces [-]
ICT Number of roads with Variable Speed Limits (VSB) introduced
[-] / Number of teleworking schemes in place [-]
Efficient driving behaviour Example: no. of courses/campaigns realised on total planned
(%)
Examples [2]
Progress-based indicators

72
Challenges of data
collection and
management
21 September Brussels 2017
The European Commission’s science and knowledge service
Joint Research Centre
73
74
75 75
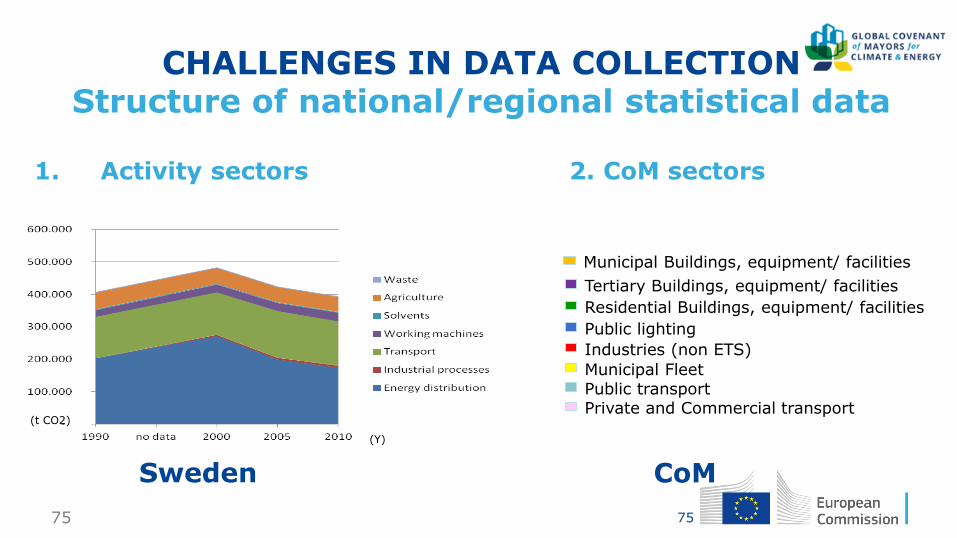
CHALLENGES IN DATA COLLECTION Structure of national/regional statistical data
Sweden
(Y)
(t CO2)
Municipal Buildings, equipment/ facilities
Tertiary Buildings, equipment/ facilities
Residential Buildings, equipment/ facilities
Public lighting
Industries (non ETS)
Municipal Fleet Public transport Private and Commercial transport
CoM
1. Activity sectors 2. CoM sectors
76
77
Overview of data
quality
78 78
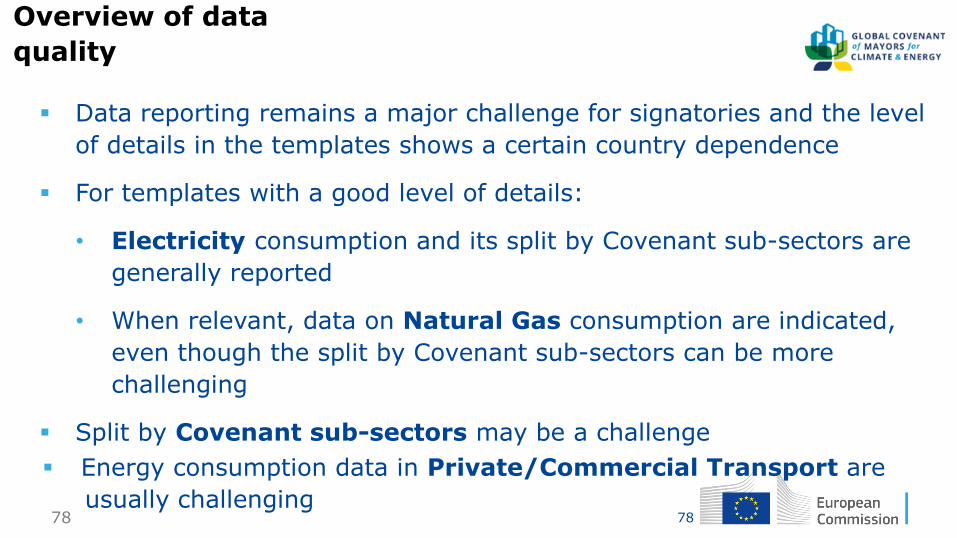
Data reporting remains a major challenge for signatories and the level
of details in the templates shows a certain country dependence
For templates with a good level of details:
• Electricity consumption and its split by Covenant sub-sectors are
generally reported
• When relevant, data on Natural Gas consumption are indicated,
even though the split by Covenant sub-sectors can be more
challenging
Split by Covenant sub-sectors may be a challenge
Energy consumption data in Private/Commercial Transport are
usually challenging
Overview of data
quality
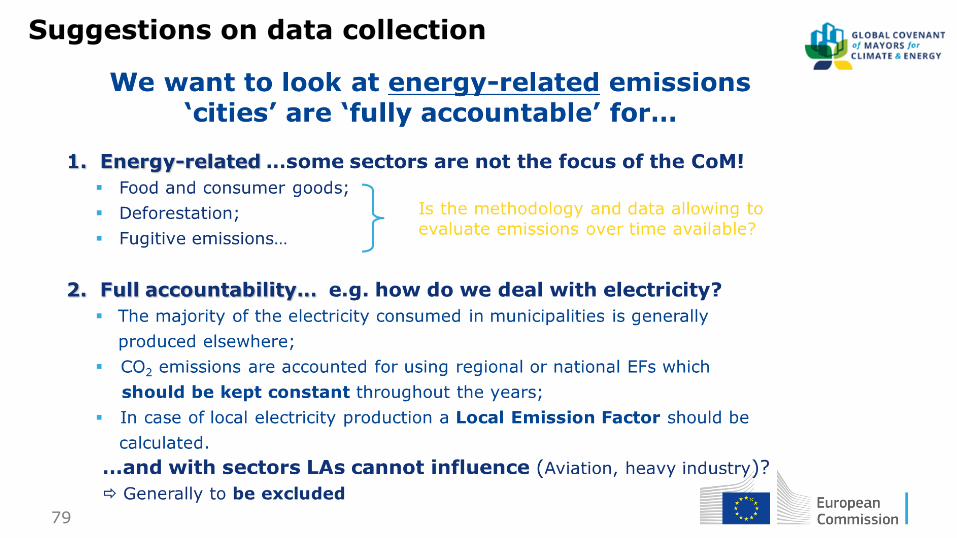
79
Suggestions on data collection
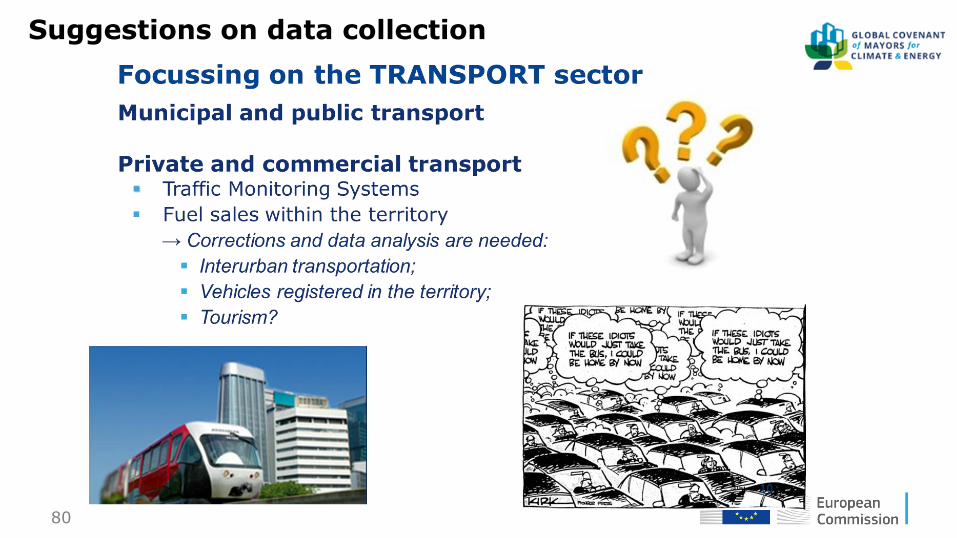
80
Suggestions on data collection
81 81
Data collection: tips from CoM experience
Projects co-funded under Intelligent Energy Europe Programme addressing the specific challenges in data collection for the Covenant signatories: MeShaRtility project (Measure and share data with utilities for the
Covenant of MaYors), duration: April 2012- April 2015, target region: EU in general, specifically addressing 12 countries: Bulgaria, Croatia, Cyprus, Estonia, Germany, Italy, Latvia, Malta, Poland, Romania, Slovenia, Spain, http://www.meshartility.eu/en/
Summary report about good data sharing practices at EU level, 2015
The report can be downloaded from: http://www.meshartility.eu/images/documents/pl/ICLEI_meshartility_report_
EN_210x297_Screen_2.pdf
82 82
Projects co-funded under Intelligent Energy Europe Programme addressing the specific challenges in data collection for the Covenant signatories: Data4Action project, duration: March 2014- February 2017, target area:
EU28, http://data4action.eu
Data4Action, aims to foster win-win energy data exchange collaboration models between public authorities and energy data providers moving from bilateral data exchange cooperation agreements to regional «one-stop shop» data centres (« Observatories»).
Data Access Guidebook for Sustainable Energy Actions Plans, 2016,
The report can be downloaded from: http://www.fedarene.org/wp-content/uploads/2017/01/576-Data-Access-
Guidebook-rx15.pdf
Data collection: tips from CoM experience
83
National initiative
Centralized data collection at national level are facilitating data collection at local level Netherlands and Denmark have developed tools which provide energy and
climate data per activity sector, broken down at least at municipal level. Cyprus Energy Agency has developed a tool which provides the local
authorities with all the energy consumption information required in order to establish their CO2 inventory.
The main aim of these tools was to assist the local authorities in
implementing and monitoring local energy and climate action plans.
Climate Monitor, Netherlands, since 2009, www.klimaatmonitor.databank.nl Municipal Carbon Inventory Tool, Denmark, since 2008,
http://www.ens.dk/undergrund Cyprus Energy Agency website: http://www.cea.org.cy/app/CEA_energy.html
83
84
Regional initiative
84
Covenant supporters play a key role in helping small and medium size local authorities to collect the data Energy data base of the province of Limburg: The province of Limburg with partners established a data base containing the results of Baseline Emission Inventory, Renewable energy scan, Sustainable building scan and a Set of climate indicators prepared for each of the Limburg (44) municipalities. This was done to encourage municipalities to sign the Covenant of Mayors and draft up a SEAP (Sustainable Energy Action Plan). By doing this, the province of Limburg wants to reach their goal, set in 2008: becoming climate neutral in 2020” * *Improving access to local energy data. Lessons
learnt and recommendations from the meshartility project”, 2015 http://www.meshartility.eu/images/documents/D6.7_Final_brochure.pdf
85
Energy consumption data has to be relevant to the particular situation of the
municipality (national averages will not reflect in the subsequent
monitoring inventories the effect of the actions implemented at local level!)
The data collection process requires time and resources. Planning is crucial!
Sources of data ( see guidebook page 70)
- Invoices (e.g. for the own buildings of the local authority)
- Market operators (energy suppliers, grid operators)
- Ministries (energy, statistics, environment), agencies, regulatory authorities
- Surveys addressed to energy consumers
Conclusions
86 86
Good quality and reliable data is essential
The availability and sources of energy data are country/region dependent
Difficult to assess the consumption of energy vectors that are not distributed via a
grid (heating oil, biomass …). Surveys are often required to complement this data.
Importance of utilities /energy suppliers / grid operators: they own the primary
data !!!
Territorial coordinators (e.g. supporting structures) and other National/ regional
authorities can play a key role in collecting data and making it available to local
authorities
Aggregated data is not enough: need data for each energy vector, for community, for
each category of customer (households, public sector, industry, services)
Data related to transport and mobility: difficult to be estimated
Conclusions
87
Stay in touch
•EU Science Hub: ec.europa.eu/jrc
•Twitter: @EU_ScienceHub
•Facebook: EU Science Hub - Joint Research Centre
•LinkedIn: Joint Research Centre
•YouTube: EU Science Hub


