33
Page 1 of 33 Sustainable Energy Vision for Estonia A path to make Estonian energy independent and sustainable by 2050 March, 2011 INFORSE-Europe

Page 1 of 33
Sustainable Energy Vision for Estonia A path to make Estonian energy independent and sustainable by 2050 March, 2011 INFORSE-Europe

Page 2 of 33
1. Introduction In the past Estonia has always relied on its own energy resource: fuel for heating houses from a neighbouring forest and mechanical power from wind, water or harnessed horses. The Soviet period with its careless uneconomical use of energy resources resulted in lavish consumption of oil shale based power. Now Estonia faces two radical choices: either to give in to the huge pressure of the big international nuclear lobby or straighten its back and follow its own independent way to create a safe and environmentally benign sustainable energy supply, restoring its intrinsically economic but creative lifestyle still in the genes from the older generations. Estonia does not need the “Japanese version of Finnish sauna” but primary energy supply, independent from big foreign energy companies as a guarantee to sustain its cultural heritage and remain in the driving seat on its own territory. It is high time to rally all forces to make Estonia not only a paragon in relation to its progress in moving towards information society but a paragon in relation to reorganizing its energy system as well to make this targeted information society sustainable. Estonia has plenty of renewable energy and if the will is there, the ultimate goal of abandon unsustainable use of fossil fuels by the year 2050 is realistic and feasible. Any comments, queries or feedback is greatly welcomed and will be paid attention to. Find more reading on INFORSE-Europe and the sustainable energy visions and scenarios at www.inforse.org/europe.
Page 3 of 33
2. Renewable Energy Potentials 2.1 Windpower Windpower has a long history in Estonia. It is estimated that at the beginning of the 20th Century the total number of windmills in Estonia was in the range of 2 - 3 thousand with the total output power about 10 MW, which was quite a large share of the total energy consumption in Estonia at that time. In the 1920s and 1930s there were set up a lot of small wind turbines to charge batteries for radio receivers. The use of wind power to pump water and produce electricity in the rural areas started in Estonia during the common economic growth in 1930s. The wind generators were produced in Estonia, and the references to several patents serve as a proof of their good quality and a unique engineering approach. After the Second World War the usage of wind power decreased rapidly due to existing Soviet energy policy in favour of big thermal power plants run on oil shale.
The estimation of wind energy potential in Estonia is based on Estonian Wind Atlas, which was developed using similar material and methods that were used for the European Wind Atlas. Based on the mean monthly wind statistics from 48 meteorological stations of Estonian Meteorological and Hydrological Institute and measurement sites within the period of 1891–1990, thirteen wind climate regions were distinguished.
At the 50 m above ground level, the mean annual wind speed is dependent primarily on the distance from the coast. Over the Baltic Proper the mean wind speed exceeds 9 m/s, over the Gulf of Finland and the Gulf of Riga it remains 7–8 m/s. At this height above ground we can see clearly the influence of the West-Estonian Archipelago. Due to increased roughness the wind is weakened and sheltered by Saaremaa the wind reaches the continental part of Estonia at a lower wind speed. In inland areas of Estonia wind speed varies only slightly, remaining in most regions between 4 and 5 m/s. Only in South-East Estonia with its complex terrain, mean annual wind speed remains below 4 m/s. Lake Peipus is large enough to form an undisturbed wind profile and the mean annual wind speed at a height of 50 m is up to 7 m/s.
The annual wind energy resource curve follows quite well the annual electric energy consumption curve in Estonia. In the best areas in Estonia, concerning wind energy potential, it is possible by using 1.5 MW wind turbines to produce annually up to 40 GWh of electric energy from a surface area of one square kilometre. Considering all the potential areas in Estonia, suitable for erecting wind turbines, the annual technical wind energy potential might be evaluated to be at least 10 TWh which is considerably higher than the annual electricity consumption (7.1 TWh in 2009) of the country. This evaluation coincides with the estimation of the energy department of the Estonian Ministry of Economic Affairs and Communication as well.
At present, one of the major problems, facing wind energy promotion in Estonia, is the lack of suitable grid connections, as the existing ones are one way lines, needed to be replaced in case of linking wind energy into the grid. In addition to that the transmission lines are as a rule not located close enough to the potential wind park sites. Under the current legal regulations, the owner of the wind park should build the missing part of the grid between the park and the main grid. As the investments for building this above mentioned linkage are rather high, the production cost of wind based electricity would rise as well and on quite a few occasions would even make it unprofitable. The electric transmission network belongs to the same category with state owned highways which are kept at the needed quality level on the tax payer’s money. Therefore the state’s subsidies would be needed to solve this linkage problem for wind parks.
Another obstacle of installing wind farms in Estonia is the lack of compensation (power) stations. Without compensation capacity of varying production and load, the Estonian main grid allows to install only up to 750 MW wind power and to such an extent the contracts have already been signed

Page 4 of 33
to have an access to the grid for new wind power facilities. Thus without compensation power stations it is possible to install additional 90 MW wind power to the 527 MW of already existing and short term planned wind power. In addition to the existing 350 MW Estlink seacable (to Finland) there will be available a 635 MW Estlink-2 sea-cable which is due to be commissioned by the end of the year 2013. This would allow importing from Finland up to 985 MW of additional electric power in case of need. In addition to the chance of power import, Põhivõrgud Ltd has decided to install in the near future 100 MW gas turbines to compensate the rapid changes in power consumption and cover the peak load. One of the solutions would be compensation of varying production and load with import and export of power, but as relying on import is rather precarious and therefore the most probabilistic solution would be is to find resources to build Estonian hydro pump stations to solve the wind energy accumulation problem. The efficiency coefficient of these stations is about 80%. The suitable sites for these stations are in the North-East Estonia having rather high seashore cliff. Preliminary calculations show that the cost of electricity from these power stations will be cheaper than from gas turbine power stations and compared with the price of oil shale electricity figuring in the CO2 tax, the solution will be from the economic point of view rather realistic. One of the options will be a pump station in Ida-Virumaa near Aseri village with the rated output power of 1200 MW and with the accumulation capacity of 15 GWh. Preliminary calculations show that if buying electricity at the price of 72 EUR/MWh, then the production cost of electricity in that pump station would be 123 EUR/MWh which is 17% cheaper than the production cost of electricity in gas turbine power stations. If the production cost of wind power is 63 EUR/MWh then adding the needed pump stations, the average production cost will be ca 70 EUR/MWh which would be lower that the oil shale electricity production cost 86 EUR/MWh if factoring in the impact on the environment.
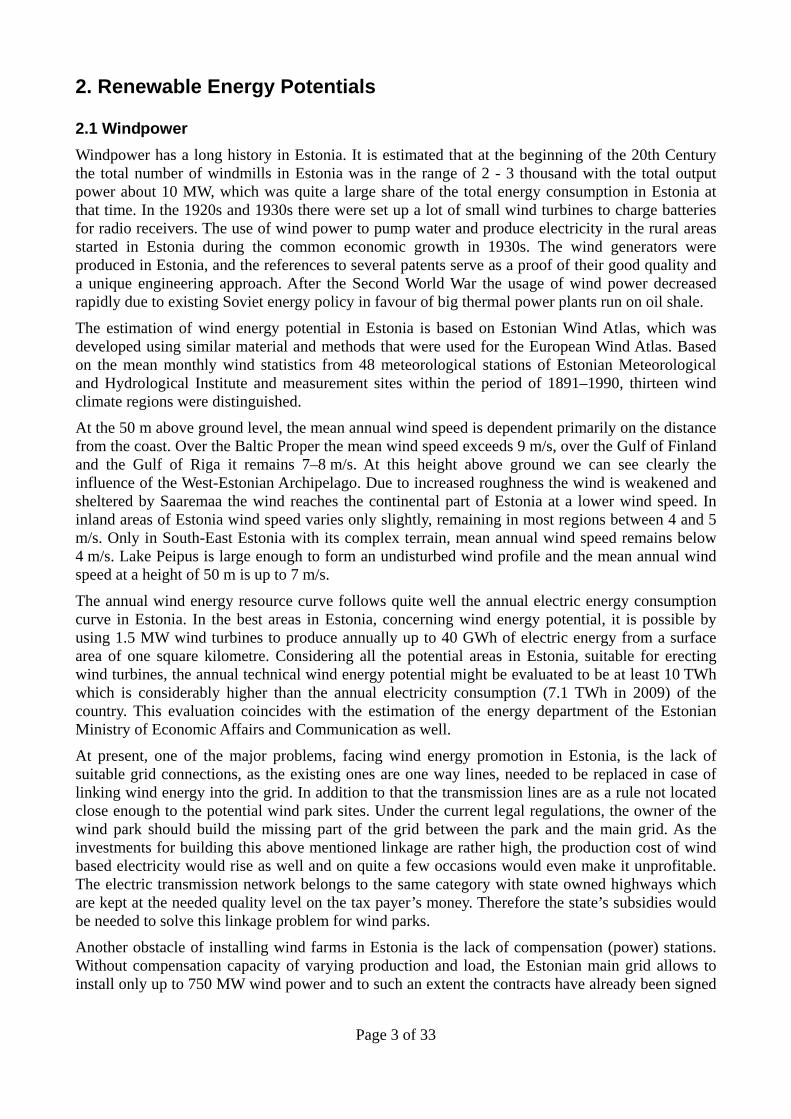
Installed capacity of windplants in Estonia
0.0
20.0
40.0
60.0
80.0
100.0
120.0
140.0
160.0
1999 2000 2001 2002 2003 2004 2005 2006 2007 2008 2009
Year
MW
Page 5 of 33
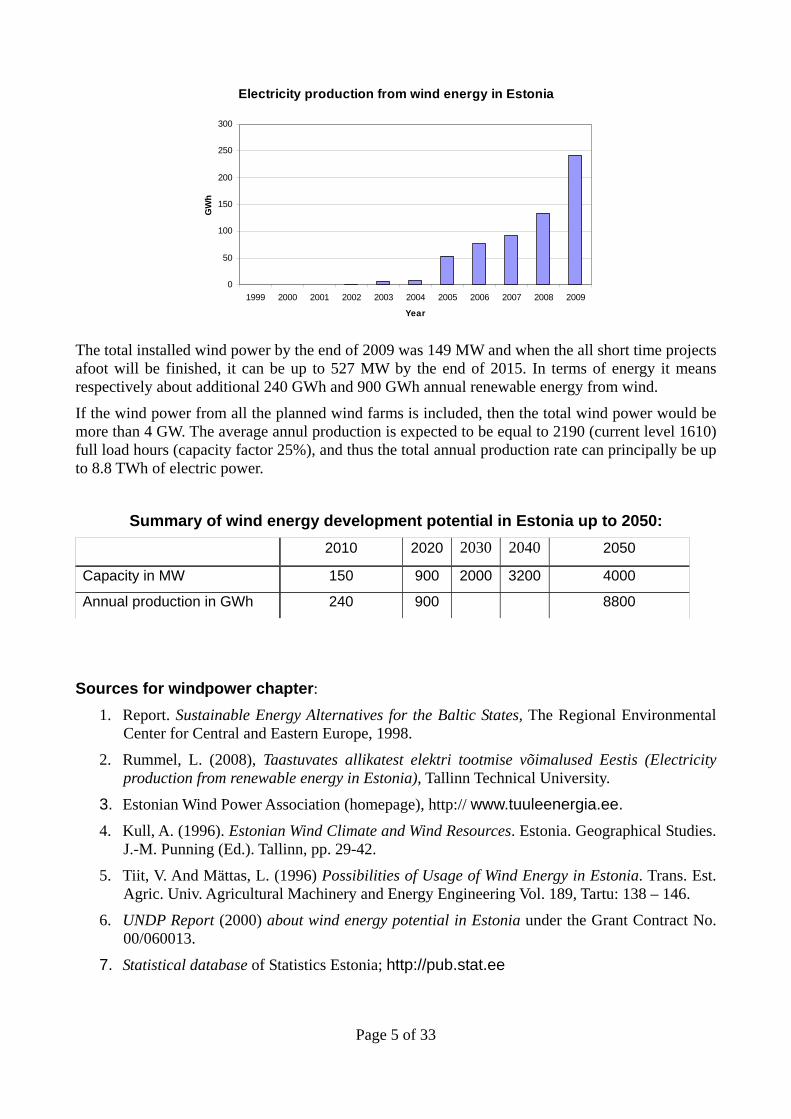
Electricity production from wind energy in Estonia
0
50
100
150
200
250
300
1999 2000 2001 2002 2003 2004 2005 2006 2007 2008 2009
Year
GW
h
The total installed wind power by the end of 2009 was 149 MW and when the all short time projects afoot will be finished, it can be up to 527 MW by the end of 2015. In terms of energy it means respectively about additional 240 GWh and 900 GWh annual renewable energy from wind.
If the wind power from all the planned wind farms is included, then the total wind power would be more than 4 GW. The average annul production is expected to be equal to 2190 (current level 1610) full load hours (capacity factor 25%), and thus the total annual production rate can principally be up to 8.8 TWh of electric power.
Summary of wind energy development potential in Estonia up to 2050: 2010 2020 2030 2040 2050
Capacity in MW 150 900 2000 3200 4000
Annual production in GWh 240 900 8800
Sources for windpower chapter:
1. Report. Sustainable Energy Alternatives for the Baltic States, The Regional Environmental Center for Central and Eastern Europe, 1998.
2. Rummel, L. (2008), Taastuvates allikatest elektri tootmise võimalused Eestis (Electricity production from renewable energy in Estonia), Tallinn Technical University.
3. Estonian Wind Power Association (homepage), http:// www.tuuleenergia.ee. 4. Kull, A. (1996). Estonian Wind Climate and Wind Resources. Estonia. Geographical Studies.
J.-M. Punning (Ed.). Tallinn, pp. 29-42.
5. Tiit, V. And Mättas, L. (1996) Possibilities of Usage of Wind Energy in Estonia. Trans. Est. Agric. Univ. Agricultural Machinery and Energy Engineering Vol. 189, Tartu: 138 – 146.
6. UNDP Report (2000) about wind energy potential in Estonia under the Grant Contract No. 00/060013.
7. Statistical database of Statistics Estonia; http://pub.stat.ee
Page 6 of 33
2.2 Solar energy Estonia is situated in the Northern Hemisphere between the Northern latitudes 59°40’ and 57°30’. The number of overcast days in a year is about 180 – 200 in the North- and Southeast-Estonia and some 150 – 160 days in the coastal area of the Baltic Sea. The intensity of solar radiation is seasonally very different. The atmospheric circulation enhances the seasonal differences of solar radiation. In December, when many cyclones go over Estonia, the sunshine duration is about 4 – 14 % of the maximum. In June the sunshine duration in some places on the coastal area goes up to 60% of the maximum, and in the inland of the country the average is about 55%. Due to these factors, the monthly solar radiation is 172 kWh/m2 in Tartu in June, but in December only 7.8 kWh/m2.
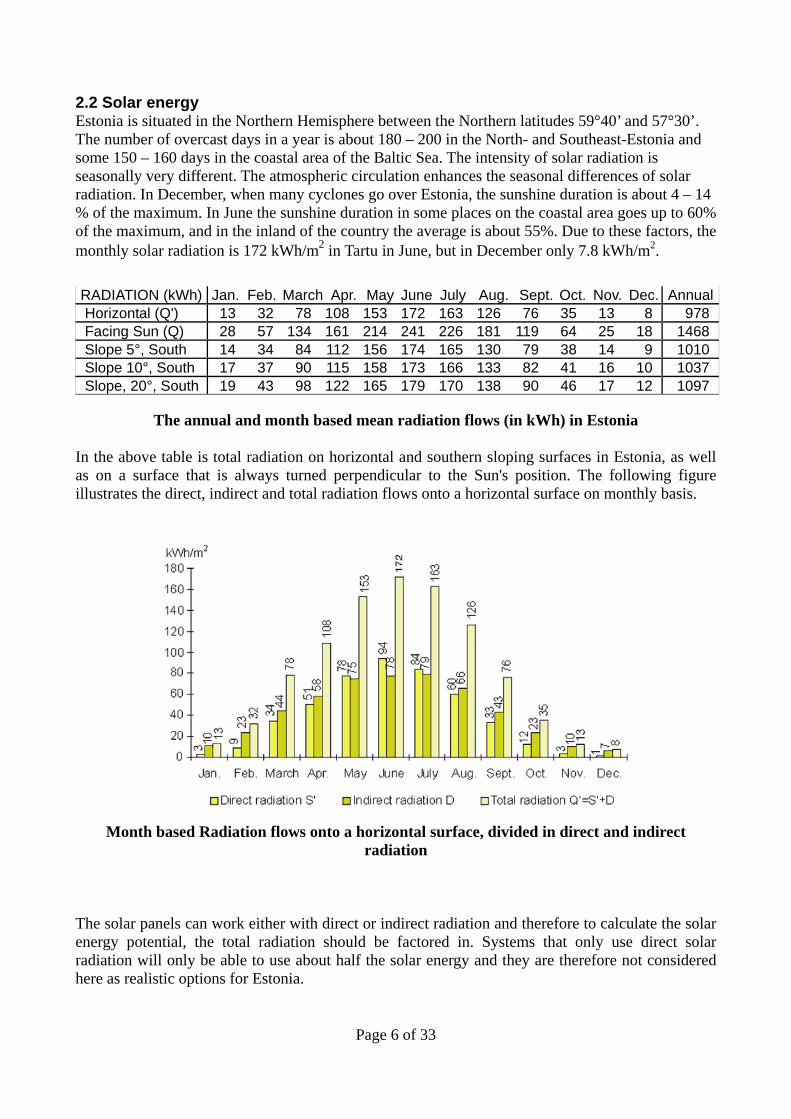
RADIATION (kWh) Jan. Feb. March Apr. May June July Aug. Sept. Oct. Nov. Dec. AnnualHorizontal (Q') 13 32 78 108 153 172 163 126 76 35 13 8 978 Facing Sun (Q) 28 57 134 161 214 241 226 181 119 64 25 18 1468 Slope 5°, South 14 34 84 112 156 174 165 130 79 38 14 9 1010 Slope 10°, South 17 37 90 115 158 173 166 133 82 41 16 10 1037 Slope, 20°, South 19 43 98 122 165 179 170 138 90 46 17 12 1097
The annual and month based mean radiation flows (in kWh) in Estonia In the above table is total radiation on horizontal and southern sloping surfaces in Estonia, as well as on a surface that is always turned perpendicular to the Sun's position. The following figure illustrates the direct, indirect and total radiation flows onto a horizontal surface on monthly basis.
Month based Radiation flows onto a horizontal surface, divided in direct and indirect radiation
The solar panels can work either with direct or indirect radiation and therefore to calculate the solar energy potential, the total radiation should be factored in. Systems that only use direct solar radiation will only be able to use about half the solar energy and they are therefore not considered here as realistic options for Estonia.

Page 7 of 33
For south sloping solar photovoltaic (PV) panels the annual energy input will be about 1050 kWh/m2, depending on the slop. Assuming an average efficiency of PV panels to be 13% and that the efficiency for the rest of the system is 90%, the annual value for the converted energy equals to 120 kWh/m2. Considering that in realistic systems one can not use all the energy without additional losses, the annual technical potential for PV panels could be taken equal to 100 kWh/m2. For solar heating the efficiency is higher, and while it varies substantially from application to application and with the load of the individual system, we estimate the average efficiency to be about 33%. This gives the annual technological solar thermal potential the quantitative value 350 kWh/m2 for systems with south sloping collectors. Individual systems can have higher efficiency, if they are sloping more than 20'C South, and/or if they have low operating temperatures and/or they have very high efficiency, such as vacuum tube collectors. Estonia does not have any historic experience in solar energy exploitation, except for the heat supply for greenhouses. The first steps in solar energy use have been done some 15 years ago. In 1995, Vändra Hospital has been provided with a solar panel for central heating system with the surface area of 40 m2. It came as a humanitarian aid from Swedish Nynäshammi Commune. The solar system is linked to the common central heating system of the building, run on fossil fuel. As a two-stage heat transfer system is used with antifreeze in the outdoor circuit, the system can be kept in service even in the wintertime. The biggest present solar heating system was commissioned in 2009 in Tallinn on the roof of a residential building, consisting of 64 solar panels with 1920 vacuum tubes. The cost of the project was 100 000 EUR, covered by a bank loan. The total surface area of the system is 255 m2 and the peak energy output intensity is up to 1 MW. The planned annual energy delivery of the system is about 250 MWh, resulting of fossil energy saving in fiscal units up to 15 000 EUR. The calculated pay back period of the project is below 10 years. In addition to commercial projects there have been installed some home made solar panels for space heating in private residential buildings all over Estonia. For instance, there is a 12 m2 surface solar panel on the roof of a private resident house in Nõmme, covering the heat need of the house for the most part of a year. In addition to above given solar heat applications, photovoltaic modules have been taken into use in Estonian Naval Force to provide power supply for 36 lighthouses and naval signs. Concerning scientific research on solar energy systems, the Semiconductor Faculty of Tallinn Technical University is doing research on the efficiency rise of thin film photovoltaic elements. The use of photovoltaic modules for generating power into the common grid is economically not viable today in Estonia. If the cost of 1 MW solar power is 2.1 MEUR, we get that the production cost of 1 MWh in Estonia is 300 EUR which is six times more expensive than the Nord Pool average price. In spite of this, in the near future there will be 100 kW solar farm erected in Võru County in South-East of Estonia, to prove the point that photovoltaic energy is possible even in a place like Estonia. The solar modules of this farm, following the movement of the Sun, will be placed on 6 m high poles. The firm behind the project is Energy Smart Estonia, being a sister company to renowned Energy Smart. The cost of the project is about 400 000 EUR and factoring in planned 60 % donation, the calculated pay back period of the project would be 16 years. Producing domestic hot water in summer in Estonia is not a bad choice after all. It is accepted between the experts in solar energy usage that solar energy is capable of covering about the half of all the domestic hot water need in Estonia. If the solar collector is applied only to produce domestic hot water, the savings in total heat demand are in the range of 5 – 15 %, but if it can also supply space heating, the total saving is estimated to be in the range of 20 – 60 % of household heat consumption The heat energy cost produced on the basis of solar energy is not higher than produced by other energy sources in Estonia and definitely it is lower than the cost of heat energy produced
Page 8 of 33
by electricity. The average hot water consumption in Estonia is about 50 litres per capita and day. It means that the heat energy need for domestic hot water per capita is about 4 MWh/year. As the Estonian adult population in Estonia is 1.1 million, we get that on the basis of solar energy one can cover annually about 2 TWh of the heat energy need in Estonia, if all would use it in hot water supply. Considering that the technical solar heat potential in Estonia is 350 kWh/m2, the needed surface area for producing 2 TWh solar heat, would be 5.5 km2. But in 2000 the surface area of dwellings in Estonia was 35.8 km2. Therefore only 15% of total roof area of dwellings is needed to produce this amount of solar heat and this is rather realistic to achieve without resorting to some complicated construction work for installing the needed solar heat panels. In this scenario we set the solar heat energy annual potential in Estonia to 2 TWh. While this in theory could all be used for domestic hot waster, realistically it would be used for a range of applications, including domestic use, service sector including swimming pools, and industries that use low-temperature heat. Considering that the solar photovoltaic energy efficiency potential in Estonia is 100 kWh/m2 and covering 20% of the total roof area of dwellings in Estonia, we get that the solar photovoltaic power potential in Estonia will be about 0.7 TWh. Since there is little experience with solar energy in Estonia today, and the economy for PV installations is not very promising, a gradual development is expected, see table below.
Summary of potential solar energy development in Estonia 2010 2020 2030 2040 2050
Solar heating, production
(TWh) 0 0.3 1.0 1.6 2
PV, production (TWh) 0 0.1 0.3 0.5 0.7
Sources for solar energy chapter:
1. Report. Sustainable Energy Alternatives for the Baltic States, The Regional Environmental Center for Central and Eastern Europe, 1998,
2. Statistical database of Statistics Estonia; http://pub.stat.ee 3. Rummel, L. (2008), Taastuvates allikatest elektri tootmise võimalused Eestis (Electricity
production from renewable energy in Estonia), Tallinn Technical University. 2.3 Bioenergy About 50% of the total land area of Estonia is covered by forest and this fact tells that biomass is by far the foremost renewable energy resource in Estonia. Due to rather low population density and moderate climate the fertile soil covers the majority of the Estonian territory. The Estonian biomass resource can be divided into four main categories: wood, peat1, agricultural waste and unused agricultural land.
1 The inclusion of peat has been debated, as historically the unsustainable use of peat have have lead in some
countries to depletion of the resources, similar to fossil fuel use, but as theoretically peat can be used in sustainable way, the potential is not excluded from this chapter.
Page 9 of 33
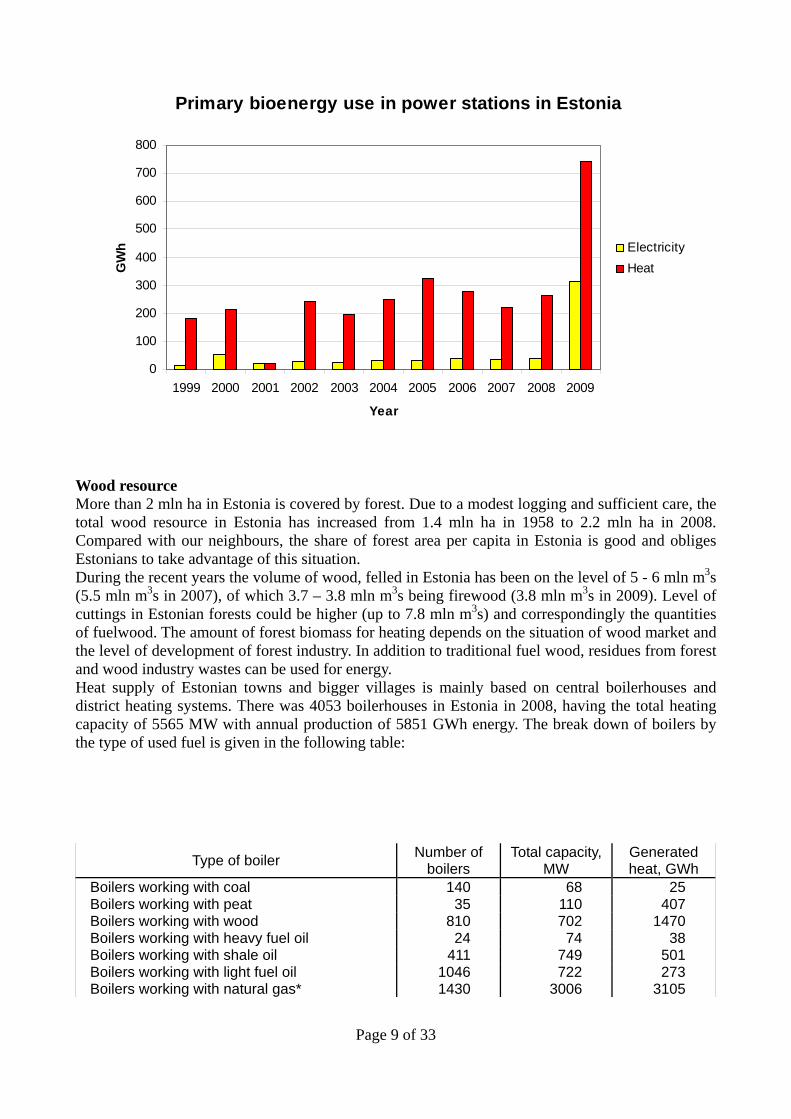
Primary bioenergy use in power stations in Estonia
0
100
200
300
400
500
600
700
800
1999 2000 2001 2002 2003 2004 2005 2006 2007 2008 2009
Year
GW
h ElectricityHeat
Wood resource More than 2 mln ha in Estonia is covered by forest. Due to a modest logging and sufficient care, the total wood resource in Estonia has increased from 1.4 mln ha in 1958 to 2.2 mln ha in 2008. Compared with our neighbours, the share of forest area per capita in Estonia is good and obliges Estonians to take advantage of this situation. During the recent years the volume of wood, felled in Estonia has been on the level of 5 - 6 mln m3s (5.5 mln m3s in 2007), of which 3.7 – 3.8 mln m3s being firewood (3.8 mln m3s in 2009). Level of cuttings in Estonian forests could be higher (up to 7.8 mln m3s) and correspondingly the quantities of fuelwood. The amount of forest biomass for heating depends on the situation of wood market and the level of development of forest industry. In addition to traditional fuel wood, residues from forest and wood industry wastes can be used for energy. Heat supply of Estonian towns and bigger villages is mainly based on central boilerhouses and district heating systems. There was 4053 boilerhouses in Estonia in 2008, having the total heating capacity of 5565 MW with annual production of 5851 GWh energy. The break down of boilers by the type of used fuel is given in the following table:
Type of boiler Number of boilers
Total capacity, MW
Generated heat, GWh
Boilers working with coal 140 68 25 Boilers working with peat 35 110 407 Boilers working with wood 810 702 1470 Boilers working with heavy fuel oil 24 74 38 Boilers working with shale oil 411 749 501 Boilers working with light fuel oil 1046 722 273 Boilers working with natural gas* 1430 3006 3105

Page 10 of 33
Boilers working with electricity 147 22 12 Boilers working with shale oil gas and biogas 6 110 15 Boilers working with vegetable biomass** 4 3 2 TOTAL 4053 5565 5851
Usually only 50% of the installed capacity of the boilers is used, which gives the possibility to decrease the capacity when converting the boilers from fossil fuels to bioenergy. The main use of wood as an energy resource can be established through burning wood waste from timber and paper pulp industry. There is no need to make or import special boilers for burning wood waste; the only thing needed to do is to convert the existing boilers for burning chipped wood waste. As Estonia has sufficient resources of wood fuel for supplying boilerhouses, just after the re-establishment of independence in 1991, to ensure the energy supply and improve the environmental conditions, a program has been launched by the Estonian Government to convert the boilers from imported fossil fuel to domestic biofuel. Though there is an unutilised potential of fuelwood in Estonian forests, due to the environmental reasons there are limitations. The quantities of forest biomass for heating also depend on the wood market. In this situation it is necessary to seek for alternative resources of bioenergy. In spite of some progress in using chipped wood waste in local boiler houses, there is still a very long way to go for using the full potential of Estonian wood resource for energy supply. Though the bulk of firewood and wood chips is already in use for producing heat energy, logging residues is still practically unused. According to the research results of the Estonian University of Live Sciences the theoretical felling residues resource at the current level of wood felling is about 1.5 mln m3s. This capacity is equivalent to 3012 GWh primary energy and it is possible to add to this resource the conifer stumps in the amount of 0.48 mln m3s (equivalent to 964 GWh of primary energy) and 0.5 mln m3s of bark (equivalent to 1004 GWh of primary energy). Thus the total spin off wood resource in energy units is 4980 GWh. The next table gives us an overview about the annual wood resource by felling:
Wood resource in 2006
Resource Protected for environmental reasons Permitted for consumption
Assortment 1000
m3s/year GWh/year
1000
m3s/year GWh/year % 1000 m3s/year GWh/year
Timber 8526 1082 13 7443 Firewood 1318 2748 355 74 27 963 2008 Logging residues
1764 3187 260 470 15 1504 2717
Conifer stumps
568 1026 87 158 15 480 868
TOTAL 12175 6960 1784 1367 20 10391 5594 In addition to resources, the future of fuelwood depends also from the prices. If to increase the share of the local manufactures in the conversion process, the cost of fuelwood based energy could be decreased. The next Table gives us an overview of the fuel price comparison in Estonia

Page 11 of 33
Fuel comparison table
Fuel Moisture content %
Heat value LHV MWh/t
Fuel density kg/m3
Fuel price EUR/t Price per MWh
Straw/hay/chaff 15-18 4,0-4,17 100-135 11.2 5.8
Wet biofuel/biomass (chips,bark,sawdust) 45-60 2,2-2,6 280-
300 17.0 9.5
Dry shavings 8-20 4,2 180 11.2 Woodpellet 6-8 4,8 660 121.4 29.4 Sod peat 35-40 3,3 387 21.5 8.6
Milled peat 45-50 2,6 341 14.0 7.7 Heavy oil - 9,6 960 300.3 31.6 Light oil - 11,5 840 524.0 49.2
Natural gas (m3) - 0,0076 - 0.3 35.8 Liquid gas - 13 - 824.3 63.3 Electricity - - - 70.3
Wooden biomass on forest land
340000342000344000346000348000350000352000354000356000358000360000362000
2000 2001 2002 2003 2004 2005 2006 2007 2008 2009
Year
Thou
sand
tons

Page 12 of 33
Total felllng in thousand cubic meters
0
2000
4000
6000
8000
10000
12000
14000
1999 2000 2001 2002 2003 2004 2005 2006 2007 2008
Year
Thou
sand
cub
ic m
eter
s
Total felling in Estonia in 2007 was 5.5 mln m3s of which 3.7 mln m3s was firewood. As Estonian Forestry Master Plan establish an optimal felling about 13 mln m3s annually for the period 2001 – 2010, then as one can see, the actual felling in 2007 was only half of that level. Relying on the results of Estonian Institute of Economic Research, the felling amount of firewood was 1594 thousand m3s above the sustainable felling capacity in 2006. At the same time the felling for timber was only 50% of the sustainable logging level. It means that felling capacity can be increased by 2032 thousand m3s annually. Therefore the current unused wood resource in energy units is equal to 9060 GWh. Therefore the total spin off wood resource is about 14 TWh.
Planned power stations in Estonia running on biomass:
Power station Capacity in MW
Planned annual production in GWh
Date of commissioning Promoter
10% biomass in Narva thermal power stations 43.0 364 2012 Eesti Energia Ltd
Pärnu bioCHP 25.0 212 2011 Fortum Termest Ltd Ahtme bioCHP 18.0 152 2011 Eesti Energia Ltd Kuressaare bioCHP 2.5 21 2011 Kuressaare Soojus Ltd Small bioCHP 1.5 12 2010 Many small firms TOTAL 90.0 761
Brushwood. From the low land areas, covered with bushes and scrubs, one can produce by rough estimation up to 0.7 mln m3s solid volume firewood. Unfortunately, the exact brushwood potential in Estonia is not yet clarified. Even less than fifty years ago the brushwood was cut into faggots to use as fuel together with firewood. Alone in the region of Matsalu one can provide annually up to 2 thousand tons of biomass from brushwood which is equivalent in energy terms to 2.3 GWh and one can run a 0.7 MW boiler on it.
Energy forest. In the situation of decreasing agricultural production one of the possible alternatives for abandoned agricultural lands is energy wood production, based on grey alder. It decreases the

Page 13 of 33
import of fossil fuels, improves environmental conditions and solves the problems of employment in rural areas. Unfortunately, the growing of energy forest is still not developed in Estonia with only some test areas planted with the total surface area of about 10 ha, some of these as part of the sewage water cleaning system. But in principle, the energy forest yield can be up to 15 tons of biomass per ha in Estonia. The energy forest potential in Estonia is evaluated to be up to 11.3 TWh. Peat. The Estonian peat resource share in the global peat resources is about 0.8%. Natural conditions for the formation of peat and bogs are favourable in Estonia. The mires have mainly been developed by overgrowing of water bodies or by mineral lands turning into mires. Peat reserves are divided into two categories according to its decomposition state:
• White peat which has a limited decomposition.
• Well decomposed black peat as a biofuel.
Peat production
0
200
400
600
800
1000
1200
1400
1992 1993 1994 1995 1996 1997 1998 1999 2000 2001 2002 2003 2004 2005 2006 2007 2008 2009
Year
Thou
sand
tons

Page 14 of 33
Electricity and heat production from peat
0
20
40
60
80
100
120
140
160
180
1999 2000 2001 2002 2003 2004 2005 2006 2007 2008 2009
Year
GW
h Electricity
Heat
Estonian peat resource contains of 4 629 mires and the peat industrial layer area is about 0.7 million ha. The current figure for the active industrial fuel peat resource in Estonia is 244 Mt. In 1992, a special peat energy programme was launched aiming at producing energy by using peat and chopped wood. According to this programme, it is possible to extract fuel peat in 102 natural mines, spread on an area of 66 000 ha. Peat has been listed as an Estonian mineral resource and used in Estonia over a long period, the first peat factory established already in 1913. To date peat has been worked up into the following main categories:
• Milled peat produced for litter and fertilisers.
• Block peat produced for horticulture.
• Milled fuel peat produced to make peat briquettes.
• Sod fuel peat.
With peat there is not a very clear cut watershed between renewables and fossil fuels. Much depends on the consumption rate. Peat is a good example as a fuel which is very vulnerable about the consumption rate and therefore depending on it, peat can serve either as a renewable biomass or as a fossil fuel. Therefore one should be very careful with calculating the annual increment for peat to determine the critical consumption rate to make peat a renewable biofuel. Assuming that the average annual increment of a mire area peat layer is 1mm and considering that 22% of Estonian territory is covered by mires, we get for the theoretical annual upper limit for the increment of peat in Estonia 1.7 Mt. The total technical sustainable annual peat resource is estimated to be some 1.4 million tons of which 85% is fuel peat (1.2 mln tons). As the mining level of peat in Estonia in 2008 was 0.35 Mt, then in relation to this consumption level peat can be considered among renewables in Estonia. Taking the calorific value of peat equal to 3.1 MWh/t and considering that currently in practice half of the mined peat is used for energy purposes, we get for the upper limit of domestic sustainable peat based biofuel in energy units 0.5 TWh. Reed. More than 20% of Estonian territory is covered by wetland and it means that the potential biofuel resource is even much bigger than the biomass determined only by the forested area. Though one can witness certain success in converting local boiler houses to wood chips, the use of biomass from wetland is still an unbeaten track in Estonia. The peculiarity of the wetland of

Page 15 of 33
Matsalu Nature Reserve is that the characteristic features of several biotopes at the Nature Reserve (water-meadows, coastal pastures and meadows etc.) can be preserved only by human activity. Without human activity, the landscape, including also coastal pastures and meadows would go through changes and these areas would be soon covered with junipers. It means that the reed stands of the wetland should be mowed regularly anyway and the only problem is what to do with the yield. The use of reed based biomass from the wetland of Matsalu Nature Reserve as biofuel would be ground breaking in Estonia, having not only the local economic effect and its contribution to the welfare of the environment is not limited to the region but encompasses the whole area of Estonia. The area of the Matsalu nature reserve (40,000 ha) forms the greater part of the total area of the wetland (49,000 ha). The remaining part (9, 000 ha) forms a protection area for the reserve. The most natural and characteristic biotopes at Matsalu are undoubtedly the reed stands, covering almost 3,000ha.
The reed harvesting in Matsalu goes back to the Middle Ages and even before that. The main goal of the reed harvesting was to obtain material for hatched roofs but some time it was needed to cut tracks in the reed fields for fishermen as well. The reed cutting is economically justified and environmentally benign activity even now but only less than 1% of the total areas of reed stands is cut nowadays on commercial basis. In spite the fact that reed harvesting is now economical undertaking (export to Germany and Denmark), it can be much more escalated if it were possible to use better technical equipment to that end and get low interest loans. Unfortunately, not all the reed in the wetland of Matsalu Nature Reserve is suitable for hatched roofs. Therefore, it is needed to find some other practical usage for reed as well. The most perspective of these new choices is, indeed, the use of reed biomass as a biofuel for space heating in the local area of Matsalu. It is not only a good chance to run Matsalu Nature Reserve in sustainable way in terms of energy but also a substantial help to alleviate the space heating problems of nearby human settlements. The annual potential of heat delivery from biofuels of the Matsalu wetland is sufficient to cover the full need for space heating and hot water for the nearby Lihula community and the town. Fortunately, in 2009 refurbished Lihula 1.8 MW boiler house started to use local reed, hay and straw as fuel. Agricultural waste. The bulk of agricultural waste is straw and animal manure. The straw production within the period 2004 – 2006 was in average about 674 000 tons annually. In energy terms it is equal to 3200 GWh. If to use 50% of the produced straw on energy purposes, the energy potential of straw will be up to 1600 GWh. In maximum 86% of this energy can be converted to heat and taking the conversion efficiency into electricity equal to 30%, it is possible to produce 480 GWh electric energy. In all Estonian livestock and poultry farms 2 099 189 tons of manure was produced in 2006. The biogas production in energy terms on basis of this manure quantity would be as much as 400 GWh. If 50% of this energy would be available for producing biogas, the resulting energy of it would be 200 GWh. Agricultural land resource. A rapid decline in agricultural land use has occurred in Estonia since the restoration of independence in 1991. The scale of this decrease in arable land was the most drastic change in the whole of Europe, and was higher than other post-Soviet European countries by a factor of 3.9. The use of abandoned agricultural areas is considered as one potential way of increasing bio-energy production. General review of land resources in 2007 has made according to the Estonian Basic Map. The total potential land resource for biomass production is in Estonia approximately 3.7 mln ha. The largest share of it is covered by forests (2.4 mln ha). Absolutely unused agricultural land resource in Estonia is rather large: 123 187 ha. It makes 15% of the total agricultural land in Estonia. In
Page 16 of 33
addition to that there are 160 000 ha unused agricultural land that is partly in use and 110 000 ha agricultural land which is cultivated only for the reason of maintaining the ecological balance of the herbal system. Thus the unused agricultural land resource is about 0.4 mln ha, which is almost one third of the total agricultural land in Estonia. Potential land resource in 2007 for growing biomass for forestry, agriculture and energy production
in thousand ha
Forest Brushwood Abundant peat fields Total agricultural
land
Unused agricultural land
TOTAL
2406.1 7.6 3.0 1270.3 409.6 3687.0
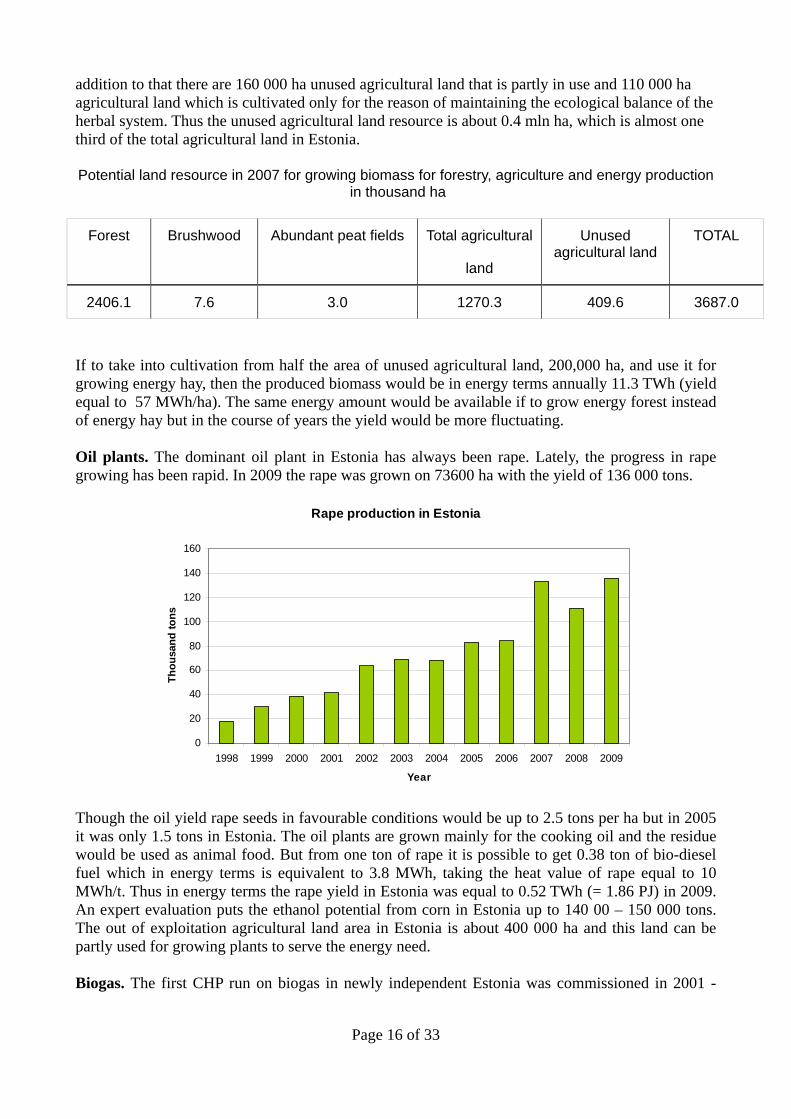
If to take into cultivation from half the area of unused agricultural land, 200,000 ha, and use it for growing energy hay, then the produced biomass would be in energy terms annually 11.3 TWh (yield equal to 57 MWh/ha). The same energy amount would be available if to grow energy forest instead of energy hay but in the course of years the yield would be more fluctuating. Oil plants. The dominant oil plant in Estonia has always been rape. Lately, the progress in rape growing has been rapid. In 2009 the rape was grown on 73600 ha with the yield of 136 000 tons.
Rape production in Estonia
0
20
40
60
80
100
120
140
160
1998 1999 2000 2001 2002 2003 2004 2005 2006 2007 2008 2009
Year
Thou
sand
tons
Though the oil yield rape seeds in favourable conditions would be up to 2.5 tons per ha but in 2005 it was only 1.5 tons in Estonia. The oil plants are grown mainly for the cooking oil and the residue would be used as animal food. But from one ton of rape it is possible to get 0.38 ton of bio-diesel fuel which in energy terms is equivalent to 3.8 MWh, taking the heat value of rape equal to 10 MWh/t. Thus in energy terms the rape yield in Estonia was equal to 0.52 TWh (= 1.86 PJ) in 2009. An expert evaluation puts the ethanol potential from corn in Estonia up to 140 00 – 150 000 tons. The out of exploitation agricultural land area in Estonia is about 400 000 ha and this land can be partly used for growing plants to serve the energy need. Biogas. The first CHP run on biogas in newly independent Estonia was commissioned in 2001 -

Page 17 of 33
2004 in Pääsküla outskirt of Tallinn with power capacity of 856 kW and heat capacity of 1050 kW. Tallinn Wastewater Treatment Plant in Paljassaare was reconstructed in 1993 to produce biogas. The biogas production capacity of the plant is 647 kW and the gas is used as a fuel for boilers and engines. The first CHP run on agricultural biogas in Estonia after regaining independence was commissioned in Valjala parish of Saaremaa, run on piggery manure with production capacity of 350 kW power and 420 kW heat. On the basis of manure, effluent and biodegradable waste it is possible to produce annually about 96 mln m3 biogas. This quantity of biogas is sufficient fuel for producing 236 GWh of electric energy with the total electric power up to 29.5 MW and 244 GWh of heat energy. On the basis of herb based biomass as maze, clover, hay, etc. one can get annually in average 2809 mln m3 biogas which can serve as fuel for producing 688 GWh electric energy and 710 GWh heat energy. Thus the whole theoretical biogas annual potential is 377 mln m3 to produce 924 GWh electric energy and 954 GWh heat. Municipal Waste. In 2008 the municipal waste production was 514600 tons from which 334200 tons was dumped into landfills and 123000 tons was recycled. In energy purposes only dumped in lanfills municipal waste can be used. Taking the average special heating value for municipal waste up to2.2 – 3.3 MWh/t, the dumped primary energy of dumped municipal waste in landfills was ca 920 GWh in 2008. It means that through a whole year it is sufficient to sustain a power station with capacity of 33 MW. The total capacity of planned incineration plants in Iru and Tartu is already 22 MW. If in addition to these two incineration plants to build a CHP in Väe, run on municipal waste and use the municipal waste for producing cement in Kunda, the needed amount of municipal waste will go up to 460 000 and it means that the whole municipal waste potential in Estonia will be taken into exploitation. Planned CHP plants:
Plant Capacity in MW
Planned annual production in GWh
Date of commissioning Promoter
Iru CHP on waste 15.0 127 2011 Eesti Energia Ltd Tartu CHP on waste 7.2 61 2012 Fortum Termest Ltd TOTAL 22.2 188
Summary. The actual share of biofuels in primary energy production was 8.8 TWh in 2008. The evaluation of the total annual common biomass resource in Estonia, based on data from different experts in the field, is in energy units 19.2 TWh:
Solid biomass, traditional Annual production in TWh Firewood 5.6 Logging residues 4.4 Industrial waste (solid) 5.0 Black alkali 0.3 Other biomass 2.8 Converted firewood 1.1 TOTAL 19.2
The untraditional annual solid biomass resource potential in Estonia is 13.4 TWh of which 2.1 TWh is usage of existing biomass production:
Other existing solid biomass Annual production in TWh Straw 1.5 Reed 0.6

Page 18 of 33
TOTAL 2.1
Potential new solid biomass production
Annual production in TWh
Energy plants on unused agricultural land
11.3
Following the above given analyses, the biogas potential in Estonia is about 1.9 TWh. The potential of liquid biofuel is equal to 0.6 TWh, based on expanding the cultivation area of rape seeds. Sources for bioenergy:
1. Statistical database of Statistics Estonia; http://pub.stat.ee. 2. Rummel, L. (2008), Taastuvates allikatest elektri tootmise võimalused Eestis (Electricity
production from renewable energy in Estonia), Tallinn Technical University.
3. Report. Sustainable Energy Alternatives for the Baltic States, The Regional Environmental Center for Central and Eastern Europe, 1998.
4. Muiste, P., Padari, A., Roostalu, H., Kriipsalu, M., Astover, A., Mitt, R., Pärn, L., Melts, I. Eestis olemasoleva, praeguse või juba kavandatud tootmise-tarbimise juures tekkiva biomassi ressursi hindamine (Evaluation of biomass production in Estonia at the current and planned production level), Estonian University of Life Sciences, Tartu 2007.
5. Kask, Ü. Biogaasi ressurss ja tootmine Eestis. Projekti W-fuel andmebaasi loomine (Biogas production and resource potential in Estonia. Project W-fuel database development), Tallinn University of Technology, Project W-fuel Info Day in Rakvere, 4.03.2010.
6. Pärn, L., Mitt, R, Muiste, P., Project report: Elektriliinide trassidelt saadava võsa energeetiline potentsiaal (The energy potential of brushwood from below the high voltage electric transmission lines), Tartu, 2010.
7. Muiste, P., Astover, A., Padari A., Roostalu, H., Kukk, L., Suuster, E., Ostroukhova, A., Melts, I. Maaressurss (Land resource), Estonian University of Life Sciences, Tartu 2007.
8. Project Bioenergy in Motion homesite: http://www.bioenergy-in-motion.com/.
2.4 Hydropower
Estonian rivers are small in size and flow. Due to the flat relief, terrain, the average inclination of the rivers is small. Therefore the capacity of the Estonian hydropower is small and there are no possibilities to install large hydroelectric plants. In spite of that hydropower has been in use in Estonia already for ages. The first recorded data about wheel water mills date back to the 13th century. In 1843, the water wheels installed in Narva (Kreenholm) were the biggest in the world at that time. In 1893, a hydroelectric power plant in Kunda was inaugurated with the output power of 200 kW. In 1936 the hydropower plant capacity provided 18% of the total power generating capacity in Estonia By the beginning of 1940 the total hydro power capacity was 27 MW.
Most of the Estonian hydroelectric plants were destroyed during the World War II. After the War,
Page 19 of 33
some of these were restored and even some new plants have been built. According to the former Soviet energy doctrine, only large energy systems were envisaged perspective. Therefore, all small waterpower plants were declared non-perspective. Almost all the hydroelectric plants have been taken out of service and left out of care.
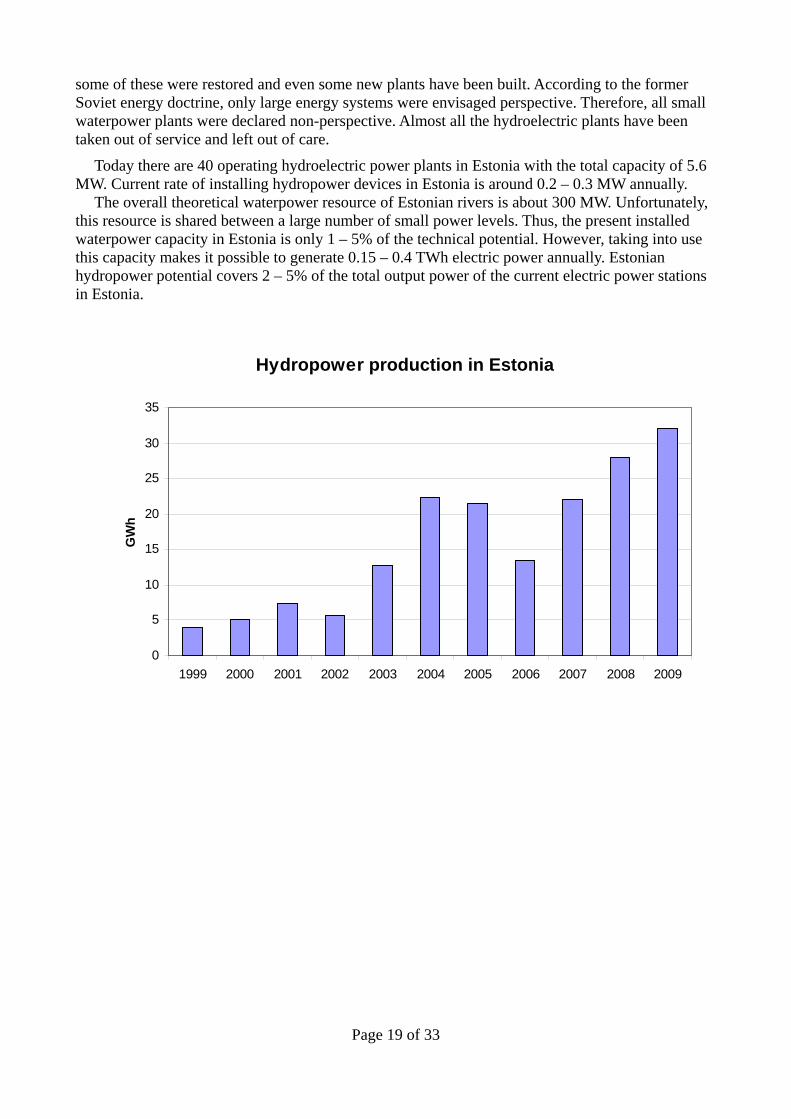
Today there are 40 operating hydroelectric power plants in Estonia with the total capacity of 5.6 MW. Current rate of installing hydropower devices in Estonia is around 0.2 – 0.3 MW annually.
The overall theoretical waterpower resource of Estonian rivers is about 300 MW. Unfortunately, this resource is shared between a large number of small power levels. Thus, the present installed waterpower capacity in Estonia is only 1 – 5% of the technical potential. However, taking into use this capacity makes it possible to generate 0.15 – 0.4 TWh electric power annually. Estonian hydropower potential covers 2 – 5% of the total output power of the current electric power stations in Estonia.
Hydropower production in Estonia
0
5
10
15
20
25
30
35
1999 2000 2001 2002 2003 2004 2005 2006 2007 2008 2009
GW
h
Page 20 of 33
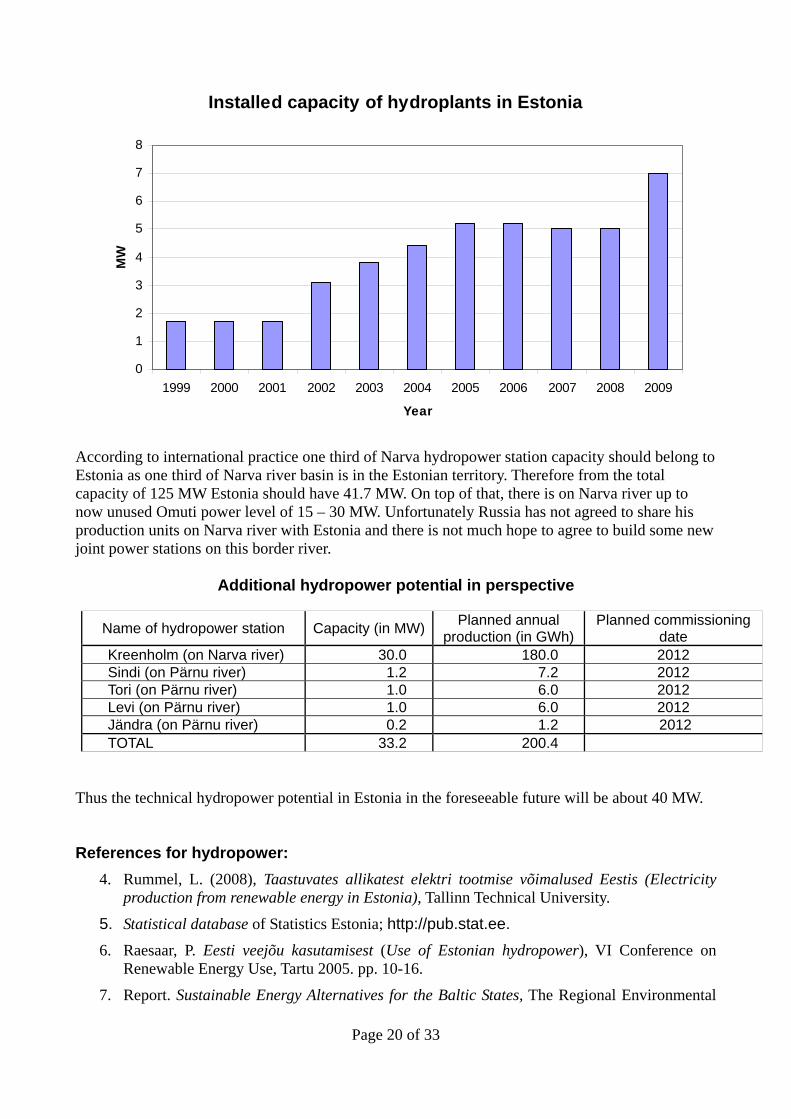
Installed capacity of hydroplants in Estonia
0
1
2
3
4
5
6
7
8
1999 2000 2001 2002 2003 2004 2005 2006 2007 2008 2009
Year
MW
According to international practice one third of Narva hydropower station capacity should belong to Estonia as one third of Narva river basin is in the Estonian territory. Therefore from the total capacity of 125 MW Estonia should have 41.7 MW. On top of that, there is on Narva river up to now unused Omuti power level of 15 – 30 MW. Unfortunately Russia has not agreed to share his production units on Narva river with Estonia and there is not much hope to agree to build some new joint power stations on this border river.
Additional hydropower potential in perspective
Name of hydropower station Capacity (in MW) Planned annual production (in GWh)
Planned commissioning date
Kreenholm (on Narva river) 30.0 180.0 2012 Sindi (on Pärnu river) 1.2 7.2 2012 Tori (on Pärnu river) 1.0 6.0 2012 Levi (on Pärnu river) 1.0 6.0 2012 Jändra (on Pärnu river) 0.2 1.2 2012 TOTAL 33.2 200.4
Thus the technical hydropower potential in Estonia in the foreseeable future will be about 40 MW. References for hydropower:
4. Rummel, L. (2008), Taastuvates allikatest elektri tootmise võimalused Eestis (Electricity production from renewable energy in Estonia), Tallinn Technical University.
5. Statistical database of Statistics Estonia; http://pub.stat.ee. 6. Raesaar, P. Eesti veejõu kasutamisest (Use of Estonian hydropower), VI Conference on
Renewable Energy Use, Tartu 2005. pp. 10-16.
7. Report. Sustainable Energy Alternatives for the Baltic States, The Regional Environmental

Page 21 of 33
Center for Central and Eastern Europe, 1998,
2.5 Overall renewable energy potential Though in principle there is also possible to include into renewable energy geothermal energy and wave power, the underground temperatures in Estonia are modest and the waves in the Baltic Sea have substantially less energy than in the oceans and thus these two sources are not included as realistic sources into the list of available renewable energy in Estonia in the coming decades. In the more distance future the low temperature geothermal energy might prove useful as an alternative source of low temperature heating to reduce the electricity need for the heat pumps. The overall renewable energy potential in Estonia is given in the following table:
Renewable Energy TWh
Windpower 8,8
Solar heat 1,9
Solar PV 0,7
Bio-fuel, liquid 0,6
Solid biomass 21,9
Biogas 1,9
Energy Forest 11,3
Hydro power 0,2
Total 47,3
Compared with the primary energy supply of 56 TWh in Estonia in 2009, the overall renewable energy potential is almost up to the current total primary energy demand.

Page 22 of 33
3. Demand of Energy Services Demand for energy services have been increasing in many economic sectors in Estonia in the last decade, including heated floorspace, electric appliences, equipment in service sector, industry and transport. Some of these above mentioned energy services have progressed slower and some faster than GDP in Estonia. The future trends of energy services will also be influenced by changes in social structure, satisfaction of certain demands and changes concerning the conversion of consumption society into creative society. The households’ floor area has increased 7.5% in the last decade but as the floor area per capita is till below the EU average, the special floor area is expected to increase about a percent annually.
Floor area of dwellings in thousand m2
1998 1999 2000 2001 2002 2003 2004 2005 2006 2007 2008 2009 201036460 36560 37280 37360 37430 37540 37760 38040 38370 38760 39320 39780 40086
Average floor area per inhabitant in m2
1998 1999 2000 2001 2002 2003 2004 2005 2006 2007 2008 2009 201026.2 26.5 27.2 27.3 27.5 27.7 27.9 28.2 28.5 28.9 29.3 29.7 29.9
The household demand for electricity has increased 26% in the last decade but as the energy efficiency has not changed, demand for electric energy services has increased 26%. It is expected that in the future the demand for electric energy services will be proportional to the increase in floorspace per capita.
The service sector demand for heat and fuel has increased about 60% in the last decade while demand for electricity has increased about 80% (increase until 2008, expected stable 2008-2010 because of the crisis). We expect these increases to continue in the coming decades.
In industry, the heat and fuel demand increased 25% while the electricity demand increased 28% in the period 2000 - 2008. This might have been caused by a 25% increase in production without any significant change in energy efficiency (actually 3% higher electricity demand relative to production). The industrial production volume is expected to remain more or less on the 2008 level.
The personal car ownership increased from 338 cars/1000 inhabitants in 2000 to 407 cars /1000 inhabitants in 2009 and thus there was 20% increase during the last decade. In the same period transport the energy demand in transport increased 71%. It is expected that the use of cars will remain on current level (43% higher level than the level in 2000).
Bus use fell 11% within the period of 2000 - 2009 but it is expected to have a further increase up to 40% by the year 2025 without any further increase.
Passenger train use fell 5% within the period of 2000 - 2009, but it is expected to have a further increase again up to 20% by the year 2020 and 50% by the year 2050.
Page 23 of 33
Road freight has increased 50% within the period of 2000 - 2005 but then had a setback within 2005 – 2009. In the future it is expected to increase again up to the 2005 without any further increase.
The rail freight will be expected to increase 30% by the year of 2050.
Page 24 of 33
4. Energy Efficiency Potential 4.1 Legal background for energy efficiency The most important official document concerning energy efficiency in Estonia is Estonian Energy Saving Action Program 2007 – 2013. This document is based on other Estonian documents linked to energy use in Estonia, the most important of which are the following:
• Long-term National Development Plan for the Fuel and Energy Sector Until 2015.
• Estonian electricity sector development plan 2005-2015.
• Estonian Environmental Strategy Until 2030.
• Estonian national sustainable development strategy “Sustainable Estonia 21.
• Estonian Housing Development Plan 2007-2013.
• Transport Development Plan 2006-2013.
• National Programme for Decreasing Greenhouse Gas Emissions 2003-2012.
• National Strategy for the Use of Structural Funds 2007-2013” and its divisional implementation plans.
• National Development Plan for the Use of Oil Shale 2007-2015. The main objectives of Estonian Energy Saving Action Program 2007 – 2013 are the following:
• The availability of energy-efficiency information.
• Availability of skills and experts.
• Increasing efficiency in the consumption, production and transfer of fuels and energy.
• Performing tasks arising from the European Union fuels and energy efficiency policy. The specific objectives of the Estonian Energy Saving Action Program are as follows:
• Keep the growth of the energy consumption at least twice as low as the growth of the gross domestic product.
• Ensure the fulfilment of 8 % CO2 emission reduction according the Kyoto protocol for the period of 2008 – 2012 compared with the year of 1990, increasing the efficiency of energy production and transport, using environmentally more benign fuels and reducing energy consumption in all economy sectors and households.
4.2 Energy efficiency development Estonia is ranked in respect of its GDP level in the fortieth place and in respect of energy efficiency in 94th place in the world. To produce the same amount of wealth, it is needed to use 5 – 6 times more energy in Estonia than in average in European Union. Comparison with Danes in energy efficiency gives even tenfold difference. When taking into account the carbon consumption of the economy (the relationship between the GDP corrected on the basis of purchasing power parity and the amount of carbon dioxin emitted into the atmosphere), Estonia is placed at the same level as the countries which are exporting fuel, and is 114th in the list of respective countries. Thus Estonia is classified as a country with relatively high energy consumption.

Page 25 of 33
Production of primary energy per capita
0.0
5.0
10.0
15.0
20.0
25.0
30.0
35.0
40.0
1999 2000 2001 2002 2003 2004 2005 2006 2007 2008 2009
Year
MW
h
The changes that have taken place since Estonia regained independence have also affected the relationship between energy and the economy. The energy consumption of the gross domestic product (GDP) has decreased annually; during the period 1993-2004 this indicator decreased by more than 1.8 times.
Energy intensity of economy
0.0
2.0
4.0
6.0
8.0
10.0
12.0
1999 2000 2001 2002 2003 2004 2005 2006 2007 2008 2009
Year
KW
h/EU
R
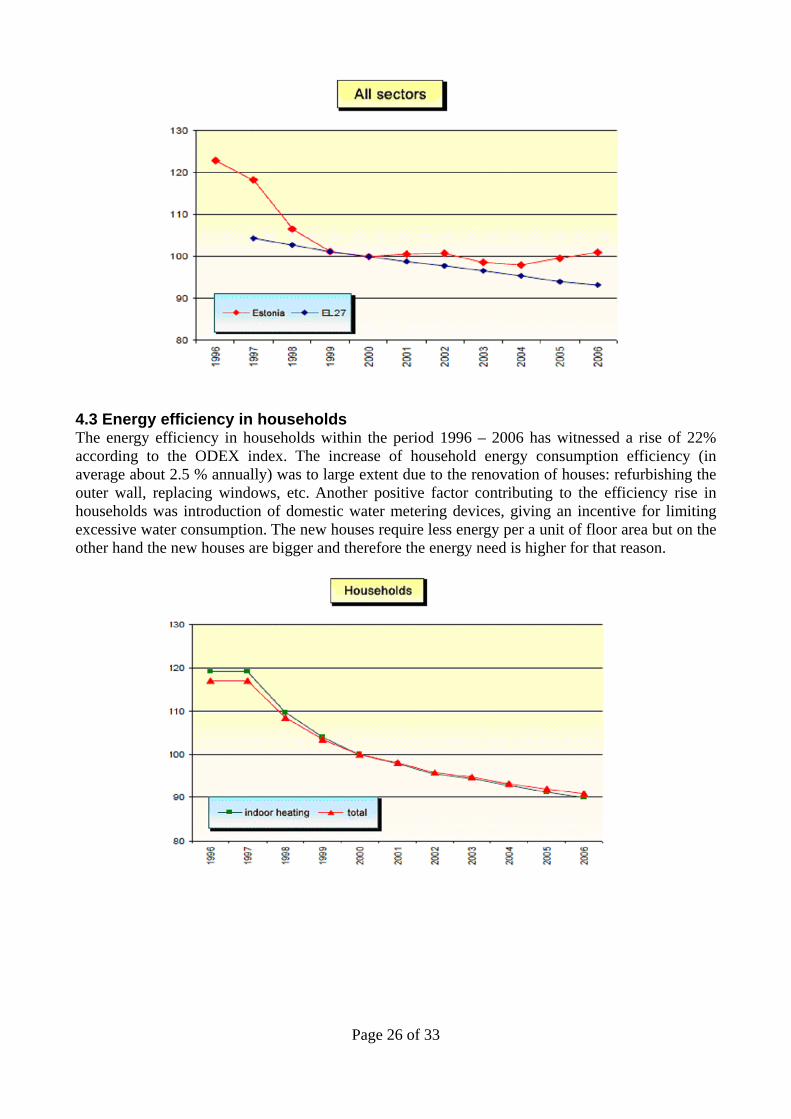
Within the period 1996 – 2006 the energy efficiency trend in Estonia has made a significant progress which is well reflected on the decrease of overall energy efficiency index ODEX by 18% (- 1.9 % annually). Since the year 2000 the ODEX index has been practically constant. Base year for ODEX index (= 100) was 2000.
Page 26 of 33
4.3 Energy efficiency in households The energy efficiency in households within the period 1996 – 2006 has witnessed a rise of 22% according to the ODEX index. The increase of household energy consumption efficiency (in average about 2.5 % annually) was to large extent due to the renovation of houses: refurbishing the outer wall, replacing windows, etc. Another positive factor contributing to the efficiency rise in households was introduction of domestic water metering devices, giving an incentive for limiting excessive water consumption. The new houses require less energy per a unit of floor area but on the other hand the new houses are bigger and therefore the energy need is higher for that reason.

Page 27 of 33
The break down of household dwellings in Estonia according to their age are given in the following table:
The breakdown of the number of dwellings by age in Estonia Period of building
Before 1919 Up to 1945 Up to 1970 1971 - 1990 Up to 1990 1991 - 2010
Percentage 9 % 24 % 54 % 41 % 95 % 5 %
Floor area of dwellings in thousand m2
1998 1999 2000 2001 2002 2003 2004 2005 2006 2007 2008 2009 201036460 36560 37280 37360 37430 37540 37760 38040 38370 38760 39320 39780 40086
Average floor area per inhabitant in m2
1998 1999 2000 2001 2002 2003 2004 2005 2006 2007 2008 2009 201026.2 26.5 27.2 27.3 27.5 27.7 27.9 28.2 28.5 28.9 29.3 29.7 29.9
As one can see, the bulk of the residential dwellings (95 %) are built before 1991 according to the former Soviet and pre-war building codes. Today the energy use in the residential sector in Estonia is rather lavish. The following Figure gives us a picture about the electric power and heat consumption in the residential sector in the years 1990 – 2008.
Consumption of heat and power in households
0.0
2.0
4.0
6.0
8.0
1990
1991
1992
1993
1994
1995
1996
1997
1998
1999
2000
2001
2002
2003
2004
2005
2006
2007
2008
2009
TWh
pow er
heat
In the years of former Soviet Union big block houses have been built by an outdated and unsatisfactory building code, not focused on energy saving. The building quality of these houses is low and worn off. Almost half of the residential housing stock is characterized by multi-flat panel houses with very thin insulated outer walls and by poor quality windows, causing high heat losses.

Page 28 of 33
The district heating systems for the residential sector is in disrepair, many badly needed meters missing. About 80% of the total energy that is used in the residential sector goes for space heating and domestic hot water. It means that the energy conservation policy should be focused on problems in this field of energy use.
The final energy use in the residential sector by fuel in 2008 is given in the following Figure.
Fuel consumption in households in 2008
Firewood34%
Light fuel oil7%
Diesel oil5%
Motor gasoline25%
Coal1% Peat briquette
1%
Briguette and pellets
1%
Wood chips and -waste10%
Wood waste10%Naurall gas
6%
As one can see, firewood is still the dominant fuel in heating houses and cooking in Estonia. Wood chips and wood waste has not been able to substitute firewood up to now. The use of natural gas is still not as extensive as the use of light fuel oil. The annual energy saving potential in the residential sector in Estonia is very high, amounting to 7.1 TWh (more than half of the final energy use in residential sector in 1995). But the implementation of all the measures to put this potential into practise requires very large investments, by far being above the facilities in Estonia nowadays. The realistic energy saving potential for the near future is considerable less in scope, being only 6% after the coming two year period, 24% in five years time and 44% in ten years time. A lot of educational work should be done to change the energy usage habits and customs among the population.
Within the framework of this Vision it is assumed 2% increase of efficiency within the period from 2010 to 2050. Taking into account the condition of residential buildings in Estonia in 2000, this is a rather conservative approach, but nevertheless will require joint actions with enhanced energy requirements for new buildings and enhanced renovation scope of existing buildings.
Household energy efficiency is expected to increase about 1% annually within the period of 2010 – 2050. 4.4 Energy efficiency in service sector The energy efficiency in the service sector is expected to follow the energy efficiency in the household sector, leading to a doubling of energy efficiency by the year 2050. This is well below
Page 29 of 33
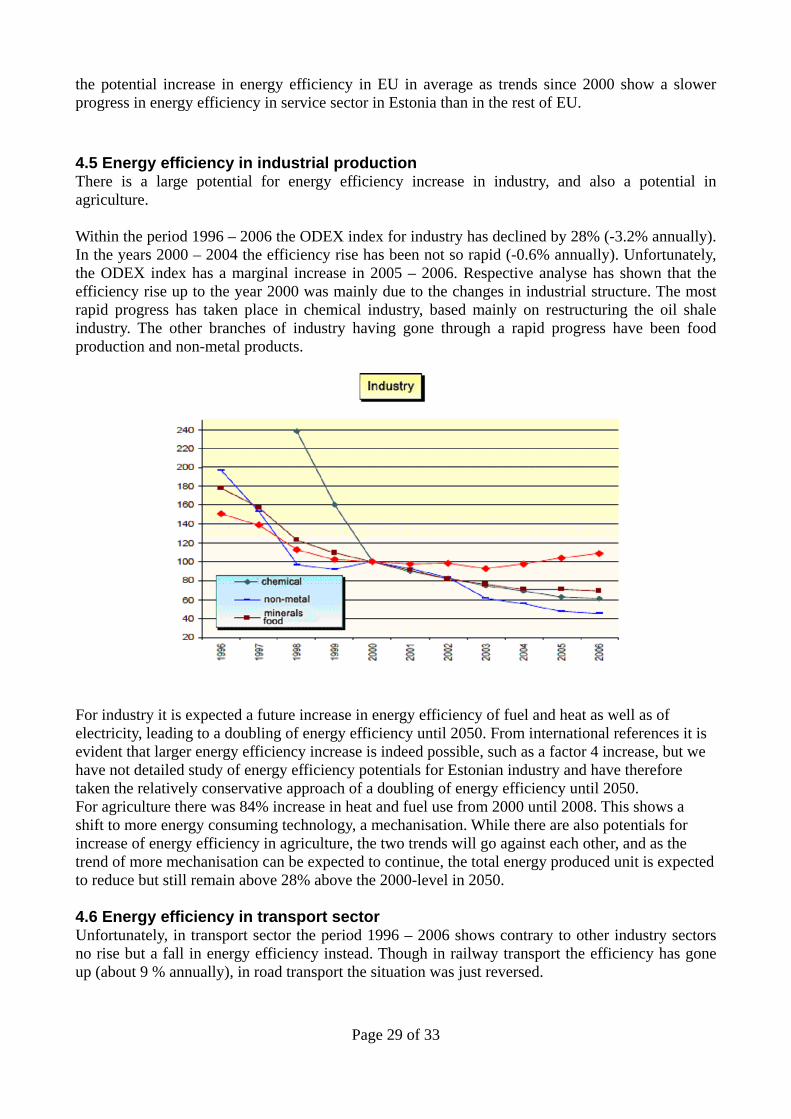
the potential increase in energy efficiency in EU in average as trends since 2000 show a slower progress in energy efficiency in service sector in Estonia than in the rest of EU. 4.5 Energy efficiency in industrial production There is a large potential for energy efficiency increase in industry, and also a potential in agriculture. Within the period 1996 – 2006 the ODEX index for industry has declined by 28% (-3.2% annually). In the years 2000 – 2004 the efficiency rise has been not so rapid (-0.6% annually). Unfortunately, the ODEX index has a marginal increase in 2005 – 2006. Respective analyse has shown that the efficiency rise up to the year 2000 was mainly due to the changes in industrial structure. The most rapid progress has taken place in chemical industry, based mainly on restructuring the oil shale industry. The other branches of industry having gone through a rapid progress have been food production and non-metal products.
For industry it is expected a future increase in energy efficiency of fuel and heat as well as of electricity, leading to a doubling of energy efficiency until 2050. From international references it is evident that larger energy efficiency increase is indeed possible, such as a factor 4 increase, but we have not detailed study of energy efficiency potentials for Estonian industry and have therefore taken the relatively conservative approach of a doubling of energy efficiency until 2050. For agriculture there was 84% increase in heat and fuel use from 2000 until 2008. This shows a shift to more energy consuming technology, a mechanisation. While there are also potentials for increase of energy efficiency in agriculture, the two trends will go against each other, and as the trend of more mechanisation can be expected to continue, the total energy produced unit is expected to reduce but still remain above 28% above the 2000-level in 2050. 4.6 Energy efficiency in transport sector Unfortunately, in transport sector the period 1996 – 2006 shows contrary to other industry sectors no rise but a fall in energy efficiency instead. Though in railway transport the efficiency has gone up (about 9 % annually), in road transport the situation was just reversed.

Page 30 of 33
With the introduction of EU regulation for car energy efficiency there are large potentials for energy efficiency in transport for the years to come. With switching over to electric and hydrogen vehicles, there will be possible even larger potential increases in energy efficiency. Therefore we assume large increase in energy efficiency in personal cars and in rail through the planned transition from motofuel to electric drive.
For personal cars it is expected a 25% increase in efficiency by the year 2020 and 66% increase by the year 2050 with 2000 as the base year.
For trains it is expected a 60% increase in energy efficiency until 2050, with 2000 as a base year.
For buses and trucks it is expected only a 30% increase in energy efficiency by the year 2050.
4.7 Efficiency in energy supply Efficiency in heat production had not changed significantly. Despite the changes in fuel use and the extended use of natural gas, the overall efficiency of boiler houses has not increased. But there are still sufficient technical choices for increasing the efficiency of boiler houses. The increase in the demand for heating has not yet brought with it a corresponding increase in the performance efficiency of boiler units, but rather has led to an extended use of outdated, inefficient facilities. During the period of 2001-2005 boiler units which were engaged in heating production were able to achieve as an output 81.1 – 85.1% of the energy contained in fuels. These boilers supply about 60% of the heat for district heating. Within the framework of the Vision it is expected that the old units will be replaced with new boiler units that will be more efficient, increasing average efficiency up to 89% by the year 2020 and 95% by the year 2050. The efficiency of the current combined heat and power (CHP) plants is about 70%. Within the framework of this Vision it is assumed a small improvement in efficiency till 2015, then a steady replacement of the old units with new units until 2030, reaching then an average electric efficiency level 45% with the total efficiency up to 85%. This is the expected to go up even to 47% electric efficiency and 86% total efficiency by the year 2050. This substantial increase in energy efficiency will be due to replacing oil shale by biomass and natural gas. The current thermal powerplants in Estonia have energy efficiency about 38% (in 2008). This efficiency level is expected to increase steadily up to 46% until 2030 and further up to 55% for the
Page 31 of 33
years 2040 and later. To ensure this substantial rise in efficiency, it is needed to replace the existing thermal power plants, substituting these by state of art powerplants run on biofuels. Both for new powerplants and CHP, the expected efficiencies are only achievable by switching over to the best available technology. In comparison with the year 2001, the electricity losses during transmission decreased by 19%, and heat losses during transmission by 17% by the year of 2005. The grid loss was 11% in 2008 and it is expected to reduce this figure down to 7% by the year 2050. Unfortunately, there are a lot of district heating systems in which the losses amount more than 20% of the heat transmission volume. According to the 2006 survey by the Ministry of the Environment, the share of these systems was equal to 38.2%. According to the national statistics the heat loss has decreased 22% within the period from 2000 to 2008, and the loss was only 10.4% of the total heat supply by district heating in 2008. Sources:
1. Odyssee database: http:// www.odyssee-indicators.org/.
2. Report. Sustainable Energy Alternatives for the Baltic States, The Regional Environmental Center for Central and Eastern Europe, 1998.
3. Statistical database of Statistics Estonia; http://pub.stat.ee. 4. Estonian Energy Saving Action Program 2007 – 2013.
5. Eesti Energia Ltd homepage; http// www.energia.ee

Page 32 of 33
5. Energy development prognoses Combining the expected development of energy services and energy efficiency proposed in the previous chapters, the final energy demand will look like as shown in the following chart:
The exposed system in the chart will be a substantially improved energy system with higher conversion efficiencies, lower losses, and use of heat pumps to collect energy from the ambient environment to add up to the renewable energy supply. This results in a substantially reduced primary energy demand according to the following chart:
Primary Energy Supply
0
25
50
75
100
125
150
175
200
225
250
2000 2005 2010 2015 2020 2025 2030 2035 2040 2045 2050
PJ
Coal, shale, peat
Oil
Natural Gas
Ambient via heat pumps
Wind, Solar, hydro
Biomass
The expected transition is accompanied with an increase in electricity use. The increase is caused by electric transport, increased use of heat pumps and some changes from fuels to electricity in industry.. The main increase in electricity use will be due after 2025 when the transport is expected to switch over to use electric drive.
2000 2005 2010 2015 2020 2025 2030 20350
20
40
60
80
100
120
140
Secondary Energy Divided in sectors
HouseholdsService sectorsAgriculture, fisheryIndustryTransport
PJ

Page 33 of 33
The extended reliance on wind and solar energy will increase the demand for a more flexible energy system as the current energy system in Estonia can balance no more than 750 MW windpower. It is expected to build heat pumps in district heating to increase demand side flexibility, and then use the heat pumps in case there is an overproduction of windpower. It is also proposed to develop a smart grid to regulate use of electricity, in particular for new facilities such as electric vehicles and heat pumps. Probably the cheapest electricity storage option would be a new pump storage plant which was discussed in 2.1. Without demand side management and heat pumps this storage plant should handle about 1600 MW, but with the demand side management and heat pumps in the district heating systems, it is needed to adjust only about 800 MW. According to the expected energy development, the resulting CO2 emissions from energy use are illustrated in the following chart.
02468
10121416
2000 2005 2010 2015 2020 2025 2030 2035 2040 2045 2050
CO2 emissions from energy consumption, million tons CO2/year
The sharp reduction of the emission in the coming decades is due to the proposed combination of measures for increasing energy efficiency of energy production and use, increasing the share of renewable energy, reconstruction of the power sector and a more modest increase of the energy service level than the case was in the last decade.


