39
Sustainable Healthcare
| Date post: | 27-Dec-2015 |
| Category: |
Documents |
| Upload: | alannah-carson |
| View: | 215 times |
| Download: | 0 times |

Sustainable Healthcare
Sponsored by:
The Corporate Realty, Design & Management Institute
CENTER FOR MAXIMUM POTENTIAL BUILDING SYSTEMS
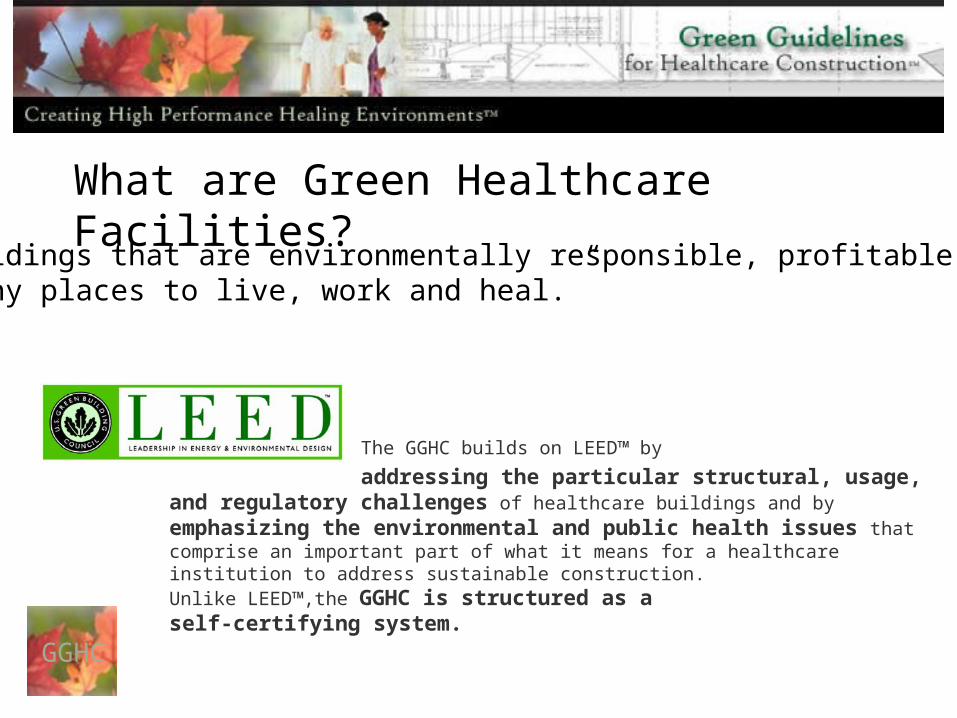
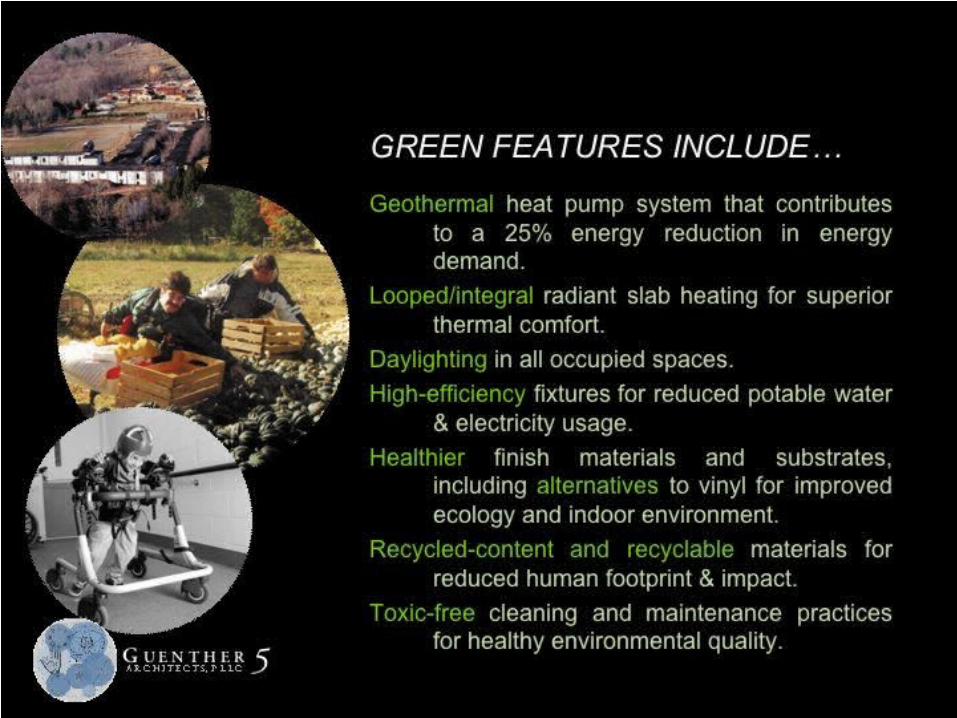
The GGHC builds on LEED™ by
addressing the particular structural, usage, and regulatory challenges of healthcare buildings and by emphasizing the environmental and public health issues that comprise an important part of what it means for a healthcare institution to address sustainable construction. Unlike LEED™,the GGHC is structured as a self-certifying system.
GGHC
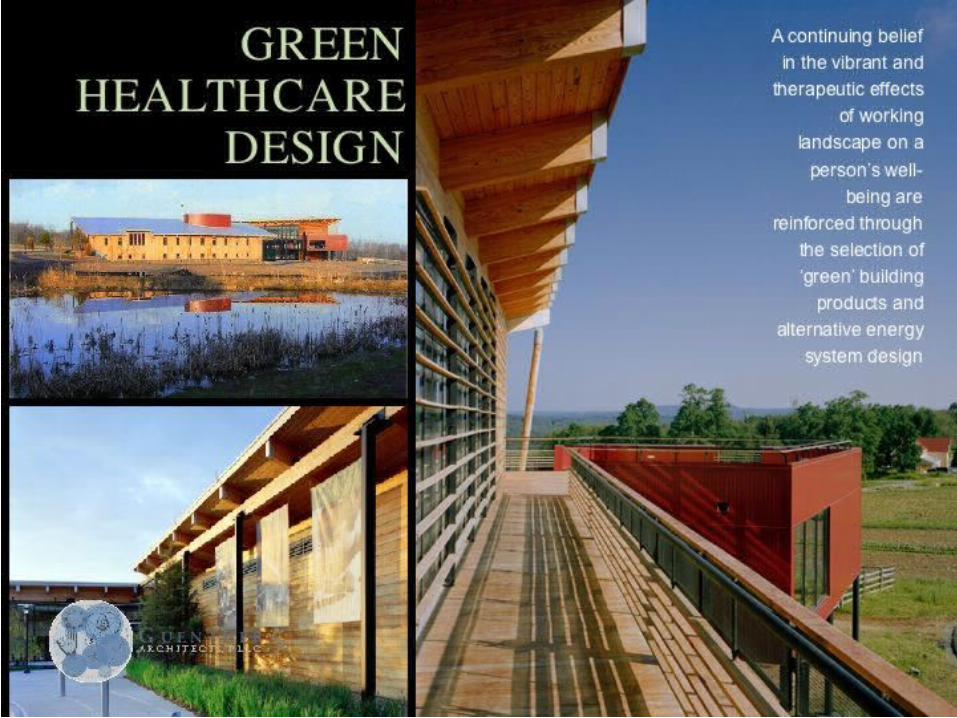
What are Green Healthcare Facilities?“…buildings that are environmentally responsible, profitable, and healthy places to live, work and heal.”
GGHC
sustainable
The Green Guidelines for Healthcare Construction seek to reward organizations that strive to engage in environmental stewardship, and that lead the healthcare industry toward high performance healing environments
GGHC
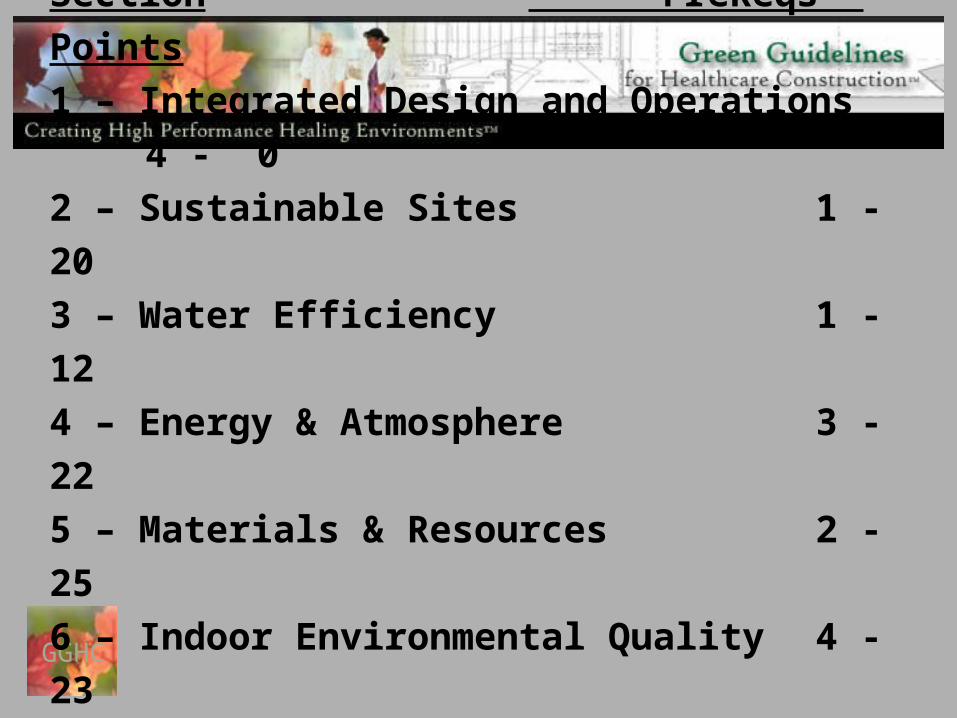
Section PreReqs - Points
1 – Integrated Design and Operations 4 - 0
2 – Sustainable Sites 1 - 20
3 – Water Efficiency 1 - 12
4 – Energy & Atmosphere 3 - 22
5 – Materials & Resources 2 - 25
6 – Indoor Environmental Quality 4 - 23
7 – Innovation 0 - 4
LEED for Healthcare Application Guide
Volunteer committee at work to develop application guide that will support healthcare facilities registered under LEED-New Construction.
Green Guidelinesfor Healthcare Construction
www.gghc.org
Download the draft nowRegister for version 1.0 Pilot - September, 04
GGHC
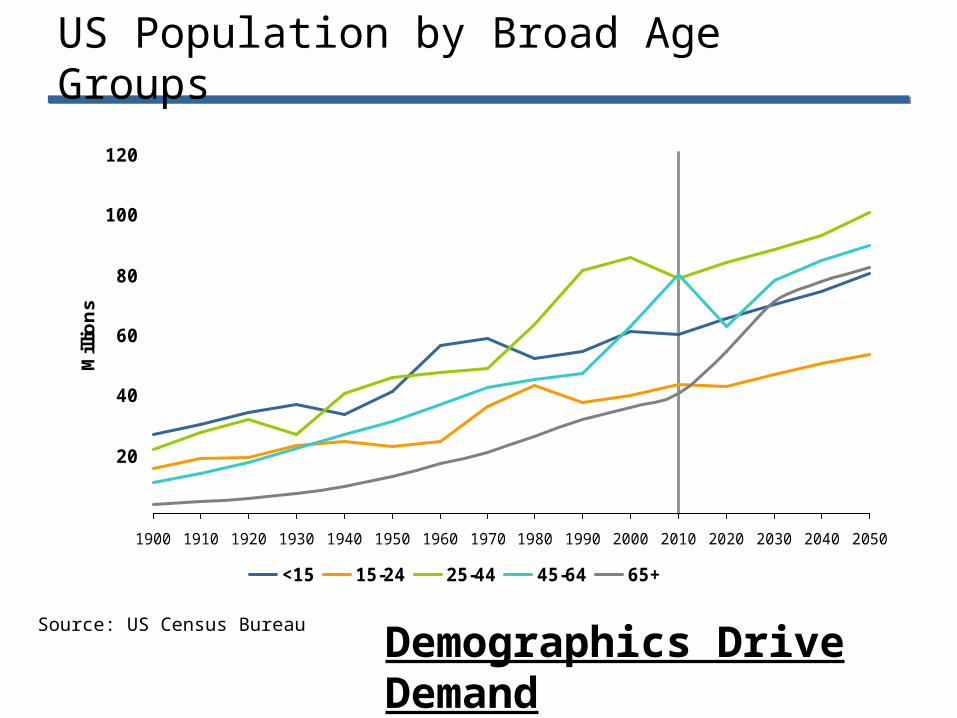
US Population by Broad Age Groups
20
40
60
80
100
120
1900 1910 1920 1930 1940 1950 1960 1970 1980 1990 2000 2010 2020 2030 2040 2050
Mill
ion
s
<15 15-24 25-44 45-64 65+
Source: US Census Bureau
Demographics Drive Demand
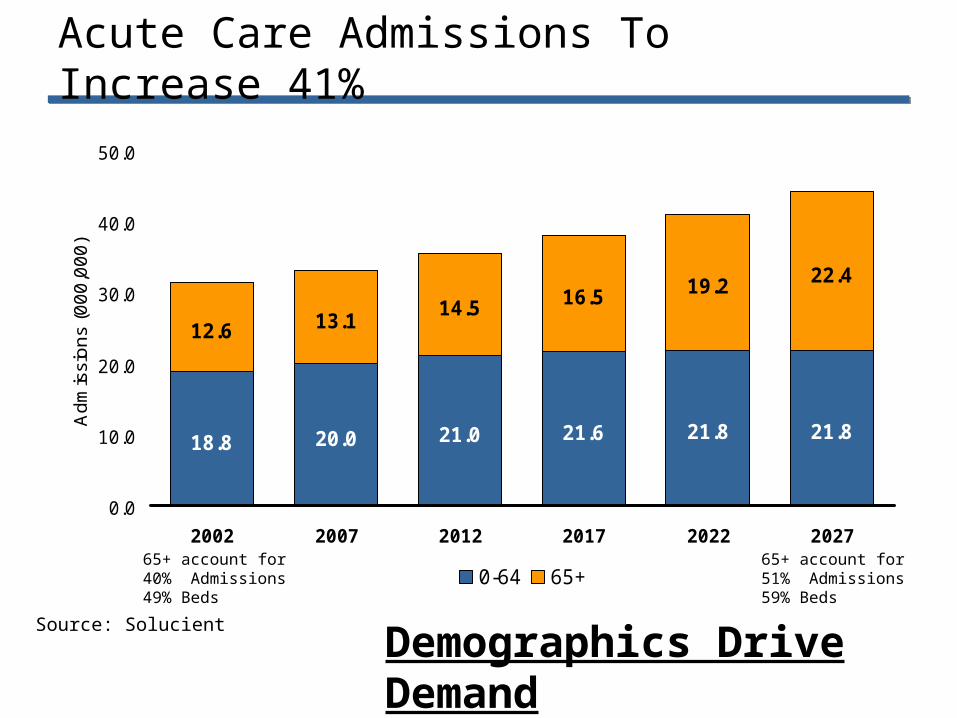
Acute Care Admissions To Increase 41%
18.8 20.0 21.0 21.6 21.8 21.8
12.6 13.114.5 16.5 19.2 22.4
0.0
10.0
20.0
30.0
40.0
50.0
2002 2007 2012 2017 2022 2027
Ad
mis
sio
ns
(00
0,0
00
)
0-64 65+65+ account for40% Admissions49% Beds
65+ account for51% Admissions59% Beds
Source: Solucient
Demographics Drive Demand
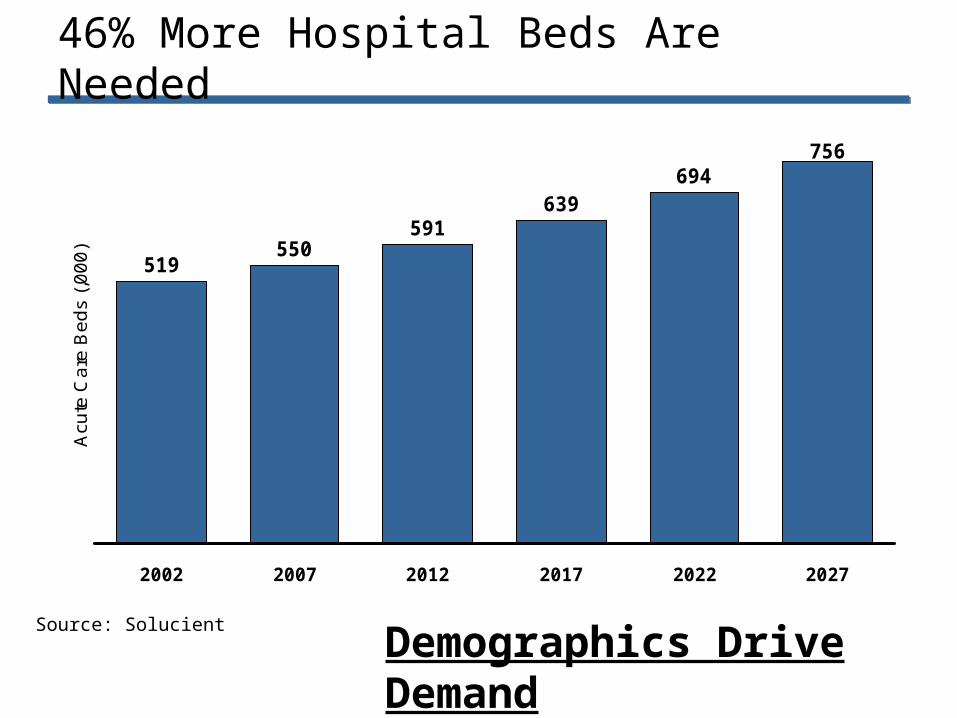
46% More Hospital Beds Are Needed
519550
591639
694756
2002 2007 2012 2017 2022 2027
Acu
te C
are
Be
ds
(,0
00
)
Source: Solucient
Demographics Drive Demand
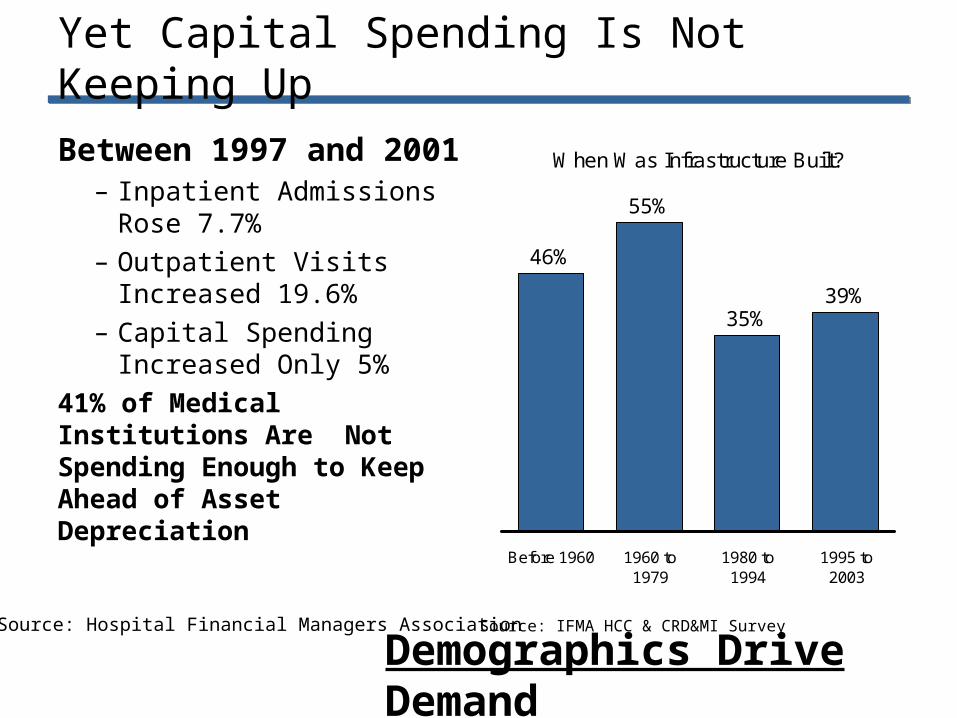
Yet Capital Spending Is Not Keeping Up
Between 1997 and 2001– Inpatient Admissions Rose
7.7%
– Outpatient Visits Increased 19.6%
– Capital Spending Increased Only 5%
41% of Medical Institutions Are Not Spending Enough to Keep Ahead of Asset Depreciation
When Was Infrastructure Built?
39%35%
55%
46%
1995 to2003
1980 to1994
1960 to1979
Before 1960
Source: IFMA HCC & CRD&MI SurveySource: Hospital Financial Managers Association
Demographics Drive Demand
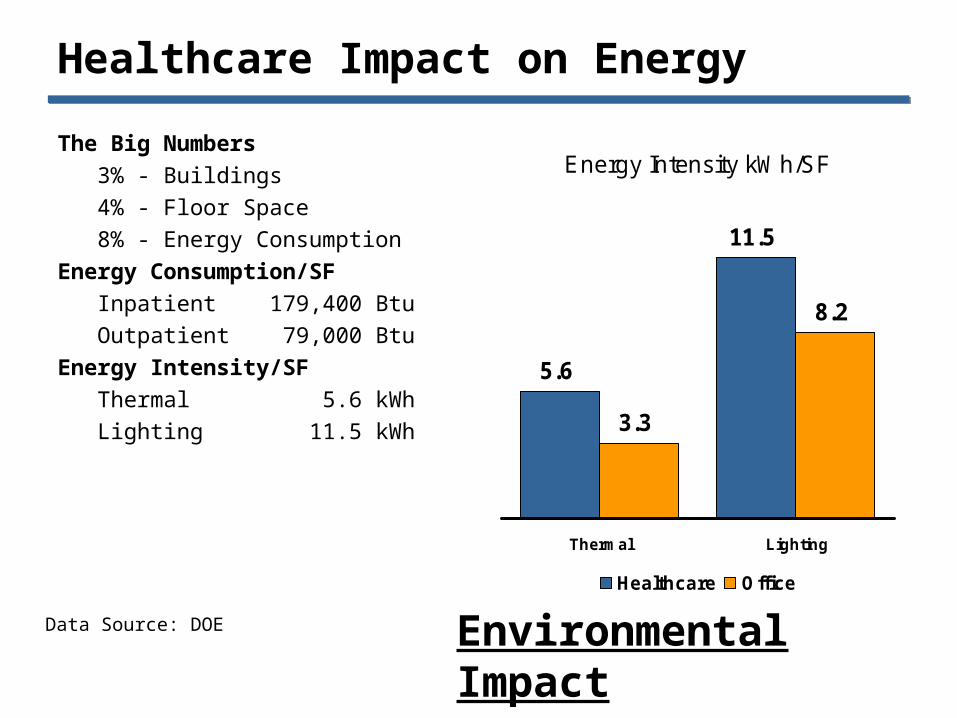
Healthcare Impact on Energy
Energy Intensity kWh/SF
5.6
11.5
3.3
8.2
Thermal Lighting
Healthcare Office
The Big Numbers
3% - Buildings
4% - Floor Space
8% - Energy Consumption
Energy Consumption/SF
Inpatient 179,400 Btu
Outpatient 79,000 Btu
Energy Intensity/SF
Thermal 5.6 kWh
Lighting 11.5 kWh
Data Source: DOE
Environmental Impact
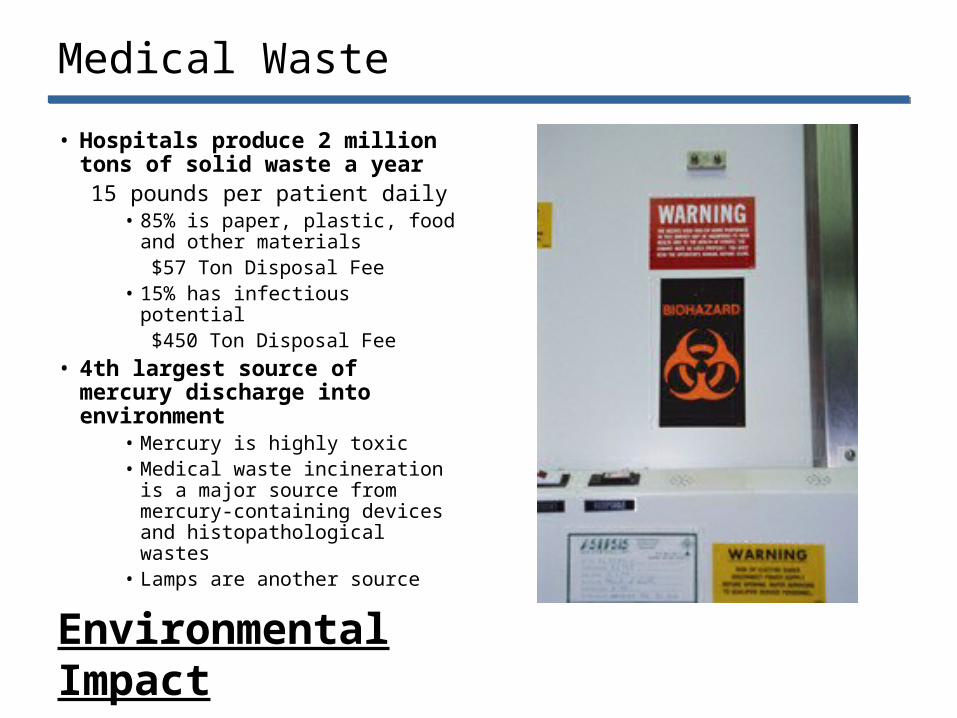
Medical Waste
• Hospitals produce 2 million tons of solid waste a year
15 pounds per patient daily• 85% is paper, plastic, food and other
materials$57 Ton Disposal Fee
• 15% has infectious potential$450 Ton Disposal Fee
• 4th largest source of mercury discharge into environment
• Mercury is highly toxic• Medical waste incineration is a
major source from mercury-containing devices and histopathological wastes
• Lamps are another source
Environmental Impact
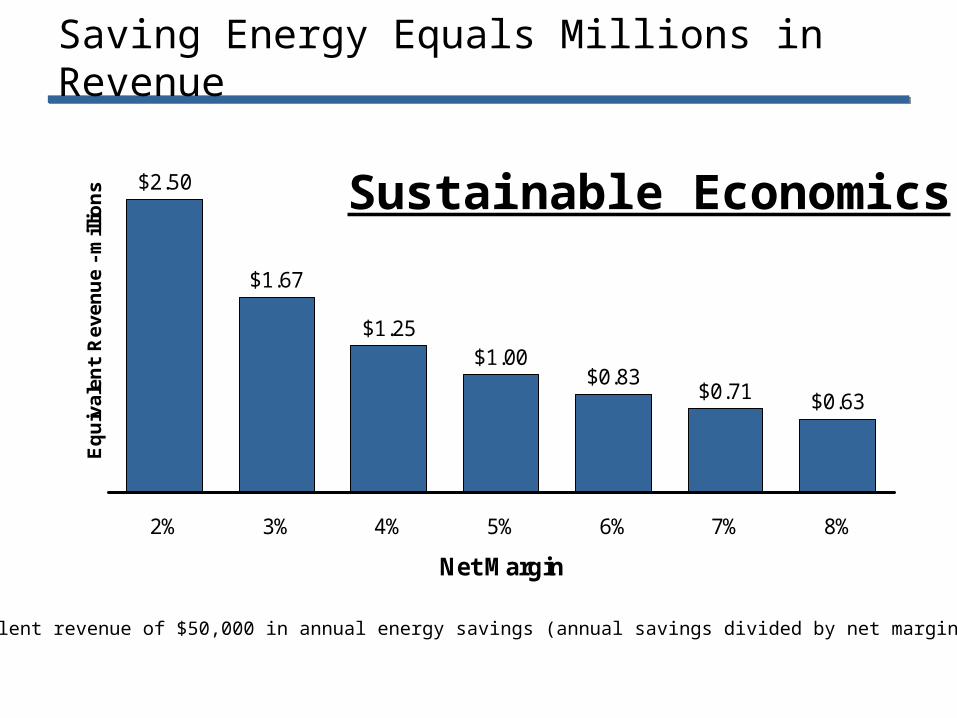
Saving Energy Equals Millions in Revenue
$2.50
$1.67
$1.25$1.00
$0.83$0.71 $0.63
2% 3% 4% 5% 6% 7% 8%
Net Margin
Eq
uiv
ale
nt
Re
ve
nu
e -
mill
ion
s
Equivalent revenue of $50,000 in annual energy savings (annual savings divided by net margin)
Sustainable Economics
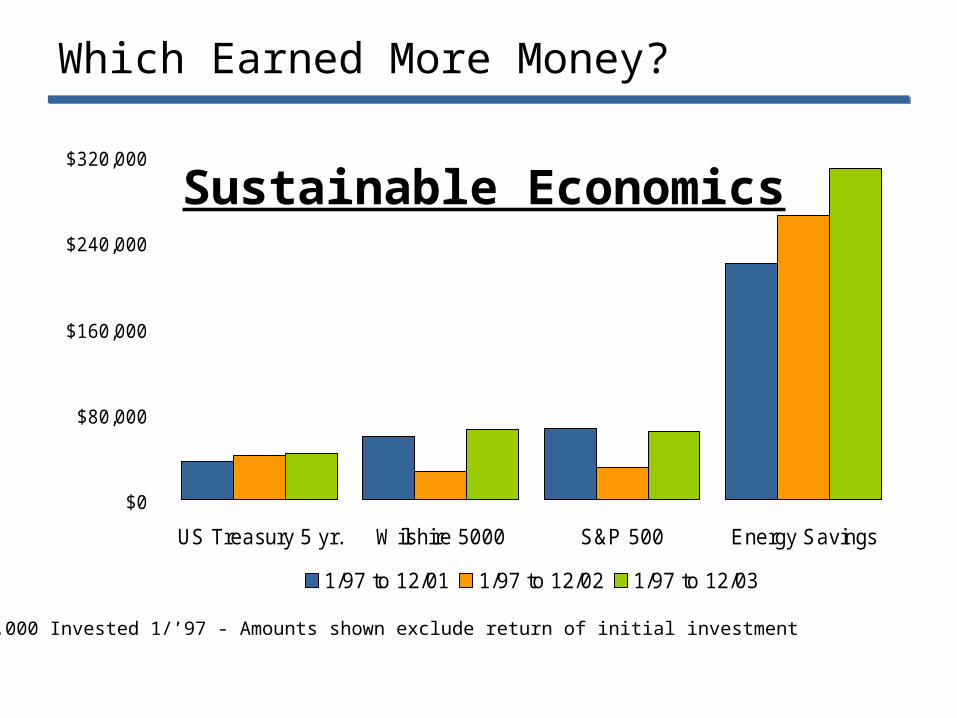
Which Earned More Money?
$0
$80,000
$160,000
$240,000
$320,000
US Treasury 5 yr. Wilshire 5000 S&P 500 Energy Savings
1/97 to 12/01 1/97 to 12/02 1/97 to 12/03
$100,000 Invested 1/’97 - Amounts shown exclude return of initial investment
Sustainable Economics
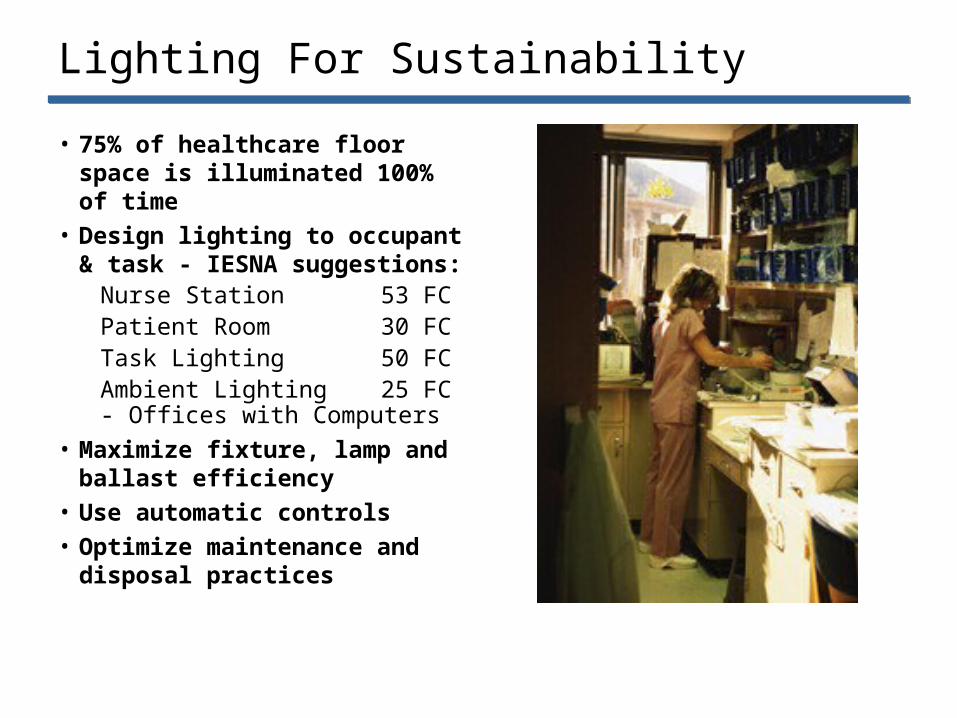
Lighting For Sustainability
• 75% of healthcare floor space is illuminated 100% of time
• Design lighting to occupant & task - IESNA suggestions:
Nurse Station 53 FCPatient Room 30 FCTask Lighting 50 FCAmbient Lighting 25 FC- Offices with Computers
• Maximize fixture, lamp and ballast efficiency
• Use automatic controls
• Optimize maintenance and disposal practices
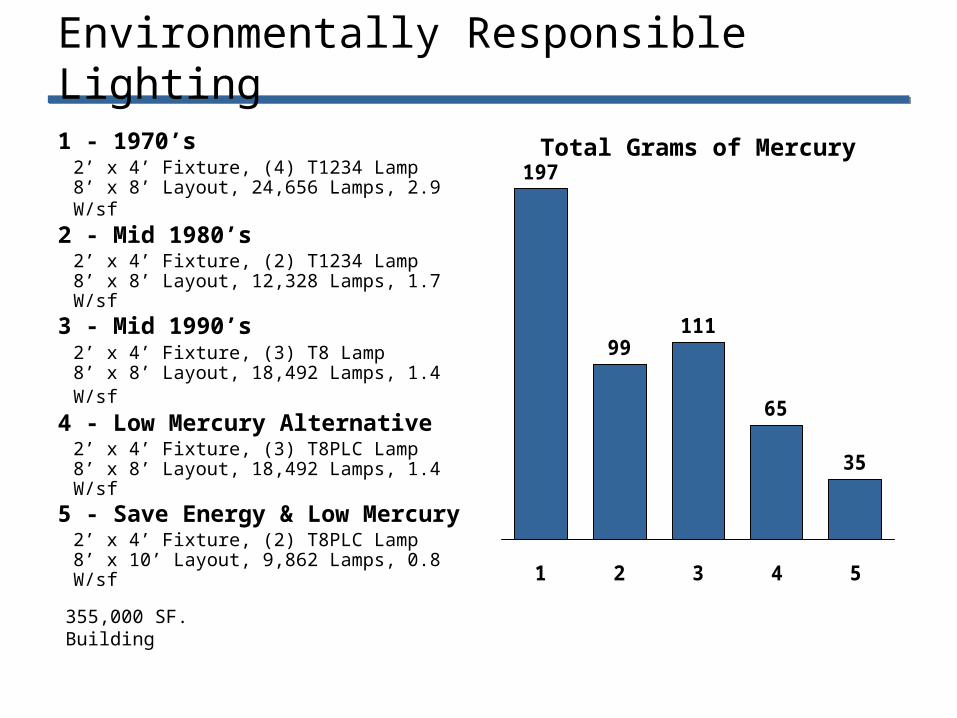
Environmentally Responsible Lighting
197
99111
65
35
1 2 3 4 5
1 - 1970’s2’ x 4’ Fixture, (4) T1234 Lamp8’ x 8’ Layout, 24,656 Lamps, 2.9 W/sf
2 - Mid 1980’s2’ x 4’ Fixture, (2) T1234 Lamp8’ x 8’ Layout, 12,328 Lamps, 1.7 W/sf
3 - Mid 1990’s2’ x 4’ Fixture, (3) T8 Lamp8’ x 8’ Layout, 18,492 Lamps, 1.4 W/sf
4 - Low Mercury Alternative2’ x 4’ Fixture, (3) T8PLC Lamp8’ x 8’ Layout, 18,492 Lamps, 1.4 W/sf
5 - Save Energy & Low Mercury2’ x 4’ Fixture, (2) T8PLC Lamp8’ x 10’ Layout, 9,862 Lamps, 0.8 W/sf
355,000 SF. Building
Total Grams of Mercury
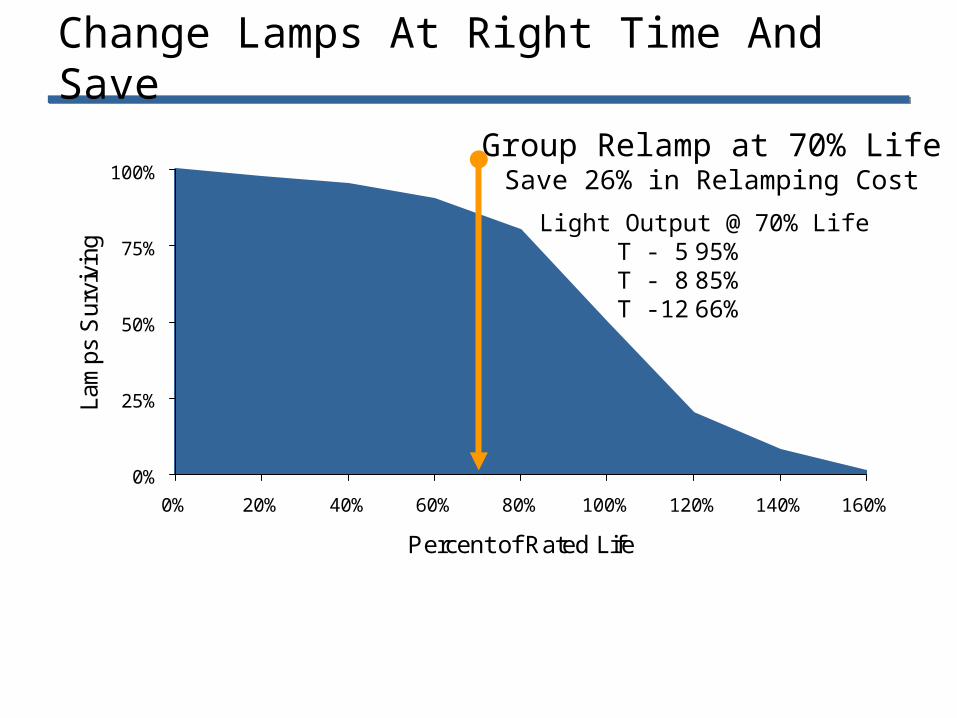
Change Lamps At Right Time And Save
0%
25%
50%
75%
100%
0% 20% 40% 60% 80% 100% 120% 140% 160%
Percent of Rated Life
Lam
ps S
urvi
ving
Group Relamp at 70% LifeSave 26% in Relamping Cost
Light Output @ 70% Life T - 5 95%T - 8 85%T -12 66%
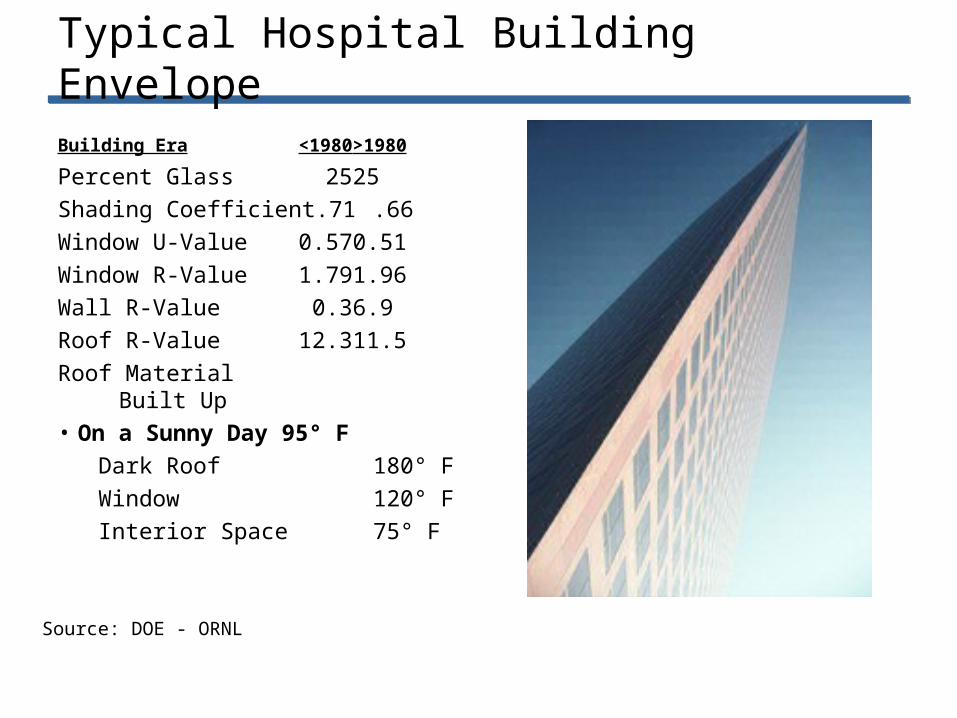
Typical Hospital Building Envelope
Building Era <1980 >1980
Percent Glass 25 25
Shading Coefficient .71 .66
Window U-Value 0.57 0.51
Window R-Value 1.79 1.96
Wall R-Value 0.3 6.9
Roof R-Value 12.3 11.5
Roof Material Built Up• On a Sunny Day 95° F
Dark Roof 180° F
Window 120° F
Interior Space 75° F
Source: DOE - ORNL
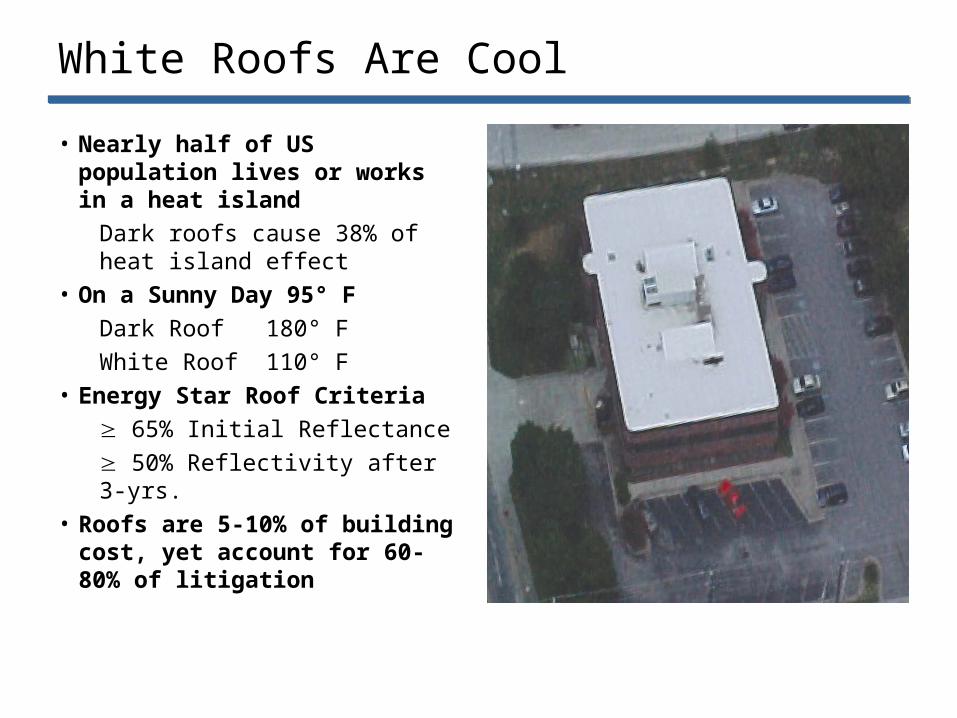
White Roofs Are Cool
• Nearly half of US population lives or works in a heat island
Dark roofs cause 38% of heat island effect
• On a Sunny Day 95° F
Dark Roof 180° F
White Roof 110° F
• Energy Star Roof Criteria
65% Initial Reflectance
50% Reflectivity after 3-yrs.
• Roofs are 5-10% of building cost, yet account for 60-80% of litigation
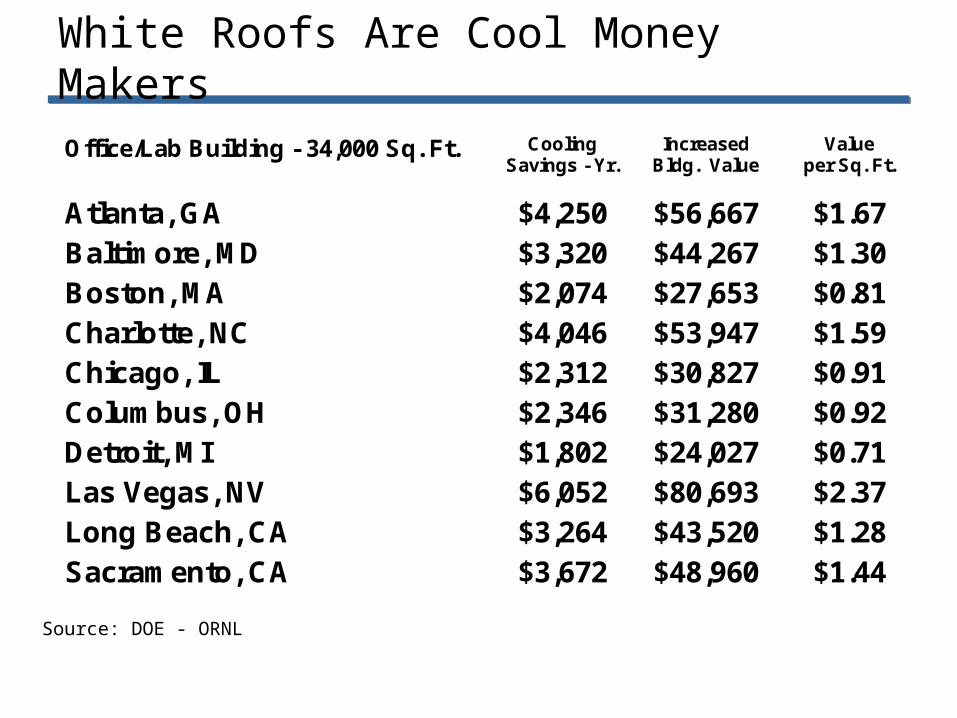
White Roofs Are Cool Money Makers
Office/Lab Building - 34,000 Sq. Ft. CoolingSavings - Yr.
IncreasedBldg. Value
Valueper Sq. Ft.
Atlanta, GA $4,250 $56,667 $1.67Baltimore, MD $3,320 $44,267 $1.30Boston, MA $2,074 $27,653 $0.81Charlotte, NC $4,046 $53,947 $1.59Chicago, IL $2,312 $30,827 $0.91Columbus, OH $2,346 $31,280 $0.92Detroit, MI $1,802 $24,027 $0.71Las Vegas, NV $6,052 $80,693 $2.37Long Beach, CA $3,264 $43,520 $1.28Sacramento, CA $3,672 $48,960 $1.44
Source: DOE - ORNL
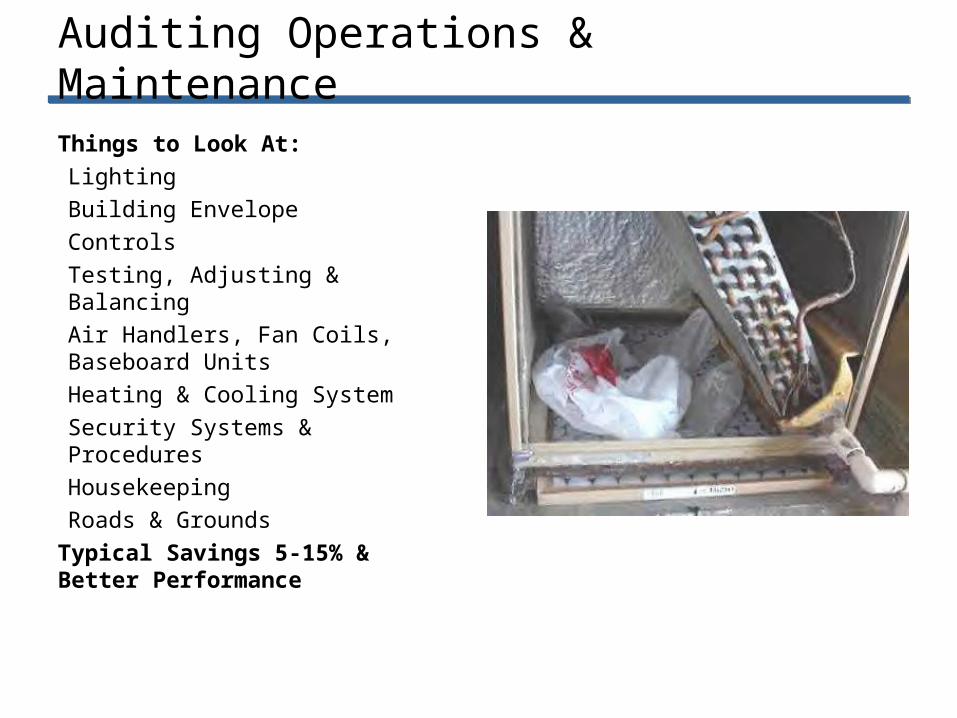
Auditing Operations & Maintenance
Things to Look At:
Lighting
Building Envelope
Controls
Testing, Adjusting & Balancing
Air Handlers, Fan Coils, Baseboard Units
Heating & Cooling System
Security Systems & Procedures
Housekeeping
Roads & Grounds
Typical Savings 5-15% & Better Performance
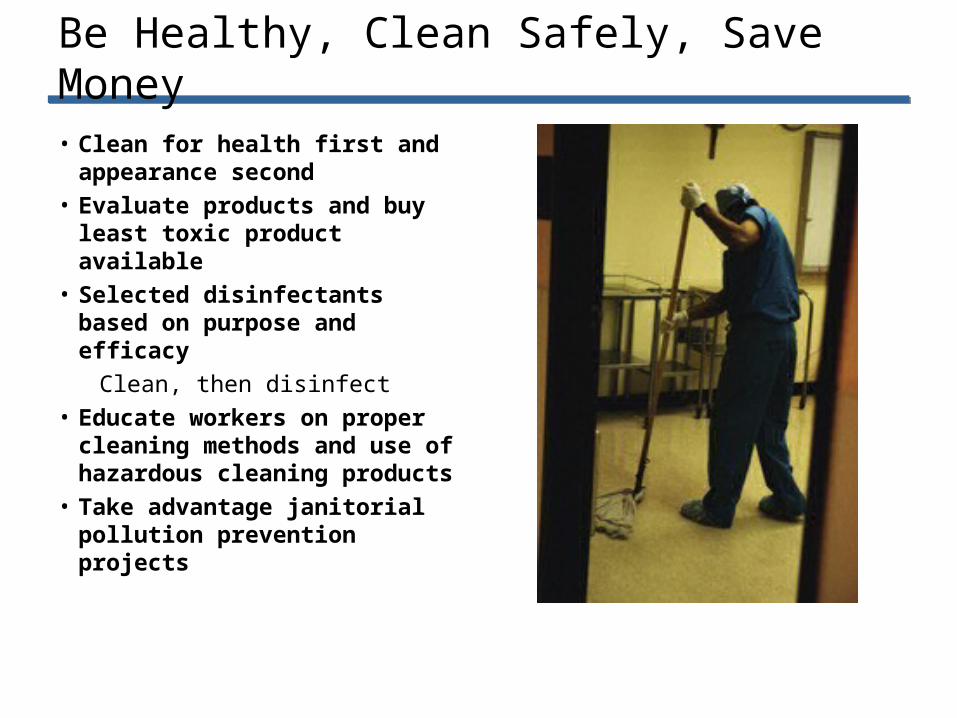
Be Healthy, Clean Safely, Save Money
• Clean for health first and appearance second
• Evaluate products and buy least toxic product available
• Selected disinfectants based on purpose and efficacy
Clean, then disinfect
• Educate workers on proper cleaning methods and use of hazardous cleaning products
• Take advantage janitorial pollution prevention projects
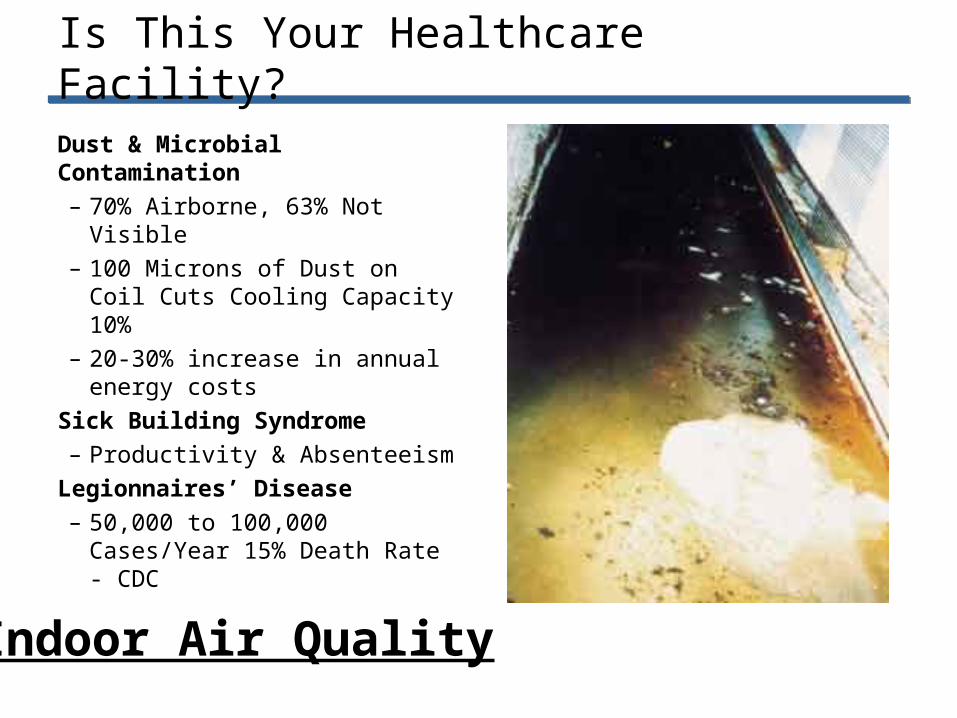
Is This Your Healthcare Facility?
Dust & Microbial Contamination
– 70% Airborne, 63% Not Visible
– 100 Microns of Dust on Coil Cuts Cooling Capacity 10%
– 20-30% increase in annual energy costs
Sick Building Syndrome
– Productivity & Absenteeism
Legionnaires’ Disease
– 50,000 to 100,000 Cases/Year 15% Death Rate - CDC
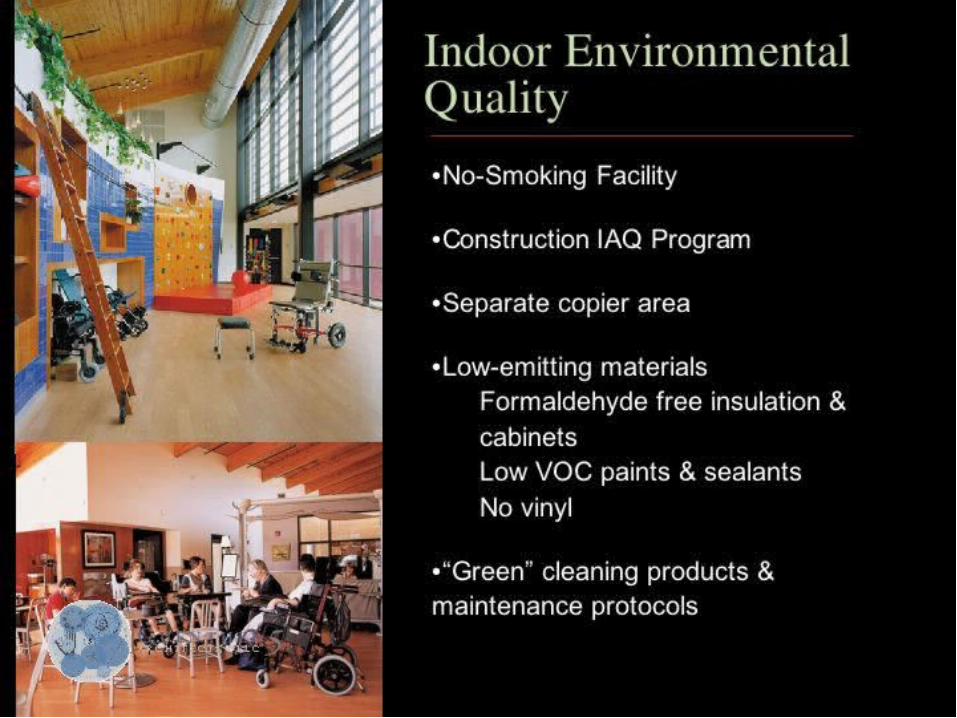
Indoor Air Quality
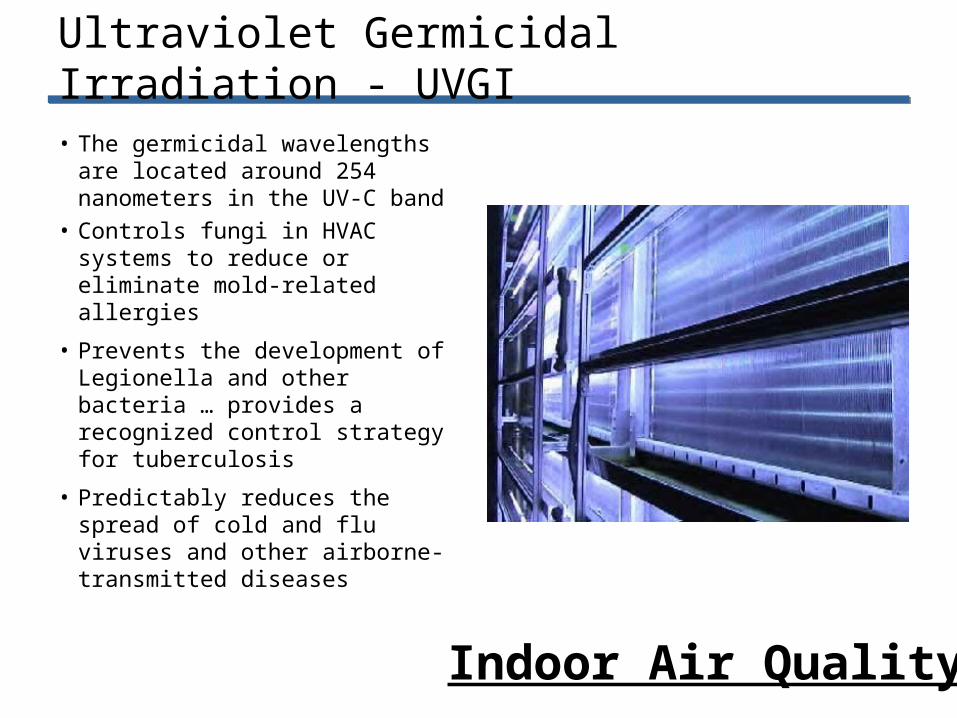
Ultraviolet Germicidal Irradiation - UVGI
• The germicidal wavelengths are located around 254 nanometers in the UV-C band
• Controls fungi in HVAC systems to reduce or eliminate mold-related allergies
• Prevents the development of Legionella and other bacteria … provides a recognized control strategy for tuberculosis
• Predictably reduces the spread of cold and flu viruses and other airborne-transmitted diseases
Indoor Air Quality
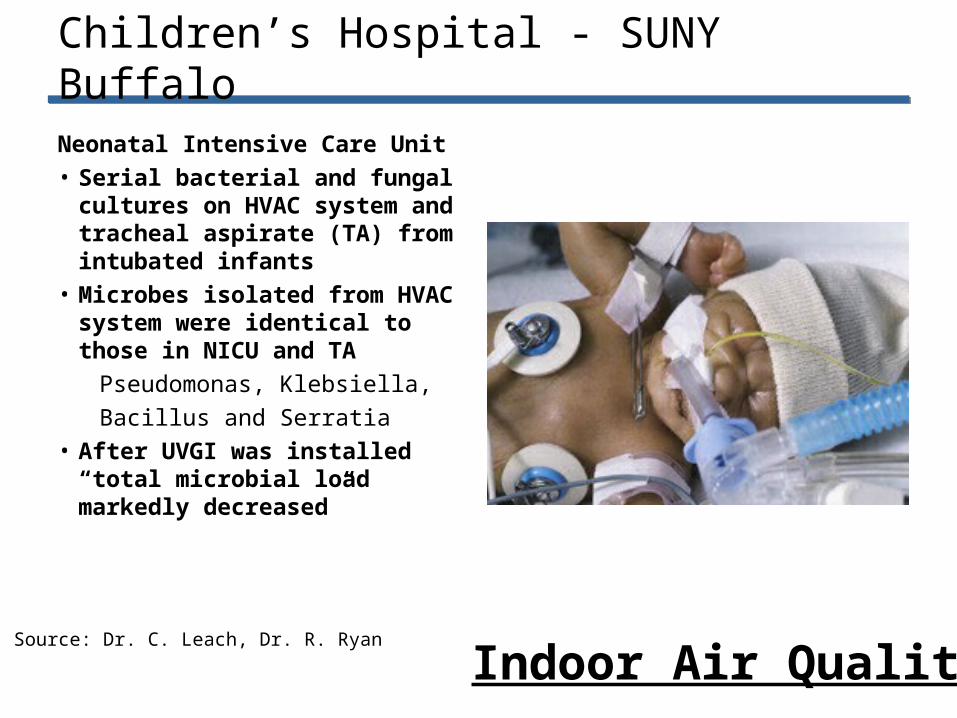
Children’s Hospital - SUNY Buffalo
Neonatal Intensive Care Unit
• Serial bacterial and fungal cultures on HVAC system and tracheal aspirate (TA) from intubated infants
• Microbes isolated from HVAC system were identical to those in NICU and TA
Pseudomonas, Klebsiella,
Bacillus and Serratia
• After UVGI was installed “total microbial load markedly decreased”
Source: Dr. C. Leach, Dr. R. Ryan
Indoor Air Quality
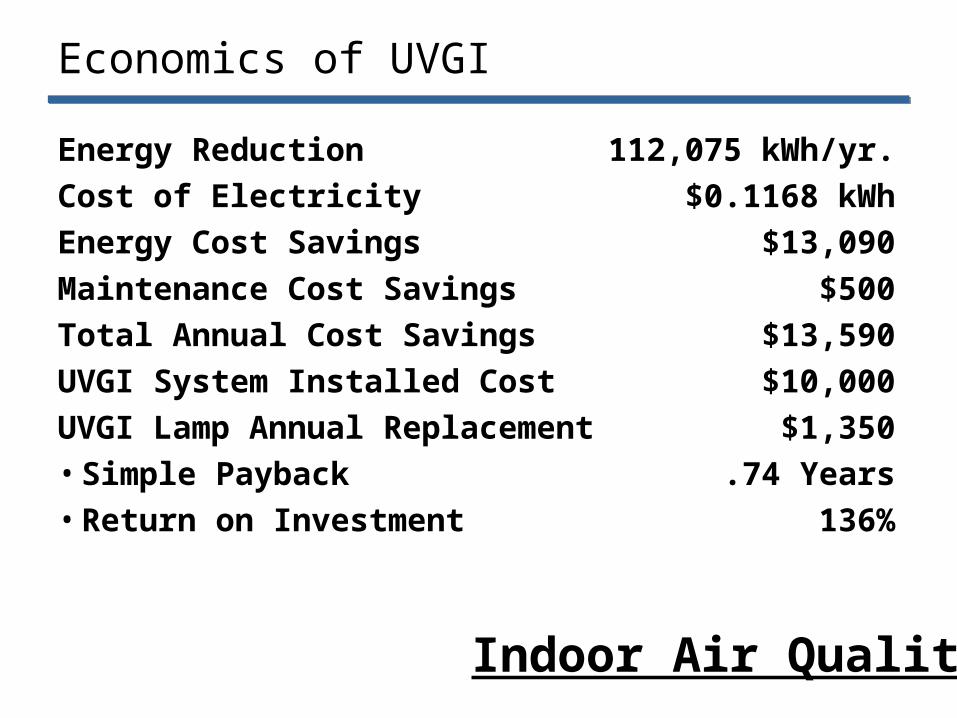
Economics of UVGI
Energy Reduction 112,075 kWh/yr.
Cost of Electricity $0.1168 kWh
Energy Cost Savings $13,090
Maintenance Cost Savings $500
Total Annual Cost Savings $13,590
UVGI System Installed Cost $10,000
UVGI Lamp Annual Replacement $1,350
• Simple Payback .74 Years
• Return on Investment 136%
Indoor Air Quality
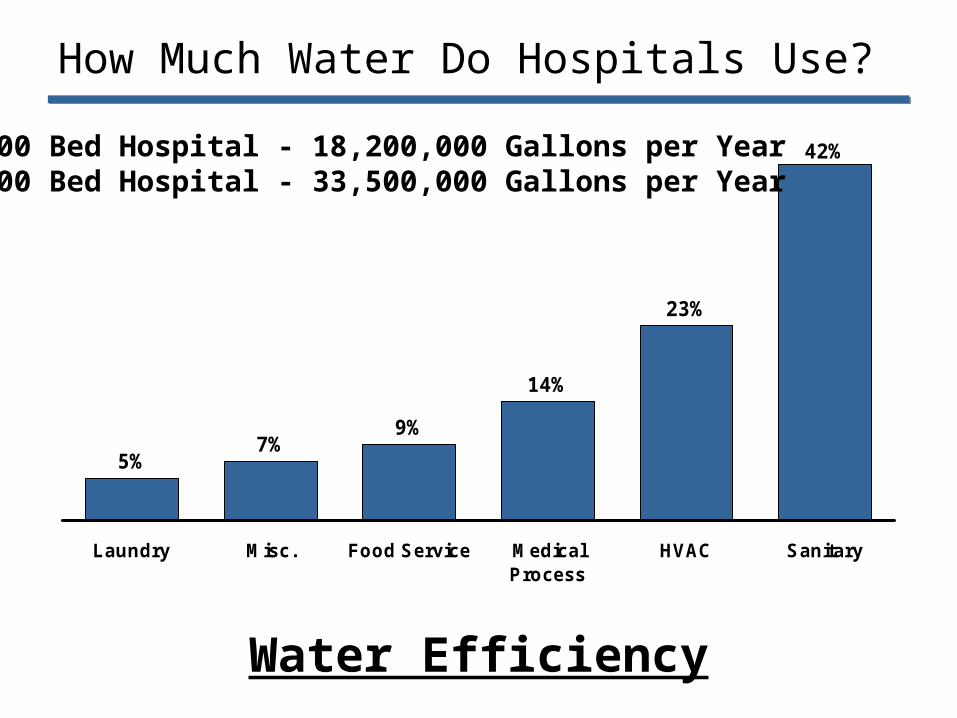
How Much Water Do Hospitals Use?
42%
23%
14%
9%7%
5%
SanitaryHVACMedicalProcess
Food ServiceMisc.Laundry
200 Bed Hospital - 18,200,000 Gallons per Year300 Bed Hospital - 33,500,000 Gallons per Year
Water Efficiency
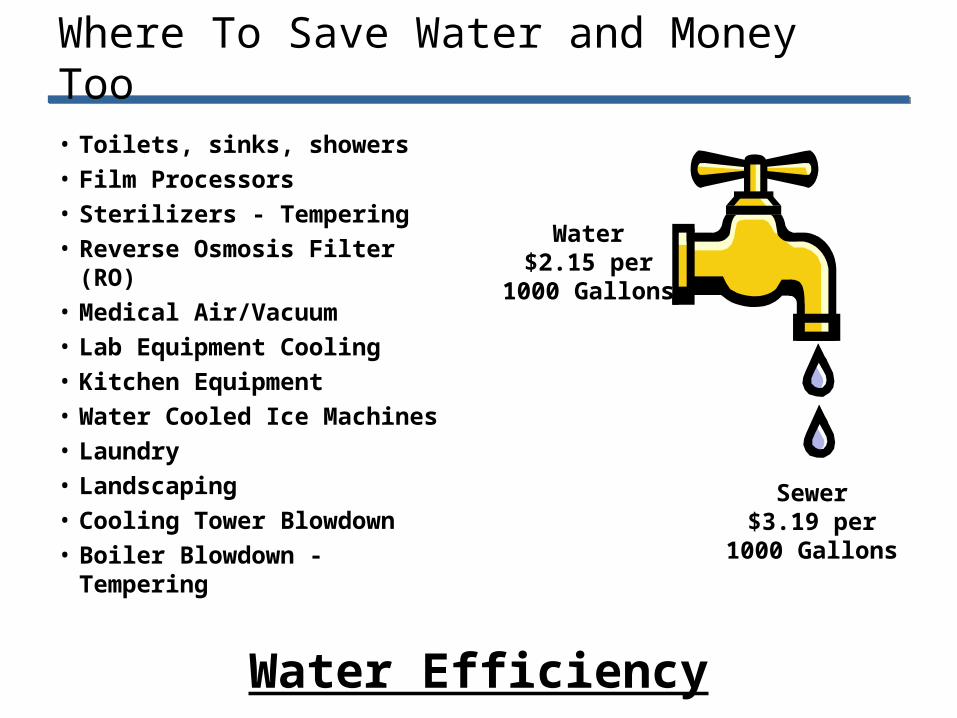
Where To Save Water and Money Too
• Toilets, sinks, showers
• Film Processors
• Sterilizers - Tempering
• Reverse Osmosis Filter (RO)
• Medical Air/Vacuum
• Lab Equipment Cooling
• Kitchen Equipment
• Water Cooled Ice Machines
• Laundry
• Landscaping
• Cooling Tower Blowdown
• Boiler Blowdown - Tempering
Water$2.15 per
1000 Gallons
Sewer$3.19 per
1000 Gallons
Water Efficiency
Thanks to Our Sponsors:
The Corporate Realty, Design & Management Institute
CENTER FOR MAXIMUM POTENTIAL BUILDING SYSTEMS


