Page 1
Sustainable livelihood strategies and outcomes of ageing
farmers in Kenya’s Central Highlands
Authors
Louise C. Branlard (ndb289)
Aslak H. C. Christiansen (wfx997)
Helene L. Hannibal (vnz331)
Jesse C. Jones (nhm902)
Course name
5440-B3-3F18; Thematic Course: Interdisciplinary Land Use and Natural Resource Management
Word count: 9490 Date: 06/04/2018
Kenyan counterparts
Phyllis Wamaitha
Moses Ndarua
Supervisors
Christian Pilegaard Hansen
Lise Tjørring
Page 2
Abstract
The global population is rapidly ageing. By 2050, old people will outnumber the young for the
first time in history with 80% of the ageing population located in developing countries. Sub-
Saharan Africa is experiencing rapid growth in its ageing populations. The main causes are due
to decreasing fertility and mortality rates resulting in increased life expectancy and urban youth
migration. Age is one of multiple driving factors that influence livelihood strategies, yet there is
a knowledge gap on the connection between ageing rural populations and the sustainability of
their livelihood strategies and outcomes. The aim of this study is to assess how ageing farmers’
livelihood capitals, mediated by the influence of institutions and organisations, affect adoption of
livelihood strategies and the achievement of sustainable livelihood outcomes in the Central
Highlands of Kenya. Data was obtained while conducting questionnaires, semi-structured
interviews, and focus group discussions. The results were categorised in the context of the
sustainable livelihoods framework and compared with literature for analysis and validity. Old
farmers were found to have reduced physical capabilities and labour access due to limited
financial resources and youth migration resulting in decreasing levels of productivity and
financial stability. Old farmers’ capabilities to overcome the obstacles posed by age are limited
by institutional and organisational mismanagement. The issues of adequate capital access faced
by ageing farmers increases their vulnerability to various economic and natural shocks. It is
concluded that age poses a significant barrier to the realisation of sustainable livelihood
outcomes.
Page 3
Acknowledgments
We would first like to thank our Kenyan fellow-students, Phyllis Wamaitha and Moses Ndarua,
from the University of Nairobi. We are also very grateful to our local guide, Francis, and our two
local interpreters, Doris and Julius, whom were all Gatuya-ini locals. We would also like to
thank our host families for the wonderful hospitality and sharing with us their way of life.
Furthermore, we are very appreciative to the local chief and agricultural officers who provided
useful insight and helped us acquire necessary data to conduct our research.
The field-based part of the course was a collaboration between the Wangari Maathai Institute for
Peace and Environmental Studies at University of Nairobi, Roskilde University and University
of Copenhagen. The inputs and efforts of lecturers from the Wangari Maathai Institute,
University of Copenhagen and Roskilde University are highly appreciated. This field work and
design of the project was collaboratively done by students from University of Nairobi, University
of Copenhagen and Roskilde University. Villagers of the Gatuya-ini location, Nyeri county
hosted the students and freely contributed to the information in this report through several
interviews and informal communications. Their contribution is acknowledged and much
appreciated. We are grateful to the chief and the community leaders in Gatuya-ini location for
logistical support in the implementation of the training.
Page 4
Work distribution
Main authors Contributing authors
Abstract All
Acknowledgements All
1. Introduction All
2. Background All
3. Theory
The Sustainable Livelihood Framework Louise
4. Methods
4.1. Rationale for choice of methods Helene Jesse
4.2. Ethics Aslak, Helene Louise
4.3. Questionnaires Aslak Louise
4.4. Semi-structured interviews Aslak, Helene, Louise
4.5. Focus group discussions Aslak, Louise
4.5.1. Women Louise
4.5.2. Men Aslak
4.6. Translation Louise Helene
4.7. Bias section Aslak, Helene Louise
5. Results
5.1. Livelihood Strategies Jesse Aslak, Helene
5.2. Livelihood Capitals Louise Aslak, Helene, Jesse
5.3. Institutional and organisational influence Aslak Jesse, Louise
5.4. Livelihood Outcomes Jesse Aslak
Page 5
6. Discussion Aslak, Jesse, Louise Helene
7. Conclusion All
8. Perspectives and Recommendations Aslak, Jesse, Louise Helene
Abbreviations and Definitions
AO
FGD
fFGD
mFGD
GDP
GoK
KU
LMIC
NGO
SLF
SSA
UN
SACCO
Agricultural officer (may be followed by 1 or 2)
Focus group discussion
Female focus group discussion
Male focus group discussion
Gross domestic product
Government of Kenya
University of Copenhagen
Low- and middle-income country
Non-governmental organisation
Sustainable livelihoods framework
Sub-Saharan Africa
United Nations
SACCOs are a type of cooperative that farmers can join that
provide loans with lower interest rates and smaller loans than
banks with less requirements.
Page 6
6
Table of content
1. INTRODUCTION................................................................................................................. 1
2. BACKGROUND ................................................................................................................... 5
3. THEORY ............................................................................................................................... 7
The Sustainable Livelihoods Framework (SLF)................................................................................... 7
4. METHODS .......................................................................................................................... 10
4.1. Rationale for choice of methods .............................................................................................. 10
4.2. Ethics ......................................................................................................................................... 10
4.3. Questionnaires .......................................................................................................................... 11
4.4. Semi-structured interviews...................................................................................................... 13
4.5. Focus group discussions ........................................................................................................... 13
4.5.1. Female FGD ...................................................................................................................... 14
4.5.2. Male FGD .......................................................................................................................... 15
4.6. Translation ................................................................................................................................ 15
4.7. Bias and Validity ...................................................................................................................... 16
5. RESULTS ............................................................................................................................ 17
5.1. Livelihood Strategies ................................................................................................................ 17
5.2. Livelihood Capitals .................................................................................................................. 22
5.2.1. Natural capital.................................................................................................................... 22
5.2.2. Physical capital .................................................................................................................. 23
5.2.3. Human capital .................................................................................................................... 24
5.2.4. Financial capital ................................................................................................................. 26
5.2.5. Social capital...................................................................................................................... 27
5.3. Institutional and Organisational Influence ............................................................................ 28
5.4. Livelihood Outcomes................................................................................................................ 30
6. DISCUSSION ...................................................................................................................... 33
7. CONCLUSION ................................................................................................................... 37
8. PERSPECTIVES AND RECOMMENDATIONS ........................................................... 39
9. REFERENCES .................................................................................................................... 40
10. APPENDICES ................................................................................................................. 44
Page 7
1
1. INTRODUCTION
The global population age 60 and above has more than doubled since 1980, and in almost all
countries, the proportion of old people is increasing (UN DESA, 2017). Table 1 depicts the
expected changes in the population distribution of old people in different regions of the world.
By 2050, old people will outnumber young people (under age 15) for the first time in history,
numbering roughly 2 billion with 80% residing in developing countries (WHO, 2014; UN
DESA, 2017). The countries of SSA will see between two to fivefold increases in their elderly
population between 2017 and 2050 (UN DESA, 2017). Major causes of the global ageing trend
are due to decreasing fertility and mortality rates (Biritwum et al., 2013). Life expectancy at age
60 in Africa is now almost on the level with the global average, and further increasing
(Aboderin, 2012). Demographic changes in households are a driver for changes in agricultural
practices and livelihood strategies. As cities attract young generations and income sources shift
to other sectors, agricultural labour capital is diminished leading to threatened food security and
livelihoods among rural communities. Hence, rural communities across developing countries
face a comprehensive problem characterised by an ageing population within farming (FAO,
2017). Even though the Kenyan government and NGOs have tried to engage youth in agriculture
through funding training and other initiatives (Mwaura, 2017), there remains a clear shift in
employment among Kenyans towards off-farm sectors (Yeboah & Jayne, 2016). Currently,
agriculture directly provides livelihoods for 75% of the population; however, only 11% of the
Kenyans age 18-35 are interested in farming as an occupation (Awiti et al., 2015; Mwaura,
2017). This lack of a rural workforce and disengagement could significantly disrupt Kenya’s
smallholder driven agricultural economy as agriculture contributes 36% to the country’s GDP
(World Bank, 2016; Mwaura, 2017).
Page 8
2
Table 1: Global trends in ageing showing the percentage change in the total population being ≥ 60 years, based on
regional UN estimates from 1950 - 2050 and adapted from world population prospects (UN DESA, 2011).
There are multiple driving factors that influence livelihood strategies including economic
stability, population density, access to market, the presence of development projects, and
climatic conditions, especially in the agricultural sector (Pender et al., 2006). Indeed, high
population density can result in deterioration and intensification of farmlands and can support the
creation of nonfarm industries (Liu and Yamauchi, 2013). Climate change over the coming
decades is predicted to negatively impact yield of major staple crops such as maize (Schlenker
and Lobell, 2010). On the positive side, improving market access can stimulate the production of
cash crops, thereby creating more stable incomes via shifts in agricultural practices and crop
varieties (Pender et al., 2006).
In the agricultural sector, an ageing workforce has major implications on sustainable land use
and development (FAO, 2017). Older farmers have reduced health and physical capabilities
which affects the application of livelihood strategies and the resulting livelihood outcomes
(Scoones, 1998). A decline in physical strength requires additional labour to achieve the same
outcomes. Since crops and cultivation practices vary in labour intensity, a shift in livelihood
strategies and income sources might be observed in ageing rural households. Widowhood is an
additional factor that hinders productivity for old farmers as husband and wife teams are more
efficient together (Cattell, 2003). Furthermore, access to useful agricultural information is
moderated by financial resources and other factors, i.e. illiteracy, that provide further obstacles
for ageing households. While 78% of Kenya’s adult population can read and write, only 51%
over age 65 is literate (Knoema, 2015; CIA, 2017).
Page 9
3
The role and dynamics of institutions, organisations, policies, and legislation heavily mediates
access to various livelihood capitals which, in turn, influences the livelihood strategies adopted
by farmers (DFID, 1999). These aspects play a key role in shaping the development of
sustainable livelihood outcomes, i.e. well-being, financial stability, natural resource resilience,
and sustainability.
Demographic changes are a driver for governments of developing countries to implement new
policies that counter the negative socioeconomic impacts associated with an ageing population
(UN DESA, 2017). If policies are enacted proactively to circumvent the consequences
anticipated with ageing demographics, adaptive measures are far more likely to be successfully
implemented (UN DESA, 2017). Gender, ethnicity, and rural-urban residence are well-
documented factors explaining inequalities and poverty in SSA, but even though evidence points
to age as a key factor, it is poorly documented in SSA (Aboderin, 2012). Additionally, there is an
apparent lack of literature concerning sustainability of livelihoods in ageing rural populations;
this information is essential for the development of solutions that promote societal adaptation
under the socioeconomic threats proposed by ageing demographics. This problem is particularly
relevant in developing countries, and existing literature is extremely limited in focus on SSA.
The research questions of this project were formulated to address this knowledge gap through the
lens of the Sustainable Livelihoods Framework (SLF) proposed by Scoones (1998).
Main research question:
How does ageing of rural communities affect livelihoods in Kenya’s Central Highlands?
Sub-research questions:
1. How have livelihood strategies of ageing farmers changed over time?
2. How does access to the different forms of capital and institutional influence affect livelihood
strategies of ageing farmers?
3. What are the livelihood outcomes and consequences of these pathways?
Page 10
4
Data about livelihood capitals older farmers have access to, and the influence of institutions and
organisations mediating these capitals will be collected in order to understand how these factors
affect the adoption of strategies to achieve sustainable livelihood outcomes within ageing rural
communities.
One challenge of this study might be the difficulty to isolate age as the governing factor in
changes of livelihood strategies due to the fact that changes occur during the passing of time,
which is not related to ageing necessarily. In a wider context, this could be political, economic,
social, cultural, climatic or market-related changes affecting livelihood strategies. Another
limitation is that researching about changes in people’s life over time requires to activate old
people’s memory, and some information might have been forgotten over the years due to their
old age.
Page 11
5
2. BACKGROUND
Nationally, 7% of the population is 55 or older. The median age in Kenya is 19.7 with 40% of
the population school-going age (0-14) and 19% prime-working age (15-24) (CIA, 2017). The
current demographic structure was caused by high fertility in the late 1970’s, even though this
rate has significantly decreased over the years (CIA, 2018). A low median age indicates an
already existing demographic concern partially due to the cost of providing free education for
40% of the population and the consequent impending need to create jobs without the reliability
of significant future economic growth.
Kenya’s Central Highlands is one of the most productive agricultural regions in Africa (CIA,
2018). Fertile soils and good market access stimulate growth and commercial agricultural
enterprises, but many farmers struggle with small land sizes between 1.2 and 5 acres on average
per household (Pender et al., 2006). The research site, Gatuya-ini, is located near the town of
Othaya in Nyeri County in the Central Highlands of Kenya. The population of Nyeri County is
approximately 690,000 with 76% of inhabitants living in rural areas (Wiesmann et al., 2016).
The Kikuyu people are the predominant ethnic group living in the region; the dominant local
language is Kikuyu, but proficiency in Swahili and English is also common, especially among
the younger generations.
Page 12
6
Overlooking a typical agricultural scenery in the Othaya region with the Abadare mountain range in the background.
Population density is relatively high in Kenya’s Central Highlands (PRB, 2011), but this does not
necessarily translate into a strong agricultural labour force. Since a high proportion of the
population is below age 15 and basic education is now compulsory for children (The
Constitution of Kenya, 2010), there is limited human labour capital from this age group which
was a historically relied upon source in farming communities (Pender et al., 2006).
Page 13
7
3. THEORY
The Sustainable Livelihoods Framework (SLF)
The research aims to understand the stated objectives through adoption of the SLF as defined by
Scoones (1998). This framework offers a consistent structure to analyse the achievement of
sustainable livelihoods by small-holder farmers of rural communities in developing countries.
We will base our definitions of “livelihood” and “sustainable livelihood” on the following:
A livelihood comprises the capabilities, assets (including both material and social resources) and
activities required for a means of living. A livelihood is sustainable when it can cope with and
recover from stresses and shocks, maintain or enhance its capabilities and assets, while not
undermining the natural resource base (Scoones, 1998).
The SLF is an interdisciplinary approach that relies on five main components: contexts,
livelihood resources, institutional processes and organisational structures, livelihood strategies,
and sustainable livelihood outcomes (Scoones, 1998). Scoones (1998) explains that, in a
particular historical, socioeconomic, and demographic context, certain combinations of
livelihood resources, or capitals, lead to certain combinations of livelihood strategies that, in
turn, lead to certain outcomes. Moreover, institutions and organisations greatly influence the
establishment of certain strategies (figure 3.1).
Page 14
8
Figure 3.1: Simplified schematic of the different components of the Sustainable Livelihoods Framework (SLF). The
arrows represent a relationship between two components. Adapted from DFID, 1999.
A livelihood strategy is defined as an activity adopted in order to achieve desired livelihood
outcomes; examples of such activities include agricultural intensification or extensification,
diversification within or outside agriculture, and even migration (Scoones, 1998). Livelihood
resources that influence strategies are divided into five different forms of capital: natural,
physical, human, financial, and social (DFID, 1999). First, the dependency of rural communities
on natural capitals such as land and water strongly influences their agricultural crop selection and
climatic vulnerability; second, physical capital includes infrastructure such as irrigation, storage
facilities, and transport; third, “skills, knowledge, ability to labour and good health” are defined
as human capital; fourth, financial capital includes available stocks such as income, cash,
savings, livestock, and flows of money such as pensions and remittances; and fifth, social capital
includes relationships with neighbours and the community, family relationships with children,
grandchildren, husbands and wives, and societal traditions regarding land ownership and
inheritance (DFID, 1999). Institutions and organisations are the “social structures and processes
through which sustainable livelihoods are achieved” (Scoones, 1998), and they are constantly
evolving in time. In simple terms, institutions (e.g. agricultural officers and other governmental
agencies) are society’s rulemakers while organisations (e.g. SACCOs and agricultural
cooperatives) are the players; both structures mediate the access to resources through restrictions
or opportunities. Finally, sustainable livelihood outcomes are characterised by poverty reduction,
Page 15
9
improvement of well-being and capabilities, as well as livelihood adaptation and vulnerability,
and natural resource resilience (Scoones, 1998).
Because this framework can be applied at different scales and for different groups of people, the
definitions of the elements constituting the framework are free to be defined alongside research-
specific objectives, hence the listed elements are not exhaustive. The first step is to define the
most relevant indicators of a sustainable livelihood according to the subject research group. It is
through the informants’ personal definitions of the framework’s elements that the factors can be
determined and categorised. Socioeconomic factors such as gender, income level, or former
political position may influence access to different forms of capital and selection of livelihood
strategies (Scoones, 1998); this must be discussed when analyzing results determined through the
lens of SLF.
Page 16
10
4. METHODS
4.1. Rationale for choice of methods
Due to time limitation for data collection, we elected to focus only on ageing farmers’
experiences. Therefore, we eliminated the need to interview young people and compare their
viewpoints. From this perspective, our interest in trans-demographic issues such as land
inheritance practices and youth migration is limited to the aspects that affect old farmers.
We chose to work with different social science methods such as questionnaires, semi-structured
interviews, and focus group discussions as they would help us gain a deeper insight in old
farmers’ everyday life (appendix 2). If we had had more time, methods such as farm typology
and soil sampling would have been relevant to examine the sustainability of old farmers’
livelihood strategies on a more quantitative scale. Additionally, better documentation of
participant observation would have provided deeper understanding of the livelihood strategies
and resource access of our subject group.
4.2. Ethics
To maintain proper research ethics, we guaranteed our respondents’ anonymity, and asked
consent to take pictures of them and to record during interviews. We also made sure to show our
gratitude for their participation and answered any questions they had concerning our research.
We experienced surprise and curiosity from some respondents, for they had not seen white
people since the British colonisers, however we explained our aims and the questionnaire or
interview would proceed nicely in all cases.
Initially we assumed corruption would be a sensitive topic, but most farmers spoke freely about
it although they would generally mention it as mismanagement.
Page 17
11
Picture of a 97 year-old farmer on her farm.
4.3. Questionnaires
As a first approach to get an overview of the study site, questionnaires are a good method to
collect large amounts of descriptive features. Closed questions are recommended since they are
easier to interpret, while open questions require more coding afterwards (Smith et al., 2015). Our
questionnaire was mostly consisting of closed questions for the sake of analysis, with few open
questions.
A pre-selection of farmers over 60 was made thanks to our local guide, and 45 respondents were
located around Gatuya-ini by mapping their farm on Google Earth (figure 4.3.1). Out of the 45
pre-selected respondents, some were not home resulting in a total of 33 completed
Page 18
12
questionnaires. Additionally, 5 other respondents filled out the questionnaire before the focus
group discussions started.
Figure 4.3.1: Map of the sampling for questionnaires. Blue, red and green pins represent the questionnaires that were
conducted by the three different groups; the yellow pin represents a respondent for a semi-structured interview with
who no questionnaire held. The numbers represent the questionnaire numbers by which informants are nominated.
To conduct all the questionnaires in one day, we spread into three mixed groups of three. One
person questioned the respondent with the help of a translator, as only one of our informants
performed the questionnaire in English, while a third person took notes and observed (appendix
3).
Each questionnaire has been numbered with the group number being either 0, 1 or 2, followed by
the chronological number of questionnaire; e.g. group 1 conducted its 6th questionnaire of the
Page 19
13
day refers to questionnaire no. 106 (appendix 4.1). In the following, we will reference interviews
with these numbers.
4.4. Semi-structured interviews
The loosely defined guideline of semi-structured interviews enabled us to gain insight into the
informant’s perspective on changes experienced over time, and issues or opportunities that we
might not have thought about. Open questions were mostly asked, including life story inspired
questions (appendix 4.2). While interviewing, timelines of the farmers’ lives were drawn in order
to get a more visual overview of the changes occuring in the past.
Among the questionnaire respondents, nine were selected for semi-structured interviews; some
profiles were representative of the average farmer in the area and some deviated on different
aspects, only one female was represented. Only one of our informants was able to speak English
fluently. Moreover, one interview with a farmer and retired agricultural officer was conducted in
a mix of English and Swahili. Additionally, three key informants were interviewed, being the
head of the agricultural office in Nyeri South, one agricultural officers from the same office, and
the chief of the Othaya Township sub-location. These three interviews were conducted in
English. To conduct the semi-structured interviews, we spread into two mixed groups of four
consisting of one interpreter, one Kenyan student and two KU students each, excluding our
guide.
4.5. Focus group discussions
Two FGDs with integrated participatory ranking of problems and solutions concerning old
farmers were conducted, one with only women and the other only men (appendix 5.1), enabling
Page 20
14
respondents to express themselves more freely, since gender might present a discriminatory
factor in rural Kenyan communities. This was well orchestrated as our research group consisted
of four women and four men, with two KU students, one Kenyan student, and one interpreter of
each gender. The discussions were held in a school, considered a neutral place for our
respondents to convene. Two rooms on opposite sides of a courtyard were used in order to create
a privacy barrier between the two discussions.
The respondents were invited by our local guide, they were not chosen from the farmers we
already met. These new respondents were asked to answer the same questionnaire, yet, not all of
them did due to a lack of time. While the discussions started, tea, mandazis and chapatis were
served to the respondents. Both FGDs lasted about 1.5 hours.
4.5.1. Female FGD
Five old women were present and the discussion started off pretty easily. In the beginning, one of
the women would speak more than the others, but as they were getting more into the discussion,
the speaking time became more equally distributed. At first, we were sitting observing outside of
the circle consisting of the informants and the interpreter, but we felt that a more participatory
dynamic from us was more efficient. We changed positions and faced all the informants while
staying a bit outside of the circle as we were drawing, listing their arguments and guiding our
interpreter throughout the discussion. The informants would keep speaking together, not to us,
but the dynamic of the discussion was felt to be more lively with this setting.
To perform the problems ranking (appendix 5.2), our informants first listed all the problems they
face due to age, then ranked them. However, it is not certain our respondents did the ranking in a
very accurate way, they rather voted for which problem is a big problem, and we based the
ranking on the degree of dissatisfaction a problem would raise among the respondents.
Afterwards, solutions for ageing farmers were addressed, but they were addressed as solutions to
the aforementioned problems, hence they were not ranked.
Page 21
15
4.5.2. Male FGD
A lively discussion took place with a small group of three old men. Initially, the dynamic of the
group was dominated by two of the members sitting on one side of the table, but when initiating
the ranking exercise, the setting adopted by the respondents and the translator changed, yielding
a more cohesif discussion. We sat behind them taking notes, observing and guiding the translator
to address certain aspects. It seemed to support the group discussion that we were placed a
outside of the circle.
The participatory ranking of problems and solutions (appendix 5.2) where performed by getting
the group to draw a mind map of problems related to ageing and related solutions. After that, we
suggested some points that they did not touch upon but that we felt were central aspects.
Eventually, ranking both problems and solutions spurred a lively discussion.
4.6. Translation
During the fieldwork we had the opportunity to work with two interpreters originating from the
village where we stayed. This enabled us to connect more with people and the local culture,
however we believe it potentially affected our data collection for several reasons. First, we
assume that a lot of information was lost throughout the translation. For example, after a several-
minutes-discussion with a respondent, the interpreter would translate only a brief summary, most
likely forgetting some information. Second, the interpreter might have interpreted or selected the
information given by the informant while translating it, causing the information not to be raw.
This potential misinterpretation can be due to the interpreter’s own understanding of our research
and his own beliefs and culture. Some things may have seemed obvious to them while they were
actually not obvious to us. Due to their cultural background they have a different understanding
and viewpoint that shapes the way they live and express themselves and interact with each other,
which was new to us (Paarup-Larsen, 1989. Clear explanations of our research goals and good
Page 22
16
communication helped overcoming these challenges and improved our understanding of each
other’s culture.
4.7. Bias and Validity
We worry that the role of our local guide as an elder of the village might have biased some data
because of his influence amongst the locals. He may have persuaded some respondents to
participate even though they were initially reluctant. Therefore, we asked our guide not to be
present during the interviews and focus group discussion conducted afterwards.
Due to their great knowledge about the area and the local people, the guide and interpreters may
have influenced the data, as they would sometimes add information or correct the respondent’s
answer.
Data obtained appear to be consistent both within and between the methods although there are
discrepancies between individual statements. There are some contradictions between farmers and
key informants, indicating that divergence may come from informants’ position. Yet, the internal
validity of the data is ensured through triangulation of our results from each method.
The relatively small sample size of this study and the lack of literature concerning ageing
populations and sustainable land use in developing regions compromise the possibility to
generalise the findings to a broader context or another location under similar settings.
Page 23
17
5. RESULTS
The average old farmer in the area is a male, age 76, married, and lives either alone or with 1 to 4
other family members while being the household head. He most likely has not had primary
education when he was a child, has been a farmer all his life, and now owns 2.3 acres of land. He
mainly grows coffee and tea alongside subsistence crops for his family’s personal consumption.
He still has a sense of pride regarding farming even though his physical capabilities have
reduced with age and his financial stability and productivity has decreased compared to when he
was younger.
5.1. Livelihood Strategies
The turbulent decades building up to the end of British colonisation and the transitory phase into
independence thereafter significantly impacted the trajectory of agricultural production in
Kenya’s Central Highlands. Through constructing timelines of the farmers’ lives, it became clear
that most adopted tea and coffee following the freedom of independence in 1963 (004, 113, 211,
AO1). Due to the improvements to financial stability, the popularity of the crops spread (figure
5.1.1). Before independence, people predominantly grew traditional subsistence crops such as
millet, sorghum, yams, cassava, arrowroots, and maize (004, AO1), and with the exception of
maize and arrowroot these crops are nearly nonexistent in the region today (007, AO1). This
shift in the region’s agricultural production diverted long-established, local economic networks
away from decentralised, community-scale barter and trade systems towards the centralised,
market-based systems (004, 007, 113).
“During the colonial period, traditional food crops were not sold but exchanged; there was no
money. But after 1963, farmers in the area started producing tea and coffee introducing the
concept of cash crops. Kenyans could not cultivate cash crops before independence because the
British controlled the market. To grow cash crops, they had to clear a lot of forest which caused
caused excessive deforestation in the country” (004).
Page 24
18
Figure 5.1.1 depicts the current income sources for the sampled group of ageing farmers in
ranked order from producing the highest (rank 1) to least (rank 4) income proportion. Insight into
the income reliance of old farmers illustrates the force of international markets that encourage
the production of tea and coffee, while dairy also provides farmers a significant share of income
through strong regional markets. Macadamia, avocados, bananas, cabbage, and timber are also
reported to produce incomes albeit subsidiary compared to the three aforementioned sources.
The “other” category, which includes traditional crops like arrowroot and sugarcane, represents a
low proportion of income for ageing farmers as these crops are mostly grown for subsistence, but
surpluses can still be sold to local markets.
Figure 5.1.1: Ranking of the 4 major income sources from highest to lowest. Tea and coffee are predominant among
the first and second main income sources respectively. Dairy seems to be important on all 4 positions. “Other” refers
to sugarcane, kale, spinach, arrowroot, sweet potato, guava, potatoes and beans, which mainly are food crops for
personal consumption. From questionnaires.
While tea was noted to provide a more steady income than coffee in recent years (106, 110, 211,
401, AO2, mFGD), many farmers reported a trend of increasingly low earnings and overall
Page 25
19
financial instability caused by price volatility (particularly regarding coffee) in the market; as
such, many have started diversifying their income streams away from tea and coffee alone (006,
110, 211, 401, Chief). However, diversification does not seem to be a significant trend in the
region as 82% of questionnaire respondents report no change in their crop selection over time,
and 13% report a decrease.
Over the past few decades, a market for perennial tree crops, most notably macadamia and
avocado, has emerged encouraging farmers to diversify their production in order to increase
income stability (010, 106, 110, 113, 209, 401, AO1, AO2, Chief). Farmers in the region have
shown a willingness to try such new initiatives with the potential to increase earnings from their
land (AO1). The comparatively low input intensity of perennial tree crops is promising; less
labour and fertilizer is needed to produce profitable yields compared to tea and coffee (110, 113,
AO1). This can be correlated with the decreased in inputs observed for ageing farmers that
support the idea of less input intensive crops due to the general decreasing trend in inputs (figure
5.1.2). The current success of these crops has led farmers to plan for increasing their tree crop
production (110, 209). Shortcomings in relying heavily on perennial tree crops might include a
lack of market access that is still in a developmental stage (106, 113), the inconsistent incomes
due to annual or biannual harvest cycles (211, mFGD), and the multiyear delay between planting
saplings and their first harvest which can be hard for ageing farmers to justify (fFGD, mFGD).
Page 26
20
Figure 5.1.2: Changes in inputs applied over the years such as manure, fertilizers, pesticides, and irrigation. From
questionnaires.
Farming remained an integral part of older farmers’ lives even if they had an off-farm job when
they were younger (003, 010, 106, 110, 113, 211, 401). Figure 5.1.3 shows that a slight majority
of the sampled population were career farmers without other jobs, but a comparatively large
portion also had jobs before entering old age. Only one of the 38 sampled farmers transitioned
into farming from another career (figure 5.1.3).
Page 27
21
Figure 5.1.3: Distribution of farmers that have always only been farming (a majority of 55%), farmers that have had
other occupations over the years (42%), and farmers that switched to farming over the years (3%). From
questionnaires.
While figure 5.1.4 shows a slight majority of ageing farmers report no change in their proportion
of land under cultivation, a fairly large portion of the sample population admits to a decrease in
their proportion of agriculturally productive land. There may be confounding considerations of
whether land no longer under production by ageing farmers is now under cultivation by the
children who will inherit the land through the common practice of subdivision, despite the land
still legally belonging to the elderly. Some old farmers report already subdividing land among
their children (004, 113, 211), yet it is unclear how land is then considered part of the total when
declaring decreasing land area production versus no change.
Page 28
22
Figure 5.1.4: Changes in portion of land used for farming, 39% of informants decreased the area used for farming on
their land, while 53% have experienced no change through time. From questionnaires.
5.2. Livelihood Capitals
5.2.1. Natural capital
A vast majority of informants state that weather events negatively impacted farming over the
years (004, 006, 010, 106, 110, 113, 209, 211, 401, Chief, fFGD, mFGD). Both FGDs ranked
weather and droughts as their fifth major challenge. Indeed, the decrease of rain and increasing
regularity of severe droughts has damaged agricultural production and threatened the viability of
rearing livestock. “The main event that has affected me most as a farmer is drought, [...] maybe
every 2 to 3 years” (010). Such statements about droughts are common, while only one farmer
states that he was never affected (209).
Page 29
23
Since tea and coffee were introduced en masse by the British settlers and then perpetuated by
Kenyan farmers, wide areas of forests have been cleared to make room for these cash crops (004,
006, 106, 211). At a smaller scale, some farmers cut down trees on their own land to make room
for the cash crops in addition to their subsistence food crops (004, 006).
Agriculture seems to have intensified over the years in the sense that the soil is continuously
being farmed rendering it infertile (mFGD). Due to the decrease in soil fertility over time, the
need for fertilizers has increased in order to compensate (113). However, the use of fertilizers
has increased over time for only 16% of the old farmers we held questionnaires with which
shows that the vast majority of the respondents (84%) had either not changed, decreased, or are
not using fertilizers at all (figure 5.1.2). Manure from livestock also constitutes a significant
input (106).
5.2.2. Physical capital
As soil erosion is a problem on bare soil (mFGD), most of the informants experienced issues
with erosion which leads them to take measures against it; some plant napier grass (004, 010,
209), trees (110, 209), or tea (113) to prevent soil erosion. Terracing is also used (006, 010, 209)
as well as digging trenches (006, 110, 113, 209). One farmer even has large bags filled with soil
laying in the paths of his tea fields to prevent soil erosion, but states that he is now too old to do
something better (211). Some of them have been taught during educational events many years
ago how to prevent soil erosion (010, 110). Informant 006 explains that he dug trenches and built
terraces in 1984 and that they did not need any maintenance since then. This shows that farmers
took measures against erosion when they were younger, but are not willing to put energy into
maintaining these measures, as their physical capabilities have reduced.
Informants pointed at the lack of irrigation system due to its cost, which hinders the adoption of
horticultural crops such as cabbage (fFGD, mFGD). For that matter, a vast majority of 82% of
questionnaire respondents have never used irrigation at all, which makes the link to the fact that
old farmers are less inclined than young farmers to adopt and invest in technologies.
Page 30
24
5.2.3. Human capital
From the questionnaires, half of the 19 out of 38 respondents had not finished primary education
or had no education at all, while 12 completed primary school, 2 completed secondary (until high
school), and 5 completed higher education. “We used to help our families farm until eventually
taking over the land, but today it is different; maybe it is the education that has changed this”
(106). While this trend today is far less ubiquitous than in the past, many old farmers began
farming immediately after finishing school (106, 110, 211). Informal education through
participation in educational events or farmer field schools improved farming practices (110,
113). Indeed, farmers lack knowledge to grow e.g. fruit trees (mFGD). Moreover, knowledge
about best management practices has resulted in increasing yields (106).
However, old age results in reduced health, physical capabilities and energy to work the land due
to body pains and memory loss, causing productivity to decrease (003, 006, 010, 110, 113, 211,
401, Chief, AO2, fFGD, mFGD). The female FGD rank ageing, in reference to reduced health
and physical capabilities, in second position while males rank it in fourth position. “Ageing has
an effect on their health as their bones become weaker and they cannot be as effective as they
once were” (fFGD).
Indeed, applying inputs has become one of the most difficult part of farming due to age (110).
Knowledge acquired throughout years of experience as a farmer is not enough to compensate for
reduced health and strength (010, 211, Chief). Additionally, respondents declare that widowhood
is often a problem as the workload on the farm is higher when working alone in addition to
maintaining the house (fFGD, mFGD). Hence, some of the informants feel the need to hire
labour for these reasons (004, 006, 106, 113, 401). On the other hand, some of them claim that
farming is healthy and maintains their physique (106, mFGD).
All of the respondents are household head, most of them live alone (24%), while 66% of them
live in an household consisting of 1-4 additional persons, and a minority of 11% consisting of 6-
Page 31
25
8 additional persons. According to one of our key informants, the number of children per family
has decreased in the area (AO2), and farmers evoke the fact that their children have migrated to
larger cities and out of farming (003, 106, 209, 211, 401), resulting in less family labour
available (003, 106, 110, 209, 113, 401, AO2, mFGD) and sometimes working alone on the farm
(fFGD). “Due to the increased labour, some farmers experience physical difficulties” (fFGD).
Therefore, labour ranks in third and fourth position for respectively male and female FGDs, even
though they refer to labour by blaming both the decreased availability of family and hired labour,
and a decrease in activity, which is inherent to physical capabilities. Hence, labour input has
mostly decreased over time (figure 5.2.3.1a) even though a majority of 62% of respondents to the
questionnaire are hiring additional labour (figure 5.2.3.1b). The questionnaire data also reveals
that the farmers decreasing the amount of labour were primarily the ones dependent on family
labour, with 40% decreasing family and hired labour, and 50% decreasing family labour.
Figure 5.2.3.1a: Changes in labour input over the years. A majority of 61% of the respondents have decreased their
labour input on their farm. Figure 5.2.3.1b: Type of labour working on the farm. A majority of 62% respondents hire
additional labour while 38% rely only on family labour. Labour is sometimes hired seasonally for harvests only.
From questionnaires.
Page 32
26
5.2.4. Financial capital
Several respondents own livestock as a source of financial resources, including cows (004, 010,
110, 209, 211, 401), chickens and geese (006, 113). However, droughts have caused the amount
of livestock to decrease for several farmers (003, 006, 106, 110, 209, 211) which resulted in a
decrease in financial stability (110, 113). The amount of livestock farmers can support is
reported to decrease with age (004, 006, 113, AO2).
Less diversification of income sources is believed to decrease old farmers’ financial stability
(004). Several informants point out poor marketing and their reduced productivity as drivers for
their reduced income (106, 110, 209, 211, Chief, AO2). The cost of production is higher now
than before, thus old farmers’ income is lower even though crops prices have increased (AO1).
This lack of financial resources, ranked as the main challenge for both FGDs, hinders the
farmers’ possibilities to invest in new agricultural ventures and technology (003, 209, fFGD,
mFGD), to buy inputs (106, 110, 211) and to hire labour (004, 010, 106, 211, fFGD, mFGD).
Indeed, the cost of hired labour has increased over the years and is now too expensive for some
farmers (003, 006, 113, AO1, AO2, fFGD).
Some farmers rely on loans to enhance farming (fFGD). Moreover, some farmers that used to
have another employment beside farming receive pensions, however it does not correlate with an
increase in financial stability for these farmers (003, 106, 401). Many informants declare their
expenses have decreased due to the fact that their children moved out several years ago (004,
006, 113, 209, 211, Chief, AO2, mFGD). It is normal for children to send remittances to their
parents (003, 006, 010, 113, 209, 401), but it only constitutes a minor contribution. Furthermore,
women during the FGD stated that they do not receive remittances, but on the contrary, they send
money to their children (fFGD).
Prices fluctuations for tea and coffee and mismanagement do not guarantee good access to
market and stable incomes for farmers (401, Chief, AO1, AO2, fFGD). Prices for tea are still
rather low (113, 401, fFGD) even though it has improved over the years (401) and the bonus
earned at the end of the year is good (211, fFGD). Several informants declared that coffee prices
Page 33
27
have gone down over the years (006, 113, 209, 401, fFGD), however, one informant states that
prices have doubled in 2015 (110). Concerning coffee, farmers are paid only once a year and
delay in payments sometimes happen, which negatively affects them (mFGD). Additionally,
when the weather is favourable, many farmers increase their productivity which results in less
demand and thus more competition and lower incomes (fFGD). It is believed that farming was
more profitable in the 1970s and 1980s when cooperatives were introduced and before cartels
infiltrated them (106). Yet, a good market for macadamia and avocados is opening up (110,
AO1, AO2).
5.2.5. Social capital
Several informants agree that the community helps them through sharing farming techniques and
organizing group trips to educational events (004, 106, 110, 113, AO2). Some have the feeling
that they learn a lot from interacting with their neighbours (004, 006, 106, 110, 113), whereas
others state there was no interaction among the community members regarding farming practices
(010, 211). “They learn from one another but they do not join hands in farming. You can see
your neighbour is growing something good, you go there, you talk to him, he teaches you” (004).
Two informants argued that today, contrary to before, farmers tend to follow their own ideas
without coordinating with their neighbours (004, 401). Moreover respondents explained that
competition between farmers brings them motivation and pride as they want to be “good
farmers” (mFGD).
The youth is not willing to work in agriculture anymore (106, 401). Young people “refuse to do
the work and just want to work in the town. [...] They just want money but do not understand no
one else will grow the food if they do not” (106). Some farmers hope their children will return to
the land and become farmers (003, 004, 110, 113, 211), informant 211 “would love that, so that
they can support their families in an easy way”. On the other hand, some farmers are afraid their
children would sell their piece of land once they inherit, and therefore not pass it on (004, AO2).
Selling inherited land is despised in Kikuyu culture because they fought for their lands in the
years leading up to independence (004, Chief, AO2).
Page 34
28
Due to general population growth and land subdivision after inheritance, lands have become
smaller and smaller, corresponding to a lack of financial resources (113, 211, 401, Chief, AO2,
mFGD), which hinders agricultural development in the region (401, Chief). Old farmers also
have a strong feeling of ownership over their lands, and are sometimes not willing to pass it on to
their children, hindering the transition of land to young more productive farmers (401, Chief,
AO1, AO2). However, one of our key informant stated that old farmers would not mind renting
out their land, as long as it is not sold, and that employing a manager would improve
productivity (AO2). Indeed, some farmers may rent out their land if it was larger (fFGD). On the
other hand, according to the chief: “The main driver for young, mature farmers to migrate to
urban areas is to go to Nairobi and work and live there, because the land at the family farm is too
small and therefore not sufficient income would be generated”.
5.3. Institutional and Organisational Influence
The institutional structures are the national and county governments and the policies and
legislation they put in place, while the organisations in this context include agricultural
cooperatives and SACCOs that purchase farmers’ produce and provide inputs and credits to
farmers.
One central way the government influences the rural population of farmers is through subsidised
inputs that help farmers (010, 110, Chief, AO2) such as fertilizer (Chief, AO2) and seeds (004,
113, 401, Chief), and by providing loans through commercial banks (004, 006, 010, Chief, AO2).
However, the government does not fund old farmers, but only the youth and women (AO2,
mFGD). Moreover, many farmers have experienced a decrease in subsidies (006) and in the
amount of information and education provided (003, 211, 401, AO2, mFGD). Most likely
because the amount of agricultural officers associated with the office in Othaya has been reduced
from 56 to 8 officers over the last years (AO2). Many farmers report that they have stopped
coming to educate them (003, 006, 106, 113, 211, 401, Chief, AO2, fFGD, mFGD). “Before,
Page 35
29
they used to have a specialist that would come to the farm and educate them about farming, but
today they rarely come, so production was higher when they used to come and teach them”
(006). Moreover, the government funds the youth and women, but there is no program for old
farmers (AO2, mFGD).
There is a lot of mismanagement especially within the cooperatives (209, Chief, AO2, fFGD),
and all the cooperatives have collapsed due to bad governance except the Othaya coffee
cooperative (AO2). Mismanagement has been ranked as second and fourth main challenge
respectively during the male and female FGDs. Mismanagement is due to cartels (106, Chief)
and it is clear in the way that farmers are sold fake pesticides and fertilizers. “They are not
effective and yields keep on decreasing, and there is the sale of fake or expired fertilizers”
(fFGD). Moreover some farmers believe that there are too many directors (110), and that these
directors always get re-elected for the cooperatives and have too high salaries (fFGD). There is
very limited transparency in the cooperatives since farmers that get supplied with inputs or
deliver coffee or tea do not know the price of the inputs they get nor the income they have earned
before they are paid (fFGD). At the same time the interest rates in banks are also high, deterring
farmers from taking up loans (Chief, AO2, mFGD), creating distrust to banks (003, 209, AO2),
and the same is the case for the SACCOs (fFGD) even though some find them useful for loans
(113, 211, AO2).
Farmers state that there is good security in the area (fFGD, mFGD), even though the fear of theft
is still hindering adoption of macadamia for some farmers (003, 006), and it has been one of the
challenges evoked by the male FGD. Furthermore, there is no law in place restricting subdivision
of land and stopping the decrease in land sizes, but it is not allowed to own below 0.25 acre
(Chief). These are all aspects of the governance structure that affect the livelihood strategies and
outcomes of ageing farmers (DFID, 1999). The government is actively trying to improve
livelihood strategies and outcomes by encouraging farmers to diversify their production with
avocado and macadamia through giving out 1 million trees (AO2) and regulating the sale of
macadamia to national markets ensuring a higher price for farmers (AO2).
Page 36
30
5.4. Livelihood Outcomes
Farming gives a sense of pride that provides a happy life for many old farmers in the region
(004, 106, 110). The lifestyle is a way of keeping active and avoiding the idleness that often
accompanies old age (106, mFGD). The ability to provide subsistence needs and alleviate the
worries of hunger is empowering to their work (010, mFGD). Working hard and receiving an
income from farming is some of the most rewarding aspects of the job for many people (003,
110, 211, 401, fFGD, mFGD). Others report self-dependence and the ease of life as their most
favorable aspects of farming (006, 106).
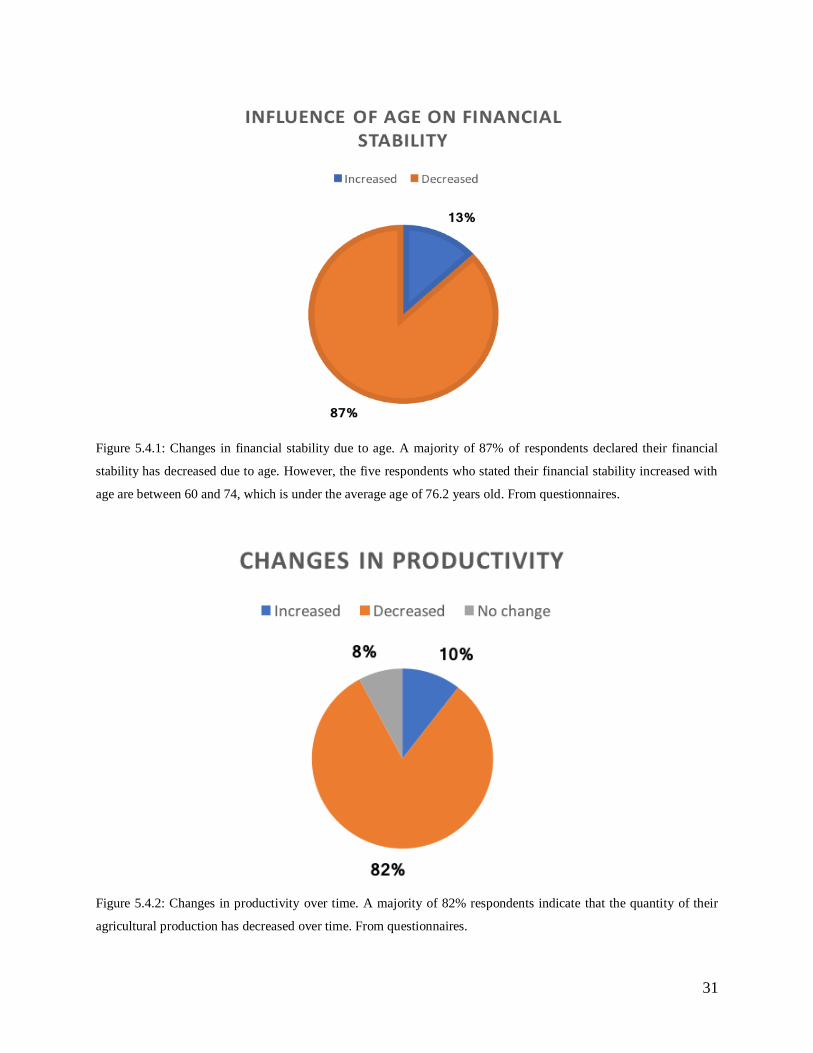
In order to understand how farmers are affected by ageing, changes in financial stability are
important to consider. The vast majority of the sample population discloses a decrease in their
financial stability corresponding to old age (figure 5.4.1). Widowhood was brought up as a
reason for decreased financial stability (113).
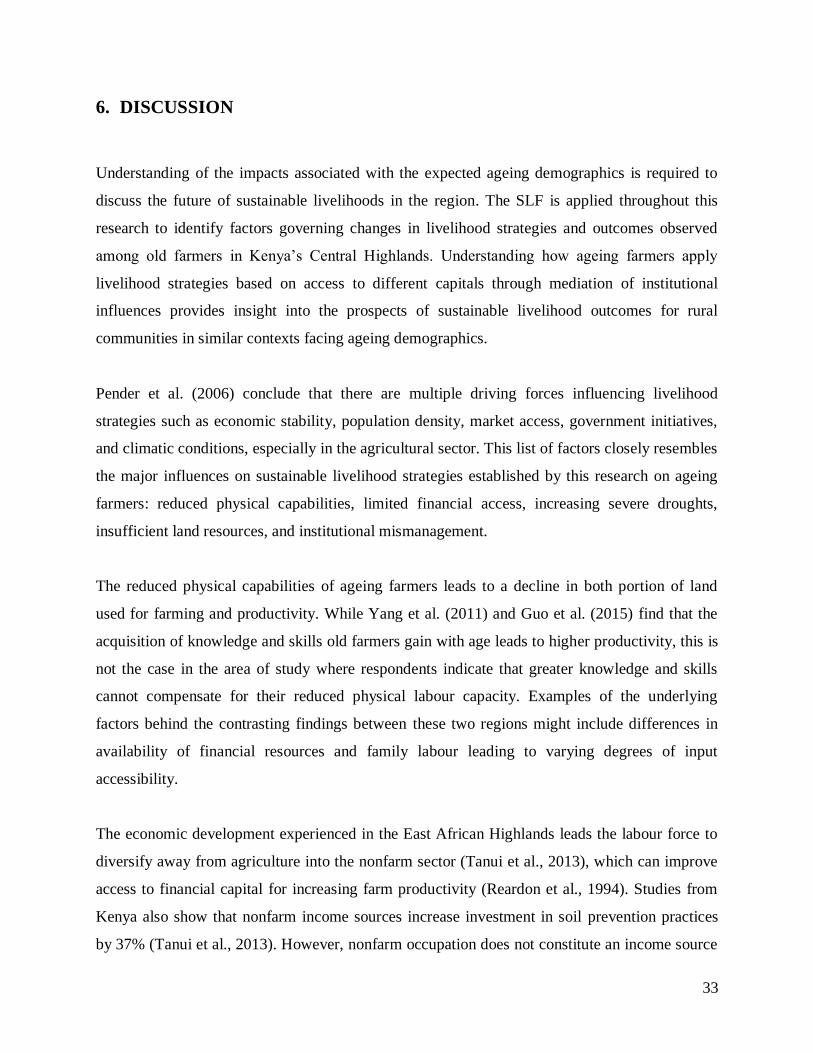
As depicted in figure 5.4.2, a major caveat appears to be the lower productivity that accompanies
ageing for many farmers (003, 006, 110, 211, AO2). Direct causes of this correlation are reduced
work stamina from lower energy levels and overall diminishing physical capabilities (fFGD).
Some even mentioned increasing difficulties in consistently providing enough to eat for
themselves either through means of self-subsistence production or access to sufficient financial
resources (110, 211).
Page 37
31
Figure 5.4.1: Changes in financial stability due to age. A majority of 87% of respondents declared their financial
stability has decreased due to age. However, the five respondents who stated their financial stability increased with
age are between 60 and 74, which is under the average age of 76.2 years old. From questionnaires.
Figure 5.4.2: Changes in productivity over time. A majority of 82% respondents indicate that the quantity of their
agricultural production has decreased over time. From questionnaires.
Page 38
32
It is believed that old farmers farm 70-80% of the land in the study area (AO1, AO2). The
potential productivity and profits from the region’s farmland is inhibited by the unwillingness of
old farmers to relinquish their land to younger farmers (113, 401, Chief, AO1, AO2). When
transition of land does occur, subdivision usually accompanies the process further decreasing
potential productivity through the diminished efficiencies of scale of famers on increasingly
small inherited plots (113, mFGD). In fact, some farmers wish their children to find off-farm
jobs and not return since the lack of land access presents a barrier to successful farming in the
region (113, fFGD). Diminishing fertility of cultivated lands is a further limiting factor of
productivity for all farmers (113), especially the old who report applying less inputs with age
(figure 5.1.2) implying a decrease in their capacity to amend depleted soils.
Page 39
33
6. DISCUSSION
Understanding of the impacts associated with the expected ageing demographics is required to
discuss the future of sustainable livelihoods in the region. The SLF is applied throughout this
research to identify factors governing changes in livelihood strategies and outcomes observed
among old farmers in Kenya’s Central Highlands. Understanding how ageing farmers apply
livelihood strategies based on access to different capitals through mediation of institutional
influences provides insight into the prospects of sustainable livelihood outcomes for rural
communities in similar contexts facing ageing demographics.
Pender et al. (2006) conclude that there are multiple driving forces influencing livelihood
strategies such as economic stability, population density, market access, government initiatives,
and climatic conditions, especially in the agricultural sector. This list of factors closely resembles
the major influences on sustainable livelihood strategies established by this research on ageing
farmers: reduced physical capabilities, limited financial access, increasing severe droughts,
insufficient land resources, and institutional mismanagement.
The reduced physical capabilities of ageing farmers leads to a decline in both portion of land
used for farming and productivity. While Yang et al. (2011) and Guo et al. (2015) find that the
acquisition of knowledge and skills old farmers gain with age leads to higher productivity, this is
not the case in the area of study where respondents indicate that greater knowledge and skills
cannot compensate for their reduced physical labour capacity. Examples of the underlying
factors behind the contrasting findings between these two regions might include differences in
availability of financial resources and family labour leading to varying degrees of input
accessibility.
The economic development experienced in the East African Highlands leads the labour force to
diversify away from agriculture into the nonfarm sector (Tanui et al., 2013), which can improve
access to financial capital for increasing farm productivity (Reardon et al., 1994). Studies from
Kenya also show that nonfarm income sources increase investment in soil prevention practices
by 37% (Tanui et al., 2013). However, nonfarm occupation does not constitute an income source
Page 40
34
for the old farmers studied in the Othaya region. This reveals a different trend between the
greater farming community and that of old farmers which further aggravates the problems of
elderly who lack the financial resources to invest in farming.
Increasing extreme weather events in the region present serious dilemmas for ageing farmers
who lack the capacity to implement adaptive livelihood strategies, making this group more
vulnerable compared to young farmers (GoK, 2010). Rainwater storage and irrigation are
measures that can alleviate vulnerability to droughts in the region, but old farmers lack financial
resources to invest in these technologies and blame a lack of government support initiatives.
The decreasing trend in portion of land under cultivation among the elderly may be a coping
strategy for the lack of human and financial capitals. A lack of land access is one aspect
encouraging the migration of young people to urban areas like Nairobi for study and work
opportunities which, in turn, decreases the rural workforce. There are increasing constraints on
access to land in Kenya and other countries in the region primarily driven by population
pressure, fragmented land holdings, and declining soil fertility (Tanui et al., 2013). The
interwoven issues concerning land transition, youth migration, and ageing rural populations leads
to decreases in access to human and social capital negatively affecting old farmers’ livelihood
strategies and outcomes. Consequences include both reduced productivity and financial stability
on the individual and regional scale. Unless the traditional inheritance systems are reformed to fit
within a free market situation, population growth and ageing rural communities will decrease
productivity and food security (Tanui et al., 2013). Reforming these systems could facilitate both
more sustainable transition of lands and increased productivity.
The limitations ageing farmers face regarding access to livelihood capitals are exacerbated by the
fact that government programs exclusively focus on the youth and women and by
mismanagement within formal institutions and the agricultural cooperatives. There appears to be
significant problems with organisational corruption especially within the tea and coffee
cooperatives, negatively impacting the growers of these crops whom are primarily old farmers.
Limited extension services in the region leaves farmers without the education necessary to
amend agricultural practices and improve productivity. While the issue of mismanagement
Page 41
35
concerns farmers in general, it is a recurring challenge old farmers pointed out, and their age may
lead to greater difficulties with adapting and coping with these issues. The disengagement theory
in gerontology states that old people tend to disengage from society while simultaneously being
rejected (Tornstam, 1989); this concept supports reasoning that old farmers’ are inherently
predispositioned to have disadvantaged access to public benefits and suffer more from the
obstacles posed by institutionalised mismanagement.
Pender et al. (2006) found macadamia and avocado to be the most common tree crops in the
region providing good incomes. The Kenyan government attempts to promote income
diversification with avocados and macadamia, but most old farmers lack the knowledge to adopt
perennial trees crops and the risk of theft poses a serious threat. Inadequate dissemination of
agricultural knowledge due to poor education services maintains old farmers’ inertia to leave
their livelihood strategies regarding crop selection unchanged. This underlines the institutional
underestimation and disregard for the consequences of an ageing population. The government
overlooks the chance to proactively implement policies and legislation to improve structural
management and effectively mitigate the socioeconomic consequences of ageing.
Age is a factor in the sustainability of land use since old farmers’ ability to implement and
maintain soil erosion measures, such as terraces, decreases with age. These challenges make it
difficult for ageing farmers to maintain the natural resource base through sustainable land use
practices. The potential for higher productivity and sustainability from land managed by young
farmers is limited by the reluctance of ageing farmers to pass on their land. This claim is well
supported by the data on declining use of inputs due to age alongside continuous cropping
patterns that do not allow for needed fallow periods to maintain soil fertility; this issue presents
one of root causes of declining food production in Africa (Ayuk, 2001). Another significant
factor for maintaining soil fertility is the significant decreases in the amount of livestock owned
by old farmers not only has implications for income and financial stability, but also for the
sustainability of the land use since animal manure is a key resource in nutrient management and
supplies much needed organic matter for the soil. As the two strategies stand with either old
farmers holding onto their land or subdividing amongst children, the data shows that both
courses lead to decreased land productivity.
Page 42
36
The aspects of changing dynamics in livelihood strategies for old farmers are dependent on a
range of variables. Therefore, it can be difficult to isolate the degree of influence age plays as a
factor. However, age was found to be directly correlated with access to several of the capitals
and the livelihood strategies, thus implicating many aspects of ageing affects the sustainability of
livelihood outcomes for farmers.
Page 43
37
7. CONCLUSION
The key impacts of age on livelihood strategies and livelihood outcomes are depicted in figure
7.1. Based on the data, it can be argued that most ageing farming communities in the region lack
the resource capacity to diversify their crop selection away from tea and coffee resulting in the
static trend. The decreasing trend in productivity and financial stability among ageing farmers is
likely influenced by limited capacity to diversify with better suited crops in the context of
decreasing access to livelihood capitals, i.e. land size, labour, and livestock, as illustrated in the
figure. The declining access to these resources with age and the worsening of outcomes argues
for the need of new context-specific livelihood strategies for ageing farmers.
Figure 7.1: On the left, aspects considered as governing factors affecting financial stability and productivity of
ageing farmers, on the right, changes on financial stability and productivity. From questionnaires.
The reduced access to livelihood capitals of ageing farming communities leads to decreases in
productivity. This results in a lack of necessary financial resources to invest in adequate inputs
and hire labour to compensate for the lack of workforce caused by urban youth migration. While
youth migration may result in decreased expenses for the ageing farmers, it also creates a lack of
incentivisation to improve productivity. Most old farmers in these communities lack the financial
Page 44
38
resources and knowledge required to diversify their production away from tea and coffee and
transition to less labour-intensive crops. The institutional and organisational support is
inadequate for ageing farmers further hindering their capacity to achieve sustainable livelihood
strategies and outcomes. However, old farmers seem to be proud of their occupation, either
because they are able to maintain their ancestors’ legacy, or because they can sustain themselves
financially and nutritionally. Incessant fragmentation of land due to the process of subdivision
and continuous cropping methods threaten sustainable land use and soil fertility.
The trends in livelihood outcomes analysed through the lens of the SLF clearly indicate that
ageing farmers face a decrease in financial stability. While the physical capabilities of farmers
significantly decrease with age, their well-being remains satisfactory. The decreasing access to
capitals that corresponds to ageing diminishes their adaptive capacity and consequently increases
vulnerability to various economic and natural shocks. Overall, the results indicate that ageing
reduces farmers’ access to the livelihood capitals required for establishing sustainable livelihood
strategies and outcomes.
Page 45
39
8. PERSPECTIVES AND RECOMMENDATIONS
If birth rates continue to decline, the future demographic structure will result in a reversed
population pyramid, since the current massive young population will retire around 2060-70
posing significant social and economic challenges. This calls for immediate policy actions if
future socioeconomic consequences are to be averted. Policy and legislation that improves
institutional transparency, provides financial aid and investments, and establishes educational
programs would enable ageing farmers to better cope with the challenges they face. These
measures can enable access and utilisation of adequate inputs and the pursuit of sustainable land
use practices to achieve sustainable livelihood outcomes.
Adoption of less input-intense perennial tree crops such as avocado and macadamia trees may
constitute an effective alternative for old farmers. Farmers’ interest in adopting tree crops is
limited by a lack of knowledge and education. However, tree crops take several years to mature
which might limit the attractiveness of this livelihood strategy for old farmers. Therefore, a slow
transition to these less labour-intensive crops should be facilitated by mediating institutions and
organisations. Perennial tree crops can also alleviate the struggle of maintaining soil fertility for
future generations.
Formulating formal leasing contracts would enable young farmers to rent pieces of land from
older farmers who are unable to efficiently manage the entirety of their land. This approach to
facilitating youth engagement in agriculture can provide additional income sources for old
farmers from otherwise fallow or unproductive land while increasing overall productivity in the
region. A standardised contract would ideally prevent fraud and deter distrust incentivising
ageing farmers to lease excess land while intensifying on their remaining plots.
Additional research into the aspects of sustainable land use in ageing farming communities will
reveal valuable information on driving factors for maintaining soil fertility and productivity.
Comparative studies with young and old farmers in different regions could provide further
knowledge for the research of ageing rural population impacts on sustainable land use.
Page 46
40
9. REFERENCES
Aboderin, I. (2012) ‘Global Poverty, Inequalities and Ageing in Sub-Saharan Africa: A Focus for
Policy and Scholarship’, Journal of Population Ageing, 5(2), p87.
Awiti, A., Scott, B., Bhanjee, S. (2017) East Africa Youth Survey 2017 [online]. Available at:
https://ecommons.aku.edu/eastafrica_eai/20/ (Accessed 13 February 2018).
Ayuk, E. T. (2001) ‘Social, economic and policy dimensions of soil organic matter management
in sub - Saharan Africa: Challenges and opportunities’, Nutrient Cycling in Agroecosystems,
61(1–2), p183-195.
Biritwum, R., Mensah, G., Yawson, A., Minicuci, N. (2013) Study on global AGEing and adult
health (SAGE) Wave 1 - The Ghana National Report. PDF [online]. Available at:
www.who.int/healthinfo/survey/SAGESurveyManualFinal.pdf (Accessed 29 MArch 2018).
Cattell, M. G. (2003) ‘African Widows: Anthropological and Historical Perspectives’, Journal of
Women & Aging, 15(2-3), p49-66
Central Intelligence Agency (CIA), (2018) The World Factbook 2018 [online]. Available at:
https://www.cia.gov/library/publications/the-world-factbook/geos/ke.html (Accessed 1 April
2018)
Central Intelligence Agency (CIA), (2017) The World Factbook 2017 [online]. Available at:
https://www.cia.gov/library/publications/the-world-factbook/geos/ke.html (Acessed 1 April
2018)
The Constitution of Kenya (2010) [online]. Available at
http://www.icla.up.ac.za/images/constitutions/kenya_constitution.pdf (Accessed 15 February
2018).
DFID (1999) Sustainable Livelihoods Guidance Sheets. PDF [online]. Available at:.
https://www.eldis.org/vfile/upload/1/document/0901/section2.pdf (Accessed 10 February 2018).
Page 47
41
FAO (2017) The future of food and agriculture: Trends and Challenges. PDF [online]. Available
at: http://www.fao.org/3/a-i6583e.pdf (Accessed 17 February 2018).
GoK (2010) National Climate Change Response Strategy (NCCRS). PDF [online]. Available at:
https://cdkn.org/wp-
content/uploads/2011/12/National_Climate_Change_Response_Strategy_Executive_Brief.pdf
(Accessed 5 April 2018).
Guo, G., Wen, Q., Zhu, J. (2015) ‘The Impact of Aging Agricultural Labor Population on
Farmland Output: From the Perspective of Farmer Preferences’, Mathematical Problems in
Engineering, 2015, p1-7
Knoema. (2015) World Data Atlas [online]. Available at:
https://knoema.com/atlas/Kenya/topics/Education/Literacy/Adult-literacy-rate (Accessed 4 April
2018).
Liu, Y., Yamauchi, F. (2013) ‘Population density, migration, and the returns to human capital
and land - insights from indonesia’, Food Policy, 48, p182-193.
Mwaura, G. M. (2017) ‘Just Farming? Neoliberal Subjectivities and Agricultural Livelihoods
among Educated Youth in Kenya’, Development and Change 48(6) p1310–1335.
Paarup, B. (1989) ‘Liv og Forklaring: En analyse af rationalet bag et ritual hos Koma i Nigeria’
in Hastrup, K., Ramløv K. (eds) Kulturanalyse: Fortolkningens forløb i antropologien.
Copenhagen: Akademisk Forlag, pp. 46-54.
Pender, J., Place, F., Ehui, S. (2006) Strategies for sustainable land management in the east
african highlands. Washington, D.C: International Food Policy Research Institute.
Population Reference Bureau (PRB), (2011) Kenya population datasheet 2011 [online].
Available at: https://www.prb.org/kenya-population-data-sheet-2011/ (Accessed 4 April 2018).
Reardon, T., Crawford, E., Kelly, V. (1994) Links between Nonfarm Income and Farm
Investment in African Households: Adding the Capital Market Perspective, American Journal of
Agricultural Economics, 76, p1172-1176.
Page 48
42
Schlenker, W., Lobell, D. B., (2010) ‘Robust negative impacts of climate change on African
agriculture’, Environmental Research Letters, 5(1), p1-8.
Scoones, I. (1998) ‘Sustainable Rural Livelihoods: A Framework for Analysis’ IDS Working
Paper 72, Brighton: IDS.
Smith, P. G., Morrow, R. H., Ross, D. A. (2015) Field Trials of Health Interventions: A Toolbox.
3rd edn, OUP Oxford: Oxford, UK, pp. 224 - 239.
Tanui, J., Groeneveld, R., Klomp, J., Mowo, j., van Ierland, E. C. (2013) Explaining investments
in sustainable land management: The role of various income sources in the smallholder farming
systems of western Kenya [online]. Available at: http://ageconsearch.umn.edu/record/161275
(Accessed 5 April 2018).
Tornstam, L. (1989) Gero-transcendence: A reformulation of the disengagement theory. Aging
Clin Exp Res 1:55. https://doi.org/10.1007/BF03323876
United Nations, Department of Economic and Social Affairs (UN DESA) (2017) World
Population Ageing 2017 - Highlights. PDF [online]. Available at:
http://www.un.org/en/development/desa/population/publications/pdf/ageing/WPA2017_Highligh
ts.pdf (Accessed 4 April 2018).
United Nations Department of Economics and Social Affairs (UN DESA) (2011) World
population prospects, the 2010 revision [online]. Available at:
www.un.org/en/development/desa/population/publications/trends/population-
prospects_2010_revision.shtml (Accessed 25 March 2018).
Yang, J., Yang, G., Hu, X. (2011) ‘Age effects on the agricultural labor force farmers cultivated
land use eficency—evidence from different levels of economic development in the region’,
Resources Science, 9, p1691–1698.
Wiesmann, U., Kiteme, B., Mwangi, Z. (2016) Socio-Economic Atlas of Kenya: Depicting the
National Population Census by County and Sub-Location. 2nd revised edition. Nairobi: KNBS.
Page 49
43
World Bank (2016) World Development Indicators 2016. PDF [online]. Available at:
http://databank.worldbank.org/data/download/site-content/wdi-2016-highlights-featuring-sdgs-
booklet.pdf (Accessed 4 April 2018).
World health organization (2014) Ghana country assessment report on ageing and health. PDF.
[online]. Available at:
http://apps.who.int/iris/bitstream/handle/10665/126341/9789241507332_eng.pdf;jsessionid=8EA
0DD194B11DF8A2F6BC5E922310169?sequence=1 (Accessed 5 April 2018).
Yeboah, K., & Jayne, T. S. (2016) ‘Africa’s Evolving Employment Structure’, International
Development Working Paper, East Lansing: Michigan State University.
Page 50
44
10. APPENDICES
List of appendices
1. Synopsis ............................................................................................................. 45
2. Overview of the methods ................................................................................... 60
3. Questionnaire ..................................................................................................... 60
4. Semi-structured interviews ................................................................................. 68
4.1. List of informants ........................................................................................ 70
4.2. Guidelines .................................................................................................... 70
4.2.1. Farmers .............................................................................................. 70
4.2.2. Key informants .................................................................................. 70
5. Focus group discussions ...................................................................................... 71
5.1. Guidelines ..................................................................................................... 71
5.2. Problem and solution ranking ....................................................................... 73
Page 51
45
1. Synopsis
Ageing rural communities’ impact on sustainable land use
in Kenya’s Central Highland
Synopsis
Authors:
Louise C. Branlard (ndb289)
Aslak H. C. Christiansen (wfx997)
Helene L. Hannibal (vnz331)
Jesse C. Jones (nhm902)
Kenyan counterparts:
Phyllis Wamaitha
Moses Ndarua
Supervisors:
Christian Pilegaard Hansen & Lise Tjørring
Course name:
5440-B3-3F18; Thematic Course: Interdisciplinary Land Use and Natural Resource
Management
Word count: 2350
Date: 23.02.2018
Page 52
46
1. Introduction
The research site is located near the city of Othaya in Nyeri county in the Central Highlands of
Kenya. The area is characterized by a high population density (PRB, 2011), and the average
land holding is 0.5-2 hectares per household (Pender et al., 2006). Fertile soils and good market
access stimulate growth and commercial agricultural enterprises. However, income sources still
vary considerably across the Central Highlands (Pender et al., 2006).
Nyeri county has a total population of approximately 690,000 with 76% of its inhabitants living
in rural areas (Wiesmann et al., 2016). About 21% are in-migrants from other counties of
Kenya. There is also migration from rural to urban areas within Nyeri (Wiesmann et al., 2016).
Nationally, 7% of the population is 55 or older. The median age in Kenya is 19.7 with 40% of
the population school-going age (0-14) and 19% prime-working age (15-24) (CIA, 2017). A
low median age indicates how demographics in Kenya are an already existing concern. While
there is a high population density in the Central Highlands of Kenya, this does not translate into
a strong agricultural labour force; since a high proportion of the population is school-going age,
there is limited allocation of human capital for farming from this age demographic (Pender et
al., 2006). There is also a clear shift in employment trends among Kenyans in all age groups
towards off-farm sectors (Yeboah & Jayne, 2016), yet the government and NGOs have tried to
engage youth in agriculture through funding training and other initiatives (Mwaura, 2017). This
consequent lack of workforce presents issues for the agricultural sector (Mwaura, 2017).
Currently, agriculture directly provides the livelihood of 75% of the population; however, only
11% of the Kenyans aged 18-35 are interested in farming as an occupation (Awiti et al., 2015;
Mwaura, 2017). This disinterest will significantly influence Kenya’s economy as agriculture
contributes 36% of the country’s GDP (World Bank, 2016).
There are multiple driving factors that influence livelihood strategies including economic
stability, population density, access to market, the presence of development projects, and
climatic conditions, especially in the agricultural sector (Pender et al., 2006). Indeed, high
population density can result in deterioration or intensification of farmlands and can support
the creation of non-farm industries. These effects can also be the result of in-migration (Liu &
Yamauchi, 2013). Good market access can stimulate the production of cash crops, thereby
creating a shift in agricultural practices and crop varieties and providing more stable incomes
Page 53
47
(Pender et al., 2006). Moreover, climate change is predicted to negatively impact yield of major
staple crops such as maize in the coming decades (Schlenker & Lobell, 2010).
Demographic changes in households are also a driver for changes in agricultural practices and
livelihood strategies. Rural communities across developing countries face a comprehensive
problem characterized by an ageing population (FAO, 2017). As cities attract young
generations and income sources shift to other sectors, agricultural labor capital is diminished
leading to threatened food security and livelihoods among rural communities (FAO, 2017). In
the agricultural sector, an ageing workforce has major implications on sustainable land use and
development (FAO, 2007). Furthermore, older farmers’ health and capabilities are reduced
which affects the application of livelihood strategies and their outcomes. A decline in physical
strength requires additional labour to achieve the same outcomes. Additionally, widowhood
hinders productivity as a husband and a wife are more efficient together despite their advanced
age (Cattell, 2003). Some crops and cultivation practices are more labour intensive than others.
Thus, a shift in livelihood strategies and income sources might be observed in ageing rural
households. Access to information due to financial resources and other factors like illiteracy
can provide further obstacles for ageing households. Even though 78% of the population over
the age of 15 can read and write, only 50.8% of the population over 65 years old is literate
(Knoema, 2015; CIA, 2017).
Institutional processes and organisational structures are of great influence regarding access to
various livelihood resources and, consequently, mediate their influence on livelihood strategies
adopted by rural households (DFID, 1999). Indeed, institutions, organisations, policies, and
legislation can either restrict or improve access to certain forms of capital. Hence, such factors
indirectly shape sustainable livelihood outcomes, i.e. well-being, income level and stability,
natural resource resilience, and sustainability.
There is an apparent lack of information in the literature concerning ageing rural populations
and the connection with agricultural based livelihoods and sustainable land use practices. This
problem is particularly relevant in developing countries as previously discussed, and research
is particularly limited in focus on the countries of Sub-Saharan Africa.
To begin, an overview of the age distribution in Othaya will be determined. Then, the research
will be structured according to the Sustainable Livelihoods Framework (SLF) proposed by
Page 54
48
Scoones (1998). Data about changes over time in agricultural practices, occupations, and the
livelihood resources that older farmers have access to will be collected in order to understand
how these changes affect sustainable livelihood outcomes among ageing rural communities.
Information about livelihood resources will be categorized in the different capitals listed by the
SLF – natural, physical, human, financial, and social capital (DFID, 1999). Further
categorization and analysis of the influential role that livelihood resources and strategies play
in establishing sustainable livelihood outcomes will occur after collecting data from the
questionnaire results completed by ageing farmers in the area.
2. Research questions
Main research question:
How does ageing of rural communities affect livelihoods in Kenya’s Central Highlands?
Sub-research questions:
1. How have livelihood strategies of ageing farmers changed over time?
2. How does access to the different forms of capital and institutional influence affect livelihood
strategies of ageing farmers?
3. What are the livelihood outcomes and consequences of these pathways?
3. Theoretical Framework
The research aims to understand the stated objectives through adoption of the Sustainable
Livelihoods Framework (SLF) as it is defined by Scoones (1998). This framework offers a
consistent structure to analyse the achievement of sustainable livelihoods by small-farm holders
in developing countries such as Kenya. We will base our definitions of livelihood and
sustainable livelihood on the following definitions: “A livelihood comprises the capabilities,
assets (including both material and social resources) and activities required for a means of
living. A livelihood is sustainable when it can cope with and recover from stresses and shocks,
maintain or enhance its capabilities and assets, while not undermining the natural resource
base.” (Scoones, 1998). The SLF is an interdisciplinary approach that relies on five main
Page 55
49
components: contexts, livelihood resources, institutional processes and organisational
structures, livelihood strategies, and sustainable livelihood outcomes (Scoones, 1998). Scoones
explains that, in a particular historical, socio-economic, and demographic context, certain
combinations of livelihood resources, or capital, lead to certain combinations of livelihood
strategies that, in turn, lead to certain outcomes. Moreover, institutions and organisations
greatly influence the establishment of certain strategies (Cf. figure 1). A livelihood strategy is
defined as an activity adopted in order to achieve livelihood outcomes; this activity can be
agricultural intensification or extensification, livelihood diversification within or outside
agriculture, or migration (Scoones, 1998). Livelihood resources that may influence strategies
are divided into five different forms of capital: natural (e.g. land and water), physical (e.g.
infrastructure and energy), human (e.g knowledge and skills), financial (e.g. livestock and
insurance), and social (e.g. family and organizations) (DFID, 1999). Livelihood outcomes are
characterized by livelihood security, well-being and capabilities, as well as livelihood and
natural resource resilience.
Figure 1: Simplified schematic of the different components of the Sustainable Livelihoods Framework (SLF).
The arrows represent a relationship between two components.
4. Methodology
Page 56
50
The methods described will be used to acquire the data necessary to answer the primary research
question (section 2) through the lens of the objectives identified under the three sub-research
questions (appendix 5.1).
4.1. Qualitative methods
4.1.1. Participant observation
Dewalt et al. (1998) describes how taking part in and observing a given culture or group of
people’s everyday lives, activities, rituals, etc. is important for our understanding of that certain
field. When asking our informants about their everyday life and their relation to different
agricultural issues, we might not get all the information we need for our analysis. This is
because some cultural knowledge is implicit and our ignorance may lead to a lack of awareness.
This can be characterized as silent knowledge (Bundgaard, 2010). During the participant
observation we hope to collect visual and contextual knowledge about land use, as well as a
deeper knowledge on the aspects of our informant’s everyday life that are too innate or sensitive
to discuss through interview. We also plan on performing a working day exercise where we
follow the informants around their farm and help them throughout their day.
4.1.2. Informal interviews
According to Bernard (2011), an informal interview is characterized by a complete lack of
control over the interview and the issues touched upon. This type of interview can be a good
way to gain rapport or trust with informants due to the informal conditions it is carried out
under. Spradley (1979) describes how the first period of the interview is often characterized by
a mutual awkwardness. As time passes by and the relationship between interviewer and
respondent develops, the mutual trust increases and the interviewer gets access to more and
more important information. Therefore, this method can be relevant when information about
sensitive topics is needed. Due to the explorative nature of the method, we hope to gain
information on relevant aspects of livelihoods that might not be apparent initially or help in
identifying other informants who would be appropriate candidates for interviewing. Informal
interviews inherently synergize well with participant observation, and the methods will be
simultaneously utilized in the field.
Page 57
51
4.1.3. Semi-structured interviews
A semi-structured interview follows a loosely defined guideline often based on overall thematic
questions relevant for the research. During the process, the interviewer can deviate from the
guideline to pursue relevant research subjects arising from the informant. If the conversation
dies out during the interview, the guideline can be used to introduce new questions and assure
that all relevant subjects are addressed. The semi-structured interview is most useful when time
is limited with informants (Bernard, 2011). Through conducting semi-structured interviews,
insight will be gained into informants’ perspective on changes experienced over time such as
agricultural practices, occupational diversification, and impact of migration. Furthermore,
knowledge on access to the different capitals and institutional processes will be collected
leading to an understanding of the livelihood outcomes of these pathways.
4.1.4. Life-story interviews
As a method for understanding individual lives and connecting with others’ experience, life-
story interviews are very useful. A life-story interview offers a wide range of human
characteristics and qualities, and people telling their own stories reveals a lot about their unique
experience. Historical construction of older farmers’ lives can be very useful for the research
questions proposed in this project (Atkinson, 1998). Through using a narrative approach to our
interviews, we hope to get more personal information about the way our informants experience
changes over time in livelihood strategies, access to resources, and related outcomes.
4.1.5. Focus group discussions
Focus group discussions (FGD) provide a good environment for understanding collective action
and group beliefs which are not captured in personal interviews (Mikkelsen, 2005). The focus
group yields different data than interviews: “FGD´s show attitudes as socially performed
instead of individually performed” (Jakobsen, 2012). Therefore, one should be careful when
interpreting consensus opinion arising during FGDs. Group discussions rarely reveal any
personal opinions, and the group dynamic might result in a feeling of consensus, thereby
leaving out deviations in opinion which might exist outside of the group environment. However,
in some cases a ‘safe space’ is established where people feel more comfortable sharing personal
views; this safe space is useful in approaching sensitive issues (Mikkelsen, 2005). The group
dynamic will be used as it is expected to provide new information not obtained in the interviews
through collectively stimulating the memory of older farmers; thus, gaining additional
Page 58
52
information about historical changes in agricultural practices and livelihood strategies not
gained during personal interviews may become possible. We might also be able to gain
information about the transforming structures and processes (i.e. institutions and organizations)
affecting the livelihood strategies of older farmers, and how this has changed over time.
4.2. Quantitative Methods
4.2.1. Area measurement, GPS systems
GPS will be used to map out the area in the first days of the fieldwork and places of specific
interest to the research questions. GPS mapping might also be applied in conjunction with
creation of the farm typology (mapping land holdings).
4.2.2. Creation of farm typologies
Step by step comparison of farm functioning in a delimited area will be determined by mapping
the locations of farmers interviewed. The classification method is based on extensive data about
farm functioning such as family, objectives, history, productions, management, techno-
economic results, biophysical constraints etc. (Alvarez et al., 2014). According to Giller et al.
(2011) and Tittonell et al. (2010) the collection of data from farms is an essential step in the
construction of typologies, and they advise using a survey to capture the whole farming system.
Data can be obtained through sampling older farmers and building a basis of understanding
regarding farm resources, income/output, and a general resource flow which will highlight the
important resources affecting livelihood strategies (Alvarez et al., 2014).
4.2.3. Questionnaire
Questionnaires are useful for collecting large amounts of categorical information. This method
is suitable for organizing and analyzing demographic features of a subject group but is
somewhat limited in detail. It can be argued that deeper information such as beliefs, feelings,
and behaviours can be difficult to quantify through questionnaires (Mikkelsen, 2005).
Questionnaires are usefully applied in initial phases of data collection to obtain an overview of
the group studied. The information gained through this can be instructive for the application of
more in-depth methods. Additionally, the method is useful for establishing a relationship and
Page 59
53
knowledge about key informants and can be used to gain knowledge about the general trends
in agriculture and the sampled area’s demographics.
References
• Alvarez, S., Paas, W., Descheemaeker, K., Tittonell, P., Groot, J.C.J., (2014).
Constructing typologies, a way to deal with farm diversity: general guidelines for the
Humidtropics. Report for the CGIAR Research Program on Integrated Systems for the
Humid Tropics. Plant Sciences Group, Wageningen University, the Netherlands.
• Atkinson, R., 1998. The Life Story Interview, London: Sage Publications.
• Awiti, A., B. Scott, and S. Bhanjee (2015). East Africa Youth Survey 2015. Nairobi:
East Africa Institute, Aga Khan University. data.eadialogueseries.org (accessed 15
April 2016).
• Bernard, H. Russell. 2011. Research Methods in Anthropology: Qualitative and
Quantitative Approaches. Maryland: AltaMira Press.
• Bundgaard, H. 2003. ’Lærlingen’. In: Hastrup, K. (red.). Ind i verden. Copenhagen.
Hans Reitzels Forlag.
• Cattell, M. G. (2003). PhD: African Widows: Anthropological and Historical
Perspectives, Journal of Women & Aging, 15:2-3, 49-66, DOI:
10.1300/J074v15n02_04
• Central Intelligence Agency (CIA), 2017. The World Factbook 2017. Washington
DC. Available at: https://www.cia.gov/library/publications/the-world-
factbook/geos/ke.html
• Dewalt, K., Dewalt, Billie, R and Wayland, Carol B, In: H. Russel Bernard (ed.),
1998, “Participant Observation”, Handbook of methods in cultural Anthropology.
Walnut Creek: Alta Mira Press.
• DFID (1999). Sustainable Livelihoods Guidance Sheets. Department for International
Development. https://www.eldis.org/vfile/upload/1/document/0901/section2.pdf
• FAO (2017). The future of food and agriculture: Trends and Challenges. Available at:
http://www.fao.org/3/a-i6583e.pdf
• Giller, K.E., Tittonell, P., Rufino, M.C., van Wijk, M.T., Zingore, S., Mapfumo, P.,
Adjei-Nsiah, S., Herrero, M., Chikowo, R., Corbeels, M., Rowe, E.C., Baijukya, F.,
Mwijage, A., Smith, J., Yeboah, E., van der Burg, W.J., Sanogo, O.M., Misiko, M., de
Ridder, N., Karanja, S., Kaizzi, C., K’ungu, J., Mwale, M., Nwaga, D., Pacini, C.,
Page 60
54
Vanlauwe, B. (2011). Communicating complexity: Integrated assessment of trade-offs
concerning soil fertility management within African farming systems to support
innovation and development. Agricultural Systems nr. 104, pp. 191-203.
• Jakobsen, H. (2012). Focus groups and methodological rigour outside the minority
world: Making the method work to its strengths in Tanzania. Qualitative research, vol.
12, no. 2, pp. 111 - 130.
• Knoema, 2015. World Data Atlas. Available at:
https://knoema.com/atlas/Kenya/topics/Education/Literacy/Adult-literacy-rate
• Liu, Y., Yamauchi, F. (2013). Population density, migration, and the returns to human
capital and land - indsights from indonesia. International food policy research
institute. Discussion paper 01271.
• Mikkelsen, B. (2005). Methods for Development Work and Research: A New Guide
for Practitioners. London: SAGE Publications.
• Mwaura, G. M. (2017). Just Farming? Neoliberal Subjectivities and Agricultural
Livelihoods among Educated Youth in Kenya. International institute of social studies.
Development and Change 48(6): 1310–1335.
• Pender, J., Place, F & Ehui, S. (2006). Strategies for sustainable land management in
the east african highlands. Washington, D.C: International Food Policy Research
Institute.
• Population Reference Bureau (PRB), (2011). Kenya population datasheet 2011.
• Schlenker, W. and Lobell, D. B., (2010). Robust negative impacts of climate change
on African agriculture. Environ. Res. Lett. 5 014010.
• Scoones, I. (1998) Sustainable Rural Livelihoods: A Framework for Analysis, IDS
Working Paper 72, Brighton: IDS.
• Spradley, James (1979). The Ethnographic Interview. New York: Holt, Rinehart and
Winston.
• Tittonell, P., Muriuki, A., Shepherd, K.D., Mugendi, D., Kaizzi, K.C., Okeyo, J.,
Verchot, L., Coe, R., Vanlauwe, B. (2010). The diversity of rural livelihoods and their
influence on soil fertility in agricultural systems of East Africa – A typology of
smallholder farms. Agricultural Systems 103, pp. 83-97.
• Yeboah, K., & Jayne, T. S. (2016). Africa’s Evolving Employment Structure
(International Development Working Paper 147). East Lansing: Michigan State
University.
Page 61
55
• Wiesmann, U., Kiteme, B., Mwangi, Z. (2016). Socio-Economic Atlas of Kenya:
Depicting the National Population Census by County and Sub-Location. Second,
revised edition. KNBS, Nairobi. CETRAD, Nanyuki. CDE, Bern. DOI:
http://dx.doi.org/10.7892/boris.83693
• World Bank (2016). World Development Indicators 2016. Washington, DC: World
Bank. doi: 10.1596/978–1-4648–0683–4. License: Creative Commons Attribution CC
BY 3.0 IGO
Page 62
56
Appendix
Data matrix
Research
questions
Objectives Hypothesis Data required Methods
1. How have
livelihood
strategies of
ageing farmers
changed over
time?
1.1 Determine
the changes in
agricultural
practices (i.e.
intensification
and/or
extensification)
over time.
Older farmers might
cling more to traditional
agricultural practices,
inhibiting adoption of
technology and
agricultural inputs; this
might improve land use
sustainability but
decrease agricultural
productivity.
Overview of
different farming
practices, and how
they have changed
over time
• GPS mapping
• questionnaires
• semi-
structured and
life-story
interviews
• focus group
discussions
1.2 Determine
livelihood
diversification
over time, both
within and
outside
agriculture.
Within agriculture: There
might be changes in cash
crop/staple crop
production ratios - which
may be caused by a
better access to the
market, more and more
stable incomes.
Outside agriculture:
There might a change in
occupation away from
farming to non-
agricultural sectors.
Overview of
income sources
and occupations
over time
• questionnaires
• semi-
structured and
life-story
interviews
• focus group
discussions
1.3 Determine
the impact of
youth migration
out of
agriculture on
livelihood
strategies of old
farmers.
Youth migration out of
agriculture reduces the
available labour force.
Effects of reduced
labour availability
due to migration
trend
• semi-
structured
interviews
• focus group
discussion
2. How does
access to the
different forms
of capital and
institutional
influence affect
2.1 Natural
capital: land
quality, size,
typology, and
water quality
and access.
If it is steep maybe old
people will struggle to
cultivate the land; if
there is no irrigation and
water access is distant, it
Determine access
and
typology/quality
of land and water
for old farmers.
• GPS Mapping
• farm typology
• questionnaires
• participant
observation
Page 63
57
livelihood
strategies of
ageing farmers?
will cause difficulties for
old farmers.
• semi-
structured
interviews 2.2 Physical
capital:
transport,
infrastructures,
energy, storage,
technologies
Improper storage might
lead to loss of post-
harvest goods.
Good infrastructure
facilitate market access.
Infrastructures are also
e.g. wooden shed where
they store their tools or
livestock.
There might be a
technological access gap.
Determine how
access and quality
of physical capital
affect livelihood
strategies of older
farmers.
2.3 Human
capital: labour,
skills, health,
knowledge
Ageing farmers’s health
and physical condition
might hinder
productivity.
However, ageing farmers
might have more
knowledge and skills
from experience.
Determine
whether old
farmers’ health
and physical
condition
influence their
agricultural
practices.
Determine how
experience has
shaped knowledge
and skills of older
farmers.
2.4 Financial
capital: income,
market, credits,
insurance
Lack of income will
affect the farmers ability
to develop agricultural
practices and livelihood
strategies.
Banks may not want to
lend money to older
farmers.
Lack of effective
insurance might also be a
problem with climate
change.
Determine how
access and quality
of financial capital
influence
livelihood
strategies.
Gain knowledge
about markets
(access,
fluctuations),
sufficient incomes,
poverty/wealth,
the benefit of
insurance and
credits.
Page 64
58
2.5 Social
capital: family
and neighbours,
relationships,
group
affiliations.
Older farmers may be
less engaged in
collective action,
decision-making, and
information sharing.
Gain knowledge
on the access and
quality of human
capital among
older farmers.
Determine if the
farmers’
relationships help
them to overcome
certain issues.
2.6 Determine
the effect of
transforming
structures and
processes
mediated by
institutions and
organisations
on access to
capital for older
farmers.
Institutions and
organisations play an
influential role in
determining the access to
capitals and impact on
livelihood strategies.
Corruption might be an
inherent aspect of the
quality of institutions,
organizations, policies,
and legislation.
Knowledge on the
influence of
institutions,
organisations,
policies, and
legislation
regarding access
to and exchange
between capitals
as they relate to
livelihood
strategies.
Knowledge on
ageing farmers’
definition and
experience with
corruption.
• questionnaires
• semi-
structured
interviews
• participant
observation
• interview with
agricultural
officer
• group focus
discussion
3. What are the
livelihood
outcomes and
consequences of
these pathways?
3.1 Determine
the
consequences
on: income
level, income
stability,
degrees of risk,
and well-being.
Diversification of
livelihood strategies
increase income levels
and stability.
Knowledge on
farmers’
perspective of
workload, income
improvement, and
well-being.
• questionnaires
• informal and
semi-
structured
interviews
• participant
observation
3.2 Determine
the
environmental
consequences
of different
livelihood
strategies:
resilience and
sustainability.
There is increasingly less
agricultural labour
available leading to
deterioration of rural
livelihoods and
inadequate adaptation to
climate change
Determine if the
farmers’
livelihood can
“cope with and
recover from
stresses and
shocks [...], while
not undermining
the natural
resource base”
• questionnaires
• informal and
semi-
structured
interviews
• participant
observation
Page 65
59
(Conway and
Chambers, 1992)
3.3 Develop
understanding
of long-term
consequences
and trends.
There is increasingly less
agricultural labour
available leading to
deterioration of rural
livelihoods and
inadequate adaptation to
climate change.
Farmers’ views on
the future
improvements or
changes
• data analysis
Page 66
60
2. Overview of applied methods
Questionnaires Semi-structured interviews Focus group
discussions Farmers Farmer and retired
agricultural officer
Key informants
38 9 1 3 2
3. Questionnaire
Introduce ourselves and our objectives before the survey begins.
“We are university students here to learn about well-being of ageing farmers in this community.
We are trying to understand what effects old age has on farming practices and your access to
agricultural resources. We would greatly appreciate your help in gaining insight into your life
as part of a piece to this puzzle.”
ithui twi arutwo a university na tukite itura riri rianyu guthoma uria andu akuru mararima na
kana urimi wao niusenjetie na ukuru na kana nimarakinyerwo ni indio ciiganie na urimi.
Ask if the person wants to stay anonymous.
“Your answers will remain strictly confidential and you are free not to answer certain questions
if you wish. All responses remain anonymous and you do not have to provide your name if you
do not wish. If you do, it may help us contact you later if we could use further information for
our research.”
Nitungienda mumenye ati mashokio maku tukumatumira githomoini gitu tu na hari gutuarithia
urimi wanyu na mbele. “Ni wega umenye ati tomuhaka uheyane ritwa riaku na wina wiathi
kwaga gucokia kioria ogiothe tugukuria.”
GPS point: No.: x: y: z:
Location:
Page 67
61
Date: _____/_____ Time: _____:_____
Informant:
Telephone number:
Interviewer:
Observer:
Translator:
Personal information
1. Name: ____________________________
2. Gender: Male __________ Female __________
3. Age:__________
4. Marital status: Single _____ Married _____ Widowed _____ Divorced _____
Wee wi muhiku / niuhikanitie / niukuithitie / (niwahikite/niwahikitwo mugitigana)
Household information
5. Who is the household head?: __________________________
We niwe mwene guku?
6. People currently living in the same household:
Muri aigana aria muikaraga guku?
Relationship Age Gender Occupation Name
1)
2)
3)
Page 68
62
4)
5)
6)
7)
Education and network
7. Which level of education have you completed?
Wakinyirie ha githomo giaku?
Started and unfinished Completed
Primary
Secondary
Tertiary (explain):
Informal (explain):
8. Have you participated in any of the following agricultural networks?
Munyitanagira atia na arimi aria ange guikuria?
• Farmers field school: __________________________________________________
• Cooperative: _________________________________________________________
• Organisation: ________________________________________________________
• SACCO: ____________________________________________________________
• Other: ______________________________________________________________
Occupation and income
9. What is your current occupation(s):
_______________________________________
Wikaga atia kuona uvosho waku?
Page 69
63
10. Have you changed your occupation and income sources over time? If yes:
Niuri washegia wira kana mawira maria makuheaga uvosho?
Occupation and income sources Time
11. Rank your current income sources from highest to lowest?
No nyende uvange mawira maku ukiambia na wira uria ukuheaga uvosho muinge
1. __________________________________________________________________
2. __________________________________________________________________
3. __________________________________________________________________
4. __________________________________________________________________
5. __________________________________________________________________
6. __________________________________________________________________
12. Are you planning to continue farming or shift to other income sources?
Wina mufago wa guchejia kana kutigana na urimi na hihi kuingirira mawira mang´e?
___________________________________________________________________________
___________________________________________________________________________
13. How did you obtain the land of your farm?
Mugunda uyu urarima wawonire atia?
Inheritance: _____ Purchasing: _____ Renting: ___ Other: _____________
Igai ria muciari / Kugura/ Gukombora/ maigi
14. How has age influenced your financial stability over time?
Ukuru waku ukugiritie atia guthondeka mbeca cia kuigana?
Increased:_____ Decreased:_____ No change:_____
Page 70
64
mbecha ciaku nishingihite/ niinyihite / hatire na ugaruruku
Farming
15. What is the size of your land?
Mugunda waku uigana atia?
_______ acres
16. How has the size of your land changed over time?
Muigana wa mugunda waku niucingetie na mahinda?
Increased:_____ Decreased:_____ No change:_____
Niwongererete / niunyihite / hatire na ugaruruku
17. How have you changed the area of land you use for farming?
Muigana wa mugunda waku uria urarima niucengetie?
Increased:_____ Decreased:_____ No change:______
Niwongererete / niunyihite / hatire na ugaruruku
18. What is the size of your farm compared to the rest of the village.
Muigana wa mugunda waku weigana atia ukigerekania na wa aria ange muringaine?
Small:____________ Medium:_____________ Large:____________
Ni munini/ wi gatagatiini/ ni munene
19. Which crops do you grow from most to least in land area?
Urimaga mimera ireku kuuma iria meinge nginya iria minini?
1. ____________________________
2. ____________________________
3. ____________________________
4. ____________________________
5. ____________________________
6. ____________________________
7. ____________________________
Page 71
65
8. ____________________________
9. ____________________________
10. ____________________________
20. Do you have trees on your land? If yes, for what purpose:
Niuhandite miti mugaundaini waku? Hihi ni ya wira uriku?
• _______________________________________________________
• _______________________________________________________
• _______________________________________________________
• _______________________________________________________
• _______________________________________________________
21. Have you changed your crop selection over the years? If yes, how so:
Kiiria ukuragia nigichengetie na mahinda?
___________________________________________________________________________
___________________________________________________________________________
________________________________________________________________________
22. Has the quantity of your agricultural production changed over time? If yes, how
so:
Muigana wa urimi waku niucengetie na mahinda?
___________________________________________________________________________
___________________________________________________________________________
23. Have inputs changed over time:
Njira ciaku cia urimi nicengetie na mahinda?
• Mulching: ______________________________________________
• Composting: ____________________________________________
• Manure: _______________________________________________
• Fertilizer: ______________________________________________
• Tools:_________________________________________________
• Pesticides:______________________________________________
• Irrigation:_______________________________________________
• Other: __________________________________________________
Page 72
66
24. Has the number of livestock you own changed over time due to ageing?
Muigana wa mahiu maku nicengetie kwa mahinda niundu wa ukuru?
___________________________________________________________________________
___________________________________________________________________________
25. Do you use family labour and/or hired labour on your farm? If yes, how often?
Niwiurutagira wira waku kana ni kuandikana?
Family labour Hired labour
How often:
26. Has the labour input on the farm Increased/decreased with your age?
Mahuthiru maku ma mugunda nimaingehete kana nimanyihite na ukuru waku?
__________________________________________________________________________
Thank you for participating in our questionnaire. Would you like to be contacted and participate
in some of our further work? If yes, write telephone number at the beginning.
Niwega niundu wa unyitaniri wanyu. No wende tuaranirie ringi. Akoro no wende, no utuhe
namba yaku ya thimu.
Observations:
• Is the respondent comfortable during the interview?
___________________________________________________________________________
___________________________________________________________________________
• Does he/she seem reliable?
___________________________________________________________________________
___________________________________________________________________________
• Characteristics of the house and immediate surroundings (new/worn down, tin
roof/thatched roof, degree of cleanliness, electricity, tap water, toilet facilities…)
Page 73
67
___________________________________________________________________________
___________________________________________________________________________
• Assets (radio, TV, car, motorbikes, bicycle, mobile phone…):
___________________________________________________________________________
___________________________________________________________________________
Page 74
68
4. Semi-structured interviews
4.1. List of informants
Farmers
003 - 87 year old male
004 - 93 year old male
006 - 78 year old male
010 - 74 year old male
106 - 67 year old male
110 - 72 year old male
113 - 80 year old female
209 - 74 year old male
211 - 84 year old male
Farmer and retired agricultural officer
401 - 83 year old male
Key informants
Chief
Agricultural officer 1
Agricultural officer 2
4.2. Guidelines
4.2.1. Farmers
Ask if the person wants to stay anonymous.
“Your answers will remain strictly confidential and you are free not to answer certain questions
if you wish. All responses remain anonymous and you do not have to provide your name if you
do not wish. If you do, it may help us contact you later if we could use further information for
our research.”
Page 75
69
Nitungienda mumenye ati mashokio maku tukumatumira githomoini gitu tu na hari gutuarithia
urimi wanyu na mbele. “Ni wega umenye ati tomuhaka uheyane ritwa riaku na wina wiathi
kwaga gucokia kioria ogiothe tugukuria.”
Ask consent for the survey to be recorded.
“Would you agree to answering a brief survey and would you permit audio recording for strict
research purposes? Your answers will remain strictly confidential and you are free to not answer
certain questions if you wish.”
We start with making a timeline !
There is no order of the questions. Bring mandazis or other snacks.
We are here to learn something about your life as a farmer, so we would like to make a timeline
of your career:
Which events have affected you most through your life as a farmer?
Why did you start farming?
What do you like most about being a farmer?
What is the most difficult part about being a farmer?
Have you witnessed any general farming trends over your life in the region?
Questions related to research question 1 (strategies):
Have you done anything else than farming over the years?
How has your life as a farmer changed since you took over cultivating this land?
How has your choice of crops changed over the years? Why?
Are you planning to change which crops you are growing now? (relevant for the youngests)
Have you changed the amount of crops you grow for market compared to crops for personal
consumption, compared to when you were young?
Have you increased your amount of perennial crops such as fruit trees or trees for timber over
the years? Why? (trees are less labour-intensive).
What methods have you adopted or discarded relating farming practices? How have these
affected you as a farmer?
Are you doing anything to preserve your soil and crops against extreme weather events?
Have your yields increased since you started farming?
Page 76
70
What have been the determining factors for your choice of livestock? Why is livestock
important to you?
Do you have less expenses now compared to when you were younger, if yes how has it affected
your priorities within farming?
Has the amount of off-farm income changed since you started farming?
Questions related to research question 2 (capital and institutions):
Have you experienced any climatic changes over the years?
How is the market for selling your crops - how has it changed since you were young?.
How has your health/physical condition affected your farming strategies?
How has your labor (family and hired) resources changed over the years? Do you feel like youth
migration has impacted this?
How has farming experience and knowledge affected your yield and choice of crops.
Does the community help you to improve your agricultural practices? How?
Have the government and local authorities helped you in any way with farming? How?
How have farmers field school had an impact on your farming strategies?
How being part of SACCOs and/or cooperatives has affected your way of life?
Questions related to research question 3 (outcomes):
Do you feel like your income level and stability are now sufficient to support your needs
compared to when you were younger?
What is well-being for you? Do you feel that you have achieved these over the years? (e.g. self-
esteem, security, happiness, stress, vulnerability, power, exclusion)
Do you want your own children/grandchildren to become farmers? Why? – maybe rather
grandchildren than children because of most children already farm.
4.2.2. Key informants
• Introduce ourselves and define what we consider old (over 60).
• Do you think if ageing has impacted the cost of living for aging farmers, and if it a
reason why they may not try to earn more?
• How does it work if the sons do not want to take over the land?
Page 77
71
• How many old farmers are located in this area, and has the proportion of old farmers
changed over time? If yes, why?
• Get a list of the old farmers in the area or some statistics on how many old compared to
young.
• Have you noticed trends in diversification of livelihood strategies among the old
farmers?
• Does older farmers tend to diversify or decrease their amount of livestock, focus on
growing a specific crop, increase their amount of perennial crops such as trees that are
less labour-intensive?
• Are you aware of the challenges that older farmers are facing? Which are they? Do you
provide recommendations to deal with these challenges?
• e.g. if he sometimes have to deal with family conflicts over land
• e.g. old farmers complaining about the fact that they don’t get a lot of money especially
with coffee (might be linked to cooperatives).
• What are the main differences between young and old farmers in terms of financial
stability?
• Regarding market accessibility, - do they sell less crops at market
• Is the government or the region helping old farmers with e.g. pensions and other things?
• What are the plans for the future in order to solve these issues concerning older farmers?
5. Focus group discussions
5.1. Guideline
We are going to do the questionnaire with all of the respondents for the FGD before starting
the group discussions. However the ones arriving late we should ask them weather they would
be willing to do it after wards, so that we don’t waist the time of the ones that actually arrived
at time, and also because most of them will probably have to leave for lunch.
Francis is getting respondents for the FGD
Making a ranking exercise for the FGD
Page 78
72
Initially we will ask them to discuss what are some things that you all like about being a farmer.
Ranking exercise about the problems aging farmers are facing.
Before the ranking exercise we will brief the interpreters about what we are going to discuss
and how the focus group will work and what their role as a facilitator are. After we have
explained it to them, we will tell them to explain to us how they will introduce tha discussion
to the group, what we shall discuss and how they should act as fascilitators.
We will ask the group to make a brainstorm about problems associated with aging and
agricultural production, and the correlation between the 2, and after the mind map is done we
will ask the group to rank the biggest problem they are faced with, then the second best and
consecutively for the top 5. We are going to add in the below mentioned problems, we see as
the most relevant, if they are not mentioned in the mind map, or if the discussion dies out.
Mismanagement (mismanagement in institutions or organizations), Physical capabilities to
farm, climatic change/weather change (Drought, irregular rains etc.), land availability, labor
availability, financial resources, theft, widowhood.
Solution ranking, ask what the solutions are to the earlier mentioned
We will do this exercise in the same way as the problem ranking, and then we will pose the
overall research question again and ask for what they think could be solutions to this.
Planting of perennial fruit crops (macadamia and avocados), reduced labor requirement.
irrigation schemes.
Intensification – Intensify production on smaller land area and leasing away the remaining land
and earn income from that, and information on benefits of intensification. (Ask whether old
farmers would be willing to rent out their land to younger farmers, if they could increase
production and give a certain share to the old farmers, instead of maintaining low productivity
land).
Take a discussion about the conservatism relating transition of land, and problems of young
people not willing to move into agriculture.
Ask whether If your production have decreased with age, and why do you think that is
Page 79
73
Put a blank paper on the table so that the participants can make a mind map of the problems,
and we can add in if we fell that they are forgetting some relevant problems (which we have
identified as relevant)
Guide for interpreters: Make sure that Julius introduce the project, make everyone introduce
each other to the group to fascilitate a better dynamic, and explain thouroughly how this
exercise will work.
5.2. Problem and solution ranking
Problem and solution ranking for both female and male FGDs. During the female FGD,
solutions where not ranked as they were stated according to the corresponding problems (Cf.
section 4.5).