10
Sustainable Management Metropolia, Business Ethics IP week. 3 Collapse
| Date post: | 26-Dec-2015 |
| Category: |
Documents |
| Upload: | hope-davis |
| View: | 216 times |
| Download: | 0 times |
Sustainable ManagementMetropolia, Business Ethics IP week.
3 Collapse

Collapse
n Will our society collapse?
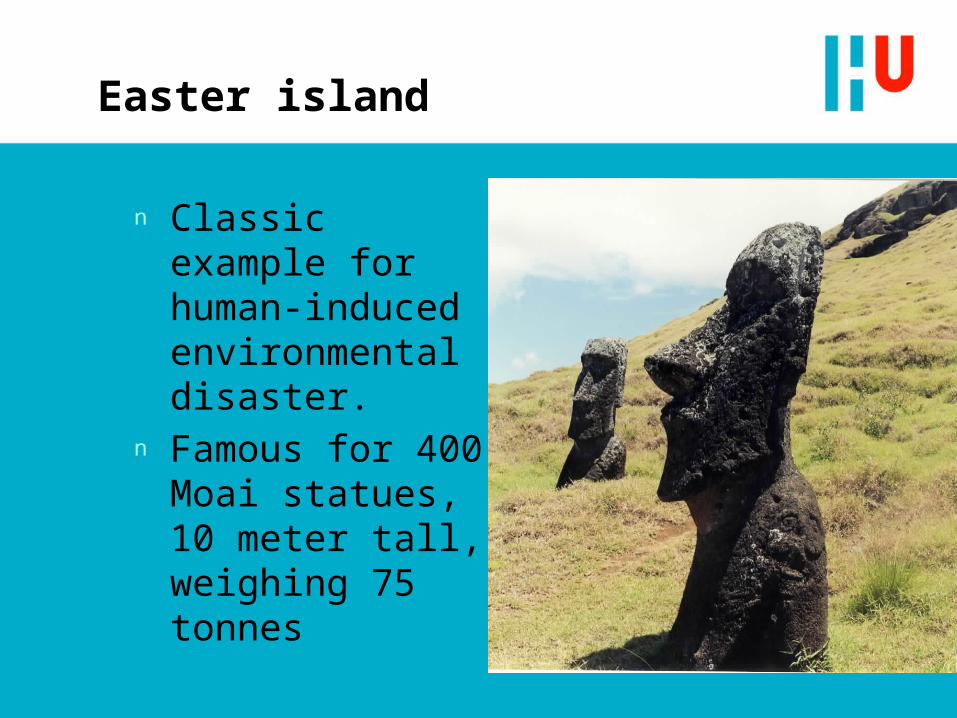
Easter island
n Classic example for human-induced environmental disaster.
n Famous for 400 Moai statues, 10 meter tall, weighing 75 tonnes

Easter Island geography
n 170 km2
n 3700 km form Chile East and 2000 km for Pitcairn Islands west
n Discovered in 1722 by Jacob Roggeveenn He found no trees, no animals other than
insects, and an impovered, underfed society
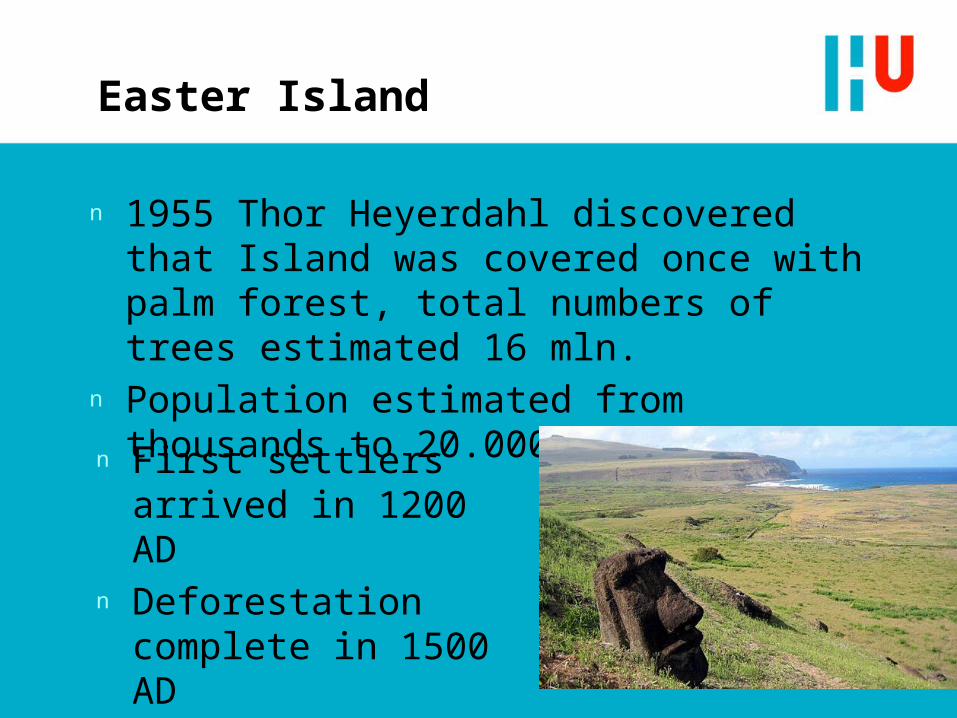
Easter Island
n 1955 Thor Heyerdahl discovered that Island was covered once with palm forest, total numbers of trees estimated 16 mln.
n Population estimated from thousands to 20.000
n First settlers arrived in 1200 AD
n Deforestation complete in 1500 AD
Easter Island
n Do you see similarities with our current society?
n Characteristics: n Closed ecosystemn Sensitive to destructionn Unsustainable practices
From: Collapse
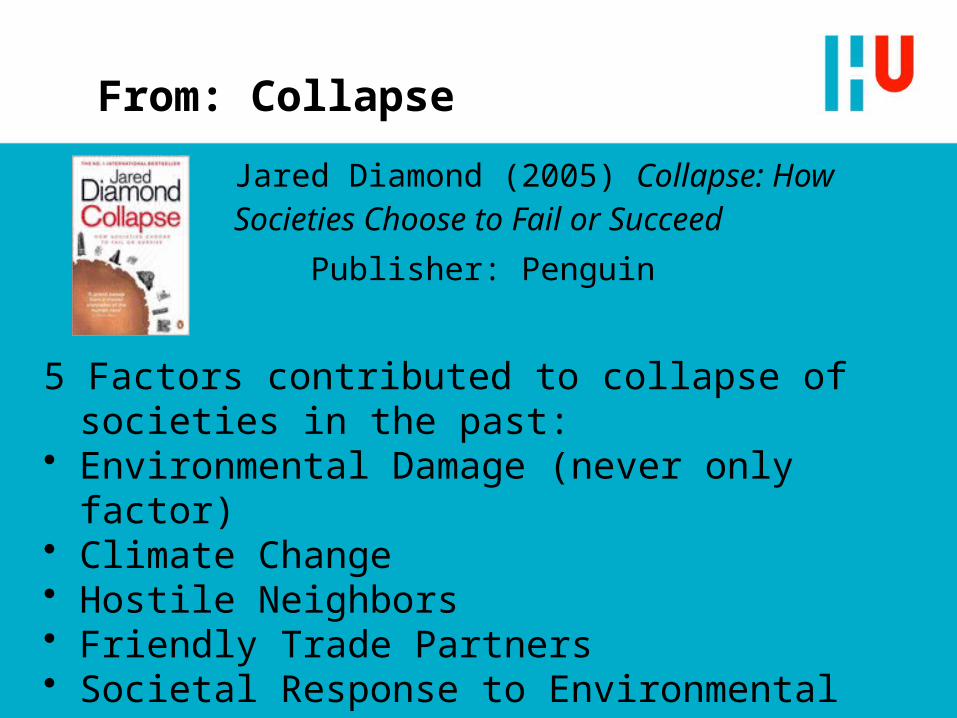
Jared Diamond (2005) Collapse: How Societies Choose to Fail or Succeed Publisher: Penguin
5 Factors contributed to collapse of societies in the past:
• Environmental Damage (never only factor)• Climate Change• Hostile Neighbors• Friendly Trade Partners• Societal Response to Environmental Change
(always included)
Maya collapse
n Population grew, while resources diminishedn Deforestation, hillside erosion, decrease in
agricultural land, man-made droughtn Increased fighting over diminishing resourcesn Drought because of climate changen Kings responses were; enrich themselves,
engage in wars, erect monuments, compete with other kings, extract food from peasants for soldiers
Development
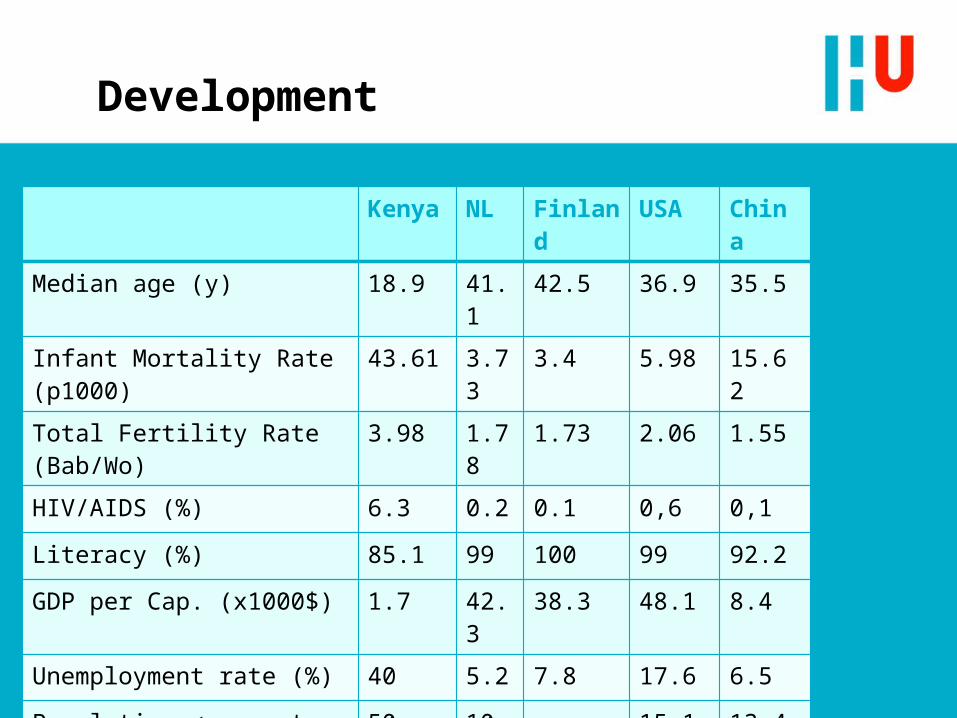
Kenya NL Finland USA China
Median age (y) 18.9 41.1 42.5 36.9 35.5
Infant Mortality Rate (p1000) 43.61 3.73 3.4 5.98 15.62
Total Fertility Rate (Bab/Wo) 3.98 1.78 1.73 2.06 1.55
HIV/AIDS (%) 6.3 0.2 0.1 0,6 0,1
Literacy (%) 85.1 99 100 99 92.2
GDP per Cap. (x1000$) 1.7 42.3 38.3 48.1 8.4
Unemployment rate (%) 40 5.2 7.8 17.6 6.5
Population < poverty line (%) 50 10.5 - 15.1 13.4
Ecological Footprint (gha/p) 1.18 6.19 6.16 8 2.21


