Brian Stafki │ Oregon Department of Environmental Quality Sustainable Materials Management in Oregon What is it? How did we get here? What does it mean for Oregon? Brian Stafki October 16, 2018 Recycling Association of Minnesota and Solid Waste Association of North America
Transcript
Brian Stafki │ Oregon Department of Environmental Quality
Sustainable Materials Management in Oregon
What is it? How did we get here? What does it mean for Oregon?
Brian Stafki
October 16, 2018
Recycling Association of Minnesota and Solid Waste Association of North America
2
3
Brian Stafki │ Oregon Department of Environmental Quality
Recycling in OregonWhy do we recycle?
FOR INTERNAL USE 4
Brian Stafki │ Oregon Department of Environmental Quality
Recycling benefits the environment
5
Brian Stafki │ Oregon Department of Environmental Quality
Benefits of waste recovery (Oregon, 2016)
6
• Prevented the use of 27 trillion BTUs of energy
o Equivalent to 2.8 percent of Oregon’s total energy use
• Reduced 2.9 million metric tons of carbon dioxide
equivalents
o Equivalent to annual tailpipe emissions from ~690,000
passenger cars
Brian Stafki │ Oregon Department of Environmental Quality
Oregon and SMMIs there more than recycling?
7
8
Brian Stafki │ Oregon Department of Environmental Quality
Sustainable materials management defined
9
“Materials management is an approach to serving human needs by using and reusing resources most productively and sustainably throughout their life cycles, generally minimizing the amount of materials involved and all the associated environmental impacts.”
— U.S. E.P.A.
Brian Stafki │ Oregon Department of Environmental Quality
Material life cycle
10
material extraction
and processing
manufacturing international transportation
end-of-life management home and business use retail distribution
domestic
transportation
Production
Consumption
Recycling is necessary, but insufficient
11
2006 U.S. GHG inventory
with 32% recovery (MSW)
provision
of
materials
42%
buildings
transporting
people
appliances
& devices 2006 U.S. GHG inventory with
very high recovery rate
(~95% MSW + >70% C&D)
“savings” 6%
Brian Stafki │ Oregon Department of Environmental Quality
Oregon adopts SMM
Vision: By 2050, Oregonians produce and use materials responsibly
while conserving resources, protecting the environment and living
well.
12
Brian Stafki │ Oregon Department of Environmental Quality
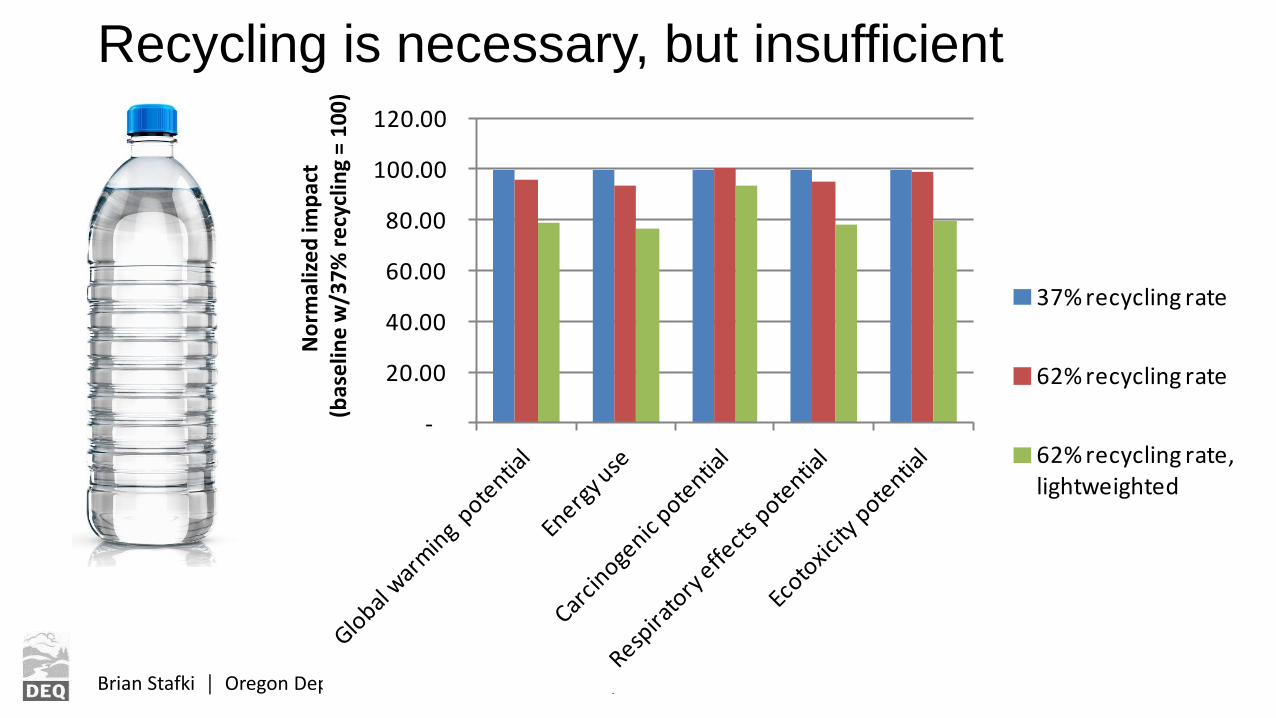
Recycling is necessary, but insufficient
13
-
20.00
40.00
60.00
80.00
100.00
120.00
37% recycling rate
62% recycling rate
No
rmalized
im
pact
(baseli
ne w
/37%
recyclin
g =
100)
Brian Stafki │ Oregon Department of Environmental Quality
Recycling is necessary, but insufficient
14
-
20.00
40.00
60.00
80.00
100.00
120.00
37% recycling rate
62% recycling rate
62% recycling rate, lightweighted
No
rmal
ize
d im
pac
t(b
ase
line
w/3
7%
re
cycl
ing
= 1
00
)
Brian Stafki │ Oregon Department of Environmental Quality
Recycling is necessary, but insufficient
15
-
20.00
40.00
60.00
80.00
100.00
120.00
37% recycling rate
62% recycling rate
62% recycling rate, lightweighted
tap water (worst case)
No
rmal
ize
d im
pac
t(b
ase
line
w/3
7%
re
cycl
ing
= 1
00
)
Brian Stafki │ Oregon Department of Environmental Quality
Recycling is necessary, but insufficient
16
-
20.00
40.00
60.00
80.00
100.00
120.00
37% recycling rate
62% recycling rate
62% recycling rate, lightweighted
tap water (worst case)
tap water (best case)
No
rmal
ize
d im
pac
t(b
ase
line
w/3
7%
re
cycl
ing
= 1
00
)
Brian Stafki │ Oregon Department of Environmental Quality