1 Sustainable mortgage funding markets for sustainable housing markets Author: Prof. Dr.rer.pol. Stefan Kofner, MCIH TRAWOS: Institut for Transformation, Housing and Social Spatial Development For the European Network of Housing Research International Housing Conference, Toulouse, France 5th July Prepared for the Plenary session 3: Legal and financial instruments for safeguarding sustaina- ble communities
Transcript
1
Sustainable mortgage
funding markets for
sustainable housing markets
Author: Prof. Dr.rer.pol. Stefan Kofner, MCIH
TRAWOS: Institut for Transformation, Housing and Social Spatial Development
For the European Network of Housing Research
International Housing Conference, Toulouse, France
5th July
Prepared for the Plenary session 3: Legal and financial instruments for safeguarding sustaina-
ble communities
2
Contents
1 A brief outline .............................................................................................................................................. 3
2 Types of mortgage credit funding instruments ......................................................................................... 4
2.1 Classical refinancing means ..................................................................................................................... 5
2.2 Asset sale .................................................................................................................................................. 5
2.3 Risk transfer .............................................................................................................................................. 8
2.4 Mortgage-specific and non-specific instruments ...................................................................................... 9
3 The housing cycle ....................................................................................................................................... 10
3.1 Definition and evidence of the housing cycle .......................................................................................... 10
3.2 Theories of the housing cycle .................................................................................................................. 15
3.2.1 Initial overshooting of house prices .............................................................................................. 16
3.2.2 The pig cycle ................................................................................................................................. 18
3.2.3 The Kuznets cycle ......................................................................................................................... 20
3.2.4 The credit cycle ............................................................................................................................. 21
3.2.5 Review of the last U.S. housing and credit cycle .......................................................................... 22
3.3 Effects of system-inherent factors on the housing cycle .......................................................................... 25
3.4 The role of interest rates ......................................................................................................................... 27
“A high-quality and progressive land culture necessarily requires an abundant and steady in-
flow of productive capital, it is simply impossible without this. ...
We have no better means to set in motion the existing capital, the entrepreneurial spirit and
the manpower, as the real credit.”1
Source: Rudolf Eberstadt: Handbuch des Wohnungswesens, Jena: Gustav Fischer, 2. Auflage
1910, S. 295.
The aim of this paper is to develop criteria to assess the available refinancing instruments for
mortgage credit according to their sustainability. The concept of sustainability is applied to
mortgage funding instruments and focuses on the continuous availability of the instrument at
affordable interest rates in all phases of the housing cycle. In other words the term sustainabil-
ity - as used here - is a matter of robustness in the face of market volatility.
The research question of the paper is deemed to be important because availability and price of
refinancing funds are of important for a steady access of borrowers to mortgage credit, a
steady development of primary mortgage rates and hence a steady flow of housing invest-
ment. Non-sustainable refinancing sources tend to accelerate the cyclical ups and downs of
housing markets. A non-sustainable funding instrument will be in ample supply when the
market is booming. Conversely, if the market is falling in terms of turnover, prices and the
like, a non-sustainable source can almost dry out and thus accelerate the downward tendency
of the market by restraining the supply of primary mortgage credit at an inopportune time.
The availability of a sustainable refinancing instrument on the other hand will develop along a
more stable path and accelerating effects will be limited. Since the welfare effects of regulato-
ry intervention are not obvious, possible reasons for the moderation of housing cycles will be
discussed.
In the paper a definition of the housing cycle will be given based on empirical observation of
relevant variables. Business cycle theories will be analyzed according to their explanatory
value for housing cycles. In this context the role of development time lags, the availability of
funding for mortgage credit and of other factors inherent in the housing system (e.g. appraisal
1 The quote in German original: „Eine hochstehende und fortschreitende Bodenkultur bedarf unbedingt eines
reichlichen und stetigen Zustroms von Produktivkapital; sie ist ohne diesen schlechthin unmöglich. … Wir ha-ben kaum ein besseres Mittel, um das vorhandene Kapital, den Unternehmungsgeist, die Arbeitskraft in Bewe-gung zu setzen, als den Realkredit.“
4
and innovative loan characteristics) with a pro-cyclical potential is discussed. It is assumed
that a high degree of market volatility is accompanied by net welfare losses.
This exploratory research paper shall contribute to our understanding of housing market cy-
cles and bubbles and their relation with primary and secondary mortgage markets. It can help
to determine the research design and data collection method for future research projects in this
field.
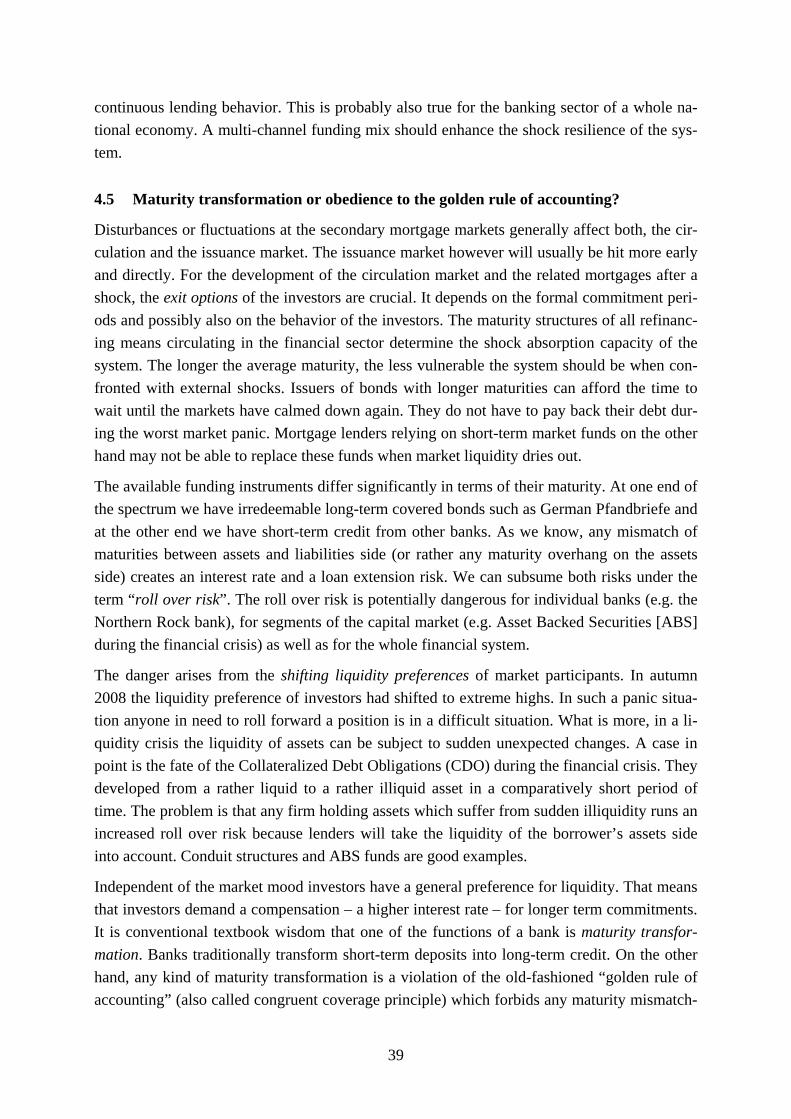
2 Types of mortgage credit funding instruments
Figure 1 shows in addition to the traditional funding instruments (such as mortgage bonds,
deposits), the various instruments for the transfer of credits or credit risks to the capital mar-
ket. The fundamental difference between the traditional and the innovative funding instrument
is their impact on the balance sheet and on the risk position of the originator of the mortgage
loans. It is questionable to label the sale of a mortgage credit pool as refinancing because in
that case the assets are moved to independent investment vehicles, called “Special Purpose
Vehicles” (SPV). To be precise, we can say that the loan purchase of the SPV has to be re-
financed.
Figure 1: Mortgage credit funding and risk transfer instruments
5
2.1 Classical refinancing means
In the classic mortgage refinance mortgage loans remain on the balance sheet of their origina-
tor and the corresponding refinancing means are to be found on the liabilities side of the orig-
inator’s balance sheet. Part of their primary credit market loans made banks refinance via cus-
tomer deposits, and yet another part by the issuance of bank bonds or covered bonds, rotating
at the secondary market afterwards. That is where supply of and demand for long-term financ-
ing meet. An efficient secondary market facilitates the financing of long-term investments
extraordinary, because it combines the interest of credit institutions in long-term funding
sources with the investors’ preference for liquid investments.
The most important types of funding means for mortgage credit are:
Credit facilities from other banks
Unsecured bank bonds
Covered bonds
Deposits
Retail deposits are pre-dominant in Europe with an estimated 2/3 of Europe’s mortgages
funded through deposits.
Covered bonds are debt instruments secured by a cover pool of mortgage loans (property as
collateral) or public-sector debt to which investors have a preferential claim in the event of
default. They account for around 15-20 per cent of mortgage funding in Europe.
Mortgage Pfandbriefe are a the German version of the covered bonds model. They represent
an important funding tool for residential mortgage loans in Germany. The Pfandbrief is sub-
ject to dense regulation (Kofner 2009, p. 9-18). The outstanding bonds have to be covered by
pools of eligible collateral assets. Only commercial or residential mortgage loans, ship or air-
craft loans and public sector loans qualify as cover assets. The holders of the bonds have a
dual claim: one against the issuer, and the other against the cover pool. The Pfandbrief as a
particularly fail-safe bond type is subject to additional and special regulation to minimize as-
set-related risks in the cover pool (e.g. worsened creditworthiness or fallen asset prices). Only
mortgages that meet certain minimum requirements may be used as cover for Mortgage
Pfandbriefe.
For financing owner occupied residential properties also Bauspar loans are often used in addi-
tion to mortgage loans. The funding of Bauspar-loans is a matter of the Bauspar collective and
thus largely independent of capital market developments.
2.2 Asset sale
Unlike a traditional refinancing in the event of an asset sale the mortgage are taken away from
the balance sheet and the bank receives the proceeds from the sale. Thus the selling bank re-
6
ceives liquidity and sets free capital for new business, which must be held no longer for the
loans sold.
The asset sale may be made in the form of a securitization or a whole loan sale. A whole loan
sale is a complete sale of the assets included without a subsequent securitization. The loans
can be sold to another bank where they fit better into the loan portfolio or to a specialized
credit recycler like the Lone Star group from Texas.
Mortgage Backed Securities are debt securities issued off-balance sheet. This system is par-
ticularly prevalent in the U.S. In Europe it accounts for around 5 per cent of mortgage funding
at present. In a securitization transaction, future cash flows are converted into tradable securi-
ties that are sold to investors.
The bank that has granted the loans originally (also called the “Originator”) sells the loans to
Special Purpose Vehicle (SPV), (a unit specially established for the acquisition). The SPV
refinances the acquisition of the mortgages by issuing bonds at the capital market. The bonds
“covered” by the outsourced mortgages are called “Mortgage-Backed Securities” (MBS) or
“Residential Mortgage Backed Securities” (RMBS).2 The SPV finally holds the purchased
loans on the asset side of its balance sheet and the outstanding MBS on the liabilities side.
2 Bonds backed by assets other than mortgages (for example, by leasing or credit card receivables) are called
“Asset-Backed Securities" (ABS).
7
Figure 2: Structure of an MBS transaction
This means that the bank that had issued the loan initially, is released from the risk. It is not
liable to the purchasers of the MBS issued by the SPV. The safety of the claims of the MBS
creditors now depends primarily on the development of interest and principal payments from
the “underlying” mortgages and no longer on the creditworthiness of the originator. If it
comes to unplanned payment defaults, the value of the MBS bonds is directly affected. In
contrast, the claims of creditors of ordinary bank bonds are only at risk if the entire bank
should become insolvent. To improve the risk position of the MBS, however, creditors are
usually protected by additional guarantees (so-called “credit enhancements”).
The role of the rating agencies in such a securitization transaction is, among other things, to
evaluate the MBS securities to determine a fair purchase price. For this purpose they estimate
the default probabilities of the underlying loans, depending on the creditworthiness of bor-
rowers and the value of the collateral objects (that is financed homes) using statistical meth-
ods based on historical data.3
3 For an introduction to the methods used and its pitfalls see Münchau 2008, pp. 137-149.
Trustee
Originator SPV
Borrower
Investor
ConsortiumEnhancer
Rating-Agency
Interest/Principal
Asset sale
Purchase price
Payout/Receivables
Paymentobligation
InvestmentPlacement
Issuances Issueproceeds
Interest/Principal
Inte
rest
/Pri
ncip
al
Qualityassessment
Creditenhancement
Cash Flow Investment
8
For the securitization of loans, financial markets have developed different forms. Compared
with the RMBS is the so-called “Collateralized Debt Obligations” (CDOs) are backed by a
broader range of assets – e.g. housing credit, credit card receivables, MBS or other CDOs.
The CDOs thus offer investors a broader risk diversification. They are, however, so complex
that an ordinary investor cannot cope with the risk assessment.
2.3 Risk transfer
Credit risk can be transferred without selling or securitizing the credit. For this purpose three
financial instruments are at hand:
• Mortgage insurance,
• Credit default swaps (CDS) and
• Credit linked notes (CLN).
Independent of the chosen risk transfer instrument the loans remain on the balance sheet of
the originator. If certain contractually defined credit events occur (for example the insolvency
of a debtor), then the lender or insurance holder receives compensation payments from the
insurers.
The classic form of risk transfer is the private mortgage insurance (see Kofner 2007 for de-
tails). The primary mortgage insurance protects the lender against the risk of losses from the
liquidation of distressed mortgages. It is underwritten by the borrower in favor of the lender.
The mortgage insurance is an additional protection in particular suitable for loans beyond the
conventional loan limits. U.S. type mortgage insurance companies are hindered because of
their strict regulation and supervision to offer cheap rate insurance coverage. Their premiums
are calculated based on sound actuarial principles and the law forces them to hold reserves for
bad times. For the lender it is thus a sustainable type of credit risk transfer.
In the years before the outbreak of the crisis the coverage of the default risk of loans with the
help of credit default swaps (CDS) became more and more popular. CDS are a kind of trada-
ble credit hedges. With the help of a CDS contract, the risk of default of a loan is transferred
to a third party (“Insurer” or “risk taker”) for a limited period. The risk taker in turn receives
an insurance premium. In case the contractually defined credit event occurs the insured party
receives the agreed compensation. Because of their tradability CDS are a liquid asset class in
normal times. Because of this property, CDS can also be used for speculative investments.
With the help of CDS contracts speculators can place bets that the market assesses certain
default risks too high or too low.
The underwriters of the risks at the CDS market are usually no insurances, but hedge funds,
investment banks or others. These investors often lack experience in the management of credit
risks and earmarked reserves for bad times. In the event of an unexpected accumulation of
loan defaults such quasi-insurers may become insolvent. Moreover the volume of circulating
9
CDS contracts exceeds the volume of the underlying credit engagements by many times.
From the close integration of market participants counterparty risks result which are difficult
to assess. If CDS insurers become insolvent, the policyholders are also affected. They are then
left without protection and may need to write-off their credit exposures.
A variant of the CDS, are Credit Linked Notes (CLN). CLN are covered bonds with an insur-
ance element. If the pool of cover loans makes losses above a certain threshold, the bondhold-
ers have to forgo part of their capital. CLN are used by mortgage lenders not primarily inter-
ested in funding but in risk transfer. The lender does not sell loans to the Special Purpose Ve-
hicle, but buys insurance from it. This is also known as “synthetic” securitization (see Report
of the Mortgage Funding Expert Group 2006, p. 48).
2.4 Mortgage-specific and non-specific instruments
Of great importance in our context is the extent to which a refinancing instrument defines
minimum requirements relating to the mortgages to be refinanced. Such requirements can
pertain to
the length of fixed-rate periods (“congruent coverage”),
the level of interest rates (not lower than those of the funding means),
the determination of the mortgage lending value,
minimum LTV,
insolvency privilege of investors relating to the mortgages in a cover pool in case of an
issuer insolvency,
supervision intensity,
minimum credit scores of borrowers,
need for additional safeguards, e.g. in case of a LTV ratio above 80 per cent of the
mortgage lending value.
The instruments can be classified according to the intensity of such requirements. There are
non-specific refinancing means such as deposits and unsecured bank bonds. On the other hand
we have covered bonds which have a direct impact on the quality and quantity of the related
cover loans. Even securitization transactions often define criteria with respect to the mortgag-
es to be securitized. Then loan purchase criteria of Fannie Mae and Freddie Mac are a case in
point. In private securitization we have a higher degree of flexibility, but the characteristics of
the loans have an effect upon the rating of the issuance. To give an example, a higher share of
subprime mortgages in a credit pool will result in a lower rating, a lower price of the issuance
and finally in higher interest rates at the primary mortgage market.
Regarding the non-specific instruments (deposits, unsecured bank bonds) one might be in-
clined at first sight to assume that they are neutral in terms of the quality of the loans re-
financed. However, the possibility of sanctioning behavior of investors in the event of deterio-
rating creditworthiness of the issuer needs to be taken into account. One might even say that
10
the quality of the loan portfolio is a critical parameter for the funding conditions of a bank. In
that regard, it is doubtful whether efficiently working markets could be improved by introduc-
ing covered bonds. If they do not work efficiently, covered bonds have characteristics of a
public good.
3 The housing cycle
3.1 Definition and evidence of the housing cycle
It is not easy to define the housing cycle. Real estate cycles are marked by similar cyclical
developments of certain time series variables like building permits, building completions, real
estate prices, default rates of mortgage borrowers, real estate investment and sales activities,
vacancy rates, volume of newly granted mortgage loans and so forth around a long-term
trend. In practice the focus is often limited to price variations. That focus does seem to be in
line with the observation that comovements between major Euro area countries in the housing
sector are much weaker for prices than for real variables like housing starts (Alvarez et al.
2009).
Figure 3: Building permits for dwellings in residential and non-residential construction
Former federal territory (from the year 2005 without West Berlin)
‐
100 000
200 000
300 000
400 000
500 000
600 000
700 000
800 000
900 000
1970 …………….
1972 …………….
1974 …………….
1976 …………….
1978 …………….
1980 …………….
1982 …………….
1984 …………….
1986 …………….
1988 …………….
1990 …………….
1992 …………….
1994 …………….
1996 …………….
1998 …………….
2000 …………….
2002 …………….
2004 …………….
2006 …………….
2008 …………….
11
Figure 4: Single Family House Prices in Germany
Another problem is the differentiation between cycles and bubbles. The term “bubble” is ob-
viously inconsistent with the concept of efficient markets. What kind of inefficiencies are pre-
vailing at the housing market? These include
externalities of land use,
difficult market access for specific groups,
imperfect allocation of housing stock to tenants,
merit good characteristics,
special features of the investment decision,
high transaction costs,
frictions in price formation,
cyclical fluctuations in housing markets (between housing shortage and excess sup-
ply),
high degree of market intervention.
Among these features the special features of the housing investment decision are of crucial
importance. A real estate investment requires a binding commitment to the location without a
possibility of interregional balancing out of capacities and a high initial capital commitment.
Also because of the long life cycles of buildings the capital invested will usually amortize
slowly. The resulting long term capital commitment creates financial risks, i.e. interest rate
- 1990-2002 Bundesbank calculat ions based on data provided by
BulwienGesa AG
- 1990-1995 W est G erm any
- 2003-2009 vdp P rice Index for S ingle fam ily houses, calculated by vdpResearch
12
and loan extension risk. All in all the risk of making a bad investment is surely not negligible
in housing. Investors will tend to take a wait and see attitude. They will tend to delay their
investment in case of rising uncertainty about input variables like rent or interest rate.
A housing bubble is characterized by house prices reaching a temporary and unsustainable
peak in time because of the irrational behavior of many market participants. The irrational
element is a fundamentally unfounded expectation of rising house prices and rents in the fu-
ture. In the formation phase of a bubble the expectation of future capital gains becomes ever
more important for the expected income of the investment. For the definition of a bubble it is
important that the only “rational” explanation for the rising values is the common expectation
of rising values.4 It is basically a phenomenon of social psychology, a kind of collective sug-
gestion. According to the definition given the possibility of a house price bubble is culturally
bound. If people regard the investment in their home as once in a lifetime decision and do not
even monitor current market prices, they will not take part in any bubble hysteria.
And how about the relationship between housing bubbles and housing cycles? This issue af-
fects our definition of a bubble. The crucial question is if speculative bubbles are independent
or just amplifiers of cycles. In that sense the bubble would be a normal cyclical phenomenon
– an exaggerated cycle.
4 Case / Shiller (2004, p. 299) have put it like that: “We believe that in its widespread use the term refers to a
situation in which excessive public expectations of future price increases cause prices to be temporarily elevat-ed.”
13
Country 1970-1999 2000-2006 Country 1970-1999 2000-2006
U.S. 0.012 0.055 Netherlands 0.023 0.027
Japan 0.010 -0.045 Belgium 0.019 0.064
Germany 0.001 -0.029 Sweden -0.002 0.059
France 0.010 0.075 Switzerland 0.000 0.019
Great Britain 0.022 0.068 Denmark 0.011 0.065
Italy 0.012 0.051 Norway 0.012 0.047
Canada 0.013 0.060 Finland 0.009 0.040
Spain 0.019 0.081 NewZealand 0.014 0.080
Australia 0.015 0.065 Ireland 0.022 0.059
Average 1970-1999 0.012
2000-2006 0.046
Average Annual Real Price Growth by OECD Country
Source: Hurst 2009
A closer look at historic real house price growth for a set of OECD countries reveals im-
portant differences in house price dynamics. First of all, we can state that between 1970 and
2006 real house prices substantially grew on average. Secondly, the average real growth rate
of house prices was substantially higher in the years before the bubble burst: 4.6 per cent for
the years between 2000 and 2006 as compared to 1.2 per cent between 1970 and 1999.
Furthermore, it stands out that there is a strong correlation between house price dynamics be-
fore and after 2000. There are countries like Britain which experienced above average real
house price growth in both periods, countries like Germany which underperformed both times
and countries like Norway which developed like the average. Whilst it happened in some cas-
es that growth rates as compared with the average accelerated (France, Canada) or decelerated
(Japan) a reversal of the trend (Netherlands, Sweden) was an exception.
14
Figure 5: U.S. Nominal House Price Appreciation 1976-2008 (OFHEO Data)
There is strong empirical evidence for the U.S. and other countries that “persistent housing
price increases are always followed by persistent housing price declines” (Hurst and Guerrieri
2009). The two authors have analyzed statistics of U.S. metropolitan areas between 1980 and
2000 and found out that the average price increase over boom (consecutive periods of price
increases) was 55 per cent. The average price decline during the subsequent bust (the follow-
ing period of price declines) was 30 per cent in that period – the average length of a bust be-
ing 7 years. Using historical data (Country, State, Metropolitan Area) they have estimated that
a 100 per cent increase in house prices is usually followed by periods of 50-60 per cent de-
clines.
-0,10
-0,05
0,00
0,05
0,10
0,15
0,20
1976
1977
1978
1979
1981
1982
1983
1984
1986
1987
1988
1989
1991
1992
1993
1994
1996
1997
1998
1999
2001
2002
2003
2004
2006
2007
2008OF
HE
O H
ouse
Pri
ce I
nde
x
15
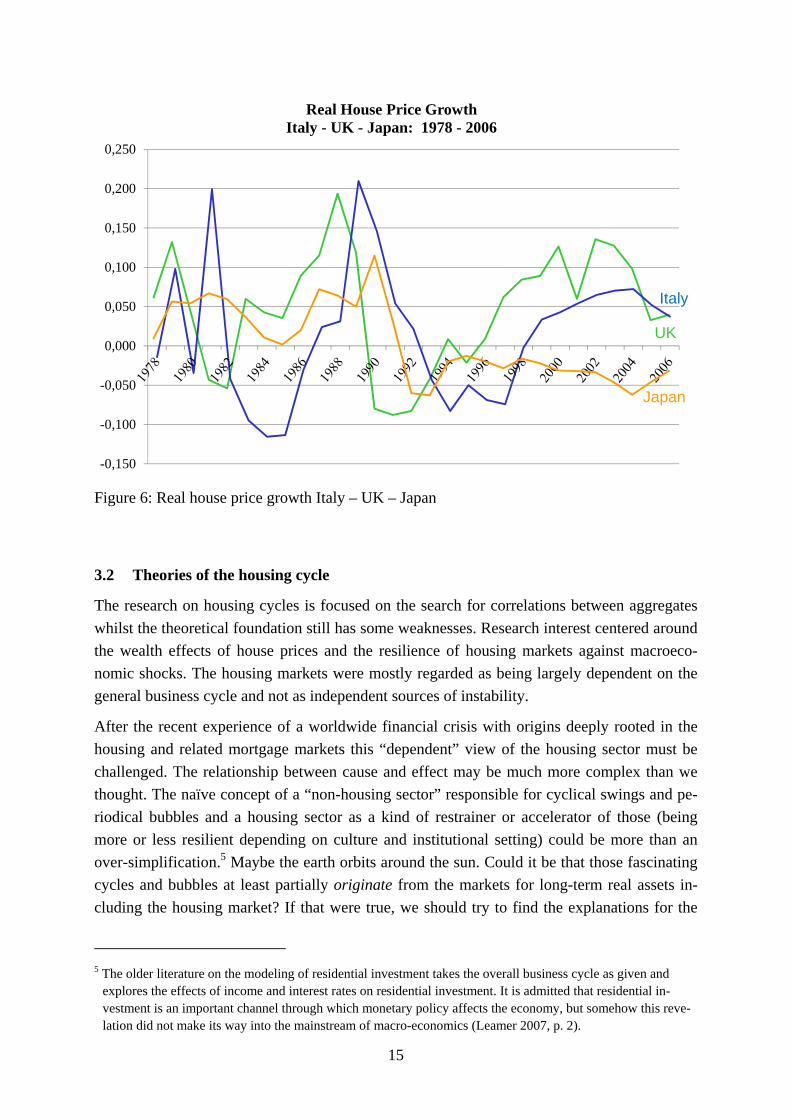
Figure 6: Real house price growth Italy – UK – Japan
3.2 Theories of the housing cycle
The research on housing cycles is focused on the search for correlations between aggregates
whilst the theoretical foundation still has some weaknesses. Research interest centered around
the wealth effects of house prices and the resilience of housing markets against macroeco-
nomic shocks. The housing markets were mostly regarded as being largely dependent on the
general business cycle and not as independent sources of instability.
After the recent experience of a worldwide financial crisis with origins deeply rooted in the
housing and related mortgage markets this “dependent” view of the housing sector must be
challenged. The relationship between cause and effect may be much more complex than we
thought. The naïve concept of a “non-housing sector” responsible for cyclical swings and pe-
riodical bubbles and a housing sector as a kind of restrainer or accelerator of those (being
more or less resilient depending on culture and institutional setting) could be more than an
over-simplification.5 Maybe the earth orbits around the sun. Could it be that those fascinating
cycles and bubbles at least partially originate from the markets for long-term real assets in-
cluding the housing market? If that were true, we should try to find the explanations for the
5 The older literature on the modeling of residential investment takes the overall business cycle as given and
explores the effects of income and interest rates on residential investment. It is admitted that residential in-vestment is an important channel through which monetary policy affects the economy, but somehow this reve-lation did not make its way into the mainstream of macro-economics (Leamer 2007, p. 2).
-0,150
-0,100
-0,050
0,000
0,050
0,100
0,150
0,200
0,250
Real House Price Growth Italy - UK - Japan: 1978 - 2006
Italy
Japan
UK
16
independent (or endogenous) cyclical development of these assets and ask about the resilience
the rest of the economy (e.g. labour market regulation and social security nets). As Leamer
has put it in 2007 already: “I have not been able to find any macroeconomic textbook that
places real estate front and center, where it belongs.”
A common classification of the factors with the potential to invoke real estate cycles is the
distinction between “exogenous” and “endogenous” factors. The endogenous factors for their
part are divided into four groups (Rottke 2006, p. 65):
Time lags
Information inefficiencies
Bounded rationality
Special items
Development time lags can induce the pig cycles known from agricultural markets (see be-
low). Such pig cycles can prevail at any market where supplier’s decisions on quantities to be
offered only take effect after a considerable time lag.
A market is information-inefficient if the relevant information for assessment is not fully or
incorrectly reflected in prices (Shleifer 2000, p. 1). Non-transparent markets, particularly in
the context of asymmetric information in principal-agent relationships (i.e. the presence of
less well-informed principals and better-informed agents) are subject to such information-
inefficiencies. As a consequence of an asymmetric distribution of information the affected
markets may experience cyclical excesses, as price information is distorted and transactions
take place on an erroneous basis.
Bounded rationality is basically any deviation from the conception of the homo oeconomicus
– the idea of humans being a kind of walking calculators always and everywhere able to de-
fine and choose the utility-maximizing alternative. Financial markets can be subject to bound-
ed rationality as well as the markets for real assets. It often takes the form of misguided
speculation. People bet on future capital gains without taking notice of fundamental factors.
Such behavior, if widely spread as in a stock market mania can result in grossly overpriced
assets. The correction will of course follow right on the heels of the exaggeration. In a reces-
sion buyers might be reluctant to buy because they think they can get a better deal in the fu-
ture. The concept of bounded rationality is part of the credit cycle explanation of housing cy-
cles.
3.2.1 Initial overshooting of house prices
Every theory of the housing cycle should start with the special properties of housing supply
and demand. Both, supply and demand curves are deemed to be relatively inelastic in the
short run. Hence considerable price movements are necessary in the short run to clear the
market after an unanticipated increase in demand.
17
Figure 7: Shape of the supply curve of housing
The shape of the housing supply curve is somewhat special. It has been called a “kinked”
supply curve, i.e. we expect an asymmetric reaction depending on the direction of price
movements. The reaction on rising prices / rents will be very inelastic in the short run. In the
long run, it might be more elastic, however. The reason is the development time lag. Investors
need considerable amounts of time for planning, building permit proceedings, construction
and marketing of their projects. The reaction time can get even longer if government regula-
tion causes development bottlenecks, e.g. a scarcity of housing land.
Under such conditions we would expect an initial overshooting of rents and house prices in
case of an unexpected demand shock. From a dynamic point of view development time lags
can induce pig cycles after an initial shock.
Al
p0
y0
Ak
p
y
18
Figure 8: Adjustment after an increase in housing demand
With a kinked supply curve the initial reaction of the market will be a very limited increase in
volume and a hefty price increase. In the long run however supply will react more elastic.
Step by step the new houses planned immediately after the initial shock will reinforce supply.
Hence house prices or rents will gradually decrease.
3.2.2 The pig cycle
So far we have only collected arguments for overshooting prices in case of a shock. We have
no explanation yet for cyclical developments in time. Such an explanation might be found by
comparing house price cycles with agricultural price cycles and especially with “livestock”
cycles.
The reasons for the price cycles in livestock are reaction lags of suppliers. The suppliers are
responding to current prices but the effect of their decisions on the market will only realize
after considerable time lags. In agricultural markets we have to take into account the “psycho-
logical lag” (time required for the realization of changing market situations) and the “biologi-
cal lag” (time required until market effectiveness of production decisions). Economists use the
so-called cobweb theorem to explain dynamic consequences of supply-side delays.
A0(r0)
p0
y0
A0k
l
N0l
N1l
y1
p1
y
p
y2
p2
A1k
19
Figure 9: Cobweb model
The model does not allow for the possibility of learning of the suppliers. That might be a real-
istic assessment, although Hanau recommended in 1928 already:
“The farmer’s calculation of the profitability of pig fattening should not use those pig prices
prevailing at the time of stabling or during the fattening period, but the pork prices, which will
be achieved after completion of the fattening in case of sale.” (Hanau 1928, p. 33).
The housing market is a market fitting into the assumptions of the cobweb theorem. Conver-
gence or divergence of the model is a question of the relative slopes of the supply and demand
curves. If the slopes of supply and demand curve are the same the model produces a continu-
ous oscillation with constant amplitude. If the slope of the demand curve is higher than that of
the supply curve, the model will behave convergently. In the other case the amplitude of the
cycles will become ever bigger as time goes by.
What interim conclusions can we draw from this? The model can explain dynamic cyclical
developments of quantities and prices after an initial shock in the absence of learning of sup-
pliers. After a demand shock an initial overshooting of house prices and rents is to be ex-
pected. Although supply will adjust in the long run in a market characterized by development
time lags we can expect cyclical repercussions and there is no guarantee that the market will
ever regain a stable equilibrium state: “For housing it’s the cycle that is persistent. Once the
cycle starts, it keeps on going. Like a pebble thrown into a smooth pond of water.” (Leamer
2007, p. 3).
Also, the housing cycle can extremely differ between regions. Within metro areas there is
extreme heterogeneity with respect to housing price changes (Hurst). That is no wonder if we
DS
P Hi
P Lo
Q HiQ Lo
Expansion
Contraction
FallingPrices
RisingPrices
Price
Quantity
20
consider the characteristics of the housing market as compared with markets for livestock.
Housing markets are regional markets whereas agricultural markets are spatially integrated. A
case in point is the price for pork meat in Germany and Austria.
With a multitude of local or regional housing markets, how can we have a macro-economic
housing cycle? Let us imagine that all regional housing markets in ac country are initially
equilibrated. If an unanticipated wave of immigration hits that country and all immigrants
move to a set of boomtowns, the boomtown markets would start to pig-cycle if the assump-
tions of the cobweb theorem hold. The pig cycles would still be observable on the national
level, although weaker.
The problem is that any kind of unanticipated demand shock, be it a cyclical phenomenon or
not, can induce a regional pig cycle. It thus seems plausible that market volatility is higher on
the regional than on the national level. Markets in different phases of the cycle balance them-
selves out on the national level.
We are still not able to explain nationwide house cycles with the cobweb theorem. The only
possibility to do so would be to identify (unanticipated) factors affecting all or at least many
regional housing markets in the same way. Natural candidates would be significant changes in
interest rates, migration balance, wages and unemployment rates, national housing market
regulation or subsidization. Interest rate changes would be particularly interesting because
they tend to behave cyclical themselves.
The problem with this approach is that different types of housing (e.g. apartment complexes
and single family homes) may have different development time lags and thus different cycles.
Also we cannot ignore the possibility of regional differences in development lags. Think
about dynamic / apathetic bureaucrats or capacity utilization in the construction industry.
Since other real estate markets share the development time lag and the sensitivity to interest
rate changes with the housing market6, there is a danger of confusion of cause and effect with
respect to the general business cycle. If real estate markets were inherently unstable, the re-
sulting cyclical flow of real estate investment could be one of the major explanatory factors of
the general business cycle.
3.2.3 The Kuznets cycle
The Kuznets cycles are long-term (15-25 year) transport and building cycles. They are usually
associated with the demand for consumer durable goods and longer-lived capital goods, like
houses, factories, office buildings and ships.
This cycle is believed to be caused by demographical factors which cause investment ex-
penditures on housing and other fixed structures to fluctuate. A certain chronology of events
is assumed: During economic booms rising wages and other factors create incentives for new
family formations. Hence the demand for new housing units will rise which in turn boosts
6 Different types of real estate have different cycles reflecting different development lags.
21
economic output more. Critics have argued however that the Kuznets cycle just represented
waves of population and migration.
Kuznets has divided the building cycle is into four phases, development, overbuilding, ad-
justment and acquisition. The key figure in each of the four phases is the relation between
housing starts and housing sales. The idea is that new housing development lags home sales is
akin to pig cycle mechanism.
In the development phase demand picks up and an increase in housing starts follows. This
phase is characterized by low vacancy rates and rising rents. It reaches maturity after about 3
to 5 years. A signal of the turning point is the aggressive bidding up of land prices. The fol-
lowing overbuilding phase is characterized by the fact that housing starts consistently pace
out home sales. In the subsequent adjustment phase builders react to the declining demand
and curtail housing starts. Finally, in the acquisition phase of the cycle housing starts continue
to decline while home sales are firm. The building activity is further reduced although vacan-
cy rates have peaked and rent concessions have ceased.
3.2.4 The credit cycle
We need to take into account the possibility of credit-driven price cycles (access to mortgage
credit, interest rate cycles). It is unclear however, whether the forces of the credit market are a
source of instability of their own, or just an amplifier of the housing cycle. Again, it is not
obvious what is cause and what is effect in this respect.
Debt and speculation can play a major role in the business cycle. Debt can feed speculation
when lenders are willing to lend more on rising asset prices. This role has been investigated
by Irving Fisher, Hyman Minsky, and others. More recently, Cantor and Wenninger analyzed
how the credit cycle leads to a “credit crunch”, and how finance and economic activities in-
teract. According to Cantor and Wenninger, the credit cycle process consists of ten steps: 7
1. Demand for capital assets and investment increases. Possible causes: An “expansion-
ary monetary or fiscal policy,” a “boom in the stock market”, or an “upward shift in
inflationary expectations”.
2. Additional investment financed with additional debt. Prices of collateral assets rise.
Lenders start to lower credit standards tempted by a false sense of security.
3. Investors start to use riskier financing methods, e.g. higher leverage, maturity mis-
match, new debt to pay old interest. Shock vulnerability of the system increases.
4. Expectations about increased profits and rising capital gains shift downward. Possible
causes include: a tightening of monetary or fiscal policy to control inflation, external
shocks, or an oversupply of assets because of production time lags. Cash flows, profits
and asset prices begin to decline.
7 Cantor / Wenninger 1993, pp. 31-32.
22
5. Interests of debtors and lenders diverge because of falling collateral values and deteri-
oration of debtors’ ability to repay: borrowers want to refinance short-term debt, but
lenders want their money back. The “credit crunch” begins.
6. Borrowers fail to roll over loans. Lenders do not get paid. Financial distress spreads.
7. Assets are sold at distressed values. The number of insolvencies increases. Distress
can become contagious. Fight for quality and possibly lender-of-last-resort interven-
tion.
8. Nonperforming loans and related depreciations increase.
9. Highly leveraged banks loose equity capital and regulatory screw tightened. The
“credit channel” gets partially or fully blocked. The credit crunch spreads to other sec-
tors of the economy.
10. All “economic units” decrease their spending. The economy slows down.
Houses are one type of the capital assets used as collateral for credit along the credit cycle.
The problem with the credit cycle model is that the set of reasons for the initial increase in
demand for capital assets seems to be somewhat arbitrarily chosen. It is possible that mone-
tary policy or any other possible cause followed a cyclical pattern in the past, but in the ab-
sence of a theory we cannot be sure if the cyclical pattern will reproduce in the future. Also,
the reasons given are only loosely connected with the credit and asset markets. And the same
goes for the set of reasons given for the failure of capital assets to generate the expected prof-
its. And finally, the distinction between primary and secondary credit markets is not always
clear.
The credit cycle is basically not more than a set of stylized developments of certain capital-
and asset-market variables during a boom and bust cycle. It is not in my view an explanatory
model for general business or real estate cycles. Monetary policy is important as a trigger in
so far as it influences the lending activities of the banking sector. One thing is certain, a hous-
ing cycle is virtually unthinkable without an accompanying credit cycle. It is therefore worth
wile to analyze the dynamic forced shaping supply and demand for mortgage credit. In this
context the liquidity of secondary mortgage markets is presumable a very important supply
side factor.
3.2.5 Review of the last U.S. housing and credit cycle
The last boom and bust cycle of the U.S. housing market gave us the chance to study the
transmission channels between financial and housing markets. The foundation of the boom
which lasted for more than 10 years (the Case Shiller house price index rose every single
month for 10.5 years in row – between January 1995 and June 2006) was excess liquidity
searching for profitable investment opportunities. Creative investment bankers developed
financial innovations like Asset Based Securities (ABS) and Credit Default Swaps (CDS) able
to transform mortgage credit risk into tradable securities or swaps. These financial innova-
tions were particularly well suited to securitize risky mortgage loans like credits for borrowers
23
with a very low credit score. With the new funding instruments in the background it was pos-
sible to provide new target groups with mortgage credit, i.e. households who had no access to
mortgage credit before. It was possible to continuously relax lending standards and lend to
ever more vulnerable borrowers because either the loan itself or the default risk could be
transferred to the anonymous capital market. Principal-agent theory is able to explain why the
final risk-takers were unable to control quality of the loans to be securitized. The originators
used the capital markets as a dump for ever-worsening credit risk.
Figure 10: Causal chain of a housing bubble - Source: Kofner 2008, p. 11
It is no wonder that as long as banks managed to enlarge the target group for mortgage credit
in terms of creditworthiness house prices were on the rise. If house prices have risen for a
certain period of time expectations about future houses begin to change. The home slowly
transforms into a speculative asset. People buy houses chiefly because of the expecatation of
future capital gains. Investors hasten to jump on the band wagon and banks expectations about
the future house price increases begin to rigidify (“adaptive expectations”). If it comes to that
point credit decisions more and more neglect personal creditworthiness and bet for continu-
ously rising prices. The risk of further lowering lending standards seems to be limited. De-
24
mand for financial innovations to get rid of the risks associated with the worsening credit
quality goes up and will be met as long as liquidity is ample.
The bursting of credit and price bubble was inevitable, because many among the vulnerable
borrowers without sufficient income and reserves were unable to cope with the slightest addi-
tional burden. Subprime borrowers are fair-weather borrowers for the most part, who can only
sustain at low interest rates and ever rising house prices - and even then only if they do not
lose their job or become ill.
The end was in sight - not just the when and the how. The actual occasion then was a real
change in the course of U.S. monetary policy. The rate hikes between middle of 2004 and
middle of 2006 directly hit the borrowers with variable rate mortgages. Their monthly pay-
ments increased significantly. As a result, the most vulnerable subprime borrowers defaulted
on their loans. Thus began the phase of correction of previous excesses, which we may desig-
nate as a purification crisis. During such a crisis all exaggerations are trimmed back to their
normal levels. Also, the behavior of market participants in terms of risk-consciousness should
change lastingly.
Figure 11: Purification crisis - Source: Kofner 2008, p. 43
During the purification crisis all cause-effect relationships that led to the emergence of the
bubble operate in the opposite direction. As with the emergence of the bubble, the effects are
mutually reinforcing, and market participants are subject to significant behavioral changes. As
during the development of the bubble exaggerations cannot be ruled out in.
25
When market participants realize that the number of non-performing loans goes up, we can
expect that
Securitization and insurance market especially for bad credit risk dry out.
Banks tighten their risk selection policies because of the first signs of market instabil-
ity and the limited possibilities to dump credit risk.
House prices will start to fall.
A downward spiral can now easily develop: Securitization and insurance market become ever
drier, hence lending standards are tightened, hence house prices fall, hence lending standards
are tightened and secondary markets get even drier, and so forth. Adaptive expectations of
house prices declining ever more make things worse. Also, when house prices fall continuous-
ly, more and more borrowers slip into a negative equity position. the As a consequence the
number of sales and foreclosures will rise further, the extent depending on the institutional
design and the behavior of lenders and borrowers. The resilience of the macro-economy can
possibly accelerate the downward spiral. The extent depends on the wealth effect of falling
house prices, labor market regulation and the social security system. As we have seen, a se-
vere purification crisis at the housing and related credit markets can have devastating conta-
gion effects throughout financial and real markets.
3.3 Effects of system-inherent factors on the housing cycle
A part of the housing cycle could be explained by the general business cycle fluctuations. The
cyclical fluctuations of GDP, inflation and interest rates presumably have an important influ-
ence on housing demand and investment activity. What is more, because of development time
lags the housing sector is an independent source of economic instability. A change in the na-
tional housing market subsidization system can induce housing cycles independent of the
general business cycle. And even if the shock event is related to the general business cycle –
say falling interest rates – the development time lag shapes the housing cycle in its own way
according to the cobweb theorem. Remember that supply side related time lags are irrelevant
for many markets other than real estate and agriculture. They might be typical for industrial
expansion investments however, especially when investment in additional equipment is ac-
companied by construction investment.
The availability of funding for mortgage credit is probably another causal factor or accelerator
of the housing cycle. And last but not least there are certain factors inherent in the housing
system with a pro-cyclical potential to accelerate or decelerate the cyclical swings of the hous-
ing market.
Housing-specific taxation and subsidies are a case in point. If, for example the parliament
reduces the depreciation rates for new apartment buildings in a general economic downturn
the negative impact on housing investment activity will reinforce the downward tendencies in
26
the housing sector as well as in the general economy. A pro-cyclical variation of housing
taxation and subsidization would induce a political housing cycle.
The direction of the influence of system-inherent factors like government intervention on the
housing cycle is not a law of nature. It is, in fact, shaped by institutional design and changing
patterns of human behavior. To give an example, non-recourse mortgage credit for home-
owners is common in most states of the U.S. but totally uncommon in Germany. These insti-
tutional differences shape the development of downward cycles. U.S. homeowners tend to
cease payments on their mortgages and abandon their homes in case of negative equity whilst
German homeowners use to stick to their mortgages “until their last breath”. Also the U.S.
homebuyers might be ready to take higher risks in advance because of the non-recourse char-
acteristic of their loan. Their German counterparts on the other hand might choose to stay
tenants or buy a more modest home. Hence, we have an accelerating effect in the U.S. and a
neutral one under the German institutional design.
Another case in point is real estate appraisal. If valuation methodology stresses current mar-
ket values it will not impede mortgage lending activities in an upswing. In a downswing mar-
ket valuation will result in a pronounced need for correction of the over-hyped values.8 Con-
versely, a methodology relying chiefly on substance value or sustainable DCF will result in
sensibly higher equity requirements of lenders when house prices rise and thus curb the vol-
ume of mortgage credit in a boom phase.
Apart from changing requirements relating to the collateral we need to take the possibility of
changes in other loan criteria into account, in particular changes in the requirements relating
to the creditworthiness of borrowers. There are clear indications that in the years before the
outbreak of the financial crisis the lending standards in the U.S. were continuously lowered,
hence the rising market share of subprime and Alt-A mortgages. It looks like lending stand-
ards are tightened and loosened in a pro-cyclical way in some countries. This is a point to be
further investigated.
Another candidate for a cyclical variable is the loan-to-value ratio (LTV). It is conceivable
that the minimum share of equity capital necessary to get access to a mortgage varies pro-
cyclically, too. Last, but not least the share of mortgages with variable rates might have an
effect on the housing cycle.
Innovative loan characteristics like Interest Only Mortgages, teaser rates, grace periods, „Op-
tion Adjustable Rate Mortgages“, Cash-out refinancing and foreign currency loans may also
have a pro-cyclical effect. When house prices rise rapidly there is sometimes a tendency on
the lender’s side to offer a kind of initial financing which will only be affordable in the long
run if conditions like regional houses prices and income of the borrower change for the better.
8 And thus more cases of negative equity.
27
accelerating decelerating neutral unclear
Taxation and subsidies X
Share of non-recourse mort-gages
U.S. Germany
Market-oriented appraisal of collateral
U.S. Germany
Cyclical lending standards U.S. Germany
Cyclical LTV requirements U.S. Germany
Share of adjustable rate mort-gages
U.S. Germany
Share of loans with innovative characteristics
U.S. Germany
In principle all system-inherent factors as well as the funding mix for mortgage credit can
have an accelerating, a decelerating or a neutral effect on the housing cycle. Also we need to
take into consideration the possibility of asymmetries. A factor of accelerating nature in a
boom might have a neutral or less decelerating influence during a downturn. To give an ex-
ample, take the possibility of a changing valuation methodology stressing market value during
the boom and long-term DCF in a downward phase. Most factors are presumed to be acceler-
ating or neutral. It would be hard to give an example for a counter-cyclical impact of a factor.
Regarding valuation that would mean to have lower property values in a boom than in a
downswing.
With the recent experience of a severe mortgage market and financial crisis in our minds the
dangers of running a mortgage system with several accelerating factors active at the same
time are obvious to everybody. In this context, the potential for mutual reinforcement as be-
tween market-oriented appraisal and non-recourse type of mortgages should be taken into
account. However, the dangers were not so obvious even for insiders in banks and supervising
authorities before the outbreak of the crisis.
3.4 The role of interest rates
A steady flow of mortgage credit at the primary market is a necessary – but not sufficient –
prerequisite for a moderate development of the housing cycle. That is because most acquisi-
tions and developments are financed with considerable leverage. Just as important as the con-
tinuous access of investors to mortgage credit is the development of interest rates for mort-
gage credit. The steadier interest rates develop through time, the more moderate the cyclical
fluctuations of a housing market will be.
The rate of return on the equity capital to be invested is negatively correlated with the interest
rate to be paid for the debt capital involved. If high interest rates prevail, many projects are
not regarded as profitable enough and presumably the financial leverage of the projects real-
28
ized is lower. Low interest rates on the other hand create an incentive for higher loan-to-value
ratios and enhance the profitability of all leveraged projects.
Hence stable interest rates are a prerequisite for a stable investment flow. Conversely, an un-
steady development of interest rates will entail an unsteady flow of investment in housing.
For a steady access to mortgage credit and a steady development of mortgage rates – and
hence a steady flow of housing investment – the continuous availability of refinancing funds
and a steady level of refinancing rates are of crucial importance. That is because each mort-
gage credit granted additionally means a balance sheet extension for the lender because it re-
quires a refinancing transaction, e.g. creation of new credit via bank bonds or bank deposits.
To put it in a nutshell: no credit without refinance.
3.5 Why moderate housing cycles?
Our underlying thesis is that a curbed housing cycle is more desirable than a cycle marked by
hefty fluctuations. But why should it be desirable to moderate housing cycles? Six different
groups of arguments could be relevant in this respect:
• Allocative efficiency reasons: The housing sector could attract more than its op-
timal share of scarce investment capital in case of a housing boom phase or bubble.
On the other hand, in case of a purification crisis – after the bubble has burst – it
might not be sufficiently equipped with new capital. This argument clearly denies
the efficient market hypothesis and allows for overshooting as well as undershoot-
ing asset prices and hence for spontaneous deviations from the optimal allocation
of real capital between economic sectors and asset classes.
• Economic growth considerations: When a house price bubble is developing, the
housing sector is taking away scarce capital from other sectors where capital for-
mation might contribute more to the future growth potential of the economy.
• Distributional arguments: In an environment with extreme house price fluctua-
tions the timing of consumers’ buy and sell decisions becomes critical for the per-
formance of their investment. That is especially a problem in markets without an
abundant rental housing market. The consequence will be arbitrary distributional
effects between winners and losers. Remember, that most consumers have allocat-
ed a very considerable part of their total wealth to their home (the home often be-
ing the only considerable asset). Heavy house price fluctuations therefore have a
resounding impact on their overall wealth position.9 We can expect that in an envi-
ronment with very volatile house prices the individual level of housing consump-
tion in terms of quality and quantity becomes a sort of lottery. Such arbitrary dis-
tributional effects of house price fluctuations make mockery of all political efforts
to enhance the distribution of wealth and income.
9 Depending on the length of the cycles we also need to consider inter-generational distributional effects.
29
• Urban-planning reasons: A more steady flow of real estate investment activity
along the timeline possibly has other advantages. As a consequence of a more even
distribution of investment in time, the change of the urban landscape will follow a
different path as compared with a row of boom and bust cycles. We can generally
expect that on a sustainable path most investment projects will be carefully consid-
ered and checked from all sides, e.g. market research, investment calculation.
Conversely, on a non-sustainable path, we observe hasty planning and decision-
making during the boom and prolonged phases of reluctance to invest during the
cyclical downturn. Our thesis is that a pronounced cyclical flow of investment has
a negative effect on the quality and sustainability of investment decisions.
• Housing policy deliberations: The affordability of home ownership worsens
when a house price bubble is developing. The number of average yearly household
incomes necessary to buy an average home rises dramatically during a house price
boom. That again is especially a problem in markets with a small rental housing
sector.
• Macroeconomic stabilization policy considerations: As we have argued, the sta-
bilization of the housing market might be an aim in itself. Apart from that we can
derive an argument for intervention from possible macroeconomic spillovers of a
volatile housing market: The wealth effect of rising / falling house prices is
deemed to be the most important spillover effect. Leamer (2007, pp. 10-13 and 37)
has shown that “residential investment consistently and substantially contributes to
weakness before the recessions, but business investment in equipment and soft-
ware does not. And the recovery for residences begins earlier and is complete ear-
lier than the recovery for equipment and software. … I take it as clearly implied
that the business cycle would be less frequent and less severe if the housing cycle
were less frequent and less severe.”
We have discussed allocative, distributional and stabilization policy arguments in favor of
moderate cyclical swings of the housing market. Affordability and urban planning considera-
tions strengthen the argument.
We must, however, acknowledge the possibility of trade-offs. There must be an optimal de-
gree of cyclical instability. It would be almost impossible to suppress the housing cycle com-
pletely. That is because the government is not in control of all possible shock variables. Re-
member that housing cycles have a regional nature. The cost of an anticyclical policy to sup-
press the cycles would be prohibitively high and presumably the related information and time
lags are insuperable. All we can hope for is a moderation of the cycle by promoting stability-
oriented monetary policy, restricting erratic government intervention and limiting accelerating
factors.
30
4 Sustainable mortgage funding
4.1 Towards a definition of a sustainable mortgage funding instrument
The concept of sustainability applied to mortgage funding instruments focuses on the contin-
uous availability of the instrument in all phases of the housing cycle at an “affordable” inter-
est rate, though not necessarily in the same volume. There may be no instrument without any
fluctuations during the cycle. It thus makes sense to order the instruments along a sustainabil-
ity continuum.
A mortgage funding instrument more on the sustainable side should develop relatively stable
in case of external shocks affecting the primary market for mortgage credit, e.g. a considera-
ble changes in house prices or unemployment rates in a given period of time. It is important
that the concept of stability relates to the times of stress as well as to boom phases. The con-
cept of sustainability requires that a funding instrument is not cheap and overabundant in a
housing market boom likewise.
We can expect those funding means to remain relatively unimpressed in times of stress which
are institutionally unsuitable to refinance low-quality mortgages - the German Pfandbrief be-
ing a case in point (Kofner 2009). In times of stress a system with “buffers” will perform bet-
ter. Those buffers are system-inherent factors (see above) like LTV requirements or the share
of adjustable rate mortgages which can improve or weaken the resistibility of borrowers de-
pending on their accelerating or decelerating alignment.
For the assessment of the sustainability of different funding instruments we need empirical
evidence about secondary market liquidity and issuance activity. Also we need to define ac-
ceptable bandwidths in a given period of time for each indicator of sustainability. The assess-
ment has to take into account the possible distortions generated by government intervention,
e.g. the German guaranty for all kinds of deposits or the ECB’s 60 billion Euro purchase pro-
gram for covered bonds.
A methodological problem is to interpret time series like the development of the volume of
new issuances of a certain type of mortgage bond in time. The problem with such a volume
figure is that it basically reflects market turnover. From the point of view of sustainability it
would be important however to know the relative contributions of supply and demand shifts
to the dynamic development of the figure.
31
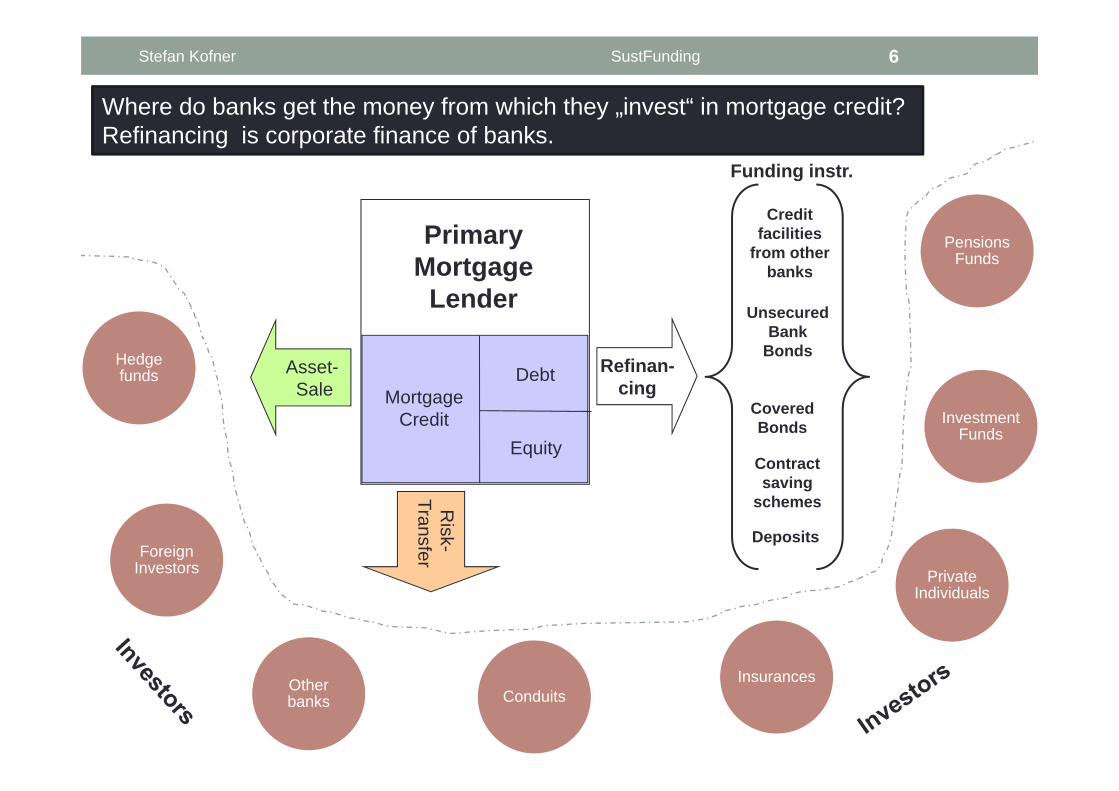
Figure 12: Pessimistic change in risk perception
Figure represents the circulating market for a funding instrument, e.g. some type of covered
bond. Initially the market is equilibrated. If this market is exposed to stress buyers and sellers
change their risk perception. Buyers are only willing to buy given quantities for lower prices
because they demand higher risk premiums. Sellers on the other hand are ready to accept low-
er prices for given quantities because they have lower risk investment alternatives with com-
parable interest rates at hand. The result will be lower prices for the securities. The direction
of the volume effect is dependent on the relative changes in risk perception of buyers and
sellers. If buyers react more sensitively than sellers the volume circulating will shrink et vice
versa. If we accept the initial equilibrium volume as a neutral starting point, the sustainable
outcomes are on the right side. The degree of sustainability increases the more we move to the
right. To the left of the neutral starting point we have the unsustainable outcomes. We can
thus define a sustainable funding instrument as an instrument where circulation does not fall
markedly and market yields do not rise sharply after a steep rise in perceived risk.
A0
N0
N1
circulation
price
A1
N2
Decreasing sustainability
32
Figure 13: Optimistic change in risk perception
Consider the consequences of an optimistic change in risk perception. Under such circum-
stances buyers are willing to accept higher prices for given quantities reflecting the lower risk
premiums. Sellers on the other hand demand higher prices for given quantities. The result will
be a higher price for the securities. The direction of the volume effect is again dependent on
the relative changes in risk perception of buyers and sellers. Sustainability increases to the
right. We can thus define a sustainable funding instrument as an instrument where circulation
does not rise markedly and market yields do not fall sharply after a steep fall in perceived
risk.
4.2 Development of funding sources during the financial crisis
In the storm of the financial crisis the classic funding instruments like deposits, bank bonds
and Mortgage Pfandbriefe have suffered whereas “innovative” instruments like securitization
and shorter term credit facilities from other banks experienced a disaster (Kofner / Hofer
2010, pp. 18-21).
Banks relying on shorter term credit from other banks were the first ones to be hit from the
declining market confidence. The fate of Northern Rock from England is a case in point. After
lending banks were not willing to roll forward their credit any more, in September 2007 a
genuine bank run and later on the nationalization of Northern Rock followed.
A0
N0
N1
circulation
price A1
Decreasing sustainability
33
What is more, the markets for mortgage credit securitization dried out faster than anyone had
expected. Since the middle of 2007 (!) private securitization markets were virtually no longer
available as a refinancing channel for residential mortgage loans (see figure). Since then the
vast majority of U.S. private mortgage loans was purchased by the two semi state controlled
securitization agencies known as Fannie Mae und Freddie Mac.
Source: Inside Mortgage Finance
Figure 14: Quarterly MBS-issues in billion Dollars in 2007
The market for unsecured bank bonds proved to be vulnerable, too. In the middle of 2008
rates had risen above 8 per cent and after the Lehman collapse the underwriting business came
to a halt for nearly six months. In these months government bonds and the new asset class of
state-guaranteed bonds dominated issuance. Measured in terms of swap spreads uncovered
bank bonds have fared considerably worse than covered bonds and especially far worse than
German Pfandbriefe.
And how about bank deposits? That asset class was regarded as a safe haven by most private
investors during the hard days of the crisis. We do not know however what would have hap-
pened without the public guarantees for private deposits provided by most EU governments.
In a crisis of confidence overnight or short-term deposits may turn out to be an unreliable
funding source. However, since the market participants trusted in the governmental guarantee
German banks with a funding side based on deposits did not have any liquidity difficulties
Subprime & OtherAlt-APrime JumboFreddie Mac & Fannie Mae
34
The Pfandbrief initially benefited from the financial disturbances. There was a lack of funding
alternatives since the markets for the securitization of mortgage credit had almost dried out by
the end of 2007 and the market for senior unsecured bank debt became illiquid. The Pfand-
brief as the major funding tool for mortgage loans with capital market orientation was able to
step into the breach and the issue volume and the nominal value of the outstanding Mortgage
Pfandbriefe rose strongly in 2008 (see figure). In the fourth quarter of 2008 however, the vol-
ume of Pfandbriefe sold was considerably smaller than it had been in the first three quarters of
the year.
Source: Association of German Pfandbrief Banks (2010b), European Covered Bond Council (2009)
Figure 15: New Issuance of Mortgage Pfandbriefe 2003-2009
Similar to other funding tools tradability of Pfandbriefe was temporarily restricted.10 Also in
the middle of the year 2008 the risk premiums began to rise. Pfandbrief spreads widened sig-
nificantly (see figure). However, the temporary liquidity problems in the Pfandbrief market
cannot be compared to the complete breakdown of the markets for credit securitization. Com-
pared with other mortgage funding instruments the Pfandbrief fared reasonably well and was
10 While investors were always able to buy or sell bid-offer spreads widened. Interbank secondary market trading
with Jumbo Pfandbriefe suffered from restrictions during the peak of the crisis. For further details see Kofner 2009, pp. 19-23.
New Issuance of Mortgage Pfandbriefe 2003-2009
0
10000
20000
30000
40000
50000
60000
70000
2003
2004
2005
2006
2007
2008
2009
mill
ion
Eu
ro
35
able to maintain access to liquidity by and large, if somewhat restricted and dearer. And we
should not forget that the Pfandbrief market recovered at a very early stage of general market
recovery. In 2009 the issue volume of mortgage backed Pfandbriefe reached 56.8 billion Eu-
ro, almost equaling the record level of the year before.
Source: Commerzbank Credit Research (2010)
Figure 16: Swap Spread of German Pfandbriefe compared to European Covered Bonds and
European Senior Unsecured Bank Debt
Admittedly, government intervention has helped. The bail out of Hypo Real Estate in early
October could be interpreted as an implicit state guarantee for all bigger banks regarded as
relevant to the system. The EU finance minister’s rescue package which included an explicit
commitment to bail out any bank constituting a systemic risk in the banking market and
common principles for the re-capitalization of ailing institutions (F.A.Z., 08.10.2008, Nr. 235,
p. 11) was also helpful to re-establish trust in the stability of the financial system. Another
milestone was the German government’s declaration to ensure the functionality of the Pfand-
brief Market and the safety of the Pfandbrief from 13. October 2008.11
11 Contained in the Explanatory Memorandum of the Financial Markets Stabilization Act (Finanzmarktstabi-
lisierungsgesetz).
Swap Spread of German Pfandbriefe compared to European Covered Bonds and European Senior Unsecured Bank Debt
-50
0
50
100
150
200
250
300
Jan 99 Jan 01 Jan 03 Jan 05 Jan 07 Jan 09
Swap Spread European Senior Unsecured Bank Debt (iBoxxprCorpBNKSen)
Swap Spread European Covered Bonds (iBoxxprCov)
Swap Spread German Pfandbriefe (IBOXXprCovDE)
(bp)
36
What can we learn from this in terms of sustainability of funding instruments? First of all, we
must bear in mind that this financial crisis was one of the heaviest ever experienced. Liquidity
almost completely dried out in many market segments and the crisis of confidence was so
deep that even the overnight money markets were hit. Under these conditions of extreme
stress we observed differences in shock resilience of the different funding instruments. Com-
paring and assessing the performance of the different instruments is not an easy task anyway,
because of the distortions created by government intervention.
4.3 The downfall of mortgage credit securitization
Why did securitization markets perform so badly during the crisis? These markets were espe-
cially vulnerable in a crisis of confidence not only because of the ever deteriorating quality of
the securitized credits, but also because of the complexity and intransparency of the securiti-
zation structure. The risks of the complex securities created were almost impossible to assess
for outsiders. A case in point is the tranching of mortgage bonds like MBS and CDO.
With the help of the tranching method a loan pool with a certain probability of failure could
be split in different sub-issues with different risk and return profiles. It allowed securities to
be tailored to the preferences of different investor groups. The AAA-rated tranches were
bought by, for example, pension funds and the remaining tranches by yield-hungry hedge
funds perhaps.
The importance of the tranching method for the global credit crisis can hardly be over-
estimates. An unstructured bond covered with inferior credit would necessarily get a lousy
rating. Only through the slicing and dicing was it possible to transform “garbage into gold”.
Using this kind of modern financial alchemy bonds covered with low-quality mortgages
achieved an AA-and AAA-rating.
Because of its complex and instransparent structures securitization of mortgage credit is sub-
ject to the well-known principal-agent-problem. The “principal” are the investors who invest
their money into MBS and not in ordinary bank bonds or covered bonds. It could be also buy-
ers of other securities, which are themselves covered by the MBS. As “agents” of the inves-
tors we have: the mortgagor, the credit-issuing bank, in many cases independent credit inter-
mediaries, the investment bank that arranged the securitization and the credit rating agency
that rated the MBS issue.
37
Figure 17: The Mortgage Industry Food Chain
The problem now is that the agents are just not behaving as vicarious agents (i.e. as if they
were themselves the holders of the MBS), because the investors can hardly control them in
such a complex web of relationships.12 So the agents have enough leeway to pursue their own
goals. In the securitization of a credit relationship, particularly the credit intermediary (often
also performing the lending test), the originator and the investment bank are susceptible to
carelessly grant or securitize mortgage loans to the detriment of MBS creditors – loans they
would not have taken on their own balance sheet because of their low credit quality. Therein
lies the so-called “moral hazard” of the whole structure.
With a 100-percent securitization none of the agents is more involved in the risk of default,
which is then carried fully by the MBS creditors. A control function can at best be performed
by the rating agencies who assess the credit bundles. That the agency is acting in the interests
of the creditors is doubtful, but depends on the incentive and remuneration structures. Critics
suggest that such complex structures have been created, not least to be able to deceive inves-
tors better about the risks. In any case, those responsible have withdrawn from effective con-
trol as much as possible.
This kind of organized intransparency and irresponsibility is just the opposite of the German
Pfandbrief system where creditor and issuer of debt securities are not as widely as possible
12 For a detailed analysis of these interactions see Ashcraft / Schuermann 2008.
38
separated from each other, but institutionally identical. The loans will remain at 100 percent
on the balance sheet of the securities issuer and it has no interest to grant mortgages to bor-
rowers with a defective creditworthiness.
The boundless expansion of the practice of securitizing real estate loans was the starting point
of the financial market crisis. With the help of securitization transactions, the lending banks
were able to remove mortgages with second-class credit ratings from their balance sheets. The
possibility of securitization acted as an incentive for the mortgage lenders to take on ever
greater credit risks and to pass them on to the capital market.
Is securitization thus to be banned completely? If we could limit the principal-agent-problem
and develop easier and more transparent structures, a second attempt seems feasible. A stable
funding system is however a system that rests on a number of pillars.
4.4 Diversification of the funding mix
For the stability of a national housing market the funding mix (i.e. the composition of the refi-
nancing means) is presumably more important than the availability of certain funding means.
From a stability point of view a steady flow of primary mortgage credit is required. Mortgage
lenders react upon changes in their funding conditions by changing primary interest rates,
loan criteria (requirements relating to the collateral or the creditworthiness of the borrower),
appraisal standards or loan characteristics.
For their lending behavior the refinancing conditions in their entirety are relevant. The macro-
stability of the system depends on the lending behavior of the whole banking sector. If a fund-
ing source dries out (e.g. uncovered bank bonds), there is no problem for the availability of
primary mortgage credit, if at the same time another funding instrument is ready to step into
the breach (e.g. bank deposits). If investors restructure their portfolios in a way that does not
affect the availability and conditions of funding for mortgage credit there will be no negative
effect on mortgage volume and real estate investment. The banking sector as a whole simply
adapts its refinancing portfolio. However, the distribution of market shares between lenders or
groups of credit institutions can change by doing so. Also, there may be differences in terms
of the adaptability of national housing finance systems to changes in the availability of certain
funding means: A part of the additional bank deposits in our example could be used for other
types of credit than mortgage credit.
As the financial crisis has shown (again) refinancing instruments are subject to sudden chang-
es in availability, price and liquidity. Also it depends on the type of crisis and the general cap-
ital market and macro-economic environment including bail-out measures of governments
which instruments suffer the most. Since it is not perfectly predictable how the different fund-
ing sources will be affected in a future secondary market liquidity crisis it is always a good
idea for a lender to spread the refunding risk as widely as possible. This argument is especial-
ly valid for so-called “systemic” banks: A one-sided funding mix of a systemic bank can
cause stability problems for the whole banking system. A bank that relies solely on one source
of funding is subject to a greater risk of insolvency and will ceteris paribus show a more dis-
39
continuous lending behavior. This is probably also true for the banking sector of a whole na-
tional economy. A multi-channel funding mix should enhance the shock resilience of the sys-
tem.
4.5 Maturity transformation or obedience to the golden rule of accounting?
Disturbances or fluctuations at the secondary mortgage markets generally affect both, the cir-
culation and the issuance market. The issuance market however will usually be hit more early
and directly. For the development of the circulation market and the related mortgages after a
shock, the exit options of the investors are crucial. It depends on the formal commitment peri-
ods and possibly also on the behavior of the investors. The maturity structures of all refinanc-
ing means circulating in the financial sector determine the shock absorption capacity of the
system. The longer the average maturity, the less vulnerable the system should be when con-
fronted with external shocks. Issuers of bonds with longer maturities can afford the time to
wait until the markets have calmed down again. They do not have to pay back their debt dur-
ing the worst market panic. Mortgage lenders relying on short-term market funds on the other
hand may not be able to replace these funds when market liquidity dries out.
The available funding instruments differ significantly in terms of their maturity. At one end of
the spectrum we have irredeemable long-term covered bonds such as German Pfandbriefe and
at the other end we have short-term credit from other banks. As we know, any mismatch of
maturities between assets and liabilities side (or rather any maturity overhang on the assets
side) creates an interest rate and a loan extension risk. We can subsume both risks under the
term “roll over risk”. The roll over risk is potentially dangerous for individual banks (e.g. the
Northern Rock bank), for segments of the capital market (e.g. Asset Backed Securities [ABS]
during the financial crisis) as well as for the whole financial system.
The danger arises from the shifting liquidity preferences of market participants. In autumn
2008 the liquidity preference of investors had shifted to extreme highs. In such a panic situa-
tion anyone in need to roll forward a position is in a difficult situation. What is more, in a li-
quidity crisis the liquidity of assets can be subject to sudden unexpected changes. A case in
point is the fate of the Collateralized Debt Obligations (CDO) during the financial crisis. They
developed from a rather liquid to a rather illiquid asset in a comparatively short period of
time. The problem is that any firm holding assets which suffer from sudden illiquidity runs an
increased roll over risk because lenders will take the liquidity of the borrower’s assets side
into account. Conduit structures and ABS funds are good examples.
Independent of the market mood investors have a general preference for liquidity. That means
that investors demand a compensation – a higher interest rate – for longer term commitments.
It is conventional textbook wisdom that one of the functions of a bank is maturity transfor-
mation. Banks traditionally transform short-term deposits into long-term credit. On the other
hand, any kind of maturity transformation is a violation of the old-fashioned “golden rule of
accounting” (also called congruent coverage principle) which forbids any maturity mismatch-
40
ing. The rule is essentially meant to assure insolvency-resistance by eliminating the roll over
risk. Is the golden rule the key to a sustainable funding system?
For the design of a sustainable funding system two questions are of crucial importance:
Is the roll over risk inevitable?
If it is, how can we manage the roll over risk on the macroeconomic level?
In a free market economy the roll over risk is inevitable because the general liquidity prefer-
ence of investors provides for an upwardly directed yield curve and thus an incentive for ma-
turity mismatching for banks and borrowers.13 It is doubtful if it would make sense to force all
banks and borrowers to respect the golden rule of accounting via regulation, supervision and
sanctions because that would mean higher long-term and lower short-term interest rates. The
resulting fundamental change of the slope of the yield curve would foster short-term invest-
ment at the cost of long-term investment. The long-term growth prospects of the economy
would suffer and especially real estate investment would slump when long-term credit would
be generally scarce. Whilst the golden rule of accounting taken literally would assure a high
degree of capital market stability, the cost of its enforcement seems unbearable.14
Since macroeconomic mismatching entails costs and benefits there must be an optimal degree
of mismatching. Reducing the degree of mismatching creates marginal benefits by reducing
financial market instability but also marginal costs in terms of future GDP losses. The crucial
question is if we are faced with market failure in this respect. Does the private sector tend to
expand maturity overhang beyond the optimal point? The answer is an issue of liability. If the
corporate governance system is defective or a bail out by the government is probable when
the risk of insolvency increases, the management has an incentive to boost profit expectations
in good times by extending the maturity overhang.
The government is thus well advised to keep an eye on the roll over risks in the banking sys-
tem. If a systemic bank cannot roll over funding means because of capital market liquidity
strains a chain reaction with unforeseeable consequences is possible – as we have seen after
the collapse of the investment bank Lehman brothers. The roll over risk thus needs to be lim-
ited, contained, supervised and cleverly distributed in order to make the whole system shock-
resistant.
Mortgages for private homes usually contain both types of risk, the interest rate and the loan
extension risk. That even applies to Germany where private mortgages often have a fixed in-
terest period of 10 years. The only exemption is the traditional 30 years fixed rate mortgage
common in the U.S.
13 It does not matter here if banks or borrowers take the roll over risk.
14 The other possible outcome of a trial to enforce the golden rule could be creative circumvention of such regu-lation by banks.
41
For the stability of the housing market it is obviously a good idea to contain the roll over risk
and especially the interest rate risk on the level of the borrowers. By containing the interest
rate risk the number of delinquent borrowers in case of a hefty interest rate rise can be limited.
This could be achieved by long (initial) fixed interest rate periods combined with considerable
initial amortization rates, by interest rate caps or by taking more than one loan and mix matur-
ities (e.g. three mortgages with 5, 10 and 15 years initial fixed interest rate periods).
From a systemic point of view however, this sort of stability may not be costless (no free
lunches). As we have argued, a certain degree of maturity overhang is efficient. Longer credit
terms put additional stress on the stability the financial system. This is because a part of most
long-term credit engagements will be refinanced with short-term means. Even when covered
bonds are used for funding, we can argue that by creating additional demand for long-term
capital short-term interest rates will rise. If regulation forces lenders in one segment of the
market to strictly respect the golden rule of accounting a higher degree of maturity mismatch-
ing somewhere else in the system will be the consequence.
Hence making the borrowers weatherproof is not a panacea. Less vulnerable borrowers could
mean more vulnerable lenders. Or less vulnerable lenders could mean more secondary mort-
gage market volatility. The challenge is to distribute the roll over risk in way that fosters the
stability of the whole system. If borrowers take out mortgages with variable interest rates the
lender does not run a roll over risk, but the probability of default of the borrowers will be
higher. If borrowers take out the classical 30 years fixed rate mortgages the roll over risk is
completely transferred to the banking system. Does this make sense? Arguably, it may be
easier for the lender to manage the roll over risk because banks usually run large credit portfo-
lios with different maturities whilst homeowners usually only hold one collateral asset fi-
nanced with one mortgage loan.
4.6 Towards a methodology of assessing sustainability
A global analysis for example of the MBS market would not be promising because the funds
raised are distributed to several primary markets. According to our definition of sustainability
which focuses on availability especially in stress situations it would make sense to take a look
at a set of countries that promise a specific learning effect because some shock event has hit
their primary mortgage market. On our shortlist we might put countries where house prices
have fallen dramatically during the financial crisis, e.g. the U.S., Ireland and Spain. For each
country we should compare the performance of different funding instruments. In the case of
Spain we could compare Cedulas, deposits and unsecured bank bonds.15 It is doubtful howev-
er if the U.S. would be a suitable country for investigation. The problem is the prominent role
of state-controlled securitization agencies like Fannie Mae and Freddie Mac. There is strong
evidence that these agencies stabilize the secondary market in times of stress. It is probable
that the private securitization market is distorted by their activities.
15 We may have to control for the ratings the issuers.
42
5 Conclusions
As we have argued above, it is desirable to moderate housing cycles, not least because of it is
a prerequisite for macro-economic stability: „Housing is the most important sector in our eco-
nomic recessions and any attempt to control the business cycle needs to focus especially on
residential investment.” (Leamer 2007, pp. 1-2).
If it is desirable to moderate the housing cycle, how can it be done? The pig cycle can be
moderated by appropriate measures to relax the supply-side rigidities (e.g. land supply). Also,
the government has a responsibility to stabilize the expectations of investors. Surprising inter-
ventions in the housing market surely have a destabilizing effect and should thus be avoided.
Stable framework conditions stabilize the flow of housing investment in time. Apart from this,
housing need forecasts can help to stabilize investor’s expectations. They can help investors
to anticipate future changes in demand and thus reduce development time lags.
It is surely more difficult to moderate the credit cycle. That is basically a problem of timing of
monetary policy: „The best time to fight the housing cycle with tight monetary policy is when
the wave is starting to rise, not when it is cresting. The worst time to stimulate the economy
with loose monetary policy is when the wave is starting to rise. That is going to make the crest
all the higher, and the crash all the more catastrophic.” (Leamer 2007, p. 3).
First of all, the definition of monetary stability should include the development of prices for
key assets. Monetary policy not only affects the prices of consumer goods, but also asset pric-
es. If by monetary expansion credit creation in the banking system is facilitated, this may af-
fect commodity prices, stock prices, house prices or any other asset prices. All assets that can
be purchased on credit are in danger, to become victims of a credit-induced inflation of asset
prices. This is especially dangerous for stability when the rising asset prices in turn attract an
increased credit creation. A lax monetary policy and unsustainable lending practices must
come together. If in an environment with lax regulation banks constantly adapt the collateral
values during the price cycle to inflated asset prices or raise the lending limits over and over
again, further upward pressure on prices will be the result.
In a bank-dominated system, where the risks remain predominantly on the balance sheets of
lenders, not even that would be enough to generate price and credit bubbles of the extent the
market for subprime mortgages incurred. Only when an easy money policy lasting for many
years, lax regulation of lending and the possibility of removing credit risk from the balance
sheets of lenders meet the explosive mixture is ready, that triggered the current crisis in finan-
cial markets.
43
6 Sources
Alvarez, L. / Bulligan, G. / Cabrero, A. / Ferrara, L. / Stahl, H. (2009): Housing and macroe-
conomic cycles in the major Euro area countries, Conference on Macroeconomics of Housing
Markets, Banque de France, 3-4 December 2009.
Arndt, F. / Tolckmitt, J. (2000): The Pfandbrief, in: The Pfandbrief 2000: Facts and Figures,
ed. by VDH Verband Deutscher Hypothekenbanken, pp. 7-26.
Ashcraft, A. / Schuermann, T. (2008): Understanding the Securitization of Subprime Mort-
gage Credit. Wharton Financial Institutions Center Working Paper No. 07-43.
Barras, R (1994), Property and the economic cycle: building cycles revisited, Journal of Prop-
erty Research, 11, pp. 183-197.
Bitner, R. (2008): Confessions of a Subprime Lender, Wiley.
Cantor, R. / Wenninger, J. (1993): Perspective on the Credit Slowdown, Federal Reserve
Bank of New York Quarterly Review, Spring 1993, Vol. 18, No. 1.
Case, K. / Shiller, R. (2004): Is there a bubble in the housing market?, Cowles Foundation
Paper No. 1089.
Catte, P. et al. (2004), “Housing Markets, Wealth and the Business Cycle”, OECD Economics
Department Working Papers, No. 394, OECD Publishing.
http://dx.doi.org/10.1787/534328100627
Hanau, A. (1928): Die Prognose der Schweinepreise, in: Vierteljahreshefte zur Konjunktur-
forschung, Sonderheft 7, Berlin.
Hurst, E. (2009): Housing Prices, Housing Cycles, and Consumption, Presentation University
of Chicago.
Kofner, S. (2007): Hedging mortgage default risk with mortgage guaranty insurance: A model
for Europe?, in: Housing Finance International, vol. 21, No. 4, Juni 2007, S. 3-15.
Kofner, S. (2008): Die Hypotheken- und Finanzmarkkrise, Frankfurt a.M.: Fritz Knapp Ver-
lag.
Kofner, S. (2009): The German Pfandbrief system facing the financial crisis, paper presented
at the European Network of Housing Research International Housing Conference, Prague,
Czech Republic, 28th June – 1st July 2009.
Kofner, S. / Hofer, T. (2010): The German residential mortgage market before, during and
after the financial crisis: business as usual? paper presented at the European Network of
Housing Research International Housing Conference, Istanbul, Turkey, 4th – 7th July 2010.
Kuznets, S. (1930): Equilibrium economics and business cycle theory, in: QJE, vol. 44, pp.
381-415.
44
Leamer, E. (2007): Housing and the Business Cycle, paper presented at the Symposium spon-
sored by the Federal Reserve Bank of Kansas City, Jackson Hole, Wyoming, August 30 -
September 1, 2007.
Münchau, W. (2008): Vorbeben, München: Hanser.
Report of the Mortgage Funding Expert Group for the European Commission, Brussels, 22
December 2006.
Rottke, N. (2006): Integration von Immobilienzyklen in das Immobilienmanagement, in: Bo-
ne-Winkel et al. (ed.): Stand und Entwicklungstendenzen der Immobilienökonomie, Köln:
Rudolf Müller Verlag.
Shleifer, A. (2000): Inefficient markets – an introduction to behavioral finance, Oxford.
SUSTAINABLE MORTGAGE FUNDING FOR SUSTAINABLE HOUSING MARKETSPresentation for the
European Network of Housing Research International Conference
Mixité: an urban and housing issue?, Toulouse, France
5. - 8. July 2011
Presenter: Stefan Kofner, MCIH
Stefan Kofner SustFunding 2
Contents
I. Sustainability and mortgage funding
II. Housing cycles and bubbles
III. Theories of the housing cycle
IV. Sustainable mortgage funding
• “A high-quality and progressive land culture necessarily requires an abundant and steady in-flow of productive capital, it is simply impossible without this. ...
• We have no better means to set in motion the existing capital, the entrepreneurial spirit and the manpower, as the real credit.”
Stefan Kofner SustFunding 3
Residential construction volume in Western Europe 1991-2012 in prices of 2009
Where do banks get the money from which they „invest“ in mortgage credit?Refinancing is corporate finance of banks.
Funding instr.
Sustainability and mortgage funding
Steady availability
and price of refinancing
Steady access of
borrowers to mortgage
credit
Steady development
of primary mortgage
rates
Steady flow of housing investment
Stefan Kofner SustFunding 7
• Improve ourunderstanding of housing market cycles and bubbles and their relation with primary and secondary mortgage markets
How to define the housing cycle?
Stefan Kofner SustFunding 8
Peak
Recession
Trough
Recovery
Time
Variable
Housing cycle: Similar cyclical developmentsof certain time series variables like building permits, buildingcompletions, real estate prices, default rates of mortgage borrowers,real estate investment and sales activities, vacancy rates, volume ofnewly granted mortgage loans and so forth around a long-term trend.
Stefan Kofner SustFunding 9
‐
100 000
200 000
300 000
400 000
500 000
600 000
700 000
800 000
900 000
1970 …………….
1972 …………….
1974 …………….
1976 …………….
1978 …………….
1980 …………….
1982 …………….
1984 …………….
1986 …………….
1988 …………….
1990 …………….
1992 …………….
1994 …………….
1996 …………….
1998 …………….
2000 …………….
2002 …………….
2004 …………….
2006 …………….
2008 …………….
Building permits for dwellings in residential and non-residential constructionFormer federal territory (from the year 2005 without West Berlin)
Canada 0.013 0.060 Finland 0.009 0.040Spain 0.019 0.081 New Zealand 0.014 0.080
Australia 0.015 0.065 Ireland 0.022 0.059
Average 1970-1999 0.0122000-2006 0.046
Source: Erik Hurst 2009
Average Annual Real Price Growth By OECD Country
Stefan Kofner SustFunding 17
-0,12
-0,09
-0,06
-0,03
0,00
0,03
0,06
0,09
0,12
U.S. Real House Price Appreciation: 1976 – 2008 (OFHEO Data)
Stefan Kofner SustFunding 18
Problems of price
formation
Inelastic supply and
demand curves
Initial over-shooting of rents and
prices
Supply adjusts in
the long run
Develop-ment time
lags induce pig cycles
Credit-driven cycles
Stefan Kofner SustFunding 19
How can weexplain thosecycles andbubbles?
Theories of the housing cycle
• Leamer in 2007: “I have not been able to find anymacro-economic textbook that places real estatefront and center, where it belongs.”
• “Exogenous factors”: Housing cycle dependent on business cycle / credit cycle
• “Endogenous factors”:• Development Time Lags: like ships, pigs and airplanes
• Information inefficiencies: those principals and agents
• Bounded rationality: read Minsky
• Maybe the earth orbits around the sun?
Stefan Kofner SustFunding 20
Agricultural price cycles(especially with “livestock”)
Stefan Kofner SustFunding 21
Productioncycle
Pricecycle
Time
0.00
0.50
1.00
1.50
2.00
2.500
1M
19
90
08
M1
99
0
03
M1
99
1
10
M1
99
1
05
M1
99
2
12
M1
99
2
07
M1
99
3
02
M1
99
4
09
M1
99
4
04
M1
99
5
11
M1
99
5
06
M1
99
6
01
M1
99
7
08
M1
99
7
03
M1
99
8
10
M1
99
8
05
M1
99
9
12
M1
99
9
07
M2
00
0
02
M2
00
1
09
M2
00
1
04
M2
00
2
11
M2
00
2
06
M2
00
3
01
M2
00
4
Pre
ise
in €
/kg
Deutschland ÖsterreichQuelle: Statistik Austria, Schmid
SustFunding 22
Pork meat prices in Austria and Germany in €/kg
Stefan Kofner
The Cobweb Theorem
Stefan Kofner SustFunding 23
DS
P Hi
P Lo
Q HiQ Lo
Expansion
Contraction
FallingPrices
RisingPrices
Price
Quantity
The suppliers are responding tocurrent prices.“Biological lag”: time required untilmarket effectiveness of productiondecisions“Psychological lag”: time requiredfor the realization of changingmarket situations
Pt
St6
St+k
Qt+k
D
St5St4
St2
St3
St1Pt1
Pt3
Pt4
Pt2
Stefan Kofner SustFunding 24
Convergence or divergence of the model is a question of therelative slopes of the supply and demand curves.
The housing market – a cobweb?
• The housing market fits well into the assumptions of the cobweb theorem.
• Model explains dynamic cyclical developments of quantities and prices after an initial shock.
• “For housing it’s the cycle that is persistent. Once the cycle starts, it keeps on going. Like a pebble thrown into a smooth pond of water.” (Leamer 2007, p. 3)
Stefan Kofner SustFunding 25
Regional or nationwide cycles?
• Hurst: extreme heterogeneity within metro areas with respect to housing price changes
• No wonder: regional markets
• National level cycles induced, if the same shock event hits many regional housing markets at the same time (e.g. interest rates, migration balance, national tax regulation)
• However: Different types of real estate / different regions may have different development time lags
Subprime & OtherAlt-APrime JumboFreddie Mac & Fannie Mae
Source: Inside Mortgage Finance
“System-inherent factors”
Stefan Kofner SustFunding 34
accelerating decelerating neutral unclear
Taxation and subsidies X
Share of non-recourse mortgages
U.S. Germany
Market-oriented appraisal of collateral
U.S. Germany
Cyclical lending standards U.S. Germany
Cyclical LTV requirements U.S. Germany
Share of adjustable rate mortgages
U.S. Germany
Share of loans with innovative characteristics
U.S. Germany
• direction of influence of these factors shaped by institutional design and
changing patterns of human behavior.• e.g. non-recourse mortgages, appraisal, “innovative” loan characteristics• Running a mortgage system with several accelerating factors active at
the same time is dangerous because of mutual reinforcement
*)• Adjustable Rate
Mortgages (ARM)• 5/1, 7/1, 10/1 ARMs• Interest Only
Mortgage-specific and non-specific funding instruments
• Some refinancing instruments define minimum requirements relating to the mortgages to be refinanced. Such requirements can pertain to (inter alia):• the length of fixed-rate periods (“congruent coverage”),
• the determination of the mortgage lending value,
Towards a definition of a sustainable mortgage funding instrument
• Focus on continuous availability of the instrument in all phases of the housing cycle at an “affordable” interest rate
• No excess supply in boom phases, no drying out in times of stress
• assessment of sustainability: secondary market liquidity and issuance activity.
Stefan Kofner SustFunding 37
Pessimistic change in risk perception
Stefan Kofner SustFunding 38
A0
N0
N1
circulation
price
A1
N2
Decreasing sustainability
Buyer‘sstrike
Optimistic change in risk perception
Stefan Kofner SustFunding 39
A0
N0
N1
circulation
price A1
Decreasing sustainability
How did the different funding instruments perform?
• Shorter term credit facilities from other banks: Remember Northern Rock?
• Mortgage securitization: market almost disappeared overnight in the U.S.
• Unsecured bank bonds:• After the Lehman collapse no underwritings
for six months.
• Swap spreads worse than covered bonds and far worse than German Pfandbriefe.
• Bank deposits profited from public guarantees
Stefan Kofner SustFunding 40
And how did the Pfandbrief perform?
Stefan Kofner SustFunding 41
New Issuance of Mortgage Pfandbriefe 2003-2009
0
10000
20000
30000
40000
50000
60000
70000
2003
2004
2005
2006
2007
2008
2009
mil
lio
n E
uro
Source: vdp 2010b, European Covered Bond Council 2009
• Nominal value of outstanding Mortgage Pfandbriefe rose strongly in 2008 (by 114 per cent).
• Price formation “liquidity-driven” after September 15
• Market relaxation in the course of the year 2009: Spreads narrowed when risk attitudes normalized
Stefan Kofner SustFunding 42
Swap Spread of German Pfandbriefe compared to European Covered Bonds and European Senior Unsecured Bank Debt
-50
0
50
100
150
200
250
300
Jan 99 Jan 01 Jan 03 Jan 05 Jan 07 Jan 09
Swap Spread European Senior Unsecured Bank Debt ( iBoxxprCorpBNKSen)
Swap Spread European Covered Bonds (iBoxxprCov)
Swap Spread German Pfandbriefe (IBOXXprCovDE)
(bp)
Source: Commerzbank Credit Research 2009
The role of government intervention
Implicit and explicit state guarantees of banks regarded
as “relevant to the system”
German government’s institutional guarantee of the Pfandbrief funding system
from 13. October 2008
European Central Bank’s 60 billion Euro purchase program
for covered bonds
Stefan Kofner SustFunding 43
If only theAmericans
used coveredbonds insteadsecuritization!
Maturity mismatch creates roll over risk
• Any mismatch of maturities between assets (i.e. any violation of the golden rule of accounting) and liabilities side (or rather any maturity overhang on the assets side) creates a “roll over risk”, i.e. interest rate and loan extension risk.
• danger of shifting liquidity preferences – liquidity crisis• difficult to roll forward a position
• liquidity of assets can suddenly change
• Chain reactions depending on the complexity of the structure:e.g. Conduits suffered from illiquidity of CDOs
• Shock absorption capacity of the system determined by maturity structure of refinancing means circulating
Stefan Kofner SustFunding 44
Just enforce the golden rule?• The golden rule of accounting is essentially meant to
assure insolvency-resistance by eliminating the roll over risk.
• But: One of the functions of a bank is maturity transformation.
• But: The roll over risk is inevitable because the general liquidity preference of investors provides for an upwardly directed yield curve and thus an incentive for maturity mismatching for banks and borrowers.
• The cost of enforcement of the golden rule seems unbearable, inter alia higher long-term interest rates
• Better ask for the optimal degree of mismatching possibly market failure
Stefan Kofner SustFunding 45
The key(s) to funding stability
1. The challenge is to distribute the roll over risk in a way that fosters the stability of the whole system: Lenders have better risk dispersion possibilities
2. In inefficient markets covered bonds have the characteristics of a public good.
3. Diversification of the funding mix is important at all levels.
4. The longer the average maturity of refinancing instruments, the better. And avoid cumulation of maturities!
Stefan Kofner SustFunding 46
How can we moderate the housing cycle?
• Pig cycle• relax supply-side rigidities (e.g. land supply)
• stabilize the expectations of investors
• Credit cycle• Timing of monetary policy
• Definition of monetary stability incl. key asset prices
• Sustainable lending practices
• Possibility to remove credit risk from the balance sheet
Stefan Kofner SustFunding 47
• „Housing is the most important sector in our economic recessions and any attempt to control the business cycle needs to focus especially on residential investment.” (Leamer 2007, pp. 1-2).