35
Sustainable Packaging Trends Gwen Lorio April 28, 2011
Sustainable Packaging TrendsGwen Lorio April 28, 2011
2
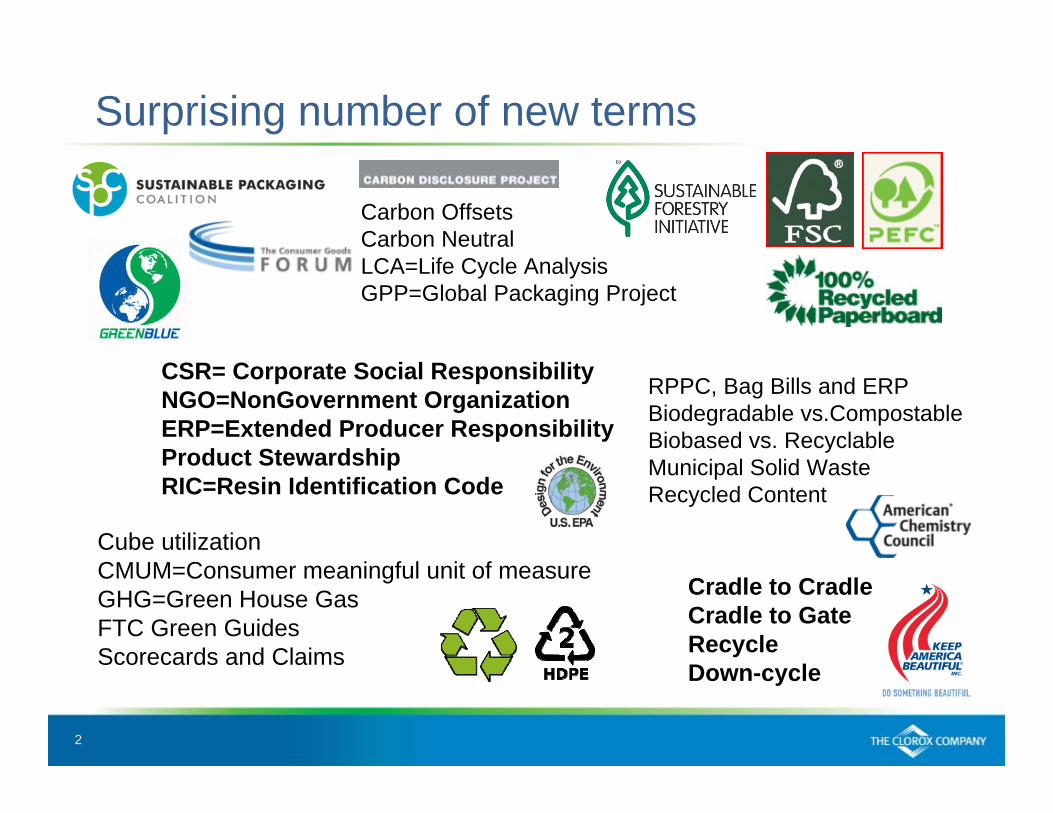
Surprising number of new terms
Cradle to CradleCradle to GateRecycleDown-cycle
CSR= Corporate Social ResponsibilityNGO=NonGovernment OrganizationERP=Extended Producer ResponsibilityProduct StewardshipRIC=Resin Identification Code
Carbon OffsetsCarbon NeutralLCA=Life Cycle AnalysisGPP=Global Packaging Project
Cube utilizationCMUM=Consumer meaningful unit of measureGHG=Green House GasFTC Green GuidesScorecards and Claims
RPPC, Bag Bills and ERPBiodegradable vs.CompostableBiobased vs. RecyclableMunicipal Solid WasteRecycled Content
3
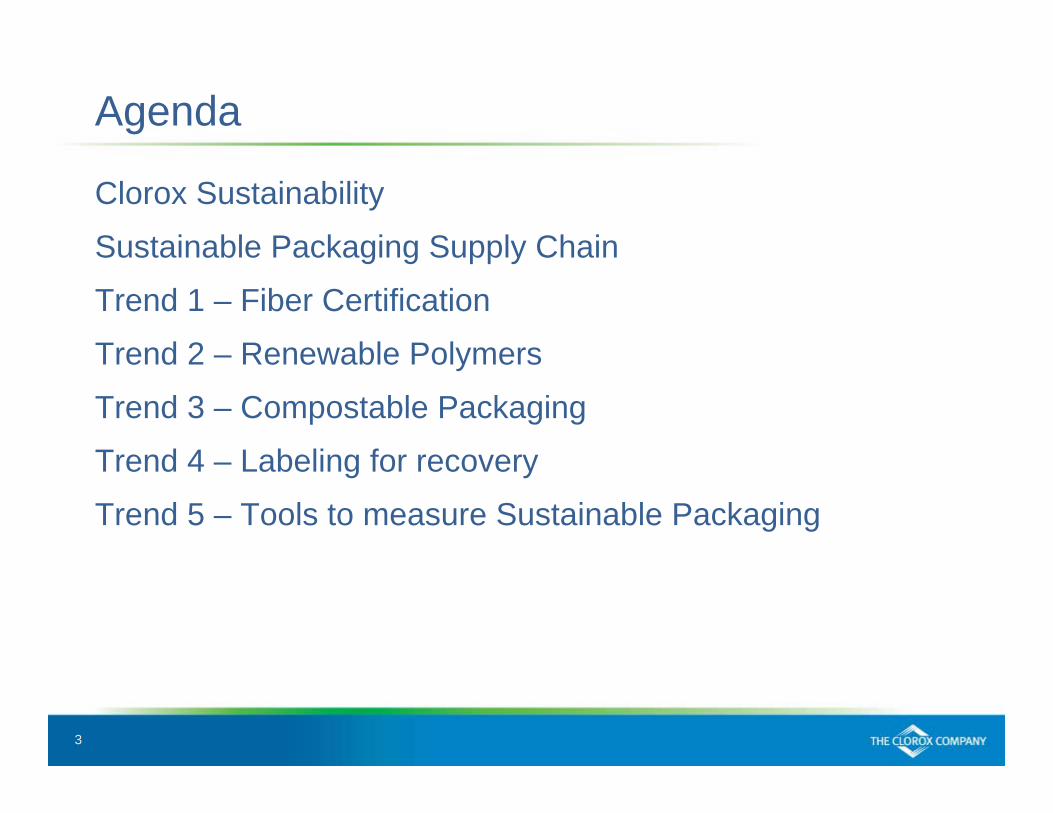
Agenda
Clorox Sustainability
Sustainable Packaging Supply Chain
Trend 1 – Fiber Certification
Trend 2 – Renewable Polymers
Trend 3 – Compostable Packaging
Trend 4 – Labeling for recovery
Trend 5 – Tools to measure Sustainable Packaging
4
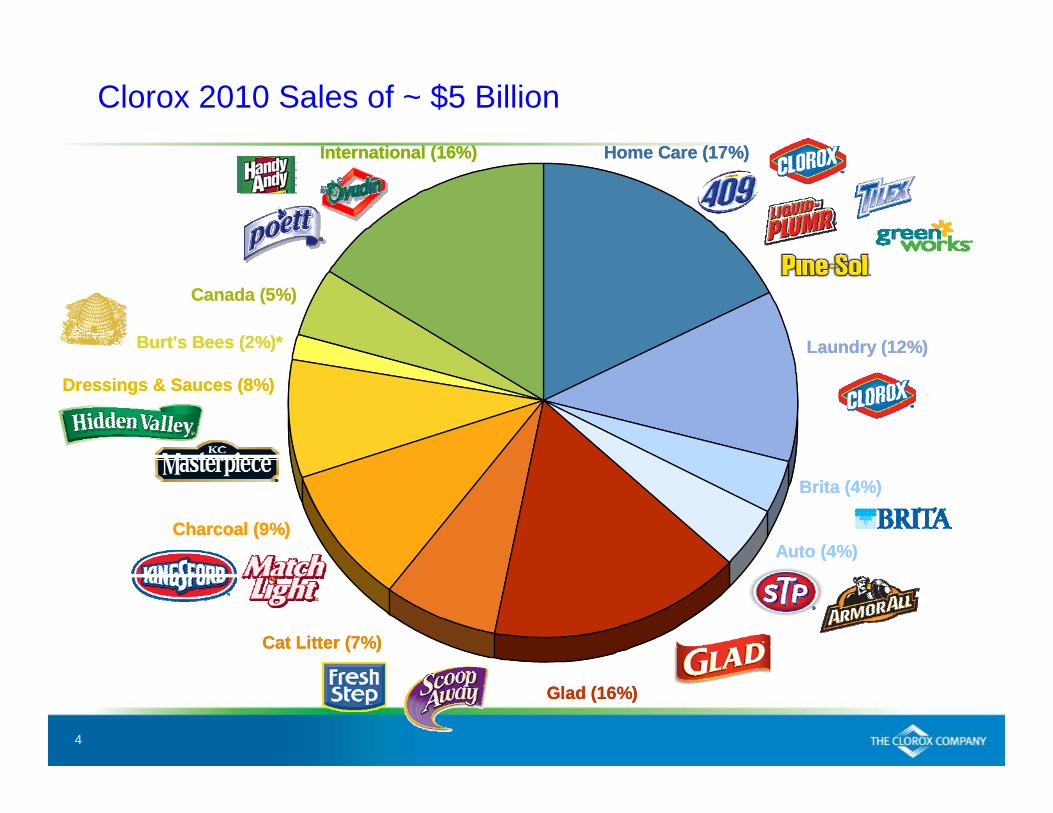
International (16%)
Canada (5%)
Burt's Bees (2%)*
Dressings & Sauces (8%)
Charcoal (9%)
Cat Litter (7%)
Glad (16%)
Auto (4%)
Brita (4%)
Laundry (12%)
Home Care (17%) International (16%)
Canada (5%)
Burt's Bees (2%)*
Dressings & Sauces (8%)
Charcoal (9%)
Cat Litter (7%)
Glad (16%)
Auto (4%)
Brita (4%)
Laundry (12%)
Home Care (17%)
Clorox 2010 Sales of ~ $5 Billion
5
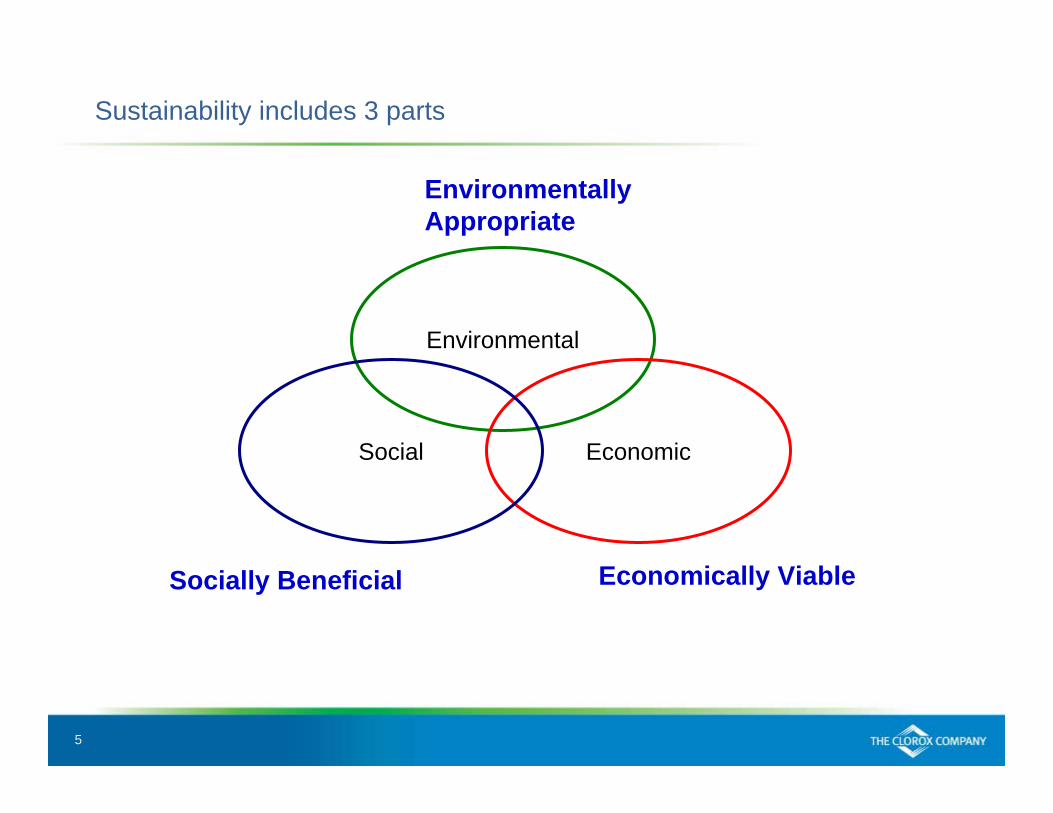
Sustainability includes 3 parts
Environmental
EconomicSocial
Environmentally Appropriate
Socially Beneficial Economically Viable

6
6
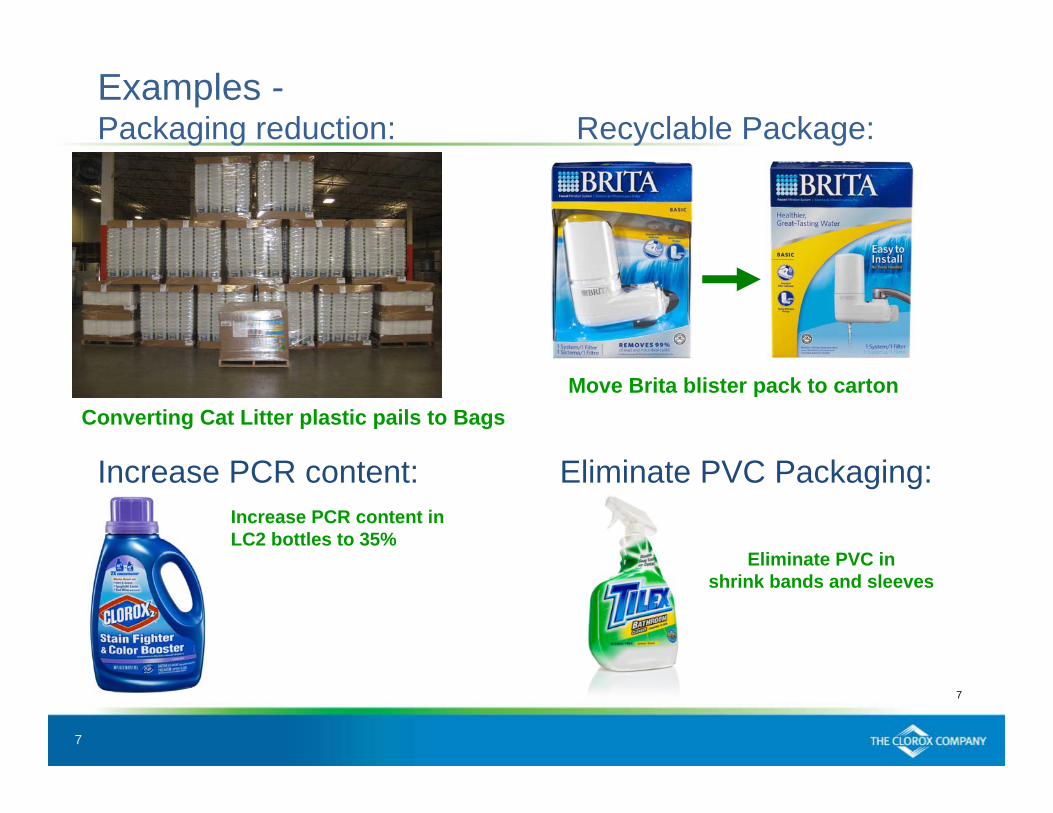
Clorox’s 2013 Sustainable Packaging Goals:
• Reduce packaging of the majority of our product portfolio by 5 percent or more
• Have more than 90 percent of all our products in recyclable primary packaging
• Increase PCR content in our primary and secondary packaging
• Eliminate PVC in all packaging
7
7
Examples -Packaging reduction: Recyclable Package:
Converting Cat Litter plastic pails to BagsMove Brita blister pack to carton
Increase PCR content: Eliminate PVC Packaging:Increase PCR content in LC2 bottles to 35%
Eliminate PVC in shrink bands and sleeves
8
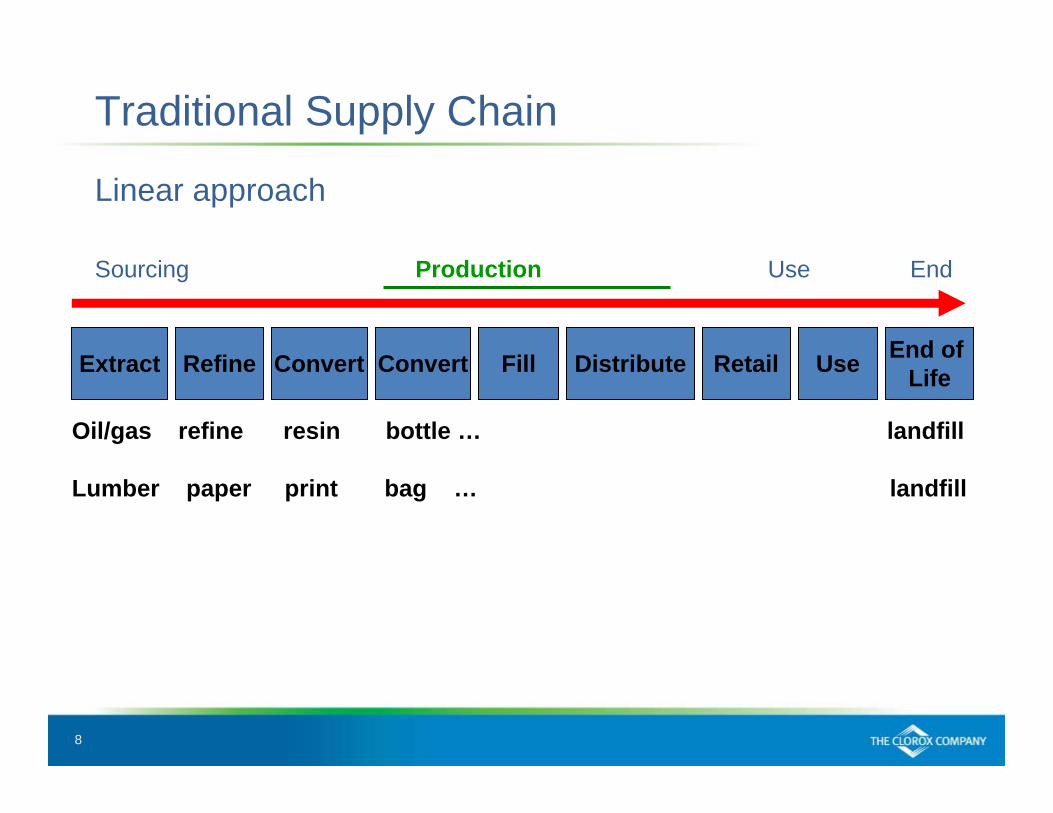
Traditional Supply Chain
Linear approach
Sourcing Production Use End
Extract Refine Convert Convert Fill Distribute Retail Use End of Life
Oil/gas refine resin bottle … landfill
Lumber paper print bag … landfill
9
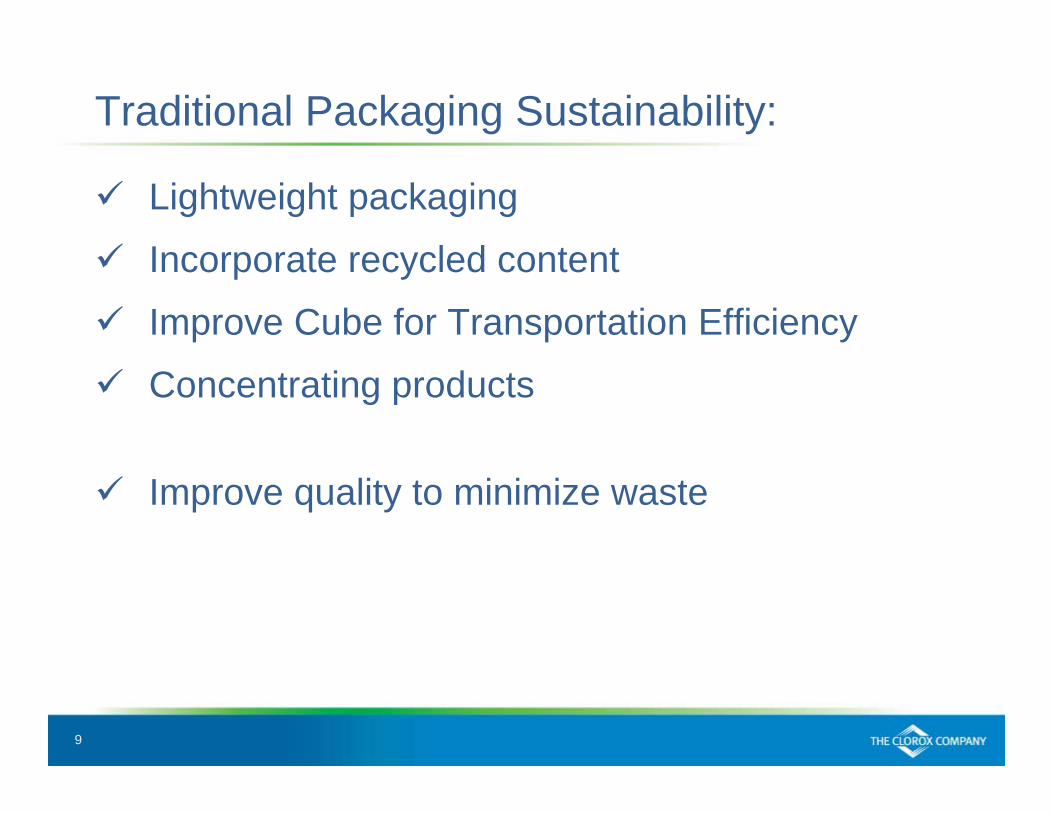
Traditional Packaging Sustainability:
Lightweight packaging
Incorporate recycled content
Improve Cube for Transportation Efficiency
Concentrating products
Improve quality to minimize waste
10
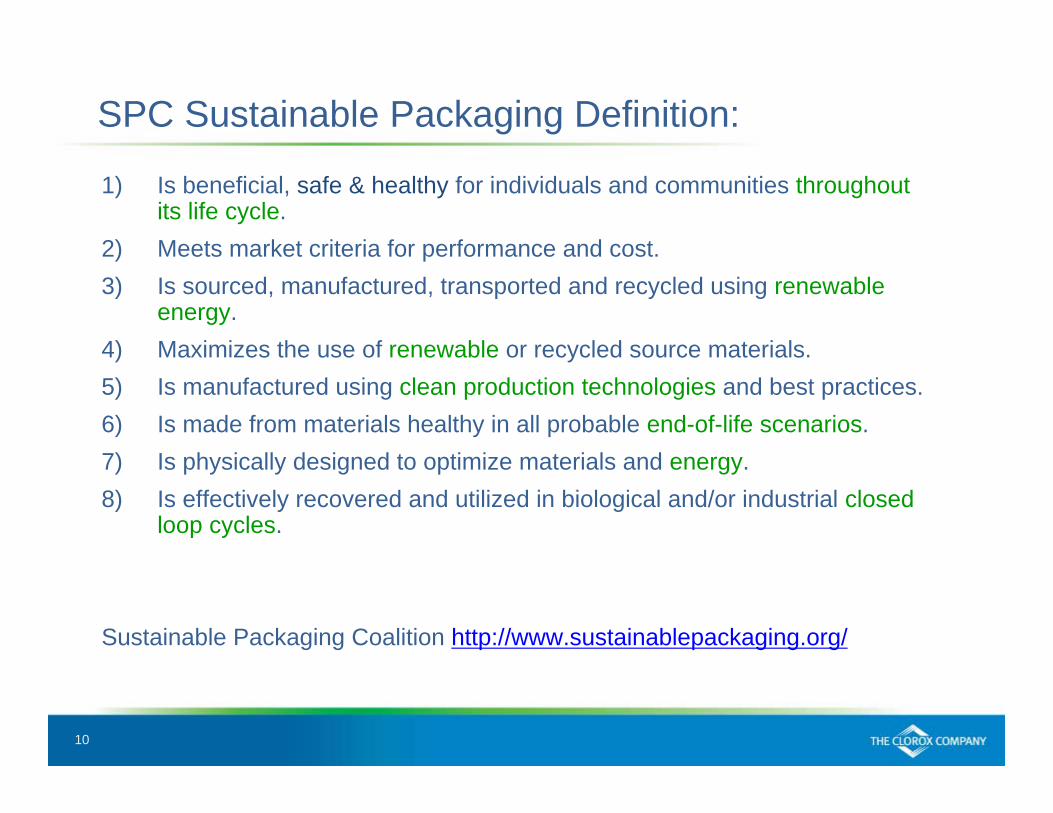
SPC Sustainable Packaging Definition:
1) Is beneficial, safe & healthy for individuals and communities throughout its life cycle.
2) Meets market criteria for performance and cost.3) Is sourced, manufactured, transported and recycled using renewable
energy.4) Maximizes the use of renewable or recycled source materials.5) Is manufactured using clean production technologies and best practices.6) Is made from materials healthy in all probable end-of-life scenarios.7) Is physically designed to optimize materials and energy.8) Is effectively recovered and utilized in biological and/or industrial closed
loop cycles.
Sustainable Packaging Coalition http://www.sustainablepackaging.org/
11
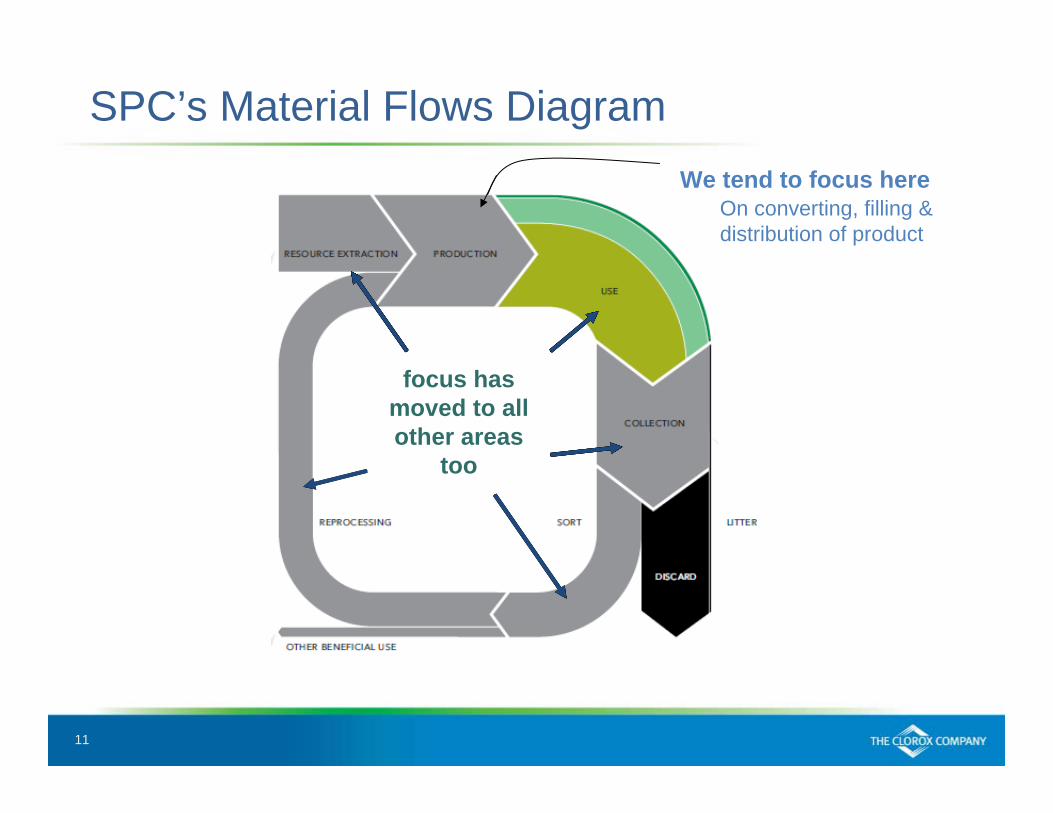
SPC’s Material Flows DiagramWe tend to focus here
focus has moved to all other areas
too test
On converting, filling & distribution of product
12
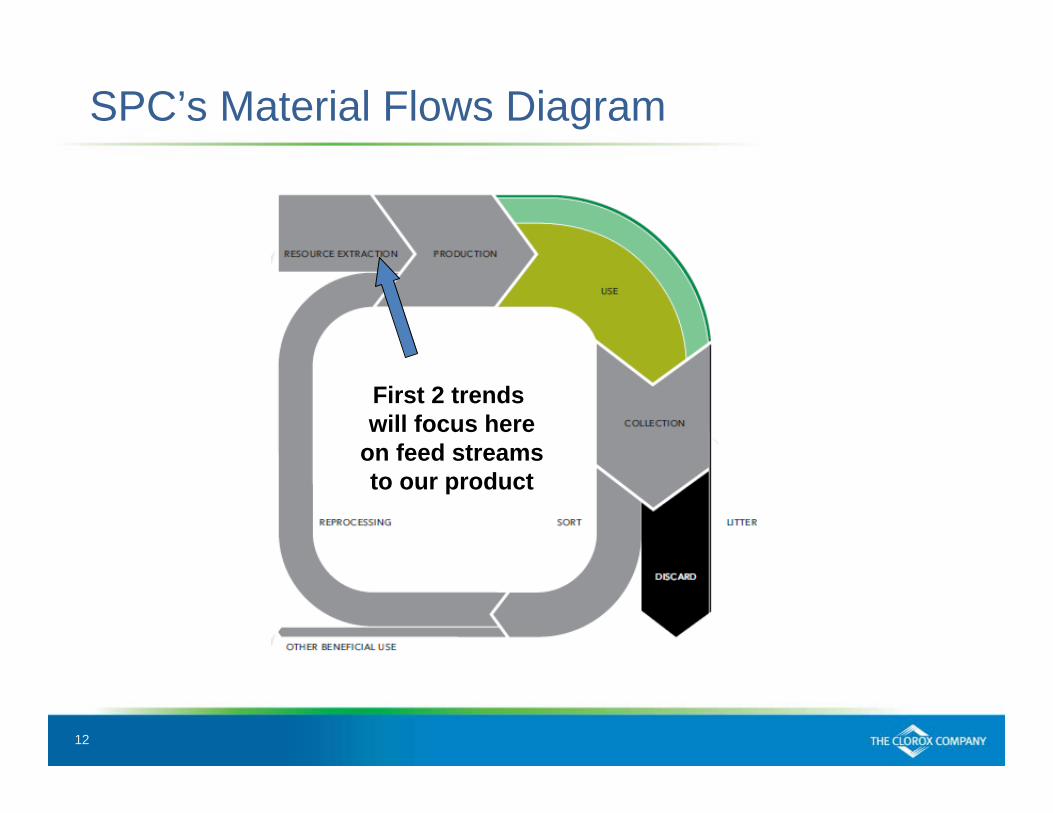
SPC’s Material Flows Diagram
test
First 2 trends will focus here
on feed streamsto our product
13
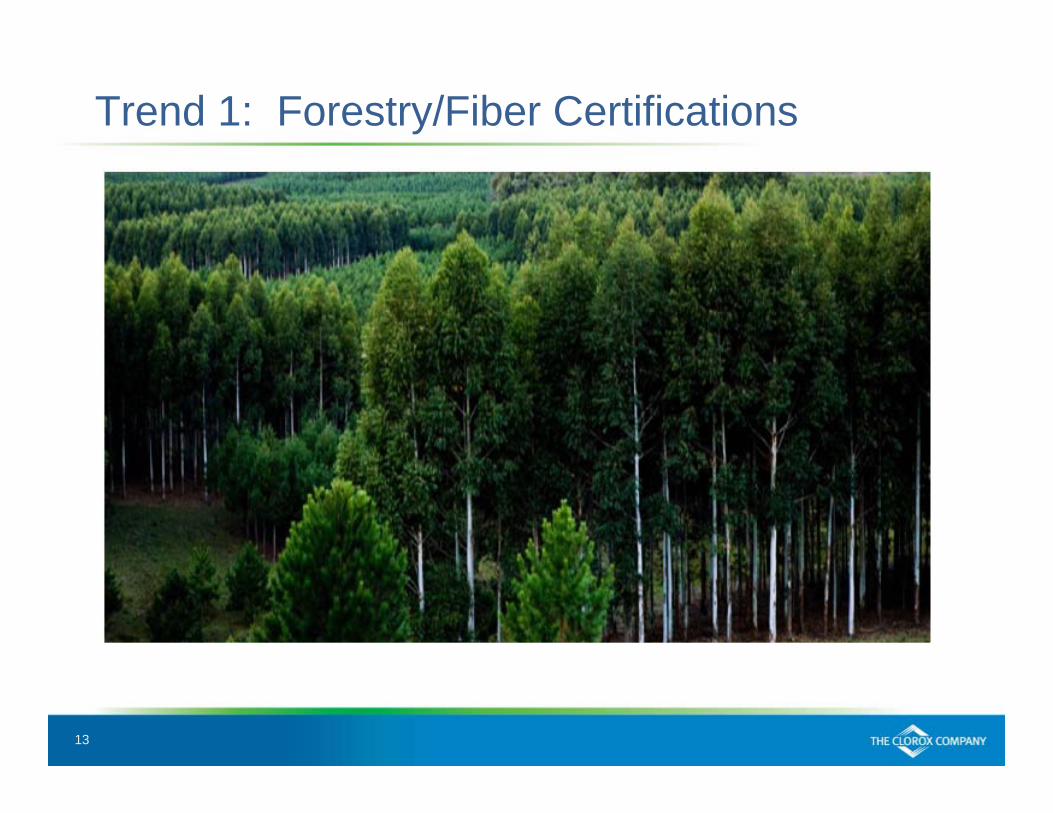
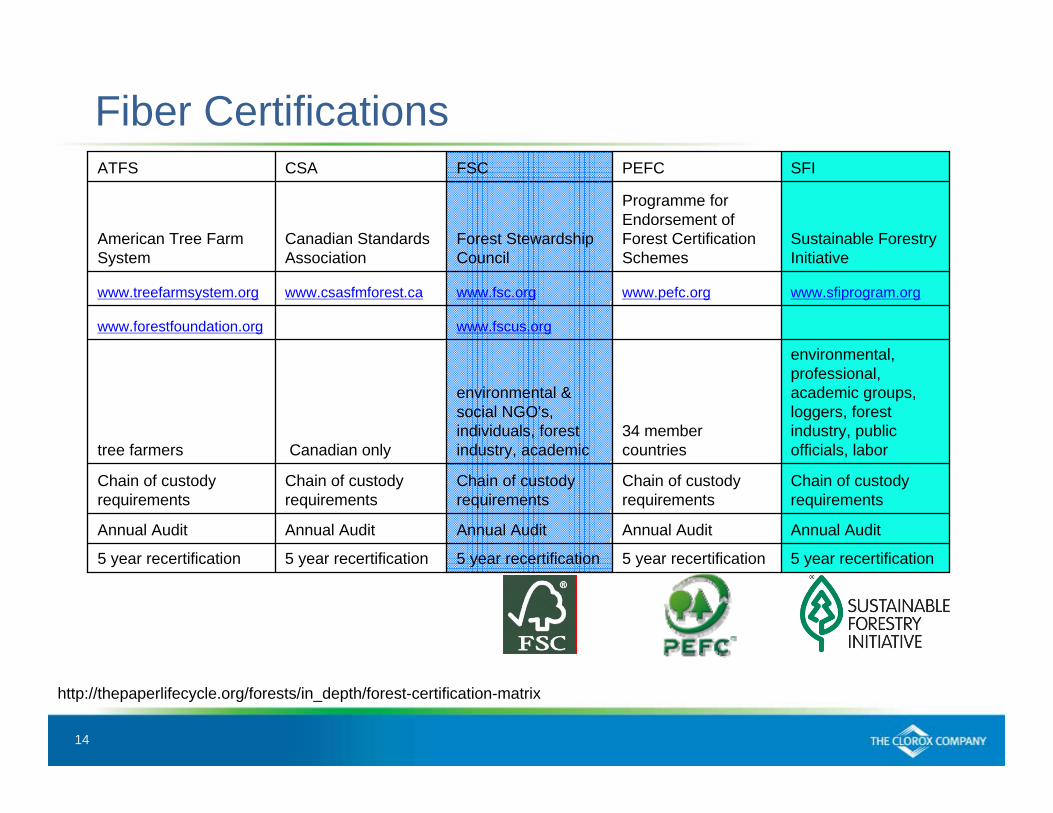
Trend 1: Forestry/Fiber Certifications
14
Fiber Certifications
5 year recertification5 year recertification5 year recertification5 year recertification5 year recertification
Annual AuditAnnual AuditAnnual AuditAnnual AuditAnnual Audit
Chain of custody requirements
Chain of custody requirements
Chain of custody requirements
Chain of custody requirements
Chain of custody requirements
environmental, professional, academic groups, loggers, forest industry, public officials, labor
34 member countries
environmental & social NGO's, individuals, forest industry, academicCanadian onlytree farmers
www.fscus.orgwww.forestfoundation.org
www.sfiprogram.orgwww.pefc.orgwww.fsc.orgwww.csasfmforest.cawww.treefarmsystem.org
Sustainable Forestry Initiative
Programme for Endorsement of Forest Certification Schemes
Forest Stewardship Council
Canadian Standards Association
American Tree Farm System
SFIPEFCFSCCSAATFS
http://thepaperlifecycle.org/forests/in_depth/forest-certification-matrix
15
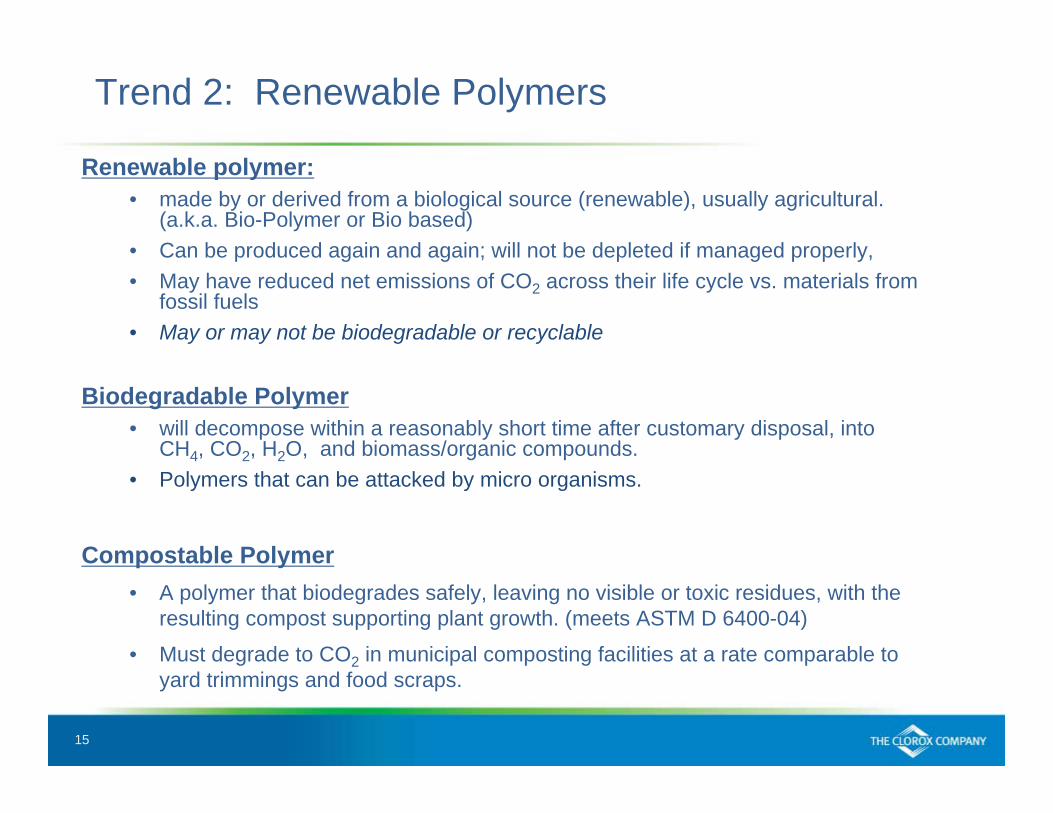
Trend 2: Renewable Polymers
Renewable polymer:• made by or derived from a biological source (renewable), usually agricultural.
(a.k.a. Bio-Polymer or Bio based) • Can be produced again and again; will not be depleted if managed properly,• May have reduced net emissions of CO2 across their life cycle vs. materials from
fossil fuels• May or may not be biodegradable or recyclable
Biodegradable Polymer• will decompose within a reasonably short time after customary disposal, into
CH4, CO2, H2O, and biomass/organic compounds. • Polymers that can be attacked by micro organisms.
Compostable Polymer • A polymer that biodegrades safely, leaving no visible or toxic residues, with the
resulting compost supporting plant growth. (meets ASTM D 6400-04)
• Must degrade to CO2 in municipal composting facilities at a rate comparable to yard trimmings and food scraps.
16
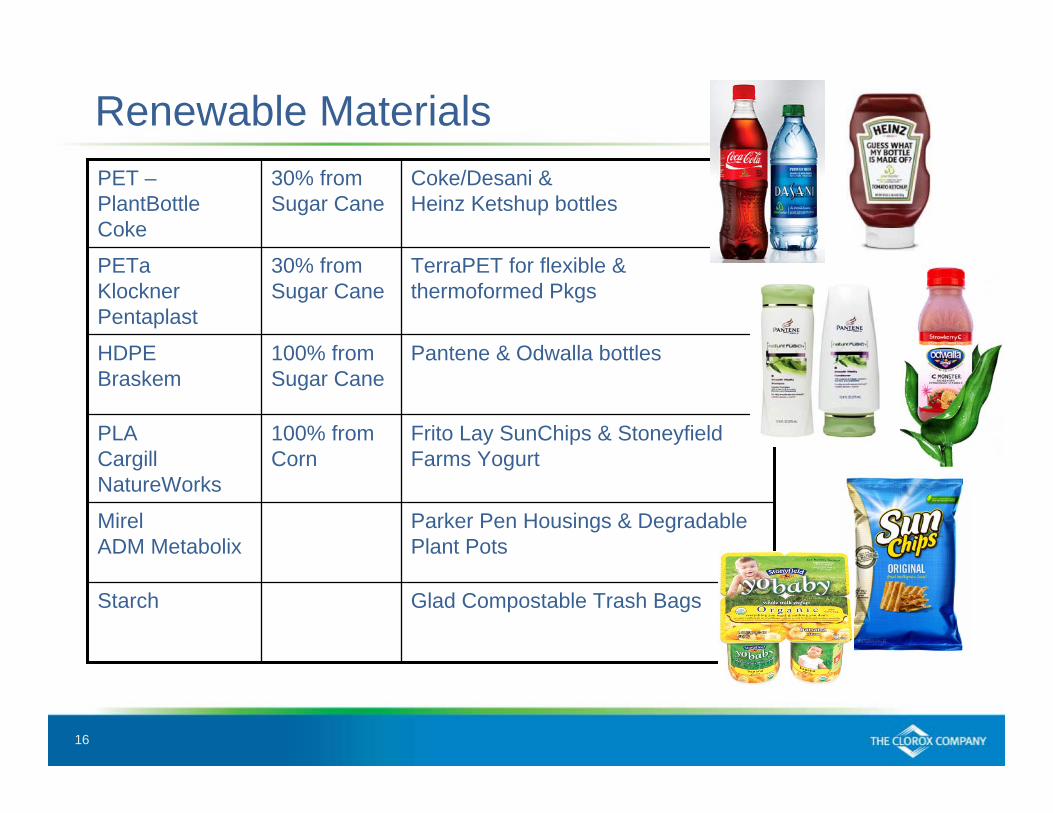
Renewable Materials
Glad Compostable Trash BagsStarch
Parker Pen Housings & Degradable Plant Pots
MirelADM Metabolix
Frito Lay SunChips & StoneyfieldFarms Yogurt
100% fromCorn
PLACargill NatureWorks
Pantene & Odwalla bottles100% from Sugar Cane
HDPEBraskem
TerraPET for flexible & thermoformed Pkgs
30% from Sugar Cane
PETaKlocknerPentaplast
Coke/Desani & Heinz Ketshup bottles
30% from Sugar Cane
PET –PlantBottleCoke
17
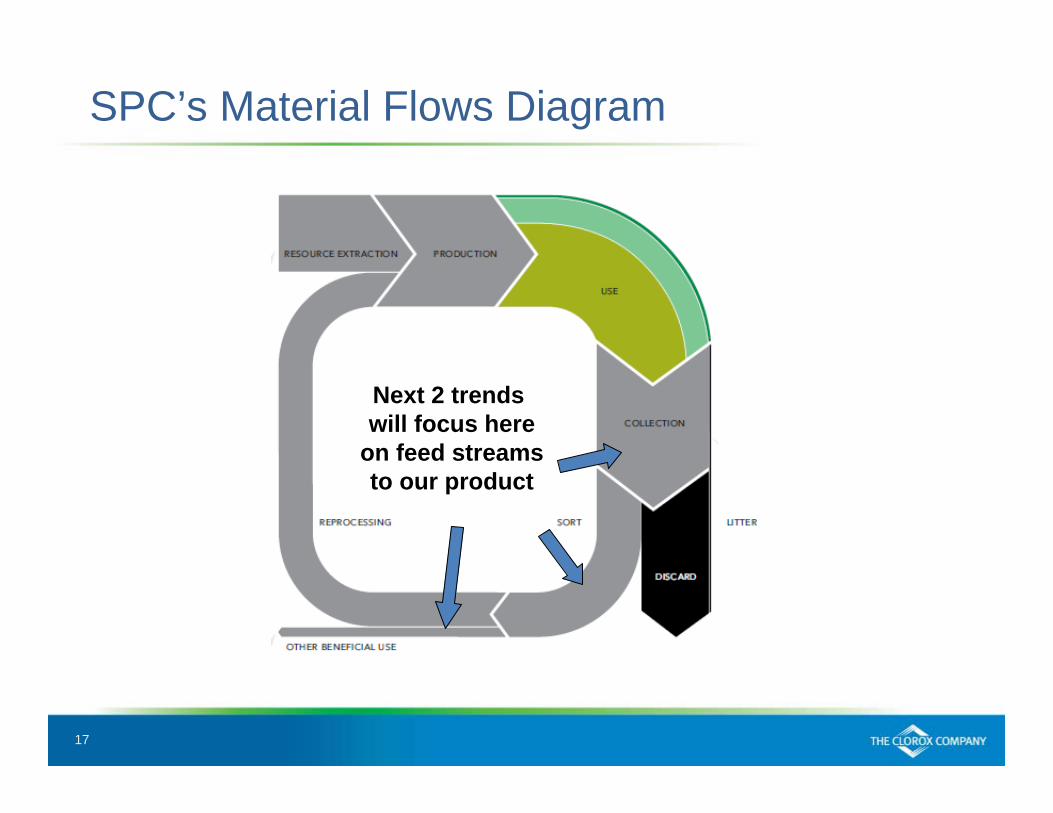
SPC’s Material Flows Diagram
test
Next 2 trends will focus here
on feed streamsto our product
18
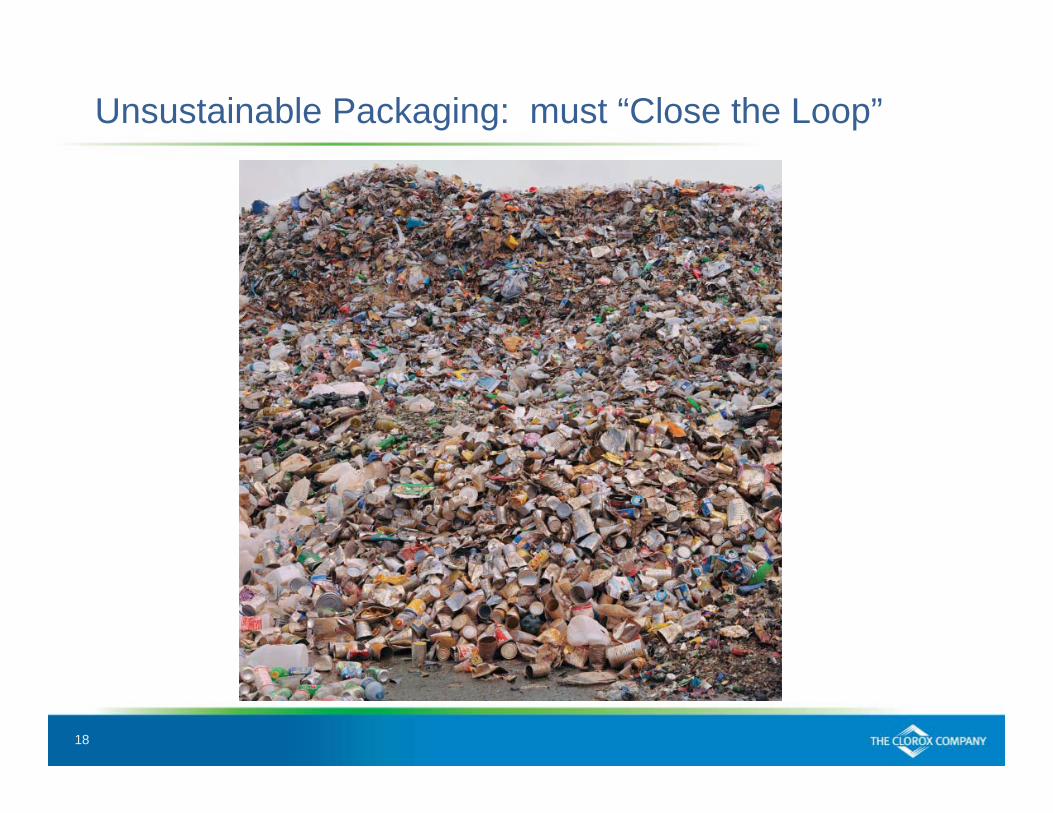
Unsustainable Packaging: must “Close the Loop”
19
Trend 3: Compostable Packaging
• Why compost packaging?• Encourages diversion of food/organics from landfill
• In turn, reduces methane emissions
• Recycling offers higher value for items without food contamination
• Key take away: Don’t design compostability into non-food packaging
20
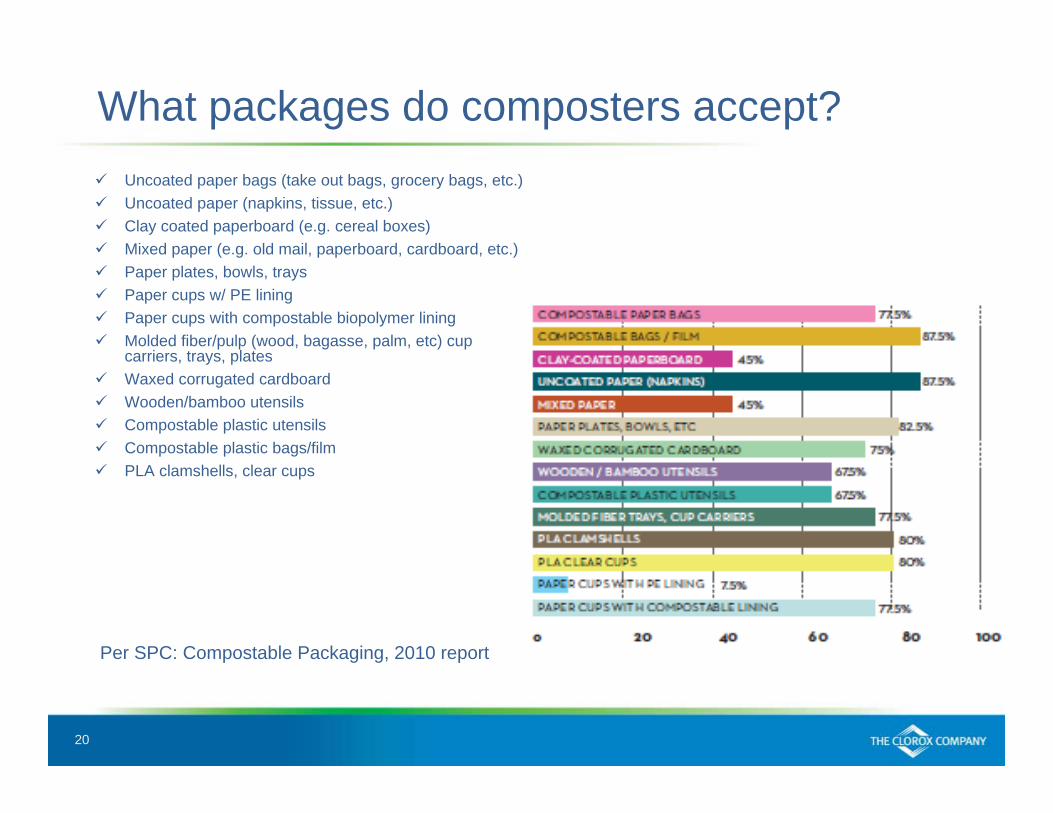
What packages do composters accept? Uncoated paper bags (take out bags, grocery bags, etc.) Uncoated paper (napkins, tissue, etc.) Clay coated paperboard (e.g. cereal boxes) Mixed paper (e.g. old mail, paperboard, cardboard, etc.) Paper plates, bowls, trays Paper cups w/ PE lining Paper cups with compostable biopolymer lining Molded fiber/pulp (wood, bagasse, palm, etc) cup
carriers, trays, plates Waxed corrugated cardboard Wooden/bamboo utensils Compostable plastic utensils Compostable plastic bags/film PLA clamshells, clear cups
Per SPC: Compostable Packaging, 2010 report
21
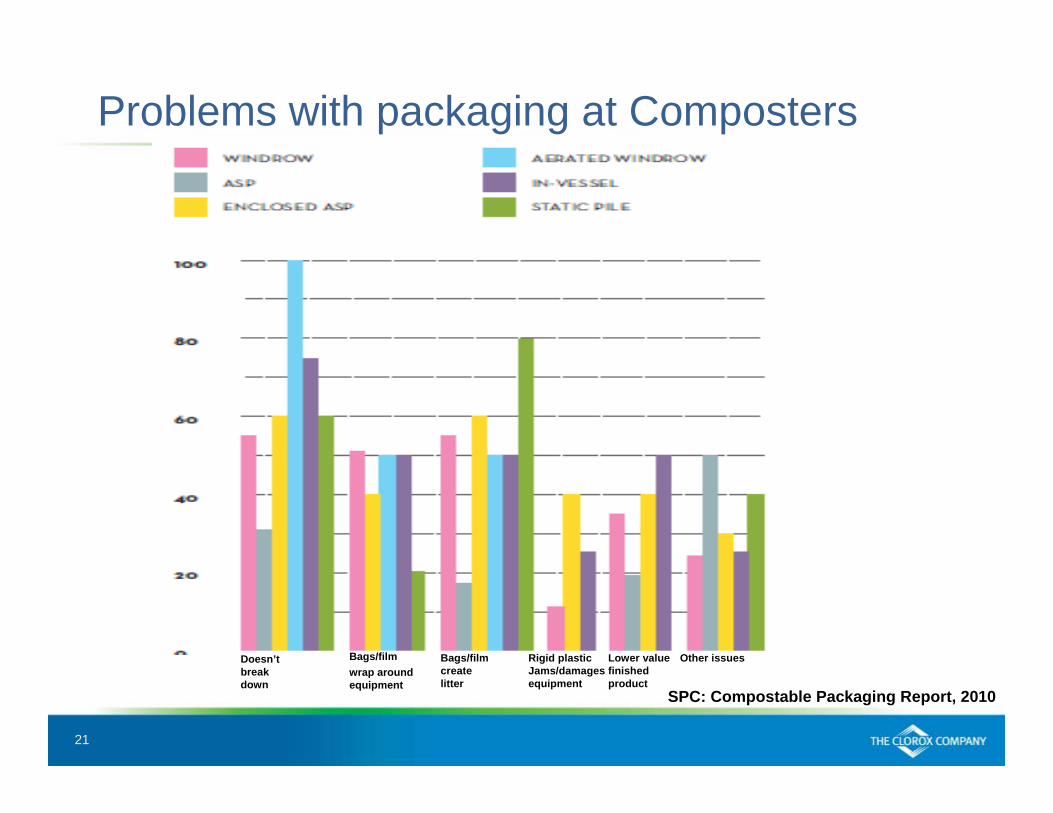
Problems with packaging at Composters
Doesn’t break down
Bags/filmwrap aroundequipment
Bags/filmcreate litter
Rigid plasticJams/damagesequipment
Lower valuefinishedproduct
Other issues
SPC: Compostable Packaging Report, 2010
22
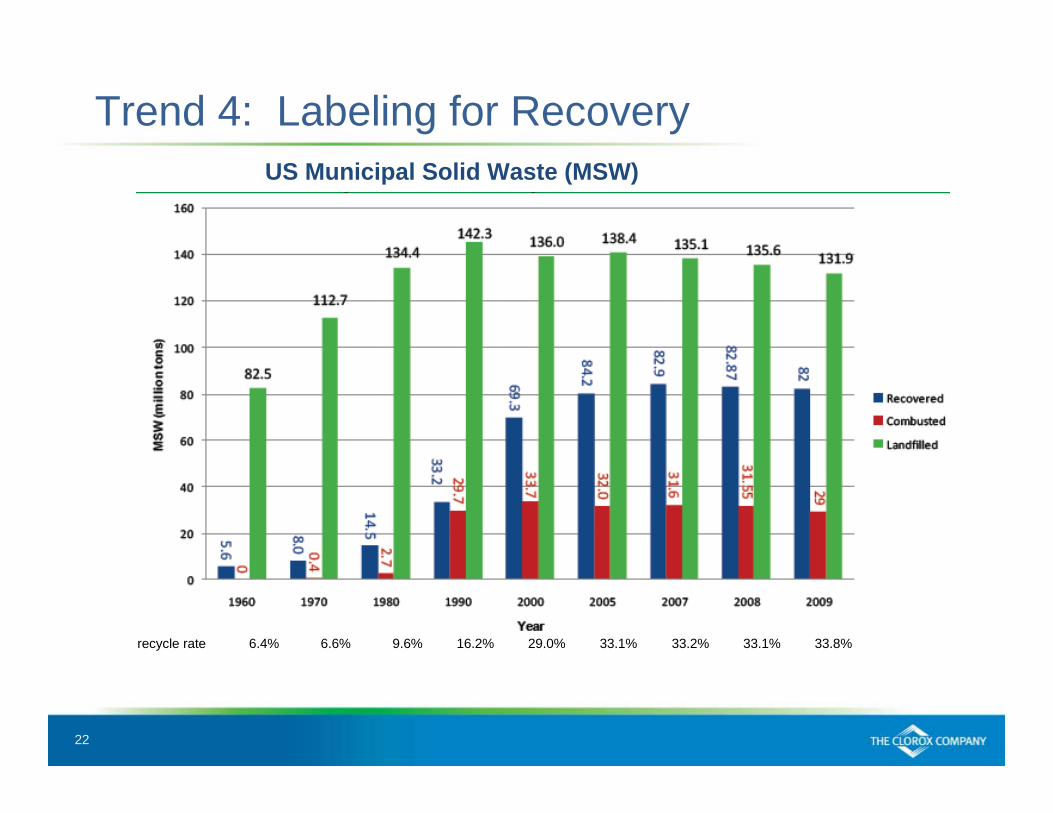
Trend 4: Labeling for RecoveryUS Municipal Solid Waste (MSW)
33.8%33.1%33.2%33.1%29.0%16.2%9.6%6.6%6.4%recycle rate
23
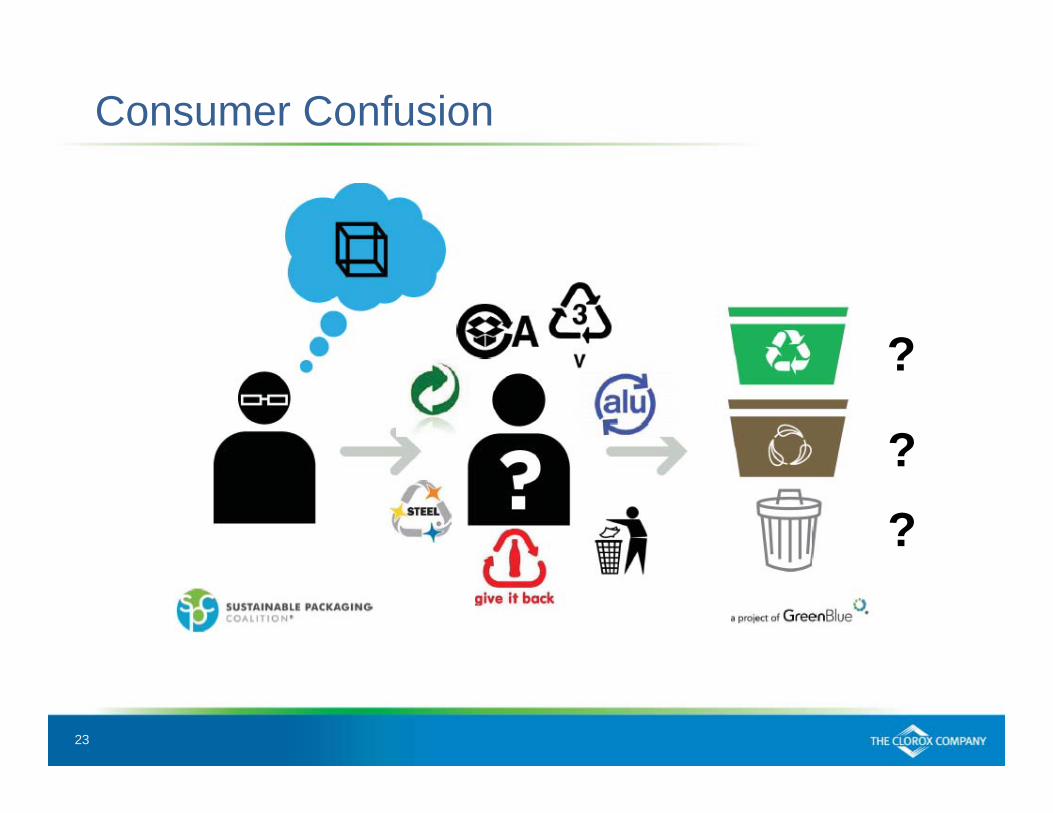
Consumer Confusion
?
??
24
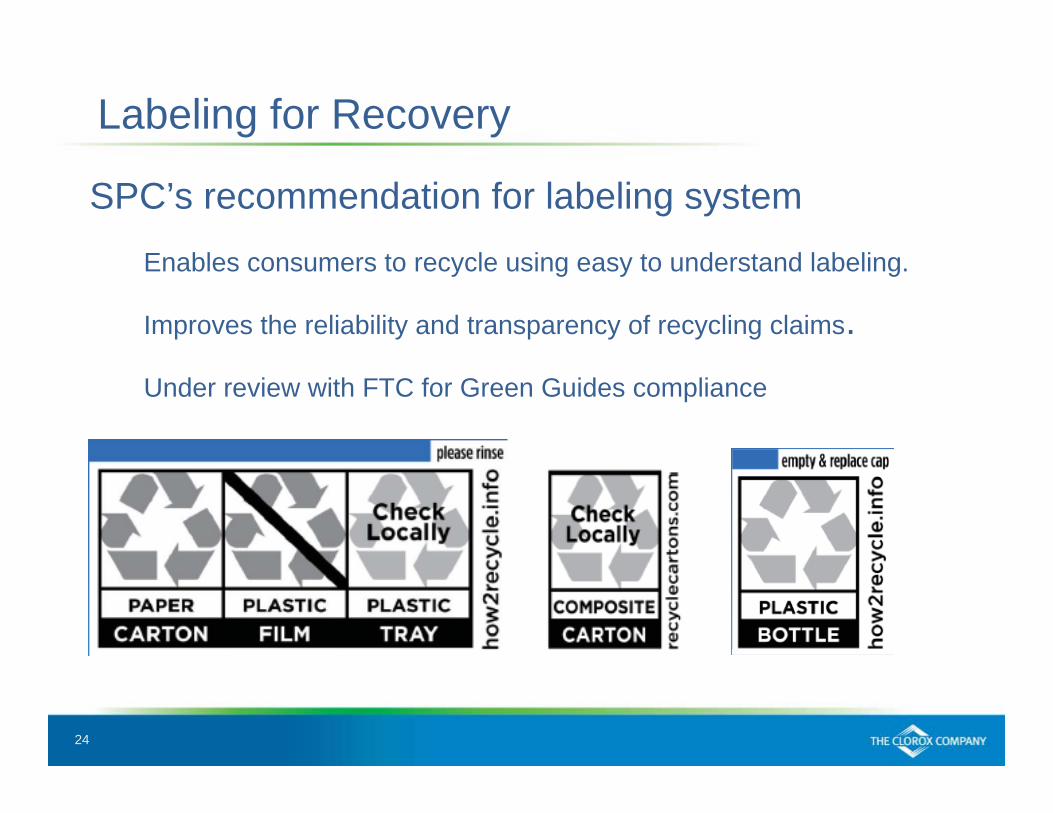
Labeling for Recovery
SPC’s recommendation for labeling system
Enables consumers to recycle using easy to understand labeling.
Improves the reliability and transparency of recycling claims.
Under review with FTC for Green Guides compliance
25
Trend 5: Tools to measure Sustainable Packaging
LCA (Life Cycle Assessment)
Compass
WalMart Packaging Scorecard
26
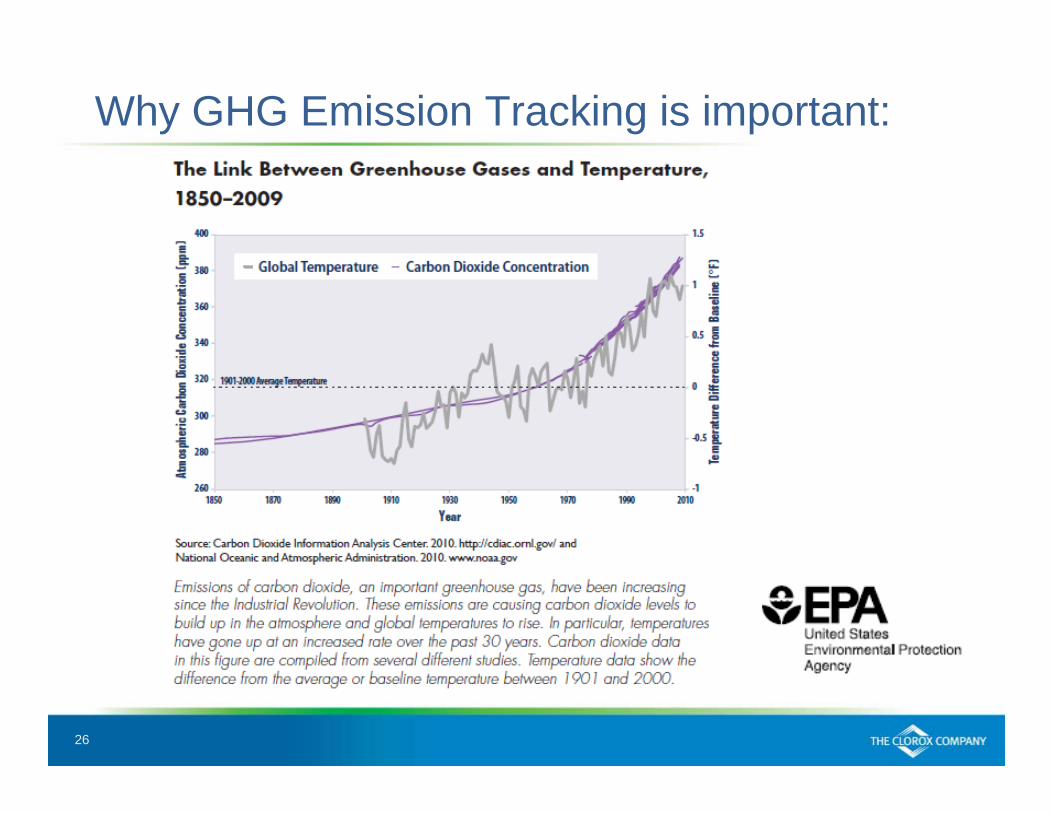
Why GHG Emission Tracking is important:
27
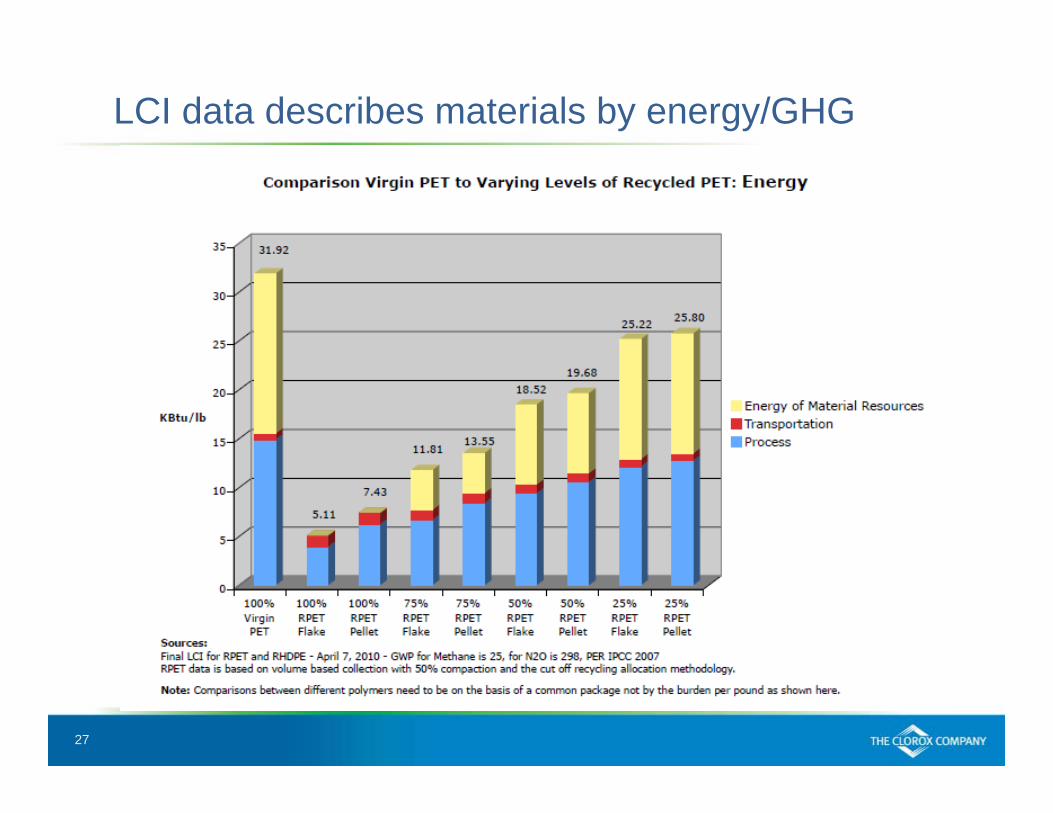
LCI data describes materials by energy/GHG
28
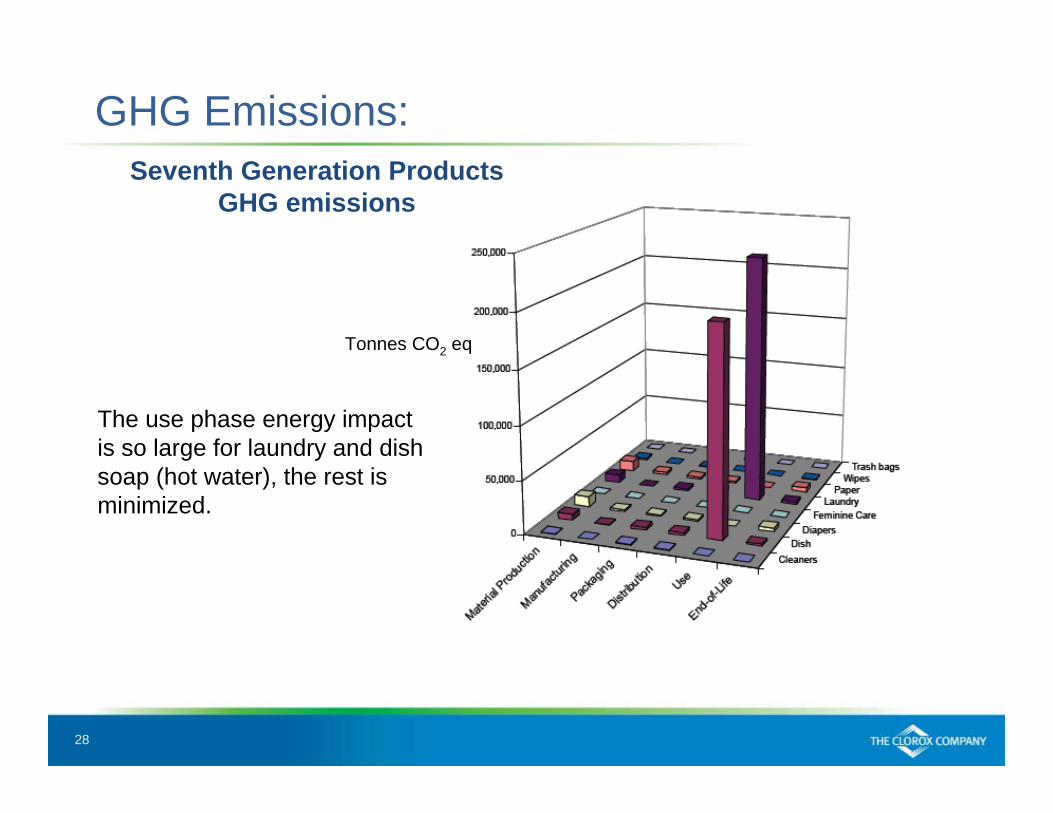
GHG Emissions:Seventh Generation Products
GHG emissions
Tonnes CO2 eq
The use phase energy impact is so large for laundry and dish soap (hot water), the rest is minimized.

29
GHG Emissions from Product Seventh Generation Products
GHG emissions
TonnesCO2 eq
Without the use phase shown, its clear that the largest impacts come from Material Production.
30
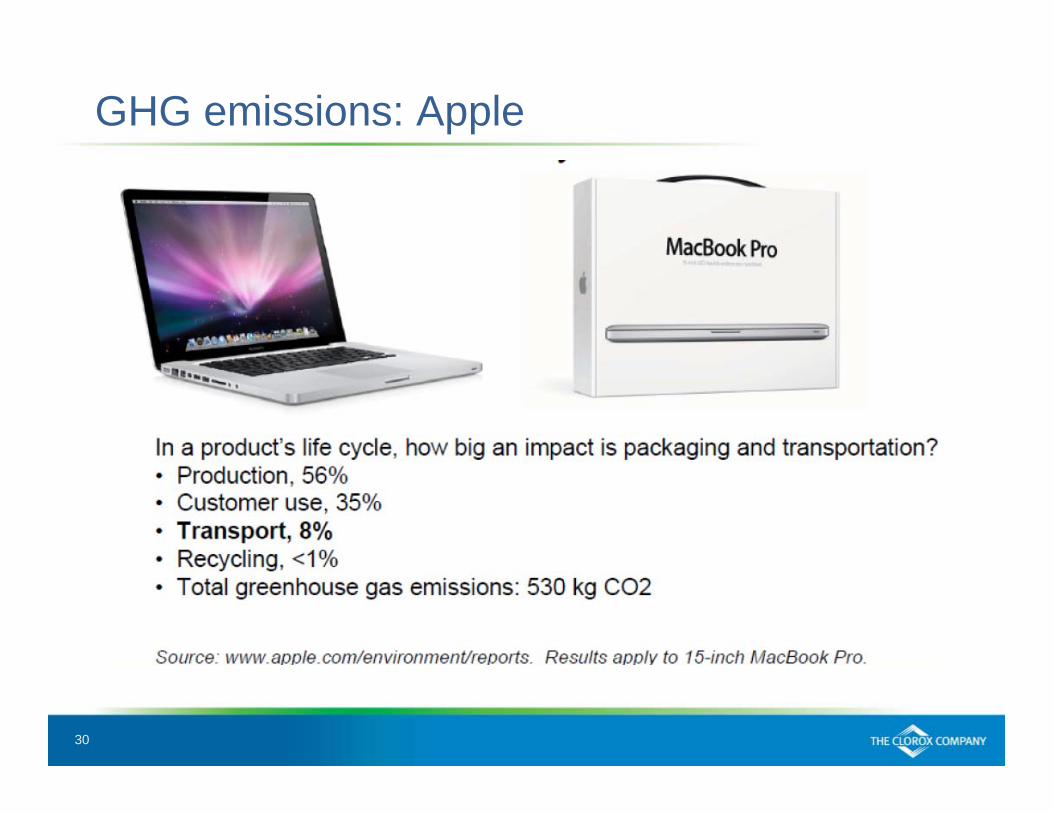
GHG emissions: Apple
31
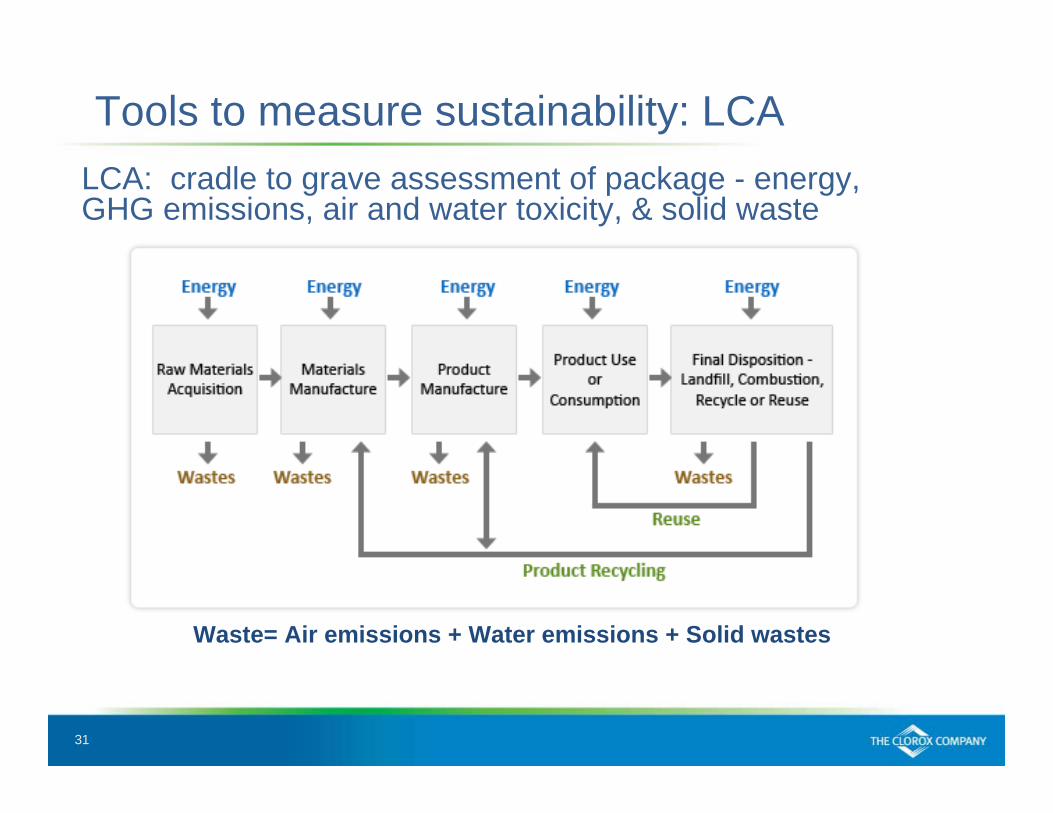
Tools to measure sustainability: LCALCA: cradle to grave assessment of package - energy, GHG emissions, air and water toxicity, & solid waste
Waste= Air emissions + Water emissions + Solid wastes
32
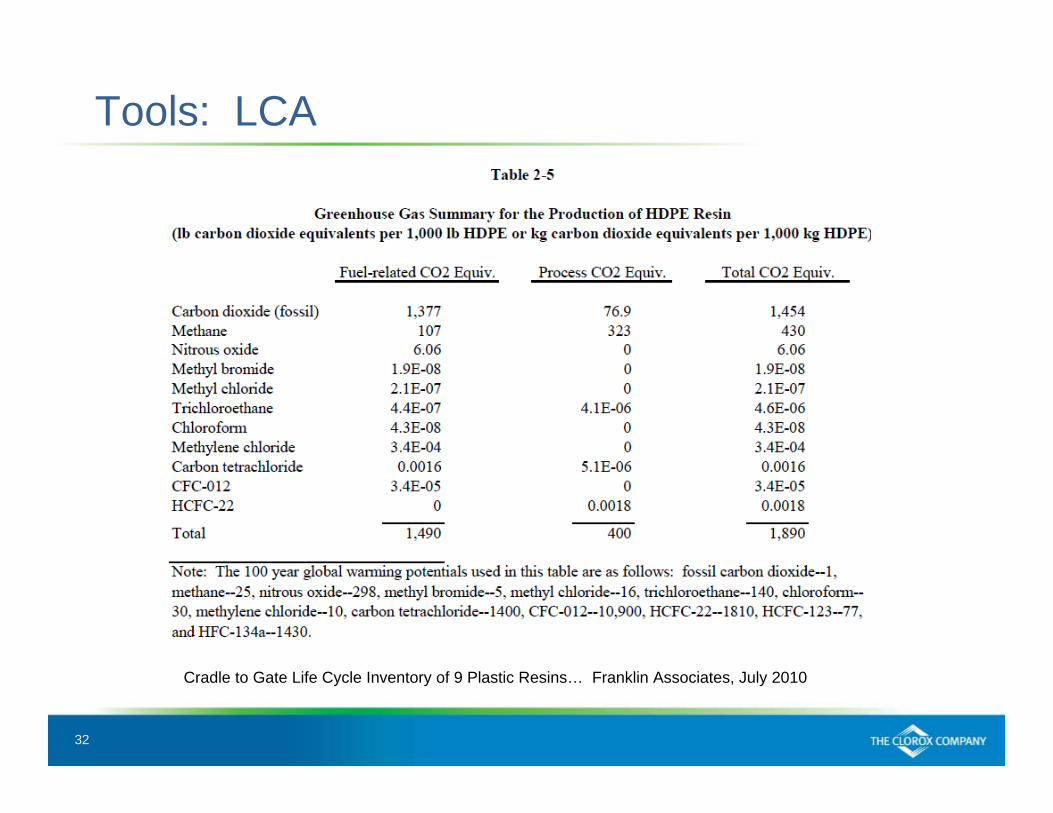
Tools: LCA
Cradle to Gate Life Cycle Inventory of 9 Plastic Resins… Franklin Associates, July 2010
33
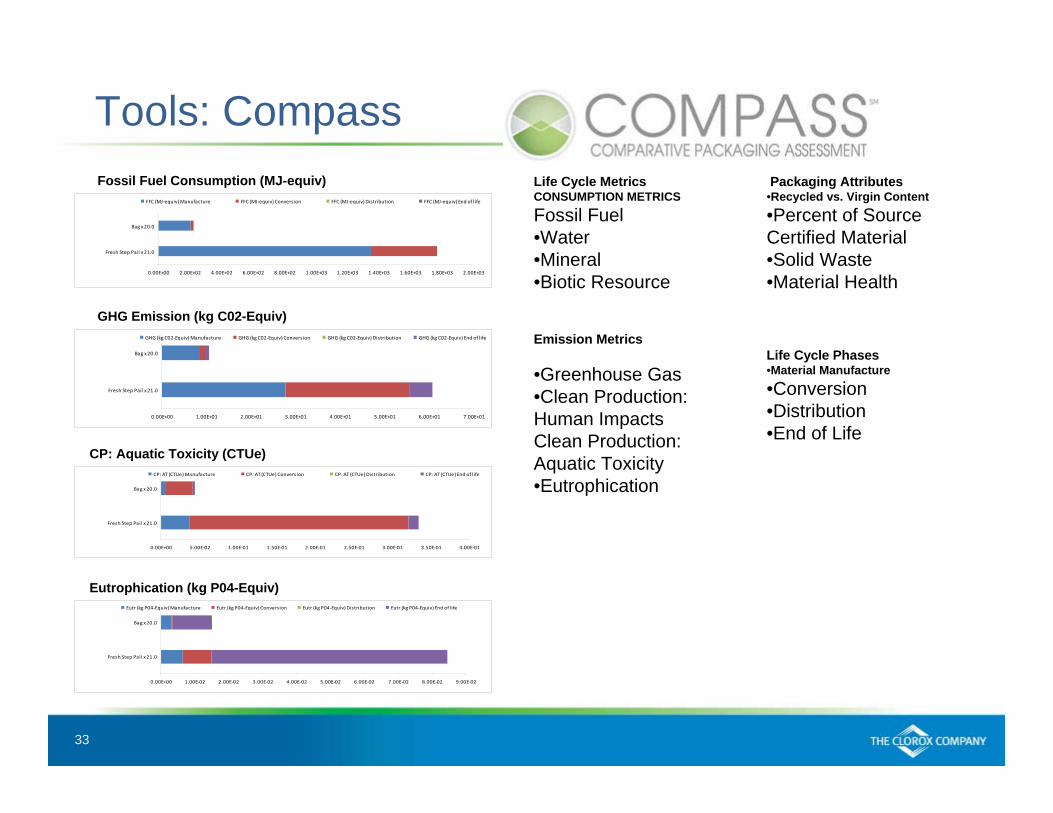
Tools: CompassPackaging Attributes
•Recycled vs. Virgin Content •Percent of Source Certified Material •Solid Waste•Material Health
Life Cycle Phases•Material Manufacture •Conversion •Distribution •End of Life
Life Cycle MetricsCONSUMPTION METRICSFossil Fuel •Water •Mineral •Biotic Resource
Emission Metrics
•Greenhouse Gas •Clean Production: Human ImpactsClean Production: Aquatic Toxicity •Eutrophication
0.00E+00 1.00E+01 2.00E+01 3.00E+01 4.00E+01 5.00E+01 6.00E+01 7.00E+01
Bag x 20.0
Fresh Step Pail x 21.0
GHG (kg C02‐Equiv) Manufacture GHG (kg C02‐Equiv) Conversion GHG (kg C02‐Equiv) Distribution GHG (kg C02‐Equiv) End of life
Fossil Fuel Consumption (MJ-equiv)
0.00E+00 2.00E+02 4.00E+02 6.00E+02 8.00E+02 1.00E+03 1.20E+03 1.40E+03 1.60E+03 1.80E+03 2.00E+03
Bag x 20.0
Fresh Step Pail x 21.0
FFC (MJ‐equiv) Manufacture FFC (MJ‐equiv) Conversion FFC (MJ‐equiv) Distribution FFC (MJ‐equiv) End of life
GHG Emission (kg C02-Equiv)
0.00E+00 5.00E‐02 1.00E‐01 1.50E‐01 2.00E‐01 2.50E‐01 3.00E‐01 3.50E‐01 4.00E‐01
Bag x 20.0
Fresh Step Pail x 21.0
CP: AT (CTUe) Manufacture CP: AT (CTUe) Conversion CP: AT (CTUe) Distribution CP: AT (CTUe) End of life
CP: Aquatic Toxicity (CTUe)
Eutrophication (kg P04-Equiv)
0.00E+00 1.00E‐02 2.00E‐02 3.00E‐02 4.00E‐02 5.00E‐02 6.00E‐02 7.00E‐02 8.00E‐02 9.00E‐02
Bag x 20.0
Fresh Step Pail x 21.0
Eutr (kg P04‐Equiv) Manufacture Eutr (kg P04‐Equiv) Conversion Eutr (kg P04‐Equiv) Distribution Eutr (kg P04‐Equiv) End of life
34
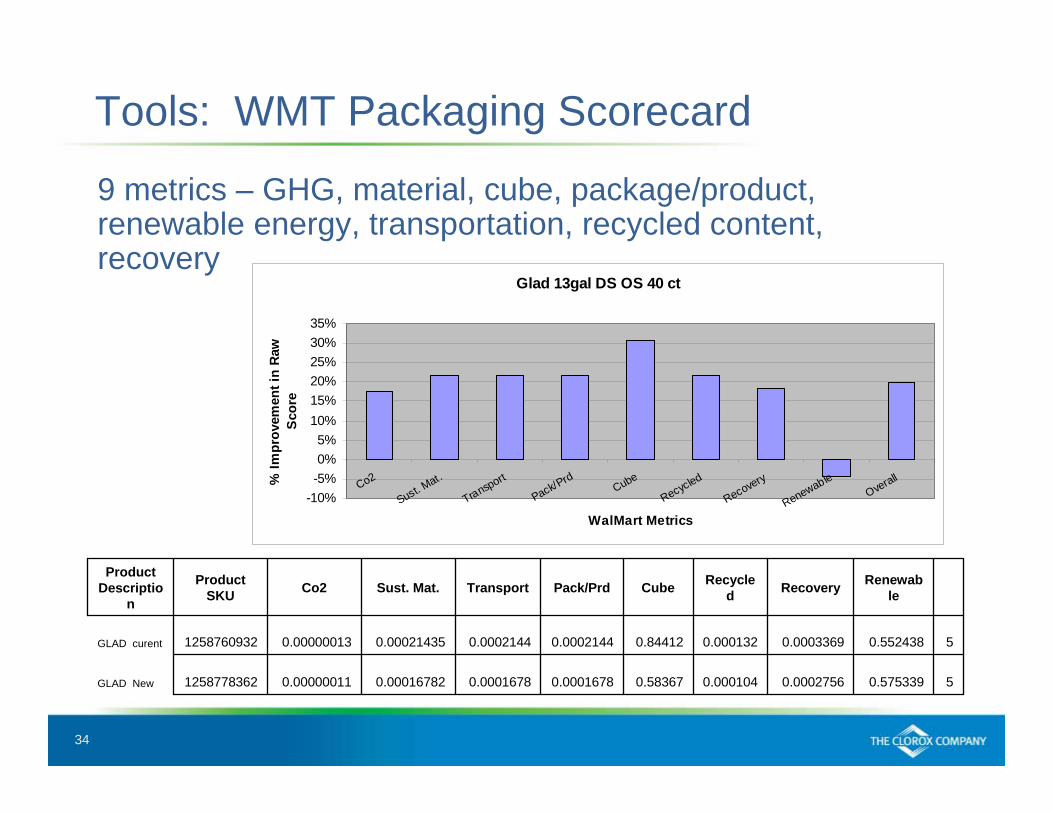
Tools: WMT Packaging Scorecard
9 metrics – GHG, material, cube, package/product, renewable energy, transportation, recycled content, recovery
50.5753390.00027560.0001040.583670.00016780.00016780.000167820.000000111258778362GLAD New
50.5524380.00033690.0001320.844120.00021440.00021440.000214350.000000131258760932GLAD curent
RenewableRecoveryRecycle
dCubePack/PrdTransportSust. Mat.Co2Product SKU
Product Descriptio
n
Glad 13gal DS OS 40 ct
-10%-5%0%5%
10%15%20%25%30%35%
Co2
Sust. Mat.
Transport
Pack/Prd
Cube
Recycled
Recovery
RenewableOverall
WalMart Metrics
% Im
prov
emen
t in
Raw
S
core
35
Sustainable Packaging Coalition: http://www.sustainablepackaging.orgFTC Green Guides: http://www.ftc.gov/bcp/edu/microsites/energy/about_guides.shtmlProduct Stewardship Institute: http://productstewardship.us/index.cfmUS EPA: http://www.epa.gov/climatechange/index.htmlACC: http://www.americanchemistry.comAmeripen: http://ameripen.org/Europen: http://www.europen.be/Forest Stewardship Council: http://www.fsc.org/Sustainable Forestry Initiative: http://www.sfiprogram.org/NOAA: www.esrl.noaa.gov/research/themes/carbon/Ca State Food & Agriculture www.cdfa.ca.gov/.../Climate_Change.htmlGreener Package http://www.greenerpackage.com/
Questions?
Resources


