18
SUSTAINABLE REVERSE LOGISTICS Reducing Waste and Emissions in the Retail Supply Chain WHITE PAPER 02.24.2016

SUSTAINABLE REVERSELOGISTICSReducing Waste and Emissions
in the Retail Supply Chain
WHITE PAPER 02.24.2016

2S U S T A I N A B L E R E V E R S E L O G I S T I C S©2016 Optoro, Inc.
ABSTRACT
The retail industry faces a large and growing challenge in managing the 3.5 billion products
consumers return every year, resulting in financial losses as well as environmental impacts, including
4 billion pounds of waste and 11 million metric tons of carbon emissions. 1
Return rates at brick-and-mortar stores are nearly 9%, and the overall trend
continues to grow, especially as return rates for e-commerce are even higher, between 10-20% of
all sales. While painful for retailers, returns have been absorbed as a cost of doing business, and until
recently the environmental impacts have been “out of sight, out of mind.” Savvy retailers now have the
opportunity to improve their recovery and reduce environmental impacts through smart use of data
and analytics to efficiently find interested buyers for returned and excess inventory.
Optoro has an environmental impact model to quantify the environmental benefits retailers can achieve using sophisticated reverse logistics management systems.
The model, built in partnership with a third-party consultant, Environmental Capital Group,
and independently verified by specialists at the U.S. EPA and logistics provider C.H. Robinson,
demonstrates waste reductions of up to 60% and savings in fuel-related carbon emissions of up to 31%.
This white paper describes Optoro’s working model, including a case study with Groupon Goods, and
explains how retailers of any size can assess the environmental impacts of their own reverse supply
chains using this framework.
1 Analysis of annual US environmental impacts by Environmental Capital Group and Optoro
3S U S T A I N A B L E R E V E R S E L O G I S T I C S©2016 Optoro, Inc.
BACKGROUND ON
ENVIRONMENTAL
IMPACTS OF REVERSE
LOGISTICS
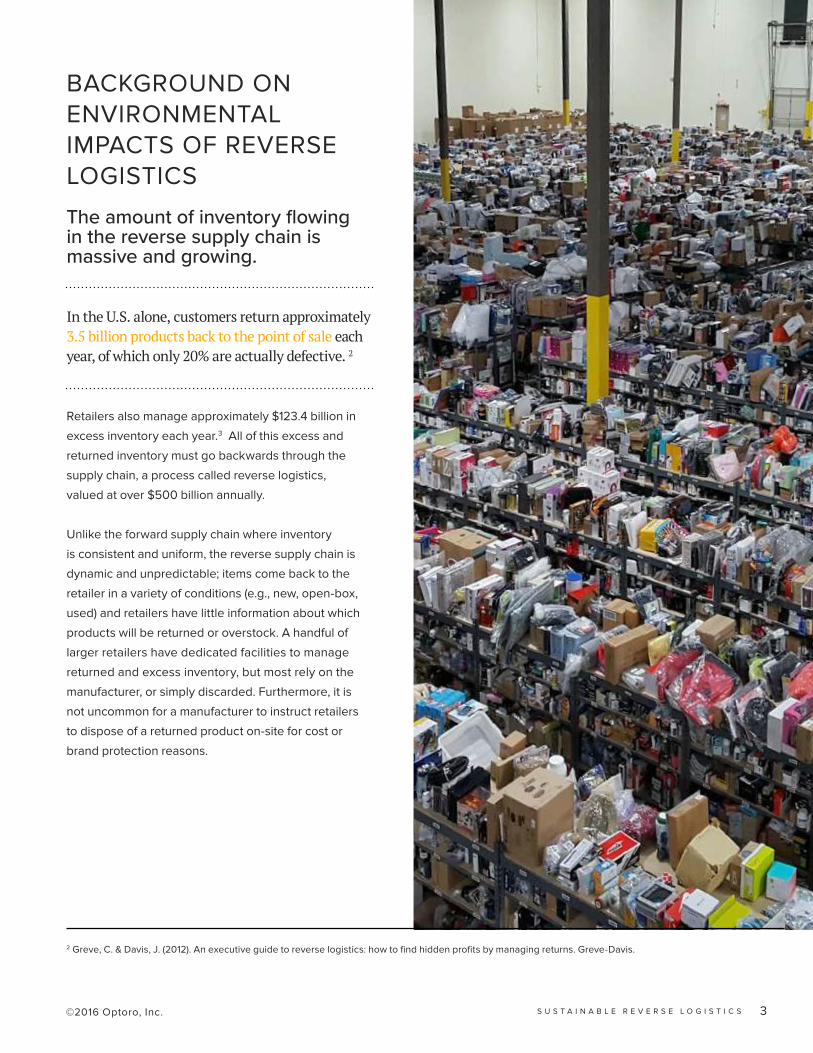
The amount of inventory flowing in the reverse supply chain is massive and growing.
In the U.S. alone, customers return approximately
3.5 billion products back to the point of sale each
year, of which only 20% are actually defective. 2
Retailers also manage approximately $123.4 billion in
excess inventory each year.3 All of this excess and
returned inventory must go backwards through the
supply chain, a process called reverse logistics,
valued at over $500 billion annually.
Unlike the forward supply chain where inventory
is consistent and uniform, the reverse supply chain is
dynamic and unpredictable; items come back to the
retailer in a variety of conditions (e.g., new, open-box,
used) and retailers have little information about which
products will be returned or overstock. A handful of
larger retailers have dedicated facilities to manage
returned and excess inventory, but most rely on the
manufacturer, or simply discarded. Furthermore, it is
not uncommon for a manufacturer to instruct retailers
to dispose of a returned product on-site for cost or
brand protection reasons.
2 Greve, C. & Davis, J. (2012). An executive guide to reverse logistics: how to find hidden profits by managing returns. Greve-Davis.
4S U S T A I N A B L E R E V E R S E L O G I S T I C S©2016 Optoro, Inc.
3 “Retailers and the Ghost Economy: $1.75 Trillion Reasons to Be Afraid.” Dynamic Action. IHL Group, 2015. 4 Greve & Davis, 2012.5 “Fast Facts: U.S. Transportation Sector Greenhouse Gas Emissions, 1990-2011.” Office of Transportation and Air Quality.
Environmental Protection Agency, Sept. 2013.
The best way to maximize the value of goods in the
reverse supply chain is to route each product to its
optimal channel based on its condition, value, and costs.
Oftentimes, that best disposition is reselling individual
units to a secondary market consumer through an
online marketplace. On average, this direct-to-consumer
sale of returned and excess inventory provides higher
financial return than wholesale liquidation, which involves
selling items in bulk at heavily discount prices. Other
dispositions, such as donation and recycling can also add
value and reduce waste.
Despite the volume and potential value of products in the
reverse supply chain, most retailers lack the core capacity to
test and remarket excess and returned inventory and take
advantage of multichannel dispositions that are available.
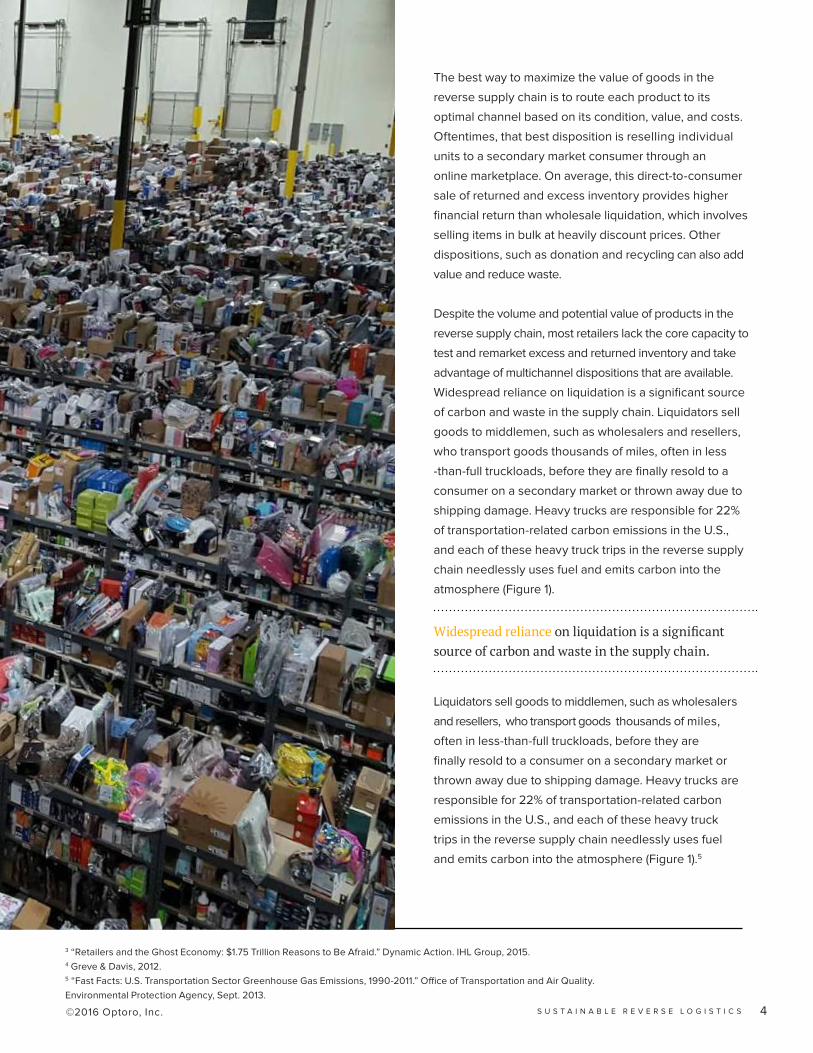
Widespread reliance on liquidation is a significant source
of carbon and waste in the supply chain. Liquidators sell
goods to middlemen, such as wholesalers and resellers,
who transport goods thousands of miles, often in less
-than-full truckloads, before they are finally resold to a
consumer on a secondary market or thrown away due to
shipping damage. Heavy trucks are responsible for 22%
of transportation-related carbon emissions in the U.S.,
and each of these heavy truck trips in the reverse supply
chain needlessly uses fuel and emits carbon into the
atmosphere (Figure 1).
Widespread reliance on liquidation is a significant source of carbon and waste in the supply chain.
Liquidators sell goods to middlemen, such as wholesalers
and resellers, who transport goods thousands of miles,
often in less-than-full truckloads, before they are
finally resold to a consumer on a secondary market or
thrown away due to shipping damage. Heavy trucks are
responsible for 22% of transportation-related carbon
emissions in the U.S., and each of these heavy truck
trips in the reverse supply chain needlessly uses fuel
and emits carbon into the atmosphere (Figure 1).5

5S U S T A I N A B L E R E V E R S E L O G I S T I C S©2016 Optoro, Inc.
FIGURE 01 .
Traditional Reverse Logistics:
Multiple touches create a significant
amount of waste and emissions
Each item ships 3-5 times,
causing significant pollution
& CO2 emissions
• Inefficient process with multiple middlemen
• Low recovery: 10 − 30% of COGS
• Poor data & lack of transparency
• 4 billion lbs. of waste
• 1.2 billion gallons of diesel fuel
• 12 million metric tons of CO2 from transportation
Business Impact Environmental Impact
Products end up in
landfills at every touchpoint

6S U S T A I N A B L E R E V E R S E L O G I S T I C S©2016 Optoro, Inc.
USING TECHNOLOGY TO INCREASE
EFFICIENCY & DECREASE IMPACT
F I G U R E 02 .
Technology solutions give retailers the ability to sell
direct to consumer in addition to selling B2B, returning
to vendor, donating and recycling.
Retailers that use technology tools to sell inventory directly to consumers from a centralized returns facility reduce and
eliminate middlemen, resulting in higher financial recovery and a reduction in transportation and waste (Figure 2).
INVENTORYExcess & Returned
DATA-DRIVENSmart Disposition
Retailers can
connect inventory
directly to optimal
disposion
As an alternative to the traditional process, retailers can opt
to use an advanced returns management system (RMS) that
provides the tools and analytics needed to sell returned
and excess inventory directly to consumers.
This software is installed on-site at one or several
centralized facilities (e.g. return center, distribution center,
or 3PL). Once a returned or excess product arrives at
the centralized facility from a retail storefront or online
Business Impact Environmental Impact
• Eliminate middlemen & reduce touches
• Higher recovery: 50 − 80% of COGS
• Dramatically better data & visibility
• Reduce waste by up to 73%
• Cut fuel costs by $850M
• Lower CO2 emissions by 2+ million metric tons
customer, it is scanned into the software system. First, the
software categorizes goods by their condition, ranging from
“New Sealed” (for overstock products or products that were
returned without being opened) to “Used in Good Condition”
(for products that were opened, used and returned). Next,
data and real-time secondary market information is used
to instantly match and market each product to its optimal
disposition- be that direct to consumer, business to business,
recycling, return to vendor, or donation (Figure 2).

©2016 Optoro, Inc. 7S U S T A I N A B L E R E V E R S E L O G I S T I C S
MEASURING ENVIRONMENTAL BENEFITS
To demonstrate the environmental benefits that retailers can
achieve using smarter returns management, Optoro developed
an environmental model that quantifies the fuel savings and
waste reduction for any retailer’s reverse logistics network.6
The goal of the model is to compare the environmental
impact of the traditional reverse logistics process
(Baseline Scenario) to an intelligent reverse logistics
process (Results Scenario). The environmental model
compares results using standard methods for supply
chain analysis and carbon emissions, based on the best
data and assumptions available. The methodology used
was developed by Optoro with a third-party consultant,
Environmental Capital Group, and was independently
verified by specialists at the U.S. EPA and logistics provider
C.H. Robinson. Retailers of any size can use this model as a
framework to measure carbon and waste savings achieved
through advanced inventory management systems.
Using this model, it is now possible to evaluate the impact
of reverse logistics programs and track progress toward
increased efficiency. The model demonstrates that advanced
returns management systems can lead to a 60% reduction in
physical waste and a 27% reduction in carbon emissions. The
following sections provide an overview of the methodology used
in the model and a case study from one of Optoro’s partners.

8S U S T A I N A B L E R E V E R S E L O G I S T I C S©2016 Optoro, Inc.
The model calculates waste and emissions for each of the
pathways that a returned or excess consumer product may
take, and then sums the impact of each pathway in the results
and baseline scenarios. To calculate impact, flowcharts are
6 This model estimates carbon emissions from transportation only. Additional emissions are created at warehouses and storefronts used to store this
inventory, but these sources are outside the scope of this research.
INVENTORY PATHWAYS
F I G U R E 0 3 .
Baseline flow of goods for
a hypothetical retailer: Products travel between a series of nodes
(dotted blue boxes) before reaching a
secondary consumer, disposal or recycling.
Percentages denote volume travelling to
each given disposition.
created to map out the likely pathways that a retailer’s inventory
takes after it is returned or removed from inventory. Figure 3
shows the flow of returned inventory for a hypothetical retailer
using traditional returns management processes.

9S U S T A I N A B L E R E V E R S E L O G I S T I C S©2016 Optoro, Inc.
Each item has a known routing of locations (nodes),
represented by dotted blue boxes, and transportation
modes (links) represented by black arrows. In the baseline
scenario, 78% of the inventory is sold to a liquidator.
Analyzing the flow of goods before and after the use of a returns management system allows retailers to measure improvements in carbon emissions, waste, and overall efficiencies in the reverse supply chain.
F I G U R E 0 4 .
Results flow of goods for
a hypothetical retailer: Technology allows the retailer to
add a disposition that sells inventory
direct-to-consumer (green arrow) and
eliminates the need for liquidation.
From the liquidator, goods are exchanged between a
number of nodes before reaching a final end point.
Appendix A has a list of all nodes and links used in
the model.

10S U S T A I N A B L E R E V E R S E L O G I S T I C S©2016 Optoro, Inc.
CARBON EMISSIONS
Transportation of consumer goods in the retail supply
chain requires a vehicle to travel from one location
to another. Fuel consumed by each vehicle produces
emissions of carbon dioxide (as well as other pollutants).
Each link in the flow diagram corresponds to a certain distance
and a specific vehicle type with known characteristics of fuel
economy and cargo loading. Each item, with a known size
and weight, occupies a particular share of a cargo load, and
is therefore allocated a share of fuel use and emissions in
proportion to its share of each load. A list of transportation
links used in the model is located in Appendix B.
In the hypothetical figures above, carbon emissions are
quantified for all items starting at the return center and
ending with either a secondary consumer, disposal or
recycling. 7 Figure 5 provides an example calculation for
how the model measures carbon per item in the reverse
supply chain. Step-by-step carbon calculations used in
the model are listed in Appendix C.
The model measures fuel use for each pathway and then
aggregates fuel use for all pathways to estimate total impact
for a given scenario. In the hypothetical flowcharts, 60% of
the units bought by the secondary consumer are made in
a physical storefront. In-store purchases are a major cause
of fuel-related emissions, since consumers buy as little as
a single item, whereas truckload shipping efficiently shares
F I G U R E 0 5 .
Calculating fuel
use for one link
in the baseline
scenario WholesalerLiquidator
INPUTS
Link = Liquidator to Wholesaler
Number of units = 65,819
Average unit weight = 4.7 lbs.
Distance = 564 miles
CALCULATIONS
Fuel Consumption per Truckload = 564 miles / 6 mpg = 94 gallons diesel
Carbon Emissions per Truckload = 94 gallons x 10.13 kg CO2
/ gallon = 952.2 kg CO2
Average Unit Load Share (%) = 4.7 lbs. / 309,349 lbs. = 0.0015%
Impact per Unit = (952.2 kg CO2 x 0.0015%) = 0.0145 kg CO
2
Mode = 53’ truck
Loading = 10,824 lbs.
Fuel efficiency = 6 mpg
the load with thousands of items. The model assumes
typical consumer purchasing behavior based on existing
studies. Sensitivity analysis was performed to evaluate
results with differing assumptions on the breakdown
of end consumers purchasing in store versus online.
Results of the sensitivity analysis indicate substantial
reductions in emissions even with modified assumptions.

11S U S T A I N A B L E R E V E R S E L O G I S T I C S©2016 Optoro, Inc.
7 The emissions from the links between the primary consumer and retailer, and the retailer and the returns center would not be included since they are the same
in both the results and baseline scenarios. Impact calculations begin at the Returns Center as that is the node that represents a point of convergence.
WASTE
Waste occurs at nearly every node in the reverse supply
chain; items are damaged in shipment, and buyers and
sellers dispose of inventory that is expired or unsaleable.
Data on the actual amount of inventory that is thrown away
in the reverse supply chain is very limited; salvage dealers
and retailers do not disclose this information. The estimates
used in the impact model are based on interviews with
supply chain and wholesale experts, discussions with major
retailers, and responses from a survey of bulk buyers aimed
at collecting information on waste in the supply chain. The
estimates take into consideration the average price point
of the unit, the type of good (e.g., electronics, hardlines,
softlines), and the buyers and sellers involved at each
given node. If additional data on the amount of inventory
discarded in secondary markets become available, it will
be incorporated into the model.

12S U S T A I N A B L E R E V E R S E L O G I S T I C S©2016 Optoro, Inc.
In 2014, Optoro and GrouponGoods partnered to manage
returned and excess inventory.
Prior to implementing reverse logistics software in its own
warehouse, Groupon sent all returned and excess inventory
to liquidators. Groupon now manages a large portion
of its reverse logistics in-house using Optoro's returns
management system (RMS). Optoro applied Groupon’s data
to the environmental impact model to evaluate changes in
waste, fuel consumption, and related carbon emissions.
C A S E S T U DY
190,161
71,150
36,717
20,104
226,878
91,254
0
50,000
100,000
150,000
200,000
250,000
No Optoro (lbs.) Optoro (lbs.)
Waste Generated by Returned & Excess Inventory (lbs.)
Returns Excess
FINDING A:
WASTE DECREASED BY 60%
F I G U R E 0 6 .
Total waste produced in
reverse supply chain before
and after Optoro’s software
Decreasing the reliance on liquidators
reduced the number of shipments, which
in turn reduced the likelihood of shipping
damage and the likelihood that products
expired or became obsolete. During a six
month period, this reduced waste in the
reverse supply chain by 68 tons.
The ‘results’ scenario uses actual shipment data from
six months of activity in 2015, including item weights
and destinations using Optoro’s platform. The ‘baseline’
scenario assumes the identical set of merchandise, using
the flow of goods determined based on information from
the retailer.
The analysis demonstrated a significant reduction in
waste and fuel use in the reverse supply chain.
Here are three findings from the analysis:

13S U S T A I N A B L E R E V E R S E L O G I S T I C S©2016 Optoro, Inc.
In the baseline scenario, 21% of inventory was disposed
of or recycled. Using software, 91% of the returned and
excess inventory was resold to secondary consumers.
Putting products in the hands of consumers means a
longer product lifespan and less landfill waste.
Transportation efficiencies reduced fuel use by 30% and
carbon emissions by 27%. By selling more goods directly
to consumers, Optoro cut out the extra touches involved
when reselling to wholesalers or resellers. With Optoro,
fuel used in the reverse supply chain decreased by
18,161 gallons, the equivalent to 357,844 miles driven by
passenger vehicles.
F I G U R E 0 8 .
The number of products that ended with
a secondary consumer before and after
using Optoro’s software
F I G U R E 07.
Carbon dioxide emissions measured
before and after using Optoro’s software.
FINDING C:
OVER 15% MORE GOODS
WERE SOLD TO CONSUMERS
FINDING B:
EMISSIONS DECREASED
BY 27%
361,750276,231
186,026
121,363
547,776
397,594
0
100,000
200,000
300,000
400,000
500,000
600,000
No Optoro (kg CO2) Optoro (kg CO2)
Emissions Generated by Returned and Excess Inventory (kg CO2)
Returns Excess
108,128130,535
73,427
79,062
181,556
209,597
0
50,000
100,000
150,000
200,000
250,000
No Optoro (units) Optoro (units)
Number of Products Bought by Secondary Consumers
Returns Excess
C A S E S T U DY

14S U S T A I N A B L E R E V E R S E L O G I S T I C S©2016 Optoro, Inc.
CONCLUSION
The status quo for managing returned and excess inventory in the retail
space is a source of significant waste and inefficiency in the supply chain.
The traditional returns process creates over 4 billion pounds of waste each year in the US alone; given
the increasing volume of returned and excess goods, that number is sure to grow steadily in years to
come. With new technology now available, retailers have a huge opportunity to update processes
and systems for managing reverse logistics and to reduce these environmental impacts. Optoro has
demonstrated its ability to reduce waste in the reverse supply chain by up to 60% as outlined in the
case study above. The analytical modeling tools are flexible enough to measure carbon and waste
savings for retailers of any size.
Sustainability professionals working in the retail and manufacturing space are encouraged to engage
with warehouse and reverse logistics professionals to begin examining downstream impact of returned
and excess inventory. Greater financial recovery, less waste, and lower emissions are all potential benefits
of better technology and efficient processes. A holistic system to manage this inventory is a critical part
of supply chain sustainability.

15S U S T A I N A B L E R E V E R S E L O G I S T I C S©2016 Optoro, Inc.
Optoro, Inc. is a technology company that is transforming the way retailers process, manage, and sell
their returned and excess inventory. Through comprehensive, world-class data analytics, Optoro's
software platform determines the best path for returned and excess goods, maximizing recovery value,
enabling consumers to get great deals, and reducing environmental waste. Optoro, BLINQ™, and BULQ
are trademarks of Optoro, Inc. and may be registered in certain jurisdictions. Founded in 2010, Optoro
is based in Washington, D.C. and Maryland.
For more information, please visit:
www.optoro.com
and follow us on Twitter at
@optoroinc.
ABOUT OPTORO
Readers are encouraged to contact Optoro
to learn more:
ANN CALAMAI D I R E C TO R O F S U S TA I N A B I L I T Y
APPENDIX
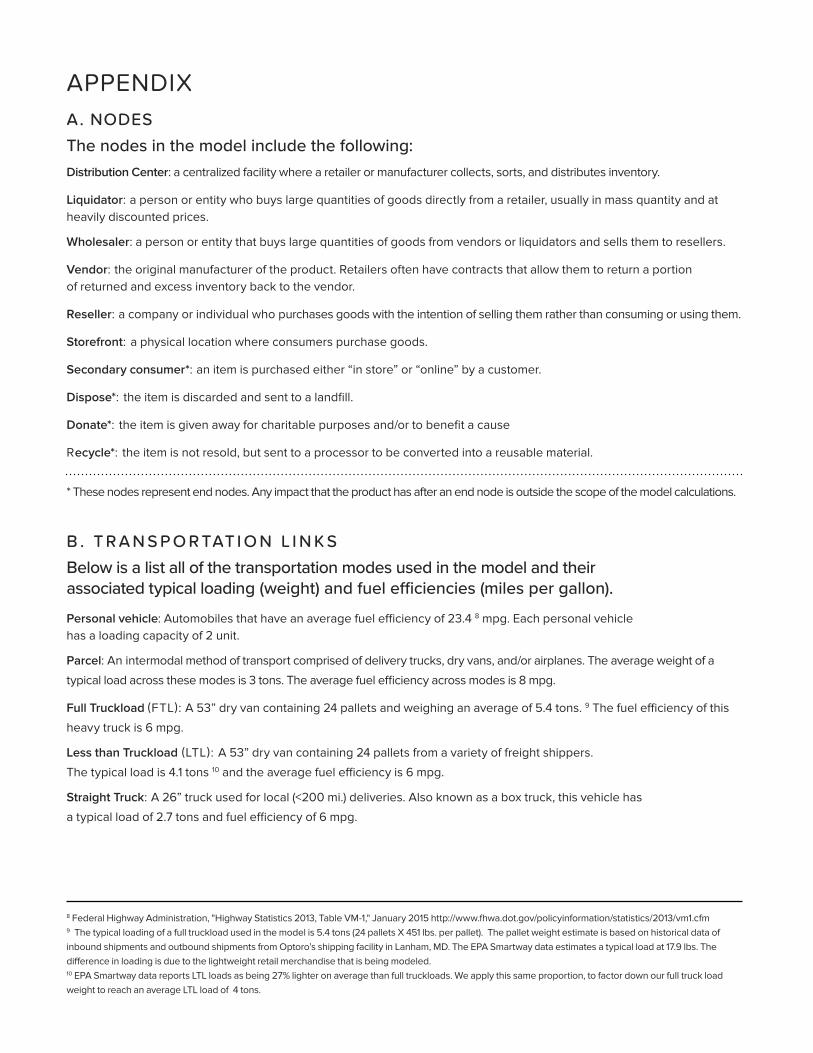
A. NODES
The nodes in the model include the following:
Distribution Center: a centralized facility where a retailer or manufacturer collects, sorts, and distributes inventory.
Liquidator: a person or entity who buys large quantities of goods directly from a retailer, usually in mass quantity and at
heavily discounted prices.
Wholesaler: a person or entity that buys large quantities of goods from vendors or liquidators and sells them to resellers.
Vendor: the original manufacturer of the product. Retailers often have contracts that allow them to return a portion
of returned and excess inventory back to the vendor.
Reseller: a company or individual who purchases goods with the intention of selling them rather than consuming or using them.
Storefront: a physical location where consumers purchase goods.
Secondary consumer*: an item is purchased either “in store” or “online” by a customer.
Dispose*: the item is discarded and sent to a landfill.
Donate*: the item is given away for charitable purposes and/or to benefit a cause
Recycle*: the item is not resold, but sent to a processor to be converted into a reusable material.
* These nodes represent end nodes. Any impact that the product has after an end node is outside the scope of the model calculations.
B . T R A N S P O R TAT I O N L I N KS
Below is a list all of the transportation modes used in the model and their
associated typical loading (weight) and fuel efficiencies (miles per gallon).
Personal vehicle: Automobiles that have an average fuel efficiency of 23.4 8 mpg. Each personal vehicle
has a loading capacity of 2 unit.
Parcel: An intermodal method of transport comprised of delivery trucks, dry vans, and/or airplanes. The average weight of a
typical load across these modes is 3 tons. The average fuel efficiency across modes is 8 mpg.
Full Truckload (FTL): A 53” dry van containing 24 pallets and weighing an average of 5.4 tons. 9 The fuel efficiency of this
heavy truck is 6 mpg.
Less than Truckload (LTL): A 53” dry van containing 24 pallets from a variety of freight shippers.
The typical load is 4.1 tons 10 and the average fuel efficiency is 6 mpg.
Straight Truck: A 26” truck used for local (<200 mi.) deliveries. Also known as a box truck, this vehicle has
a typical load of 2.7 tons and fuel efficiency of 6 mpg.
8 Federal Highway Administration, "Highway Statistics 2013, Table VM-1," January 2015 http://www.fhwa.dot.gov/policyinformation/statistics/2013/vm1.cfm9 The typical loading of a full truckload used in the model is 5.4 tons (24 pallets X 451 lbs. per pallet). The pallet weight estimate is based on historical data of
inbound shipments and outbound shipments from Optoro’s shipping facility in Lanham, MD. The EPA Smartway data estimates a typical load at 17.9 lbs. The
difference in loading is due to the lightweight retail merchandise that is being modeled. 10 EPA Smartway data reports LTL loads as being 27% lighter on average than full truckloads. We apply this same proportion, to factor down our full truck load
weight to reach an average LTL load of 4 tons.

17S U S T A I N A B L E R E V E R S E L O G I S T I C S©2016 Optoro, Inc.
APPENDIX
C . M E T H O D F O R C A LC U L AT I N G C A R B O N E M I S S I O N S
Step 1: Calculate fuel consumption
The basis for estimating emissions from fuel use starts with a calculation of fuel consumption (gallons) by
dividing the vehicle distance traveled (miles) by the fuel efficiency (mpg) of the vehicle type:
Fuel Consumption (gallons) = (Vehicle Distance (miles)) / (Fuel Efficiency (mpg))
Step 2: Convert fuel consumption to carbon emissions
Next, to find the total emissions for each link, the fuel consumption is factored by the rate of emissions for
each gallon of fuel combustion:
Emissions (CO2) = Fuel Consumption (gallons) x Emissions Factor (CO
2 / gallon)
Step 3: Assign fraction of fuel use and emissions to each item
The emissions estimated in steps 1 and 2 are for the transport of the entire vehicle and its cargo. In the final step,
the emissions are allocated to each unit of cargo on board based on the relative share of the total cargo loading.
Fuel (gallons) x Load Share (%) = Fuel per item (gallons per item)
Emissions (CO2) x Load Share (%) = Emissions per item (CO
2 per item)
The load share is calculated for each item based on the most logical metric for each retailer, either tons, volume,
pallet loading, or units per vehicle. This approach provides greater transparency and flexibility compared to using
an off-the-shelf “ton-mile” factor.
Load Share (%) = (item count) / (items per vehicle)
(note: Load Share is calculated similarly based on either weight, size, or count)

© Optoro 2016. All Rights Reserved.
SUSTAINABLE REVERSE LOGISTICS
Reducing Waste and Emissions
in the Retail Supply Chain
W H I T E PA P E R


