SEVENTH FRAMEWORK PROGRAMME SUSTAINABLE SURFACE TRANSPORT (SST)-2008-RTD-1 Integrated system for safe transportation of children to school SAFEWAY2SCHOOL Collaborative project 233967 Surrounding traffic info and warning visual and audio signs Deliverable No. D 5.5 Workpackage No. WP5 Workpackage Title User interface design and development Activity No. A5.5 Activity Title Surrounding traffic information and warning Authors: Stefan Egger (IIID) Melanie Ganzhorn and Frederik Diederichs (USTUTT) Thomas Porathe and Lennart Strand (MDH) Status: FINAL File Name: SW2S_D5-5 final.docx Dissemination Level Pu: Public Project start date and duration 1 September 2009, 36 Months
Transcript
SEVENTH FRAMEWORK PROGRAMME
SUSTAINABLE SURFACE TRANSPORT (SST)-2008-RTD-1
Integrated system for safe transportation
of children to school
SAFEWAY2SCHOOL
Collaborative project 233967
Surrounding traffic info and warning visual and audio signs
Deliverable No. D 5.5
Workpackage No. WP5 Workpackage Title User interface design and development
Activity No. A5.5 Activity Title Surrounding traffic information and warning
Authors: Stefan Egger (IIID)
Melanie Ganzhorn and
Frederik Diederichs (USTUTT)
Thomas Porathe and Lennart Strand (MDH)
Status: FINAL
File Name: SW2S_D5-5 final.docx
Dissemination Level Pu: Public
Project start date and duration 1 September 2009, 36 Months
SW2S_D5.5 final Pu Contract N. 233967
October 2011 3 IIID
Version History
Version Date Content Partner
V00 13/05/2011 REVISION TRACK, TABLE OF CONTENTS, LIST OF FIGURES, LIST OF TABLES, LIST OF ACRONYMS, CHAPTER II, CHAPTER V, REFERENCES, ANNEX I-III
USTUTT
V01 Input IIID IIID
V02 Updated content of USTUTT, Document check that it is according to the SW2S Template, Checked that the reporting structure fits with the guidelines of D5.1.
USTUTT
V03 IIID changes IIID
V04 30.08.11 Inclusion of MDH input and finalization of document USTUTT
V05 10.10.11 Peer Review Report addressing minor issues
V06 19.10.11 Revision according to Peer review Report, FINAL Document created
IIID
V07 27.08.27 Revisions according to project reviewer Ms. Rachel Grant VTI
SW2S_D5.5 final Pu Contract N. 233967
October 2011 4 IIID
Table of contents
Version History ........................................................................................ 3
Table of contents .................................................................................... 4
List of Figures ......................................................................................... 6
List of Tables ........................................................................................... 7
List of acronyms ...................................................................................... 8
1 School bus (stop) sign ..................................................................... 11
1.1 INTRODUCTION .............................................................................................. 11 1.1.1 Structure of the work ..................................................................................................... 11 1.1.2 Structure of the chapter ................................................................................................. 12
1.2 SCHOOL BUS (STOP) SIGN REQUIREMENTS ENGINEERING................................... 13 1.2.1 Current practice examples ............................................................................................. 13 1.2.2 Sign survey, findings ..................................................................................................... 13 1.2.3 Online resources exploration and findings .................................................................... 15 1.2.4 Time and size aspects to be considered ....................................................................... 18 1.2.5 Dimensions for the sign ................................................................................................. 19 1.2.6 Current school bus sign dimensions are too small ........................................................ 24 1.2.7 School bus stop signage dimensions ............................................................................ 26
1.3 SIGN BENCHMARK TESTS ................................................................................ 28 1.3.1 Simulator experiment ..................................................................................................... 28 1.3.2 Display media comparison test ...................................................................................... 30
1.4 SIGN DESIGN ................................................................................................. 32 1.4.1 Design principles to be followed .................................................................................... 32 1.4.2 Matrix design according to MoA .................................................................................... 33 1.4.3 Adjusting vector design methods to matrix/MoA requirements ..................................... 34
1.5 SCHOOL BUS (STOP) SIGN / SIGNALS – RESULTS ............................................... 35 1.5.1 School bus (stop) sign for vector application on sign plates ......................................... 36 1.5.2 School bus (stop) sign for matrix application on VMS ................................................... 38 1.5.3 Danger warning sign “children” for vector application on sign plates ............................ 40 1.5.4 Audible signs/signals ..................................................................................................... 41
5.1 SURVEY ON SCHOOL BUS- AND SCHOOL BUS STOP PICTOGRAMS IN USE .............. 72
5.2 TEST OF THE HIGH TECH BUS WARNING SIGN MDH ........................................... 82 5.3 EVALUATION OF THE 1ST DESIGN LOOP USTUTT ............................................. 86 5.4 EVALUATION OF THE 2ND DESIGN LOOP USTUTT ............................................. 92 5.5 PROTOTYPE VERIFICATION USTUTT ............................................................... 96
SW2S_D5.5 final Pu Contract N. 233967
October 2011 6 IIID
List of Figures
Figure 1: SAFEWAY2SCHOOL signs on sign plate (left), on VMS (middle) and incorporating
the message “danger” (right). ............................................................................................. 9 Figure 2: Car driver device: Information and warning. ............................................................ 10 Figure 3: Signs developed with SW2S: School bus (stop) sign, danger warning sign
“children” ........................................................................................................................... 12 Figure 4: UNECE ITC recommended school bus sign ............................................................ 14 Figure 5: Vienna Convention symbol “A, 13”: Danger warning “children”............................... 16 Figure 6: Children pictogram from Portugal. ............................................................................ 18 Figure 7: Landolt ring; gap visible at “standard” visual acuity 1 from a distance of 5 meters. 19 Figure 8: Determination of an average visual acuity to be used to calculate MoA dimension 20 Figure 9: Formula to calculate viewing time by number of information elements ................... 21 Figure 10: Field of vision and related colour distribution, left eye ........................................... 22 Figure 11: Formula to calculate viewing distance ................................................................... 22 Figure 12: Visualisation of the segmentation of viewing distance ........................................... 23 Figure 13: School bus sign: Required dimensions of current practice examples to meet
SW2S performance in terms of discrimination ................................................................. 25 Figure 14: Danger warning sign “children”: Required dimensions of Austrian current practice
example to meet SW2S performance requirements (MoA size) in terms of discrimination ........................................................................................................................................... 27
Figure 15: Simulator tested school bus signs. SW2S and Swedish example perform best ... 29 Figure 16: Sign displayed on TV, VMS and sign plate ............................................................ 31 Right: Graphical figures consisting of graphical elements Figure 17: Definitions: Sign,
enclosure, pictogram, graphical figure and element 32 Figure 18: 1 MoA = 2x2 units, n units sum up to total dimension ........................................... 33 Figure 19: 1 MoA = 1 unit, compared to 1 MoA = 2 by 2 units. 2 by 2 prevails. ..................... 34 Figure 20: Even straights support distinctive shapes .............................................................. 34 Figure 21: Vectors used according to matrix design method revealed ................................... 35 Figure 22: School bus (stop) sign, for vector-based application, RAL 1016. .......................... 37 Figure 23: Examples for a combined information school bus stop sign post .......................... 37 Figure 24: Bus pictogram ISO 7001 / In-Safety ....................................................................... 38 Figure 25: VMS school bus (stop) sign, monochrome (amber or white) ................................. 38 Figure 26: VMS school bus (stop) sign, animated (2 frames), monochrome (amber or white)
........................................................................................................................................... 39 Figure 27: VMS school bus stop sign, animated (2 frames), two colours: white and red. ...... 39 Figure 28: Current practice navigation systems/digital map services to be substituted ......... 40 Figure 29: Proposed SW2S pictograms for digital map services / (in-car) navigation systems
........................................................................................................................................... 40 Figure 30: Danger warning sign “children” .............................................................................. 41 Figure 31: Warning sound in an airplane ................................................................................. 42 Figure 32: Scheme of a warning sound ................................................................................... 43 Figure 33. Display positions for road sign systems. ................................................................ 46 Figure 34: Examples for current HMI of a road sign system (Daimler, 2011). ........................ 47 Figure 35: Road signs on a navigation map (Motor Talk, 2011). ............................................ 47 Figure 36: SAFEWAY2SCHOOL HMI development approach. .............................................. 48 Figure 37: Functionality of the Car2X communication for the SW2S car driver device. ......... 52 Figure 38: Street Signs used as information on in car navigation maps................................. 57 Figure 39: Very first Icons for the use in the tachometer. ....................................................... 58 Figure 40: Navigation maps with different icons. ..................................................................... 58 Figure 41: Navigation map with split screen (warning pictogram on left and map on right) ... 58 Figure 42: Street Sign displayed in the tachometer (Daimler, 2011). ..................................... 60 Figure 43: Re-Design of the tachometer icon. ......................................................................... 60
SW2S_D5.5 final Pu Contract N. 233967
October 2011 7 IIID
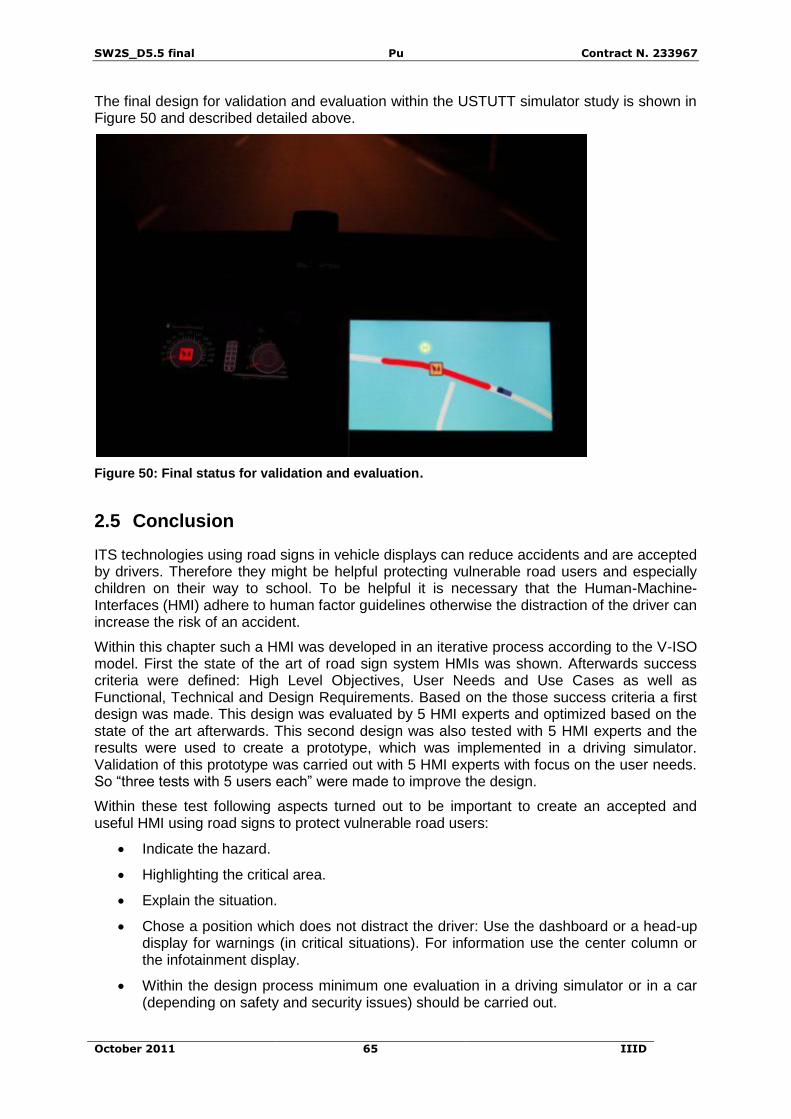
Figure 44: Implemented design concepts in the USTUTT driving simulator. ......................... 61 Figure 45: Final evaluation in the driving simulator of USTUTT. ............................................ 62 Figure 46: Results of the UAS. ................................................................................................ 62 Figure 47: Usefulness and Satisfying score. ........................................................................... 63 Figure 48: Results of the SUS. ................................................................................................ 64 Figure 49: Results of the prototype verification. ...................................................................... 64 Figure 50: Final status for validation and evaluation. .............................................................. 65
List of Tables
Table 1: Possible MoA / sign size dimensions ........................................................................ 23 Table 2: Possible MoA / sign size dimensions (excerpt, complete table: see above) ............ 27 Table 3: VMS sign animation frames and duration. File names. ............................................ 39 Table 4: List of files ready for application ................................................................................ 44 Table 5: Use Case 2.1. ............................................................................................................ 49 Table 6: Use Case 2.2. ............................................................................................................ 50 Table 7: User Needs Car Driver Device. ................................................................................. 51
SW2S_D5.5 final Pu Contract N. 233967
October 2011 8 IIID
List of acronyms
Acronym Description
APN Access Point Name
BS Bus Stop
BSIT Bus Stop Inventory Tool
CAN Controller Area Network
DSS Driver Support System, from a bus driver perspective
FERSI Forum of European Road Safety Research Institutes
GPS Global Positioning System
HMI Human Machine Interface
IBS Intelligent Bus Stop
IP Internet Protocol
LED Light Emitting Diodes
OBU On-Board-Unit
REST Representational State Transfer
SB(S)S School bus (stop) sign
SBS School Bus Sign
SOAP Simple Object Access Protocol
SSL Secure Sockets Layer
SW2S Safeway2School
TMC Traffic Management Centre, the central communication and decision server
UNECE ITC United Nations Economic Commission for Europe, Inland Transport Committee
VMS Variable Message Sign, employing LED technology
VRU Vulnerable Road User, a child of the age X to Y
VRU-unit Vulnerable Road User unit, for identification of a VRU
SW2S_D5.5 final Pu Contract N. 233967
October 2011 9 IIID
Executive Summary
This Deliverable D5.5 “Surrounding traffic information and warning, visual and audio signs” is part of Work Package 5 (WP5) "User interface design and development" within the FP7 research project "SAFEWAY2SCHOOL" (SW2S). The purpose of Deliverable 5.5 is to describe the information/warning to be issued to surrounding traffic using visual and audio signs. The aim was to develop a (warning) message, whose meaning is accurately understood, and on which one can act upon early and correctly. To display this message two concepts were developed:
School Bus (Stop) Sign
Car Driver Device (In-vehicle warning)
The school bus (stop) sign aims at providing information to the surrounding traffic of bus stops, i.e. car drivers. The information shall basically include the message about the possible presence of children and incorporates a warning character to raise attention towards children and drive slower and more careful.
The studies carried out focused on the creation of a pictogram and sign, which can outperform the current practice signs in terms of understanding and legibility on larger distances or high speeds.
Based on a review of existing international signs related to the prevention of endangering children and the international recommendation of UNECE several examples have been designed, and tests were carried out. Recommendations about sign dimensions were derived from time and size considerations, the visual acuity of driver’s eyes and a calculation method from In-Safety project.
The signs resulting from those considerations are displayed in Figure 1. For incorporating a “danger” message a triangle with the same icon is proposed.
Figure 1: SAFEWAY2SCHOOL signs on sign plate (left), on VMS (middle) and incorporating the message “danger” (right).
Aspects of application and manufacturing of the school bus (stop) sign, including printed and adhesive sheeting material, the use on VMS and (small scale) screen displays are also addressed. Finally, recommendations on the development of additional audible warning signals for pedestrians and the surrounding traffic are provided.
The car driver device aims at providing early information inside the vehicle about bus stops on the route that are currently used by children. When approaching the bus stop with children present, a car driver’s attention shall be raised by additional warning to the driver about the presence of children.
This product idea was realised by the application of the SAFEWAY2SCHOOL development methodology, the so called V-ISO model which describes a requirements engineering process as well as the design, iterative and user centred development.
The requirements engineering process is described in the subchapters:
SW2S_D5.5 final Pu Contract N. 233967
October 2011 10 IIID
Product Idea and High Level Objectives
User Needs and Use Cases
Technical Requirements
Functional Requirements
(Ergonomic and User Interface) Design Requirements
Based on the requirements engineering results, the design, iterative testing and development was carried out following a user centred design approach with several iterations and small numbers of test participants in each iteration, in order to optimize the product step by step. The development and testing process is described in two levels:
Design Loop
Prototype Verification
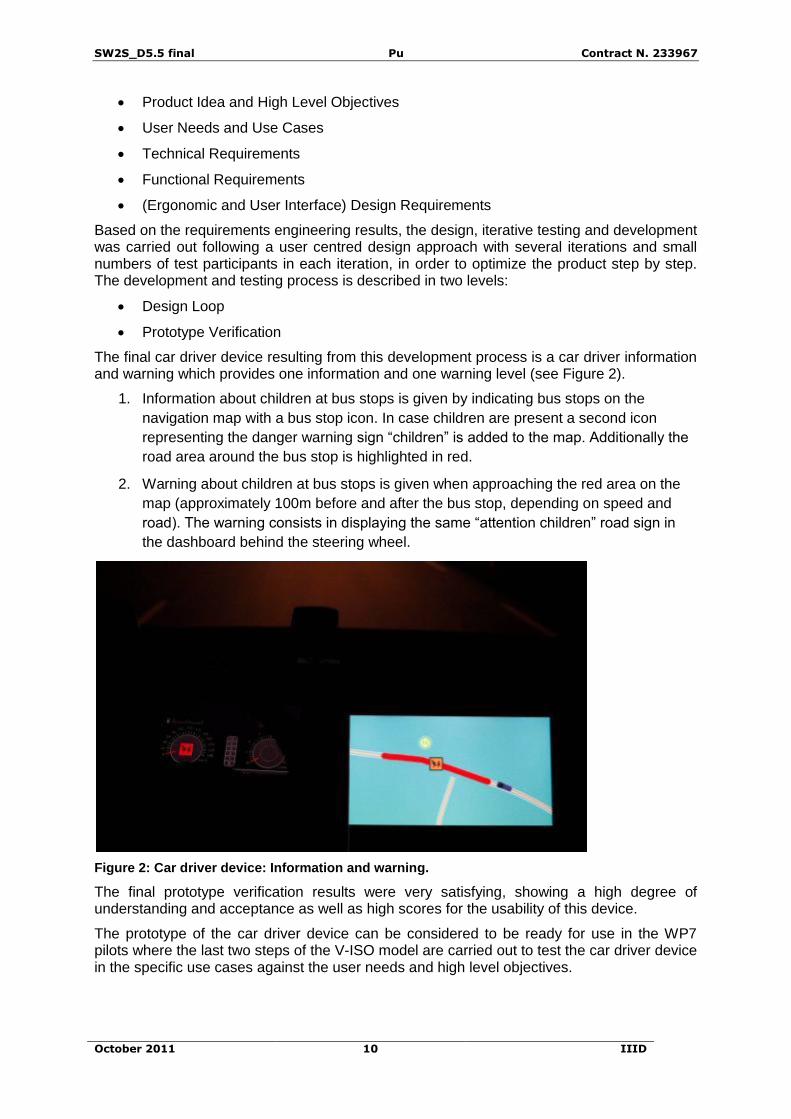
The final car driver device resulting from this development process is a car driver information and warning which provides one information and one warning level (see Figure 2).
1. Information about children at bus stops is given by indicating bus stops on the
navigation map with a bus stop icon. In case children are present a second icon
representing the danger warning sign “children” is added to the map. Additionally the
road area around the bus stop is highlighted in red.
2. Warning about children at bus stops is given when approaching the red area on the
map (approximately 100m before and after the bus stop, depending on speed and
road). The warning consists in displaying the same “attention children” road sign in
the dashboard behind the steering wheel.
Figure 2: Car driver device: Information and warning.
The final prototype verification results were very satisfying, showing a high degree of understanding and acceptance as well as high scores for the usability of this device.
The prototype of the car driver device can be considered to be ready for use in the WP7 pilots where the last two steps of the V-ISO model are carried out to test the car driver device in the specific use cases against the user needs and high level objectives.
SW2S_D5.5 final Pu Contract N. 233967
October 2011 11 IIID
1 School bus (stop) sign
The school bus stop sign developed process is reported in this chapter.
1.1 Introduction
In this chapter, bearing the title "School bus (stop) sign" the Activity Leader, the International Institute for Information Design (IIID, Austria) together with project partner Maelardalens hoegskola (MDH, Sweden) and project coordinator Statens väg och transportforskningsinstitut (VTI, Sweden), set out to research and develop means of signalisation and warning to enhance road safety for school children. This was done by evaluating current practice examples of signalisation on international level- a total of 92 examples of school bus signs, school bus stop signs, danger warning signs “children” and related pictograms from 37 countries were collected. Additionally, in order to verify the existence of other means of warnings and related regulations, one questionnaire, addressing FERSI members, supported by another, directed towards stakeholders in Europe and international, was issued.
Having established a firm base of knowledge, a sign could be created, which caters for the needs of road users and affordances of the traffic situation of today. Designed for these needs, taking into account (high) driving speeds, a driver's visual acuity (eyesight), high information density and required viewing time & distance, a sign, outperforming current practice examples in terms of discrimination (legibility) over long viewing distance, was developed. For example, in comparison to the current Austrian school bus sign (= 100%), the SW2S sign’s discrimination rate is enhanced by 188%.
Two tests carried out to support this calculation, but also make clear that the current international recommendation of UNECE, governing the visual appearance of the school bus sign is even less legible than Austrian current practice.
1.1.1 Structure of the work
Activity A5.5, “Surrounding traffic information and warning”, and this Deliverable D5.5 “Surrounding traffic information and warning, visual and audio signs”, set out to provide enhanced road safety for school children by means of signalisation. To do so, the following steps had to be taken to finally derive a functional warning/information to be issued to traffic surrounding a school bus or school bus stop.
At first, the messages to be used to convey information and/or warning were investigated on an international level, including the message’s visual representations and actual meaning(s). A message’s meaning is governed by two factors- its verbal representation/denomination, and of course the (often by law) prescribed action(s) to be taken when a car driver is confronted with such a message (sign) in a road traffic situation.
Visual representations of messages, the signs, in their various forms were collected from many countries worldwide in order to evaluate and compare functionalities, and to determine the visual representation most suitable for further development of a school bus (stop) sign “SB(S)S”. Only few representations relate closely to the international proposal by UNECE ITC of a school bus sign.
Simultaneously, the meanings of the messages were explored, resulting in the discovery that the signs rarely share the same meaning or prescribed action across countries. Never the less, it became clear that the countries’ policies to, more or less, loosely follow the UNECE ITC recommendation indicate that a basic concept of the meaning, which is known to road users, is established. Road users have either learned it during driving school, or because of encounters with a SB(S)S during exposure in road traffic.
SW2S_D5.5 final Pu Contract N. 233967
October 2011 12 IIID
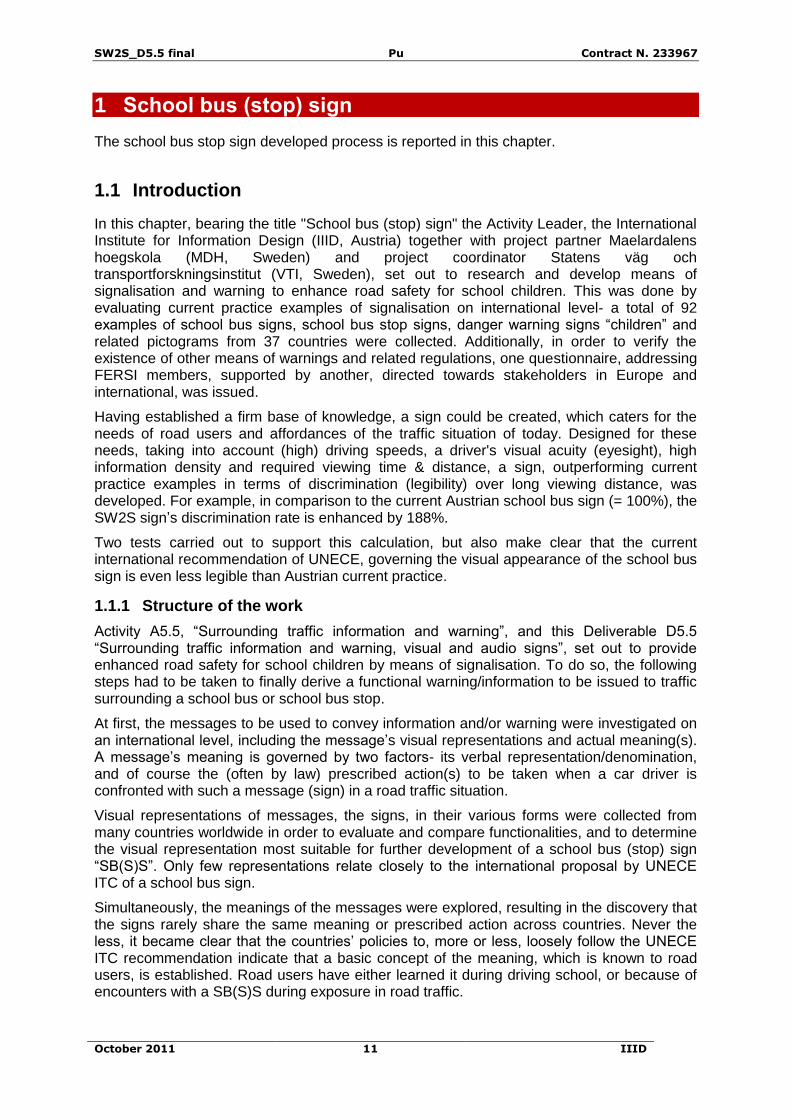
While the visual performance of SB(S)S, has been enhanced to 263% compared to the UNECE ITC recommended sign, due to work done in Activity A5.5 for the benefit of heightened road safety for school children, its is of utmost importance to pursue the harmonisation of the precise depiction of this sign, its meaning and prescribed action(s). It is recommended that this matter be addressed on international level. A possible starting point should be UNECE ITC.
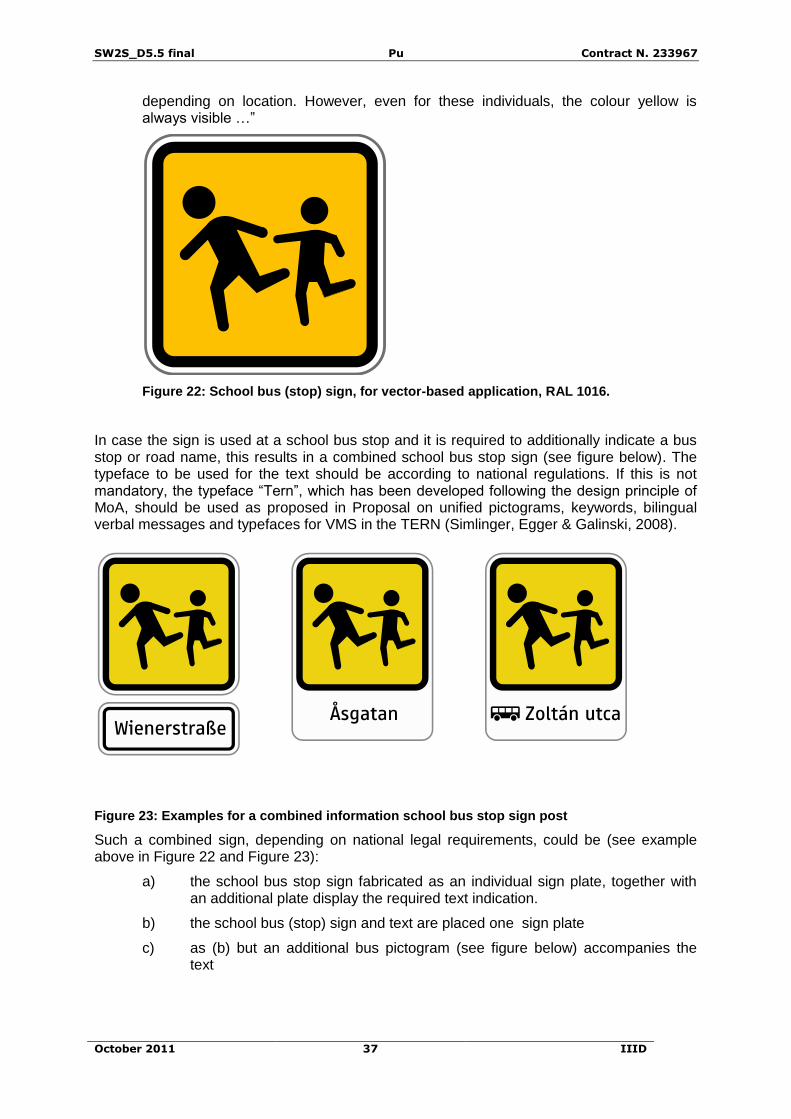
Figure 3: Signs developed with SW2S: School bus (stop) sign, danger warning sign “children”
Left: For use on road signs (sign plates) and high resolution screen displays, e.g. in-car navigation systems or computer screens
Centre: Low, 64 by 64 units resolution for LED-based VMS (Variable Message Signs) or small scale use on computer screens and in-car navigation device displays (figures following later on)
Right: For a global harmonisation of the children pictogram, in order to support its instant understanding, the danger warning signs “children”, bearing the same graphical figures as the school bus (stop) sign, should be used exclusively.
1.1.2 Structure of the chapter
The section “School bus (stop) sign requirements engineering” describes the methods and actions taken to acquire knowledge on the current status of school bus- and school bus stop signs in use. Through evaluation, requirements for the expression of the message implied were established on which further development of a school bus (stop) sign have to be based. Through this, the most appropriate example, best fulfilling the requirements was chosen.
By considering the future application areas of the sign, critical situations were highlighted, which provided further requirements to govern sign enhancement in terms of visibility, taking into account driving speeds, viewing distances, viewing time, eyesight (visual acuity of car drivers owning a driving license) and actual dimensions of application.
In the section “Sign benchmark tests”, two tests on the performance of the SW2S school bus (stop) sign are laid out. One was based on and carried out in a driving simulator facility in Germany, while the other reflected the display quality of media to present the sign under real world conditions. Both test results emphasize the validity of the developed SW2S sign, outperforming other current practice school bus signs in terms of long viewing distance/visual discrimination.
Section “Sign design” focuses on design measures in order to create the sign according to requirements of viewing time/distance, point of disappearance and visual acuity. This is provided, in general, for matrix/pixel based application such as on VMS and screen displays of computers and in-car navigation systems, and vector based use, e.g. for the fabrication of sign plates. The section “School bus (stop) sign / signals – results” explains forms of application and manufacturing of the school bus (stop) sign, including printed and adhesive sheeting material, and use on VMS and (small scale) screen displays. It is strongly recommended to use the “children” pictogram of the school bus (stop) sign in the danger
SW2S_D5.5 final Pu Contract N. 233967
October 2011 13 IIID
warning sign “children”. Finally, recommendations on the development of audible warning signals are provided.
“Annex 5.1” provides reports on the collected school bus (stop) signs and a sign display test.
“List of attached files ready for application”: Various ready-to-use files for the application of the developed signs on various media.
Section “Conclusions”, sums up findings of research, and compares the performance of current practice school bus (stop) signs to the one developed in SW2S, and emphasizes the fact that although the SW2S sign is superior, it needs to be made sure that dimensions are in conformity with the requirements of Annex III of Council Directive 91/439/EEC of 29 July 1991 on driving licences, taking into account drivers bearing weak eyesight. UNECE ITC, the entity issuing the international recommendation for the school bus stop sign, should be informed.
For audible warning sounds, recommendations are provided on how these should be composed in order to be easily recalled and related to “children in danger”.
1.2 School bus (stop) sign requirements engineering
During thissection, it needs to be emphasised that the definition of “sign” is the visual representation of the (warning) message to be conveyed, and not, as usually done in plain language, a signpost, or a signboard of whatever making, on which a visual representation of a message is presented, for instance on the roadside.
The requirements for the development of a sign to positively influence road safety of (school) children:
has enhanced efficiency in conveying the concept of endangered children, visualised by a graphical figure
is enhanced for increased visual discrimination in order to perceive the sign earlier, providing oncoming drivers with more time to adjust driving behaviour and speed.
has one unique appearance and is capable to be displayed or presented on virtually any media (metal sign plate, LED screens (VMS), in-car display screens), without quality loss or distortion.
is clearly related to the appearance of the UNECE ITC recommendation, in order to relate to the known concept of this sign and its meaning, which has to be considered as “learned” by the public due to exposure in road traffic or during lessons in driving school.
1.2.1 Current practice examples
To establish first insights on current practice on an international level to facilitate proceeding research, a first, very simple E-mail survey was sent out, focussing on possibly existing national variants of school bus signs and school bus stop signs. Only two questions were posed so respondents would find it easy to respond without much of a delay. The totality of all signs collected can be found in Annex 5.1 in the Survey on school bus- and school bus stop pictograms in use (Egger, 2010).
1.2.2 Sign survey, findings
For the school bus sign, a common, very general base of visual representation, very loosely relating to prescriptions of the Consolidated resolution on Road Traffic (R.E.1). Annex 1, Recommendation 2.2. (United Nations, Economic Commission for Europe, Inland Transport Committee, 1998), is used, if such a marking is actually in existence in a country. The visual
SW2S_D5.5 final Pu Contract N. 233967
October 2011 14 IIID
representation of a school bus sign can even vary from province to province, depending on the manufacturer of a school bus sign plate.
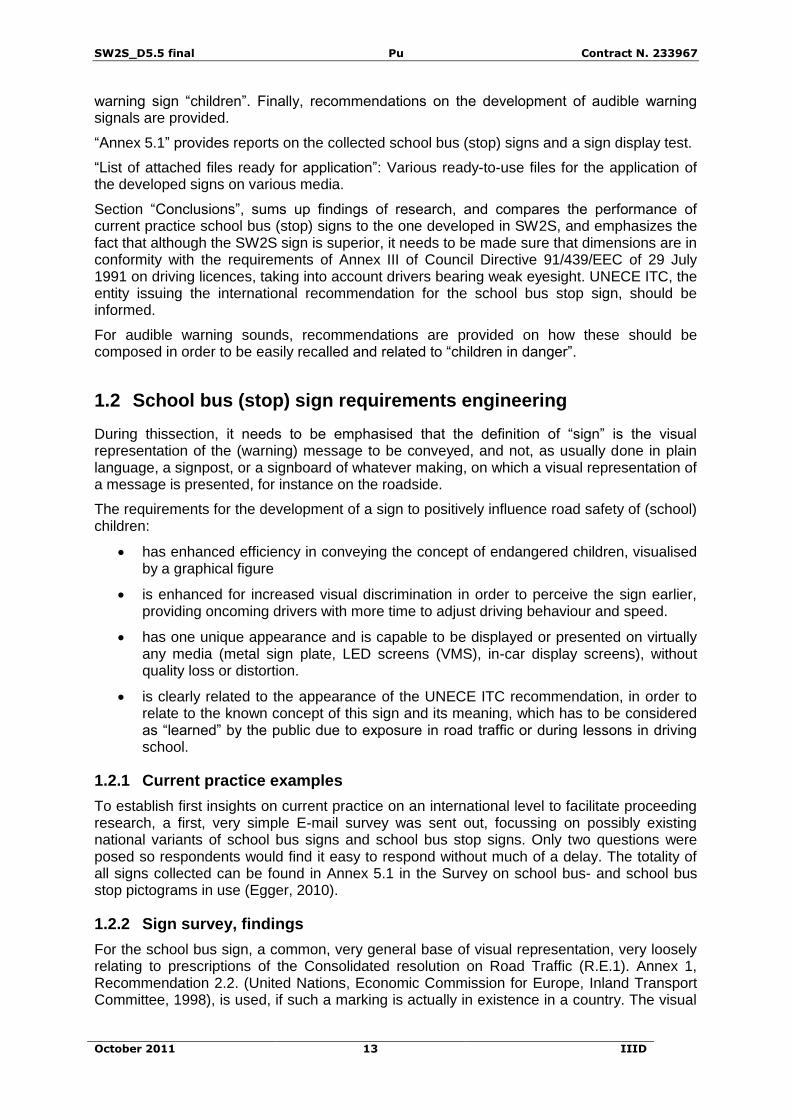
Figure 4: UNECE ITC recommended school bus sign
There are very few designated school bus stop signs in existence on the globe. Most examples only relate to the concept of school children on additional sign plates, which are attached to regular bus stop sign plates. In Anglo-Saxon influenced countries such as New Zealand, USA and Canada, danger-warning signs (yellow, diamond shaped) have been found to be placed near/at school bus stops where deemed needed.
Sign survey questions
Question 1, School bus-stop sign
--------------------------------------------
Is, in your country, a special sign/information being used to especially signal a school-bus-stop? We are interested in signs which are put on signposts and such like to point out that the physical place concerned is a bus stop for school children. YES/NO?
- if yes, please take a picture of such a sign and send it to me ([E-mail address] - again, snapshot quality is absolutely sufficient)
Question 2, School bus-sign
--------------------------------------------
Is, in your country, a special sign being used to signal a school bus? Here, we are interested in signs which are put onto school-buses, to alert and remind the surrounding traffic to behave more carefully and attentive. YES/NO?
- if yes, please take a picture of such a sign and send it to me ([E-mail address] - again, snapshot quality is absolutely sufficient)
The findings above were supported by feedback to queries (drafted by IIID) within a survey addressing FERSI members, issued by KfV. Additional questions seeking insights on methods/means in use to display and attach a school bus sign to a bus, as well as school bus colour yielded further indications:
If a sign is used to identify a school bus, it usually is represented by a detachable, or sometimes foldable sign plate. But very often, signs are permanently attached to the vehicle in form of adhesive sheeting material (stickers). In no country are signs displayed using LED technology.
TRANS/SC.1/294/Rev.5
page 25Annex 1
Annex 1
"SCHOOL BUS" SIGN
(Recommendation 2.2.)
SW2S_D5.5 final Pu Contract N. 233967
October 2011 15 IIID
Bus colour is inconsistent, generally not following North American practice, were school buses have to be yellow.
In few countries, amber-flashing lights mounted to buses are used to draw special attention to the vehicle while in the process of stopping.
In no country is sound used to draw attention to a school transportation vehicle.
FERSI survey, sign, mounting and signalling related question
Are buses used for school transport specially marked and/or have special signs or signals? (Tick all that apply)
[ ] School transport sign (iron)
[ ] LED School transport sign
[ ] Colour of the bus
[ ] Light signals
[ ] Sound signals
[ ] Other___________________________
If there are special markings/signs, please give a description of it and it’s mounting to the vehicle:
1.2.3 Online resources exploration and findings
While these two surveys were carried out, a parallel study of resources commenced on more particular aspects of school bus (stop) signs currently in use. Because of a lack of studies focussing on this issue, an online exploration was conducted on the details of appearance of signs: the graphical figures and their components, and the graphical elements. In order to identify the most promising pictogram to visualise the concept of “children” to undergo further development, signs were collected and their graphical figures reviewed in terms of:
its potential for harmonisation
the potential to convey the concept of “danger”
the clarity of the graphical figures
1.2.3.1 Harmonisation of the “children” pictogram As found out during this study, there are indications that within one country, the visual representation of the concept of “children” (the pictogram) on collected school bus signs, are purposely relating to the “children” pictogram shown on the national version of danger warning sign “children”, as seen in the Convention on Road Signs and Signals, done at Vienna on 8 November 1968, Annex 1/ Symbol A, 13 (United Nations. Economic Commission for Europe, Inland Transport Committee, 1968/1995) .
SW2S_D5.5 final Pu Contract N. 233967
October 2011 16 IIID
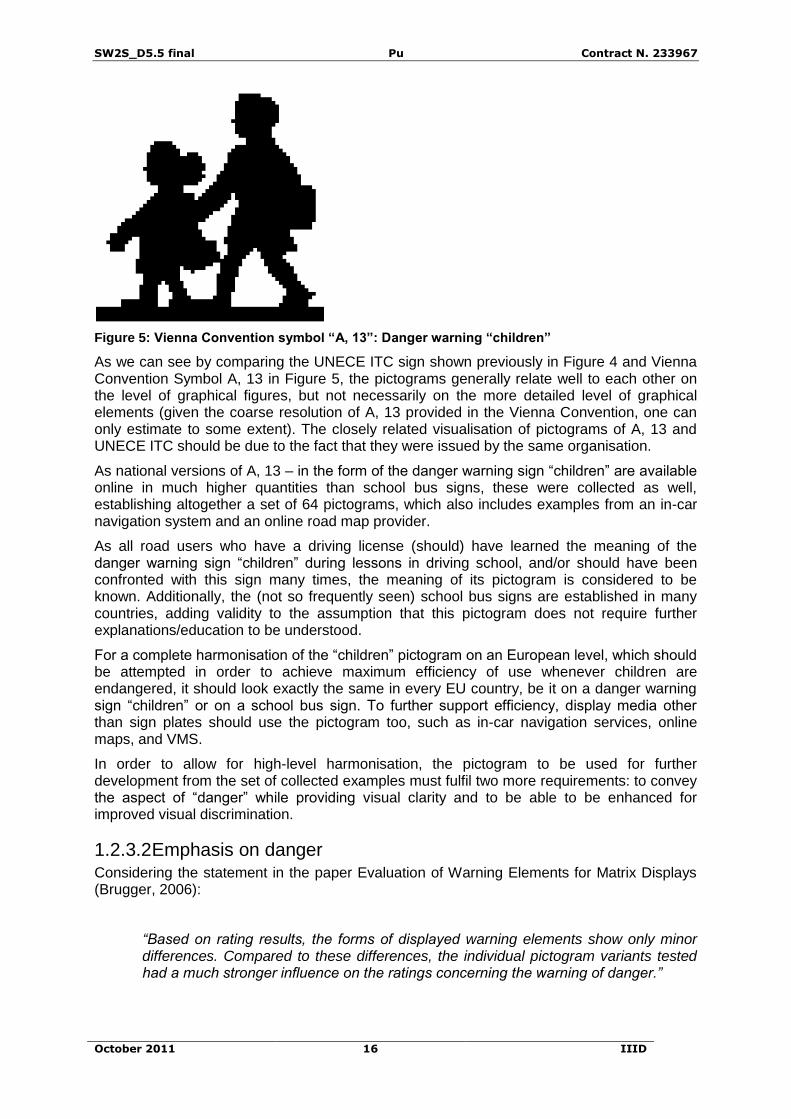
Figure 5: Vienna Convention symbol “A, 13”: Danger warning “children”
As we can see by comparing the UNECE ITC sign shown previously in Figure 4 and Vienna Convention Symbol A, 13 in Figure 5, the pictograms generally relate well to each other on the level of graphical figures, but not necessarily on the more detailed level of graphical elements (given the coarse resolution of A, 13 provided in the Vienna Convention, one can only estimate to some extent). The closely related visualisation of pictograms of A, 13 and UNECE ITC should be due to the fact that they were issued by the same organisation.
As national versions of A, 13 – in the form of the danger warning sign “children” are available online in much higher quantities than school bus signs, these were collected as well, establishing altogether a set of 64 pictograms, which also includes examples from an in-car navigation system and an online road map provider.
As all road users who have a driving license (should) have learned the meaning of the danger warning sign “children” during lessons in driving school, and/or should have been confronted with this sign many times, the meaning of its pictogram is considered to be known. Additionally, the (not so frequently seen) school bus signs are established in many countries, adding validity to the assumption that this pictogram does not require further explanations/education to be understood.
For a complete harmonisation of the “children” pictogram on an European level, which should be attempted in order to achieve maximum efficiency of use whenever children are endangered, it should look exactly the same in every EU country, be it on a danger warning sign “children” or on a school bus sign. To further support efficiency, display media other than sign plates should use the pictogram too, such as in-car navigation services, online maps, and VMS.
In order to allow for high-level harmonisation, the pictogram to be used for further development from the set of collected examples must fulfil two more requirements: to convey the aspect of “danger” while providing visual clarity and to be able to be enhanced for improved visual discrimination.
1.2.3.2 Emphasis on danger Considering the statement in the paper Evaluation of Warning Elements for Matrix Displays (Brugger, 2006):
“Based on rating results, the forms of displayed warning elements show only minor differences. Compared to these differences, the individual pictogram variants tested had a much stronger influence on the ratings concerning the warning of danger.”
SW2S_D5.5 final Pu Contract N. 233967
October 2011 17 IIID
A pictogram which can inherit and convey in its meaning the aspect of danger may just as well be understood as a warning by road users, similar to a danger warning sign. This is of special significance in the case of the school bus sign. It does not employ a special element, such as the red triangle, which is well known for its meaning “danger warning” to convey “danger”. Therefore, the graphical figures (the children) of the pictogram have to be drafted in such a way that they appear to be moving vigorously instead of showing static behaviour, as this is the case in the UNECE ITC recommended sign, and Vienna Convention Symbol A, 13. Assuming the position and viewpoint of a car driver, dashing children perceived on the roadside pose a potentially higher risk for collision and damage than those standing still. Accordingly, a driver will approach a stretch of road more carefully and more slowly where dashing children can be expected, instead of children standing still or walking slowly. Following this thinking, the graphical figures of the pictogram should be depicted as if they are running.
1.2.3.3 Clarity of graphical figures This section is concerned with more technical requirements to be fulfilled by a sign, respectively pictogram to be used for further development. Out of the set of collected examples, those in conformity with above requirements were evaluated in terms of their capability to be transformed into a new proposal that is simplified to the furthest extent possible, so that the graphical figures of the pictogram and what they represent are clearly distinguishable, even over large viewing distances.
Reasons for this are given by the need (A) to adjust the pictogram to virtually any size, and (B) any media a SB(S)S could be presented on, without losing quality of presentation. The (achievable) goal is to keep the graphical elements totally consistent at any time and any size.
(A) Optimum quality in small-scale reproduction is especially crucial, as the pictogram’s performance in this field directly translates to its efficiency in terms of visual discrimination when it is presented in a road environment. Drivers approaching (driving towards) a sign should be able to discriminate it from the greatest viewing distance possible, giving them ample time to comprehend its meaning and adjust driving behaviour accordingly. Of course, small-scale performance of the pictogram, where viewing distance is constant, e.g. on computer screens when viewing online maps, or on in-car navigation displays, profits from this approach. Later on, the technique used to design a pictogram in such a way, following principles of the “Minute of Arc” (MoA), will be explained in detail.
(B) According to the various future applications of the pictogram, it must be designed, in such a way that, besides adhering to MoA, it can adapt to various media and scale without quality loss or distortion of the graphical representation. This means that, in the design process, very coarse screen resolution (for low resolution VMS, or small display on computer/In-car navigation screens), as well as vector-based, high-resolution reproduction (from small scale printing on maps to large application on sign plates) need to be taken into account.
Following the above reasoning, the example found in Portugal fulfils all requirements. In the upcoming design process, it will be enhanced according to the principles described in (A) and (B) above. Detailed information on the evaluation leading to the assignment of this particular sign can be found in the SW2S related paper: Survey on school bus- and school bus stop pictograms in use (Egger, 2010)
SW2S_D5.5 final Pu Contract N. 233967
October 2011 18 IIID
Visser, S. (1998) http://www.elve.net/rkidpor.htm
Figure 6: Children pictogram from Portugal.
1.2.4 Time and size aspects to be considered
As the most appropriate example has been established, the re-design process is commenced, with the primary goal of creating a most “legible” pictogram that can be visually discriminated from larger viewing distances than current examples of the children pictogram. Critical situations, in which a sign’s performance is inhibited when encountered by a driver, are prioritised by the degree to which they inhibitate adequate visibility and understanding of a sign/pictogram. The factors influencing the performance are: time, size (dimension), and movement.
1.2.4.1 Time and size/movement critical situations A car driver, in the situation of moving towards a school bus (stop) sign with considerable speed, has little available time to notice, discriminate, comprehend and react appropriately and early enough to avoid possible collisions. Heightening the stakes, she/he has to discriminate a moving object, which also changes (increases) in size while being approached. This specific situation’s requirements for the pictogram design is essential, in order to increase road safety for school children.
1.2.4.2 Time critical situations Other situations, which are to be considered as secondary, are critical in terms of time, but the object to be comprehended is not moving nor increasing in size. Such a situation, for example, is taking place when the pictogram is shown on an in-car navigation display. The main focus of a driver’s attention would lie on traffic observation- within the short time of a glimpse she/he should be able to discriminate the displayed pictogram.
1.2.4.3 Size critical situations Third, the least crucial situation is given where there is no time pressure, but small size representation of the pictogram is causing problems. This may occur when observing the pictogram in small scale on computer screens or on roadmaps printed on paper. The observer my alter the viewing distance, or change the lighting situation in order to discriminate. Never the less, optimal performance of the pictogram at low resolution is key in such a situation.
SW2S_D5.5 final Pu Contract N. 233967
October 2011 19 IIID
Reiterating what is said above, designing the pictogram by fulfilling the requirements for time/size/movement critical situations, all other situations will be catered for.
1.2.5 Dimensions for the sign
Obviously, it would prove useful, in order to adapt to the needs of time/size/movement critical situations, to present any sign as large as possible. In practice, due to ever-imminent lack of available space on the roadside and on the school bus where the school bus (stop) sign is to be positioned, the possible sizes of the sign details have to be established to determine the required sign dimensions. These figures then have to be compared to available space.
1.2.5.1 Minute of Arc (MoA) Minute of Arc (MoA) is a dimension, whose size is defined mainly by the visual acuity required to discriminate (or “tell apart”) simple graphical elements being presented close to one another, at a given viewing distance. For instance, the dimension (size) of the separation of two black parallel lines, shown on white background. Usually, a person is confronted with MoA during eyesight tests done by optometrists. Using graphical figures such as the “Landolt ring” (Wkipedia, 2011) the visual acuity of a subject can be evaluated. The ring’s stroke width has exactly the same dimension as the opening (1 MoA at a set viewing distance), and through the person’s replies to the optometrist’s questions on where the opening (gap) is located (there are multiple ways to “turn” the ring, so the position of the opening varies), visual acuity can be judged.
Figure 7: Landolt ring; gap visible at “standard” visual acuity 1 from a distance of 5 meters.
This procedure can be reversed and used to judge required dimensions of one MoA for a specific (known) visual acuity and defined viewing distance. For example, the landolt ring’s gap shown above has a dimension of 1.45 mm. For persons with visual acuity 1 (or higher) the gap is visible from a distance of 5 meters.
To define MoA dimension to be used for road traffic related sign design,
an average visual acuity of drivers, and
required viewing distance(s)
have to be established.
1.2.5.2 Determining visual acuity As road users, and especially car drivers, are the most important group to be catered for, because this group is concerned with the most critical “Time and size/movement critical” situation (see above), their requirements concerning visual acuity should be reviewed.
Legal requirements are laid out as such:
Annex III of Council Directive 91/439/EEC of 29 July 1991 on driving licences:
”Group 1 (drivers of vehicles of categories A, B and B+E and subcategory A1 and B1):
(6.1.) Applicants for a driving licence or for the renewal of such a licence shall have a binocular visual acuity, with corrective lenses if necessary, of at least 0.5 when using both eyes together. Group 2 (drivers of vehicles of categories C, C+E, D, D+E and of subcategory C1, C1+E, D1 and D1+E):
SW2S_D5.5 final Pu Contract N. 233967
October 2011 20 IIID
(6.3.) Applicants for a driving licence or for the renewal of such a licence must have a visual acuity, with corrective lenses if necessary, of at least 0.8 in the better eye and at least 0.5 in the worse eye.”
This regulation provides the lower limit of 0.5 visual acuity for drivers, which must be catered for. However, a sign designed according to this regulation cannot be feasible applied in a road environment, as it would produce exceedingly large road signs.
Standard visual acuity is 1, best to be explained as average or common eyesight. As laid out by Reference.com (2008), Standard visual acuity requires only half the dimension (50 %) of 1 MoA (compared to acuity of 0.5) to be discriminated.
Accordingly, signs would be considerably smaller if developed in adherence to acuity 1, thus being much more feasible to implement, Still, many drivers with acuity 0.5 would not be able to discriminate any sign from a distance where they could comprehend and react to it in time.
Visual acuity of healthy eyes is 1.46, and this can be considered as excellent eyesight. 1 MoA at visual acuity 1.46 has a dimension of only 34.25 %, compared to acuity 0.5.
Presumably, not many drivers will be blessed with vision as good as this- taking into account the aging society to name but one factor, so creating small signs only for this small group bearing excellent eyesight would exclude all other drivers with lower visual capabilities. In order to derive a still manageable sign size, whilst designing it to provide support for a lowest possible visual acuity, an average is required.
By following the calculation method used during the course of development of signs for motorways in the FP6 project “In-Safety”, as stated in Proposal on unified pictograms, keywords, bilingual verbal messages and typefaces for VMS in the TERN (Simlinger, Egger & Galinski, 2008) a visual acuity of 0.73 is established. Using this value to calculate MoA size, and – by multiplying MoA – sign dimensions, allows a) still catering for the needs of drivers with relatively low vision while b) providing sign sizes which are still possible to be put up in a road environment, not exceeding available space given along the roadside or on the font, respectively rear, of a school bus.
1.46 • 0.5 = 0.73
Figure 8: Determination of an average visual acuity to be used to calculate MoA dimension
1.2.5.3 Viewing distance/time Required viewing distance is largely dependent on the time a driver needs to discriminate a sign or pictogram, and to transfer the received message into an appropriate adjustment of driving behaviour. The longer the time an individual has to evaluate a sign or pictogram, the more certain the correct uptake of the presented message. But, as the road traffic environment is under consideration here, driving speed is the factor, which limits the duration of viewing a sign.
In case a sign is presented among other information, attention of a driver is divided (and so is viewing time), depending on the number of total messages.
If a sign is positioned at the perimeter of vision, such as above or beside the normal, straight onward line of sight of a driver, it might not be perceived early enough, or pass out of sight too early. This again reduces viewing time, and needs to be compensated by the dimension of MoA, respectively, the dimension of the sign.
1.2.5.4 Driving speed A variety of velocities have to be considered, as, from country to country, speed limits for school buses, and the speed restrictions of roads on which they travel, differ. Additionally, environmental settings range from a rural to an urban scenario. More complexity is added to
SW2S_D5.5 final Pu Contract N. 233967
October 2011 21 IIID
the issue by the fact that if a sign is attached to a school bus, it can be moving. This effects the actual speed to be calculated, as the speed of traffic following a moving bus needs to be subtracted from the buses speed, while the speed of traffic moving opposed to the bus has to be added to bus velocity. Accordingly, signs would have to be larger in front of a school bus, compared to the one mounted on the rear. To derive a dimension for MoA, for the sake of safety, high speeds, rather than low, have to be taken into account.
1.2.5.5 Number of information elements (messages/signs) Aside from the fact that driving is a complex task, which requires most of a driver’s attention, information (messages) which are presented simultaneously to a sign on a school bus or school bus stop further increase the demand for required viewing time. In other words, the driver’s attention is shared between the provided messages, and in order to comprehend their meaning, actual viewing time for the individual signs is reduced. Addressing this problem, the Danish technical handbook for VMS (Kjemtrup, no Year) provides a method for the calculation of viewing time needed when more than one message or sign need to be comprehended. t is required reading time in seconds; n is the number of standard information elements presented. One information element, according to below formula, requires 2.33 seconds of viewing time, two information elements 2.66 seconds.
t = 2s + n/3s Figure 9: Formula to calculate viewing time by number of information elements
Viewing distance has to increase with viewing time, if requirements of time/size/movement critical situations are to be catered for.
1.2.5.6 Point of disappearance The point of disappearance is where an approached message (sign) passes out of the perimeter of a driver’s field of vision. This can imply a reduction of viewing time to some extent, depending on the following factors, which narrow the field of vision.
First is the perimeter of a driver’s field of vision. The figure below provides insights on the actual area that is encompassed by the vision of the eye. The perimeter is significantly expanding more along the horizontal axis. Full colour vision is possible within a relatively small angle of 30 degree around the centre of focus. In the area around, extending from approximately 30 to 60 (respectively 70) degrees, only black and blue vision is available, while in the outer rim of the field of vision only black and white can be distinguished. A sign could possibly be positioned on the roadside, if used as school bus stop sign, or, if attached on a school bus, high above the normal forward view of a driver. In both cases, the positioning of the sign makes it pass out of the full colour vision and focus area early.
The field of detection is due to narrow down to 15 degree during the process of driving. The higher the speed, the smaller the field of detection will become.
SW2S_D5.5 final Pu Contract N. 233967
October 2011 22 IIID
Figure 10: Field of vision and related colour distribution, left eye
Second, the limiting effect on the perimeter of the field of vision, posed by the form and dimension of a vehicles windshield, through which a driver observes traffic.
1.2.5.7 MoA governing sign dimensions Having considered the above-mentioned factors, which have an effect on viewing time/viewing distance, it seems to prove adequate – in order to have an initial view about possible dimension of MoA, and through this, a possible sign size to compare sign dimensions required for optimum performance to actual available space. To do so, the “average” (see above) visual acuity of 0.73 will be used, resulting in 1 MoA at a viewing distance of 1 meter of 0.4166 mm.
D = a + (V • t)
Figure 11: Formula to calculate viewing distance
D is the required viewing distance
a is the distance where reading must stop (point of disappearance, e.g. of an overhead road display, which is when the display (or road sign) is 15° above (or, in this case, beside) the normal direction of the central line of vision of a driver. Resulting dimension of a = 11.64 m.
V is the driving speed in meter per second
t is the viewing time in seconds.
SW2S_D5.5 final Pu Contract N. 233967
October 2011 23 IIID
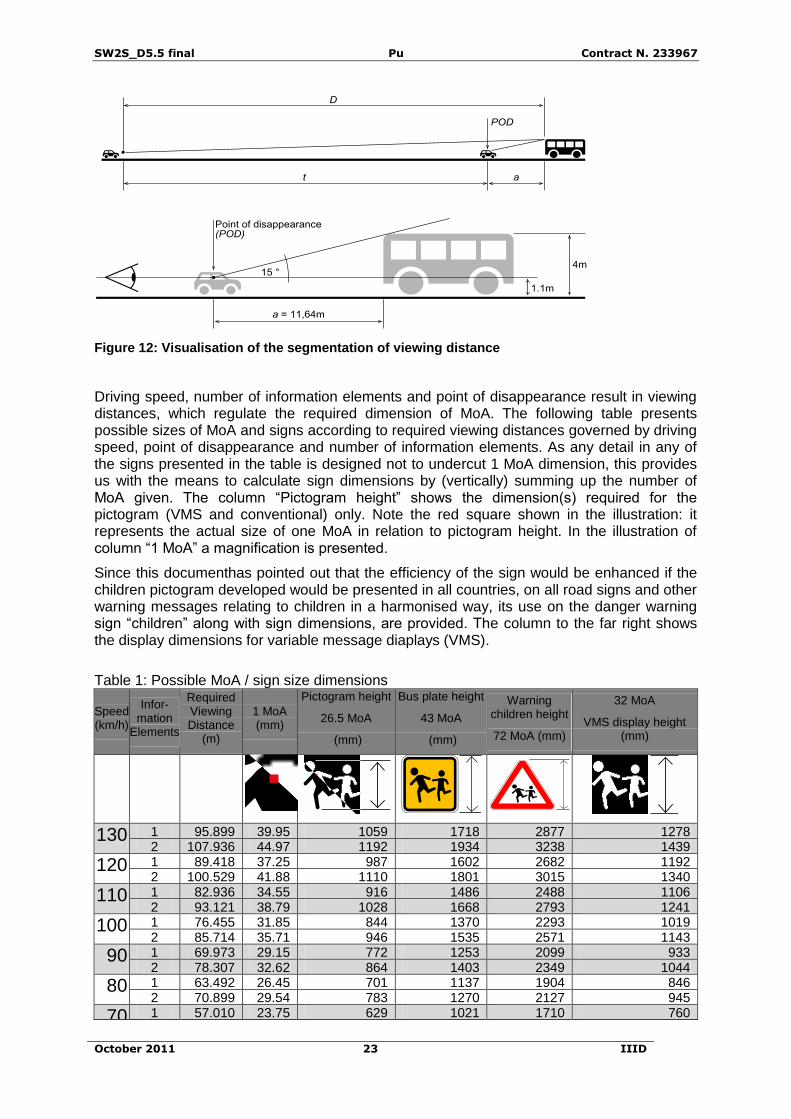
Figure 12: Visualisation of the segmentation of viewing distance
Driving speed, number of information elements and point of disappearance result in viewing distances, which regulate the required dimension of MoA. The following table presents possible sizes of MoA and signs according to required viewing distances governed by driving speed, point of disappearance and number of information elements. As any detail in any of the signs presented in the table is designed not to undercut 1 MoA dimension, this provides us with the means to calculate sign dimensions by (vertically) summing up the number of MoA given. The column “Pictogram height” shows the dimension(s) required for the pictogram (VMS and conventional) only. Note the red square shown in the illustration: it represents the actual size of one MoA in relation to pictogram height. In the illustration of column “1 MoA” a magnification is presented.
Since this documenthas pointed out that the efficiency of the sign would be enhanced if the children pictogram developed would be presented in all countries, on all road signs and other warning messages relating to children in a harmonised way, its use on the danger warning sign “children” along with sign dimensions, are provided. The column to the far right shows the display dimensions for variable message diaplays (VMS).
1.2.6 Current school bus sign dimensions are too small
The UNECE ITC recommendation 2.2, Marking of school buses, explains:
…
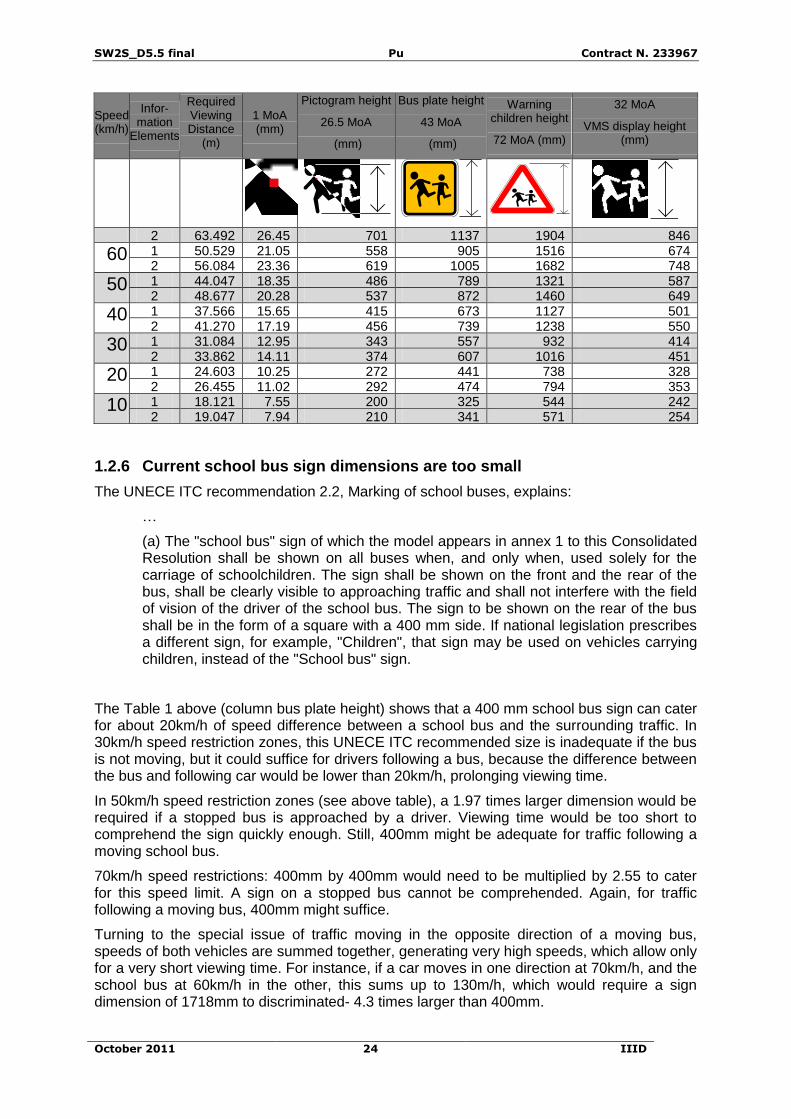
(a) The "school bus" sign of which the model appears in annex 1 to this Consolidated Resolution shall be shown on all buses when, and only when, used solely for the carriage of schoolchildren. The sign shall be shown on the front and the rear of the bus, shall be clearly visible to approaching traffic and shall not interfere with the field of vision of the driver of the school bus. The sign to be shown on the rear of the bus shall be in the form of a square with a 400 mm side. If national legislation prescribes a different sign, for example, "Children", that sign may be used on vehicles carrying children, instead of the "School bus" sign.
The Table 1 above (column bus plate height) shows that a 400 mm school bus sign can cater for about 20km/h of speed difference between a school bus and the surrounding traffic. In 30km/h speed restriction zones, this UNECE ITC recommended size is inadequate if the bus is not moving, but it could suffice for drivers following a bus, because the difference between the bus and following car would be lower than 20km/h, prolonging viewing time.
In 50km/h speed restriction zones (see above table), a 1.97 times larger dimension would be required if a stopped bus is approached by a driver. Viewing time would be too short to comprehend the sign quickly enough. Still, 400mm might be adequate for traffic following a moving school bus.
70km/h speed restrictions: 400mm by 400mm would need to be multiplied by 2.55 to cater for this speed limit. A sign on a stopped bus cannot be comprehended. Again, for traffic following a moving bus, 400mm might suffice.
Turning to the special issue of traffic moving in the opposite direction of a moving bus, speeds of both vehicles are summed together, generating very high speeds, which allow only for a very short viewing time. For instance, if a car moves in one direction at 70km/h, and the school bus at 60km/h in the other, this sums up to 130m/h, which would require a sign dimension of 1718mm to discriminated- 4.3 times larger than 400mm.
SW2S_D5.5 final Pu Contract N. 233967
October 2011 25 IIID
It is to be taken into account that the above calculations are based on the school bus (stop) sign developed by IIID in Safeway2School, which is designed to be discriminable from large viewing distances, while other current practice examples (see figure below), would need to be considerably larger to bear the same discrimination level.
Left: Italian and (center) Austrian current practice. Right: SW2S school bus (stop) sign.
Figure 13: School bus sign: Required dimensions of current practice examples to meet SW2S performance in terms of discrimination
The white and red squares (size: 1 x 1 MoA) on the Italian and Austrian examples indicate possible critical details, as they are too small to be discriminated / too large to be perceived as an integral part of a graphical figure, as indicated by the law of proximity (Sternberg, 2003): “Spatial or temporal proximity of elements may induce the mind to perceive a collective or totality”.
Considering this factor, for the Austrian school bus sign, figures in column “bus plate height” would need to be multiplied by 1.45 (for 130 km/h = 2485mm instead of 1718mm, or 30km/h: 807mm instead of 557mm).
Summing up, there is only limited space available on school buses to attach signs with appropriate dimensions. Moreover, vehicles, which transport school children, come in various models and sizes. As it might be technically feasible to attach a 1278mm VMS to the rear of a large bus, it is impossible to put it on the front, where large sign dimensions would be required. And, as in many countries, school bus signs need to be detached or invisible if a bus is not carrying school children, manipulation of such kind have to be made possible by providing a manageable sign size. For this reason, by a project consortium decision, it was agreed that for further development in SW2S, a size of 500mm by 500mm would be supported.
SW2S_D5.5 final Pu Contract N. 233967
October 2011 26 IIID
(a) Light signals to issue warnings before a school bus sign becomes possible to be discriminated from its surroundings As such a small dimension can not have the required effect over large viewing distances (reminder: 500mm support up to: 32.084m viewing distance, while 100m viewing distance would be appropriate), it may be rightly assumed that, in order to draw a driver’s attention onto the school bus before the sign is close enough to be discriminable, a light signal should be issued by a school bus, according to UNECE ITC recommendation 2.2:
(b) If domestic legislation permits or requires the use of a signal consisting of the simultaneous flashing of all amber direction-indicator lights, in accordance with the provisions of paragraphs 39 and 42 of annex 5 to the Convention on Road Traffic (1968), such a signal should be used by all buses or other vehicles carrying schoolchildren while children are boarding or alighting.
(c) If national legislation so requires, vehicles transporting children shall display their passing lights during daylight hours.
Complementary, special warning lamps as described in ECE regulation 65 (United Nations, 2008) could be used for signalisation.
It should be added that it appears reasonable to not only employ light signals during boarding and deboarding, but during the whole process of stopping, initiated when the bus is starting to slow down to approach a stop. The signal remains on while stopped, and further on until the bus has reached travel speed again. The reason for this procedure is given by the need to prepare drivers of traffic surrounding a bus to adjust driving behaviour before the school bus sign becomes adequately visible, as it is (see above) too small to be discriminated from distances greater than 32 m. During ingress/aggress and departure, the signal informs drivers that children are now along the roadside or on the road.
If an LED based VMS school bus sign is used a standard sign, fabricated as sign plate and attached to a bus, as well as additional light signals might be dispensable. Due to the VMS's nature, it can emit light over long viewing distances, drawing a driver’s attention onto a bus, before the sign it is actually legible. In case of the sign on VMS is animated, conspicuity might be further enhanced.
1.2.7 School bus stop signage dimensions
1.2.7.1 Danger warning sign “children” Considering the vulnerability of school children while waiting on a school bus at a sometimes more, sometimes less, safe school bus stops, it seems advisable to put up a danger warning sign “children”, as provided by the Vienna convention on road signs and signals, but using the discrimination-enhanced children pictogram developed in SW2S, instead of the Vienna Convention’s symbol “A, 13”.
SW2S_D5.5 final Pu Contract N. 233967
October 2011 27 IIID
Left: Austrian current practice (Bundesministerium für Wissenschaft und Verkehr, 1998). Red squares (size 1 x 1MoA) on pictogram indicate some critical details
Right: SW2S danger warning sign “children” in accordance with the Convention on Road Signs and Signals (United Nations, 1968) symbol A, 13.
Figure 14: Danger warning sign “children”: Required dimensions of Austrian current practice example to meet SW2S performance requirements (MoA size) in terms of discrimination
Still, not all school bus stops in all European countries are dangerous and in order not to confuse any danger warning sign “children” with a school bus stop, it was decided to use, for marking/signalisation of stops, the school bus sign as well, following Italian practice. The SW2S developed danger warning sign “children” may additionally be put up in proximity to a school bus stop, in case additional warnings are required, in size(s) according to respective national law. As the SW2S danger warning sign is designed to outperform, in terms of discrimination, any nation’s current practice example, safety, given by an earlier adjustment of a motorist’s driving behaviour, would be improved, compared to the current situation.
1.2.7.2 School bus stop sign The sign to actually signal a school bus stop has been decided (see above) to be the one used on school buses. Being attached to a post, shelter or other related infrastructure, it is put up to mark the place where a school bus is supposed to stop.
The situation at a stop is different to the one faced when a sign is attached to a school bus: at the stop, the posted sign remains static, which means that only the speed of a driver’s passing vehicle has an impact on viewing time, viewing distance, and through this, on sign dimension.
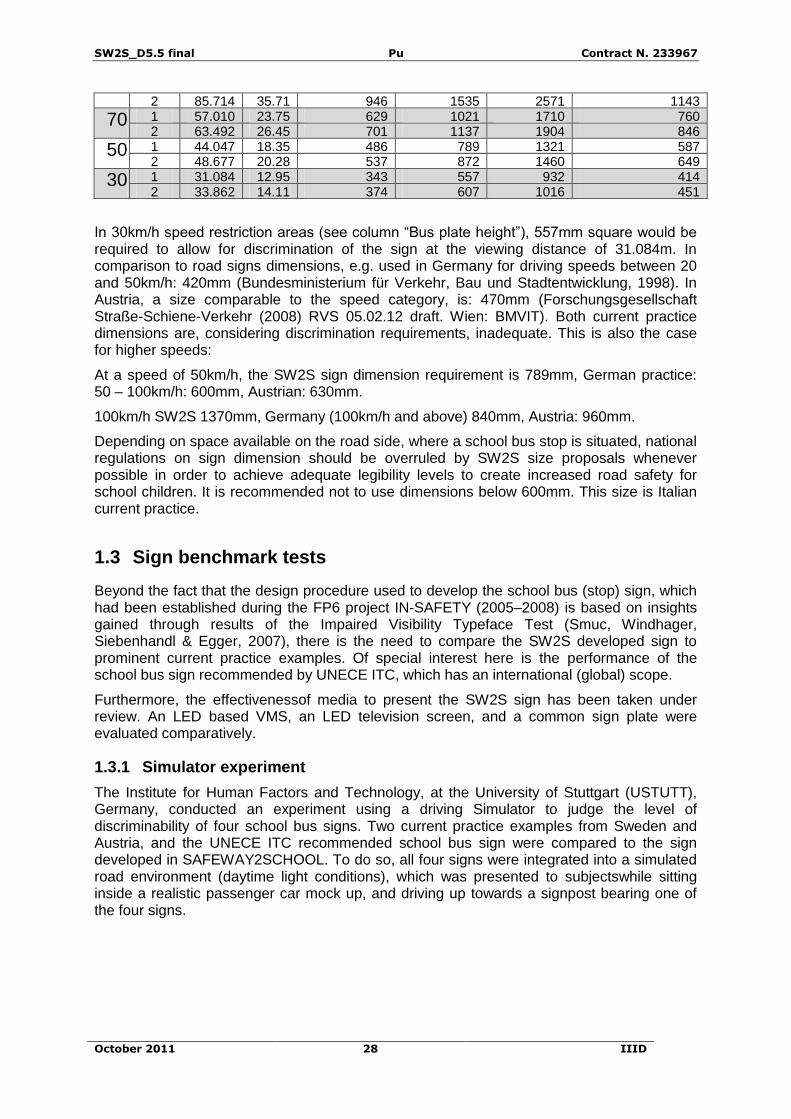
Table 2: Possible MoA / sign size dimensions (excerpt, complete table: see above)
In 30km/h speed restriction areas (see column “Bus plate height”), 557mm square would be required to allow for discrimination of the sign at the viewing distance of 31.084m. In comparison to road signs dimensions, e.g. used in Germany for driving speeds between 20 and 50km/h: 420mm (Bundesministerium für Verkehr, Bau und Stadtentwicklung, 1998). In Austria, a size comparable to the speed category, is: 470mm (Forschungsgesellschaft Straße-Schiene-Verkehr (2008) RVS 05.02.12 draft. Wien: BMVIT). Both current practice dimensions are, considering discrimination requirements, inadequate. This is also the case for higher speeds:
At a speed of 50km/h, the SW2S sign dimension requirement is 789mm, German practice: 50 – 100km/h: 600mm, Austrian: 630mm.
100km/h SW2S 1370mm, Germany (100km/h and above) 840mm, Austria: 960mm.
Depending on space available on the road side, where a school bus stop is situated, national regulations on sign dimension should be overruled by SW2S size proposals whenever possible in order to achieve adequate legibility levels to create increased road safety for school children. It is recommended not to use dimensions below 600mm. This size is Italian current practice.
1.3 Sign benchmark tests
Beyond the fact that the design procedure used to develop the school bus (stop) sign, which had been established during the FP6 project IN-SAFETY (2005–2008) is based on insights gained through results of the Impaired Visibility Typeface Test (Smuc, Windhager, Siebenhandl & Egger, 2007), there is the need to compare the SW2S developed sign to prominent current practice examples. Of special interest here is the performance of the school bus sign recommended by UNECE ITC, which has an international (global) scope.
Furthermore, the effectivenessof media to present the SW2S sign has been taken under review. An LED based VMS, an LED television screen, and a common sign plate were evaluated comparatively.
1.3.1 Simulator experiment
The Institute for Human Factors and Technology, at the University of Stuttgart (USTUTT), Germany, conducted an experiment using a driving Simulator to judge the level of discriminability of four school bus signs. Two current practice examples from Sweden and Austria, and the UNECE ITC recommended school bus sign were compared to the sign developed in SAFEWAY2SCHOOL. To do so, all four signs were integrated into a simulated road environment (daytime light conditions), which was presented to subjectswhile sitting inside a realistic passenger car mock up, and driving up towards a signpost bearing one of the four signs.
SW2S_D5.5 final Pu Contract N. 233967
October 2011 29 IIID
Left: SW2S sign. Center left: Swedish current practice. Center right: Austrian current practice. Right: UNECE ITC recommendation.
Figure 15: Simulator tested school bus signs. SW2S and Swedish example perform best
All signs were provided at equal dimensions. Test persons were asked to verbally respond when they were close enough to “see” the sign, which allowed for the measurement of the remaining distance to the signpost in order to evaluate which sign was clearly visible earliest (=over longest viewing distance). After completing the task, subjectswere requested to try and verbalize which criterion made the sign visible to them. Through given answers, USTUTT proposed conclusions on the requirements for the early (long viewing distance) visibility of signs:
a) the amount of black on the sign: it should be enough black to have a high contrast so the drivers are able to see the pictogram earlier
b) the clear outlines of persons and the perceptibility of 2 persons: details disturbing the perceptibility, clear outlines are better to identify the pictogram as persons. It is also helpful to separate the persons clearly.
c) clear difference between a tall and a small person: due to the knowledge of the meaning "tall and small person on a sign" this difference is necessary to identify the pictogram as school bus sign.
These conclusions require interpretation:
a) Relates to the need of the graphical figures to be drafted using sufficient stroke width of graphical elements, to allow for a clear differentiation of the essential parts of a graphical figure from the background. Regarding the notion of “contrast”, it can be stated that both signs performing best (SW2S and Swedish), bore a lighter background colour (more yellow) than the inferior two (orange), thus providing the predominant signs with slightly better contrast.
b) Clearly, this relates, in some part, to the expectations of subjects who are familiar with the German school bus sign because it is taught in driving school and has been witnessed numerous times on the road. As the (international) UNECE ITC recommends, it displays two children. “Details disturbing perceptibility” and “clear outlines” touch the concept of designing graphical figures without unnecessary details, which take up available space, which is better used for adequate (large enough) dimensions of 1) essential graphical elements and 2) separating space between the elements and graphical figures.
c) This comment is again connected (see (b), above) to the appearance of the school bus sign we are used to. Drafting the SW2S sign in the same manner seems appropriate.
To conclude, in the creation of the SW2S school bus (stop) sign, all requirements identified above were fulfilled, which is why it performed as expected in the simulator experiment.
1.3.1.1 Results The SW2S sign, along with the Swedish, performed best. No distinction between the two could be measured, due to the screen display resolution of the simulator facility, which is lower than the human eye can perceive. This had a “blurring” effect on precise viewing distance calculation. Even though the Swedish example uses a considerably larger “children” pictogram, it did not outperform the SW2S sign, which is clearly a positive statement about
SW2S_D5.5 final Pu Contract N. 233967
October 2011 30 IIID
the quality of its design. This result verifies the validity of the methodology used in the development of the school bus (stop) sign.
The current practice sign from Austria turned out next best, which can be tracked back to several issues concerning the design of the pictogram: many, non-essential details, like ponytails, hairstyle, book bags, skirt, sleeves, shoes and pants, do not support comprehension of the pictogram, but blur and merge. These reduce the sufficient blank space between graphical figures and elements, such as arms and legs, which are not presented in a distinctive way, generally obscuring the figures shapes, which hinders easy comprehension of the pictogram as “children”.
The UNECE ITC recommended sign performed worst. It lacks quality as described above in the comments on the Austrian example, but in an intensified way- graphical elements important for the correct perception are even less well defined and distinctive. Adding up to the list of issues, the pictogram’s dimension is lower than on any other of the three signs. Being the body for issuing international recommendations on signs used on roads, UNECE ITC should be notified.
1.3.2 Display media comparison test
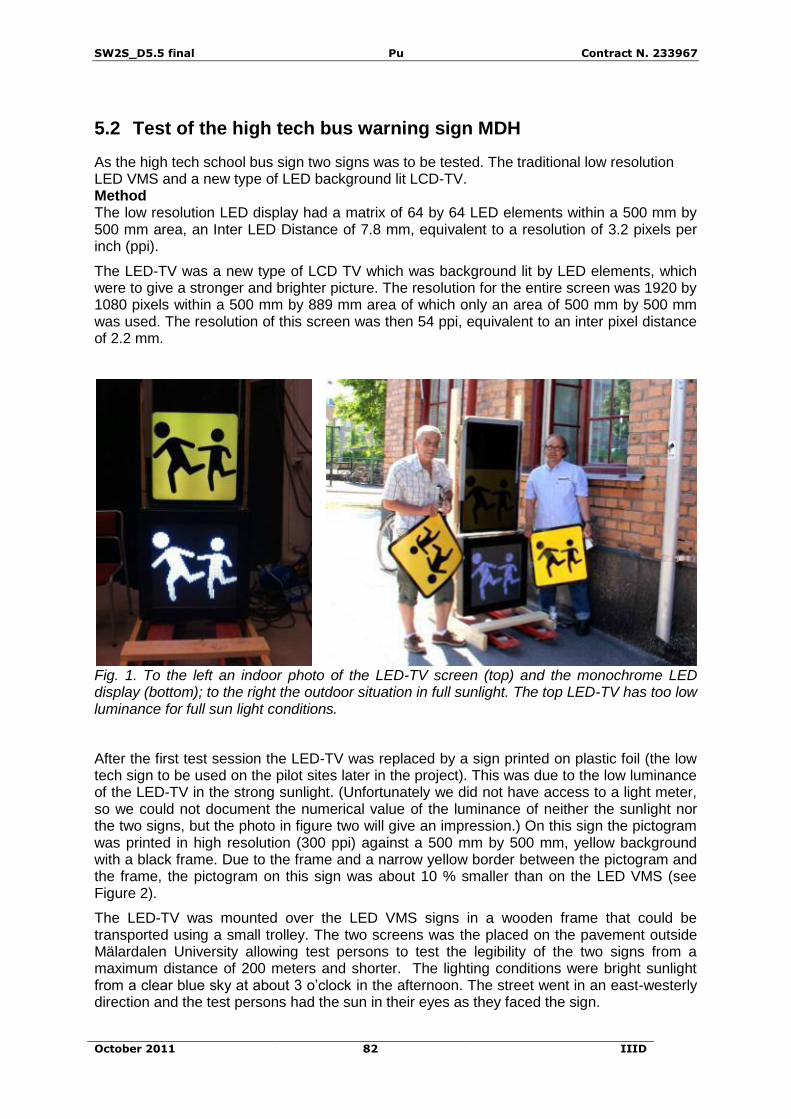
After the SW2S school bus (stop) sign was developed and positively evaluated in an artificial environment, it was due to be tested in a more realistic situation because the simulated light situations in the USTUTT driving simulator facility is not able to take into account real life light conditions. The simulator works at a set luminance - light is evenly emitted by projectors and back-lit screens present the simulation to a test person. This set up is relatively comforting to the human eye, which is not challenged by glare, high intensity luminance, or reflection of light from a passive (not illuminated) object. Accordingly, the use of the sign on VMS or on a sign plate, and the eventual effects caused to the eye/person can only be explored if tested under real (extreme) lighting conditions. To do so, the following set up was realised by Mälardalen University (MDH):
Three media to display the school bus (stop) sign-
A sign plate, made from metal. The sign is attached as adhesive, reflective sheeting material. Not fitted with its own artificial light source, it relies on other light sources, such as the sun or a motorcar’s headlights, to remain visible. The sign plate represents a low-tech alternative, which is inexpensive to produce.
A VMS display, bearing the most powerful white Light Emitting Diodes (LED), arranged in a 64 by 64 units matrix. The VMS display method is the most expensive, and probably the most effective over long viewing distances.
One LED-illuminated TV flat screen display, to possibly be a less expensive alternative to VMS.
Figure 16: Sign displayed on TV, VMS and sign plate
All display media have a common dimension of 500mm square, displaying the SW2S school bus (stop) sign. The sign’s appearance shown on VMS deviates form the sign presented on the other two media. On VMS, only the pictogram is shown, making full use of screen size, to the effect that the pictogram – the two children – is 20.7% larger than on the sign plate and the TV screen to be tested.
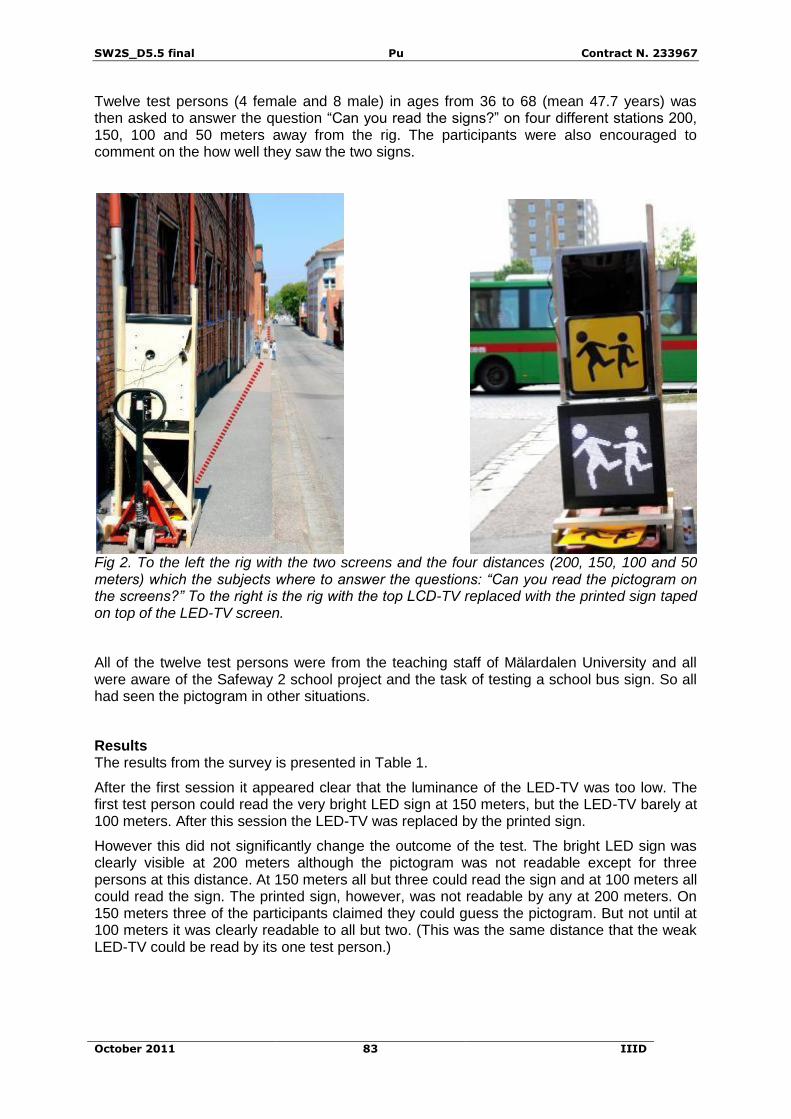
The display media were placed outside, at daytime and bright sunlight conditions in such a way that test persons had to face the sun while looking at the displayed sign, challenging luminance of media and the visibility performance of the sign. Subjects were asked to view the three media from 200, 150, 100 and 50m, and tell when if they were able to “read” the sign.
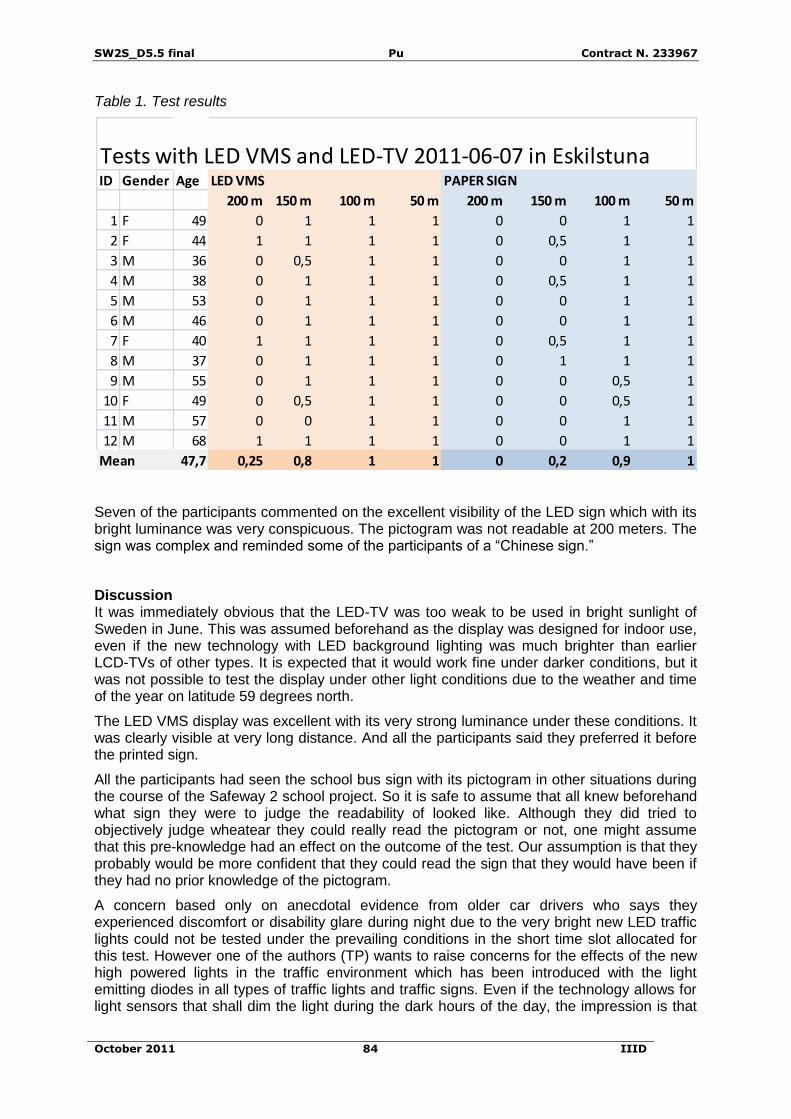
1.3.2.1 Results At extreme viewing conditions (200 meters), only 3 out of 12 test persons commented that they could discriminate the sign on VMS. The other media were unable to even project the sign over that distance. Because the TV screen display did not operate superior to the sign plate, TV was omitted from further testing.
Only at 100m viewing distance, scores of 100% (VMS), and 90% (sign plate) confirmed that the sign was legible. Still, it needs to be considered that subjects were not able to fully confirm that they had really discriminated the sign, as all of them had been familiar with its appearance through their involvement in the SW2S project.
It is remarkable that the VMS sign’s pictogram, being 20.7% larger than those used on sign plate and TV, gave only a slightly better performance. Also viewing distances are much greater than previously calculated, because the test could not take into account Annex III of Council Directive 91/439/EEC on driving licences (European Commission, 1991), where drivers are allowed to have a visual acuity of 0.5, nor the 0.73 taken on in this report for MoA dimension calculation.
In low light conditions such as during night time, the TV display might have succeeded over the sign plate. Also, it is most likely that the VMS, due to its strong luminance, may cause problems with glare when a driver is close to it. Considering this, it is essential have sensors in place which dim VMS light intensity in relation to the global light situation.
SW2S_D5.5 final Pu Contract N. 233967
October 2011 32 IIID
The relevant test report is provided as an attachment to this report: MDH test of the high tech bus warning sign (Porathe, 2011) in Annex 5.2.
1.4 Sign design
1.4.1 Design principles to be followed
1.4.1.1 Consistency of MoA dimension in every element In order to create a sign that is reliably discriminable in time/size/movement critical situations, requirements constituting the dimension MoA (Minute of Arc), have to be followed as explained before in this report (section 1.2.5.1 “Minute of Arc (MoA)”). By adhering to MoA dimension, every graphical element and figure of the school bus (stop) sign can be designed in such a way that “legibility” of every element is secured, thus allowing drivers to spot the sign, understand it, and react accordingly and in time to avoid possible collisions with school children.
Left: Sign
Center left: Black enclosure and yellow background
Center right: Pictogram consisting of graphical figures
Right: Graphical figures consisting of graphical elements Figure 17: Definitions: Sign, enclosure, pictogram, graphical figure and element
1.4.1.2 Consistency of vector- and matrix based design Now that it is clear that MoA has to be consistent in every element of the sign, it is essential to secure this consistency on as many forms of application as possible. This necessitates consideration of what the requirements of prospect applications would be. Reasonably, in the previous section, media to display the sign were explored- some were matrix based (coarse resolution with VMS LED and high resolution of a TV screen) while the adhesive sheeting material used on sign plates is vector based (virtually in high resolution available only, as up- or downscaling of a sign can be done without quality loss). The solution is a common principle that provides one common denominator to design for any matrix and vector based media. This section explains how this to be done. Generally speaking, rules of vector-based design can be adapted to obey 1) MoA and 2) pixel design requirements.
SW2S_D5.5 final Pu Contract N. 233967
October 2011 33 IIID
1.4.2 Matrix design according to MoA
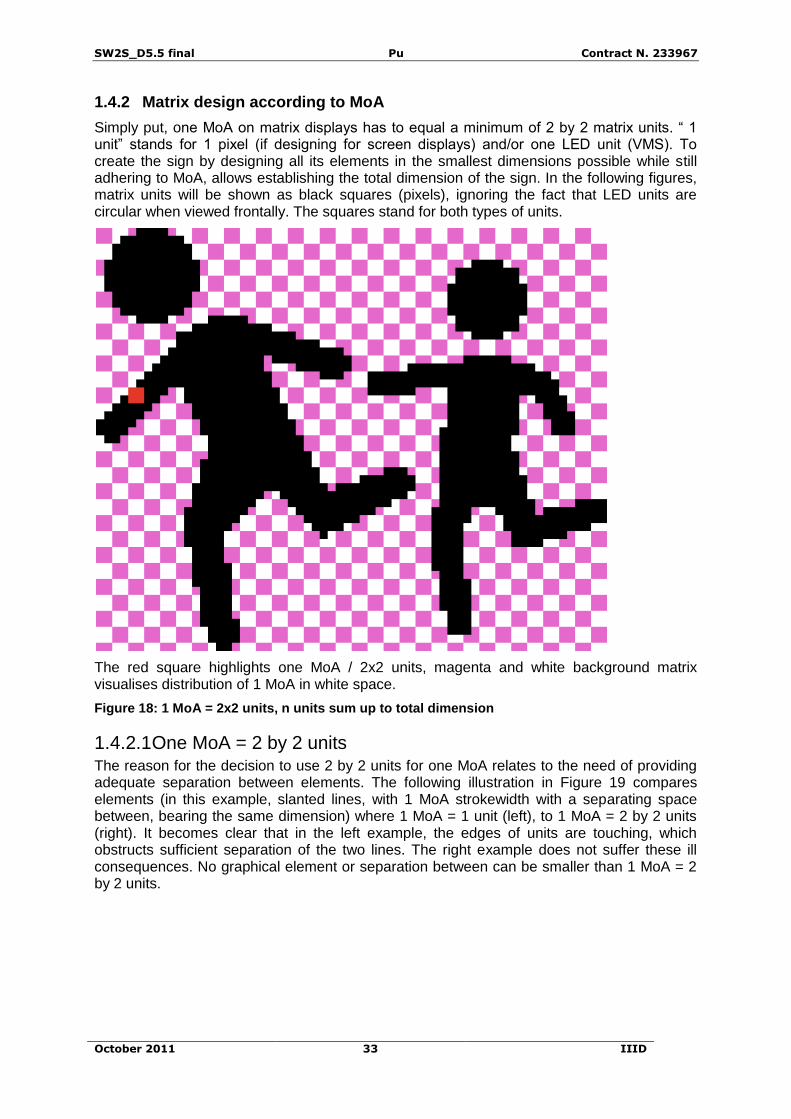
Simply put, one MoA on matrix displays has to equal a minimum of 2 by 2 matrix units. “ 1 unit” stands for 1 pixel (if designing for screen displays) and/or one LED unit (VMS). To create the sign by designing all its elements in the smallest dimensions possible while still adhering to MoA, allows establishing the total dimension of the sign. In the following figures, matrix units will be shown as black squares (pixels), ignoring the fact that LED units are circular when viewed frontally. The squares stand for both types of units.
The red square highlights one MoA / 2x2 units, magenta and white background matrix visualises distribution of 1 MoA in white space.
Figure 18: 1 MoA = 2x2 units, n units sum up to total dimension
1.4.2.1 One MoA = 2 by 2 units The reason for the decision to use 2 by 2 units for one MoA relates to the need of providing adequate separation between elements. The following illustration in Figure 19 compares elements (in this example, slanted lines, with 1 MoA strokewidth with a separating space between, bearing the same dimension) where 1 MoA = 1 unit (left), to 1 MoA = 2 by 2 units (right). It becomes clear that in the left example, the edges of units are touching, which obstructs sufficient separation of the two lines. The right example does not suffer these ill consequences. No graphical element or separation between can be smaller than 1 MoA = 2 by 2 units.
SW2S_D5.5 final Pu Contract N. 233967
October 2011 34 IIID
Figure 19: 1 MoA = 1 unit, compared to 1 MoA = 2 by 2 units. 2 by 2 prevails.
1.4.2.2 Avoid uneven straights Outlines forming graphical elements have to be created out of straights, which are formed by chains of an even and repetitive number of units. Through this practice, straights (elements) can be more clearly defined (right) and distinctively shaped, compared to when this rule is ignored (left).
Lines forming uneven number of unit chains Lines forming even number of unit chains
Figure 20: Even straights support distinctive shapes
1.4.2.3 Separation In case a sign’s pictogram to be created consists of more than one graphical figure, these must be sufficiently separated from each other. This dimension separating the graphical figures needs to be larger than the dimension separating a figure’s elements. This procedure follows the Law of Proximity’s principles.
1.4.3 Adjusting vector design methods to matrix/MoA requirements
The constraints of matrix-based design provide the means to develop any sign or pictogram according to MoA in a controlled and calculable way. By applying these principles to vector based design, its qualities can be taken advantage of in non-matrix graphics. In order to do so, it is recommended to simultaneously design for matrix/vectors. There are several
SW2S_D5.5 final Pu Contract N. 233967
October 2011 35 IIID
computer applications on the market that are able to facilitate such a procedure. Most standard vector design programmes allow for switching measurement settings from regular millimetre or inch units to pixel units. Snap to grid functionality further support vectors with pixel (matrix) accuracy.
Figure 21: Vectors used according to matrix design method revealed
In addition to the design rules for matrix-based development, another needs to be considered in the simultaneous matrix/vector design process:
1.4.3.1 Use basic shapes to construct graphical elements Basic shapes such as circles (e.g. to form the “head” of a figure), ovals to form rounded parts of a graphical element such as the “shoulder” area, or rectangles/squares should be used. It is essential that the shapes have been snapped-to- (pixel units) grid in order to convert them accurately to pixels (matrix units).
1.5 School bus (stop) sign / signals – results
Relying on the findings described in previous sections, a sign to mark school buses and school bus stops was developed. Based on the dimension of one MoA, the sign is geared to provide maximum legibility (discriminability) to motorists, to put them into a position in which they can react earlier and more appropriately than possible with current practice school bus (stop) signs, thus providing heightened safety for school children. Recommendations on sign dimensions, which are required to cater for low visual acuity of 0.73 (visual acuity of drivers can be as low as 0.5, according to Annex III of Council Directive 91/439/EEC of 29 July 1991 on driving licences (European Comission, 1991), have been provided in previous sections. The design methodology according to MoA has been approved in tests.
Up to today, no existing road sign has been (purposely) prepared for the needs of drivers with visual acuity this low, partly because actual sign dimension would be exceedingly large.
SW2S_D5.5 final Pu Contract N. 233967
October 2011 36 IIID
Visual acuity of 0.73 was established to work in favour of the group of motorists with low vision, while actual sizes remain workable. The MoA based design of the sign is the framework allowing for long range visual discrimination while keeping the sign’s dimension to a minimum, which is also the reason for its presumably excellent performance when displayed in (extremely) small scale, e.g. on maps, etc.
In order to achieve total harmonisation of the sign and, most importantly, its pictogram, it is provided for applications requiring vector based templates (e.g. for sign plates), and for matrix/pixel based application (e.g. for VMS and screen displays on computers or in-car navigation systems). By harmonising the pictogram not only on applications to be encountered directly on roads, such as road signs (e.g. danger warning sign “children”), but also including related systems such as digital maps or navigation services, the pictogram would be provided with the quality of being instantly understood, where/whenever it is shown. The school bus (stop) sign, which in general is much less seen than the prominent danger warning sign “children”, would profit greatly from “total” harmonisation.
Templates for vector/matrix applications are provided, attached to this report, ready for use for the applications described below.
1.5.1 School bus (stop) sign for vector application on sign plates
In principle, the new SW2S sign closely relates to the UNECE ITC recommended school bus sign: two children shown within a black enclosure, but the superior performance in terms of children’s safety on the road is confirmed by a simulator experiment, done within the framework of this project, by USTUTT. As an addition, the sign bears a white rim with a stroke width of one MoA, which has been put into place to better distinguish the sign from the background behind it. This way, a school bus may have any colour, but the sign is less likely to be “overlooked”. If it is attached on a signpost at a school bus stop, the (for an approaching car driver) ever-changing environment in the background is clearly separated from the sign by the white rim, increasing conspicuity. The efficiency of a prominent white outline may be witnessed when driving through Germany, where it is standard on every road sign.
Background colour of the sign: unlike many current practice examples found in countries around the world, as shown in the Survey on school bus- and school bus stop pictograms in use (Egger, 2010) Annex 5.1, the background colour on which the black pictogram is displayed should not be orange, but yellow, in order to provide more contrast to the pictogram. It is proposed to use, for sign plate application, retro-reflective sheeting material.
Sheeting material colour recommendations:
For Black: RAL 9017 Traffic black
For yellow, there are two possibilities:
o RAL 1026 Luminous yellow
o RAL 1016 Sulphur yellow
RAL 1016 is recommended by CEN 1789 (Committee on European Standards, 2007)t o be used for Emergency vehicles. In Wikipedia (2008, http://en.wikipedia.org/wiki/CEN_1789), it is said about that colour:
“The standard specifies that all ambulances will be painted yellow, with specific colour standards, as their primary body colour. The colour yellow was chosen primarily because it remains visible to almost all people in all lighting conditions, including the majority of those with colour-blindness.”
“… In fact, almost 99 percent of all colour vision deficiency involves some form of red-green colour blindness, and includes an estimated 7-10 percent of all males,
depending on location. However, even for these individuals, the colour yellow is always visible …”
Figure 22: School bus (stop) sign, for vector-based application, RAL 1016.
In case the sign is used at a school bus stop and it is required to additionally indicate a bus stop or road name, this results in a combined school bus stop sign (see figure below). The typeface to be used for the text should be according to national regulations. If this is not mandatory, the typeface “Tern”, which has been developed following the design principle of MoA, should be used as proposed in Proposal on unified pictograms, keywords, bilingual verbal messages and typefaces for VMS in the TERN (Simlinger, Egger & Galinski, 2008).
Figure 23: Examples for a combined information school bus stop sign post
Such a combined sign, depending on national legal requirements, could be (see example above in Figure 22 and Figure 23):
a) the school bus stop sign fabricated as an individual sign plate, together with an additional plate display the required text indication.
b) the school bus (stop) sign and text are placed one sign plate
c) as (b) but an additional bus pictogram (see figure below) accompanies the text
SW2S_D5.5 final Pu Contract N. 233967
October 2011 38 IIID
Of course, nothing should prohibit the use of the school bus (stop) sign without any ancillary information displayed.
Figure 24: Bus pictogram ISO 7001 / In-Safety
1.5.2 School bus (stop) sign for matrix application on VMS
1.5.2.1 Variable Message Signs (VMS) For VMS, which use Light Emitting Diodes (LED) technology, special formats have been prepared to cater for different types of VMS. One is of “static” display capacity, meaning it can only show a “message”, that is, when switched on. The other may display “animated” content, thus superimposing a flashing warning element, the “danger warning triangle” on the pictogram. This is used to draw attention to the danger of the situation, during which it is meant to be displayed.
Both VMS types bear monochrome LEDs, of white colour, if the VMS is mounted to the front of a school bus, and amber, when attached to the rear, according to the Convention on Road Traffic (United Nations, 1968), Article 32, Rules of the use of lamps:
"15. In no circumstances shall a vehicle display a red light to the front or white light to the rear, subject to the exemptions mentioned in Annex 5, paragraph 61."
For use as a two colour VMS, according to current, road related VMS practice of signalling (red for the triangle and white for the pictogram), to be put up along the roadside, a template has been provided as well. Signs have been prepared for VMS with a 64 by 64 matrix.
The sign may be shown statically. If technically possible, it may continuously turn on/off to attract additional attention.
Figure 25: VMS school bus (stop) sign, monochrome (amber or white)
SW2S_D5.5 final Pu Contract N. 233967
October 2011 39 IIID
Figure 26: VMS school bus (stop) sign, animated (2 frames), monochrome (amber or white)
Figure 27: VMS school bus stop sign, animated (2 frames), two colours: white and red.
Table 3: VMS sign animation frames and duration. File names.
No. Frame 1, 2
Duration (seconds)
A
no animation
See file: SBS_VMS-A.bmp
Children pictogram constantly visible
B
0.4 s
0.1 s
See file: SBS_VMS-B.gif Children pictogram flashing fast
C
0.3 s
0.7 s
See file: SBS_VMS-C.gif Danger warning triangle superimposed on children pictogram
SW2S_D5.5 final Pu Contract N. 233967
October 2011 40 IIID
No. Frame 1, 2
Duration (seconds)
D
0.3 s
0.7 s
See file: SBS_VMS-D.gif Danger warning triangle superimposed on children pictogram
1.5.2.2 In-car navigation systems / digital maps As previously explained, it would be ideal to harmonise the school bus (stop) sign, respectively its pictogram, in a variety of applications to help enhance and speed up the learning process of the public concerning the new sign. For systems employing digital maps to provide a specific service, the sign’s pictogram needs to be able to be shown as small as possible, while remaining discriminable. In the figures below, pictograms currently used by navigation services provider tomtom and Googlemaps, meant to convey the meaning “children” are presented, along with SW2S pictograms adjusted to bear the same vertical dimension. In order to allow for a substitution- the relevant files are available. Googlemaps and tomtom should be approached to pave the way for implementation of the SW2S pictogram in this sector.
Figure 28: Current practice navigation systems/digital map services to be substituted
Height: 38pixel Height: 16pixel Height: 12pixel
Figure 29: Proposed SW2S pictograms for digital map services / (in-car) navigation systems
1.5.3 Danger warning sign “children” for vector application on sign plates
The danger warning sign “children”, developed in SW2S is another measure to attempt wide spread harmonisation of the children pictogram, as the danger warning sign and the school bus (stop) sign should bear exactly the same depiction of the two children, because both signs meanings follow the same purpose: to alert on the fact that children are endangered. To have only one pictogram for all warnings/signs related to children makes the message distinctive, and the pictogram well know, which supports discrimination and comprehension.
The use of the pictogram on the danger warning sign “children” brings the added by the pictogram’s higher legibility value (visual discriminability), which is 177% higher (see section “School bus stop signage dimensions”) than current practice examples. As in the school bus (stop) sign, a white rim, with a stroke width of one MoA is added in order to better differentiate the sign’s outer shape to the background.
SW2S_D5.5 final Pu Contract N. 233967
October 2011 41 IIID
Figure 30: Danger warning sign “children”
1.5.4 Audible signs/signals
Mälardalen University (MDH) investigated the possibility of using an additional warning sound, issued to surrounding traffic during high-risk situations where school children are in danger of being injured. Such a scenario would be posed during the process of children embarking/disembarking a bus.
The acoustic signal was meant to be sounded from school bus loudspeakers, but could also be used in future services of in-car navigation systems, issued inside a motorcar to the driver. Such future features could combine data of the position of a school, school bus stop etc. with information on times when children are expected to be there: when school starts, ends or even when breaks are due. If combined data are both positive, and the possibility of children nearby is given, the signal would be sounded, accompanied by the display of the danger warning sign “children”. In an even further advanced scenario, school children might be directly detectable by the in-car system.
Thomas Porathe of MDH describes his findings as such:
Sound is particularly effective to arouse attention and is therefore suitable as warning messages. For instance Kahn (1983) reported that sleeping participants responded faster to auditory fire alarms than either heat or smoke. Heat or smoke only woke up the participants in 75 % of the time while a sound alarm woke them up 100 % of the time. General recommendations within the human factors research recommend using sound messages when:
The message is simple
The message is short
The message will not be referred to later
The message deals with events in time
The message calls for immediate attention
The visual system is overburdened
The receiving location is too bright or too dark or dark adaptation integrity is required
The person’s job requires moving about constantly
(Deatherage, 1972; Sanders & McCormic, 1992)
Two primary attributes of sound are frequency (measured in Hertz) and intensity (measured in decibel).
SW2S_D5.5 final Pu Contract N. 233967
October 2011 42 IIID
1.5.4.1 Warnings sounds in a traffic environment The sound environment might be very different from a big city with cars and screeching tramways to the peaceful country road. To make sure a warning sound is not masked by another environmental sound, the warning sound has to consist of several spectral frequencies. According to Patterson and Mayfield (1990), a warning sound has to be at least 15 dB(A) over the environmental noise for each of the spectral frequencies to ensure it is heard.
The following diagram from Patterson and Mayfield (1990) exemplifies the statement above and shows the warning sound in an airplane cockpit (see figure below).
Figure 31: Warning sound in an airplane
The best would of course be if the intensity (volume) of the warning sound could be varied with the intensity of the environmental noise.
Patterson and Mayfield (1990) also give the following general suggestion for the design of warning sounds:
The multiple frequencies are only one part of a good warning sound. The method of construction also contains components of tempo and intensity.
According to Patterson’s and Mayfield’s (1990) model, a good warning sound can be developed using three phases (see figure below):
1) Use frequencies and intensity to create a pulse
2) Compose several pulses into a burst.
3) Modulate the bursts on a time scale into the warning sound.
SW2S_D5.5 final Pu Contract N. 233967
October 2011 43 IIID
Figure 32: Scheme of a warning sound
In accordance with above findings, MDH created a warning sound, which was geared to warn children form running out in front, or behind a school bus during ingress/egress. In order not to compete and be confused with other sounds to be confronted with in a road environment, a very simple, “ticking” sound was used.
1.5.4.2 Conclusion Summing up, it is possible to warn school children and surrounding traffic with a sound signal. Without extensive evaluation, which would require complex road sound scenario simulations, it is inappropriate to provide a proposal for the use of the developed sound. This topic should be explored in further research, together with the possibility of creating a sound “sign” which, just like a visual sign, would identify a possibly dangerous situation for children. The sound “sign” would be sounded, for example, inside cars passing an area in which children are to be expected. Possibly a short melody, designed as a children’s song, could be implemented, using fewer, and specific notes compared to “regular” compositions. The melody might be more easily and quickly memorized and subsequently recalled and identified, providing a warning, whose meaning is readily understandable, prompting adequate reactions, such as adjustment of driving behaviour for the sake of children’s road safety.
SW2S_D5.5 final Pu Contract N. 233967
October 2011 44 IIID
Table 4: List of files ready for application
Attachment Document file name
School bus (stop) sign, 12 pixel, for use on Googlemaps SBSS_googlemaps12px.png
School bus (stop) sign, 16 pixel, for use in tomtom applications
SBSS_tomtom16px.png
School bus (stop) sign, 38 pixel, for use in tomtom applications
SBSS_tomtom38px.png
School bus (stop) sign 64 pixel, VMS, static SBSS_VMS-A.bmp
School bus (stop) sign 64 pixel, VMS, animated, monochrome
SBSS_VMS-B.gif
School bus (stop) sign 64 pixel, VMS, animated, monochrome, superimposed triangle
SBSS_VMS-C.gif
School bus (stop) sign 64 pixel, VMS, animated, 2 colours, superimposed triangle
SBSS_VMS-D.gif
School bus (stop) sign, vector application SBSS_3-3-8.ai
Pictogram “bus”, ISO 7001/In-Safety TernSymbol_3-3-2-21.ai
1.6 Recommendations
It is recommended to harmonise the SW2S sign on international level, by substituting the UNECE recommended school bus sign, and all national variations of it. Furthermore, all pictograms (which show two children) on the danger warning sign "children" should be substituted by the SW2S sign's pictogram, as it is legible from much larger viewing distances. Harmonisation of the pictogram should also lead to the substitution of related icons, currently used in in-vehicle navigation services, and electronic maps. Further recommendations are provided to support the effectivity of the warning.
Through its ability to be visible (discriminable) from greater viewing distances than current practice examples of school bus signs – viewing distances are 1.72 times greater than the Austrian example or 1.66 times greater than the Italian example – the SW2S sign provides car drivers with more time to adjust driving behaviour to an approaching situation in which children might be endangered. It must be emphasized that the UNECE ITC recommended school bus stop sign, which is the basis for international regulation, performs even less effectively, as proven in a driving simulator comparison test (see section “Simulator experiment”). UNECE ITC must be informed about its insufficient school bus stop sign, and should be supported in a possible decision to adopt the SW2S sign instead.
During research it became clear that not only the internationally recommended sign does not fulfil the requirements of today’s road situation, also dimensions of current practice school bus stop signs are inadequate. Most countries allow for 400 by 400 mm, which is, for motorists with poor eyesight (such as 0.73 visual acuity), only discriminable (legible) from very short distances. For example, the Austrian practice school bus sign is discriminable from 12.98 metres. Almost any driving speed would be to fast for a driver to adequately react. Numbers were calculated by comparison of numbers and figures provided in this paper.
None the less, if requirements of Annex III of Council Directive 91/439/EEC of 29 July 1991 on driving licences would be taken into full account, visual acuity 0.73 would not be used for
SW2S_D5.5 final Pu Contract N. 233967
October 2011 45 IIID
calculation, but rather 0.5, as this is the lowest eyesight a driver can have and still be eligible to have a driving license. If calculated with this perspective, the Austrian practice school bus sign could only be discriminated from 8.89 metres. Under these unacceptable circumstances the SW2S sign succeeds in being discriminated, at a dimension of 400 by 400 mm and with visual acuity of 0.73, from 22.32 metres.
During the progress of SW2S, a size of 500 by 500 mm was set in order to have a workable dimension for further development in the project. It may be presumed that this size will remain until the end of a project and become a recommendation, as dimensions larger than this, despite being required by road users, might be impossible to be implemented by bus service providers. At 500 by 500 mm, the SW2S sign, visual acuity 0.73, is discriminable from 27.9 metres, catering for speeds up to 27 km/h.
Summing up, taking into account the dimension increase from 400 by 400 to 500 by 500 mm, and the substitution of the current (e.g. Austrian) practice example, discriminated of the School bus (stop) sign is increased by 188%, in comparison to the UNECE recommendation, by 263%. This underlines that introducing the SW2S sign into real road environments is most appropriate and should be initiated.
Still, as this is catering only for speeds below 30 km/h, further research has to be done to tackle greater velocities.
Therefore, to support fast uptake and comprehension of the SW2S sign, it is proposed that harmonisation of it needs to be carried out, substituting all national forms of the current practice school bus signs. Furthermore, all nationally regulated forms of the danger warning sign “children” should be replaced by the one developed in SW2S, in order to harmonise its pictogram (which is the same as on the school bus (stop) sign) on international level, paving the way for an even more immediate comprehension. This is to be supported by the pictogram substituting icons in use in digital map- and (in-car) navigation services, which currently indicate areas where children are endangered.
Presumably, sound warnings to be used for children’s safety would prompt good results if used inside cars being sounded from in-car navigation devices, in case a situation mentioned above occurs. Other than when issued form a bus by loudspeakers to surrounding motorists, inside a car, the acoustic warning would not need to compete with street noise. It is advised to carry out further research on possible warning sounds, which should be composed like children’s songs, using few notes and only specific types of melodies, which should be short and jingle-like, in order to be easily memorised, and quickly identified when confronted with.
As we know that the school bus signs performance, though having been improved (see above), is still to small to allow for a timely comprehension at fast driving speeds, measures to draw attention to the centre of where children are to be expected should be implemented. In some countries, such as Austria, special (amber coloured) warning lamps are mandatory on school buses, and have to be activated while the bus is stopped and children are getting on and off. As these lamps light is conspicuous and visible long before the sign is in sight, they are proposed to be a mandatory asset of any school transportation vehicle. On school bus stops, the Amparo “see me” system might prove to be the adequate alternative.
In case VMS is used to display the school bus (stop) sign, additional warning lamps might not be required, as the high powered LEDs, being a strong light source, can be detected over at least 200 metres. If VMS display an animated sign, as proposed in this paper, conspicuity might be raised further. This can be combined with an additional (second) message, which, in short intervals, substitutes the SW2S sign. The 2nd message could be a speed limit.
SW2S_D5.5 final Pu Contract N. 233967
October 2011 46 IIID
2 Car driver device
The use of in-vehicle Intelligent Transportation Systems (ITS) in order to enhance safety has been the focus of research all over the world for many years (Noy, 1997; Barfield, 1998 and Carsten, 2005).
An ITS technology that turns out to have the potential of reducing accidents is the use of road signs in vehicle displays (Staplin, 1991; Hanowski, 1999; Lee, 1999; Luoma, 2002; Regan, 2004 and Caird, 2008). Staplin (1991), Hanowski (1999) and Caird (2008) found, that the use of road sign systems allows drivers to envisage upcoming events. Additionally the acceptance by drivers is given (Luoma, 2002 and Pierowicz, 2000). So the use of road signs is a common and accepted method of informing the driver about current traffic situations. Therefore the use of road signs in automotive Human-Machine-Interfaces (HMI) might be helpful protecting vulnerable road users and especially children on their way to school.
The development of HMI road sign systems needs special diligence. Depending on the location of such systems inside the car there is a need of taking the eyes off the road, which is can distract and increase the risk of an accident.
The aim of this chapter is developing a road sign system HMI that effectively protects vulnerable road users. First a state of the art describes today road sign systems. Afterwards the V-ISO process is used to develop a road sign system for the SW2S project to protect school children on their way to school.
2.1 State of the Art
A multitude of studies showed that road sign systems are an ITS technology with the potential to avoid crashes. However, these studies also show that there is no general agreement of the HMI design. In some studies a Head-Up display (HUD) was used in others the dashboard (DB), the center column (CC) or the infotainment display (IF).
Figure 33. Display positions for road sign systems.
Commercially available systems often use the DB or the CC to display road signs. For example the DB is used by the road signs system of Mercedes Benz.
SW2S_D5.5 final Pu Contract N. 233967
October 2011 47 IIID
Figure 34: Examples for current HMI of a road sign system (Daimler, 2011).
Road signs systems with the aim to inform the driver mainly use the CC to display the information, e.g. traffic information on navigation maps.
Figure 35: Road signs on a navigation map (Motor Talk, 2011).
Using the CC or IF to display information results in a higher distraction of the driver due to the longer period of eyes off the road. Moreover the driver needs to take the eyes off the road to check the status on the CC or IF. Checking the DB is a common task while driving. Therefore it is not effective to display road signs only in the CC, because this can increase the crash risk in critical situations. To inform the driver the CC is recommended. The position in the secondary field of view is less intrusive and so corresponding with the lower urgency of information messages. Due to the lower urgency the driver also has the possibility to choose an uncritical situation to look on the display.
HUDs are not widely spread in commercial use today. Therefore only DB and CC/IF are included in this research.
Based on this state of the art the HMI for a road sign system to protect vulnerable road users was developed within the iterative development process of the V-ISO model.
SW2S_D5.5 final Pu Contract N. 233967
October 2011 48 IIID
2.2 Development Methodology
The development process of the car driver device is based on the common SAFEWAY2SCHOOL methodology. This is a methodology that incorporates aspects of the v-model and the user centred design circle of ISO norm 13407. Fel! Hittar inte referenskälla. reveals the common aspects of the SAFEWAY2SCHOOL methodology and the preceding models.
The “V” remains and also the idea of defining requirements in the left branch and of checking if they are fulfilled on different levels on the right branch. However the right branch incorporates the idea of iterative optimization and re-design by describing the redesign circle of the ISO 13407 standard.
Figure 36: SAFEWAY2SCHOOL HMI development approach.
To follow this methodology it is necessary to define in an early phase the following success criteria:
High Level Objectives are described in “School bus (stop) sign requirements engineering” for the school bus (stop) sign, and in the section about the car driver device.
User Needs and the car driver device is also seen in this section
Functional and Technical Requirements are defined in “Deminsions for the sign” for the school bus (stop) sign and in the sections for the car driver device.
Design Requirements also defined in section “Sign design”, and “School bus (stop) sign / signals – results” for the school bus (stop) sign and in one of the section for the car driver device.
Based on those success criteria a first design attempt is created and iteratively optimized with users of the future system. Usually, multiple designs are proposed at the beginning of the design loop to identify the best design solution up front, so further specific optimization can be performed. When an appealing design has been found a prototype should be realized that incorporates the functions and technology. The prototype verification focuses on the fulfilment of the functional and technical requirements. The prototype is optimized until all requirements are met. In the next step the prototype is integrated into the complete system or infrastructure. It shall now not only work as a stand alone device but also in the context of use. Validation is carried out with users and with focus on the user needs. When the system fulfils the user needs in the use cases a general evaluation and appraisal of the system can be performed, following the question to what extent the system contributes to the high level objectives, e.g. increases road safety.
SW2S_D5.5 final Pu Contract N. 233967
October 2011 49 IIID
2.3 Requirements Engineering
According to the SW2S V-ISO development methodology the user centred design starts with requirements engineering on different levels. The following sections provide the requirements on each of those levels. High level objectives, user needs and use cases have been already defined in D5.1 and are listed here to present the very first steps of the requirements engineering process. The next steps, namely technical, functional and design requirements for the car driver device, are part of this deliverable and will be presented in this chapter.
2.3.1 High Level Objectives
For the Car Driver Device the following High Level Objectives are defined in D.5.1:
Drivers notice children with higher probability.
Drivers show reaction of safe driving and avoid critical situations.
Drivers adapt their speed according to the proposed safe speed.
Drivers react faster to hazards where children are involved.
Drivers do not overtake the bus when there is a danger to collide with children.
2.3.2 Use Cases and User Needs
The use cases and user needs have been taken from D1.3 and D5.1 and are presented here again in order to present the full requirements engineering.
Use Cases: The Car Driver Device is related to two Use Cases which are explained in detail in D1.3 – Use Cases. Both Use Cases belong to the Category 2 – Surrounding Traffic Information. Both Use Cases include two Scenarios. The following tables from D1.3 describe the Use Cases and the resulting requirements.
Table 5: Use Case 2.1.
Use Case No UC 2.1
Use Case Title Surrounding traffic information while en route
Priority level Essential Secondary Optional
Brief description
(user goal satisfied)
Reliable understanding of the traffic situation due to improved signalization to affect the behaviour of surrounding traffic to act according to law, or exceeding the requirements of the law for more safety.
Scenario (Basic course of action) Scenario 1: Surrounding traffic information while school bus en route
Priority level Essential Secondary Optional
System input (trigger) The school bus is realising its route and approaches to a school bus stop.
System output When a vehicle approaches a stopped or slow moving school bus there should be a clear warning to the driver of the vehicle indicating the presence of the stopped school bus.
When a vehicle approaches the school bus stop and school children are waiting, there should be a clear warning to the driver of the vehicle. The warning can be: flashing warning lights of the IBS, highlighted warning sign on the bus, in car warning (light or sound).
Resources required to perform A Child with a VRU unit. An Intelligent Bus Stop
A bus equipped with a School Bus Sign.
A V2I device for use inside the passing vehicle.
Quality of service indicators Speed decrease of passing vehicles when the warning system is active.
Drivers increase their attention.
Interaction steps Step 1: The school bus executes the programmed route. A proper designed school bus signal is placed on the front and the back of the bus that informs the surrounding traffic of the nature of this bus.
Step 2: The school bus approaches the bus stop and the surrounding traffic is informed for this action with a highlighted warning sign on the bus.
Step 3: The school bus is stopping at the bus stop and the surrounding
SW2S_D5.5 final Pu Contract N. 233967
October 2011 50 IIID
traffic is informed for this action with a highlighted warning sign on the bus as well as by the IBS flashing due to the existence of children and a in car warning.
Table 6: Use Case 2.2.
Use Case No UC 2.2
Use Case Title Surrounding traffic warning while children ingress-egress
Priority level Essential Secondary Optional
Brief description
(user goal satisfied)
When the children get in and off the school bus the drivers experience reliable understanding of the traffic situation due to improved signalization to affect the behaviour of surrounding traffic to act according to law, or exceeding the requirements of the law for more safety.
Scenario (Basic course of action) Scenario 1: School bus visible
As a vehicle driver I want to get information about the fact that there is a stopped or slow moving school bus visible ahead at a school bus stop and the possible ingress/egress of children.
Priority level Essential Secondary Optional
System input (trigger) The VRU approaches the IBS and reaches the active area of the IBS.
System output When a vehicle approaches a stopped (including stopping and leaving) school bus at an Intelligent Bus Stop there is a clear warning to the driver of the vehicle indicating the presence of the stopped school bus and the danger of children entering the road from both sites.
Resources required to perform A Child with a VRU unit.
An Intelligent Bus Stop.
A bus equipped with a School Bus Sign.
A V2I device for use inside the passing vehicle.
Quality of service indicators Speed decrease of passing vehicles when the warning system is active.
Drivers increase their attention.
Interaction steps Step 1: VRUs are waiting at the IBS.
Step 2: The IBS’s warning lights are activated.
Step 3: The School bus approaches the school bus stop.
Step 4: The School bus sign is activated.
Step 5: The School bus has stopped at the school bus stop (children ingressing/egressing).
Step 6: The School bus sign warns for a stopped school bus.
Step 7: A vehicle is approaching the bus stop.
Step 8: The in-vehicle warning device is activated.
Step 9: The School bus is leaving the school bus stop.
Scenario (Basic course of action) Scenario 2: School bus hidden
As a vehicle driver I want to get information about the fact that there is a stopped or slow moving school bus hidden behind a curve ahead at a school bus stop and the possible ingress/egress of children.
Priority level Essential Secondary Optional
System input (trigger) The VRU approaches the IBS and reaches the active area of the IBS.
System output When a vehicle approaches a stopped (including stopping and leaving) school bus at an Intelligent Bus Stop there should be a clear warning to the driver of the vehicle indicating the presence of the stopped school bus
Resources required to perform A Child with a VRU unit. An Intelligent Bus Stop.
A bus equipped with a School Bus Sign.
A V2I device for use inside the passing vehicle.
Quality of service indicators Speed decrease of passing vehicles when the warning system is active.
Drivers increase their attention.
Interaction steps Step 1: VRUs are waiting at the IBS.
Step 2: The IBS’s warning lights are activated.
Step 3: The School bus approaches the school bus stop.
Step 4: The School bus sign is activated but it is not visible from the surrounding traffic.
Step 5: The School bus has stopped at the school bus stop (children
SW2S_D5.5 final Pu Contract N. 233967
October 2011 51 IIID
ingressing/egressing).
Step 6: The School bus sign warns for a stopped school bus.
Step 7: A vehicle is approaching the bus stop.
Step 8: The in-vehicle warning device is activated.
Step 9: The School bus is leaving the school bus stop.
User Needs: The following table describes the User Needs and Requirements as mentioned in the focus groups.
Table 7: User Needs Car Driver Device.
User group No of function
User wishes (from focus groups
and workshops) (who-needs what-from whom-when-in order to..)
Description of system requirements
User affected by the function
Level of priority
(Mandatory-Optional)
Bus driver 5 As a bus driver I want passing vehicle to slow down in order to guarantee child safety.
The system shall make passing vehicles to slow down
Bus drivers, other road users
M
Road user 5 As a road user I want to know that children are present in order to be prepared.
The system shall make passing vehicles to slow down
Bus drivers, other road users
M
All new All stakeholders want the car drivers to be warned about dangerous locations along the way children are walking.
The system shall lead to adapted and safe speed of the surrounding traffic.
All
Bus driver new The bus drivers want communication and warning for a forthcoming stop of the bus.
The system shall warn drivers when a school bus is approaching a bus stop so they do not overtake.
Bus drivers, road users
Parents new Parents are worried about the behaviour of the other road users.
The system shall lead to adapted and safe speed of the surrounding traffic.
Road users
Traffic new As a car driver I want information when children are on the road in order to adapt my speed.
The system shall lead to adapted and safe speed of the surrounding traffic.
Road users
Traffic new As a car driver I want no information when no children are on the road or at the bus stop in order to select a different safe speed.
The system shall lead to adapted and safe speed of the surrounding traffic.
Road users
2.3.3 Technical Requirements
This section presents the technical requirements for the Car2X communication and for the warning inside the vehicle.
The technical requirements of the Car2X communication:
The technical requirements for detection of black spots (children at bus stops) and the wireless transmission of such information to the intelligent bus stop (road site unit) and the car (on board unit) are subject to SAFEWAY2SCHOOL WP3 and WP4. A short overview is given here.
For the detection of children near to a bus stop it is necessary to realize a data communication between the pedestrian and the bus stop. Technically this happens by
SW2S_D5.5 final Pu Contract N. 233967
October 2011 52 IIID
attaching two devices to the carriers: A road site unit (RSU) to the bus stop and a VRU-unit to the pedestrian. In SAFEWAY2SCHOOL the Amparo solutions VRU-unit is used which broadcasts data on a range of about 100m every few seconds and only when being moved. The electronics of the VRU-unit have following specifications:
Operating frequency MHz 433,92
Transmitter output mW <1
Battery voltage V 3,6
Battery capacity Ah 1
Service interval (change of batteries) years >1
A long life of the battery ensures that the device is working most of the time and function is not interrupted in times when the user is not taking care of changing the battery.
The road site unit (RSU) is integrated into the intelligent bus stop, receiving the signal from the VRU-unit. The RSU is powered by a solar panel and battery. It also transmits data to a central server and can be extended with a WLAN module to send data directly to the surrounding traffic. The surrounding traffic is equipped with on board units (OBU) to receive such data and use it for the in-vehicle driver warning.
Figure 37 displays the architecture of the communication assumed for the car driver information and warning.
or
Figure 37: Functionality of the Car2X communication for the SW2S car driver device.
2.3.3.1 Technical Requirements of a in car driver device The following references were taken into account for creating technical requirements to inform and warn car drivers:
EU Statement of Principles on Human Machine Interface for In-Vehicle Information and Communication Systems.
Lerner, N. D. [et al.] Preliminary Human Factors Guidelines for Crash Avoidance Warning Devices. NHTSA, 1996
• Stevens, A. [et al.] Design Guidelines for Safety of In-Vehicle Information System. TRL & DTLR, 2002
DIN EN ISO 15005 Road vehicles – Ergonomic aspects of transport information and control systems – Dialogue management principles and compliance procedure.
DIN EN ISO 15008 Road vehicles -- Ergonomic aspects of transport information and control systems -- Specifications and compliance procedures for in-vehicle visual presentation.
TR 1 “Visual displays should be designed and installed to avoid glare and reflections.“ (European Commission, 2006).
SW2S_D5.5 final Pu Contract N. 233967
October 2011 53 IIID
TR 2 If several systems are installed, the integrated application should consider the relative priority of its functions (DIN EN ISO 15005:2002).
TR 3 Application of Power
“Power should be applied to the warning device when the vehicle ignition switch is turned on even if the device is capable of being turned off manually during vehicle operation. This application of power should place the device into the standby mode of operation (e.g., device is receiving power, but sensors and warning interface are not activated). Any device which must be physically attached to or worn by the driver (e.g., driver alertness monitoring devices) is excepted. Such devices should be manually turned on by the driver, and should not be automatically turned on with the vehicle ignition switch.” (Lerner, et al., 1996).
TR 5 Failure of Multi-Sensor Devices
“For warning device displays that are capable of being activated by more than one sensor, the failure of any one of the sensors should be treated as a failure of the full device, and so indicated by the device’s status indicator(s).” (Lerner, et al., 1996).
TR 5 Fail Safe Design
“[…] warning devices should be designed to fail in a safe manner. Failure should not cause critical functions (e.g., automatic prioritization of detected hazards) to produce false warnings. Malfunctioning systems should be automatically placed in a failure mode. The failed condition should be displayed to the driver by means of a status indicator.” (Lerner, et al., 1996).
TR 6 Missing input data must not result in undefined system behavior or failure (DIN EN ISO 15005:2002).
TR 7 Prevention of False/Nuisance Warnings
“False warnings (i.e., those triggered by an inappropriate stimulus event) and nuisance warnings (i.e., those triggered by an appropriate stimulus event under conditions that are not useful to the driver) should be minimized without seriously degrading the hazard detection performance of […] warning devices.” (Lerner, et al., 1996).
“[…] warnings may be inappropriate because assumptions about driver, vehicle or environmental characteristics (e.g., reaction time, braking distance) make the timing of the warning inappropriate.” (Lerner, et al., 1996).
TR 8 Legibility:
“[…] warning displays should be legible at a glance. Display characters (e.g., alphanumerics, geometric shapes) should subtend a minimum visual angle of at least 12 minutes of arc.” (Lerner, et al., 1996).
“Testing should be conducted for specific displays to ensure that the display is legible for 95% of the expected driving population.” (Lerner, et al., 1996).
“To ensure legibility of information the designer needs to consider not only the position of the visual display, but properties such as brightness, contrast, size and resolution. These should be such that the displayed information is clearly legible during daylight and darkness and does not cause visual discomfort or distract the driver when not being directly viewed.” (Stevens, et al., 2002).
TR 9 Brightness (luminance, intensity)
“The brightness (luminance) of the overall display should appear uniform to drivers. […] The brightness of the display should be adaptable to changes in ambient light (e.g., day or night) to ensure that the display is legible in all ambient light conditions.” (Stevens, et al., 2002).
TR 10
Contrast
The contrast ratio […] describes the relation between the luminance of the foreground
SW2S_D5.5 final Pu Contract N. 233967
October 2011 54 IIID
and background. This should be at a minimum of 5:1 in night conditions, a minimum of 3:1 at daylight conditions and a minimum of 2:1 at sunlight conditions (DIN EN ISO 15008:2003). Stevens et al. (2002) recommends a contrast of 5:1 and mentions that too high contrast could cause problems of glare, while too low contrast slows down the reading process.
The ratio of average luminance of the display and of the surrounding (luminance balance) should not exceed 10:1 (Stevens, et al., 2002). Yet, higher values are often acceptable; at a ratio of 100:1, reading performance decreases slightly but yet significantly (DIN EN ISO 15008:2003).
Lf= Luminance of the foreground; Lb= Luminance of the background (DIN EN ISO 15008:2003)
“Reflections and glare visible to the driver […] reduce legibility and should be avoided for example through:
o Provision of a display brightness control
o Appropriate display surface texture and finish
o Appropriate colour choice
o Appropriate image polarity
o Use of recess or cowl
Designer should ensure that any reflections and glare reduction, or contrast enhancement techniques of this type, do not cause the display to contravene other relevant standards.” (Stevens, et al., 2002).
TR 11
Screen Image Stability
“The screen display should not vibrate or flicker to an extend where information becomes blurred […]. Vibration and flicker are likely to increase reading time and consequently the time required to complete the task and thus will increase visual distraction from the driving task.” (Stevens, et al., 2002).
2.3.4 Functional Requirements
Within the focus groups 4 functional requirements were emphasized:
FR 1 The system shall make passing vehicles to slow down.
FR 2 The system shall respect all relevant data privacy requirements
FR 3 The system shall respect all relevant safety regulations.
These requirements are complemented by some standard requirements out of:
EU Statement of Principles on Human Machine Interface for In-Vehicle Information and Communication Systems.
FR 4 “The system does not present information to the driver which results in potentially hazardous behaviour by the driver or other road users. “ (European Commission, 2006).
FR 5 “The system should not obstruct vehicle controls and displays required for the primary driving task.“ (European Commission, 2006).
SW2S_D5.5 final Pu Contract N. 233967
October 2011 55 IIID
2.3.5 Design Requirements
The following references were taken into account for creating a sample of general design requirements:
EU Statement of Principles on Human Machine Interface for In-Vehicle Information and Communication Systems.
Guidelines for the Design and Installation of Information and Communication Systems in Motor Vehicles – United Nations Report.
DIN EN ISO 15005 Road vehicles – Ergonomic aspects of transport information and control systems – Dialogue management principles and compliance procedure.
Campbell, J. L. [et al.] Crash Warning System Interfaces: Human Factors Insights and Lessons Learned. NHTSA, 2007
Since many guidelines are contained in more than one reference, only the most comprehensive one is chosen to be listed here. Only in a few cases further references are taken into account, providing additional information. Thus, the sample presented does not claim to be complete. For further information about specific topics, please refer to the relevant references. The design requirements presented in this section are numbered with preceding “DR”.
DR 1 “The system supports the driver and does not give rise to potentially hazardous behaviour by the driver or other road users.” (European Commission, 2006).
DR 2 “The allocation of driver attention while interacting with system displays and controls remains compatible with the attentional demand of the driving situation.” (European Commission, 2006).
DR 3 “The system does not distract or visually entertain the driver.” (European Commission, 2006).
DR 4 “Interfaces and interface with systems intended to be used in combination by the driver while the vehicle is in motion are consistent and compatible. “ (European Commission, 2006).
DR 5 “The system should be located and securely fitted in accordance with relevant regulations, standards and manufacturers’ instructions for installing the system in vehicles.“ (European Commission, 2006).
DR 6 Displays and interaction elements should be mounted in a manner that allows unobstructed performance of the driving task and system functions (DIN EN ISO 15005:2002).
DR 7 “No part of the system should obstruct the driver's view of the road scene.“ (European Commission, 2006).
DR 8 “Visual displays should be positioned as close as practicable to the driver's normal line of sight.“ (European Commission, 2006).
DR 9 “Visually displayed information presented at any one time by the system should be designed such that the driver is able to assimilate the relevant information with a few glances which are brief enough not to adversely affect driving.“ (European Commission, 2006).
DR 10 Individual dialogues with the system must be created such that the driver identifies the priority of presented information. (DIN EN ISO 15005:2002).
DR 11 The system should present visual information as long as necessary. (DIN EN ISO 15005:2002).
SW2S_D5.5 final Pu Contract N. 233967
October 2011 56 IIID
DR 12 “Information relevant to the driving task should be accurate and provided in a timely manner.“ (European Commission, 2006).
DR 13 “Information with higher safety relevance should be given higher priority.“ (United Nations Economic Commission for Europe, 1998).
DR 14 “The driver should always be able to keep at least one hand on the steering wheel while interacting with the system.“ (European Commission, 2006).
DR 15 “The system should not require long and uninterruptible sequences of manual-visual interfaces. If the sequence is short, it may be uninterruptible.“ (European Commission, 2006).
DR 16 “While the vehicle is in motion, visual information not related to driving that is likely to distract the driver significantly should be automatically disabled, or presented in such a way that the driver cannot see it.” (European Commission, 2006).
DR 17 “The behaviour of the system should not adversely interfere with displays or controls required for the primary driving task and for road safety.” (European Commission, 2006).
DR 18 “Information should be presented to the driver about current status, and any malfunction within the system that is likely to have an impact on safety.” (European Commission, 2006).
DR 19 How to Make Warnings Compatible with Driver Responses
“Warnings should:
be presented in a manner that is compatible with the driver’s desired vehicle control response,
induce an orienting response, where appropriate, causing the driver to look in the direction of the hazard, and
Adequately capture the driver’s attention without startling the driver.
Before attempting to link warnings with a specific driver response, designers should be:
Confident that the [warning] device (i.e., sensors, processors, DVI) is capable of determining the desired driver response with very high levels of accuracy and reliability.
Clear as to what kind of response (i.e., a perceptual response—looking in the direction of the hazard, or a motor response—braking or turning away from a hazard) the warning is intended to elicit.
Confident that the warning will indeed elicit the desired driver response under most driving situations and conditions.” (Campbell, et al., 2007).
Based on the use cases, user needs and the high level objectives these requirements can be supplemented by specific Safeway2School in car driver device design requirements:
DR 20 The system should give information about a critical situation around the car driver
DR 21 The critical area should easily identifiable by the car driver
DR 22 The information shall only be given when a hazard exists (no information is given if a hazard at this position could be possible)
DR 23 The information should be created to inform the car driver to slow down
2.4 Design, iterative and user centred development
Deduced from the technical, functional and design requirements and the State of the Art the following Safeway2School design guidelines were defined:
SW2S_D5.5 final Pu Contract N. 233967
October 2011 57 IIID
The information will only be presented when a hazard exists. For the Saveway2School in car driver devices the information will be presented if there are children within a radius of 50 m around a black spot or an IBS. Regarding to requirements FR 1, FR 2, FR 3, DR 10, DR 11, DR12, DR 15, DR 20, DR 21 and DR 22.
The information has to be designed in the way to give the driver early information where the black spot and/or the bus stop is. Regarding to requirements DR 1, DR 2, DR 9, DR 10 and DR 21.
The driver has to be informed at the moment he/she enters the critical area till he/she leaves this area. Regarding to requirements FR 1, DR 9, DR 10, DR 11, DR 12, DR 15, DR 21 and DR 23.
The information has to be placed in the way it does not overlay information and warnings with higher priority. Regarding to requirements FR 5, DR 1, DR 13 and DR 17.
Status of the system has to be clear to the driver. Regarding to requirements TR 4, TR 5, TR 6, TR 7, FR 4, DR 1, DR 3, DR 7 and DR 18.
The information should be displayed in the tachometer and/or in the display in the centre console. Regarding to requirements TR 1, TR 3, TR 8, TR 9, TR 10, TR 11, DR 2, DR3, DR 4, DR 5, DR 6, DR7, DR 8, DR 9, DR 14 and DR 19.
The function has to be integrated in the existing car electronic and prioritized with existing functions. Regarding to requirements TR 2, TR 5, TR 6 and FR 5.
2.4.1 Design Loop
Based on the design guidelines a first design loop was made and evaluated. For this very first design loop different concept ideas were collected and evaluated to find the best way to transmit the information about children nearby or at a school bus stop.
The first concept is based on the well known use of road signs on navigation maps. In different car navigation maps such signs are used to inform the driver e.g. about traffic or closed roads. Some examples are shown in Figure 38.
Figure 38: Street Signs used as information on in car navigation maps.
Due to the position of common navigation displays in cars this information is not displayed in the direct field of view of the driver. Therefore additional information to attract attention is necessary. To improve the perceptibility two different concept ideas were created:
The use of an icon in the tachometer which transmit the general information of a hazard ahead and more information on the map
The use of a split screen on the navigation map as a cue (Trini, 2005). Using a split screen pop-up can attract the attention of the driver.
During the first evaluation the following hypothesizes shall be verified:
SW2S_D5.5 final Pu Contract N. 233967
October 2011 58 IIID
The use of an icon in the tachometer or a split screen improves the perceptibility of the information about a hazard.
Only an icon in the tachometer can not transmit all necessary information.
Different icons transmit the information “beware of children” in different ways and some are easier to understand than others.
A common bus stop sign is not necessary when the SAFEWAY2SCHOOL sign is used.
If the critical area is highlighted it is easier for the user to understand and identify the hazard.
A combination of an icon in the tachometer and information on the navigation map is the priority of the users.
Within this first design loop four icons for the use in the tachometer were designed (see Figure 39). The evaluation asked for the meaning and the design.
Figure 39: Very first Icons for the use in the tachometer.
Additionally a set of navigation maps with different street signs, bus stop icons and highlighted streets was created (see Figure 40). They were tested for the meaning, distinctness and the priority of the participants. For the first loop the common and well known German danger warning sign “attention children” was used to avoid the influence of design preferences or averseness to the SAFEWAY2SCHOOL sign.
Figure 40: Navigation maps with different icons.
The experts were also asked if they would like to have a split screen or if it is too much information.
Figure 41: Navigation map with split screen (warning pictogram on left and map on right)
SW2S_D5.5 final Pu Contract N. 233967
October 2011 59 IIID
Finally the participants were asked about their favourite combination.
2.4.1.1 Results of the first design loop For the very first evaluation 5 experts, 3 male and 2 female, with an age average of 28,4 years were asked. The concept ideas were shown to them as paper prototypes as they are shown in Annex 5.3.
For all of the created icons the meaning was not clear to the participants. For each Icon the meaning was only 60% or less correct. Due to these results a re-design is necessary. For this new icon some helpful aspects could be collected during this evaluation:
The different reasons of hazard should be clear
Compact, less complex design
Using signal colours
The results verified the hypotheses:
Only an icon in the tachometer can not transmit all necessary information.
Different Icons transmit the information “attention children” in different ways and some are easier to understand than others.
Due to the results of the perceptibility without an additional icon (between -2 (bad) and -1 (slightly bad)) the hypothesis was also verified:
The use of an icon in the tachometer or a split screen improves the perceptibility of the information about a hazard.
For the different designs of the navigation map some clear results were found:
The sign with children is rated better than a general attention sign.
The maps with highlighted critical area are rated better than the one without.
The maps with an addition common bus stop sign are rated better than the ones without.
Therefore the following hypotheses are verified:
Different Icons transmit the information “attention children” in different ways and some are easier to understand than others.
If the critical area is highlighted it is easier for the user to understand and identify the hazard.
And the following hypothesis was not verified:
A common bus stop sign is not necessary when the SAFEWAY2SCHOOL sign is used.
That a split screen improves the visibility was said by each of the 5 participants. It was rated as slightly very good and as slightly much better as without a split screen. These results also verify the hypothesis.
The use of an icon in the tachometer or a split screen improves the perceptibility of the information about a hazard.
Finally the participants were asked for their most liked combination out of the presented designs. Of the 5 participants 2 preferred an icon in the tachometer and the information on the navigation map with a common bus stop sign, highlighted area and the “attention children” sign. Three preferred the same map design but in combination with a split screen. Due to the missing clear preference the following hypotheses could neither proved nor disproved and have to be tested within the next loop:
SW2S_D5.5 final Pu Contract N. 233967
October 2011 60 IIID
A combination of an icon in the tachometer and information on the navigation map is the priority of the users.
In summary it can be said that some hypotheses were proved and some disproved. Furthermore an additional user requirement could be found: enough information about the hazard is requested. It is not enough to know where the hazard is, it is also necessary to transmit the information what the hazard is. Thus it is easier for the driver to decide if and how to react.
2.4.2 Re-Design
Based on the results of the first design loop a re-design was made. The focus of this re-design was on the icon in the tachometer. The new concept idea for the icon in the tachometer is also an adaption of common systems. As shown in Figure 42 it is possible to display a street sign in the tachometer.
Figure 42: Street Sign displayed in the tachometer (Daimler, 2011).
For the SAFEWAY2SCHOOL concept this function can be expanded, because the use of the SAFEWAY2SCHOOL technique allows earlier information than a camera based concept. Instead of the speed limit sign the SAFEWAY2SCHOOL sign will be displayed in the tachometer (see Figure 43). A later enhancement with other street signs is possible.
Figure 43: Re-Design of the tachometer icon.
For the evaluation of this new concept again the common German street sign was used due to avoid the influence of like or dislike of the SAFEWAY2SCHOOL sign.
Within this second evaluation the participants were asked about the use of the navigation map alone, in combination with the icon in the tachometer, in combination with a split screen and in combination with a split screen and icon in the tachometer. The concepts were shown
SW2S_D5.5 final Pu Contract N. 233967
October 2011 61 IIID
to them as a paper prototype (see Annex 5.0). They were asked about the visibility, the combination of icons, the information content and the relation to the other concepts.
2.4.2.1 Results of the second design loop Within this second evaluation 7 experts, 3 female and 4 male, with an age average of 29,14 years were asked.
For the navigation map alone the worst results were found. The visibility and the relation between the icons and the information content were the lowest of all results. For the combination of split screen and icon in the tachometer the visibility was rated as best, but the information content was rated as too high. The concept was compared to the navigation map alone only rated as a bit better. Both other concepts were rated clearly better compared to the navigation map alone. The navigation map in combination with the icon in the tachometer and the navigation map in combination with split screen also show nearly the same results for visibility, combination of icons and information content. Additionally thy reached the same mean of 1,83 at the final ranking. The split screen concept was preferred by 3/6 and the icon in the tachometer by 2/6. So the preference and usefulness is undetermined further, hence the design of the in car warning is reduced to two concepts. Therefore it was decided to implement these two concepts in the driving simulator and to evaluate these prototypes to find a final result.
2.4.3 Prototype Verification
To find a final information design and to verify this prototype the split screen and the icon in the tachometer were implemented in the driving simulator of USTUTT (see Figure 44).
Figure 44: Implemented design concepts in the USTUTT driving simulator.
For the final evaluation a hypothesis was added to the existing ones as defined in chapter 2.4.1:
Due to the position of the information the distraction of the icon is lower than the distraction of the split screen.
The final evaluation included the User Acceptance Scale (UAS), the System Usability Scale Questionnaire (SUS) and several questions out of the templates in Deliverable 7.1. Additionally the preferences of the experts were asked with 5 final questions (see Annex 5.0).
For the evaluation the participants were asked to drive the SAFEWAY2SCHOOL scenario till the information about children at the first bus stop appears.
SW2S_D5.5 final Pu Contract N. 233967
October 2011 62 IIID
Figure 45: Final evaluation in the driving simulator of USTUTT.
2.4.3.1 Results of the prototype verification Five participants, 3 male and 2 female, with an age average of 27,6 were asked for the final evaluation. As Figure 46 shows the results for the icon in the tachometer (IT) were better as the one for the split screen (SP).
Figure 46: Results of the UAS.
Out of the results of the UAS two new variables can be generated: the usefulness score and the satisfying score [23]. Usefulness score is the average of the items: 1 (useful), 3 (good), 5 (effective), 7 (assisting), 9 (raising alertness). Satisfying score it the mean of the results of the items: 2 (pleasant), 4 (nice), 6 (likeable), 8 (desirable).
Undesirable
Worthless
Irritating
Superfluous
Annoying
Bad
Unpleasant
Useless
Desirable
Assisting
Likeable
Effective
Nice
Good
Pleasant
Useful
-2 -1 0 1 2
SP
IT
SW2S_D5.5 final Pu Contract N. 233967
October 2011 63 IIID
Figure 47: Usefulness and Satisfying score.
Figure 47 shows even more clearly the positive ratings for the dashboard icon (IT). Four out of five values are in the positive quadrant and the mean value is even higher.
For both concepts enough information are displayed. Five out of five participants also thought that the icon in the tachometer can avoid accidents, for the split screen only three out of five participants had this opinion. Additionally four out of five participants would like to have the icon in their tachometer; the split screen is wanted by two out of five participants.
The results of the System Usability Scale Questionnaire (SUS) are summarized in Figure 48. These results also show better values for the icon in the tachometer (IT) as for the split screen (SP).
-2
-1,5
-1
-0,5
0
0,5
1
1,5
2
-2 -1,5 -1 -0,5 0 0,5 1 1,5 2
Usefulness score
Sat
isfy
ing
sco
re
Mean SP
Mean IT
SP
IT
SW2S_D5.5 final Pu Contract N. 233967
October 2011 64 IIID
Figure 48: Results of the SUS.
The results of the preference questions also show the preference of the participants for the icon in the tachometer. As Figure 9 shows four out of five participants want to have the design with the icon in the tachometer in their car. The visibility for the icon in the tachometer is said as better as the one of the split screen by five out of five participants.
Figure 49: Results of the prototype verification.
In summary all results show a clear preference of the participants for the icon in the tachometer in combination with information on the navigation map, including a highlighted area, the road sign “attention children” and a bus stop sign. Therefore the final information design was chosen and the prototype is verified.
2.4.4 Final Status for Validation and Evaluation
0
12
3
45
6
Wan
t
Co
mp
reh
ensi
bil
ity
Vis
ibil
ity
Dis
trac
tio
n
Pre
fere
nce
ov
er a
ll
No
. o
f p
arti
cip
an
ts
Split ScreenIcon
012345
Co
mp
lex
ity
Su
pp
ort
Inco
nsi
sten
cy
Dif
ficu
lt t
o u
se
Lea
rn b
efo
re
SP
IT
b
012345
Use
fre
qu
entl
y
Sim
pli
city
Inte
gra
tio
n
Eas
y t
o l
earn
Con
fid
ent
use
SP
IT
a
SW2S_D5.5 final Pu Contract N. 233967
October 2011 65 IIID
The final design for validation and evaluation within the USTUTT simulator study is shown in Figure 50 and described detailed above.
Figure 50: Final status for validation and evaluation.
2.5 Conclusion
ITS technologies using road signs in vehicle displays can reduce accidents and are accepted by drivers. Therefore they might be helpful protecting vulnerable road users and especially children on their way to school. To be helpful it is necessary that the Human-Machine-Interfaces (HMI) adhere to human factor guidelines otherwise the distraction of the driver can increase the risk of an accident.
Within this chapter such a HMI was developed in an iterative process according to the V-ISO model. First the state of the art of road sign system HMIs was shown. Afterwards success criteria were defined: High Level Objectives, User Needs and Use Cases as well as Functional, Technical and Design Requirements. Based on the those success criteria a first design was made. This design was evaluated by 5 HMI experts and optimized based on the state of the art afterwards. This second design was also tested with 5 HMI experts and the results were used to create a prototype, which was implemented in a driving simulator. Validation of this prototype was carried out with 5 HMI experts with focus on the user needs. So “three tests with 5 users each” were made to improve the design.
Within these test following aspects turned out to be important to create an accepted and useful HMI using road signs to protect vulnerable road users:
Indicate the hazard.
Highlighting the critical area.
Explain the situation.
Chose a position which does not distract the driver: Use the dashboard or a head-up display for warnings (in critical situations). For information use the center column or the infotainment display.
Within the design process minimum one evaluation in a driving simulator or in a car (depending on safety and security issues) should be carried out.
SW2S_D5.5 final Pu Contract N. 233967
October 2011 66 IIID
Regarding these guidelines an accepted HMI can be created to protect children on their way to school. This HMI is also shown to be useful in subjective assessment and the objective usefulness will be shown in D7.1.
SW2S_D5.5 final Pu Contract N. 233967
October 2011 67 IIID
3 (Overall) Conclusions
The task described in the chapter "School bus (stop) sign" was to develop a school bus sign, and school bus stop sign, which have a greater potential of alerting drivers on the possible presence of school children near by than current state-of-the -rt. Additionally, Investigations were made to pave the way for an adequate sound fulfilling the same purpose. After establishing an overview on current practice signs used in relation to the protection of school children on the road, done via international surveys, where 92 theme related signs and pictograms were collected, one was chosen that had the required expression to underline the meaning of its message, whilst bearing the potential to be enhanced to be visually discriminated (legible) from greater viewing distances, respectively high speeds. Through this, drivers can perceive the sign earlier and in time.
In the following process, taking into account the key persons - a motorist - challenged most in noticing, discriminating, and through this, in comprehending this sign and act accordingto a safe driving behaviour and not to endanger school children, calculations were carried out based on driving speed, viewing distance, visual acuity and number of information elements to gain required sign dimensions.
It became clear that the current size of the school bus sign as recommended by UNECE ITC is too small, and adding to this, that the many national variants are not capable to support large distance discrimination, even more so, mainly they are only "legible" at very low speeds.
To alter this unsatisfying situation for the better, the new SW2S school bus (stop) sign was carefully crafted up to the smallest graphical element to fulfil the motorists requirements (as explained above), leading to an improvement, in terms of large viewing distance discrimination, of up to 229%. Tests carried out under simulated and real life conditions support these findings.
Knowing that, with the introduction of a new "children" pictogram in the sign - which is in conformity with the Vienna Convention on Road Signs and Signals (1968, United Nations) - it is strongly recommended to carry out standardisation, substituting all existing national variants, extending beyond the school bus (stop) sign to other signs such as the danger warning sign "children", and wherever such a pictogram can be usefully applied. the proprietor of the current international recommendation for the school bus sign (UNECE (ITC))should be informed.
To support widespread standardisation, the sign/pictogram is available in read-to-use formats, for high-resolution application (for sign plates), low screen resolution for Variable Message Signs (VMS) and small screen resolution for digital online maps and in-car navigation screens. Additional recommendations were worked out to further enhance safety for school children in situations where they are endangered, such as during boarding and alighting.
To support the visual aspect and strengthen the alarming character of the warning, the requirements for an audible warning sound were established. Reasoning tells us that a sound signalled from a school bus or school bus stop might not be effective, taking into account traffic noise it would have to compete with, and the ever better insulated motor cars, it is unlikely that drivers would actually hear it.
Never the less, for in-car navigation devices, which might in the future detect possible children near by, a specific sound should be useful to notify a driver on this specific type of danger she/he is going to encounter, without the need to take the eyes off the road. Work performed in chapter "Car Driver Device" indicates the validity of this assumption.
SW2S_D5.5 final Pu Contract N. 233967
October 2011 68 IIID
In chapter "Car Driver Device", USTUTT examined possibilities to increase safety for school children by concentrating on warnings that could be issued via in-car devices to drivers, taking the developed school bus (stop) sign further into one of its future application areas.
A HMI was developed, first showing the state of the art of road sign system HMIs, and success criteria defined: High Level Objectives, User Needs and Use Cases as well as Functional, Technical and Design Requirements.
After designing a first HMI, it was evaluated by HMI experts, leading to a second proposal. Tested again by HMI experts, via another redesign, a prototype was derived and implemented in a driving simulator. Once more, HMI experts with focus on user needs evaluated the prototype's performance.
The following cornerstones were established which are needed to adhere to, in order to create an in-car HMI using signs reflecting actual road signs to protect vulnerable road users: The Hazard should be visually indicated (children), and the stretch of road where the danger is present. The situation given should be made clear to the driver. To avoid distraction, displays close to the normal line of sight of a driver to visualise warnings (dashboard or head-up-display) are to be employed. For further information to turn to when a visual indication is shown, a display less near to the normal line of sight may be used. It is strongly recommended to use a driving simulator to evaluate HMI designs.
SW2S_D5.5 final Pu Contract N. 233967
October 2011 69 IIID
4 References
Anund, A. (2010) Swedish school bus sign. Linköping: VTI
Barfield, W., Dingus, T.A. (Eds.) (1998.): Human Factors in Intelligent Transportation Systems. Lawrence Erlbaum, Mahwah, NJ.
Brugger, C. (2006) Evaluation of Warning Elements for Matrix Displays. Wien: IIID
Bundesminister für Wissenschaft und Verkehr (1994) Schülertransport-Kennzeichnungs-Verordnung 30. Sept. 1994. Nr 792. Wien: BMWV
Bundesministerium für Verkehr, Bau und Stadtentwicklung (1998) VwV-StVO, §39 Allgemeines zu Verkehrszeichen. Bonn: BMVBS,
Bundesministerium für Wissenschaft und Verkehr (1998) BGBl. II – Ausgegeben am 29. Juli 1998 – 238. Verordnung: Straßenverkehrszeichenverordnung 1998 – StVZVO 1998. Wien: BMWV
Caird, J.K., Chisholm, S.L., Lockhart, J. (2008): Do in-vehicle advanced signs enhance older and younger drivers’ intersection performance? Driving simulation and eye movement results. International Journal of Human-Computer Studies 66, 132–144.
Campbell, J. L. [et al.] Crash Warning System Interfaces: Human Factors Insights and Lessons Learned. NHTSA, 2007
Carsten, O., Brookhuis, K. (2005):. The relationship between distraction and driving performance: towards a regime for in-vehicle information systems. Transportation Research, Part F 8, 75–77.
Committee on European Standards (2007) Medical Vehicles and their Equipment 1. CEN EN 1789
Daimler Global Media Site (2011). URL: http://media.daimler.com/dcmedia/0-921-1159728-49-1160522-1-0-29-0-0-1-11701-854934-0-3842-0-0-0-0-0.html?TS=1306160014872. [23.05.2011]
DIN EN ISO 15005 Road vehicles – Ergonomic aspects of transport information and control systems – Dialogue management principles and compliance procedure.
DIN EN ISO 15006:2006 Road vehicles -- Ergonomic aspects of transport information and control systems -- Specifications and compliance procedures for in-vehicle auditory presentation
DIN EN ISO 15007 Road Vehicles -- Measurement of driver visual behaviour with respect to transport information and control systems -- Definitions and parameters.
DIN EN ISO 15008:2003 Road vehicles -- Ergonomic aspects of transport information and control systems -- Specifications and compliance procedures for in-vehicle visual presentation
Economic Commission for Europe, Inland Transport Committee. (1968/1995). Convention on Road Signs and Signals, done at Vienna on 8 November 1968, Annex 1/ Symbol A, 13. United Nations.
Economic Commission for Europe, Inland Transport Committee. (1968) Convention on Road Traffic, done at Vienna on 8 November 1968. United Nations
Economic Commission for Europe, Inland Transport Committee. (1998). Consolidated resolution on Road Traffic (R.E.1). Annex 1, Recommendation 2.2. United Nations
SW2S_D5.5 final Pu Contract N. 233967
October 2011 70 IIID
Egger, S. (2010) Googlemaps children icon. Wien: IIID
Egger, S. (2010) Survey on school bus- and school bus stop pictograms in use. Wien: IIID
EU Statement of Principles on Human Machine Interface for In-Vehicle Information and Communication Systems.
European Commission (1991) Annex III of Council Directive 91/439/EEC of 29 July 1991 on driving licences
ISO/TC145/SC1 (2006) ISO 7001. Graphical symbols— Public information symbols. Geneva: ISO
Kamalski, T. (2010) tomtom children icon. Eindhoven: tomtom
Kjemtrup, K (no Year) Danish technical handbook for VMS. Copenhagen: Vejdirektoratet
Lee, J.D., Gore, B.F., Campbell, J.L. (1999): Display alternatives for invehicle warning and sign information: message style, location and modality. Transportation Human Factors 1 (4), 347–375.
Lerner, N. D. [et al.] Preliminary Human Factors Guidelines for Crash Avoidance Warning Devices. NHTSA, 1996
Luoma, J., Rämä, P. (2002): Acceptance of traffic sign information provided by an in-vehicle terminal. In: Proceedings of the Ninth World Congress on Intelligent Transportation Systems. Chicago, Illinois.
Motor.-Talk.de Europas größte Auto- und Motor-Community (2011). URL: http://www.motor-talk.de/bilder/navi-fx-anzeige-stau-s-g17401700/stau-i203312809.html. [23.05.2011
Noy, I. (1997): Ergonomics and Safety of Intelligent Driver Interfaces. Lawrence Erlbaum, Mahwah, NJ.
Patterson, R. D. & Mayfield, T. F. (1990). Auditory Warning Sounds in the Work Environment. In Philosophical Transactions of the Royal Society of London. Series B, Biological Sciences, Vol. 327, No. 1241, Human Factors in Hazardous Situations (Apr. 12, 1990), pp. 485-492.
Pierowicz, J., Jocoy, E., Lloyd, M., Bittner, A., Pirson, B. (2000): Intersection Collision Avoidance Using ITS Countermeasures (Task 9: Final Rep). National Highway Traffic Safety Administration, Washington, DC.
Porathe, T. (2011) MDH test of the high tech bus warning sign, Eskilstuna: Mälardalen University
Regan, M.A. (2004): A sign of the future I & II: Intelligent transport systems & human factors. In: Castro, C., Horberry, T. (Eds.), The Human Factors of Transport Signs. CRC Press, Boca Raton, FL, pp. 213–238.
Simlinger P., Egger S., Galinski C. (2008). Proposal on unified pictograms, keywords, bilingual verbal messages and typefaces for VMS in the TERN. Wien: IIID
Smuc M, Windhager F, Siebenhandl K, Egger S (2007) Impaired Visibility Typeface Test. Wien/Krems: IIID/DUK
Staplin, L., Fisk, A.D. (1991): A cognitive engineering approach to improving signalized left-
SW2S_D5.5 final Pu Contract N. 233967
October 2011 71 IIID
turn intersections. Human Factors 33, 559–572.
Sternberg, R (2003) Cognitive Psychology Third Edition, Thomson Wadsworth
Stevens, A. [et al.] Design Guidelines for Safety of In-Vehicle Information System. TRL & DTLR, 2002
Trini, M. (2005): Verteilung von Aufmerksamkeit zwischen und innerhalb von Objekten. Dissertation, Philosophischen Fakultät Universität Erlangen, Erlangen.
United Nations (2008) ECE Regulation No. 65, Revision 1
Visser, S. (1998) Portuguese danger warning sign children. http://www.elve.net/rkidpor.htm
Wikipedia (2011) Landolt C. http://en.wikipedia.org/wiki/Landolt_C
Wogalter, M. S.[et al.] Research-based guidelines for warning design and evaluation. Elsevier Science Ltd., 2002
5 Annex
5.1 SURVEY ON SCHOOL BUS- AND SCHOOL BUS STOP PICTOGRAMS IN USE
5.2 TEST OF THE HIGH TECH BUS WARNING SIGN MDH
5.3 EVALUATION OF THE 1ST DESIGN LOOP USTUTT
5.4 EVALUATION OF THE 2ND DESIGN LOOP USTUTT
5.5 PROTOTYPE VERIFICATION USTUTT
SW2S_D5.5 final Pu Contract N. 233967
October 2011 72 IIID
5.1 Survey on school bus- and school bus stop pictograms in use
SW2S_D5.5 final Pu Contract N. 233967
October 2011 73 IIID
PicassemblySW2S-1_2010 Public SAFEWA2SCHOOL, Contract No 233967
2010-04-21 1 of 9 International Institute for Information Design (IIID)
SEVENTH FRAMEWORK PROGRAMME
SUSTAINABLE SURFACE TRANSPORT (SST)-2008-RTD-1
Integrated system for safe transportation of children to school
Title
Authors
Summary
Work Package/Activity
Status
Distribution
Document ID
Issue date
Content:
Survey on school bus- and
school bus stop pictograms in use
Stefan Egger, International Institute for Information Design (IIID)
The following collection of signs/symbols/pictograms is based on a survey
which was conducted to find examples of signs in use, bearing pictograms
to identify/signal school buses and school bus stops. The aim of this paper is
to provide sufficient background knowledge to derive insights for the planned
development of a school bus- and school bus stop pictogram.
A5.5 Surrounding traffic info and warning
Final
All Partners
PicassemblySW2S-1_2010
21/04/2010
1. Introduction …………………………………………………………. 2
2. Definitions …………………………………………………………… 2
3. Discussion …………………………………………………………… 2
3.1 Emphasis on danger ………………………………………………… 3
3.2 Clarity of the graphical content of a symbol ……………………… 3
3.3 In favor of a reduced number of graphical elements ……………. 3
4. Conclusion ………………………………………………………….. 3
4.1 Pictogram “children” ………………………………………………… 3
4.2 Pictogram “bus” ……………………………………………………… 3
5. Further research …………………………………………………… 4
5.1 Relevant regulations ………………………………………………… 4
5.2 Sign combinations …………………………………………………… 4
5.3 Related project: Bus signage trial in Aberdeenshire, Scotland …. 46. Sign collection ……………………………………………………………… 5
92 Dr Snooks (2005) http://www.flickr.com/photos/drsnooks/
19323617/in/set-72057594139931538/
93 Egger, S. (2010) Wien: IIID
94 Preis, K. (1977) Erkennung von Zeichenvarianten. Wien:
Universität Wien
95 ISO/TC145/SC1 (1981) ISO Technical Report 7139. Develop-
ment and principles for application of public information symbols
Geneva: ISO
SW2S_D5.5 final Pu Contract N. 233967
October 2011 82 IIID
5.2 Test of the high tech bus warning sign MDH
As the high tech school bus sign two signs was to be tested. The traditional low resolution LED VMS and a new type of LED background lit LCD-TV. Method The low resolution LED display had a matrix of 64 by 64 LED elements within a 500 mm by 500 mm area, an Inter LED Distance of 7.8 mm, equivalent to a resolution of 3.2 pixels per inch (ppi).
The LED-TV was a new type of LCD TV which was background lit by LED elements, which were to give a stronger and brighter picture. The resolution for the entire screen was 1920 by 1080 pixels within a 500 mm by 889 mm area of which only an area of 500 mm by 500 mm was used. The resolution of this screen was then 54 ppi, equivalent to an inter pixel distance of 2.2 mm.
Fig. 1. To the left an indoor photo of the LED-TV screen (top) and the monochrome LED display (bottom); to the right the outdoor situation in full sunlight. The top LED-TV has too low luminance for full sun light conditions.
After the first test session the LED-TV was replaced by a sign printed on plastic foil (the low tech sign to be used on the pilot sites later in the project). This was due to the low luminance of the LED-TV in the strong sunlight. (Unfortunately we did not have access to a light meter, so we could not document the numerical value of the luminance of neither the sunlight nor the two signs, but the photo in figure two will give an impression.) On this sign the pictogram was printed in high resolution (300 ppi) against a 500 mm by 500 mm, yellow background with a black frame. Due to the frame and a narrow yellow border between the pictogram and the frame, the pictogram on this sign was about 10 % smaller than on the LED VMS (see Figure 2).
The LED-TV was mounted over the LED VMS signs in a wooden frame that could be transported using a small trolley. The two screens was the placed on the pavement outside Mälardalen University allowing test persons to test the legibility of the two signs from a maximum distance of 200 meters and shorter. The lighting conditions were bright sunlight from a clear blue sky at about 3 o’clock in the afternoon. The street went in an east-westerly direction and the test persons had the sun in their eyes as they faced the sign.
SW2S_D5.5 final Pu Contract N. 233967
October 2011 83 IIID
Twelve test persons (4 female and 8 male) in ages from 36 to 68 (mean 47.7 years) was then asked to answer the question “Can you read the signs?” on four different stations 200, 150, 100 and 50 meters away from the rig. The participants were also encouraged to comment on the how well they saw the two signs.
Fig 2. To the left the rig with the two screens and the four distances (200, 150, 100 and 50 meters) which the subjects where to answer the questions: “Can you read the pictogram on the screens?” To the right is the rig with the top LCD-TV replaced with the printed sign taped on top of the LED-TV screen.
All of the twelve test persons were from the teaching staff of Mälardalen University and all were aware of the Safeway 2 school project and the task of testing a school bus sign. So all had seen the pictogram in other situations.
Results The results from the survey is presented in Table 1.
After the first session it appeared clear that the luminance of the LED-TV was too low. The first test person could read the very bright LED sign at 150 meters, but the LED-TV barely at 100 meters. After this session the LED-TV was replaced by the printed sign.
However this did not significantly change the outcome of the test. The bright LED sign was clearly visible at 200 meters although the pictogram was not readable except for three persons at this distance. At 150 meters all but three could read the sign and at 100 meters all could read the sign. The printed sign, however, was not readable by any at 200 meters. On 150 meters three of the participants claimed they could guess the pictogram. But not until at 100 meters it was clearly readable to all but two. (This was the same distance that the weak LED-TV could be read by its one test person.)
SW2S_D5.5 final Pu Contract N. 233967
October 2011 84 IIID
Table 1. Test results
Seven of the participants commented on the excellent visibility of the LED sign which with its bright luminance was very conspicuous. The pictogram was not readable at 200 meters. The sign was complex and reminded some of the participants of a “Chinese sign.”
Discussion It was immediately obvious that the LED-TV was too weak to be used in bright sunlight of Sweden in June. This was assumed beforehand as the display was designed for indoor use, even if the new technology with LED background lighting was much brighter than earlier LCD-TVs of other types. It is expected that it would work fine under darker conditions, but it was not possible to test the display under other light conditions due to the weather and time of the year on latitude 59 degrees north.
The LED VMS display was excellent with its very strong luminance under these conditions. It was clearly visible at very long distance. And all the participants said they preferred it before the printed sign.
All the participants had seen the school bus sign with its pictogram in other situations during the course of the Safeway 2 school project. So it is safe to assume that all knew beforehand what sign they were to judge the readability of looked like. Although they did tried to objectively judge wheatear they could really read the pictogram or not, one might assume that this pre-knowledge had an effect on the outcome of the test. Our assumption is that they probably would be more confident that they could read the sign that they would have been if they had no prior knowledge of the pictogram.
A concern based only on anecdotal evidence from older car drivers who says they experienced discomfort or disability glare during night due to the very bright new LED traffic lights could not be tested under the prevailing conditions in the short time slot allocated for this test. However one of the authors (TP) wants to raise concerns for the effects of the new high powered lights in the traffic environment which has been introduced with the light emitting diodes in all types of traffic lights and traffic signs. Even if the technology allows for light sensors that shall dim the light during the dark hours of the day, the impression is that
Tests with LED VMS and LED-TV 2011-06-07 in EskilstunaID Gender Age LED VMS PAPER SIGN
200 m 150 m 100 m 50 m 200 m 150 m 100 m 50 m
1 F 49 0 1 1 1 0 0 1 1
2 F 44 1 1 1 1 0 0,5 1 1
3 M 36 0 0,5 1 1 0 0 1 1
4 M 38 0 1 1 1 0 0,5 1 1
5 M 53 0 1 1 1 0 0 1 1
6 M 46 0 1 1 1 0 0 1 1
7 F 40 1 1 1 1 0 0,5 1 1
8 M 37 0 1 1 1 0 1 1 1
9 M 55 0 1 1 1 0 0 0,5 1
10 F 49 0 0,5 1 1 0 0 0,5 1
11 M 57 0 0 1 1 0 0 1 1
12 M 68 1 1 1 1 0 0 1 1
Mean 47,7 0,25 0,8 1 1 0 0,2 0,9 1
SW2S_D5.5 final Pu Contract N. 233967
October 2011 85 IIID
this facility is rarely used, at least not in Sweden. With an older but more healthy and mobile population in the industrialized countries, and the knowledge of the degradation of the sight in the period between 60 and 70 years of age, this might become a problem. Instead of aiming for maxim visibility, a just-in-time conspicuity is suggested as the target for traffic signs.
More research must be conducted on the problem of disability glare and high powered LED displays. The tested display certainly had the power to glare road users when used night time. And the question is if it might even cause longer detection time for a child running out behind the a bus if the driver is disturbed by a glare from the warning sign.
The tested LED sign was equipped with white diodes. According to European legislation white light is not allowed on the rear of vehicles traveling in forward direction. The suggestion is to cover the display with an amber filter if the sign is to be tested on the rear of a bus during the pilot tests.
Conclusion The test clearly showed that the LED VMS was superior in the prevailing light conditions (strong sunlight). But more research has to be done on to the problem of disability glare and high powered light sources under dusk and night time conditions. Until then it is of great importance that light sensors and clock timers are used to dime the signs during dark periods of the day.
(110612, Thomas Porathe)
SW2S_D5.5 final Pu Contract N. 233967
October 2011 86 IIID
5.3 Evaluation of the 1st design loop USTUTT
SW2S_D5.5 final Pu Contract N. 233967
October 2011 87 IIID
SEVENTH FRAMEWORK PROGRAMME
SUSTAINABLE SURFACE TRANSPORT (SST)-2008-RTD-1
Integrated system for safe transportation of children to school
SAFEWAY2SCHOOL
Collaborative project 233967
Evaluation of the 1st design loop USTUTT
User ID (Name/Surname if not ID): _____________________
Date: ____________________
Site: _____________________
Evaluator/supervisor name (if any): _____________________
Trial scenario (s) ID: _____________________
Time and day of test: _____________________
SW2S_D5.5 final Pu Contract N. 233967
October 2011 88 IIID
SW2S_D5.5 final Pu Contract N. 233967
October 2011 89 IIID
SW2S_D5.5 final Pu Contract N. 233967
October 2011 90 IIID
SW2S_D5.5 final Pu Contract N. 233967
October 2011 91 IIID
SW2S_D5.5 final Pu Contract N. 233967
October 2011 92 IIID
5.4 Evaluation of the 2nd design loop USTUTT
SW2S_D5.5 final Pu Contract N. 233967
October 2011 93 IIID
SEVENTH FRAMEWORK PROGRAMME
SUSTAINABLE SURFACE TRANSPORT (SST)-2008-RTD-1
Integrated system for safe transportation of children to school
SAFEWAY2SCHOOL
Collaborative project 233967
Evaluation of the 2nd design loop USTUTT
User ID (Name/Surname if not ID): _____________________
Date: ____________________
Site: _____________________
Evaluator/supervisor name (if any): _____________________
Trial scenario (s) ID: _____________________
Time and day of test: _____________________
SW2S_D5.5 final Pu Contract N. 233967
October 2011 94 IIID
SW2S_D5.5 final Pu Contract N. 233967
October 2011 95 IIID
SW2S_D5.5 final Pu Contract N. 233967
October 2011 96 IIID
5.5 Prototype verification USTUTT
SW2S_D5.5 final Pu Contract N. 233967
October 2011 97 IIID
SEVENTH FRAMEWORK PROGRAMME
SUSTAINABLE SURFACE TRANSPORT (SST)-2008-RTD-1
Integrated system for safe transportation of children to school
SAFEWAY2SCHOOL
Collaborative project 233967
Prototype verification USTUTT
User ID (Name/Surname if not ID): _____________________
Date: ____________________
Site: _____________________
Evaluator/supervisor name (if any): _____________________
Trial scenario (s) ID: _____________________
Time and day of test: _____________________
SW2S_D5.5 final Pu Contract N. 233967
October 2011 98 IIID
1. Ich finde das System….
1 Nützlich Nutzlos
2 Angenehm Unangenehm
3 Schlecht Gut
4 Nett Nervig
5 Effizient Unnötig
6 Ärgerlich Erfreulich
7 Hilfreich Wertlos
8 Nicht wünschenswert Wünschenswert
2. Wie bewerten Sie die Nutzerfreundlichkeit des Systems?
sehr niedrig sehr hoch
3. Finden Sie die Darstellung (Grafik, Farbe usw.) ansprechend?
sehr niedrig sehr hoch
4. Ist es einfach die Informationen zu erkennen?
sehr schwierig sehr einfach Wenn nicht, warum:
5. Ist es einfach die Informationen zu verstehen?
sehr schwierig sehr einfach Wenn nicht, warum:
SW2S_D5.5 final Pu Contract N. 233967
October 2011 99 IIID
6. Denken Sie es sollten noch weitere Informationen angezeigt werden?
Ja Nein
Wenn ja, welche:
7. Würden Sie das System immer aktivieren?
nie immer
8. Fühlen Sie sich von dem System unterstützt?
Ja, sehr Überhaupt nicht
9. Fühlen Sie sich durch das System abgelenkt?
Ja, sehr Überhaupt nicht
10. Würden Sie sich auf das System verlassen?
Ja, sehr Überhaupt nicht
11. Denken Sie das System hilft Unfälle zu vermeiden?
Ja Nein Wenn nein, warum:
12. Würden Sie das System gerne in Ihrem Auto haben?
Ja Nein Wenn nein, warum:
SW2S_D5.5 final Pu Contract N. 233967
October 2011 100 IIID
13. Haben Sie Verbesserungsvorschläge?
System Usability Scale Questionnaire Aussage 1
Stimme gar
nicht zu
2 3 4 5
Stimme voll zu
1. Ich kann mir sehr gut vorstellen, das System regelmäßig zu nutzen.
2. Ich empfinde das System als unnötig komplex.
3. Ich empfinde das System als einfach zu nutzen.
4. Ich denke, dass ich technischen Support brauchen würde, um das System zu nutzen.
5. Ich finde, dass die verschiedenen Funktionen des Systems gut integriert sind.
6. Ich finde, dass es im System zu viele Inkonsistenzen gibt.
7. Ich kann mir vorstellen, dass die meisten Leute das System schnell zu beherrschen lernen.
8. Ich empfinde die Bedienung als sehr umständlich.
9. Ich habe mich bei der Nutzung des Systems sehr sicher gefühlt.
10. Ich musste eine Menge Dinge lernen, bevor ich mit dem System arbeiten konte.
VP: Anzeigekonzept: IT
October 2011 101 IIID
1. Ich finde das System….
1 Nützlich Nutzlos
2 Angenehm Unangenehm
3 Schlecht Gut
4 Nett Nervig
5 Effizient Unnötig
6 Ärgerlich Erfreulich
7 Hilfreich Wertlos
8 Nicht wünschenswert Wünschenswert
2. Wie bewerten Sie die Nutzerfreundlichkeit des Systems?
sehr niedrig sehr hoch
3. Finden Sie die Darstellung (Grafik, Farbe usw.) ansprechend?
sehr niedrig sehr hoch
4. Ist es einfach die Informationen zu erkennen?
sehr schwierig sehr einfach Wenn nicht, warum:
5. Ist es einfach die Informationen zu verstehen?
sehr schwierig sehr einfach Wenn nicht, warum:
VP: Anzeigekonzept: IT
October 2011 102 IIID
6. Denken Sie es sollten noch weitere Informationen angezeigt werden?
Ja Nein
Wenn ja, welche:
7. Würden Sie das System immer aktivieren?
nie immer
8. Fühlen Sie sich von dem System unterstützt?
Ja, sehr Überhaupt nicht
9. Fühlen Sie sich durch das System abgelenkt?
Ja, sehr Überhaupt nicht
10. Würden Sie sich auf das System verlassen?
Ja, sehr Überhaupt nicht
11. Denken Sie das System hilft Unfälle zu vermeiden?
Ja Nein Wenn nein, warum:
12. Würden Sie das System gerne in Ihrem Auto haben?
Ja Nein Wenn nein, warum:
VP: Anzeigekonzept: IT
October 2011 103 IIID
13. Haben Sie Verbesserungsvorschläge?
System Usability Scale Questionnaire Aussage 1
Stimme gar
nicht zu
2 3 4 5
Stimme voll zu
1. Ich kann mir sehr gut vorstellen, das System regelmäßig zu nutzen.
2. Ich empfinde das System als unnötig komplex.
3. Ich empfinde das System als einfach zu nutzen.
4. Ich denke, dass ich technischen Support brauchen würde, um das System zu nutzen.
5. Ich finde, dass die verschiedenen Funktionen des Systems gut integriert sind.
6. Ich finde, dass es im System zu viele Inkonsistenzen gibt.
7. Ich kann mir vorstellen, dass die meisten Leute das System schnell zu beherrschen lernen.
8. Ich empfinde die Bedienung als sehr umständlich.
9. Ich habe mich bei der Nutzung des Systems sehr sicher gefühlt.
10. Ich musste eine Menge Dinge lernen, bevor ich mit dem System arbeiten konnte.
VP: Anzeigekonzept: IT
October 2011 104 IIID
1. Welches Konzept hätten Sie lieber in Ihrem Fahrzeug?
Splitscreen Darstellung Icon im Tacho
2. Welches Konzept ist verständlicher?
Splitscreen Darstellung Icon im Tacho
3. Bei welchem Konzept sind die Informationen besser zu erkennen?
Splitscreen Darstellung Icon im Tacho
4. Welches Konzept lenkt mehr ab?
Splitscreen Darstellung Icon im Tacho
5. Welches der Konzepte finden Sie insgesamt am Besten?