(As on 16.9.2013) Chapter – 4 Sustainable Urban Living Montek Singh Ahluwalia* Ajay Mathur* Final Version: August 21, 2013 Word Count: 12,154 No. of Pages: 29 File Name: 0.4 Sustainable Urban Living Urbanisation in India: Challenges and Opportunities Editors - Isher Judge Ahluwalia Ravi Kanbur P K Mohanty
Transcript
(As on 16.9.2013)
Chapter – 4
Sustainable Urban Living
Montek Singh Ahluwalia* Ajay Mathur*
Final Version: August 21, 2013 Word Count: 12,154 No. of Pages: 29
File Name: 0.4 Sustainable Urban Living
Urbanisation in India: Challenges and Opportunities
Editors - Isher Judge Ahluwalia Ravi Kanbur P K Mohanty
Contents
Page
4.1 Introduction 4.1
4.2 Economising on Electricity Use 4.2
4.2.1 Designing Energy Efficient Buildings 4.2
4.2.2 Promoting Energy Efficient Appliances 4.3
4.2.3 Rooftop Solar Electricity 4.5
4.3 Sustainable Urban Transport Systems 4.6
4.3.1 Sensible Land Use Planning 4.7
4.3.2 Shifting from Private to Public Transport and Non-Motorised
Transport 4.7
4.3.3 Technology to Reduce Fossil Fuel Use 4.10
4.4 Sustainable Water and Sewerage Systems 4.11
4.4.1 Increasing Usable Water Supply 4.12
4.4.2 Reducing Demand through Water Saving Devices 4.14
4.4.3 Sewage Treatment 4.15
4.4.4 Pricing of Water 4.16
4.5 Solid Waste Management 4.18
4.5.1 Scientific Solid Waste Management 4.18
4.5.2 Financial Viability of SWM projects 4.21
4.5.3 Citizen Involvement 4.22
4.6 Conclusion 4.23
Table 4.1 4.26
Bibliography 4.28
4. 1
4.1 Introduction
India’s urban population is projected to increase from about 380 million in 2012 to 600
million by 2030. Since only about half of the urban population can be said to be effectively
served by essential urban services today, achieving universal coverage by 2030 implies that
coverage has to expand from about 180 million to about 600 million over a period of twenty
years! This would be a daunting task under any circumstances. It is made even more difficult
because sustainability considerations imply that the expansion cannot be a mere scaling up of
the existing system: the system itself has to change in important ways to make the process
sustainable.
There can be no doubt that sustainability can only be achieved through active intervention by
the government for the simple reason that externalities cause a divergence between private
and social benefit and government intervention is therefore needed to move the system to a
socially more desirable outcome. Many different types of interventions are possible. These
include price based intervention, including taxes and subsidies to influence behaviour,
regulatory intervention mandating certain actions, and public investment in those cases where
the investment needed for sustainability is unlikely to be forthcoming from private sources.
An optimal response requires a combination of all these instruments, acting in a mutually
supportive manner.
This paper examines what can be done in four areas which are relevant for achieving
sustainable urbanisation. The first two are reducing use of electricity based on fossil fuels in
buildings and reducing the energy used in urban transportation, both of which contribute to
sustainability by containing CO2 emissions. The other two are meeting the demand for water
in our cities in a sustainable manner and ensuring effective management of municipal solid
waste. There are other issues such as density and sprawl, urban bio-diversity and access to
parks for recreational purposes, and organising urban food supply chains, that are also part of
urban sustainability in the larger sense, but these are not dealt with in this paper. In the
concluding section of the paper we comment on some common features of the policy
* We are grateful to the following for many useful comments: Nick Stern, Thomas Heller, Dinesh Mohan, Sunita Narain, Mihir Shah, Rohini Nilekani, Meenu Tewari, Philipp Rode, Dmitri Zenghelics, Geetam Tiwari, Ambuj Sagar, Sunita Sagar, Shantanu Dixit, Daljit Singh and Ashok Sreenivas. We are also grateful to the editors Isher Judge Ahluwalia and Ravi Kanbur for many helpful suggestions. Needless to say, none of them is responsible for any errors that remain.
4. 2
4.2 Economising on Electricity Use
About 30 to 40 percent of total consumption of electricity in the economy occurs in
commercial and residential buildings in urban areas on account of lighting, heating, cooling
and the use of electrical appliances. Anything that restrains the growth of fossil fuel based
electricity needed to meet this demand contributes to making urbanisation more sustainable.
There is scope for intervening on several fronts.
4.2.1 Designing Energy Efficient Buildings
The energy requirements of both commercial and residential buildings for lighting, heating
and cooling can be greatly reduced through appropriate design and orientation of the
buildings to minimise the need for artificial lighting, appropriate ventilation to reduce indoor
temperatures and the use of insulation materials which save energy. The scope is greatest in
commercial buildings, where stringent building regulations can make new construction much
more energy efficient. With commercial space likely to expand at 10 to 13 percent per year
between 2010 and 2030, about 70 percent of the commercial buildings that will be in place in
India by 2030 are yet to be built. Introduction of energy efficient designs now can therefore
make a big difference to energy saving over the next twenty years.
The Energy Conservation Building Code prepared by the Bureau of Energy Efficiency
outlines various specifications that buildings must meet. Although it is not mandatory at
present about 2000 buildings complying with the code have been built or are at various stages
of construction in India and they show a 50 per cent reduction in energy demand compared
with conventional buildings. The logical next step must be to make the Energy Conservation
Building Code mandatory, at least for commercial buildings, as part of the municipal bye
laws, and then enforce the code strictly.. Municipalities could be incentivised to make the
code mandatory by making it a condition for accessing Central Government funds under the
Jawaharlal Nehru National Urban Renewal Mission. The Central Government could also lead
by example by announcing that all new central government buildings, including new public
educational institutions above a certain size, must comply with energy efficiency standards.
Energy efficiency considerations also need to be incorporated into building codes for
residential buildings. Architects engaged in building individual homes, and especially
apartment complexes, need to be sensitised to the options available.
There is scope for retrofitting and this could be publicised by Government action undertaking
well publicised retrofits of existing large buildings, as was done for Rashtrapati Bhavan in
4. 3
2004, yielding a 23 percent fall in energy use. Such retrofits involve some extra expense but
they serve as technology demonstrators which could motivate others in the private sector.
One reason why retrofitting is not popular with owners and managers of existing buildings, is
because they are uncertain of the extent of savings on electricity. Since electricity for
commercial consumers is typically over priced to achieve cross-subsidisation in favour of
lower income households, this should serve as an incentive, especially since commercial
buildings have back up diesel generators which are much more expensive. These factors
suggest that the payback period for investment to save electricity may be relatively attractive
but there is not enough realisation of the potential.
There is evidence that providing managers of buildings with information on their energy use
relative to others in the neighbourhood helps focus attention on the need for energy saving. In
some countries, including the US, local governments set aside some funds for conducting a
certain number of energy audits free of charge. A third party auditor conducts the audit and
submits recommendations to the owner of the building who is free to implement them or not..
Another way of overcoming uncertainty about the benefits is to assign the responsibility for
achieving energy savings to an Energy Service Company (ESCO) which is paid a share of the
savings in the energy bill over a five-year period. This performance-contracting business
model was used in the retrofit of Rashtrapati Bhavan. The process can be encouraged by tax
incentives for such expenditures.
4.2.2 Promoting Energy Efficient Appliances
Improvement in the electrical efficiency of appliances used in buildings is an important
means of reducing the total electricity used. A shift to more energy efficient appliances can
be encouraged through persuasion, by promoting labelling of energy efficiency, or through
compulsion by introducing mandatory standards. Global experience unambiguously
establishes that the imposition of mandatory standards has led to significant improvement in
energy efficiency of many appliances over time.1
Adoption of more efficient appliances can also be incentivised by providing a subsidy which
covers their initial higher cost which can be progressively withdrawn once the cost
effectiveness of the new product becomes evident. This is exemplified by the Bachat Lamp
1 This is illustrated by what happened in the US after the first energy crisis in the early 1970s when the US
Government mandated an improvement in energy efficiency of refrigerators. The higher standards were initially resisted by the industry, but once imposed, they were met relatively easily and indeed were quickly exceeded.
4. 4
Yojana (BLY), launched in 2009 to encourage households to switch from traditional
incandescent light bulbs to much more energy efficient compact fluorescent lights (CFLs).
Under BLY, private companies were identified and incentivised to sell CFLs to consumers at
the same price as incandescent lamps and recover the additional cost and profits from the
carbon credits which could be earned under the Clean Development Mechanism.2 The price
of carbon credits was a little over $ 12 when the programme started, and it was estimated that
as long as the price remained at $6 to $8, it would be possible to price CFL bulbs at the same
price as incandescent bulbs. The price has since fallen to a range of $3 to $4, and the erosion
of the subsidy has meant that new BLY projects are not being registered. It remains to be
seen how the momentum will be revived.
About 30 million incandescent bulbs have been replaced by CFLs under the BLY by 2012
and it is estimated that the reduction in electricity demand amounts to about 1,500 MW of
generating capacity. Kerala has implemented BLY in all households in 2010-11 and it is
reported that the electricity consumption and the peak demand for electricity in the state,
which had been growing at 7 to 10 per cent per year, remained unchanged between 2010 and
2011, and there was no load shedding in summer 2011.3 Looking further ahead, one can
expect a shift from CFLs to LED lights which involve a higher initial cost, but are even more
energy efficient and have a much longer life.
The potential for energy saving in air conditioners is very large.4 India has introduced
performance standards for air conditioners and combined it with a labelling exercise which
enables manufacturers to promote their products on the basis of certified energy efficiency.
Since electricity tariffs for households are higher for higher slabs of consumption, consumers
have a strong incentive to opt for energy efficient air conditioners. This category of
consumers can also pay the initial higher cost in anticipation of operating efficiency
advantages provided they are convinced that the label reflects energy efficiency correctly. It
2 The role of the Government was to register one large CDM programme, within which any number of
smaller geographically distinct projects could be added. The government dealt with the CDM bureaucracy, got the credits and transferred them to the private companies. The electricity distribution company designated a CFL supplier to operate within a defined area of operation. Only 60 W and 100 W bulbs are replaced with 11-15 W and 20-25 W CFLs at the subsidized price, subject to a maximum of four CFLs per customer.
3 The Government of Kerala claimed that this was due to the approximately 300 MW of demand reduction
because of the BLY programme. 4 China’s experience in the expansion of air conditioners use is relevant in this context. Penetration of air
conditioners increased from as low as 2.3% in 1993 to 67% in 2011. A similar transformation in India over the next twenty years would suggest a very large saving if energy efficiency of air conditioners is improved.
4. 5
is estimated that the average efficiency of all air conditioners sold in India, as measured by
their energy efficiency ratio, increased by 23 percent from 2.2 in 2007 to 2.7 in 2011. This
corresponds to a reduction of about 2000 MW in capacity needed to meet peak demand.
Standards and/or labels have also been notified for appliances such as fans, pumps, washing
machines, televisions and computers. The average sales-weighted efficiency of these
appliances has increased by 5 to 7 per cent in the last three years, although in the case of fans
the efficiency increase has been less than 3 per cent. A new programme is being launched to
bring in to the market super-efficient fans, with 50 per cent saving in energy. This is proposed
to be supported by providing an incentive for each such fan sold during the next three years.
The subsidy needed would decrease as economies of scale drive down prices to competitive
levels.5 A similar programme is needed for desert coolers, which are likely to be an important
and growing cooling appliance as incomes rise.
4.2.3 Rooftop Solar Electricity
Rooftop generation of solar photo voltaic (SPV) electricity contributes to sustainability by
reducing the demand for conventional electricity from the grid thus saving on carbon
emissions. The potential is greatest in commercial, institutional and government buildings,
because solar panels need regular cleaning and maintenance, without which efficiency starts
to decline. Until recently, SPV electricity was much more expensive than conventional
electricity, but costs have been falling steadily. The lowest competitively bid tariffs offered in
the Jawaharlal Nehru Urban Solar Mission were around Rs.7 per kWh. Average costs
computed over the life time of the solar equipment are more favourable since there are no
fuel costs in solar PV whereas fuel costs in conventional electricity are certain to rise over
time. On a life time cost basis, solar electricity is already competitive with the cost of diesel
based electricity, and also with inverters, both of which are extensively used as standby
sources to cope with interruptions in power supply. Decentralised generation has the
additional advantage of avoiding transmission and distribution losses. Another advantage of
solar PV is that the potential for generating electricity is at a maximum when the daytime
demand for electricity is at a peak, making it that much more competitive if time of day
tariffs were in place.
5 About 30 million fans are sold in India every year with an average power rating of 70W. This market is
very price sensitive and the labelling exercise has therefore made very little head way. An incentive system would therefore be needed. However, the benefits from reduced energy demand outweigh the expenditure on the incentive by a factor of three or more.
4. 6
India has begun promoting roof top solar energy as part of the Jawaharlal Nehru National
Solar Mission and several states (Gujarat, Karnataka, Tamil Nadu, Chhattisgarh, Kerala and
West Bengal) have taken a variety of initiatives to encourage rooftop SPV. The economics of
rooftop SPV obviously depends on the price of the grid sourced power which it substitutes.
The higher the tariff for electricity charged by the grid, the greater the benefit from rooftop
solar generation. Although “time of day” tariffs have been introduced in some states, the
differential between peak and off peak periods is as yet small. Investment in rooftop SPV
can be encouraged by allowing appropriate tax write-offs for such investments and also
through incentive “feed in tariffs” for feeding surplus power back into the grid as is the case
in Germany. Feed in tariffs subsidise solar generation without a budgetary outgo if the higher
costs are built into the cost structure of the distribution company and recovered from all
electricity consumers by a slightly higher tariff.
Solar hot water systems also save on conventional electricity and are already commercially
viable for institutional buildings such as hotels and hospitals, and for homes in colder
climates. Inclusion of mandatory solar hot-water system installation in commercial buildings
to meet at least 25% of hot-water requirement is already part of the Energy Conservation
Building Code, and the increasing adoption and enforcement of this Code by states would
enhance solar water heater adoption as well. A similar mandatory requirement for inclusion
of solar water heaters in the design of new large homes and apartment complexes could be a
condition for approval of a building plan by municipalities.
The scope for tapping solar energy may seem limited today, but it could become significant
over the next twenty years due to the combined effect of (i) higher costs of conventional
energy generation because of higher costs of fossil fuels, (ii) falling costs of solar electricity,
(iii) rational pricing of electricity for consumers including especially time of day tariffs
reflecting the higher cost to the grid of coping with peak loads and (iv) the introduction of
smart grids that enable integration of decentralised electricity with the grid, with an
appropriate incentive.
4.3 Sustainable Urban Transport Systems
Sustainable urbanisation requires that the transportation needs of cities are met in a manner
which economises on the use of fossil fuels also minimizes vehicular pollution and
congestion. Indian cities face major challenges in these areas. There is an explosion of
personal vehicles reflecting lack of public transport and also aspirational lifestyles, leading to
severe congestion. This is worsened by the mix of vehicles, i.e., two wheelers, three
4. 7
wheelers, cars and buses all travelling at different speeds, generating traffic patterns which
produce high levels of vehicular pollution. Lack of public transport disproportionately hurts
the poor whose transportation needs can only be met by public transport. Solving these
problems call for (i) sensible land use planning, (ii) shifting from private to public and non-
motorised transport, and (iii) new technology, reducing fossil fuel use in transport vehicles.
4.3.1 Sensible Land Use Planning
The transportation problem is partly due to urban planning based on traditional top down
master plans which separate residential areas from business districts generating large
transportation needs as a consequence. Current thinking on urban planning emphasises
simultaneous optimisation of transport needs with land use requirements, discouraging
segregation of residential from commercial or business districts, and encouraging mixed land
use including a mix of low income and high income housing. This greatly reduces the need to
transport large numbers of people to a central business district or workplace.
Since people change jobs, the full benefit from mixed land use can be derived only if people
can move closer to areas where they have found new jobs. . However, in Indian conditions,
this mobility depends on other urban policies. If people cannot easily sell houses in one area
and buy in another, or rent out houses they own in one area and take accommodation on rent
nearer where they work, the logic of mixed land use will be negated. Unfortunately, the
rigidity of our urban land markets inhibit easy sale and purchase of property and our rental
laws inhibit rentals for fear that the tenant will not vacate at the end of the lease period.
Reform of urban land and rental markets is therefore critical for sustainable urbanisation.
Technical and administrative constraints at the city and metropolitan government levels also
come in the way of dealing with land use planning sensibly. Besides the capacity limitations,
problems arise because transport, urban land use, energy, etc. are all handled by different
departments and these departments can often only be co-ordinated at the level of state
governments and not at the city and municipal level.
4.3.2 Shifting from Private to Public Transport and Non Motorised Transport
Shifting from private vehicles to public transport and non-motorised transport (walking and
bicycling) has to be a large part of any sustainable outcome because public transport is
typically much more energy efficient per passenger kilometre and non-motorised transport
(bicycles, walking etc.) is even better. The scope for public transport is more limited in
4. 8
smaller cities because the average trip length is too small for public transport.6For such cities
investment in safe and dedicated non-motorised transport is most important.
One critical element on the supply side in shifting to public transport is the issue of quality of
the transport service available. There is a large demand for a very cheap, no frills, public
transport service for low income commuters which has to be continued. However, higher
income individuals will be willing to switch to public transport only if the service comes up
to higher standards of quality and comfort, albeit at a higher price. There is a case therefore,
especially in the larger cities, to consider two classes of service, with a higher user charge for
the superior class.
Purely publicly operated bus services generally run at a loss because of large operational
inefficiencies, low fares and also multiple taxes. 7 A very good case can be made to subsidise
public transport because of the externalities involved in terms of reducing congestion, but if
cities are unable to offset the effect of low fares by explicit subsidies to cover losses the net
result is poor maintenance, deterioration in quality and an inability to expand the service to
meet demand, all of which encourages all those who can afford it, to rely on private vehicles.
A privately owned and managed bus system could reduce operational inefficiencies and it
could operate subject to strict regulation, but it would need an appropriate combination of an
assured structure of fares plus explicit subsidy which covers cost and provides reasonable
profits. .
Public transport can also be made more attractive relative to personal vehicle use by
introducing Bus Rapid Transit (BRT) systems which give buses an exclusive lane.. BRT
systems have been used very effectively in over a hundred cities around the world and are
now being tried in some cities in India, e.g, Ahmedabad, Delhi, Bhopal and Indore. A BRT
is least resisted when it is introduced where the existing roads are wide enough to
accommodate an exclusive bus lane without crowding the other traffic too much. However,
there is a case for introducing it even in existing crowded corridors since it will operate to the
advantage of those using public transport and to the disadvantage of those using private
transport.
6 Tiwari and Jain (2011) find that the average trip length in small and medium cities is less than 5 k.m. 7 See G. Tiwari & P.S. Kharola (2008)
4. 9
The first Delhi BRT, which was only 5.6 km long, showed a 7% shift to bus, transport
(largely from three wheelers) as a result of the BRT corridor.8 Bus speeds increased by an
average of 20 % (from 12 to 15 km per hour) in the corridor but car speeds either remained
the same, or decreased by 13% (from 15 to 13 kmph). In peak hours the traffic is not faster
moving in BRT corridors than in non BRT corridors but the volume of passengers moved in
the BRT corridors is much larger. The inconvenience caused to those using private transport
led to a challenge to the BRT through a Public Interest Litigation (PIL) in the Delhi High
Court but the Court ruled unambiguously in favour of the BRT on grounds of serving the
public good. The Delhi Government has signalled its intention to go ahead with introducing
fourteen more BRT routes.
Metros are another form of public transport which avoids congestion of roads. The Kolkata
Metro opened in 1986 and was the only metro in the country until 2002 when the Delhi metro
started operating. The Delhi Metro is a state of the art system and is widely seen as providing
a high quality service. New metros are being constructed in Bengaluru, Hyderabad, Mumbai,
Chennai and Cochin. Although metros reduce road congestion they are typically much more
expensive than other forms of public transport.9 They are not necessarily the best option
where traffic is lighter and more geographically dispersed. The financial viability of metros is
also critically dependent on the willingness to pay fares commensurate with costs, failing
which a large subsidy becomes necessary.10 An important factor in favour of metros is that
they create a large and relatively elastic urban transport service capability, which can be
utilised more intensely over time.
Cities that have a low personal vehicle use also have a significant number of walking and
bicycling possibilities. This is actually essential if only to increase ease of access to public
transport. Para-transit modes (three-wheelers and taxis) also help to increase access to public
transport. Use of public transport also depends on public perceptions of safety and security in
moving from the home to the bus or metro stop, and from the bus/metro stop to the final
destination. This is particularly important for women, who may not feel safe in making these
8 See CRRI (2012) 9 The capital cost of a metro per kilometre is 10 times that of a BRT and the passenger carrying capacity only 40 per cent higher. Several studies show that the CO2 footprint of a metro per passenger are higher than for the bus, especially when the electricity used by the metro is coal based (Chaster, M.V./Harvath, A. and Madanobe, S.(2010). 10 The willingness to pay is obviously a function of earning capacity and the value of time saved compared to the time taken by an alternative mode of travel. At low levels of per capita income the willingness and ability to pay is low, making large subsidies unavoidable.
4. 10
essential connective journeys, especially not at all hours. Without safe and assured access,
people will end up buying a personal vehicle and once they have incurred the capital expense
they will have the temptation to use it.
Along with measures to promote public transport, it is also necessary to take measures to
discourage the use of private vehicles. This is not easy if only because there are strong “life-
style aspiration” factors at work, encouraging greater use of cars. One way of discouraging
personal vehicle use is the levy of a congestion charge for vehicles to enter congested areas
(eligibility to enter the area being indicated by a special sticker which can be obtained on
payment). High parking charges in inner city areas can also discourage the use of private cars
for travel to these areas. Imposition of higher annual license fees for all vehicles and an
annual carbon tax based on engine size is sometimes also suggested as a penalty for the
pollution these vehicles generate. However the objective of pollution control is perhaps better
met by enforcing tolerable pollution standards which are effectively enforced.
4.3.3 Technology to Reduce Fossil Fuel Use
Better technology can help reduce energy use in transport, and also control pollution, by (a)
improving the fuel efficiency of vehicles based on the existing technology i.e. the internal
combustion engine and (b) by the development of new generation vehicles, e.g. electric
vehicles based on batteries, hybrid vehicles using batteries and conventional fuels, and in due
course, fuel cell electric vehicles. The major gains over the next ten years will come from
improved fuel efficiency of conventional vehicles because the new generation vehicles are as
yet a small part of the total and this will change only very slowly. The International Energy
Agency (IEA) estimates that conventional vehicles currently account for 95 percent of the
total vehicle sales and this percentage will drop only slowly to around 85 percent between
2020 and 2030, and ultimately to below 30 percent only by 2050.11
Improvements in vehicle fuel efficiency can be achieved by improvement in the fuel itself,
improvements in the engine, and reduction in the weight of the vehicle. Increased fuel
efficiency can be driven by setting mandatory standards as in many other countries. Steps are
being taken in India to increase the fuel efficiency of vehicles in terms of kilometres per litre
by about 27 percent over ten years. The IEA has set much more ambitious global targets
requiring doubling in kilometres per litre by 2030, but as IEA (2012) points out, progress in
this area is behind target.
11 See IEA 2012
4. 11
It is important to ensure that Indian fuel efficiency standards are constantly revised upwards
so that our automotive fleet remains abreast of developments in fuel efficiency. This does
mean higher vehicle cost, which will be resisted by manufacturers fearing a shrinkage in the
market, but as pointed out above, the growth of private automobiles should not parallel what
has happened in industrialised countries. Early action is desirable because the new standards
will only be embodied in the new vehicles sold, which means the impact on total fuel usage
will be evident only much later when the total stock of cars reflects the new standards.
The scope for electric vehicles and hybrid vehicles in India is being explored by the National
Mission on Electric Mobility. Electric vehicles reduce dependence on petroleum fuels and
also reduce local emissions within the city, but the impact on total emissions depends upon
whether the batteries used are powered by electricity based on conventional fossil fuel or on
clean energy such as solar power. In the former case, the impact on total emissions may not
be very different if the CO2 generated in coal fired thermal stations is taken into account.
Progress in this area will depend critically on improved battery technology on which a great
deal of research is being done globally.
Electric powered scooters have begun to make an entry in India and annual sales have
reached 200,000 which is about 5 percent of total scooter sales but less than 2 per cent of the
two wheeler market which is now dominated by motor cycles. The scope is much larger as
evidenced by China, where electric two wheelers sold are 50 percent of total sales. The
economics of electric vehicles would be greatly improved with introduction of time of day
tariffs for electricity, as this would lower the cost of recharging of batteries overnight when
tariffs are low. Installing solar panels in parking areas in offices during the day, to provide
“top up” charges for parked two wheelers at an appropriate price, would also help.
4.4 Sustainable Water and Sewerage Systems
According to HPEC (2011), only 64 percent of the urban population is covered by individual
piped water connections and stand posts, compared with 91 percent in China, 86 percent in
South Africa and 80 percent in Brazil. The duration of water supply ranges from 1 to 6 hours
in most cities, compared with 24 hours in Brazil and China and 22 hours in Vietnam and the
quality is often sub standard. The position regarding sewage treatment is worse: the total
sewage treatment capacity in the country is only about 30 percent of the estimated
requirement and 70 percent of this capacity is in Delhi and Mumbai! Furthermore, much of
the capacity that exists is underutilised because the slums and the so called “unauthorised
colonies” are not connected to the sewer system. The sewage generated in these areas
4. 12
typically flows through open drains to the nearest storm water drain and thence to the river or
other water body with a clear increase in the pollution load. The problem of water pollution is
compounded by uncontrolled discharge of industrial effluents. The net result is that a very
large proportion of the population has to rely on unclean drinking water, with consequent
damage to health and imposition of large treatment costs, both public and private. The poor
suffer much more from these consequences because they live in areas which are poorly
served.
4.4.1 Increasing Usable Water Supply
Urban water demand will almost certainly double over the next ten years, and a
corresponding increase in fresh water supply to urban areas is probably not feasible.
Fortunately, doubling of supply may not be necessary if the large wastage which exists at
present is reduced. Estimates of 40 to 50 percent wastage due to leakage (including illegal
abstraction from pipes) and evaporation are widely accepted as reasonable. A study in
Nagpur showed the wastage to be 70 percent.12 Reducing this wastage to tolerable levels
should be the first priority for increasing usable supply, but in fact cities have tended to look
for new sources of fresh water, often as far as 200-300 kilometres away. This increases costs
on account of longer pipelines, greater possibility of wastage from leakages, and larger
pumping costs. It also creates conflict with local rural communities that are increasingly
unwilling for “their” water to be diverted to meet the needs of a distant city.
The most important factor that will determine the availability of water for the cities is what
happens to water use efficiency in other sectors. Agriculture currently accounts for 80 percent
of water consumption in India and adopting more water efficient technologies in agriculture
is therefore critical for releasing water to meet the growing demand from our cities and
industry. Since, current agricultural practices are extremely wasteful of water and there is
scope for reducing water use through better water management and new cultivation practices,
such as shifting to the system of rice intensification (SRI) and promoting drip irrigation. That
is obviously a very large subject, going well beyond the scope of this paper but we mention it
only as yet another illustration of how solving some of our most serious problems of
urbanisation depends critically on policies applied in other sectors, which are formulated by
completely different agencies of government.
12Wastage is different from water that is not accounted for due to non-payment to the utility. Leakage on account of the latter is actually meeting a demand, although payment is not being made, which of course imposes a financial loss on the water utility.
4. 13
Water use efficiency in industry is also critical. Efficiency in water use in industry can be
increased in two ways: by adoption of more water efficient technologies and processes and by
enforced treatment of waste water and its reuse in secondary activities within or outside the
industry. A comprehensive treatment of this problem is outside the scope of this paper13
However, experience from around the world suggests that once such systems are in place, and
managements begin to make serious efforts at saving water, savings ranging from 15 to 90
percent are possible depending on the sub sector or process considered. The most common
figures for water saving range from 30 to 70 percent. Efficiencies of this order are clearly
worth pushing vigorously.
Many cities around the world are seeking to reduce wastage and leakage by involving private
companies in managing the system, hoping to benefit from potentially higher efficiencies of
suitably incentivised private sector concessionaires. This has been attempted in some cities in
India notably Hubli and Dharwad in Karnataka, Nagpur and Bhiwandi in Maharashtra and
Tirupur in Tamilnadu. Different models of Public Private Partnership (PPP) are possible e.g.
BOT contracts and pure management contracts, and there are examples of each in different
parts of the country with an increasing involvement of domestic players, but the numbers are
still small. In general the state must ensure access to a source of bulk water, determine a
rational water tariff that can be charged to consumers, and also set standards of performance
and delivery, while the private concessionaire bears the cost of constructing or upgrading the
existing infrastructure to manage the system and treat waste water. Depending on the tariff
they are allowed to charge, it may be necessary to provide an explicit subsidy which could be
determined on the basis of competitive bidding. However, the cost to the exchequer could be
lower than the public sector delivery method if the private concessionaire is able to achieve
high levels of efficiency in operation and in collecting water charges. Some of the early city
experiments involving private participation have shown that it is possible to achieve 24x7
water supply. However, raising water tariffs is a politically sensitive issue and is discussed
more fully in the section on pricing of water later in this paper.
The supply of usable water in cities can be increased by exploiting local water bodies which
have been neglected in most cities, with encroachment on water bodies and their catchment
area, leading to shrinkage and inadequate efforts at water harvesting. Mandatory installation
of water harvesting systems in all buildings, with a view to replenishing ground water is a
very workable solution to increase water availability and has been successfully implemented
13 For a more detailed analysis see Mihir Shah (2013).
4. 14
in Chennai and other cities are following suit. These local solutions could provide lower cost
substitutes for more capital intensive and energy intensive water supply schemes bringing
fresh water from distant sources.
The supply of usable water can also be increased by distinguishing between “black water”,
i.e., sewage and “grey water”, i.e., sullage, consisting of waste water from bathrooms and
kitchens. The latter can be treated relatively easily to an acceptable level and recycled for use
in toilets and also for gardening. This is already being done by many large commercial
establishments such as hotels, but it does require a separate plumbing system in a building to
facilitate the use of grey water. High water charges levied on large commercial
establishments make it economical for them to set up their own water treatment facilities
enabling recycling and reuse of grey water. Recycling and reuse can also be mandated by
regulation. Looking ahead, it would be useful to mandate separate plumbing systems in
building plans for all commercial buildings and also for large apartment complexes to enable
grey water to be used in toilets. Water for irrigation in public parks and gardens can also be
provided in the form of grey water by the public utility. This would require additional
investment in infrastructure for its distribution, but it would be cost effective since it would
reduce the cost incurred on treatment of the lower volume of black water.
4.4.2 Reducing Demand through Water Saving Devices
The demand for water in homes and commercial buildings can be reduced by installing water
saving devices. These include dual flush, low water capacity toilets (6 litre per full flush
instead of ten in normal toilets and only 3 litres for a half flush), taps and showers fitted with
aerators which reduce the volume of water used, sensor equipped urinals which also limit
water use, etc. These devices can be pushed by establishing regulatory standards which are
notified well in advance to come into effect three or four years later, giving producers ample
time to adjust by phasing out existing product lines and bringing out new products complying
with minimum standards of water efficiency.14
The Centre for Science and Environment in the 7th Report on the state of India’s
environment (see CSE 2012) has drawn attention to the need to re-invent the toilet itself to
avoid excessive use of water and to enable re-introduction of the nutrients in human faecal
14 For example, Australia which faces growing water scarcity, has promulgated standards whereby no manufacturer can produce or sell a toilet which uses more than 5.5 litres per full flush. The water flushing toilet was first invented in 1596 by John Harrington and patented by Joseph Brahmah in 1778. Changes since then have been marginal except for the amount of water used.
4. 15
matter into the earth. The Report emphasises that the search for alternative technology must
not be relegated to small systems for the poor as it will then never be mainstreamed. The Bill
and Melinda Gates Foundation has taken up the challenge and earmarked $ 370 million to
encourage development of new high technology toilets that do not use water or energy and
which process human waste to produce safe usable products. Experiments like these may well
prove critical in developing the technology that will ensure sustainability in terms of urban
water use.
4.4.3 Sewage Treatment
A large part of the sewage generated in our cities is returned to a river or other water body
without any treatment, leading to pollution of fresh water sources including ground water. In
Delhi, where 45 percent of the population is not connected to the sewerage system, the
problem is now sought to be addressed by building “interceptor drains” which would
intercept the sewage before it enters the storm water drain, and transport it to a sewage
treatment plant. Similar solutions need to be found for other cities including solutions that
rely on localised treatment of sewage without having to transport it over long distances to
centralised sewage treatment plants.
The scope for using low cost technologies that will enable substantial, even if not complete,
cleaning of sewage in open drains, through bio-remediation, also needs to be explored. Such
techniques have worked in the case of the Ahar river in Udaipur using the so called “Green
Bridge Technology” which relies on filtration, bio-degradation and biosorption mechanisms,
using microbes and plants. 15 Fifteen pilot projects, based on this experiment, are being
undertaken in Allahabad, Farukkabad, Patna and Ludhiana. If successful, they may point the
way forward for low cost cleaning systems to supplement large treatment facilities in
managing urban sewage.
Since sustainability of water use implies that the system should take fresh water in bulk from
rivers and lakes and return only treated water back to the natural source, we should aim at
ensuring that 100 percent of the sewage generated in all cities above a minimum size will be
treated by the end of the Thirteenth Plan in 2021-22. Achieving this target involves not only
dealing with the expansion in new urban settlements, but also the large numbers that
currently live in slums and other unauthorised colonies which are not connected to the
sewerage system. Central government assistance under the Jawaharlal Nehru National Urban
15See the 7th State of the Environment Report prepared by the Center for Science and Environment (CSE) 2012.
4. 16
Renewal Mission can be used to achieve this outcome. The “polluter pays principle”, which
is widely endorsed in discussions on sustainability, implies that the cost of the entire cycle
should be borne by the users, with appropriate cross subsidies for the poor to ensure equity,
and special penalties for high polluting units such as industrial users which impose a special
burden on the effort to clean the water. The problems associated with pricing water in urban
areas are discussed in greater detail below.
4.4.4 Pricing of Water
Water charges have traditionally been kept very low in most urban areas, because of the
perception that water is basic to human existence. As a result water tariffs cover between 30
and 60 percent of the operations and maintenance cost of providing water. This does not
cover the servicing of capital cost and it also excludes the cost of sewage treatment. Since
sewage treatment should be viewed as an essential part of the water supply cycle, the cost of
this part of the cycle should ideally be clubbed with the cost of delivering water and
recovered from water users as a group.
The simplest way of recovering water costs is to raise water charges but this is a politically
highly sensitive issue. Resistance to raising water charges is usually justified on equity
grounds but this argument is specious. It is important to emphasise that keeping water
charges low in general does not benefit the poor because piped water connections do not
extend to slums and even where connections exist, water is typically available for very short
periods. Poorer localities, which are not covered or are inadequately covered, have to depend
on water tankers to meet even their basic drinking and cooking requirement and they pay a
much higher price to water tanker operators who are often controlled by mafia like
organisations. The current low water charges therefore amount to a subsidy to those who do
not deserve it.16 This is especially so since the cost of sewage treatment is not covered and
the consequences, in terms of pollution of fresh water sources and ground water, are borne
disproportionately by the poor.
A logical approach to pricing water for urban residential and commercial use is to cost the
entire water delivery cycle, including not only the cost of collecting and delivering fresh
water plus but also the cost of sewage and effluent treatment. A relatively low tariff, which
can be well below cost, can be charged for the first “lifeline” supply slab, which would make
water upto a certain level affordable for all consumers. Subsequent slabs could involve lower 16Municipalities and water and sewerage bodies should ring fence their water-sewage accounts and undertake estimation of costs of service to various categories of consumers.
4. 17
levels of subsidy with higher slabs covering costs fully and providing a surplus to cross
subsidise earlier slabs. Water tariffs for commercial establishment should be at the highest
level incentivising them to reuse waste water as much as possible. This approach will require
a significant increase in water tariffs above present levels, but only for non poor consumers.
Nevertheless there is a danger that it may meet resistance from activist groups speaking on
behalf of consumers and others posturing for political advantage. One solution is to moderate
the initial increase by providing an explicit subsidy from the budget, which could be
eliminated progressively over time during which period consumers will appreciate the
beneficial effect of superior water supply. Progressive elimination of any subsidy from the
budget, relying entirely on cross subsidy, is entirely justifiable since urban local bodies are
starved of funds and it is logical for upper income groups in urban areas and commercial
users to bear the full cost of water treatment directly, instead of indirectly via additional
taxation to finance budget subsidies.. A high level of public awareness of the issues involved,
with an appreciation of the long term unviability of populist solutions is needed to counter
these tendencies.
Ideally, a tariff structure of the type described above should be set by an Independent Water
Regulatory authority on the basis of normative costs of both collecting and distributing water
and treating the water before returning it in an acceptable state to a natural water body.
Representatives of the public and other stake holders must have an opportunity to participate
in the process of tariff setting and comment on the distributional merits of the progressive
tariff structure. The establishment of a Water Regulatory Authority for a state, which could
also pronounce on water tariffs in cities, is an institutional development which could help to
generate broad public understanding and acceptance of higher water tariffs. However mere
establishment of the Authority does not ensure credibility. Experience suggests that it will
take time before new regulatory institutions build up their technical capacity and credibility
to be able to prescribe water tariffs which will be acceptable to consumers. As a first step in
this process, it is necessary to ring-fence the water and sewerage account of the utility so that
cost data become available and are publicly discussed.
The need for higher water charges needs to be delinked from whether the water utility is run
as a public monopoly or through private sector providers subject to regulation. In either case,
we need a tariff cum subsidy structure which covers normative costs, since otherwise the
service will be loss making, maintenance will suffer and expansion will be difficult and in the
end quality will deteriorate. Once the need for a viable tariff structure is publicly accepted,
the issue of whether the service is provided by a public sector utility or a PPP concessionaire
4. 18
can be seen as a separate decision, which can be left to the local political authority. The two
models can compete since given the normative tariff both should make a profit. If the private
sector model does better, it can be left to the municipalities to decide whether to switch.
A related issue in water pricing is that the cost of water will vary from city to city depending
on the overall availability of this scarce resource. This inter-city variation is likely to increase
in future with the consequence that water using activities and industries will have to pay more
where water is scarce. It would be a mistake to try and equalise water charges when costs of
water are widely different.
4.5 Solid Waste Management and Sustainability
The total volume of municipal solid waste (MSW) generated in India is between 65 to 70
million tonnes per year. This includes household waste, institutional waste from offices shops
and hotels, medical waste from hospitals and clinics, waste picked up in the course of street
cleaning, and construction debris. Arrangements for managing this waste are highly
unsatisfactory. Most waste is simply dumped into local waste collection bins from where it is
collected sporadically and transported in open trucks to intermediate transfer stations, and
from there to open dumpsites. Rag pickers work on open garbage dumps to remove
recyclable material (plastic and metal) which they sell to make a living.17 Dumped garbage is
sometimes set on fire to reduce its volume, which not only produces CO2 but, where plastic
waste is mixed in also generates carcinogenic fumes including dioxins and furans. What
remains at the end of this process is dumped unscientifically in what begin as land fills, but
soon become “landhills”, without adequate treatment to prevent leachates seeping into the
ground water and polluting it. Lack of regular street sweeping means that plastic litter left on
the streets ends up clogging the already inadequate drainage system, leading to frequent
flooding.
4.5.1 Scientific Solid Waste Management
The Municipal Solid Waste (Management and Handling) Rules promulgated by the Ministry
of Environment and Forests in 2000 spelt out what should be done for scientific waste
management. However, thirteen years later, implementation lags far behind. The main
elements of the rules are summarised below, with some indication of what is happening and
what needs to be done. 17Removing recyclable material is an important and useful activity and is performed by these informal sector workers at very low cost but at considerable danger to their health since these dumps include hazardous material such as medical waste, which should have been separately incinerated.)
4. 19
(i) Municipalities are required to make arrangements for collecting garbage from households
and commercial units. This could be through some combination of house to house collection
and collection from community dumping bins or dumping areas provided by the municipality.
Most municipalities have some MSW collection systems but they typically collect and
dispose off only a small percentage of the total waste and that too not scientifically.
(ii) Segregation of waste is highly recommended because it enables realisation of value from
selling recyclable waste and processing bio degradable waste. This reduces the volume of
inert waste, which has to be disposed in landfills, to about 10 percent of the volume initially
collected saving enormously on the cost of transporting waste to distant landfills. It also
reduces the demand for landfill space which is an important gain since the larger cities are
running out of suitable landfill sites.18 Ideally, segregation should begin at the household
level and several municipalities have begun experimenting with household segregation and
also segregation at the level of hotels and restaurants to separate recyclable and bio-
degradable waste. Bengaluru has recently made it mandatory and it will be interesting to see
how effectively this is implemented.
(iii) Recyclable waste (mainly paper, plastic and metal) recovered through segregation can be
sold and municipalities need to provide a secure place for storage until volume builds up for
sale. Ragpickers currently perform the function of segregation from open garbage dumps at
present, but it could be done much more efficiently and the revenue generated would cover
part of the cost of management.19
(iv) Bio-degradable waste, once segregated, can be processed either to extract the energy it
contains or converted into soil nutrient or both. Bio methanation produces bio gas, which can
be used as cooking gas or as a fuel to generate electricity, leaving behind a residue which can
be used as a soil nutrient. Direct incineration of waste to produce electricity is another option,
either by using mixed garbage as a fuel or by first converting the waste to refuse derived fuel
(RDF) pellets, which have higher and more predictable calorific content. Mixed waste can
also be converted into gas through pyrolysis or through a plasma process. Direct burning of
mixed waste can produce harmful fumes but these can be scrubbed from the exhaust.
18 Reducing the volume obviously increases the capacity of available sites ten to twenty fold. 19 Concerns are often expressed that corporatisation of waste management would disrupt the livelihood of
rag-pickers. The solution obviously lies in organising the existing rag-pickers to become part of the process, including especially at the level of house to house collection. Civil society organisations can play a critical role in encouraging this involvement and there are many examples where this has been done.
4. 20
(v) Several municipalities across the country are experimenting with all these alternatives
partnering with private firms in different ways. The bio methanation process is viable for
waste quantities of about 5 tonnes per day and can therefore be performed on a decentralised
basis. In Pune, electricity produced through bio-methanation is used by the municipality itself
for street lighting. 20 Pune has partnered with a private firm to set up a 10 MW plant based on
plasma gasification of mixed waste. Delhi has also partnered with a private company to set up
a plant based on burning mixed municipal waste to produce energy. These experiments have
not been without problems. Unexpected variation in the composition of waste, and therefore
the calorific value available has reduced energy output. There have also been concerns about
potentially polluting exhausts leading to resistance from neighbouring settlements. However,
lessons have been learnt and there are a number of waste to energy products in the pipeline.
These include an 8.2 MW plant on a BOOT basis in Bangalore, a 32 MW plant at Narela-
Bawana in Delhi. At present, only about 200 MW of waste to energy capacity has been set up,
but the potential for the country as a whole is estimated at 4000 MW.
(vi) Bio-degradable waste can also be converted into compost and this is being done in
several places.21 Composting takes time and it requires a considerable amount of land to
handle the flow of garbage over the period, and land on this scale may not be available in the
city. However, in most small towns and rural areas, this may be the only viable option. One
problem with marketing compost is that chemical fertilisers are heavily subsidised while
there are no subsidies on compost, making farmers unwilling to pay the higher unsubsidised
price. Some studies have also shown that where the waste contains heavy metals which
cannot be easily removed, the compost from such waste runs the risk of polluting the soil
with heavy metals which would then get into the food chain.
(vii) Residual inert waste which can neither be recycled nor processed has to be sent to
landfills as noted above. Landfill sites must be scientifically designed with floors and walls
lined with impermeable material to prevent leachates from seeping into the ground and
contaminating ground water. They also have to be carefully chosen to minimise
environmental impact on nearby residents, and especially to ensure that children cannot stray
20 It would be more economical to feed the electricity into the grid at peak time at a higher peak tariff and use
grid electricity for street lighting which is typically off-peak. However this depends on state level action to permit feed in tariffs with a sufficient difference in peak and off-peak rates.
21 Composting is widely used in India, with more than 70 composting plants in place, largely in medium
sized cities. Over 25 more new plants are proposed. However, most plants (barring a few such as those at Vijayawada and Suryapet) treat mixed municipal solid wastes, rather than separated organic waste. As a result, the compost yield is low.
4. 21
into the site. Most municipalities are very far from scientific design of landfill sites although
a few pilots have been undertaken.
(viii) Medical waste from hospitals and clinics is obviously a major health hazard and needs
to be treated at the point of origin, with strict supervision to ensure that the method of
disposal conforms to The Bio-medical Waste (Management and Handling) Rules, 1998 health
requirements. While the situation has improved substantially with the participation of the
private sector and the creation of common treatment facilities, there is concern that many
hospitals and clinics may not be observing these restrictions. Effective enforcement of
medical waste disposal rules is absolutely essential, and calls for strengthening of the
administrative capacity at the local level.
The Municipal Solid Waste (Management & Handling) Rules, 2000 prescribe that the State
Pollution Control Boards should report the state of compliance to the Central Pollution
Control Board which prepares a consolidated annual report. The latest report of the CPCB
(2010-11) shows that compliance is very weak in many states. Out of 3625 Urban Local
Bodies that are recorded, only 2806 reported the state of implementation of SWM rules. In
Bihar for example, which has 140 municipalities, none of them are said to be complying with
the SWM provisions. The number of municipalities putting in modern systems of waste
management is growing, but it falls far below what is needed. The Jawaharlal Nehru National
Urban Renewal Mission, which includes MSW as one of the eligible activities for which
funding is provided, has helped energise action by many municipalities and over 100 MSW
projects have been sanctioned in JNNURM-1 (see Government of India, Ministry of Urban
Development 2012).
4.5.2 Financial Viability of SWM projects
Slogans such as “From Waste to Wealth” are often invoked to promote SWM projects and
they give the impression that processing of waste can be financially viable on its own. This is
misleading. Scientific SWM can certainly generate some revenue from the sale of recyclable
waste and the electricity or compost generated, but this does not cover the full cost of
creating an end to end infrastructure for solid waste management. Some net financial burden
will remain which has to be borne by the municipality but the important point is that this
burden is much smaller than it would be if waste has to be scientifically disposed without
processing to extract value. In other words, SWM, with processing of waste, reduces the total
cost that has to be borne by the local government but a residual cost remains which has to be
financed from tax revenues and/or grants from the State Government and/or Central
4. 22
Government. Unfortunately most municipalities and urban local bodies do not enjoy a
sufficiently large tax base and devolution is also much less than it ought to be. Satisfactory
resolution of municipal financing problems is essential for effective financing of scientific
SWM and indeed for all the other initiatives which promote sustainability.
Involving private players in the task of processing solid waste through revenue generating
projects, such as in the case of waste to energy, can help extract the maximum value from the
waste and thus limit the need for public sector funds. For example, a power plant based on
burning garbage can be made viable if (a) a reasonable tipping fee per truckload is paid for
the garbage collected for delivery to the plant and (b) a reasonable tariff is offered for the
electricity produced. While paying the tipping fee is a cost, it has to be kept in mind that it
avoids the cost of transporting the garbage to a landfill and also saves in landfill costs.
Similarly, in fixing the electricity tariff, the viability of the project would be helped if the
tariff is fixed at the marginal cost at which the distribution system buys electricity rather than
the average cost. Here again there is the problem of coordinating multiple public agencies:
the price which the electricity utility is willing to pay for the power is fixed by the utility and
the electricity regulator and not the municipality.
There is a strong case for developing a template that will sensitise municipalities to all these
issues. These must be kept in mind in developing model concession agreements for SWM
PPPs which can then be awarded on a transparent and competitive basis to private parties
meeting well defined pre-qualification criteria. Competition can be in terms of a minimum
viability gap funding for which concessionaires can bid given a pre-determined tariff for the
electricity generated. The municipality can determine whether the gap funding required
makes the arrangement cost effective considering the cost of other alternatives for scientific
handling of solid waste.
4.5.3 Citizen Involvement
Mobilising citizens to demand standards of solid waste management and to push the local
government to deliver will help produce results. In 1994, when Surat saw the outbreak of a
plague like disease, the outbreak shocked both the authorities and the public and the two
collaborated closely to transform the city in less than two years into one of the cleanest cities
in India. Citizens were motivated to keep the city clean and defaulters were penalised with on
the spot penalties rather than with the initiation of judicial proceedings.
4. 23
Citizen involvement can be increased by introducing IT based complaint systems, allowing
citizens to register complaints about SWM, followed by action taken reports on each
complaint being put in the public domain. Hyderabad introduced a very effective mechanism
when the cleaning of community garbage bins was outsourced to a private company. Citizens
were given the facility of reporting non-performance by SMS messages which led to
corrective action and reporting of compliance. The Hyderabad Municipal Corporation
recorded clearing of garbage every day from designated collection points by taking a
photograph of the cleaned bin by a mobile phone and uploading it as a record. Where the
service provider was shown to have defaulted and failed to take corrective action within the
stipulated time, there was a deduction from the contract payment due.
4.6 Conclusions
A summary of the different types of interventions involved in the four areas discussed in this
paper, and the corresponding government organisations responsible, is given in the different
panels of Table 1. It is evident from the Table that there are multiple policy interventions that
can contribute to sustainability in each of the four areas discussed and there are different
levels of government responsible for each of them. The good news is that almost everything
is being done somewhere, but it is as yet only on a limited scale. The challenge is how to
scale up these efforts so that they add up to a general strategy that can make a significant
difference over a twenty year period. We draw four general conclusions from our analysis.
A successful strategy for sustainability in each area must rely on a combination of
interventions. These include regulatory interventions, price interventions including price
setting and tax cum subsidy type interventions, and in some areas public investment. Price
intervention alone will definitely not suffice because the price changes required to change
behaviour in many of the areas may be too large to be politically acceptable. Regulatory
intervention through mandatory prescription of action for economic agents is therefore
essential in many situations. It is often also more politically acceptable than the price
intervention that would be needed to have the same effect. Thus the growth of electricity
demand in cities is best contained by a combination of mandatory building regulations, which
prescribe energy saving features, the introduction of mandatory energy efficiency standards
for critical electrical appliances, plus incentives to add rooftop solar generation with the
possibility of feeding surplus power back into the grid. These interventions will be most
effective if supported by rational electricity pricing, including full cost pricing of
conventional electricity, with time of use tariffs for the consumer. Public investment can also
4. 24
play a role by making new government buildings energy efficient as “technology
demonstrator projects”, which aim at setting exemplary standards exceeding minimum
statutory levels. A similar case for action on multiple fronts can be made for each of the other
sectors as outlined in Panels B, C and D of Table 1.
The need to act on multiple fronts in a mutually supportive manner poses serious problems of
coordination because, as shown in Table 1, the individual instruments are typically controlled
by different government agencies, some of which may even be distributed over different
levels of government (centre, state and municipal). For example, evolving a rational urban
transport policy for a city involves co-operation between different agencies of the city dealing
with land use planning and transport and within transport between different agencies dealing
with bus transport and metros, and indeed even the police for providing security in public
places especially for women. At times, the policy coordination needed is across sectors which
otherwise seem remote, e.g., ensuring sufficient access to water for urban needs in future
depends critically on our ability to shift towards water saving practices in agriculture and
industry. Since government agencies typically act in silos, they are unlikely to take
coordinated steps in their area to promote objectives which they see as peripheral unless
special efforts are made at a higher level to mandate such coordination. This is difficult
enough when all actions lie in different agencies of the same level of government; it is that
much more difficult when coordination is needed across different levels of government.
Our analysis also strongly suggests that policies supporting sustainability will succeed only if
they are financially viable, and not dependent on unrealistic assumptions about subsidies to
sustain them. For example, ensuring effective sewage treatment to avoid pollution involves
costs, as do many of the policies for sustainable solid waste management. While some of
these costs can be borne by the government, especially where public investment is
unavoidable and a commercial return is not expected, the bulk of the costs have to be borne
by urban residents either in the form of higher user charges or pollution charges, or indirectly
through higher property taxes. A strong case can be made to protect the weakest sections of
the society. It is perfectly possible for example, to ensure that the poor are suitably insulated
from a rise in water charges by consciously building cross subsidisation into the user charge
structure, but that only means the non-poor have to bear a higher burden. Sustainability
cannot be achieved by assuming that all economic agents can escape the costs of adopting
sustainable solutions because the government, at various levels Centre, State and local, can
somehow bear the costs out of their budgets.
4. 25
Finally, the greatest hope for achieving sustainability in an affordable manner lies in the
possibility that technology will evolve over time to reduce the costs of sustainable solutions.
For example, the costs of solar powered electricity have been falling steadily because of
technological change and if these costs continue to fall, as is expected, solar power could
become competitive with the cost of electricity generated by new conventional thermal plants.
This is especially so if the current underpricing of coal and natural gas is progressively
eliminated. Similarly, improved energy efficiency in appliances and in fuel efficiency in the
automobile sector could make a major contribution to finding sustainable solutions to urban
electricity use and transportation problems. As the global search for greater energy efficiency
and exploitation of renewable energy alternatives intensifies, one can hope for major
technological breakthroughs in several areas which could make sustainable urbanisation a
less daunting challenge than it does at present. An obvious implication is that our policies
must provide full scope for absorbing new cost effective technologies as they arise.
We have not attempted to make quantitative assessments of how much impact a sustained
effort at sustainability can have over a decade or two if all instruments are deployed in an
optimal fashion. This can be done in principle, but it is a much larger exercise outside the
scope of this paper, and all such estimates have substantial margin of error. However, one can
certainly say that it will have a significant impact, and that impact will expand as new
technology is developed. Whatever the uncertainties at this stage, the balance of advantage
lies in starting early.
4. 26
Table 4.1: Multiple Points of Intervention Area of
Intervention
Policy Intervention Level of
Government
A
Restraining Electricity use in Buildings
1. Mandatory Energy Efficient Building Design
City Governments State Governments
2. Implementing Energy Efficiency in New Buildings and Retrofits in old buildings
Central Government State Governments
3. Pricing of electricity to reflect costs and incentivise savings
Central govt. for pricing of coal. State Electricity Commissions for pricing of electricity
4. Setting mandatory energy efficiency standards for electrical appliances Central Government 5. Encouraging rooftop SPV connections which can feed back into the grid.
State Electricity Distribution Companies
6. Introducing time of use electric metering to incentivise energy savings in peak hours
State Electricity Regulatory Commissions
7. Tax Incentives for expenditure on retrofits and for installation of rooftop SPV
Central Government
B.
Sustainable Urban Transportation Solutions
1. Sensible Land Use Planning in Cities City Planning Authorities 2. Urban property laws (sale and rental) which facilitate mobility
Central Government & State Governments
3. Ensuring provision of reliable and good quality bus transportation in cities
City Government and Road Transport Corporations
4. Provision of metros in large cities City Govt. and Metro Corporations
5. Rational planning of roads with features such as BRT, footpaths, cycle-ways, etc.
City Government
6. Institution of disincentive parking charges in congested areas to discourage parking of private vehicles
City Government
7. Differential taxation on buses and cars to incentivise public transport
State Government and Central Government
8. Imposition of “Congestion Charges” to allow private vehicles into congested areas
City Government
9. Improved fuel efficiency standards Central Government 10. Maintaining fuel price differentials which discourage private transport, i.e., petrol prices higher than diesel prices with a high tax ab initio on diesel powered cars
Central Government
11. Incentivising electric vehicles and hybrid vehicles through differential taxation and preferential depreciation rates.
Central Government
C.
Sustainable water use in Cities
1. Increasing water use efficiency in agriculture and industry to make room for expanding urban water demand
Central and State Governments
2. Reducing wastage and leakage from existing water utilities by improving efficiency in the system including by introducing private sector concessionaires
State Governments and city authorities
4. 27
3. Increasing local availability of water in surface water reservoirs and through ground water recharge and water harvesting
State Governments and city authorities
4. Treating “grey water” (sullage) to acceptable levels and recycling for some purposes
City authorities
5. Promoting use of water saving devices (low flush toilets, taps with aerators, etc.) by setting standards
Central Government
6. Comprehensive treatment of sewage City authorities and State Pollution Control Boards
7. Appropriate water pricing to cover cost of delivering fresh water and treating sewage
City authorities and State Water Regulator
8. Establishment of a Water Regulatory Authority to establish equitable and financially viable user charges for water
State Government
D.
Solid Waste Management
1. Municipalities to make arrangements for collecting 100 percent of the waste segregating at source if possible, and processing to extract value.
City authorities to be enforced by State Pollution Control Boards
2. Organising different ways of extracting value from waste including sale of recyclable waste (plastic and metal) and processing of bio-degradable waste to produce compost/energy
City authorities in consultation with technical consultants
3. Promoting establishment of waste-to-energy plants with suitable incentivisation of private public partnerships including payment of an incentive tariff for electricity generated.
City authorities and State Distribution Companies supported by State Electricity Distribution Commissions
4. Organising scientific landfills for disposal of residential inert waste
City authorities
5. Organising citizen involvement in solid waste management by empowering citizens groups to register complaints which can be tracked through imaginative use of IT.
City authorities in partnership with resident welfare authorities and civil societies
4. 28
Bibliography 1. Central Pollution Control Board (CPCB). 2010-11. Consolidated Annual Review Report (CARR) on Implementation of the Municipal Solid Wastes (Management and Handling) Rules, 2000. 2. Central Road Research Institute (CRRI), 2012, “Evaluating Bus Rapid Transit (BRT)
Corridor Performance from Ambedkar Nagar to Moolchand, Delhi, Central Road Research Institute (CRRI), 2012.
(Can be downloaded from http://crridom.gov.in/sites/default/files/brt-final-report.pdf ) 3. Centre for Science and Environment (CSE). 2012. 7th State of the Environment
Report: Excreta Matters. 4. Chester, M. V., Horvath, A., and Madanat, S. 2010. Comparison of Life Cycle Energy
and Emissions Footprints of Passenger Transportation in Metropolitan Regions”, Atmospheric Environment, Volume 44, Issue 8.
5. High Powered Expert Committee (HPEC) for Estimating the
Investment Requirements for Urban Infrastructure Services, Report on Indian Urban Infrastructure and Services, 2011. Chairperson Ahluwalia, Isher Judge. (can be downloaded from http://www.niua.org/projects/hpec/FinalReport-hpec.pdf )
6. International Energy Agency (IEA). 2012. World Energy Outlook. 7. Jain, D. and G. Tiwari. 2011. Impact of Strategies changing the Infrastructure of
NMV and Buses on Accessibility of Urban Residents, Urban Mobility India Symposium, Delhi, 3-5 December. (can be downloaded from http://iutindia.org/urban2011/index.php?option=com_content&view=article&id=71&Itemid=39 )
8. Kharola, P. S. and G. Tiwari. 2008. Urban Public Transport Systems: Are Taxation
Policies Congenial for Their Survival and Growth”, Economic and Political Weekly, volume XLIII, No. 41.
9. Ministry of Urban Development, Government of India. 2012. Compendium of
Projects under Jawaharlal Nehru Urban Renewal Mission. (can be downloaded from http://jnnurm.nic.in/wp- content/uploads/2012/11/Compendium-Projects-amp- Reforms-JnNURM-MoUD, July-12-Vol-01Part-01.pdf )
10. Shah, Mihir 2013. “Water: Towards a Paradigm Shift in the 12th Plan”, Economic and
Political Weekly, January 19, 2013. 11. Singh, D. and G. Sant. 2011. Strategic Actions for Rapid Implementation of Energy
Efficiency, Prayas, (can be downloaded from http://www.prayaspune.org/peg/publications/item/156.html )

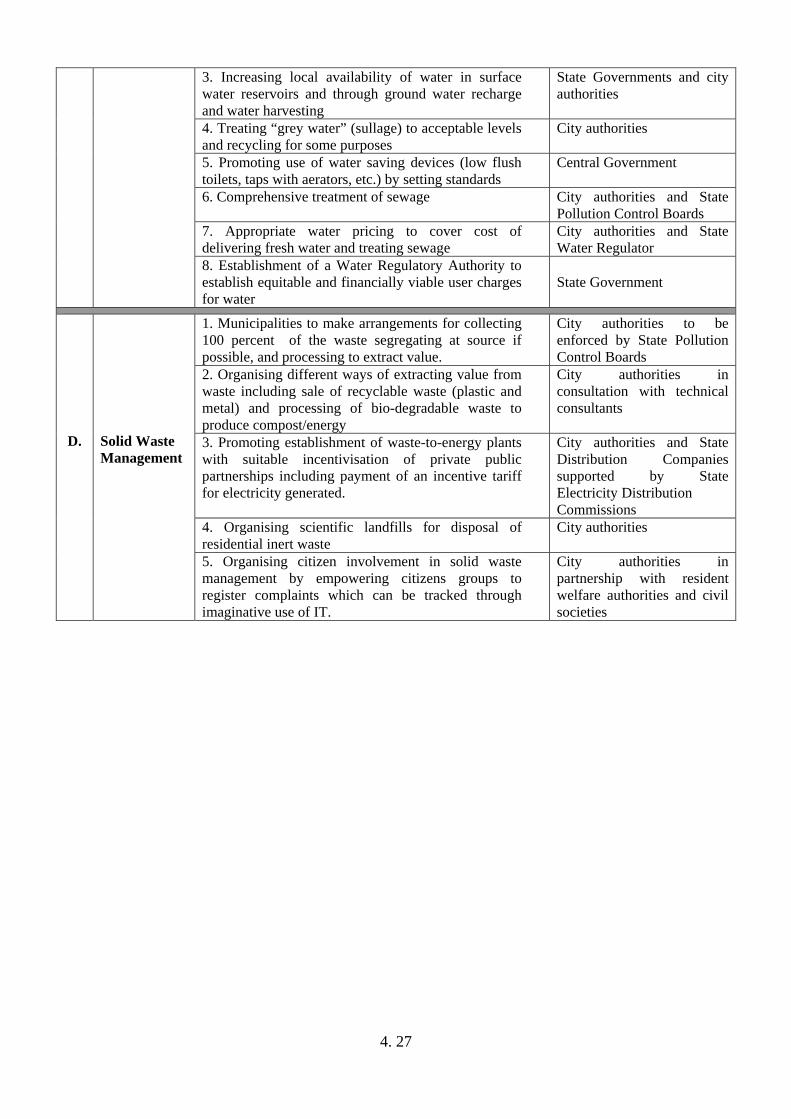


![[Nordic GBC Conference 2013] Sustainable Urban Living - Case: Espoon Adjutantti](https://static.documents.pub/doc/80x56/55a1b49e1a28abaf538b4803/nordic-gbc-conference-2013-sustainable-urban-living-case-espoon-adjutantti.jpg)


