Sustainable Water Utilisation in African Breweries - current practices and prospects A sector study and framework analysis of water consumption in African breweries with focus on the situation in Ethiopia, Ghana, Morocco and Uganda. Prepared for UNEP’s project on African BREwery sector Water saving initiative (ABREW)
Transcript
Sustainable Water Utilisation in African Breweries
- current practices and prospects
A sector study and framework analysis of water consumption in African breweries with focus on the situation in
Ethiopia, Ghana, Morocco and Uganda.
Prepared for UNEP’s project on African BREwery sector Water saving initiative
(ABREW)
i
FOREWORD
Africa is generally endowed with abundant water resources although its distribution and availability for use varies widely with quite a number of countries facing water shortage and water stress. Regional and national water figures often conceal the dramatic effects of local water scarcity, limited or polluted supplies and inadequate distribution systems, while access to fresh water has been identified repeatedly as a key factor for development. Water policies and conservation efforts tend to focus on the supply-side for domestic and agricultural use, less commonly on industrial needs. Under these circumstances the uncontrolled use of a limited resource by water intensive industries such as breweries and bottling plants takes on a special significance.
This study is intended to bring to greater prominence the situation of the African brewing industry with respect to water use. The cleaner production approach is known to dramatically reduce resource consumption while at the same time increase process efficiency. Improved efficiency also has positive financial implications as it means less money wasted on valuable resources released to the environment. These simple and seemingly obvious facts raise the key question of why this is not occurring automatically in the industry without the stimulus of outside intervention.
This study was undertaken as part of the African BREwery sector Water saving initiative (ABREW), a project aiming at assessing the needs and opportunities for reducing water use and wastewater generation from the brewery sector in Africa, by applying the cleaner production approach. This report was compiled by a multidisciplinary team drawn from a variety of African and other countries, under the leadership of the United Nations Environment Programme (UNEP). Already the results of this brief study show that much can be done to enhance the efficiency and environmental performance of the African brewery sector in the framework of a structured programme of cleaner production process and product improvement.
However, the highlights also shows that more work is needed in some areas and that further environmental improvements will depend on better data collection methods. It is hoped that this work provides a starting point for a wider commitment by the brewing industry and governments to work together in helping to make the brewery sector a major component of a sustainable regional industry for the benefit of all Africans.
ii
ACKNOWLEDGEMENTS
This report has been prepared under the overall guidance of a technical working group that was facilitated by Niclas Svenningsen and Desta Mebratu from the UNEP Division of Technology and Economics (DTIE).
The African Roundtable on Sustainable Consumption and Production (ARSCP) through the National Cleaner Production Centres (NCPCs) in Ethiopia, Ghana, Morocco and Uganda undertook sectoral study framework analysis at the counties level. Danbrew in partnership with the Ugandan Cleaner Production Centre undertook the in-plant assessment in two breweries in Uganda. Technical support and input for the sectoral study and framework analysis was provided by the Pollution Research Group of the University of Kwazulu-Natal. Additional technical assistance on the report structure and content was provided by Fritz Balkau. Stephanie Fennessy did the final proof reading and editing.
We would like to acknowledge the valuable contribution that was made by members of the technical working group. We would like to thank the partner institutions, which took responsibilities for specific tasks, namely: The African Roundtable on Sustainable Consumption and Production (ARSCP), the Pollution Research Group of the University of Kwazulu-Natal, the Ugandan Water Resource Management Department (WRMD) and Danbrew. We would also like to thank Danida for providing financial support to undertake this activity.
iii
ABBREVIATIONS
ABREW African BREwery sector Water saving initiative ARSCP African Roundtable on Sustainable Consumption and Production BOD Biochemical Oxygen Demand CEI Continuous Environmental Improvement CEO Chief Executive Officer CGEM Confederation of Moroccan Enterprises CIP Cleaning In Place COD Chemical Oxygen Demand CP Cleaner Production CSR Corporate Social Responsibility DTIE Division of Technology, Industry and Economics DWD Directorate of Water Development (Uganda) EIA Environmental Impact Assessment EMIA Ethiopian Manufacturing Industries’ Association EMP Environmental Management Plan EMS Environmental Management System EPA Environmental Protection Agency (Ghana) EPRPD Environmental Performance Rating and Public Disclosure GRI Global Reporting Initiative IFRC International Federation of Red Cross and Red Crescent Societies ISO International Organisation for Standardisation KPI Key Performance Indicator NCPC National Cleaner Production Centre NEMA National Environmental Management Authority UGX Uganda Shillings UMA Uganda Manufacturers’ Association UN United Nations UNDP United Nations Development Programme UNEP United Nations Environment Programme UNESCO United Nations Educational, Scientific and Cultural Organization UNICEF United Nations Children’s Fund UNIDO United Nations Industrial Development Organization USD US dollar WBCSD World Business Council for Sustainable Development WRMD Water Resources Management Department (Uganda)
iv
EXECUTIVE SUMMARY
Africa is generally endowed with abundant water resources although its distribution and availability for use varies widely with quite a number of countries facing water shortage and water stress. Regional and national water figures often conceal the dramatic effects of local water scarcity, limited or polluted supplies and inadequate distribution systems, while access to fresh water has been identified repeatedly as a key condition for development. Water policies and conservation efforts tend to focus on the supply-side for domestic and agricultural use, and less commonly on industrial needs. Under these circumstances the uncontrolled use of a limited resource by water intensive industries takes on a special significance.
Breweries are a widespread industry in Africa and brewing is intrinsically a water intensive industry. According to the sectoral study and framework analysis conducted in Ethiopia, Ghana, Morocco and Uganda, water consumption and specific use (hl water / hl beer) varies greatly between breweries in the study countries and ranges from 7.2 hl/hl in Uganda to 22 hl/hl in Ethiopia. Most breweries are still far from the accepted international best practice benchmark of 6.5 hl/hl, let alone the best technology level of 4 hl/hl. Most African breweries are privately owned – often by multinational parent companies, which are expected to uphold the principles of corporate social responsibility in their operations.
Breweries in Ghana, Morocco and Uganda already compete for water with other industrial and domestic users, while Ethiopian breweries contend with irrigation for crop farming. In addition, wastewater treatment is often minimal, affecting receiving water bodies and threatening water supplies of other users and neighbouring communities. The acute shortage of fresh water in urban centres and the dependence of nearby rural communities on rivers that are used by breweries are already source of conflict and dispute in some countries.
The four governments in the study countries, through their respective water policies, have made some degree of commitment towards efficient use of water resources, but most of these policy interventions focus on supply-side policies for domestic and agricultural use, and less commonly on industrial needs. Water conservation policies and awareness is generally poorly developed in all four study countries, and there are no government programmes specifically tailored to promote water conservation in the brewery sector. While some water and effluent legislation, policies and similar instruments exist in all four countries, these do not focus on sustainable water use and furthermore are not being strictly applied. In particular, the notion of water management in a systematic way still needs to be further developed.
Staff awareness levels vary significantly between individual breweries, however, in breweries with functional environmental management systems appear more aware of the importance of saving water. Some of the breweries in the study already use specific water consumption as a key benchmarking tool for monitoring their performance and/or are in the process of implementing environmental management systems (EMS) – particularly multinational owned breweries. However, economics of water savings are not fully understood in most breweries and particularly indirect costs of water use are often overlooked in corporate accounting exercises.
African countries have been slow to incorporate environmental management systems requirements into their regulatory approach. Nonetheless, several breweries in Africa have adopted ISO 14 000 standards, largely driven by market interests. Hence, this is often seen as a benchmarking exercise undertaken for public relations
v
purposes only rather than a tool for improving environmental performance and sustainability.
However, cleaner production audits show that there is still great potential to improve the materials and energy balance of the processes in a plant to identify excessive releases and risks, and to identify options to improve the situation through technology change and improved operation.
The sectoral study, framework analysis and in-plant assessment conducted in selected pilot countries and industries led to the following specific conclusion besides the points highlighted above:
• The efficiency levels of African breweries can at best be described as medium, hence leaving many opportunities for improving water use efficiency.
• Competition for clean water will only intensify further, however, awareness is still limited among brewing industry, government and public.
• Currently, the primary drivers for reduced water consumption and pollution reduction are corporate environmental policies of multinational companies active in the brewing industry. Other drivers, such as regulation, water fees or general public pressure appear to be relatively weak.
• Cleaner production has the potential to make a major contribution to reducing water consumption in African breweries.
• There is a shortage of adequate data to allow for more detailed decision-making at all levels, plant to national.
• The use of financial instruments has not been fully explored in order to influence water use.
• At the regional level, there is no business framework for information exchange or technical cooperation.
The following are some of the key recommendations that came out of the study conducted under the African Brewery Sector Water saving initiative:
• Further work is required to reduce water use in African breweries. • A major effort still needs to be made in all stakeholder groups to raise
awareness on the importance of improved water management and on the means to achieve it.
• Better information on water allocation, water use and discharge would allow for more effective application of government policy.
• At corporate level, improved monitoring, target setting and reporting could improve on water management.
• Cleaner production should be promoted as a process efficiency enhancement tool and its use should explicitly include environmental cost accounting.
• Governments should make better use of financial instruments, such as water abstraction and discharge fees in order to encourage water saving goals.
• Water management targets should be more explicitly included into environmental management tools, and in public outreach and communication.
• Existing business networks, local partners, NCPCs and regional forums should be used to sensitise pan-African business leaders in the brewing sector on the importance of sustainable water management.
The conclusions of this study are likely to apply to most African countries, as improved water management is an important objective across the entire continent. It is therefore recommended to develop a comprehensive follow-up programme, which includes the provision of a more focused and prolonged cleaner production outreach in the African brewery sector and promotes an active public-private partnership on water utilisation.
vi
TABLE OF CONTENTS
FOREWORD .............................................................................................................................. I ACKNOWLEDGEMENTS ......................................................................................................... II ABBREVIATIONS.................................................................................................................... III EXECUTIVE SUMMARY.......................................................................................................... IV TABLE OF CONTENTS........................................................................................................... VI 1. INTRODUCTION...................................................................................................... 1
1.1. DESCRIPTION OF THE BREWING PROCESS .................................................................... 2 1.2. WHAT IS CLEANER PRODUCTION (CP)?....................................................................... 4
2. INDUSTRY SECTOR DESCRIPTION ..................................................................... 6 2.1. BREWERIES IN AFRICA ................................................................................................ 6 2.2. ANNUAL PRODUCTION AND FORECAST.......................................................................... 6 2.3. OWNERSHIP OF THE BREWERIES ................................................................................. 7 2.4. ROLE AND FUNCTION OF INDUSTRY ASSOCIATIONS ....................................................... 7 2.5. ECONOMIC PERFORMANCE (ANNUAL TURNOVER AND NET RESULTS) .............................. 7 2.6. NUMBER OF EMPLOYEES PER BREWERY....................................................................... 8
3. BACKGROUND INFORMATION ON WATER USE ............................................... 9 3.1. NATIONAL WATER USE SITUATION ................................................................................ 9 3.2. LOCAL WATER SITUATION IN THE AREAS WHERE THE BREWERIES OPERATE .................. 10 3.3. IMPACT ON WATER USE AND EFFLUENT DISCHARGE TO WATER BODIES......................... 11 3.4. GOVERNMENT PRIORITIES ON WATER SAVINGS........................................................... 12 3.5. LEGAL RESPONSIBILITY OF NATIONAL AND LOCAL AUTHORITIES AND INDUSTRY IN
IMPLEMENTING WATER USE AND SAVINGS PLANS......................................................... 13 4. AWARENESS ON WATER USE........................................................................... 14
4.1. AWARENESS AMONG STAFF IN THE BREWERIES ON THE NEED TO SAVE WATER ............. 14 4.2. AWARENESS AMONG GOVERNMENT OFFICIALS ON THE NEED TO SAVE WATER .............. 15 4.3. CULTURAL EXPECTATIONS ON BREWERIES AND CORPORATE RESPONSIBILITY .............. 15 4.4. INFLUENCE OF SOCIAL NETWORKS, BUSINESS NETWORKS, AND RELIGIOUS NETWORKS. 16 4.5. MEDIA REPORTS ON WATER USE IN BREWERIES OR ON WATER ISSUES IN GENERAL ...... 16 4.6. BREWERIES ENGAGEMENT IN COMMUNITY SUPPORT WORK RELATED TO WATER
ACCESS/WATER SAVINGS .......................................................................................... 16 5. PUBLIC INSTRUMENTS USED TO INFLUENCE WATER USE ......................... 18
5.1. POLICIES ENACTED TO PROMOTE WATER SAVINGS IN THE SECTOR............................... 18 5.2. EFFICIENCY OF THE EXISTING LEGISLATION ................................................................ 19 5.3. FINANCIAL INSTRUMENTS USED TO INFLUENCE WATER USE ......................................... 20 5.4. LESSONS LEARNED ................................................................................................... 20
6. ECONOMICS OF WATER SAVINGS.................................................................... 21 6.1. COSTS INCURRED BY BREWERIES FOR USING WATER.................................................. 21
vii
6.2. AWARENESS OF BREWERIES OF THE REAL COSTS FOR WATER USE/DISCHARGE............ 21 6.3. LEVEL OF AWARENESS AMONG ACCOUNTANTS, BANK OFFICIALS AND GOVERNMENT
OFFICIALS ON THE CALCULATION OF COST-BENEFITS FROM INVESTMENTS IN CLEANER PRODUCTION ............................................................................................................ 22
6.4. AVAILABILITY OF FINANCIAL SUPPORT FROM THE PUBLIC AND PRIVATE SECTOR FOR WATER EFFICIENCY MEASURES .................................................................................. 22
7. CORPORATE MANAGEMENT ASPECTS........................................................... 23 7.1. CORPORATE COMMITMENT........................................................................................ 23 7.2. ENVIRONMENTAL MANAGEMENT SYSTEMS (EMS) IN THE BREWERY SECTOR............... 23 7.3. USE OF ENVIRONMENTAL IMPACT ASSESSMENT (EIA) FOR CORPORATE ACTION.......... 24 7.4. PRODUCT ISSUES AND ECO-LABELLING...................................................................... 24 7.5. ENVIRONMENTAL REPORTING REQUIREMENTS IN BREWERIES ...................................... 24 7.6. CLEANER PRODUCTION AUDITS IN BREWERIES............................................................ 25 7.7. CORPORATE COMMITMENT AND REPORTING ON WATER ISSUES IN BREWERIES ............. 26
9. BIBLIOGRAPHY.................................................................................................... 34 9.1. INTERNET RESOURCES ............................................................................................. 35
ANNEXES……………………………………………………………………………………………. 36
LIST OF TABLES Table 1.1: Areas in which resource consumption may be reduced........................................... 4
Table 2.1: Overview of breweries and their products in each country ...................................... 6
Table 2.2: Annual beer production by country........................................................................... 6
Table 2.3: Overview of economic performance of the brewery sector ...................................... 7
Table 2.4: Summary of employment numbers for the brewery sector ...................................... 8
Table 3.1: Water resources per country .................................................................................... 9
Table 3.2: Overview of water use in surveyed breweries.......................................................... 9
Table 3.3: Overview of effluent discharged from the surveyed breweries .............................. 11
Table 5.1: Summary of financial instruments used to influence water supply......................... 20
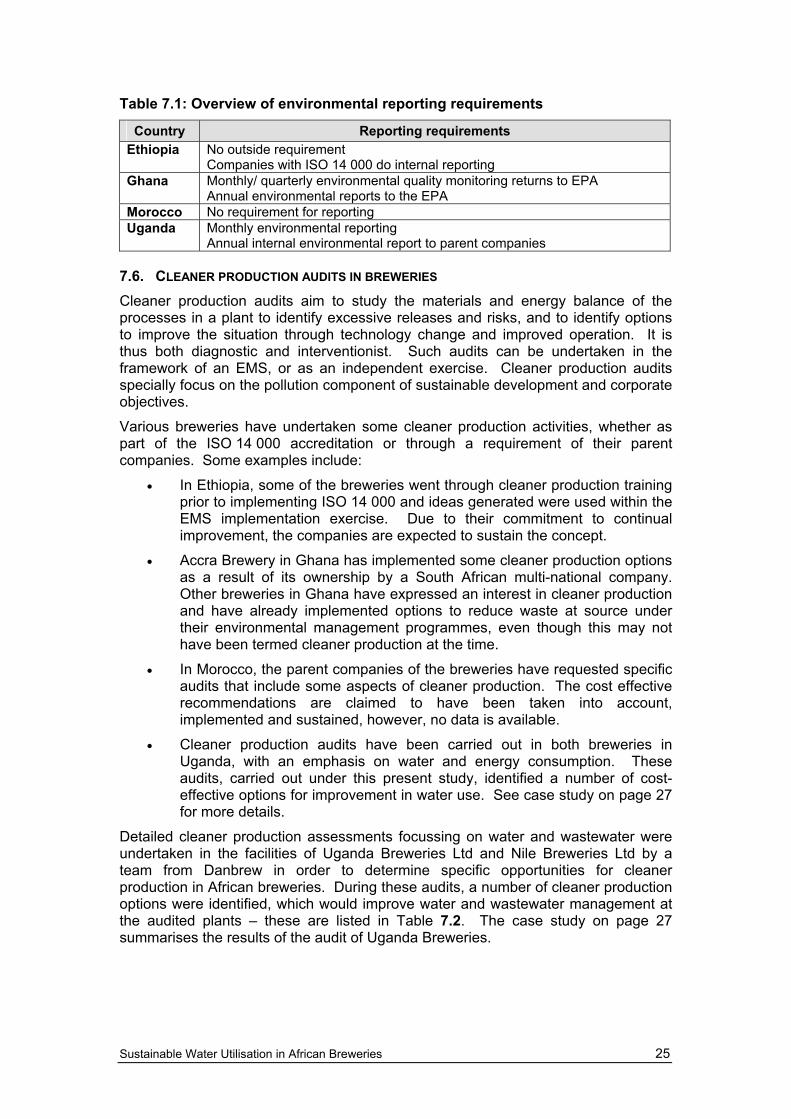
Table 7.1: Overview of environmental reporting requirements ............................................... 25
Table 7.2: Summary of outcomes of cleaner production assessments in Uganda ................. 26
Sustainable Water Utilisation in African Breweries 1
1. Introduction
Brewing is intrinsically a water intensive industry. Commonly available best technologies still require in excess of four litres of raw water for every litre of beer produced (specific water use). Older technologies that are inefficiently operated can easily double or triple this consumption, to the detriment of neighbouring communities and additional cost to the company itself. High water consumption also means higher energy use, as much of the excess water has to be heated in the brewing and cleaning processes.
Prolific use of scarce water can hardly be excused on the grounds of economic hardship as most breweries are quite profitable, with expanding domestic and export markets and planned increases in production capacity in many countries. Lack of expertise is not a credible excuse either as many breweries are owned by large multinational companies that have sophisticated management systems and training programmes already in place in most of their facilities. The sad truth is that often neither corporate management nor local authorities are up to the task of imposing appropriate requirements on local operations for a variety of reasons.
Cleaner production is an approach to improving industrial process efficiency. Adoption of cleaner production principles reduces waste and this in turn results in lower environmental impact and occupational risks. The long experience of National Cleaner Production Centres (NCPCs) and the pan-African network of cleaner production experts ensures that realistic and effective remedial measures can be devised in most cases. Cleaner production also reduces the cost of wastewater disposal by reducing the volume and strength of effluents that need to be treated. Cleaner production is thus a useful preliminary stage to designing treatment works.
This study explores the situation surrounding African breweries, and the ability of the cleaner production approach to improve the efficiency of water use to the benefit of local communities and the company shareholders (less waste means better efficiency and hence greater profitability).
The study looks at breweries in four African countries, namely Ethiopia, Ghana, Morocco and Uganda, in an attempt to isolate the technical, management and policy elements that could lead to greater efficiency in water use. Two breweries in Uganda were studied in more depth to identify specific technological factors that require improvement, on the assumption that these factors might be similar across the continent.
These investigations are of a preliminary nature, intended to provide a baseline for more detailed investigations to be undertaken subsequently. Nevertheless, important conclusions can be drawn from this pilot phase and these are highlighted in Section 0 of this report. As a result, some “no regrets” interventions and improvement programmes can be implemented immediately without waiting for more detailed studies.
Improving water use necessarily involves the cooperation of a variety of different players across different sectors. With improved coordination of these players in line with the recommendations of this study, African breweries will be able to play a more comprehensive and dynamic role in promoting sustainability in Africa on social, economic and environmental fronts, and thus apply a triple bottom line approach.
Sustainable Water Utilisation in African Breweries 2
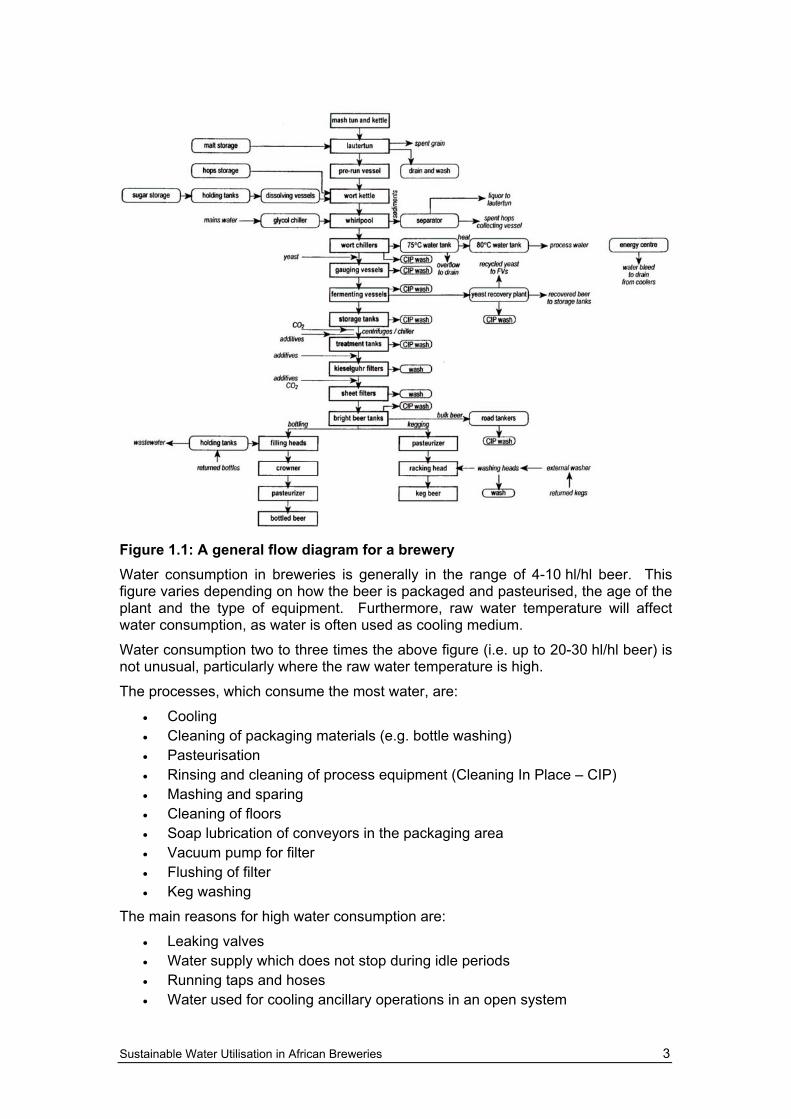
1.1. DESCRIPTION OF THE BREWING PROCESS For those unfamiliar the beer brewing process, this section includes a brief description, which in short is summarised as: malt is extracted from the barley and mixed with water, hops are added for flavour, and the mix is then fermented with yeast to produce alcohol. Refer to Figure 1.1 for more details on the five major processes of a brewing plant:
Malting The purpose of malting is to prepare the starch in the barley for easy degradation during mashing, whereby it is transferred into easily fermentable sugar. Malting and drying also gives taste and colour to the beer. Malting is often not part of the ordinary brewery operations and is undertaken off site.
After cleaning and grading, the barley is steeped and left to germinate. Once enough enzymes have built up, the germination process is interrupted and the green malt is brought into a kiln for curing, then polished to separate the rootlets and finally stored in silos before further processing. The malting process includes several cleaning steps and is thus rather water intensive.
Wort Production Malt is ground, mashed with water and heated to a high temperature to activate the enzymes built up during malting. Then the grist residues are separated, before the wort is boiled together with hops. During the boiling process and the following mixing process, proteinous substances fall out, leaving wort, which is then cooled down and passed to fermentation. Wort production again uses a lot of water and energy for heating and cooling.
Fermentation and Maturation The cooled wort is aerated, yeast is added and it is left for fermentation. When the main fermentation is finished, the “green beer” is pumped into storage tanks for maturation. During maturation, a second fermentation takes place under high pressure, building up dissolved carbon dioxide in the beer, while the remaining yeast settles out.
Filtration The finished beer is prepared for bottling or kegging by filtration and addition of carbon dioxide. To ensure a standard quality, some batches of beer are blended and colour may be added. The beer is cooled down, before filtration in a coarse and a fine filter. Before bottling the beer is stored, putting more pressure on fresh water for cleaning of these storage tanks.
Bottling of the beer The beer is bottled under counter pressure and the bottles are sealed, cleaned, pasteurised, labelled and packed. Before filling, the bottles (new or used) are passed through a bottle washer for cleaning. Empty kegs undergo a similar process. The cleaning process is very water intensive and the caustic solution needs to be replaced frequently. Pasteurisation uses heated water but mostly this is circulated and thus used repeatedly.
Sustainable Water Utilisation in African Breweries 3
Figure 1.1: A general flow diagram for a brewery Water consumption in breweries is generally in the range of 4-10 hl/hl beer. This figure varies depending on how the beer is packaged and pasteurised, the age of the plant and the type of equipment. Furthermore, raw water temperature will affect water consumption, as water is often used as cooling medium.
Water consumption two to three times the above figure (i.e. up to 20-30 hl/hl beer) is not unusual, particularly where the raw water temperature is high.
The processes, which consume the most water, are:
• Cooling • Cleaning of packaging materials (e.g. bottle washing) • Pasteurisation • Rinsing and cleaning of process equipment (Cleaning In Place – CIP) • Mashing and sparing • Cleaning of floors • Soap lubrication of conveyors in the packaging area • Vacuum pump for filter • Flushing of filter • Keg washing
The main reasons for high water consumption are:
• Leaking valves • Water supply which does not stop during idle periods • Running taps and hoses • Water used for cooling ancillary operations in an open system
Sustainable Water Utilisation in African Breweries 4
• Water used for cooling tunnel pasteuriser in an open system • High consumption of water for bottle washer • High water consumption for vacuum pump in packaging area • Overflow in the hot water system • Low equipment efficiency • Pasteurisers out of balance • Poor piping design or cleaning procedures • Poor control of process • Closed loop cooling system is not working satisfactory • No (or inefficient) resource management system
1.2. WHAT IS CLEANER PRODUCTION (CP)? Cleaner production is the continuous application of an integrated preventive environmental strategy to processes and products to reduce risks to human health and the environment.
For production processes, cleaner production includes conserving raw materials and energy, eliminating toxic raw materials, and reducing the quantity and toxicity of all emissions and wastes before they leave a process.
For products, the strategy focuses on reducing impacts throughout the life-cycle of the product, from raw material extraction to ultimate disposal.
Cleaner production can be achieved in a number of different ways. The three most important are:
It is important to stress that cleaner production is not simply a question of changing technology: changing attitudes means finding a new approach to the relationship between industry and the environment. Simply re-thinking an industrial process or a product in terms of cleaner production may produce the required results without introducing new technology.
It is also important to stress that the preferred cleaner production option will always be reduction of waste at source.
Breweries are characterised by significant resource consumption, but very limited utilisation of environmentally hazardous components. Cleaner production in breweries therefore focuses on minimisation of resource consumption, process efficiency, and, to a smaller degree, product substitution.
A brewery’s resource consumption is influenced by actions in three different functional areas, as shown in Table 1.1.
In general, breweries with a relative high unit resource consumption can immediately achieve a substantial reduction by addressing management issues and small changes in ancillary operations and process systems. Breweries with relatively low consumption need to begin by focusing on all three functional groups in detail.
Upgrading a brewery, in order to reduce resource consumption, requires actions in three areas:
• Training • Engineering • Plant equipment
Sustainable Water Utilisation in African Breweries 5
Table 1.1: Areas in which resource consumption may be reduced
Functional areas Focus areas to reduce resource consumption Process • Production methods
• Operations • System design • Maintenance • Training
Ancillary operations • Operations • Individual system design • System integration (process/utility) • Maintenance • Training
Management • Target-setting, monitoring control, responsibility allocation• Training
It should be stressed that taking action in one of these areas without complementary actions in the other two may greatly reduce their effectiveness. On the other hand, there is a large potential for synergies through combining actions in these areas.
There are a number of technologies available to reduce resource consumption and emissions within breweries. In addition, there are management options that should be considered. Activities with respect to cleaner technology and environmental management need to be co-ordinated.
The construction of a new brewery, or major refurbishment of an existing one, offer possibilities for reducing consumption of resources in a cost-effective manner. In an existing brewery, increasing efficiency requires a concerted effort from all departments.
Sustainable Water Utilisation in African Breweries 6
2. Industry sector description
This section gives a brief profile of the brewery sector in Ethiopia, Ghana, Morocco and Uganda. It is based on a short questionnaire and intensive field investigations in two Ugandan breweries.
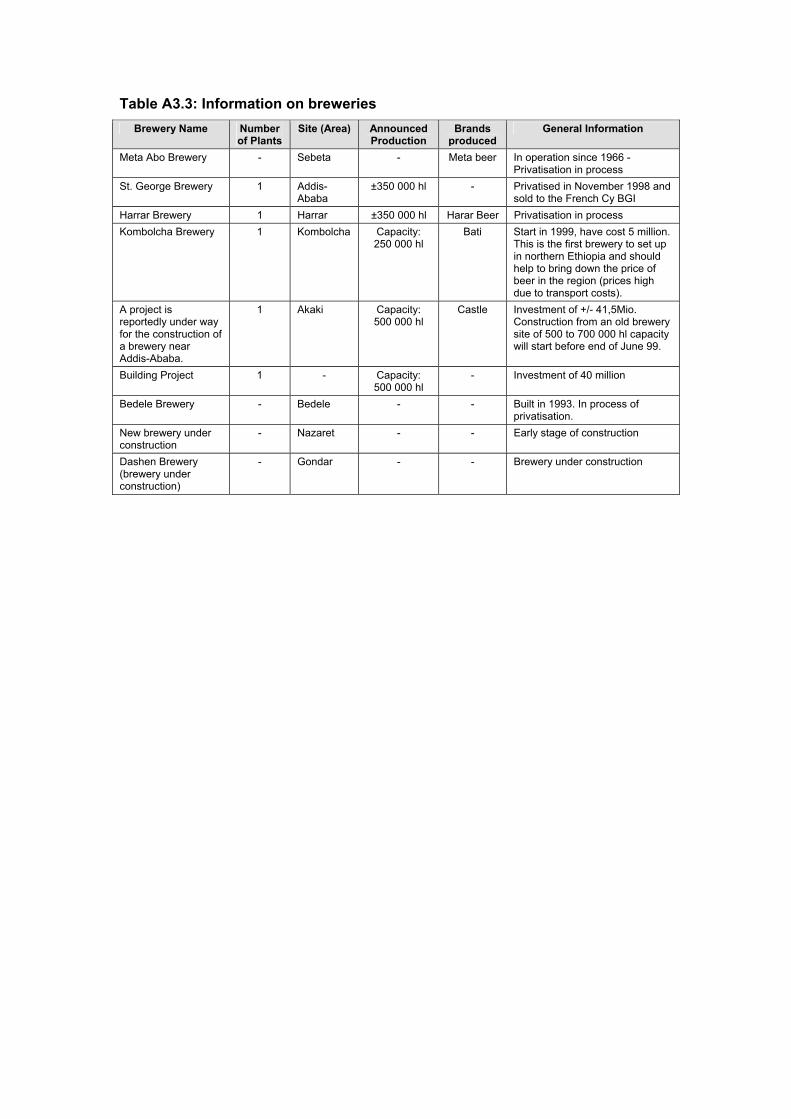
2.1. BREWERIES IN AFRICA In the four study countries, there are eleven companies operating a total of 15 breweries. Their product range includes both alcoholic and non-alcoholic beverages, as well as some spirits. Thirteen of these breweries are listed in Table 2.1.
Table 2.1: Overview of breweries and their products in each country
Alcoholic and non-alcoholic beveragesBeer, malt, soft drinks Alcoholic beverage, malt, soft drinks Alcoholic and non-alcoholic beverages
Morocco Société des Brasseries du Maroc International and local brands, non-alcoholic beverages
Uganda Nile Breweries Ltd. Uganda Breweries Ltd.
Lager Lager and spirits
Note: All breweries, except Meta, Harar, Dashen and Bedele in Ethiopia, are foreign owned companies.
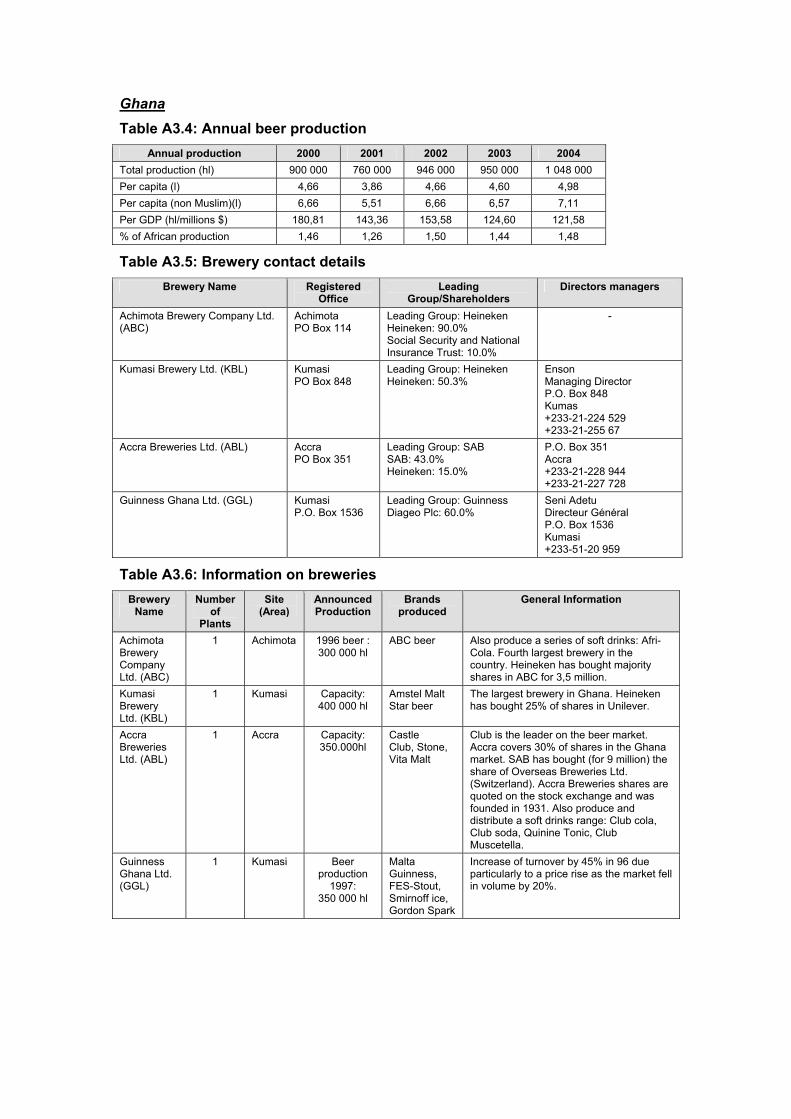
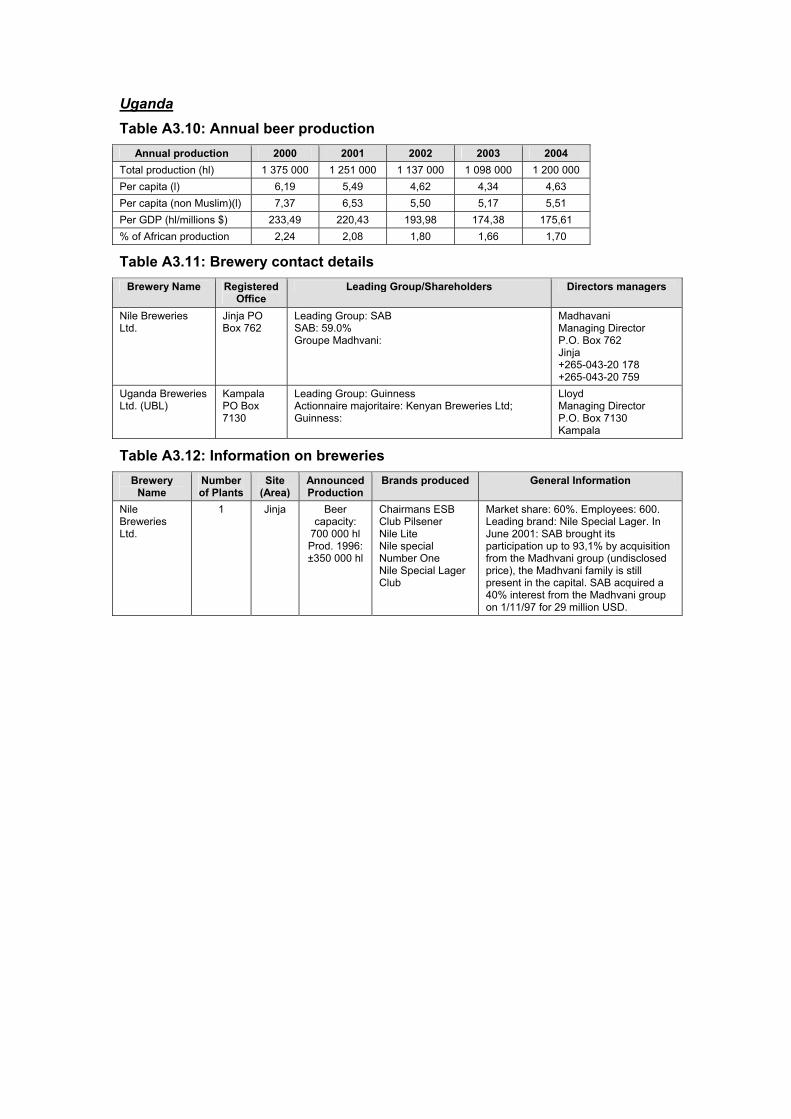
2.2. ANNUAL PRODUCTION AND FORECAST The total annual beer production for each country is provided in Table 2.2. The table also shows the actual production capacity or, in the case of Ethiopia, the forecast production capacity once operational upgrades have been completed. Where possible, data has been detailed per brewery. While most breweries are not currently operating at full production capacity, all breweries have shown steady growth in production over recent years.
Morocco 900 000 (1 company) Not available Uganda Nile Breweries Uganda Breweries
1.5 million (2 companies) 750 000 739 700
3.3 million 1 576 800 1 752 000
TOTAL 5.2 million 12.7 million
Sustainable Water Utilisation in African Breweries 7
2.3. OWNERSHIP OF THE BREWERIES The majority of the breweries in Ghana, Morocco and Uganda are privately owned often by multinational companies such as the Diageo and SAB Miller groups, with the exception of Ethiopia, where three of the five breweries are State owned. As market reforms are increasingly embraced in Africa, these State owned breweries are likely to be privatised in the future. Such change in ownership structure typically brings a general improvement in management to the breweries, including environmental management. SAB Miller, for example, is aiming for ISO 14 000 certification of all its business worldwide (refer to Section 7.2). Overall, the sector is gradually modernising and installing state-of-the-art equipment.
2.4. ROLE AND FUNCTION OF INDUSTRY ASSOCIATIONS Industry associations, which provide technical and managerial support to industry, exist in all four countries, however, their mandates are not brewery-specific in scope. These associations are:
• Ethiopian Manufacturing Industries’ Association (EMIA) – has contributed to the promotion of cleaner production in general
• Association of Ghana Industries
• Confederation of Moroccan Enterprises (CGEM)
• Uganda Manufacturers’ Association (UMA)
The Uganda Alcohol Industry Association brings together manufacturers of alcoholic products, with the mandate to “coordinate and direct activities, which counter and reduce the abuse of alcohol products”. The association has eight members, including six distilleries and two breweries (Uganda Breweries and Nile Breweries).
None of the identified industry associations have any specific water saving or environmental agenda.
In addition to national industry associations, the Institute of Brewing and Distilling (Africa Section) has members throughout the region and organises regular regional conferences.
2.5. ECONOMIC PERFORMANCE (ANNUAL TURNOVER AND NET RESULTS) The total annual sales for the breweries in each of the countries are outlined in Table 2.3. Where possible, profit figures are included. There is currently no economic data available for Ghana.
Table 2.3: Overview of economic performance of the brewery sector
Country Annual sales (USD/y) Profit Ethiopia 95 million 10 to 25% Ghana Not available Not available Morocco 240 million Not available Uganda Nile Breweries Uganda Breweries
60 million
428.5 million (East African Breweries Ltd)
Not available
6 million USD/y (2006)
Sustainable Water Utilisation in African Breweries 8
2.6. NUMBER OF EMPLOYEES PER BREWERY The number of people employed in the brewery sector in the four countries is summarised in Table 2.4. The figures do not take into account indirect employment in retail outlets, restaurants, etc.
Table 2.4: Summary of employment numbers for the brewery sector
*Note: This number was calculated by dividing the annual production value from Table 2.2 by the total number of employees in the sector for each country.
The productivity per employee can be seen to vary significantly between countries, reflecting national situations. As a rough average, 1 255 hl of beverage is produced per employee with variations of a factor of two depending on the brewery.
Sustainable Water Utilisation in African Breweries 9
3. Background information on water use
3.1. NATIONAL WATER USE SITUATION All four study countries have reasonable water resources at the national level, however, its distribution varies greatly in time and in place. In common with other countries, most water is used for agricultural purposes such as irrigation, with industrial and domestic use being the other major consumers.
Surface water is the biggest source of water in all four countries. While urban dwellers may have access to piped water, rural populations typically rely on surface streams and wells. Demand for water is increasing in all four countries, putting additional stress on often already limited supplies.
While total water resources and urban demand are often reported, few countries have studied industrial water demand projections in detail. As a result it is difficult to predict future water conflicts between competing users.
Data on water resources, demand and supply as far as available is shown in Table 3.1.
Breweries, by the nature of the processes used, are one of the most water intensive industries. In the four countries surveyed, water for brewing is variously obtained from municipal sources, boreholes, rivers, lakes and springs. The major role of breweries in water use can be illustrated by the fact that in Ethiopia the brewing industry already accounts for at least 1.5% of the national consumption of water. Severe impacts on local water services can already be observed in some areas.
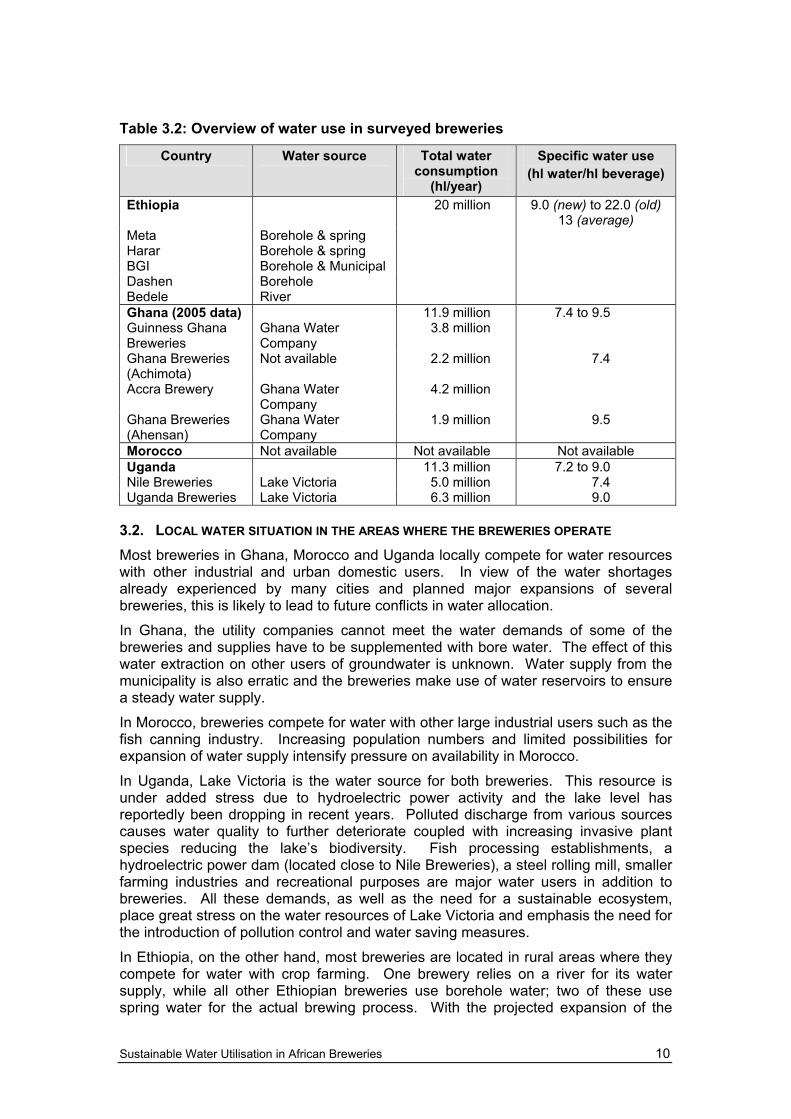
An overview of the water consumption in each of the surveyed breweries is provided in Table 3.2. UNEP and World Bank Publications give best practice specific water use in breweries as 6.5 hl of water per one hl of beer. Some European and Japanese breweries use as little as 4 hl/hl. Based on the figures provided in Table 3.2, none of the breweries in the four countries are currently performing to this level.
Sustainable Water Utilisation in African Breweries 10
Table 3.2: Overview of water use in surveyed breweries
Country Water source Total water consumption
(hl/year)
Specific water use (hl water/hl beverage)
Ethiopia 20 million 9.0 (new) to 22.0 (old) 13 (average)
Meta Borehole & spring Harar Borehole & spring BGI Borehole & Municipal Dashen Borehole Bedele River Ghana (2005 data) 11.9 million 7.4 to 9.5 Guinness Ghana Breweries
Ghana Water Company
3.8 million
Ghana Breweries (Achimota)
Not available 2.2 million 7.4
Accra Brewery Ghana Water Company
4.2 million
Ghana Breweries (Ahensan)
Ghana Water Company
1.9 million 9.5
Morocco Not available Not available Not available Uganda 11.3 million 7.2 to 9.0 Nile Breweries Lake Victoria 5.0 million 7.4 Uganda Breweries Lake Victoria 6.3 million 9.0
3.2. LOCAL WATER SITUATION IN THE AREAS WHERE THE BREWERIES OPERATE Most breweries in Ghana, Morocco and Uganda locally compete for water resources with other industrial and urban domestic users. In view of the water shortages already experienced by many cities and planned major expansions of several breweries, this is likely to lead to future conflicts in water allocation.
In Ghana, the utility companies cannot meet the water demands of some of the breweries and supplies have to be supplemented with bore water. The effect of this water extraction on other users of groundwater is unknown. Water supply from the municipality is also erratic and the breweries make use of water reservoirs to ensure a steady water supply.
In Morocco, breweries compete for water with other large industrial users such as the fish canning industry. Increasing population numbers and limited possibilities for expansion of water supply intensify pressure on availability in Morocco.
In Uganda, Lake Victoria is the water source for both breweries. This resource is under added stress due to hydroelectric power activity and the lake level has reportedly been dropping in recent years. Polluted discharge from various sources causes water quality to further deteriorate coupled with increasing invasive plant species reducing the lake’s biodiversity. Fish processing establishments, a hydroelectric power dam (located close to Nile Breweries), a steel rolling mill, smaller farming industries and recreational purposes are major water users in addition to breweries. All these demands, as well as the need for a sustainable ecosystem, place great stress on the water resources of Lake Victoria and emphasis the need for the introduction of pollution control and water saving measures.
In Ethiopia, on the other hand, most breweries are located in rural areas where they compete for water with crop farming. One brewery relies on a river for its water supply, while all other Ethiopian breweries use borehole water; two of these use spring water for the actual brewing process. With the projected expansion of the
Sustainable Water Utilisation in African Breweries 11
brewery sector in Ethiopia, the pressure on the water supply will only increase further.
3.3. IMPACT ON WATER USE AND EFFLUENT DISCHARGE TO WATER BODIES Most of the effluent discharged by the breweries in the four countries does not meet the national discharge standards as many of them release their effluent with little or no prior treatment. Table 3.3 provides an overview of effluent volume, quality, recipient and treatment type in the four countries.
Table 3.3: Overview of effluent discharged from the surveyed breweries Country Effluent
Recipient Treatment
Type Attributes where discharge limits
are exceeded Ethiopia Rural Irrigation of
farms Primary effluent treatment
COD and Suspended solids
Urban River in city None Not available Ghana Guinness Ghana Breweries
Sisa Stream Effluent plant Conductivity, TSS, oil and grease; BOD, COD; total coliforms
Ghana Breweries (Achimota)
Odaw River Neutralisation Conductivity, TSS, oil and grease; BOD, COD; total coliforms
Accra Brewery Sewer Sewerage treatment plant
Conductivity, TSS, oil and grease; BOD, COD; total coliforms
Ghana Breweries (Ahensan)
Sisa Stream None Conductivity, TSS, oil and grease; BOD, COD; total coliforms
Morocco Not available Not available Not available Uganda Nile Breweries Nile River None Not available Uganda Breweries Lake Victoria Conventional
biological plant Not available
The practice of discharging effluent of low quality into the environment causes numerous problems, some of which are discussed below.
• In Ghana, the effluent discharged to the Sisa Stream (a tributary of the Subin River) and the Odaw River impacts on the downstream water users that rely on this water for irrigation and domestic purposes. Both these water bodies are currently undergoing rehabilitation by the government.
• In Ethiopia, the effluent from rural breweries is used for irrigation purposes after undergoing primary treatment. The poor quality of this irrigation water is cause for concern for local farmers as it has previously ruined crops, prompting farmers to seek compensation from the breweries. The effluent from breweries in urban areas is directly discharged into rivers without any prior treatment. This practice poses a threat to other water users downstream.
• In Morocco, the brewery effluent is also increasingly becoming a source of pollution to farming and grazing land.
• In Uganda, untreated effluent from the Nile Breweries is discharged into the Nile River and contributes to nutrient enrichment of downstream water bodies and bacteriological contamination. This in turn affects the communities that rely on the Nile for food (fish), drinking and personal hygiene.
In light of these problems, a number of breweries have taken steps to improve the effluent discharged quality from their site:
Sustainable Water Utilisation in African Breweries 12
• Several Ethiopian breweries are in the process of implementing ISO 14 000 with the support of the Ethiopian Cleaner Production Centre. As part of this process, these breweries plan to improve the performance of their effluent treatment plants and to include effluent quality into their regular monitoring schedule.
• A wastewater treatment plant has been constructed at Guinness Ghana Breweries. Once commissioned, it will significantly improve the quality of effluent before discharge.
• Ghana Breweries (Achimota) is currently considering the installation of a biological treatment plant.
• The installation of an effluent treatment plant at Uganda Breweries has already vastly improved the quality of the discharged effluent.
It is considered that cleaner production could alleviate part of this situation by reducing both the volume and concentration of pollutants in the effluent through improved production efficiencies. This would allow smaller (and cheaper) treatment plants to be installed for the remaining effluent. It is not known if a prior cleaner production assessment was undertaken before designing the effluent plants.
3.4. GOVERNMENT PRIORITIES ON WATER SAVINGS The various governments, through their respective water policies, have made some degree of commitment towards efficient use of water resources. As a rule, these focus on supply-side policies for domestic and agricultural use, and less commonly on industrial needs. Water conservation policies and awareness is generally poorly developed in all four study countries, and there are no government programmes specifically tailored to promote water conservation in the brewery sector.
Here are some examples of government actions aiming at conserving water resources:
• In Ethiopia, the government is promoting rainwater harvesting in rural area to improve agricultural productivity, however, there is no concomitant effort to drive water supply or conservation in the industrial sector.
• Ghana’s draft National Water Policy lists rainwater harvesting and protection of water bodies and catchment areas as priority areas, but again there is no policy component for industrial water.
• In Morocco, the government has established a policy of “carrot and the stick” where industrialists can benefit from State subsidy offers for studies, audits and the purchasing of equipment to optimise water use. At the same time, the government is in the process of implementing the polluter pays principle. The State Secretariat in charge of Water is also tasked to promote water savings as part of its activities. There is no information on the success of these programmes.
• Uganda’s National Water Policy aims to “promote rational, optimal and wise use of water resources”. The Water Act (2000) makes provision for the government to protect the integrity and sustainability of water resources by any means necessary, including the application of water demand management and water saving measures. Again, there is no specific policy component for industrial water.
Sustainable Water Utilisation in African Breweries 13
3.5. LEGAL RESPONSIBILITY OF NATIONAL AND LOCAL AUTHORITIES AND INDUSTRY IN IMPLEMENTING WATER USE AND SAVINGS PLANS
In each of the four study countries there are a number of institutions mandated with overseeing water resource and water issues in general:
• Ethiopia has institutions at federal, regional and local levels to address water resource issues. The government’s priority is to improve access to fresh water in both urban and rural areas.
• In Ghana, the Ministry of Water Resources, Works and Housing is the water policy setting body. Together with the Water Resources Commission it is tasked with regulating water resource use and prosecuting wrongful users of water. Water Resource Management Boards have also been formed at national and regional levels, with all stakeholders and interested opinion leaders involved in ensuring proper use of water.
• In Morocco, there are three levels of government and other organisations, which deal with water issues: Policy setting level (Supreme Council of Water and Climate, and Ministry of Territorial Activities, Water and Environment); Executive Level (State Secretariat in charge of Water); User level (National Office of Potable Water, Water Basin Agencies, and Local autonomous public corporations); and Other Institutions (Ministry of Public Health).
• In Uganda, the Ministry of Water and Environment has policy setting functions. The Water Resources Management Department (WRMD) of the Directorate of Water Development (DWD) undertakes the water resource management function.
While some water and effluent legislation exists in all four countries, it is not being strictly applied. In general, it appears that the breweries are not regulated very closely and that even where wastewater treatment is occurring, the enforcement of regulations has not been the major driver. One way to implement water use and conservation plans is the issuance of water abstraction permits or licences, however, these instruments are mostly not applied in an effective manner.
The water distribution systems of utility companies are another way through which water use and conservation plans could theoretically be implemented. In Morocco, water distribution and supply has been privatised to a certain extent, while these functions are still monopolised in Ethiopia (Addis Ababa Water Supply and Sewerage Authority), Ghana (Ghana Water Company Ltd) and Uganda (National Water and Sewerage Corporation). It is not known if these utility providers have attempted to reduce demand of breweries located in urban areas, or indeed if they even have a commercial interest to do so.
Sustainable Water Utilisation in African Breweries 14
4. Awareness on water use
Overall, awareness of water issues – its availability, supply, quality, and pollution – is not commensurate with the importance of water as an essential resource for society and for the functioning of industry. In particular, the notion of water management in a systematic way still needs to be further developed in many countries.
Awareness of water issues among decision-makers varies between the four study countries. In Ethiopia, it is reported that there is very little awareness on the need to save water, while in Ghana awareness within the water sector is higher as a result of previous seminars and workshops highlighting the importance of water conservation.
Uganda also still shows a low level of awareness on the need of water saving although there has been an increase in the awareness to protect the environment and water resources from pollution through the media. Generally, the perception prevails that Uganda is a water-rich country and that water scarcity only occurs in dry areas.
Moroccan breweries’ concern about scarce water supplies and the high cost of municipal water, encourages awareness of water issues. The introduction of additional national environmental regulations will further contribute to the awareness on sustainable industrial resource management.
4.1. AWARENESS AMONG STAFF IN THE BREWERIES ON THE NEED TO SAVE WATER Staff awareness levels vary significantly between individual breweries, however, members of staff in breweries with functional environmental management systems appear more aware of the importance of saving water.
Some of the breweries in the study already use specific water consumption (hl water/hl beer) as a key benchmarking tool for monitoring their performance. This practice demonstrates a fairly high level of awareness on water use. Additionally, some breweries already reuse or recycle some of their wastewater, another indicator for a high level of water awareness amongst their decision-makers. As an example, Guinness Ghana Breweries has introduced a new product, which originates from the machine wash after the main product has been produced, thereby reducing both effluent volume and pollution load. Further recycling initiatives include reuse of bottle washing water for other purposes, and recovery and reuse of cooling water.
Cleaner production assessments carried out in the breweries in Ethiopia have created some level of awareness on the need to conserve water. Breweries that are already implementing ISO 14 000 have identified water efficiency as one of their key focus areas. The cleaner production audit in the breweries showed that while most of the breweries record their total water consumption, only few measure water use per main process step. Some breweries do not even have a water distribution diagram to show the network of pipes in the factory.
In Ghana, there is a high level of awareness among staff with regular training and awareness raising seminars on resource conservation. All breweries are participating in the Environmental Performance Rating and Public Disclosure (EPRPD) project run by the Environmental Protection Agency (EPA). One of the objectives of the EPRPD project is to promote efficient resource use. In some breweries environmental co-ordinators have been appointed who are responsible for the implementation and monitoring of environmental quality objectives and reporting to the EPA.
Sustainable Water Utilisation in African Breweries 15
Also in Uganda the awareness on the importance of water saving in the brewery sector is high. Efficient use of resources, particularly water, is included in the environmental policies of all breweries. Internal standards are also seen as a key driver in raising awareness on reducing water use. The breweries are either ISO 14 000 certified, or in the process of obtaining certification.
All breweries in Morocco are preparing for the implementation of ISO 14 000 and are in the process of undertaking environmental assessments to determine their baseline consumption with the aim of driving towards continual improvement in water use.
Some of the multinational owned breweries have environmental management systems that are a requirement of their parent companies. In such breweries awareness among staff on the need to save water is highest and water conservation is the responsibility of staff from the technical department of the brewery i.e. the utilities section.
As a general observation it can be said that while awareness is often high at senior management level, this concern is less visible among basic operational personnel who hold the end of the cleaning hose.
4.2. AWARENESS AMONG GOVERNMENT OFFICIALS ON THE NEED TO SAVE WATER In general, awareness about water conservation is quite high amongst government departments in the water sector in each of the four countries, and these departments work hard to educate and train their own employees as well as the public in the importance of water conservation. However, awareness amongst government officials outside the water sector is generally low.
In Ethiopia, the Environmental Protection Authority and the Ministry of Water Resources recognise the need to conserve water and are in the process of educating their staff.
In Ghana and Morocco, all ministries, departments and government institutions were widely involved in the development of the National Water Policy (Ghana) and the National Water Strategy (Morocco). The industrial sector and general public are informed and advised of the benefits of saving water through politicians and government officials.
In Uganda, it is reported that awareness at government level is low, mainly due to the perception that there is sufficient water of adequate quality in the country, much of it from the one single source – Lake Victoria. This is surprising, considering that there is both a National Water Policy and a Water Act (2000) in Uganda, which promotes the sustainable use of water. However, recent droughts in the country and the subsequent shortage of water for hydropower have highlighted the need not to regard water as an infinite resource.
As most African governments continue to address the Millennium Development Goal for water the awareness of the need to save water will hopefully improve amongst the majority of mainstream government officials. It will be important to reinforce the notion that conservation is a crucial contribution to future water supply.
4.3. CULTURAL EXPECTATIONS ON BREWERIES AND CORPORATE RESPONSIBILITY Cultural expectations on breweries vary between the four study countries, however, there is a general expectation that local communities should benefit from industrial operations. Breweries tend to have a large workforce and are therefore often counted on to provide employment for the communities in direct vicinity of their operation. As an example, close to 100% of the shop floor workers at Nile Breweries (Uganda) are from the local area.
Sustainable Water Utilisation in African Breweries 16
At some places, expectations extend beyond direct employment and include the notion that the breweries should contribute to the welfare of the local communities as part of their corporate social responsibility. In Uganda, this expectation includes the building of new health centres, schools, boreholes, roads etc. In some cases, the breweries have extended this service beyond their operational areas. In Ethiopia some communities around breweries rely on discharged wastewater from the breweries to irrigate their crops, and so expect breweries to keep them updated with discharge schedules.
In Morocco and Ghana, certain sections of the population believe that breweries should not manufacture alcoholic beverages but instead should produce soft drinks or non-alcoholic beverages. This might explain why non-alcoholic beverages such as Malta account for a good portion of the product range in the breweries in these countries.
4.4. INFLUENCE OF SOCIAL NETWORKS, BUSINESS NETWORKS, AND RELIGIOUS NETWORKS
Ownership of the breweries is a key factor to be taken into account when considering the behaviour of decision-makers. The influence of outside networks on breweries owned by multi-national companies is very small. The behaviour of the decision-makers in such breweries is dictated by internal standards of the brewery that are prescribed by the parent companies.
Decision-makers in both State and locally owned breweries are more likely to be influenced by social, business and religious networks. In Morocco, for example, religious networks retain a certain degree of influence on decision-making.
In Ghana and Morocco, several NGOs, as well as faith and community-based organisations make use of the print and electronic media to communicate the importance of prudent water use. Whilst breweries are not targeted directly, they are included as part of the industrial sector.
Overall, it appears that community influence is not a major factor in decision-making except where acute problems and controversy is present.
4.5. MEDIA REPORTS ON WATER USE IN BREWERIES OR ON WATER ISSUES IN GENERAL Media reports on water use issues have not specifically addressed the brewery sector in any of the four study countries.
In Morocco, a number of segments on the need to save water at household and industrial level have been shown as part of a water use sensitisation campaign. In Ethiopia, such news reports have mainly highlighted water scarcity issues in certain cities within the country.
The launching of Uganda Breweries’ wastewater treatment plant in 2005 is perhaps the closest the media has come to reporting on water use issues specifically related to breweries in any of the four countries. However, reduction of the biological load of wastewater discharged by the brewery was the main focus of this report.
4.6. BREWERIES ENGAGEMENT IN COMMUNITY SUPPORT WORK RELATED TO WATER ACCESS/WATER SAVINGS
By virtue of their corporate social responsibility, breweries are heavily involved in a number of community activities although few deal directly with water access or water savings. One exception being Ethiopia, where breweries that use well water for production provide fresh water to surrounding communities in return.
Sustainable Water Utilisation in African Breweries 17
Also, Uganda Breweries has made it a priority to provide access to clean water to communities in need as part of its corporate social responsibility and in recent years has contributed towards a range of water projects under its Water for Life programme. In Kabale (Western Uganda), over 100 households have benefited through the construction of water tanks and piping to capture rainwater from roofs.
Sustainable Water Utilisation in African Breweries 18
5. Public instruments used to influence water use
5.1. POLICIES ENACTED TO PROMOTE WATER SAVINGS IN THE SECTOR Ethiopia, Ghana, Morocco and Uganda each have national water policies or similar instruments to guide developments in their respective water sectors. Most of the policies, although not directly emphasising water savings, have an element of sustainable use of water resources embedded in them.
The respective policies include, The Ethiopia Water Resources Management Policy, Ghana Water Policy, The National Water Policy (1999), and the National Environmental Policy of Uganda. Morocco has a National Water Plan, as well as regional basin water plans, that provide the technical framework for the formulation of national and regional strategies for water management.
Key elements of these policies include:
• promotion of rational, optimal and wise use of water resources in all sectors;
• decentralised management of water resources by bringing on board user communities and supporting community self-initiatives in water resources management;
• increased access to safe drinking water by both rural and urban segments of the population;
• instituting measures to control pollution of water resources;
• integrated water management; and
• demand control through appropriate pricing etc.
Some legislation for promoting water savings in the in general exists in each of the four countries.
Ethiopia The Water Resources Management Proclamation (Federal Democratic Republic of Ethiopia, 197/2000 Article 5) is the main instrument for implementing Ethiopia’s water policy. On water use priority, it states that “domestic water use shall have priority over and above any other water uses”. The proclamation continues to state that development, management, utilisation and protection of all water resources in the country are the responsibility of the federal government.
Ghana Act 522 of the Water Resources Commission Act addresses water resource management issues. Part 3 of the Act provides for the acquisition and use of water resources. Section 13 of the Act prohibits the use of water resources without authority from the Water Resources Commission. Under the Environmental Assessment Regulations (1999), any activity that is likely to adversely impact on a water body has to go through an EIA process for an environmental permit before the project can commence. Additionally, the bylaws of the local authority prohibit development along water bodies, waterways and in wetlands.
Morocco The Water Code of 1995, specifically Law No. 10-95 of July 1995, is the basis for national water policy. It contains several elements on the use and protection of water
Sustainable Water Utilisation in African Breweries 19
resources. Act 10-95 emphasises a more efficient, decentralised management of water resources at all levels. There are seven basin agencies that are in charge of water policy and integrated management missions in the frame of hydrographical basins.
Uganda Uganda has the Water Act, Cap. 152, which is the principal legislation regulating the water sector in Uganda. The coverage of the Act extends to the control and regulation of water pollution. The Act is administered by the Directorate of Water Development (DWD), which regulates:
• the investigation, control, protection and management of water resources for any use in Uganda.
• the issue, revision, variation and cancellation of: construction of hydraulic work permits, water permits, waste discharge permits, water supply and sewerage, and water restrictions.
DWD is assisted by a number of central government agencies, water user groups and associations, and local governments in administering the Act.
Other policies include:
• the National Environment Act Cap 153 of the Laws of Uganda 2000 which provides the framework for co-ordinated and sound management of the environment including environmental impact assessment of water resources projects and setting water quality and effluent standards;
• the Water Resources Regulations and Wastewater Discharge Regulations of 1998 which prescribe the threshold and procedure for applications to construct any works, use water or discharge waste under the Water Act Cap 152;
• the National Environment (Wetlands, River Banks and Lake Shores Management) Regulations 2000, which regulates activities which may affect the water resources negatively. They define the allowed range and extent of activities that may take place in the vicinity of streams and rivers; and
• the Environment Impact Assessment (EIA) Regulations of 1998.
These pieces of legislation have the potential to promote water savings in the sector directly or indirectly, as for example:
• the water supply regulations emphasise the tariffs to be charged to fully cover the cost of supply and removal of wastewater generated thereof; and
• the waste discharge regulation has provisions for charging annual fees which are based on volume of effluents and concentrations on waste discharge permit holders.
5.2. EFFICIENCY OF THE EXISTING LEGISLATION Under the various laws a number of regulations and standards are enforced as part of the environmental management regime. As an example, EIAs are currently used in all four the countries as one of the methods for enforcing the legislation.
The main problem encountered in all countries is one of implementation. There is limited enforcement of existing regulations, mainly due to a lack of awareness and manpower.
In Uganda, issues that the national legislation needs to address include:
• provision of regulations for non-point sources of pollution;
Sustainable Water Utilisation in African Breweries 20
• a review of the discharge standards which are felt to be too stringent by some industrialists;
• a review of the parameters that need to be measured (currently only BOD is taken into account); and
• harmonisation of the Rivers Act and the Water Act.
Water permits are currently the only method of policing water abstraction in terms of non-compliance and consistency among water users in Uganda.
In Ghana, implementation of relevant water legislation has achieved some improvement of water quality and a recognition of the importance of water conservation. However, the common belief in the fundamental right to free potable water still results in frequent illegal connections to the water supply.
Despite the establishment of the Water Resources Commission and partnerships with public stakeholders in Morocco, the quality of water has not yet improved. It is hoped that the decentralised approach will improve the management of each catchment area and in turn the water quality.
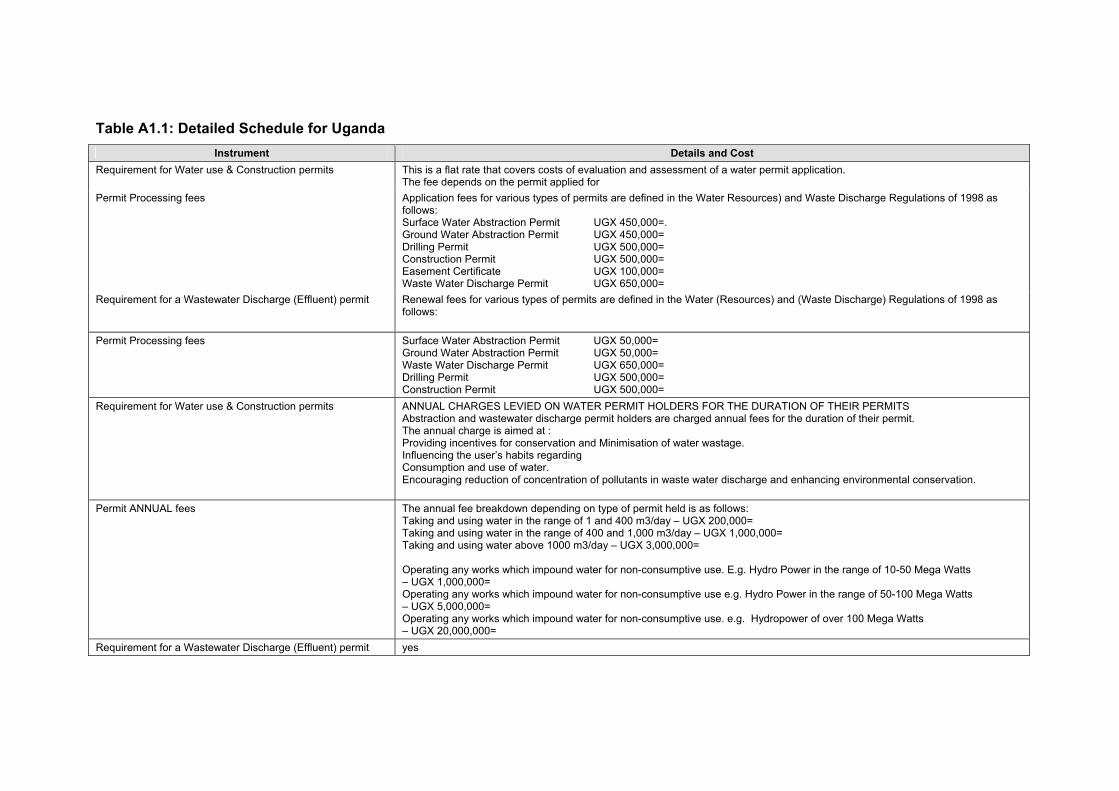
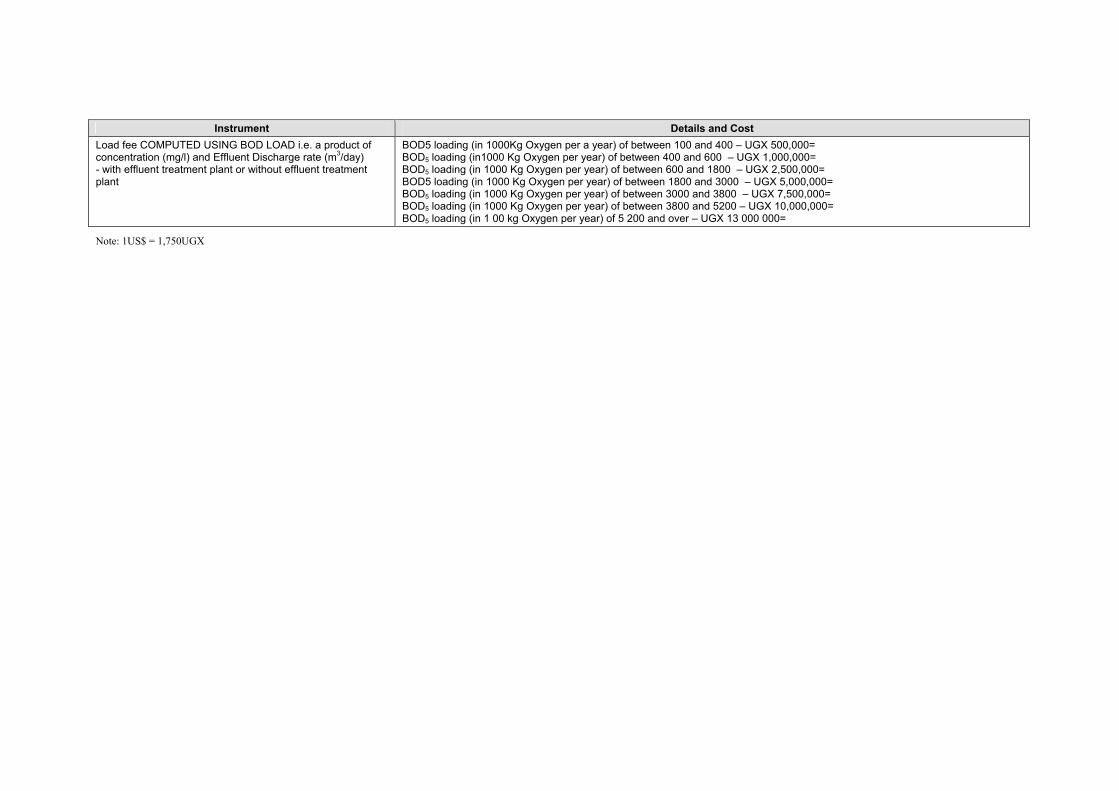
5.3. FINANCIAL INSTRUMENTS USED TO INFLUENCE WATER USE All countries have made some limited attempts to use water tariffs, abstraction fees and wastewater discharge permits to influence water use (Table 5.1). Actual cost data is shown for Uganda in Annex 1. Table 5.1: Summary of financial instruments used to influence water supply
Country Financial instruments Ethiopia • Water abstraction fees for industries in Awash River Basin
• Proposed general water resource use tariff Ghana • Domestic, commercial and industrial users pay water use tariffs based on
volume Morocco (While promoted in policy, there are no details of stated incentives to reduce
waste at source and implement the polluter pays principle) Uganda • Large urban and industrial users pay annual abstraction fees
In Ethiopia, industries do not pay for borehole water, which does not encourage conservation practises. It is hoped the introduction of the proposed water resource tariff will address this problem.
5.4. LESSONS LEARNED The afore-mentioned tools (policy, legislation and financial instruments) have also been applied in other sectors such as fish processing, leather tanning, textile production and food processing. An analysis of their use across the four countries shows that:
• there is only limited enforcement of legislation;
• there is a lack of capacity in government to monitor trends; and
• current water and effluent charges are not sufficient to encourage water conservation and pollution prevention.
As a result, national legislative and regulatory frameworks have so far failed as key drivers for (the brewing) industry to reduce water consumption or the release of pollutants into the environment.
Sustainable Water Utilisation in African Breweries 21
6. Economics of water savings
Even in a ‘soft’ regulatory framework, the economics of supplying, using and discharging water can be expected to exert a certain pressure on companies and thus drive the change to cleaner production. However, the importance of cost factors varies greatly from place to place, in part due to differences in commercial factors, e.g. cost of energy to pump water, or as a consequence of government fee structures for water services.
6.1. COSTS INCURRED BY BREWERIES FOR USING WATER Abstraction fees and effluent release charges are the most obvious direct costs incurred by the breweries for using water. In most cases these costs are in direct proportion to the volumes of water use. But greater water volumes also increase energy costs for heating and pumping, greater use of expensive chemicals, design and operation of larger treatment plants, and in general, greater water volumes required bigger equipment, pipes and tanks. These costs will be incurred irrespective of the country, with only the specific tariffs changing the final economics.
Concerning the current level of government fees for abstraction and discharge, these are rarely a major cost factor when seen alongside other production costs. It can be argued that they are even small compared with the indirect cost factors listed above if these were ever to be separately accounted for (which is rare).
6.2. AWARENESS OF BREWERIES OF THE REAL COSTS FOR WATER USE/DISCHARGE Water is a major input in the brewing process and specific water consumption (hl water/hl beer) is one of the key performance indicators used to judge the efficiency of brewery operations. Where water has to be purchased, breweries naturally include this in their accounting systems. Even then, water supply costs tend to be more visible than treatment and discharge costs, (except as capital construction cost items) so part of the total may easily go accounted for. Where water fees are relatively high, as in Morocco for example, the awareness of costs tends to be somewhat higher.
The lack of detailed and separate accounting of all aspects of water use (especially as separate process flow measurements are not undertaken in most plants) means that ultimately senior management has little awareness of the total costs associated with water use and discharge. While varying from country to country the greater volumes of water associated with inefficient process operation have repercussions throughout the plant, from additional heating and chemical costs, to over-dimensioned equipment (especially waste treatment plants) and extra pumping and monitoring costs.
Previous work by UNEP in cleaner production financing showed that few companies (or government agencies for that matter) understand the total costs associated with process inefficiencies and environmental requirements. The visible costs seen by managers and accountants are only the ‘tip of the cost iceberg’, with indirect costs contributing far more to lowering the corporate bottom line than official charges and fees.
This study has not been able to address these factors in a quantitative way, leaving their consideration to future extensions of the work.
Sustainable Water Utilisation in African Breweries 22
6.3. LEVEL OF AWARENESS AMONG ACCOUNTANTS, BANK OFFICIALS AND GOVERNMENT OFFICIALS ON THE CALCULATION OF COST-BENEFITS FROM INVESTMENTS IN CLEANER PRODUCTION
It is a curious feature of corporate accounting that the very professions servicing companies’ financial performance, i.e. accountants and financiers, are often totally unaware of the major cost issues in improving process efficiencies through cleaner production, and are thus unable to adequately advise company management.
The level of awareness is likely to be highest in those countries where cleaner production-related workshops on the subject matter have been conducted. Morocco through its cleaner production centre, Ghana through its Environment Protection Agency, and Uganda through the Uganda Cleaner Production Centre, have all conducted such workshops for accountants, bank and government officials.
In general, however, there is a need for further awareness raising and skill-building within these professions on cleaner production investment and accounting, and how to assess the financial savings from such investments.
From this study it appears that the brewery sector itself is not totally aware of these programmes, and that additional effort of education and outreach would be beneficial.
6.4. AVAILABILITY OF FINANCIAL SUPPORT FROM THE PUBLIC AND PRIVATE SECTOR FOR WATER EFFICIENCY MEASURES
For new plants, efficient ‘cleaner’ technology is now generally in-built because it reduces long-term operating costs and plant upsets (and future liabilities). For existing plants, while ‘pollution prevention pays’ and improved retrofitting of processes reduces operating costs, there is often an up-front investment, to be repaid from subsequent savings.
For profitable industries such as brewing, this can in theory come from internal sources, based on some calculated rate of return. But companies may also look out for other sources of funding from the public sector.
In the countries studied there is no clear-cut mechanism for financial support from the public (or the private) sector that is directed at water efficiency measures. In Ethiopia, breweries are expected to finance themselves, which includes cleaner production projects that have a good return on investment.
In Uganda, also, the breweries feel that they have the means to finance these types of projects themselves and therefore have not investigated other sources of financial assistance.
In Ghana, it is theoretically possible for companies to access credit schemes to implement water efficiency measures from the private and public sectors, but it is unknown if the breweries have investigated this further.
In Morocco, a bilateral cooperation with Germany has put in place a green credit line for financing environment projects of industrial pollution abatement. Under this credit line, water use and wastewater treatment are given priority. A grant of up to 40% of the total investment of the environmental portion of the project can be obtained, and up to 40% of the remaining costs can be obtained through a soft loan. All Moroccan banks are involved in the implementation of this system. It is not known if any of the breweries in Morocco have taken advantage of this mechanism, nor if the credit assessment process requires a prior cleaner production assessment.
Sustainable Water Utilisation in African Breweries 23
7. Corporate management aspects
Industry increasingly makes use of formal environmental management systems (EMS) and tools to achieve corporate objectives on environment and sustainability and make compliance more effective. Such systems and tools are often standardised by for example the International Organisation for Standardisation (ISO) to ensure a common approach across companies and countries. The best known of such systems is ISO 14 000, already in widespread use around the world. Environmental and sustainability reporting has developed a common approach through the Global Reporting Initiative (GRI).
EMS rely on clear corporate commitment to environment, corporate social responsibility (CSR) and sustainability. This needs to be articulated in such a way that actual performance can be measured against explicit objectives, and where possible, in a quantifiable form.
Governments have been slow to incorporate EMS requirements into their regulatory approach, with the result that internal EMS and external compliance with regulatory standards have become separate parallel exercises, often also with separate reporting requirements
7.1. CORPORATE COMMITMENT Companies are finding it necessary nowadays to articulate some degree of commitment to community and environmental values, partly for reasons of public relations and corporate image, but also to enhance community acceptance and attractiveness to investors. These commitments to corporate social responsibility are usually found in the company’s annual report and on their website. A review of the actions of companies in this study is shown in Section 7.7.
A number of prominent business groups have formed around such commitments, including the World Business Council for Sustainable Development (WBCSD). International brewery corporations are often members of such groups. One example relevant to this study is the CEO Water Mandate, a project under the UN Global Compact, designed to help companies in all sectors to better manage water use in their direct operations and throughout their supply chains (see Annex 3 for more details on the CEO Water Mandate). Two of the six businesses (SAB Miller and Coca Cola) involved in the UN Global Compact are active in the African brewing and soft drink market.
The implementation of such commitments in internal operations is best achieved through formal management approaches and accountability of results – as was explained above. Companies may also sponsor additional community projects as a result of these commitments, as observed by some breweries’ activities.
7.2. ENVIRONMENTAL MANAGEMENT SYSTEMS (EMS) IN THE BREWERY SECTOR As described before, a number of breweries in this study have already adopted or are in the process of adopting the ISO 14 000 standard. Five breweries in Ethiopia are already certified, with another finalising implementation. One brewery in Morocco is certified and three others are investigating implementation of ISO 14 000. In Uganda, Nile Breweries has already been certified, while Uganda Breweries is in the process.
Sustainable Water Utilisation in African Breweries 24
In Ghana, each brewery has an environmental management system at plant level that is reviewed from time to time. These are based on mandatory environmental management plan (EMP) reporting under the Environmental Assessment Regulations and their multi-national company codes.
Although originally developed to make internal management of environmental issues more effective, ISO 14 000 is also used by breweries (and other industries) as a public relations and marketing tool.
To date, the adoption of EMS has been very prescriptive particularly among the multinational owned breweries. This means that some of the basics underlying their functionality are not understood by some of the local brewery employees, especially the non-technical employees. As a result, EMS appear to be promoted more for reasons of corporate image than as a framework for making cleaner production improvements.
7.3. USE OF ENVIRONMENTAL IMPACT ASSESSMENT (EIA) FOR CORPORATE ACTION The use of EIAs is now common for major projects, and water issues are usually a major element in the assessment. Too often, however, the objective of an EIA is seen to be only the granting of an operating permit by the relevant authorities. Companies (and governments) have overlooked the use of EIAs as a process enhancement instrument during normal ongoing operation. Also, the objectives of pollution control in EIAs are often interpreted (incorrectly) as requiring an effluent treatment plant rather than aiming for water efficiency through more efficient production technologies and operation.
In this respect EIAs are not yet making a major contribution to cleaner production in an ongoing fashion, even though their use is widespread in the countries studied.
7.4. PRODUCT ISSUES AND ECO-LABELLING The brewery products from the countries taking part in the study have to be certified by the respective National Bureaus of Standards or its equivalent for purposes of safety and quality. There is insufficient public awareness or interest to certify and label the products for environmental or sustainability criteria, as indeed is the case in most places around the world.
7.5. ENVIRONMENTAL REPORTING REQUIREMENTS IN BREWERIES Environmental reporting is a growing trend in big companies, and such reporting is in any case a requirement of ISO 14 000. However, it often seen as a benchmarking exercise undertaken for public relations purposes only.
Reporting under EMS and CSR is a separate exercise to the mandatory reporting on pollution releases, or the internal process reporting within the company. Such environmental reporting is undertaken predominantly on a monthly basis, and accumulated to indicate an annual summary. In Ghana and Uganda, environmental legislation requires breweries and similar establishments to submit environmental audit reports to the environmental lead agencies, i.e. EPA and NEMA respectively. In Ethiopia, only those breweries that are ISO 14 000 accredited undertake environmental reporting. No requirement exists for the others to submit such a report.
Sustainable Water Utilisation in African Breweries 25
Table 7.1: Overview of environmental reporting requirements
Country Reporting requirements Ethiopia No outside requirement
Companies with ISO 14 000 do internal reporting Ghana Monthly/ quarterly environmental quality monitoring returns to EPA
Annual environmental reports to the EPA Morocco No requirement for reporting Uganda Monthly environmental reporting
Annual internal environmental report to parent companies
7.6. CLEANER PRODUCTION AUDITS IN BREWERIES Cleaner production audits aim to study the materials and energy balance of the processes in a plant to identify excessive releases and risks, and to identify options to improve the situation through technology change and improved operation. It is thus both diagnostic and interventionist. Such audits can be undertaken in the framework of an EMS, or as an independent exercise. Cleaner production audits specially focus on the pollution component of sustainable development and corporate objectives.
Various breweries have undertaken some cleaner production activities, whether as part of the ISO 14 000 accreditation or through a requirement of their parent companies. Some examples include:
• In Ethiopia, some of the breweries went through cleaner production training prior to implementing ISO 14 000 and ideas generated were used within the EMS implementation exercise. Due to their commitment to continual improvement, the companies are expected to sustain the concept.
• Accra Brewery in Ghana has implemented some cleaner production options as a result of its ownership by a South African multi-national company. Other breweries in Ghana have expressed an interest in cleaner production and have already implemented options to reduce waste at source under their environmental management programmes, even though this may not have been termed cleaner production at the time.
• In Morocco, the parent companies of the breweries have requested specific audits that include some aspects of cleaner production. The cost effective recommendations are claimed to have been taken into account, implemented and sustained, however, no data is available.
• Cleaner production audits have been carried out in both breweries in Uganda, with an emphasis on water and energy consumption. These audits, carried out under this present study, identified a number of cost-effective options for improvement in water use. See case study on page 27 for more details.
Detailed cleaner production assessments focussing on water and wastewater were undertaken in the facilities of Uganda Breweries Ltd and Nile Breweries Ltd by a team from Danbrew in order to determine specific opportunities for cleaner production in African breweries. During these audits, a number of cleaner production options were identified, which would improve water and wastewater management at the audited plants – these are listed in Table 7.2. The case study on page 27 summarises the results of the audit of Uganda Breweries.
Sustainable Water Utilisation in African Breweries 26
Table 7.2: Summary of outcomes of cleaner production assessments in Uganda
CP Category CP Option • Training employees on water saving • Implement a leak detection programme • Install nozzles on hoses
Housekeeping
• Use high pressure washing equipment for cleaning • Monitor and control tank cleaning water • Use level controllers for filling tanks • Measure and monitor cleaning water volume • Eliminate need for overflow rinsing in bottle washing
Better process control
• Install automatic stop water devices on pasteurisation units • Cool waste water from pasteurisation for reuse Equipment
modification • Store vacuum pump water in bottle filling area for reuse • Introduce CIP for tank cleaning Technology
change • Investigate the use of dry milling instead of wet milling Product change • Use machine wash water from main product to manufacture a new
product • Store and reuse cellar defrost water • Reuse bottle washing water • Recover condensate • Recover and reuse caustic water • Recover and reuse cooling water
Reuse / recycling
• Use spent grain for animal feed stock for farmers
7.7. CORPORATE COMMITMENT AND REPORTING ON WATER ISSUES IN BREWERIES The sustainability or environmental reports of major international groups operating in the study countries (Carlsberg, Castel, Diageo, Heineken and SAB Miller) were examined. Companies studied as part of this report are indicated in bold.
CARLSBERG
Carlsberg’s Environmental Report 2003 – 2004 does not include any African sites. The report provides a weighted group average specific water consumption of 4.7 hl/hl.
CASTEL Castel are active in Morocco. There is no environmental report available online.
DIAGEO Diageo is an integrated drinks business. The Corporate Citizenship Report 2006 does not differentiate brewing from other activities. Energy efficiency is the primary environmental priority, followed by water management and packaging. Through the Diageo Foundation four programmes are implemented, one of which is the Water of Life programme in Ouagadougou (Burkina Faso) and Kabale district (Uganda). Diageo has identified shortage of water as an issue in some of the group’s operating regions and has initiated a programme to reduce specific water consumption across its operation. Although not directly leading to water savings, new effluent treatment plants are also planned for three Nigerian sites and at sites in Cameroon and Ghana.
HEINEKEN
Water consumption and wastewater discharge is one of the seven priority sustainability categories reported in the Heineken Sustainability Report 2006. The group average specific water consumption in 2006 was 5.22 hl/hl compared to a
Sustainable Water Utilisation in African Breweries 27
group target of 5.00 hl/hl. The group aims at continuous improvement by setting the specific water consumption target for 2009 at 4.61 hl/hl. In 2006, 25 breweries failed to comply with the internal minimum specific water consumption of 7 hl/hl. During 2006 wastewater treatment plants were under construction in Nigeria, Burundi, Rwanda, Democratic Republic of Congo and Congo.
SAB MILLER SAB Miller claims a strong commitment to sustainability and is a member of the World Business Council for Sustainable Development, and the Global Compact’s ‘CEO Water Mandate’ (see also Annex 3). It produces an annual Sustainability Report and a separate Water Report, which covers the entire product value chain, including watershed mapping with the water authorities, interactions with farmers producing the raw materials, the beer manufacturing process, choice of packing materials and processes, re-use of wastewater, and community relationships. The possible trade-off between energy consumption and water consumption is noted. The water policy is linked to the group’s sustainability policies. This study includes breweries of the SAB Miller group in Ghana and Uganda.
The SAB Miller group average water consumption is 4.56 hl/hl. While not all breweries operate at this level, all plants are assessed regularly and must comply (at a minimum) to level 1 on their internal Water Staircase grading system. As an example of assessing the degree of water stress in their operating regions, the Uganda operation is undertaking an assessment of water availability in Lake Victoria.
Case study: Cleaner Production Audit at Uganda Breweries Ltd. As a first step of the cleaner production audit at Uganda Breweries, the assessors undertook a pre-assessment based on specified data that was provided by the company prior to the audit. This was followed by a two-day on-site evaluation. Finally feasibility studies were carried out on some of the key aspects identified.
The pre-assessment indicated that Uganda Breweries is a medium water-consuming brewery with a specific water use of 9.0 hl/hl (hl water/hl beer). Low consuming breweries achieve a specific water us of 5 h/hl. The audit showed that the bottling/packaging process accounts for most of the excess consumption, however, also brewhouse and domestic/garden use showed potential for reduced consumption.
The in-plant assessment revealed a reasonably efficient brewery with few areas of poor water housekeeping, with the exception of packaging. Aging equipment is responsible for the excessive water consumption. The pasteuriser and the vacuum pump alone could save more than 40 000 kl/y. Water saving here is dependent on investment in new equipment as well as ongoing maintenance. Currently, the equipment is hard pressed to meet sales requirements, which in turn allows little time for maintenance – a vicious circle.
No major problems were identified in the operation of the brewhouse. Most of the apparent excess water consumption appeared to be measuring problems that could be solved by installing a correctly placed meter. However, some of the leaks in the brewhouse could have been fixed more promptly if spare parts could be more readily obtained.
In low consuming breweries the warehouse, domestic, office, canteen and garden only account for 0.05 of the total water use. At Uganda Breweries their proportion is 0.62. It is suggested that reuse of treated wastewater for gardens, toilets and other uses, could reduce the overall water consumption at the plant.
The Diageo Group, which owns the brewery, is already paying some attention to these issues. The brewery is in the process of being ISO 14 000 certified and has appointed a person for the function to be a specialist in cleaner production. The
Sustainable Water Utilisation in African Breweries 28
responsibility for overall water consumption is placed solely on the Utility Manager. Further awareness raising is still necessary – while key performance indicators are regularly displayed within brewery, water consumption is not part of this reporting.
The audit included feasibility studies for investments in a new pasteuriser and vacuum pump. A new pasteuriser would cost 1.5 billion UGX with a payback time of one year. The fast payback is due to the major beer losses in the current operation. Water and energy savings by themselves do not seem to be an argument to the brewery although the water saving potential is 330 000 hl/year.
Saving in water does not financially justify a new vacuum pump. As an alternative, it is suggested to recirculate the cooling water using existing cooling facilities. The water sawing potential is 80 000 hl/year.
An extension of the yeast recovery process could be done without major investment and with a potential of recovering an extra 1% of lost beer; this is equivalent to water savings of 70 000 hl/year.
In conclusion of the assessment of Uganda Breweries, there is potential water saving of more than 3 million hl/year or 30% of present use, and there is equivalent potential of waste reduction.
Cleaner production action would thus be in equipment and operation, the latter requiring further staff training, and include better monitoring.
It is recommended to focus cleaner production actions on the packaging department of the plant as the introduction of some new equipment would allow for immediate major savings in water and waste and in turn money. This measure would also sent the right message with regards to water reduction to management and staff. The fact that Uganda Breweries is currently running close to full production capacity with ever increasing sales demands supports the urgency of introducing cleaner production activities in the packaging department.
Sustainable Water Utilisation in African Breweries 29
8. Conclusions and recommendations
While there are still many gaps in the information obtained for this study, we can already make some preliminary conclusions that can, if necessary, be confirmed or modified in subsequent studies. These conclusions are likely to be relevant also in other countries beyond the four studied here.
8.1. CONCLUSIONS The efficiency levels of African breweries can at best be described as ‘medium’, with rather wide variations in and between countries and breweries. Most breweries are still far from the accepted international best practice benchmark level of 6.5 hl/hl, let alone the best technology level of 4 hl/hl. Therefore there are many opportunities for improving water use efficiency. The study highlights that improvements do not always need large financial investments, and that simple housekeeping and minor plant changes can often produce significant reductions in water use (and effluent volume). As performance draws nearer the benchmark level, more major investments in technology would be needed. These investments are especially appropriate when plant capacities are expanded or when new plants are built.
The need for action on reducing water use has been well demonstrated. Available information about water conflicts arising from breweries’ use of water resources suggests that there is already a problem in some places. Planned increases in beer production will exacerbate this competition with other (growing) water uses.
Nevertheless, awareness is still limited among the main partners – company, government, and public – about the need for water savings in breweries, and of the best way of achieving them. Environmental control is still often seen as an issue of wastewater treatment rather than improving production efficiency, even though many studies have shown the latter to be more cost-effective to the company. The concept of reducing waste flows before building treatment facilities has yet to take a firm hold in the mindset of industry managers.
At this moment, the primary driver for reduced water consumption and pollution reduction are the corporate environmental policies of the multinational companies active in the brewing industry, and even then, these policies are not always implemented to their full extent. This, combined with low environmental enforcement, has resulted in low implementation of cleaner production. The presence of the National Cleaner Production Centres did assist in implementing some housekeeping and low cost interventions in Ethiopia although the outcomes are not documented. In Ghana and Uganda, where the multinationals are much better represented, the drive to the implementation of cleaner production was through the corporate structures more than through enforcement of legislation.
Other drivers such as regulation, water fees or general public pressure appear to be relatively weak. Even the supposed business objective of lowering production costs by reducing waste seems not to be very effective in prompting cleaner production action in the companies studied. Managers appear to be more focussed on expanding output than in reducing production costs.
The general information combined with the Uganda case studies confirms that cleaner production has the potential to make a major contribution to reducing water consumption in African breweries. There are likely to be concurrent savings in energy and chemical consumption as well. In addition, cleaner production solutions may also increase output of product through reduced wastage and breakage in the
Sustainable Water Utilisation in African Breweries 30
packaging line and in recovery of product from filters, etc. The challenge, as always with cleaner production, is to ‘sell’ it as a solution to suspicious industrial and consulting professionals whose culture has been to seek simple one-dimensional solutions elsewhere (often at significantly increased cost).
While some conclusions can already be drawn from this study, it is clear that there is still a shortage of adequate data for more detailed decision-making both at national and at plant levels in the four countries studied. For various reasons many of the measurements needed for a fuller analysis of cleaner production potential are not being undertaken at present. At the national level industrial water use as a proportion of total water is not usually calculated. Individual breweries generally do not measure plant water use parameters in a meaningful way to allow remedial measures to be proposed. While volume and quality of wastewater discharge is more commonly measured, its impact on ambient water quality is rarely documented.
Even with the limited data, we can conclude that individual plants have a variety of technology options for improving water efficiency especially, in the washing and bottling plants, but also in cooling, and through water re-use and yeast recovery. Some of these require additional investments, but they will also allow an increased output. Improvements in housekeeping and operation can realise some significant water saving without any major investments. There appear to be further opportunities for recycling used waters of various types in the plant, and for outside users if the chemical composition can be controlled. Unfortunately, lack of regular flow monitoring in brewery plants currently prevents plant managers from being able to study all these options in a clear-cut way.
A combination of government, corporate and public pressure on breweries is encouraging some of them to build treatment plants. However, the prior use of cleaner production to improve production efficiency would allow them to meet requirements with smaller (and cheaper) treatment plants, or perhaps to recycle less polluting effluent to agricultural or other uses. This message of ‘cleaner production before treatment’ needs to be strengthened in various communications with companies and the authorities.
A serious handicap is that governments adopting explicit water policies concerning industry (and breweries of course) have not so far set an adequate framework on water use for large companies. Accordingly, water reduction targets are set purely based on corporate priorities without taking into account public needs for water access. We find that water shortages are already affecting several brewery operations. In breweries where current production efficiencies are well short of the best-practice levels of 6.5 hl/hl beer, the water savings that could be achieved from the application of cleaner production can logically be seen as a new (and free) source of water. This aspect could usefully be stressed by the water supply authorities to those companies seeking additional water access for their plant expansion.
In fact government policy seems to have largely ignored industrial water issues despite the real constraints felt by some industries, and growing conflicts over water use and effluent discharge in various places. Government policy is often more preoccupied with augmenting supply to domestic or agricultural users than ensuring wise use of the existing resource. Few countries impose a realistic fee for industrial water, and effluent discharge permits are often not enforced. There appear to be no government targets for industrial water use that could be used as a basis for discussion and negotiation on cleaner production. Whilst information and assistance may be given for rural and urban water users, there is no information campaign to encourage better stewardship of industrial water. Financial aspects are not dealt with in a coherent way. Governments have not so far used fiscal instruments to influence
Sustainable Water Utilisation in African Breweries 31
water use in the countries studied. Water fees, if they exist at all, are insufficient to influence consumption behaviour. Overall, this study showed that awareness among government officials on water issues, let alone industrial water issues, is generally low, especially outside the water sector. Low awareness inevitably results in lack of action.
However, the situation within companies is not beyond reproach. Conventional cost accounting does not include much of the cleaner production relevant information that would help lead to action on water reduction, as for example, the cost of operating treatment plants, energy and chemicals costs in relation to excess water use, etc. In any case, in a commercial climate where breweries are presently financially quite profitable (and expanding), it is not clear how much emphasis management is actually putting on reducing operating costs.
While corporate management is more aware of water matters as a policy issue, companies have not always succeeded in translating this awareness into action at the operational level. There is still a disjuncture between corporate statements and what occurs in the plants. Many plants do not seem to monitor process water use systematically, with the result that leaks and excessive water use go undetected for long periods. There is insufficient appreciation by local managers that improved water management is an economic advantage to the company as well as a gain to the environment. Most breweries have not studied the concomitant costs associated with high water use, e.g. energy costs, higher chemicals use, costs of pumping and treatment. These costs could well be higher in some cases than the actual cost of the excess water. In brief, corporate headquarters could gain substantially by exercising more influence on national subsidiaries to better address their water issues.
A number of corporate drivers already operate, even if feebly, that could help to move the current situation to a higher plane:
• The increasing tendency for plants to seek ISO 14 000 certification should ideally lead to water management as one of its major preoccupations. But plants already certified often have been slow to implement any changes on the ground, seeing certification more as a corporate marketing exercise. Nevertheless with the correct focus, this avenue is one of the most promising in improving water management, especially if the link between ISO 14 000 and cleaner production can be made more explicit.
• Environmental reporting is currently preoccupied with the mandatory reporting of pollution releases under regulatory requirements of the authorities. It is not clear if these reports are available to the general public. There was no instance in this study of a nationally based company undertaking public sustainability reporting under the Global Reporting Initiative, and more generally, annual reports on water use have not yet become common in any of the countries studied. Governments and companies can usefully increase the mention of water use in their reporting procedures to give the issue more visibility.
• It is apparent that the EIA process could be better used than it is now to improve water efficiency in new or expanding breweries. Traditionally, EIAs have called for treatment plants rather than better processing efficiencies, however this could be overcome if cleaner production were to become a more explicit element in the terms of reference of future EIAs.
At the regional level, what is missing is a business framework where brewery operators could discuss common concerns and show leadership in technical cooperation and information exchange. Such a structure would also allow more productive regional dialogue with international organisations such as UNEP, Global
Sustainable Water Utilisation in African Breweries 32
Compact, the African Roundtable on Sustainable Consumption and Production (ARSCP), etc.
A general observation is that despite much previous activity in Africa, cleaner production initiatives do not seem to have flowed naturally to the brewery sector, notwithstanding the opportunity of numerous meetings and extensive advisory material available from, for example UNEP and UNIDO, and through the ARSCP. This applies also to the previous UNEP initiative on Cleaner Production Investments, a learning programme aimed at the financing and accounting sector (see www.financingcp.org). Only a few brewery operations have benefited from cleaner production assessments, notably in Ethiopia, and more recently in Uganda. It would appear that a more focussed and prolonged cleaner production outreach to the brewery sector is needed to readdress this situation.
8.2. RECOMMENDATIONS Further work is required to reduce water use in African breweries given their position as ‘medium’ on water efficiency criteria, and in view also of the growing potential for water use competition with other users.
A major effort still needs to be made in all stakeholder groups – company, government, public – to raise awareness of the national importance of improved water management in breweries, and of the best means of achieving it. It is important to promote more effectively to corporate and government decision-makers the use of cleaner production as a process efficiency enhancement tool. Cleaner production allows more systematic diagnostics of plant efficiencies, and leads to a more precise study of cost-effective options. Especially important is to stress the prior use of cleaner production to minimise effluent volumes and pollution loads before designing wastewater treatment plants. The relevance of cleaner production tools also should be further promoted to financial professionals and accountants who need to be more aware of the hidden costs associated with excessive water use and waste volumes. In this sense, a reinvigoration of the Cleaner Production Financing initiative in Africa – with special reference also to the brewery sector – would be valuable. NCPCs can assist by offering training and information events aimed at these stakeholders. UNEP’s assistance in finding support for such events would allow an acceleration of the process.
A more effective application of government policy would occur if better information on water allocations, water use and discharge were available, as well as more precise knowledge of water use at the process level in brewery plants. The old military adage that ‘time spent on reconnaissance is seldom wasted’ is also applicable to the water sector - better data leads to better decision-making. The data limitations of this study show that an increased emphasis on collecting relevant and accurate information related to African breweries is a pre-requisite for further project development. Breweries themselves need to be encouraged to study more deeply their own water consumption and discharge. Governments should, as a minimum, demand and publish information of water abstraction and release by companies in the interests of more transparent management of a public resource. Governments would also benefit from making industrial issues a more prominent part of their national water policies, including targets for water use efficiency by key sectors such as breweries. Greater use could be made of financial instruments such as water abstraction and discharge fees, with more realistic fee scales to influence industrial water management and to recover government costs in administrating the legislation. By linking the performance of the brewery sector to national water plans, governments would encourage breweries to compare their performance and pursue water saving goals established under these plans. There is much to do to make
Sustainable Water Utilisation in African Breweries 33
government action a more effective driver for change. Outreach to interested governments should form an important part of future ABREW activities.
At corporate level there is room for further evolution. Corporate targets for water efficiency would improve the guidance at operational levels and provide concrete input to environmental performance reports. Water management targets should be more explicitly included in ISO 14 000 and other environmental management tools such as EIAs, audits, and public outreach and communication. If necessary, corporate management should provide additional assistance to local operations in meeting such targets. Companies should work harder to make an explicit link between ISO 14 000 and cleaner production. Public reporting could be used as a vehicle for also improving corporate water information. Companies should therefore be encouraged, if not required, to publish annual sustainability reports where water issues – including consumption and release – are highlighted. Such reports and the benchmarking which would naturally follow can be a powerful driver for better water management overall.
The aspect of environmental cost accounting and cleaner production financing should be more prominent in future cleaner production work in breweries. Current managers are not fully aware of the indirect costs associated with inefficient water management, nor the best way of financing necessary process changes to reduce water use. At the same time the NCPCs and Roundtables should reinforce their efforts at educating accountants and financiers of these aspects and the positive role they can play in guiding future investments for new plants and upgrades.
Looking more broadly, a sensitisation of pan-African business leaders in the brewery sector would be an important step forward in providing the commitment within corporations to further advance the water management agenda. UNEP’s network in business circles could be used as a starting point to such a programme, using also the framework of existing business initiatives such as WBCSD, the Global Compact, GRI and others. Close links with African business associations would be indispensable to such an activity. The CEO Water Compact is an excellent starting point on which the industry and UNEP (preferably together) could build future initiatives aimed at community water access around brewery plants.
Further action by the two major partners above – government and business – can usefully be facilitated by existing global and regional institutions, in this case UNEP and its regional partners. NCPCs as well as the ARSCP should reinforce their efforts to reach out to the brewery sector. The conclusions of this study are likely to apply to most African countries, and improved water management is an important regional objective across the entire continent. The Roundtable meetings are an occasion to provide further information and training to the NCPCs about this sector and the opportunities and best approaches in dealing with the brewing industry. UNEP can play an important role in updating and augmenting the technical information on cleaner production in breweries. These meetings can also be used to provide information and training to the brewery industry. NCPCs and companies should take additional steps to more closely integrate water management and cleaner production approaches into the practice of ISO 14 000, including the building of water performance targets into EMS. Closer linkages are also useful between ISO 14 000 and environmental reporting and the use of EIAs where applicable. UNEP can play a useful facilitating role in the creation of a regional business forum of brewery companies to facilitate dialogue and capacity building.
Sustainable Water Utilisation in African Breweries 34
9. Bibliography
ABREW Framework analysis country report for Ghana, 2006
ABREW Framework analysis country report for Uganda, 2006
ABREW Framework analysis country report for Ethiopia, 2006
ABREW Framework analysis country report for Morocco, 2006
Addis Fortune, Beer Prices Increase, Volume 7 (No.353), February 2007
Integrated Regional Information Networks, Ghana: To protect or not to protect water resources – Cape Coast learns the hard way, September 2006
SOGESID, Local Water Supply, Sanitation and Sewage: Country Report for Morocco, 2005
Technical Report on breweries
UNESCO World Water Assessment Programme, National Water Development Report for Ethiopia, December 2004
United Nations Environment Programme (Industry and Environment) (1991) Audit and Reduction Manual for Industrial Emissions and Wastes, Technical report 7, ISBN: 92-807-1317-5. (Includes case study and protocol for CP audits of breweries)
United Nations Environment Programme (Industry and Environment) (1996), Cleaner Production in Breweries: A workbook for trainers, First Edition, ISBN: 92-807-1607-7, http://www.unep.fr/pc/cp/library/training/breweries/chapt%2001.pdf (accessed 15 July 2007)
United Nations Environment Programme (Industry and Environment) (1996), Cleaner Production – a training resource package, First Edition, ISBN 92-807-1605-0 http://www.unep.fr/pc/cp/library/training/cptraining/All%20chapters.pdf (accessed 15 July 2007)
United Nations Environment Programme (Industry and Environment), Profiting from Cleaner Production: Resource Kit for Training on CDROM and on UNEP DTIE website http://www.financingcp.org/training/training.html
United Nations Environment Programme (Division of Technology, Industry and Economics) (2003) Cleaning Up – experience and knowledge to finance investments in cleaner production, http://www.financingcp.org/library/PDF/UNEP_CLEANING.pdf (accessed 15 July 2007)
United Nations Environment Programme (Division of Technology, Industry and Economics) The CP Companion on CDROM.
WaterAid Uganda, End Water Poverty – Sanitation and Water for All, World Water Day Supplement, March 2007
Water Sector Restructuring Secretariat, Water for Ghana (Ghana Water Policy)
Sustainable Water Utilisation in African Breweries 35
9.1. INTERNET RESOURCES Beer brands http://beer.trash.net/ (accessed 15 July 2007)
Brewery information and address database http://www.beerme.com/ (accessed 15 July 2007)
Carlsberg Breweries A/S, Environmental Report (2003 and 2004) http://www.carlsberggroup.com/Company/Documents/Environmentalreport2003-2004.pdf (accessed 16 July 2007)
Castel Group http://www.groupe-castel.com/uk/accueil.shtml (accessed 16 July 2007)
Database for African breweries http://www.skolinternational.com/ (accessed 15 July 2007)
Diagio Corporate Citizenship, (2005) http://www.diageo.com/en-row/CorporateCitizenship/Communityandenvironment/ (accessed 16 July 2007)
Global Compact, including the CEO Water Mandate http://www.unglobalcompact.org (accessed 16 July 2007)
Global Reporting Initiative http://www.globalreporting.org accessed (10 October 2007)
Heineken, Sustainability Report - Focus on Impact http://www.heinekeninternational.com/homepage.aspx (accessed 16 July 2007)
Institute of Brewing and Distilling (Africa Section): www.igbafrica.co.za (accessed 15 July 2007)
Listing of breweries in Africa http://www.beerlabels.dk/foreign/africa.html (accessed 15 July 2007)
SAB Miller Sustainable Development Report (2006), http://www.sabmiller.com/NR/rdonlyres/2436BE0A-972B-43E4-8BDB-A43B8E848325/0/SABMiller_SDR_2006.pdf (accessed 15 July 2007)
SAB Miller (2007) Water Report 2007: Water - the challenges for the future (June 2007) http://www.sabmiller.com/NR/rdonlyres/58E03323-B96C-46B1-A839-60CA67A6AFDF/0/SABMiller_plc_waterreport_2007.pdf (accessed 15 July 2007)
SAB Miller Sustainable Development Report (2007), http://www.sabmiller.com/NR/rdonlyres/928D463A-CD20-4E66-A03F-90AE0363D60F/0/SABMiller_plc_sdr_2007.pdf (accessed 15 July 2007)
UNEP DTIE website for CP and EMS resources (accessed 10 October 2007)
http://www.unep.fr/pc/cp/
http://www.uneptie.org/pc/pc/tools/index.htm
UNEP FI website for CP Financing (accessed 10 October 2007)
World Business Council for Sustainable Development http://www.wbcsd.org/ (accessed 10 October 2007)
ANNEX 1:
Financial instruments used to influence water use in Uganda
Table A1.1: Detailed Schedule for Uganda Instrument Details and Cost
Requirement for Water use & Construction permits This is a flat rate that covers costs of evaluation and assessment of a water permit application. The fee depends on the permit applied for
Permit Processing fees Application fees for various types of permits are defined in the Water Resources) and Waste Discharge Regulations of 1998 as follows: Surface Water Abstraction Permit UGX 450,000=. Ground Water Abstraction Permit UGX 450,000= Drilling Permit UGX 500,000= Construction Permit UGX 500,000= Easement Certificate UGX 100,000= Waste Water Discharge Permit UGX 650,000=
Requirement for a Wastewater Discharge (Effluent) permit Renewal fees for various types of permits are defined in the Water (Resources) and (Waste Discharge) Regulations of 1998 as follows:
Permit Processing fees Surface Water Abstraction Permit UGX 50,000= Ground Water Abstraction Permit UGX 50,000= Waste Water Discharge Permit UGX 650,000= Drilling Permit UGX 500,000= Construction Permit UGX 500,000=
Requirement for Water use & Construction permits ANNUAL CHARGES LEVIED ON WATER PERMIT HOLDERS FOR THE DURATION OF THEIR PERMITS Abstraction and wastewater discharge permit holders are charged annual fees for the duration of their permit. The annual charge is aimed at : Providing incentives for conservation and Minimisation of water wastage. Influencing the user’s habits regarding Consumption and use of water. Encouraging reduction of concentration of pollutants in waste water discharge and enhancing environmental conservation.
Permit ANNUAL fees The annual fee breakdown depending on type of permit held is as follows: Taking and using water in the range of 1 and 400 m3/day – UGX 200,000= Taking and using water in the range of 400 and 1,000 m3/day – UGX 1,000,000= Taking and using water above 1000 m3/day – UGX 3,000,000= Operating any works which impound water for non-consumptive use. E.g. Hydro Power in the range of 10-50 Mega Watts – UGX 1,000,000= Operating any works which impound water for non-consumptive use e.g. Hydro Power in the range of 50-100 Mega Watts – UGX 5,000,000= Operating any works which impound water for non-consumptive use. e.g. Hydropower of over 100 Mega Watts – UGX 20,000,000=
Requirement for a Wastewater Discharge (Effluent) permit yes
Instrument Details and Cost Load fee COMPUTED USING BOD LOAD i.e. a product of concentration (mg/l) and Effluent Discharge rate (m3/day) - with effluent treatment plant or without effluent treatment plant
BOD5 loading (in 1000Kg Oxygen per a year) of between 100 and 400 – UGX 500,000= BOD5 loading (in1000 Kg Oxygen per year) of between 400 and 600 – UGX 1,000,000= BOD5 loading (in 1000 Kg Oxygen per year) of between 600 and 1800 – UGX 2,500,000= BOD5 loading (in 1000 Kg Oxygen per year) of between 1800 and 3000 – UGX 5,000,000= BOD5 loading (in 1000 Kg Oxygen per year) of between 3000 and 3800 – UGX 7,500,000= BOD5 loading (in 1000 Kg Oxygen per year) of between 3800 and 5200 – UGX 10,000,000= BOD5 loading (in 1 00 kg Oxygen per year) of 5 200 and over – UGX 13 000 000=
Note: 1US$ = 1,750UGX
ANNEX 2:
Country and Brewery Contact Information Ethiopia, Ghana, Morocco and Uganda
Ethiopia Table A3.1: Annual beer production
Annual production 2000 2001 2002 2003 2004 Total production (hl) 1 300 000 1 446 000 1 197 000 1 064 000 1 610 000 Per capita (l) 2,02 2,20 1,78 1,55 2,30 Per capita (non Muslim)(l) 4,04 4,39 3,56 3,10 4,60 Per GDP (hl/millions $) 204,22 231,75 197,55 159,96 199,33 % of African production 2,11 2,40 1,90 1,61 2,28
Table A3.2: Brewery contact details
Brewery Name Registered Office Leading Group/Shareholders
Kombolcha Brewery Kombolcha (south Wollo - 240 Km Northeast of Addis Ababa)
Leading Group: BGI
Kombolcha
A project is reportedly under way for the construction of a brewery near Addis-Ababa.
AkakiI Leading Group: SAB International Beverage Corp. [consortium national]: 51.0% SAB I[manag control]: 49.0%
-
Building Project Leading Group: Carlsberg Groupe Danois [Carlsberg]
-
Bedele Brewery Bedele Leading Group: Etat Etat: 100.0%
Sirata Guluma Production Manager Bedele
New brewery under construction
Nazaret Leading Group: Autres STAR Group (Ethiopian investors):
-
Dashen Brewery (brewery under construction)
Gondar Leading Group: Autres Groupe d'invstisseurs locaux affiliés à des Ong à Tigray
-
Table A3.3: Information on breweries Brewery Name Number
of Plants Site (Area) Announced
Production Brands
produced General Information
Meta Abo Brewery - Sebeta - Meta beer In operation since 1966 - Privatisation in process
St. George Brewery 1 Addis-Ababa
±350 000 hl - Privatised in November 1998 and sold to the French Cy BGI
Harrar Brewery 1 Harrar ±350 000 hl Harar Beer Privatisation in process Kombolcha Brewery 1 Kombolcha Capacity:
250 000 hl Bati Start in 1999, have cost 5 million.
This is the first brewery to set up in northern Ethiopia and should help to bring down the price of beer in the region (prices high due to transport costs).
A project is reportedly under way for the construction of a brewery near Addis-Ababa.
1 Akaki Capacity: 500 000 hl
Castle Investment of +/- 41,5Mio. Construction from an old brewery site of 500 to 700 000 hl capacity will start before end of June 99.
Building Project 1 - Capacity: 500 000 hl
- Investment of 40 million
Bedele Brewery - Bedele - - Built in 1993. In process of privatisation.
New brewery under construction
- Nazaret - - Early stage of construction
Dashen Brewery (brewery under construction)
- Gondar - - Brewery under construction
Ghana Table A3.4: Annual beer production
Annual production 2000 2001 2002 2003 2004 Total production (hl) 900 000 760 000 946 000 950 000 1 048 000 Per capita (l) 4,66 3,86 4,66 4,60 4,98 Per capita (non Muslim)(l) 6,66 5,51 6,66 6,57 7,11 Per GDP (hl/millions $) 180,81 143,36 153,58 124,60 121,58 % of African production 1,46 1,26 1,50 1,44 1,48
Table A3.5: Brewery contact details Brewery Name Registered
Office Leading
Group/Shareholders Directors managers
Achimota Brewery Company Ltd. (ABC)
Achimota PO Box 114
Leading Group: Heineken Heineken: 90.0% Social Security and National Insurance Trust: 10.0%
Seni Adetu Directeur Général P.O. Box 1536 Kumasi +233-51-20 959
Table A3.6: Information on breweries Brewery
Name Number
of Plants
Site (Area)
Announced Production
Brands produced
General Information
Achimota Brewery Company Ltd. (ABC)
1 Achimota 1996 beer : 300 000 hl
ABC beer Also produce a series of soft drinks: Afri-Cola. Fourth largest brewery in the country. Heineken has bought majority shares in ABC for 3,5 million.
Kumasi Brewery Ltd. (KBL)
1 Kumasi Capacity: 400 000 hl
Amstel Malt Star beer
The largest brewery in Ghana. Heineken has bought 25% of shares in Unilever.
Accra Breweries Ltd. (ABL)
1 Accra Capacity: 350.000hl
Castle Club, Stone, Vita Malt
Club is the leader on the beer market. Accra covers 30% of shares in the Ghana market. SAB has bought (for 9 million) the share of Overseas Breweries Ltd. (Switzerland). Accra Breweries shares are quoted on the stock exchange and was founded in 1931. Also produce and distribute a soft drinks range: Club cola, Club soda, Quinine Tonic, Club Muscetella.
Guinness Ghana Ltd. (GGL)
1 Kumasi Beer production
1997: 350 000 hl
Malta Guinness, FES-Stout, Smirnoff ice, Gordon Spark
Increase of turnover by 45% in 96 due particularly to a price rise as the market fell in volume by 20%.
Morocco Table A3.7: Annual beer production
Annual production 2000 2001 2002 2003 2004 Total production (hl) 780 000 869 000 927 000 877 000 914 000 Per capita (l) 2,72 2,98 3,13 2,91 2,99 Per capita (non Muslim)(l) 135,84 148,95 156,38 145,63 149,40 Per GDP (hl/millions $) 23,41 25,65 25,68 20,06 18,26 % of African production 1,27 1,44 1,47 1,33 1,29
Table A3.8: Brewery contact details Brewery Name Registered Office Leading Group/Shareholders Directors managers
Société des Brasseries du Maroc and Cobomi
Casablanca Leading Group:BGI-Castel BGI-Castel: 54.7% Divers: 45.3%
750 000 hl Amstel Bock 49 Flag Heineken Stork La Gazelle 33 Export Castel Beer
BGI (Castel Group) which had already a brewery in Casablanca (Cobomi) purchased in 2003, 54,69 % of SBM (3 breweries) and controls 95 % of the beer market. Also produces under licence Heineken and Amstel beer and the soft-drinks range of Coca-Cola, Fanta, Schweppes.
Uganda Table A3.10: Annual beer production
Annual production 2000 2001 2002 2003 2004 Total production (hl) 1 375 000 1 251 000 1 137 000 1 098 000 1 200 000 Per capita (l) 6,19 5,49 4,62 4,34 4,63 Per capita (non Muslim)(l) 7,37 6,53 5,50 5,17 5,51 Per GDP (hl/millions $) 233,49 220,43 193,98 174,38 175,61 % of African production 2,24 2,08 1,80 1,66 1,70
Table A3.11: Brewery contact details Brewery Name Registered
Office Leading Group/Shareholders Directors managers
Leading Group: Guinness Actionnaire majoritaire: Kenyan Breweries Ltd; Guinness:
Lloyd Managing Director P.O. Box 7130 Kampala
Table A3.12: Information on breweries Brewery
Name Number of Plants
Site (Area)
Announced Production
Brands produced General Information
Nile Breweries Ltd.
1 Jinja Beer capacity:
700 000 hl Prod. 1996: ±350 000 hl
Chairmans ESB Club Pilsener Nile Lite Nile special Number One Nile Special Lager Club
Market share: 60%. Employees: 600. Leading brand: Nile Special Lager. In June 2001: SAB brought its participation up to 93,1% by acquisition from the Madhvani group (undisclosed price), the Madhvani family is still present in the capital. SAB acquired a 40% interest from the Madhvani group on 1/11/97 for 29 million USD.
ANNEX 3:
Information on The CEO Water Mandate
The CEO Water Mandate represents both a call to action and a strategic framework for companies seeking to address the issue of water sustainability in their operations and supply chain. The CEO Water Mandate is voluntary, nonetheless it represents a commitment to action. Its structure is designed to assist companies in developing a comprehensive approach to water management and covers six key areas: direct operations, supply chain and watershed management, collective action, public policy, community engagement, and transparency. More specifically, signatories pledge to set water-use targets, assist suppliers with water-efficiency practices, and partner with governments, policy makers and community groups to address water shortages and sanitation.
In their direct operations the mandate pledges the companies will: • Conduct a comprehensive water-use assessment to understand the extent to which the
company uses water in the direct production of goods and services. • Set targets for our operations related to water conservation and wastewater treatment, framed
in a corporate cleaner production and consumption strategy. • Seek to invest in and use new technologies to achieve these goals. • Raise awareness of water sustainability within corporate culture. • Include water sustainability considerations in business decision-making – e.g. facility siting,
due diligence, and production processes.
In supply chain and watershed management the companies will: • Encourage suppliers to improve their water conservation, quality monitoring, wastewater
treatment, and recycling practices. • Build capacities to analyse and respond to watershed risk. • Encourage and facilitate suppliers in conducting assessments of water usage and impacts. • Share water sustainability practices – established and emerging – with suppliers. • Encourage major suppliers to report regularly on progress achieved related to goals.
In collective action: • Build closer ties with civil society organizations, especially at the regional and local levels. • Work with national, regional and local governments and public authorities to address water
sustainability issues and policies, as well as with relevant international institutions – e.g., the UNEP Global Programme of Action.
• Encourage development and use of new technologies, including efficient irrigation methods, new plant varieties, drought resistance, water efficiency and salt tolerance.
• Be actively involved in the UN Global Compact’s Country Networks. • Support the work of existing water initiatives involving the private sector – e.g., the Global
Water Challenge; UNICEF’s Water, Environment and Sanitation Program; IFRC Water and Sanitation Program; the World Economic Forum Water Initiative – and collaborate with other relevant UN bodies and intergovernmental organizations – e.g., the World Health Organization, the Organisation for Economic Co-operation and Development, and the World Bank Group.
In public policy • Contribute inputs and recommendations in the formulation of government regulation and in the
creation of market mechanisms in ways that drive the water sustainability agenda. • Exercise business statesmanship by being advocates for water sustainability in global and
local policy discussions, clearly presenting the role and responsibility of the private sector in supporting integrated water resource management.
• Partner with governments, businesses, civil society and other stakeholders – for example specialized institutes such as the Stockholm International Water Institute, UNEP Collaborating Centre on Water and Environment, and UNESCO’s Institute for Water Education – to advance the body of knowledge, intelligence and tools.
• Join and/or support special policy-oriented bodies and associated frameworks – e.g., UNEP’s Water Policy and Strategy; UNDP’s Water Governance Programme.
In community engagement: • Endeavour to understand the water and sanitation challenges in the communities where we
operate and how our businesses impact those challenges. • Be active members of the local community, and encourage or provide support to local
government, groups and initiatives seeking to advance the water and sanitation agendas. • Undertake water-resource education and awareness campaigns in partnership with local
stakeholders.
• Work with public authorities and their agents to support – when appropriate – the development of adequate water infrastructure, including water and sanitation delivery systems.
In transparency: • Include a description of actions and investments undertaken in relation to the CEO Water
Mandate in our annual Communications on Progress for the UN Global Compact, making reference to relevant performance indicators such as the water indicators found in the Global Reporting Initiative (GRI) Guidelines.
• Publish and share our water strategies (including targets and results as well as areas for improvement) in relevant corporate reports, using – where appropriate – the water indicators found in the GRI Guidelines.
• Be transparent in dealings and conversations with governments and other public authorities on water issues.