39
Sustained Habitability on a Dynamic Early Earth James Kasting Department of Geosciences Penn State University
| Date post: | 23-Dec-2015 |
| Category: |
Documents |
| Upload: | theodora-goodwin |
| View: | 219 times |
| Download: | 1 times |
Sustained Habitability on a Dynamic Early Earth
James KastingDepartment of Geosciences
Penn State University
Talk Outline
• Part 1: Precambrian climate evolution—constraints on surface temperature and greenhouse gas concentrations
• Part 2: The rise of atmospheric O2 and the enigma of low Proterozoic O2 concentrations

after Bassinot et al. 1994
O isotopes—the last 900 k.y.
• O isotopes in carbonate rocks are routinely interpreted as measurements of paleotemperature during the Pleistocene glacial epoch• High 18O means low temperature, and vice versa• Part of this is an ice volume effect, and part is thermodynamic. The two effects add
(PD
B)
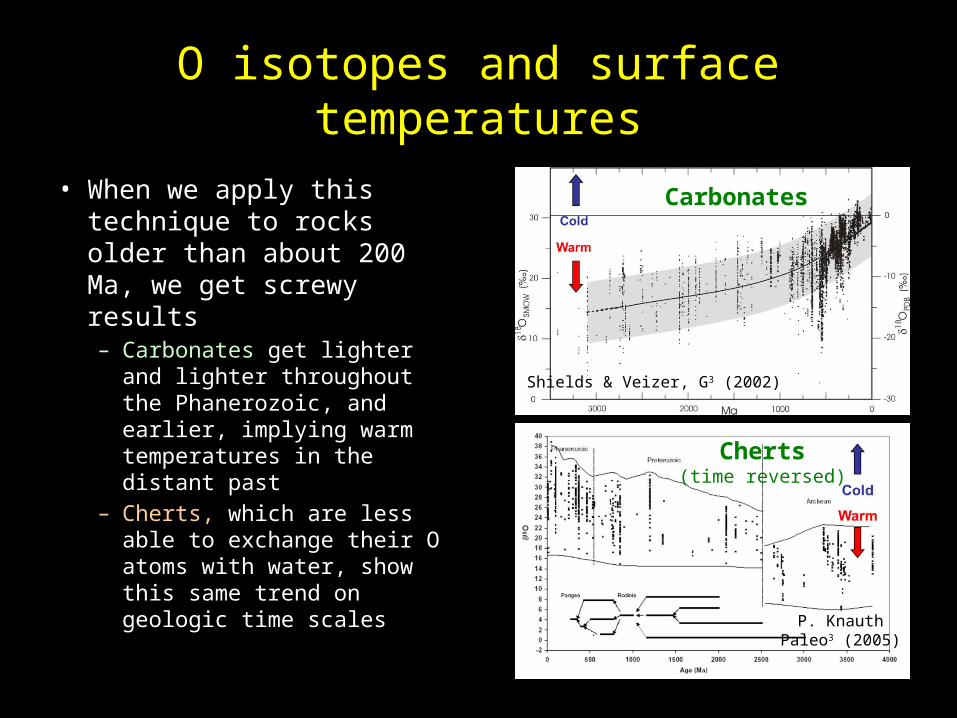
O isotopes and surface temperatures
• When we apply this technique to rocks older than about 200 Ma, we get screwy results– Carbonates get lighter and
lighter throughout the Phanerozoic, and earlier, implying warm temperatures in the distant past
– Cherts, which are less able to exchange their O atoms with water, show this same trend on geologic time scales
Carbonates
Cherts(time reversed)
Shields & Veizer, G3 (2002)
P. KnauthPaleo3 (2005)

Face value temperatures from O isotopes
• Chert data: Mean surface temperature was 7015oC at 3.3 Ga – Ref: Knauth and Lowe, GSA Bull. (2003)
• Carbonate data: Surface temperatures remain significantly elevated (enough to cook the trilobites) until as recently as the early Devonian (~400 Ma)
It is hard to believe any of this, though, because there is evidence for glaciation at several different times in the Precambrian

Geologic time
Rise of atmospheric O2 (Ice age)
First shelly fossils (Cambrian explosion)Snowball Earth ice ages
Warm (The ‘Boring Billion’)
Ice ages
Warm (?) Origin of life
‘Conventional’ interpretationof the Precambrian climaterecord
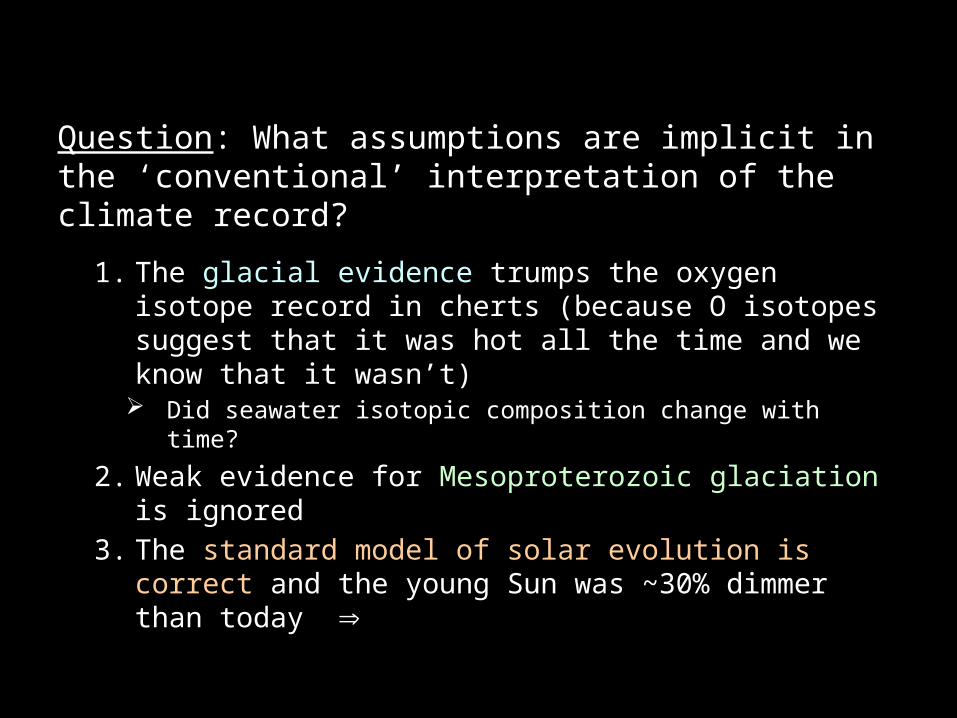
Question: What assumptions are implicit in the ‘conventional’ interpretation of the climate record?
1. The glacial evidence trumps the oxygen isotope record in cherts (because O isotopes suggest that it was hot all the time and we know that it wasn’t)
Did seawater isotopic composition change with time?2. Weak evidence for Mesoproterozoic glaciation is
ignored3. The standard model of solar evolution is correct
and the young Sun was ~30% dimmer than today
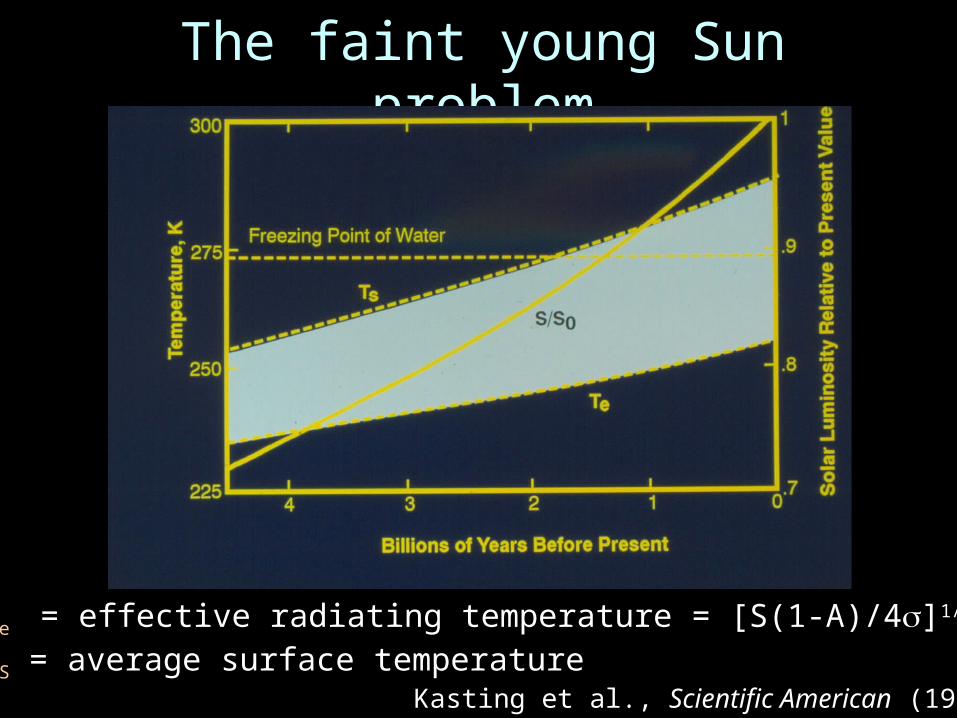
The faint young Sun problem
Kasting et al., Scientific American (1988)
Te = effective radiating temperature = [S(1-A)/4]1/4
TS = average surface temperature

Greenhouse gases and CO2-climate feedbacks
• So, one needs more greenhouse gases, especially during the Archean
• CO2 is a prime candidate because it is part of a negative feedback loop (see panel at right)
• We should be cautious about over-interpreting this model, though, because land area may have been much smaller during the Archean
Diagram illustrating the (modern)carbonate-silicate cycle. AtmosphericCO2 increases when the climate cools because of slower rates of silicate weathering on land

What can we say empirically about CO2 levels in the distant past?
• Some controversial constraints on Archean CO2 can be derived from paleosols (ancient soils)
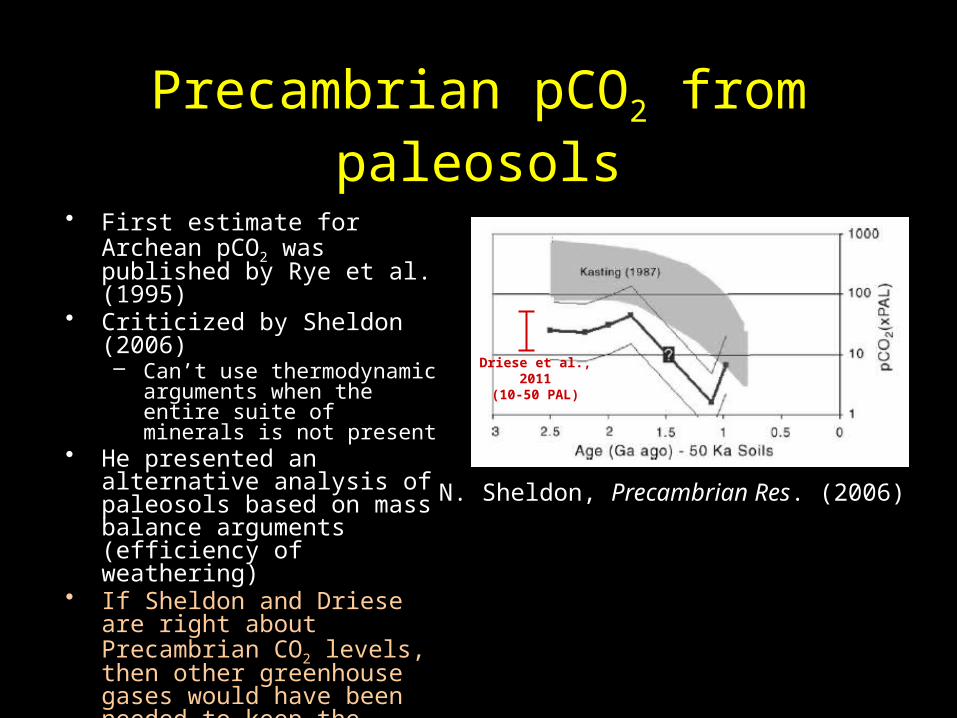
Precambrian pCO2 from paleosols
• First estimate for Archean pCO2 was published by Rye et al. (1995)
• Criticized by Sheldon (2006)– Can’t use thermodynamic
arguments when the entire suite of minerals is not present
• He presented an alternative analysis of paleosols based on mass balance arguments (efficiency of weathering)
• If Sheldon and Driese are right about Precambrian CO2 levels, then other greenhouse gases would have been needed to keep the early Earth from freezing
• But, a new analysis method has recently been published..
N. Sheldon, Precambrian Res. (2006)
Driese et al.,2011
(10-50 PAL)
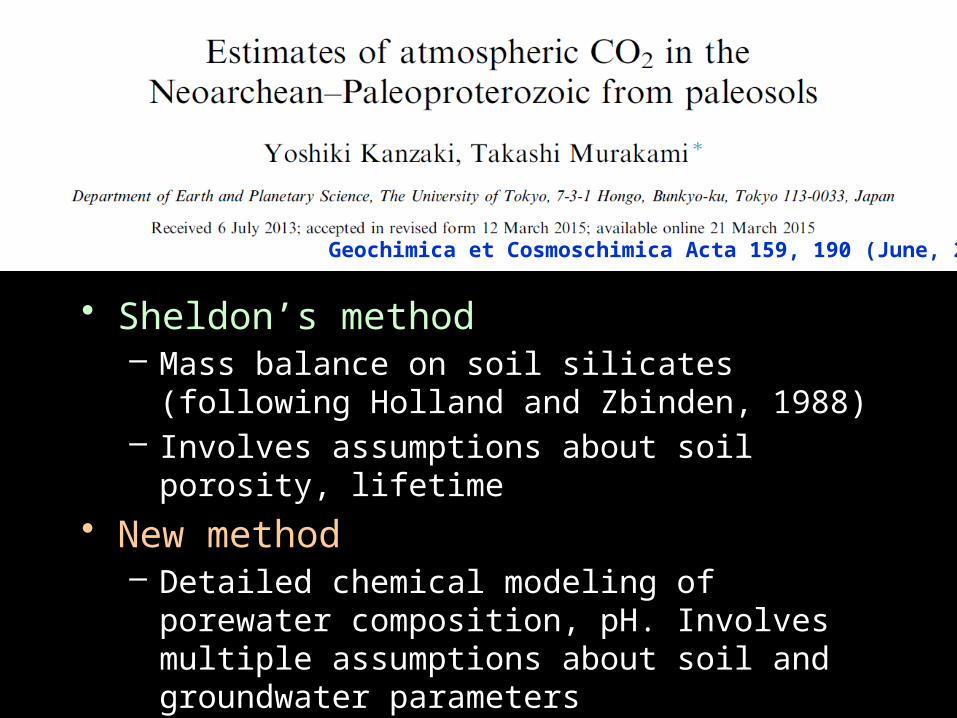
• Sheldon’s method – Mass balance on soil silicates (following
Holland and Zbinden, 1988)– Involves assumptions about soil porosity,
lifetime• New method
– Detailed chemical modeling of porewater composition, pH. Involves multiple assumptions about soil and groundwater parameters
Geochimica et Cosmoschimica Acta 159, 190 (June, 2015)
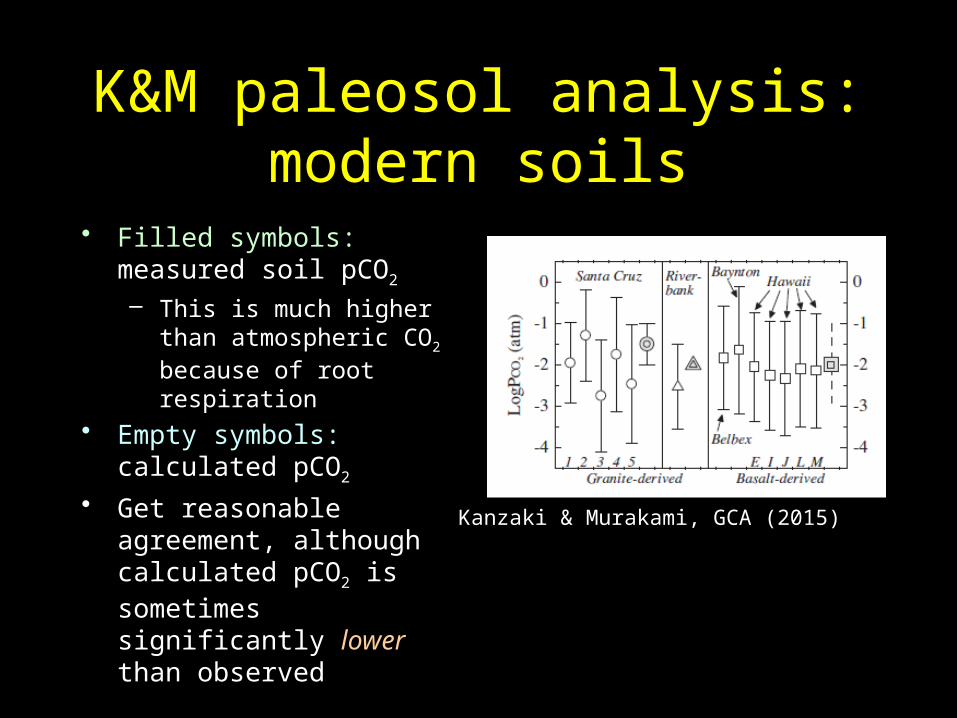
K&M paleosol analysis: modern soils
• Filled symbols: measured soil pCO2
– This is much higher than atmospheric CO2 because of root respiration
• Empty symbols: calculated pCO2
• Get reasonable agreement, although calculated pCO2 is sometimes significantly lower than observed
Kanzaki & Murakami, GCA (2015)
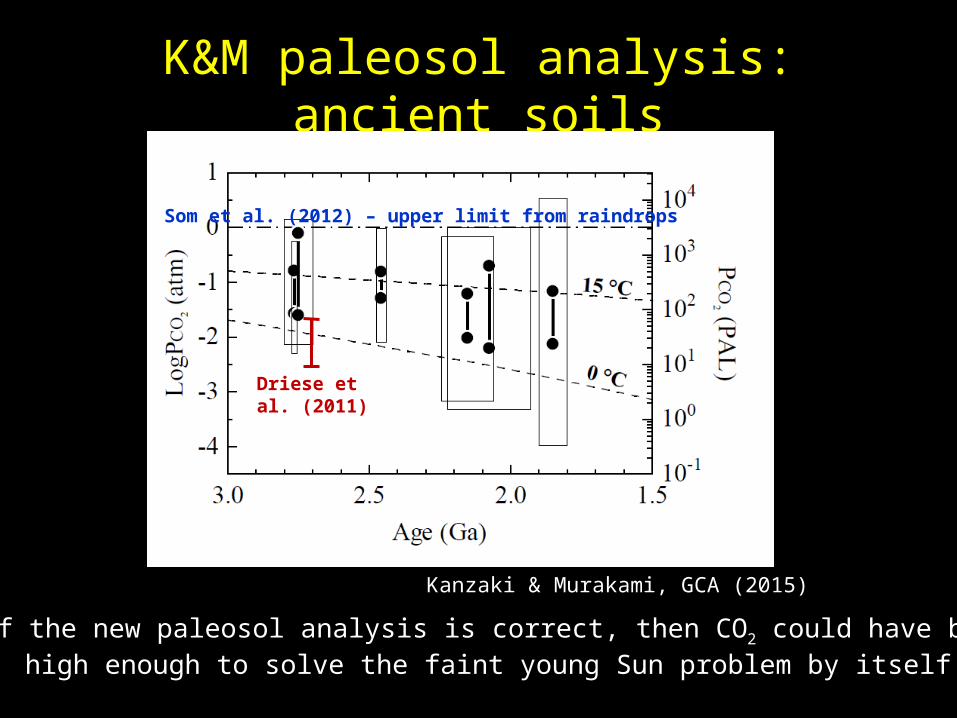
K&M paleosol analysis: ancient soils
Kanzaki & Murakami, GCA (2015)
• If the new paleosol analysis is correct, then CO2 could have been high enough to solve the faint young Sun problem by itself
Driese etal. (2011)
Som et al. (2012) – upper limit from raindrops
• That said, methane should also have been an important greenhouse gas during the Archean– Its lifetime is long in a low-O2 atmosphere– It’s a moderately good greenhouse gas (but
not nearly as good as CO2, contrary to popular opinion)
– The methanogens that produce it are thought to be evolutionarily ancient..
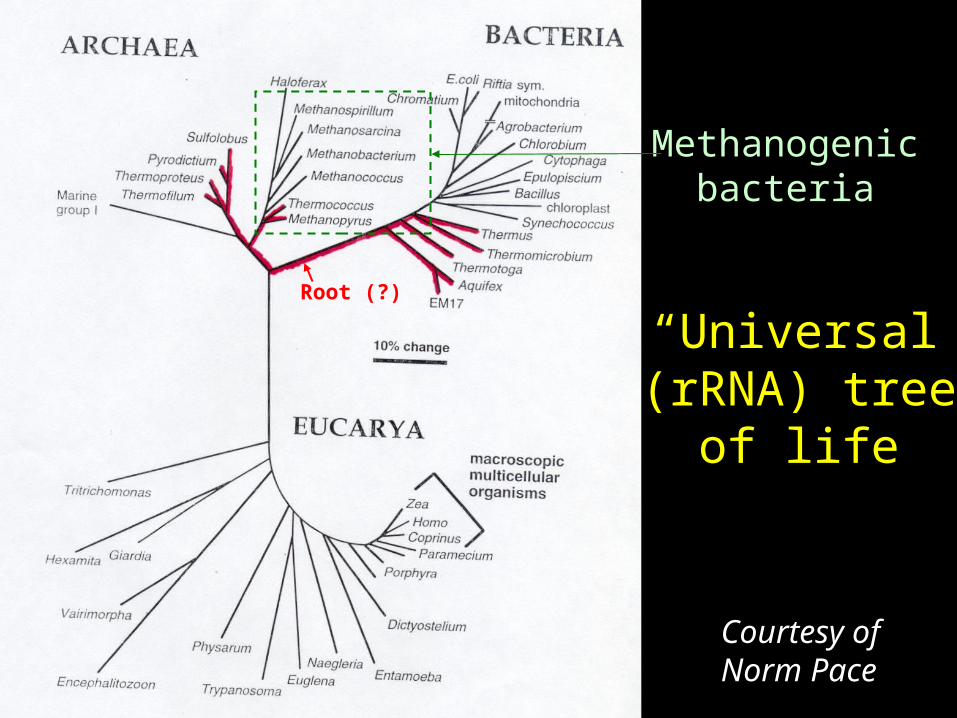
Methanogenicbacteria
Courtesy ofNorm Pace
“Universal”(rRNA) tree
of life
Root (?)

Anoxic ecosystem modeling
• Coupled photochemical-ecosystem modeling of an methanogen- or H2-based anoxygenic photosynthetic ecosystem predicts Archean CH4 concentrations of 200-2000 ppm
• This is enough to produce 10-15 degrees of greenhouse warming
• Higher warming by CH4 is precluded by the formation of organic haze at CH4/CO2 ratios greater than ~0.1
Kharecha et al., Geobiology (2005)

Archean CH4-CO2 greenhouse
• Diagram shows a hypothetical Archean atmosphere at 2.8 Ga
• The black curves show predicted surface temperatures with zero and 1000 ppm of CH4
• The loss of much of this CH4 at ~2.5 Ga could plausibly have triggered the Paleoproterozoic glaciations
2.8 GaS/So = 0.8
J.F. Kasting, Science (2013)
Driese et al. (2011)

Geologic time
Rise of atmospheric O2 (Ice age)
First shelly fossils (Cambrian explosion)Snowball Earth ice ages
Warm (The ‘Boring Billion’)
Ice ages
Warm (?) Origin of life
‘Conventional’ interpretationof the Precambrian climaterecord
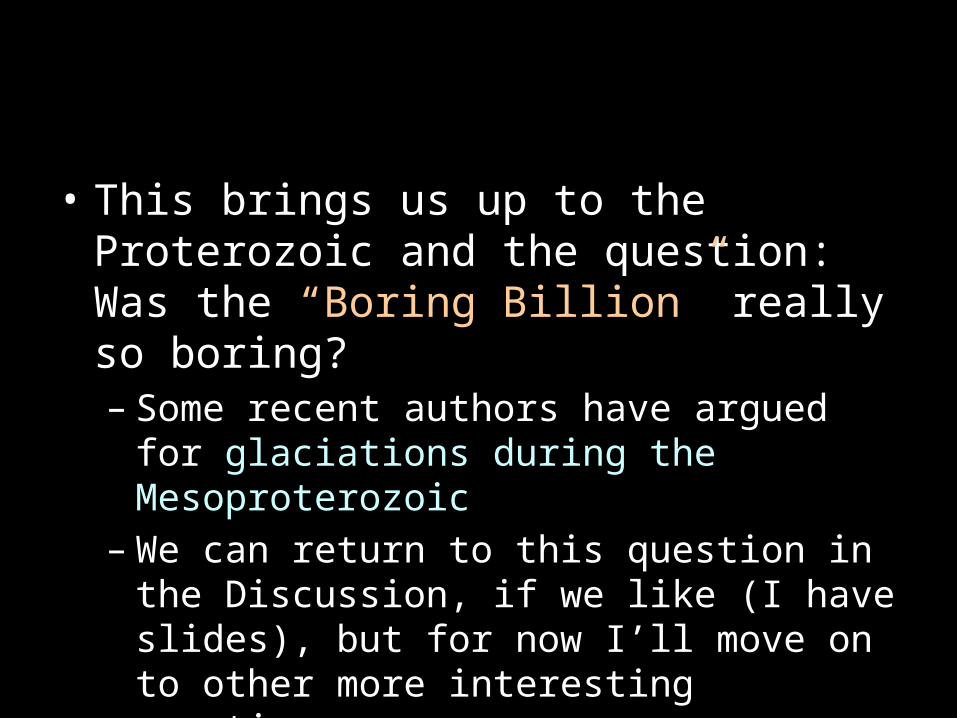
• This brings us up to the Proterozoic and the question: Was the “Boring Billion” really so boring?– Some recent authors have argued for glaciations
during the Mesoproterozoic– We can return to this question in the Discussion, if
we like (I have slides), but for now I’ll move on to other more interesting questions

• Part 2: The rise of atmospheric O2 and the enigma of low Proterozoic O2 concentrations
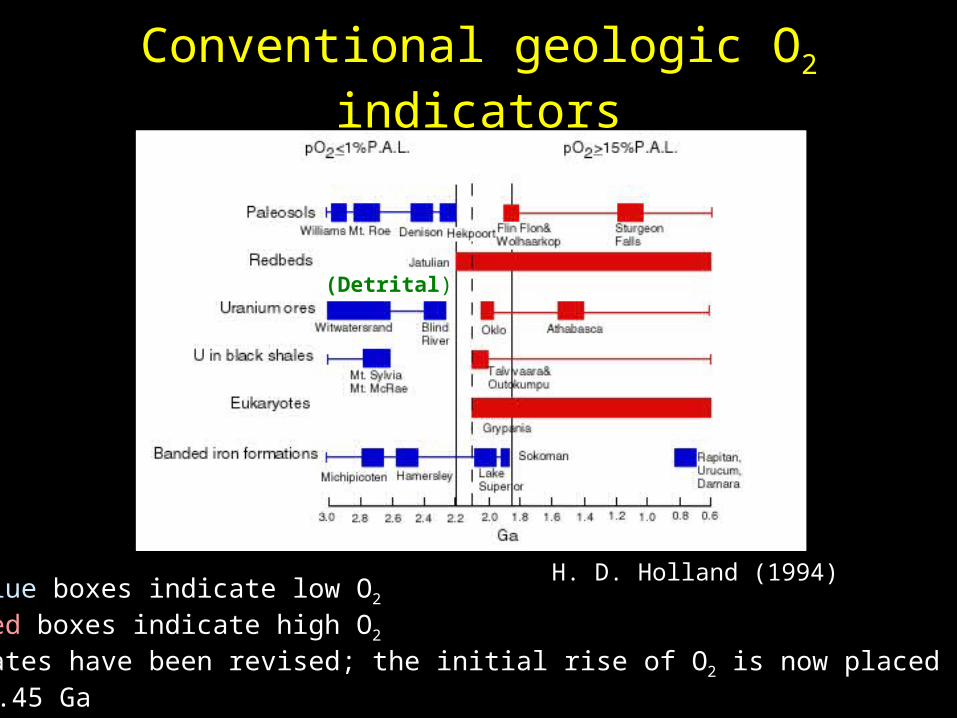
Conventional geologic O2 indicators
H. D. Holland (1994)
(Detrital)
• Blue boxes indicate low O2
• Red boxes indicate high O2
• Dates have been revised; the initial rise of O2 is now placed at 2.45 Ga

Sulfur MIF record
• The Cloud/Holland interpretation of the rise of O2 is strongly supported by the record of sulfur ‘mass-independent’ isotope fractionation, which shows that atmospheric O2 was low prior to ~2.45 Ga
• This does not preclude the possibility of ‘whiffs’ of O2 (Ariel Anbar’s term) during the Archean, for which there is geochemical evidence
Reinhard et al., Nature (2013)(Technique pioneered by Farquharet al., Science, 2000)
Cr isotopes and pO2
• Cr has two accessible oxidation states, Cr+3 and Cr+6. As with U, the oxidized state is soluble, while the reduced state is insoluble
• 53Cr is enriched in the +6 state relative to 52Cr when Cr is oxidized
• If O2 is present during weathering, then 53Cr is preferentially removed from soils and deposited in sediments, such as banded iron-formations

A ‘whiff’ of O2 at 3.0 Ga• Crowe et al. (Nature,
2013) argued for small amounts of atmospheric O2 (310-4 PAL) at 3.0 Ga
• The analysis is based on 53Cr depletion in the Nsuze paleosol (top panel) and enrichment of 53Cr and U in the contemporaneous Ijzermyn iron formation (bottom panel)
• Blue bar is the range of mantle values
• This suggests that O2 was being produced by cyanobacteria at 3.0 Ga
Paleosol
Iron formation
53Cr

• Question: If O2 was being produced at 3.0 Ga, why did it not rise to significant levels until about 2.45 Ga?
– I won’t talk about this, but we can return to this question in the discussion

The conventional view of the rise of atmospheric O2
• A widely copied chart for the history of atmospheric O2 is that created by Lee Kump in 2008
• The Archean value (< 10-5 PAL) is an upper limit from sulfur MIF– Actual surface O2
concentrations were likely much smaller except in the vicinity of localized oxygen oases
L.R. Kump, Nature (2008)
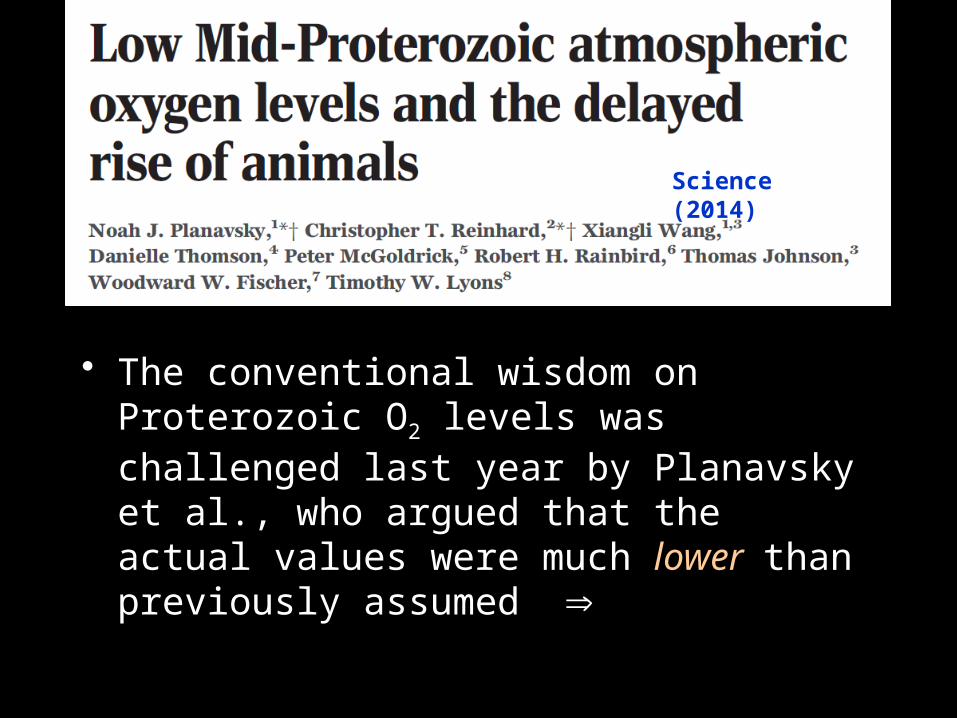
• The conventional wisdom on Proterozoic O2 levels was challenged last year by Planavsky et al., who argued that the actual values were much lower than previously assumed
Science (2014)
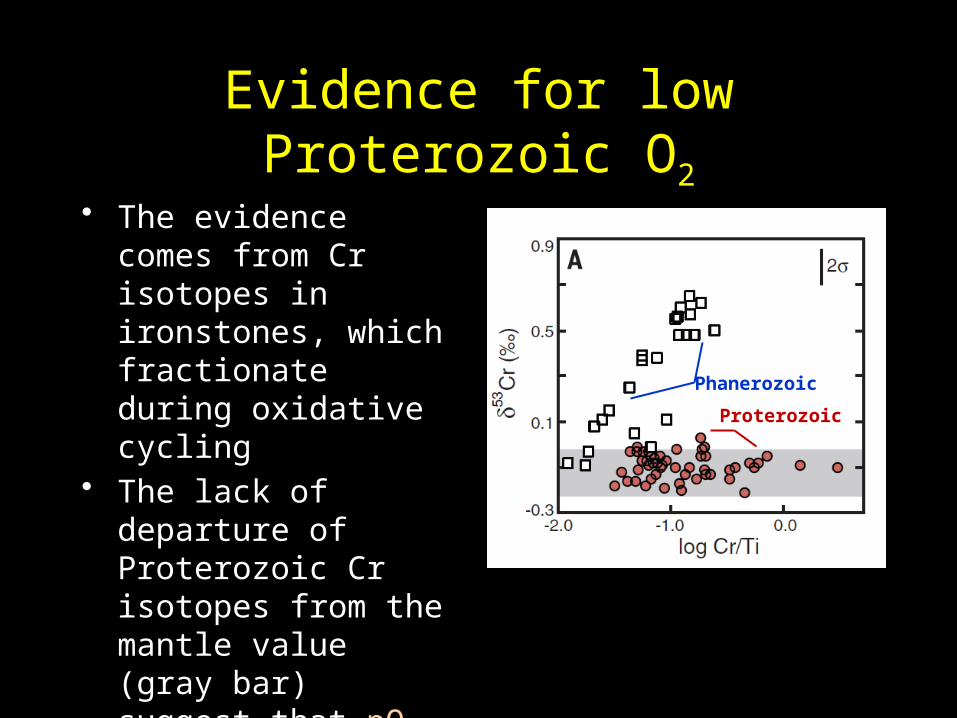
Evidence for low Proterozoic O2
• The evidence comes from Cr isotopes in ironstones, which fractionate during oxidative cycling
• The lack of departure of Proterozoic Cr isotopes from the mantle value (gray bar) suggest that pO2 was < 10-3 PAL
Phanerozoic
Proterozoic

The new view of the rise of atmospheric O2
• The new estimate for Proterozoic O2 is 100 times lower than the previous best guess
• This may have made it difficult for animals to evolve until the end of the Neoproterozoic
• It also raises questions about surface UV fluxes.. L.R. Kump, Nature (2008)
Planavsky et al.
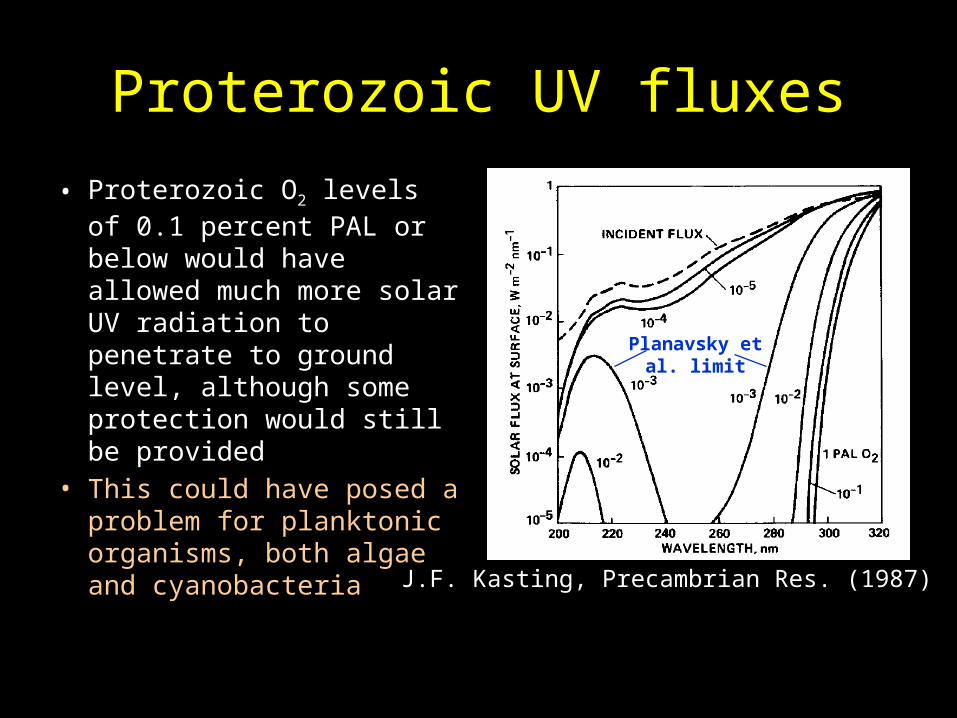
Proterozoic UV fluxes
• Proterozoic O2 levels of 0.1 percent PAL or below would have allowed much more solar UV radiation to penetrate to ground level, although some protection would still be provided
• This could have posed a problem for planktonic organisms, both algae and cyanobacteria
Planavsky etal. limit
J.F. Kasting, Precambrian Res. (1987)

Some possible questions for discussion
1. Were Proterozoic O2 concentrations really 0.1% PAL or below? If so, what was holding them down?
2. What accounts for ‘whiffs’ of O2 during the Archean?
3. Can we believe any of the Precambrian atmospheric CO2 estimates from paleosols? Are better pCO2 indicators available?
4. What do the oxygen isotope data from cherts and carbonates really tell us?Not discussed:5. Is the published evidence for mid-Proterozoic glaciation believable, or was
it truly the boring billion?6. What caused O2 to increase sharply at the beginning of the Proterozoic,
i.e., the GOE?7. What role, if any, does the seafloor play in controlling atmospheric O2 and
CO2 concentrations over long time scales?

• Backup slides…
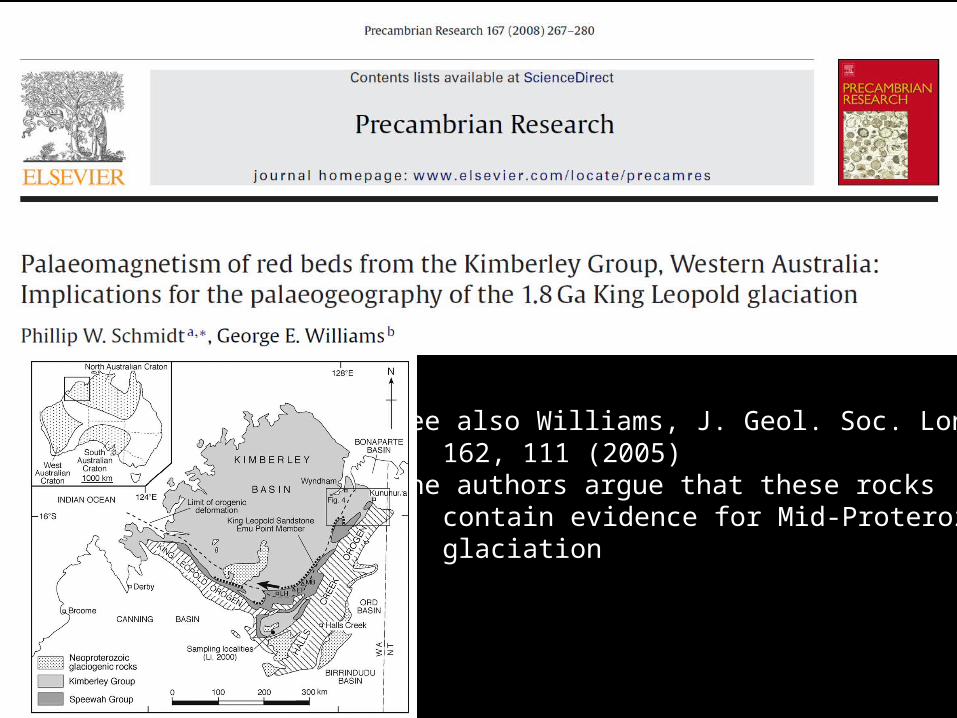
• See also Williams, J. Geol. Soc. London 162, 111 (2005)• The authors argue that these rocks contain evidence for Mid-Proterozoic glaciation
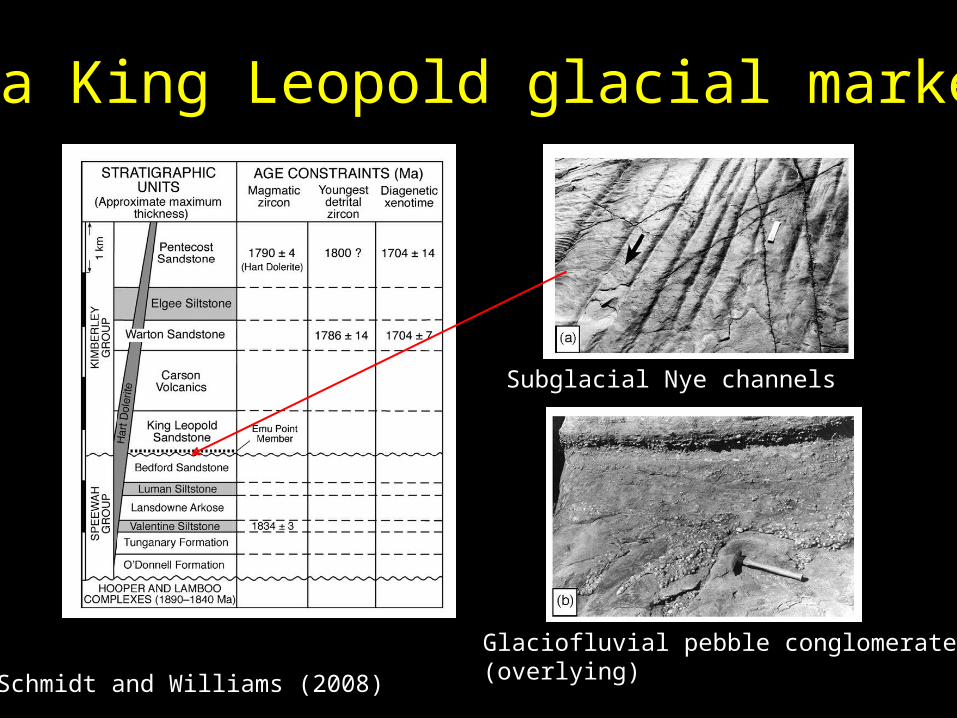
1.8-Ga King Leopold glacial markers(?)
Subglacial Nye channels
Glaciofluvial pebble conglomerate(overlying)Schmidt and Williams (2008)
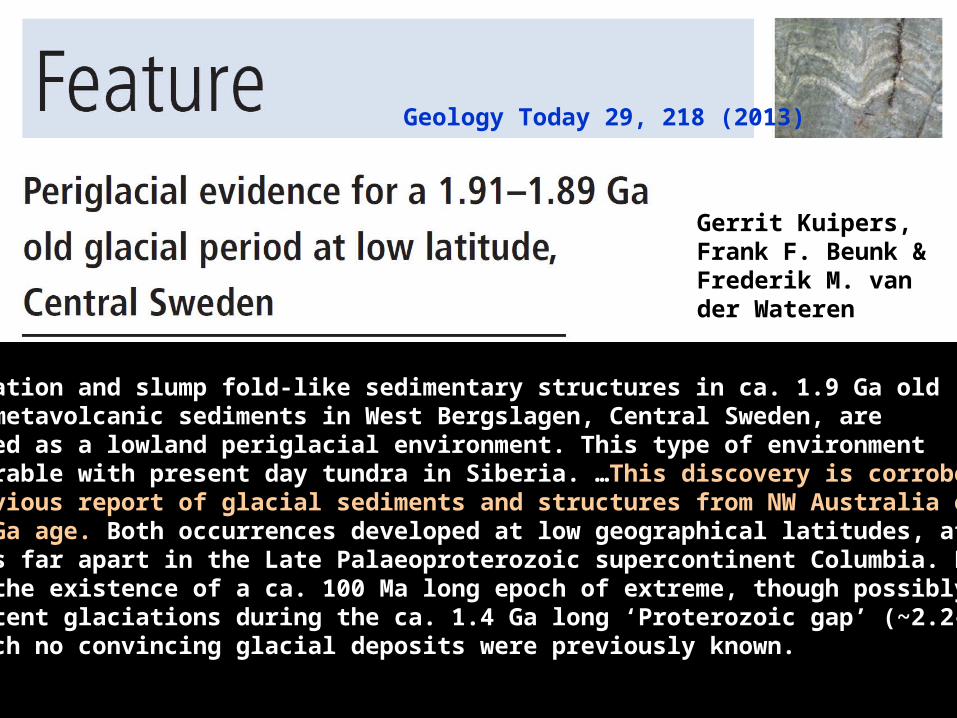
Gerrit Kuipers,Frank F. Beunk &Frederik M. vander Wateren
Cryoturbation and slump fold-like sedimentary structures in ca. 1.9 Ga olddacitic metavolcanic sediments in West Bergslagen, Central Sweden, arerecognized as a lowland periglacial environment. This type of environmentis comparable with present day tundra in Siberia. …This discovery is corroborated by a previous report of glacial sediments and structures from NW Australia of ca. 1.8 Ga age. Both occurrences developed at low geographical latitudes, at locations far apart in the Late Palaeoproterozoic supercontinent Columbia. Either suggest the existence of a ca. 100 Ma long epoch of extreme, though possibly Intermittent glaciations during the ca. 1.4 Ga long ‘Proterozoic gap’ (~2.2–0.77 Ga) From which no convincing glacial deposits were previously known.
Geology Today 29, 218 (2013)
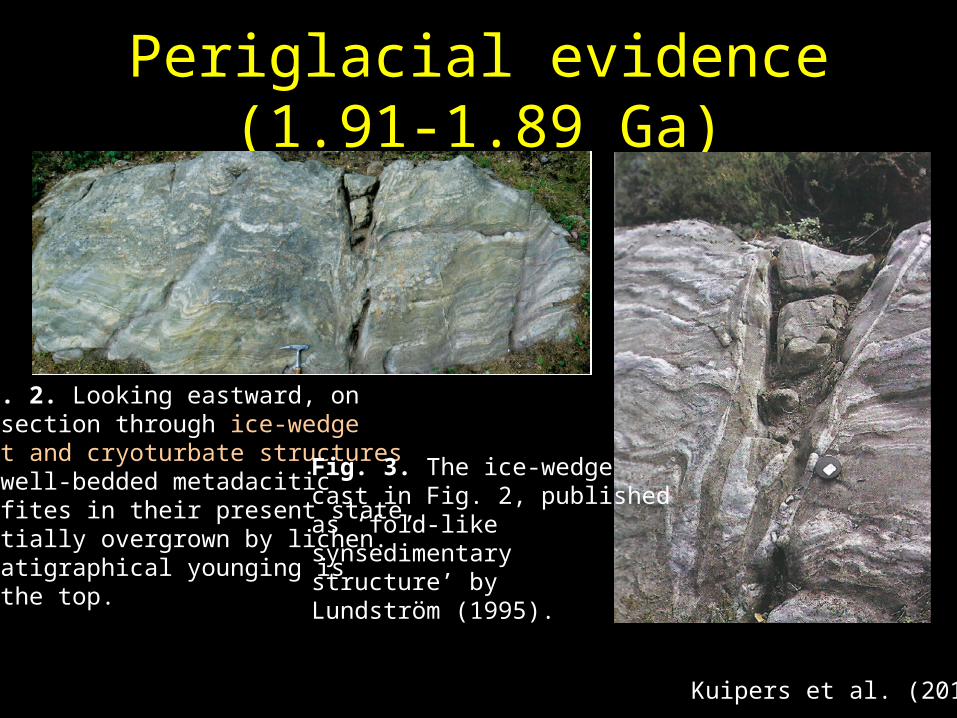
Periglacial evidence (1.91-1.89 Ga)
Fig. 2. Looking eastward, onto section through ice-wedgecast and cryoturbate structuresin well-bedded metadacitictuffites in their present state,partially overgrown by lichen.Stratigraphical younging isto the top.
Fig. 3. The ice-wedge cast in Fig. 2, publishedas ‘fold-likesynsedimentary structure’ byLundström (1995).
Kuipers et al. (2013)
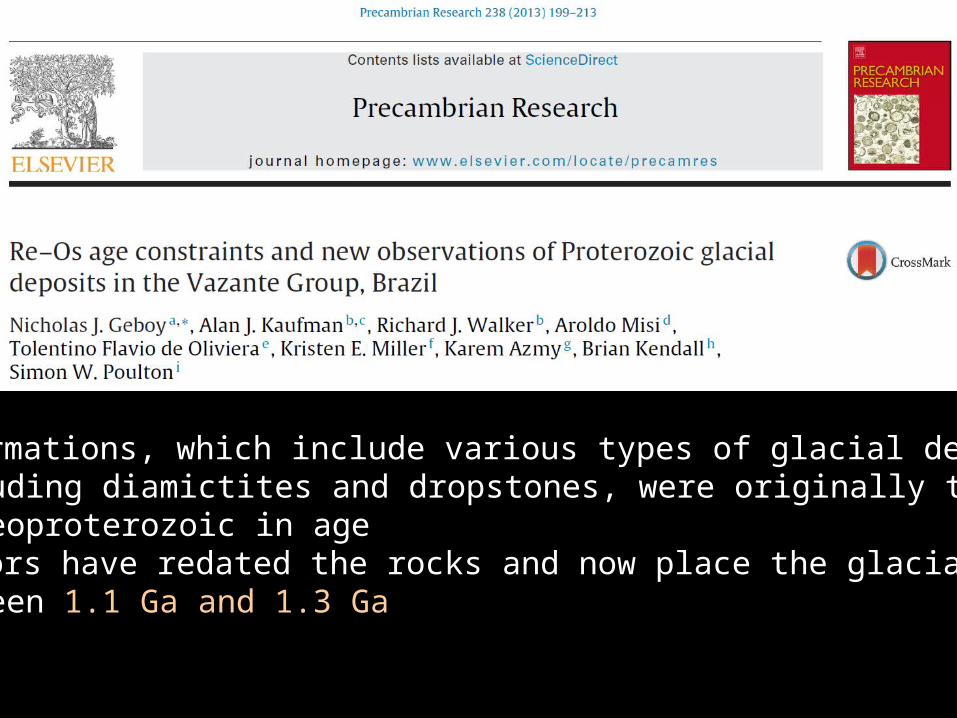
• These formations, which include various types of glacial deposits, including diamictites and dropstones, were originally thought to be Neoproterozoic in age• The authors have redated the rocks and now place the glaciation between 1.1 Ga and 1.3 Ga

Late Mesoproterozoic Glaciation (?)(1.1-1.3 Ga)
Geboy et al., Precambrian Res. (2013)
1.1 Ga
1.3 Ga
VazanteGroup


