80
Report No. 66301-TR Sustaining High Growth: The Role of Domestic Savings Turkey Country Economic Memorandum Synthesis Report CONFERENCE EDITION
Report No. 66301-TR
Sustaining High Growth: The Role of Domestic SavingsTurkey Country Economic Memorandum
Synthesis Report
CONFERENCE EDITION
CURRENCY AND EQUIVALENTS UNITS Currency Equivalents
(Exchange Rate Effective December 23, 2011)Currency Unit: Turkish Lira (TL)
USD 1 = 1.8809 TLGovernment Fiscal YearJanuary 1 - December 31Weights and Measures
Metric System
ABBREVIATIONS AND ACRONYMS
ARDL Autoregressive Distributed Lag ISE Istanbul Stock Exchange
BIS Bank for International Settlements IPO Initial Public Offering
BRSA Banking Regulation and Supervision Agency IRA Individual Retirement Account
CAD Current Account Deficit £ British Pound
CBRT Central Bank of the Republic of Turkey LAC Latin America and the Caribbean
CEM Country Economic Memorandum MENA Middle East and North Africa
CMB Capital Markets Board NBFI Nan-Bank Financial Institutions
CPF Central Provident Fund NPS National Pension Services
CTF Child Trist Fund OECD Organization for Economic Cooperation and Devel-opment
ÇTTH Account to Encourage Employee Savings PF Publicly Managed Fund
DB Defined-Benefit Schemes R&D Research and Development
DC Fully-Funded Schemes RMF Retirement Mutual Fund
ECA Europe and Central Asia SCF Survey of Consumer Finances
EPF Employee Provident Fund SG Saving Gateway
ETF Exchange Traded Funds SME Small and Medium Enterprises
EU European Union SOE State-Owned Enterprises
FX Foreign Exchange SSA Sub-Saharan Africa
GDI Gross Domestic Income TFP Total Factor Productivity
GDP Gross Domestic Product TL Turkish Lira
GIC Government Investment Corporation TPSA Tax-Preferred Saving Accounts
GMM Generalized Method of Moments TUBI-TAK
The Scientific and Technological Research Council of Turkey
GNDI Gross National Disposable Income TURK-STAT Turkish Statistics Agency
GPDI Gross Private Disposable Income UK United Kingdom
HBS Household Budget Survey US United States
KOSGEB Small and Medium Enterprises Development Organization VAR Vector Auto-Regression
KRW South Korean Won
Vice President: Philippe H. Le HouérouCountry Director: Martin RaiserSector Director: Yvonne Tsikata
Sector Manager: Satu KahkonenTask Team Leader: Kamer Karakurum Özdemir
TABLE OF CONTENTS
Executive Summary ...................................................................................................................................................................i
1. Introduction ........................................................................................................................................................................... 1
2. Saving Trends in Turkey in International Comparison ............................................................................................ 3
2.1 Total, Public and Private Saving ........................................................................................................................ 3
2.2 Household Saving ................................................................................................................................................. 6
2.3 Corporate Saving ................................................................................................................................................... 9
3. Why Does Domestic Savings Matter for Turkey? ...................................................................................................11
3.1 The Implications of Low Savings on Growth .............................................................................................11
3.2 Evidence on the Investment-Saving Relationship in an Open Economy:
International Perspective ..................................................................................................................................14
3.3 Attaining Sustainable High Growth: A Growth Accounting Perspective ........................................15
4. Determinants of Saving in Turkey ................................................................................................................................18
4.1 Private and Public Saving .................................................................................................................................18
4.2 Household Saving ...............................................................................................................................................23
4.3 Corporate Saving .................................................................................................................................................35
5. The Role of Financial Markets in Intermediating Savings in Turkey ................................................................40
5.1 Overview of Financial Markets ........................................................................................................................40
5.2 The Private Pension Scheme ...........................................................................................................................45
6. Policy Options .....................................................................................................................................................................47
Bibliography .............................................................................................................................................................................52
Annex I. Financial Market Development and Mandatory Saving Schemes: Country Experiences ...........61
LIST OF TABLES
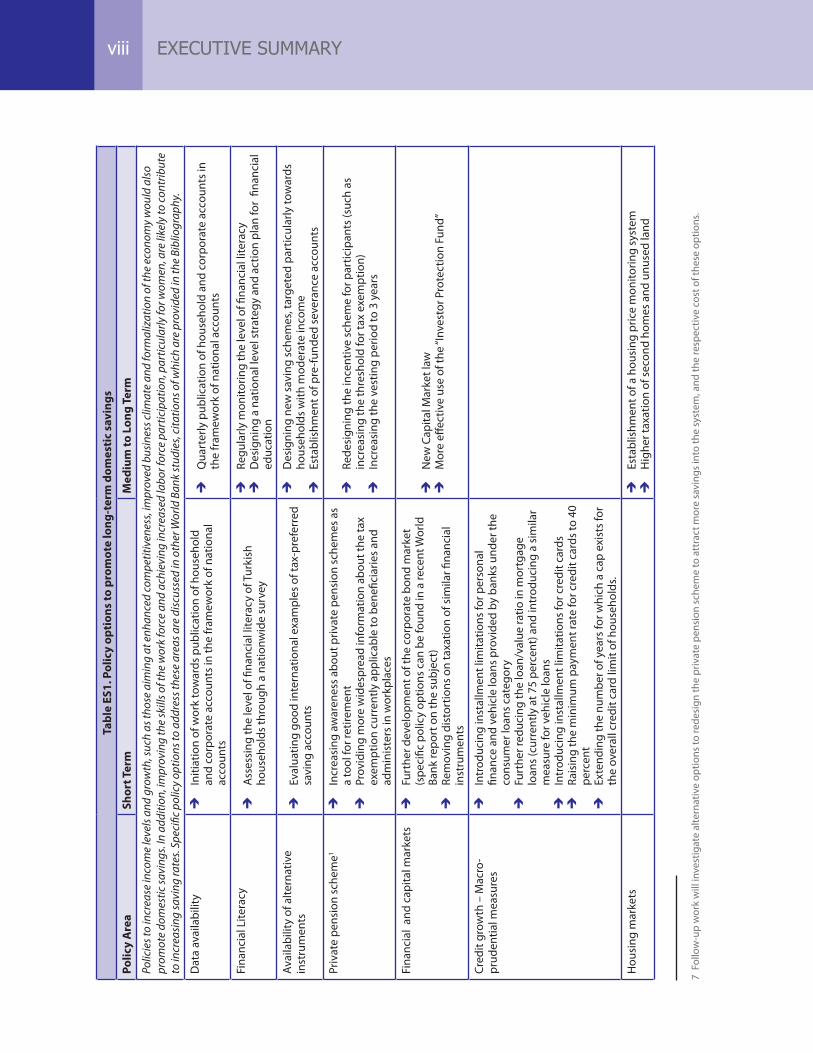
Table ES1. Policy Options to Promote Long-term Domestic Savings .............................................................viii
Table 1. Simulations of Savings and Growth Rates, Various Scenarios .......................................................16
Table 2. Household Financial Assets in Turkey: Percent of GDP and Decomposition ...........................30
Table 3. Turkey: Returns on Financial Instruments (2005–2010) (Percent) ...............................................32
Table 4. The Turkish Banking System: Key Indicators .......................................................................................41
Table 5. Operating Costs (Percent of Assets Managed) ...................................................................................46
Table A1. International Comparison: Saving, Financial Market Development, Growth, Pensions ......61
Table A2. Korea-Investor Base (KW billions) ............................................................................................................64
LIST OF FIGURES
Figure ES1. Total, Private and Public Saving Rates (%) ................................................................................................i
Figure ES2. Policies Promoting Household Saving .................................................................................................... iv
Figure 1. Domestic Saving in Turkey, 1975–2010 ................................................................................................... 3
Figure 2. Private and Public Saving in Turkey, 1988–2010 (%) .......................................................................... 3
Figure 3. Saving Rates by Region ................................................................................................................................. 5
Figure 4. Saving Rates by Income Group .................................................................................................................. 5
Figure 5. Saving Rates by Transition, Takeoff Countries ....................................................................................... 5
Figure 6a. Mean Saving Rates .......................................................................................................................................... 6
Figure 6b. Median Saving Rates ...................................................................................................................................... 6
Figure 7. Consumption of Durable Goods and Private Saving (%) .................................................................. 7
Figure 8. Saving Rate by Income .................................................................................................................................. 8
Figure 9. Saving Rate by Age ......................................................................................................................................... 8
Figure 10a. Saving Rates by Level of Education, 2007 .............................................................................................. 8
Figure 10b. Saving Rates by Level of Education, 2003 - 2008 ................................................................................. 8
Figure 11. Income Statement of a Typical Non-Financial Firm ............................................................................ 9
Figure 12. Net Profits and Saving Rates of Turkish Firms, 1996–2008 .............................................................10
Figure 13. Mean and Median Saving Rates of Firms Selected Countries (2003–2009) .............................10
Figure 14. Saving-Investment Gap as Percent of GDI............................................................................................11
Figure 15. Potential Transmission Channels from Savings to Growth .............................................................12
Figure 16. Average Growth Rates of Developing Countries by CAD-GDP and
Investment-GDP Ratios, 2000-2008 ........................................................................................................13
Figure 17. Saving and Investment Rates ....................................................................................................................14
Figure 18. Investment-Saving Association ................................................................................................................15
Figure 19. Public Saving (Percent of GDP) .................................................................................................................21
Figure 20. Employment Rates in 2009 Across Countries (%) ..............................................................................25
Figure 21. Composition of Turkish Household Financial Assets, 2010 ............................................................31
Figure 22. Bank Loans to Corporate Sector (Percent of GDP).............................................................................35
Figure 23. Investment, Saving and Cash Flows Rates (%) ....................................................................................36
Figure 24. Financial Markets – International Comparison (Percent of GDP, 2009) ......................................40
Figure 25. Financial Markets in Turkey, 2002–2010 ................................................................................................40
Figure 26. IPOs in Turkey, 2004–2010..........................................................................................................................42
Figure 27. World Bond Markets as Percent of GDP (2009) ...................................................................................43
Figure 28. Pension Funds as Percent of GDP (2009) ..............................................................................................45
Figure A1. Malaysia Investor Base (RM Billion) .........................................................................................................62
Figure A2. Thai Investor Base (Billion Bahts) .............................................................................................................64
LIST OF BOXES
Box 1. Data on Savings in Turkey ............................................................................................................................ 4
Box 2. The Relationship between the Public Sector Overall Balance and Public Saving ..................20
Box 3. The Survey of Consumer Finances ..........................................................................................................28
Box 4. The Account to Encourage Employee Savings (ÇTTH) ....................................................................33
Box 5. Taxation of Retained Earnings in Chile ..................................................................................................38
ACKNOWLEDGEMENTS
The Country Economic Memorandum on Domestic Savings was undertaken jointly by the Ministry of Development and the World Bank. The World Bank team included Kamer Karakurum Özdemir (co-TTL, ECSP2 and the main author of this synthesis report), Cihan Yalçın (co-TTL, Central Bank), Muammer Kömürcüoğlu, Constantino Hevia (DECRG) and Pınar Baydar (ECCU6). The Ministry of Development team consisted of Erhan Usta, Ahmet Çelenkoğlu, Salih Köse, Dr. Ahmet Sabri Eroğlu, Kağan Saygılı, Eser Pirgan Matur, Ali Sabuncu, Sema Bahçeci, Aşkın Türeli, Ertan Apaydın, Sefa Çavdaroğlu, Çağatay Telli, Fatih Kaya, Ahmet Yılmaz, Seda Yurtsever, Hakan Erten, Kutluhan Taşkın, Yusuf Ziya Türk and Murat Keleş. The team also benefited from significant contributions by officials from the Undersecretariat of Treasury, Capital Markets Board and consultations with various private sector agencies.
The background papers were prepared by Ercan Uygur (Turkish Economic Association), Gökçe Uysal Kolaşin, Arda Aktaş, Duygu Güner, Seyfettin Gürsel (all at Bahçeşehir University), Tansel Yılmazer (University of Missouri), Ismail Dalla (George Washington University), Erdal Özmen (METU), Cihan Yalçın (Central Bank), Saygın Şahinöz (Central Bank), Eser Pirgan Matur, Ali Sabuncu, Sema Bahçeci (all at the Ministry of Development). SAM Research and Consulting conducted focus group discussions with households.
Valuable contributions were made by Bernard Funck (MNSPR), Mark Roland Thomas (AFTP4), Selin Sayek (Bilkent University), Eduardo Ley (PRMED), Marina Wes (ECSP2), Inessa Love (DECFP) and Klaus Schmidt-Hebbel (Catholic University of Chile).
Overall guidance was provided by Yvonne Tsikata (ECSPE), Satu Kahkonen (ECSP2) and Ulrich Zachau (EAPVP). Peer reviewers were Rauf Gönenç (OECD), Hasan Ersel (Sabancı University) and Zafer Mustafaoğlu (LCSPR). Homi Kharas (Brookings Institution) provided peer review comments at the early preparation stage of the study.
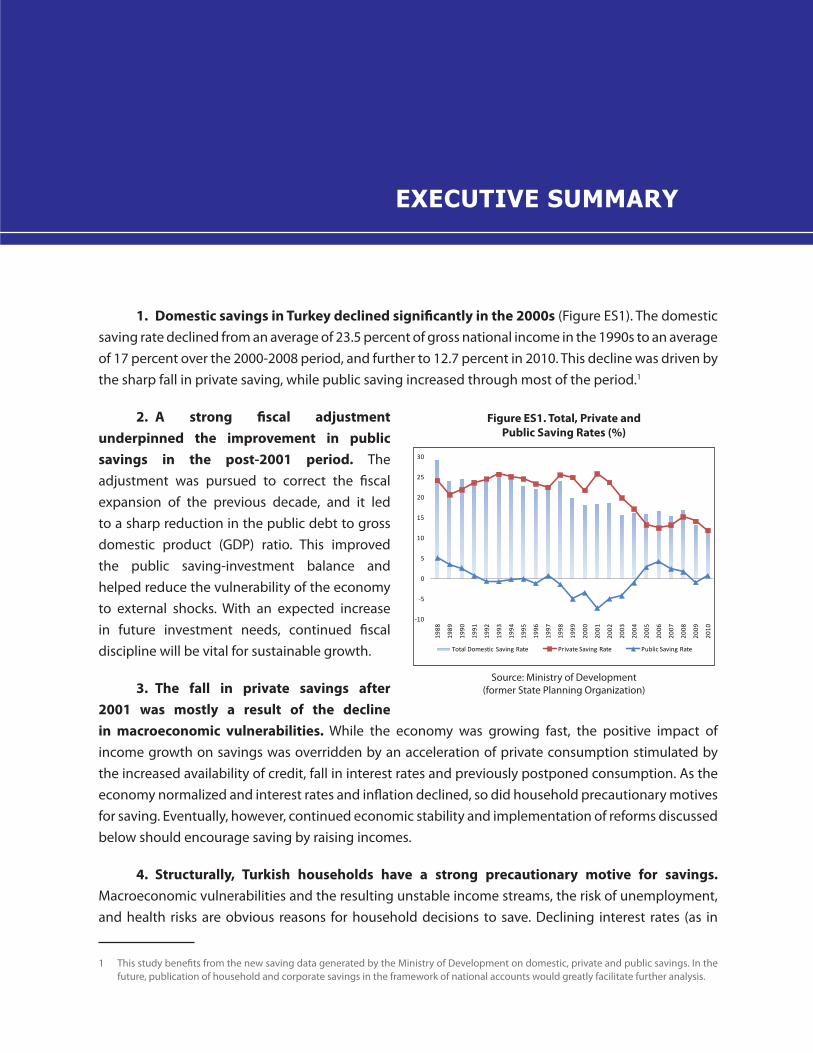
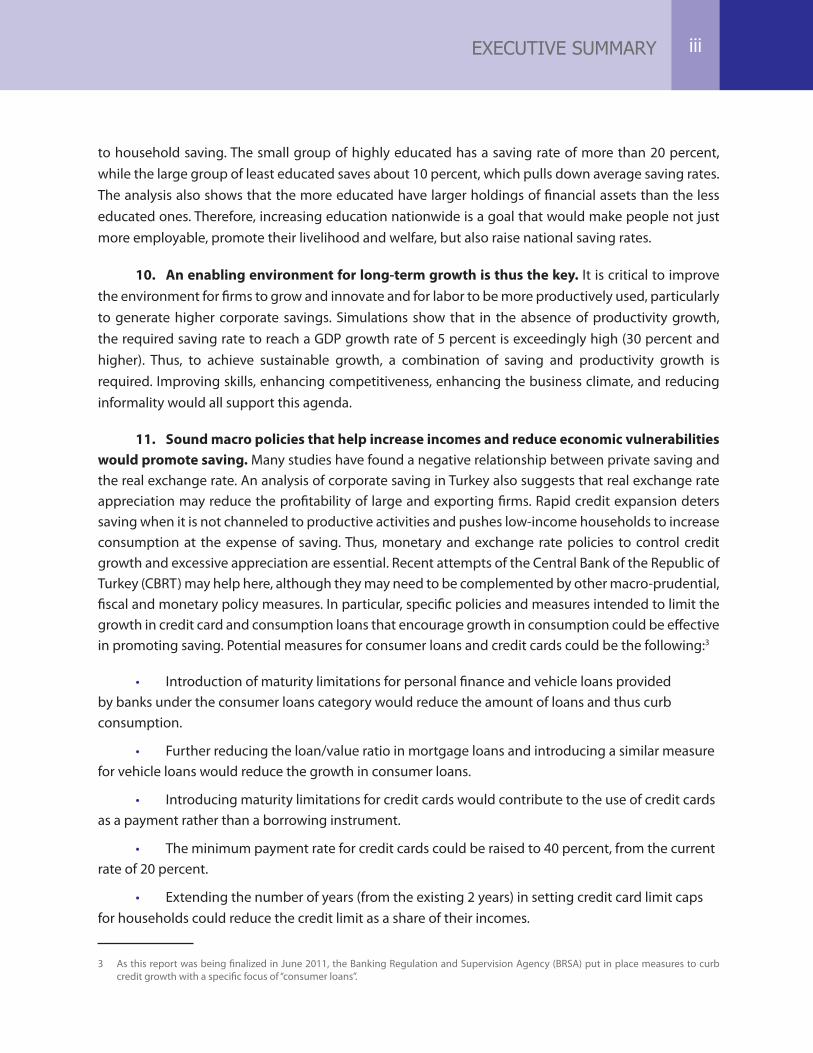
1. Domestic savings in Turkey declined significantly in the 2000s (Figure ES1). The domestic saving rate declined from an average of 23.5 percent of gross national income in the 1990s to an average of 17 percent over the 2000-2008 period, and further to 12.7 percent in 2010. This decline was driven by the sharp fall in private saving, while public saving increased through most of the period.1
2. A strong fiscal adjustment underpinned the improvement in public savings in the post-2001 period. The adjustment was pursued to correct the fiscal expansion of the previous decade, and it led to a sharp reduction in the public debt to gross domestic product (GDP) ratio. This improved the public saving-investment balance and helped reduce the vulnerability of the economy to external shocks. With an expected increase in future investment needs, continued fiscal discipline will be vital for sustainable growth.
3. The fall in private savings after 2001 was mostly a result of the decline in macroeconomic vulnerabilities. While the economy was growing fast, the positive impact of income growth on savings was overridden by an acceleration of private consumption stimulated by the increased availability of credit, fall in interest rates and previously postponed consumption. As the economy normalized and interest rates and inflation declined, so did household precautionary motives for saving. Eventually, however, continued economic stability and implementation of reforms discussed below should encourage saving by raising incomes.
4. Structurally, Turkish households have a strong precautionary motive for savings. Macroeconomic vulnerabilities and the resulting unstable income streams, the risk of unemployment, and health risks are obvious reasons for household decisions to save. Declining interest rates (as in
1 This study benefits from the new saving data generated by the Ministry of Development on domestic, private and public savings. In the future, publication of household and corporate savings in the framework of national accounts would greatly facilitate further analysis.
Figure ES1. Total, Private and Public Saving Rates (%)
-10
-5
0
5
10
15
20
25
30
1988
1989
1990
1991
1992
1993
1994
1995
1996
1997
1998
1999
2000
2001
2002
2003
2004
2005
2006
2007
2008
2009
2010
Total Domestic Saving Rate Private Saving Rate Public Saving Rate
Source: Ministry of Development (former State Planning Organization)
EXECUTIVE SUMMARY
the 2000s) that reflected reduced risk premium and hence vulnerability reduced precautionary savings motives. Households where the head is an employer or self-employed rather than a wage earner tend to save more, while households where there is a green card holder (a non-contributory health program) save less, controlling for the income effect.
5. Households with a high young dependency ratio have low saving rates. A high young dependency ratio (the ratio of the number of 0-14 year old children to the number of working members of the household) leads to decreased savings, as families with more children have a greater need for current consumption. At the same time households are either unable to plan their savings or do not fully realize the need to plan for future expenses.
6. The low level of female labor force participation also contributes to low household and private saving rates. Given low employment rates in Turkey, the dependency ratio among the working age population is high compared to OECD countries, mainly due to the low female labor force participation rate. Households in which more women work tend to save beyond the additional income effect. This suggests that increasing female labor force participation from the 2010 rate of about 28 percent may help increase the savings rates.2
7. Considerable amount of savings are kept “under the mattress”, mostly in the form of gold. Informal instruments of saving include gold, cash and foreign currency, as well as loans to family/friends and businesses. The micro level data shows that about 30 percent of households have bought gold, jewelry or watches in the past year. Participants of focus groups also declared to have a significant amount of saving, mostly in the form of gold, “under the mattress”, which does not enter the banking system. Policies to stimulate saving or to attract saving into the financial sector need to take this into consideration.
8. Low domestic saving adversely affects Turkey’s growth prospects. First, domestic saving finances investment and thus growth. Cross-country data - especially for developing countries - suggest a positive association between saving, investment, and growth. Second, low domestic saving increases dependence on foreign financing, fueling a rise in the external current account deficit and jeopardizing the sustainability of growth. With domestic saving low, Turkish investments have increasingly been financed by foreign capital, which has raised concerns about external sustainability as the current account deficit has widened. Dependence on foreign savings has exposed Turkey to the risk of capital reversal, with its attendant adverse impact on economic growth. As a result, increasing domestic saving is critical for promoting sustainability of growth in Turkey.
9. The level of a country’s development (primarily its income and education levels) may be one of the most important determinants of its domestic saving rates. The household income level is the main factor that influences saving. Education levels are, not surprisingly, also closely related
2 World Bank Female Labor Force Participation in Turkey: Trends, Determinants and Policy Framework (2010).
EXECUTIVE SUMMARYii
to household saving. The small group of highly educated has a saving rate of more than 20 percent, while the large group of least educated saves about 10 percent, which pulls down average saving rates. The analysis also shows that the more educated have larger holdings of financial assets than the less educated ones. Therefore, increasing education nationwide is a goal that would make people not just more employable, promote their livelihood and welfare, but also raise national saving rates.
10. An enabling environment for long-term growth is thus the key. It is critical to improve the environment for firms to grow and innovate and for labor to be more productively used, particularly to generate higher corporate savings. Simulations show that in the absence of productivity growth, the required saving rate to reach a GDP growth rate of 5 percent is exceedingly high (30 percent and higher). Thus, to achieve sustainable growth, a combination of saving and productivity growth is required. Improving skills, enhancing competitiveness, enhancing the business climate, and reducing informality would all support this agenda.
11. Sound macro policies that help increase incomes and reduce economic vulnerabilities would promote saving. Many studies have found a negative relationship between private saving and the real exchange rate. An analysis of corporate saving in Turkey also suggests that real exchange rate appreciation may reduce the profitability of large and exporting firms. Rapid credit expansion deters saving when it is not channeled to productive activities and pushes low-income households to increase consumption at the expense of saving. Thus, monetary and exchange rate policies to control credit growth and excessive appreciation are essential. Recent attempts of the Central Bank of the Republic of Turkey (CBRT) may help here, although they may need to be complemented by other macro-prudential, fiscal and monetary policy measures. In particular, specific policies and measures intended to limit the growth in credit card and consumption loans that encourage growth in consumption could be effective in promoting saving. Potential measures for consumer loans and credit cards could be the following:3
• Introduction of maturity limitations for personal finance and vehicle loans provided by banks under the consumer loans category would reduce the amount of loans and thus curb consumption.
• Further reducing the loan/value ratio in mortgage loans and introducing a similar measure for vehicle loans would reduce the growth in consumer loans.
• Introducing maturity limitations for credit cards would contribute to the use of credit cards as a payment rather than a borrowing instrument.
• The minimum payment rate for credit cards could be raised to 40 percent, from the current rate of 20 percent.
• Extending the number of years (from the existing 2 years) in setting credit card limit caps for households could reduce the credit limit as a share of their incomes.
3 As this report was being finalized in June 2011, the Banking Regulation and Supervision Agency (BRSA) put in place measures to curb credit growth with a specific focus of “consumer loans”.
EXECUTIVE SUMMARY iii
12. However, savings do not automatically generate investment—channeling increased savings to productive investments is crucial. In this context, the mix of gross capital formation in terms of construction, machinery and equipment is important. In Turkey, perceptions of housing as an investment instrument is dominant and this may not be growth-enhancing. In this regard, policies to change such perceptions could be pursued, including increased taxation of second houses and unused land, as well as development of a system for monitoring housing prices. Future work could analyze specifics of such policy options.
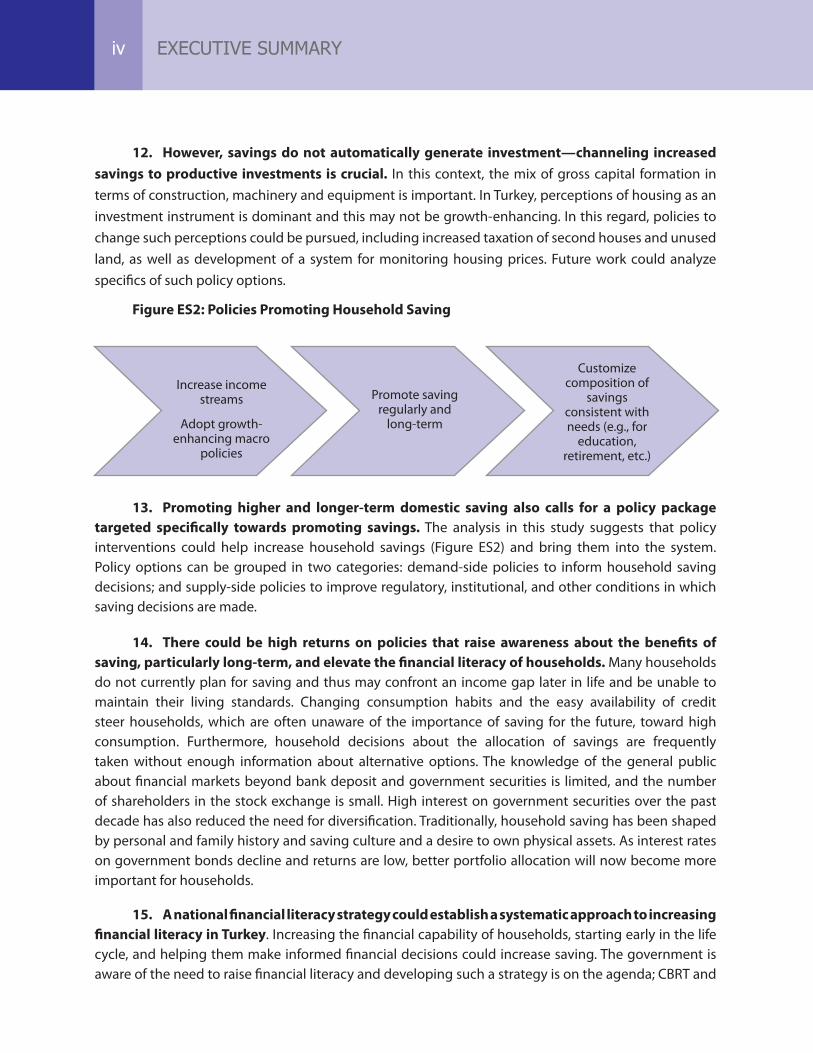
Figure ES2: Policies Promoting Household Saving
13. Promoting higher and longer-term domestic saving also calls for a policy package targeted specifically towards promoting savings. The analysis in this study suggests that policy interventions could help increase household savings (Figure ES2) and bring them into the system. Policy options can be grouped in two categories: demand-side policies to inform household saving decisions; and supply-side policies to improve regulatory, institutional, and other conditions in which saving decisions are made.
14. There could be high returns on policies that raise awareness about the benefits of saving, particularly long-term, and elevate the financial literacy of households. Many households do not currently plan for saving and thus may confront an income gap later in life and be unable to maintain their living standards. Changing consumption habits and the easy availability of credit steer households, which are often unaware of the importance of saving for the future, toward high consumption. Furthermore, household decisions about the allocation of savings are frequently taken without enough information about alternative options. The knowledge of the general public about financial markets beyond bank deposit and government securities is limited, and the number of shareholders in the stock exchange is small. High interest on government securities over the past decade has also reduced the need for diversification. Traditionally, household saving has been shaped by personal and family history and saving culture and a desire to own physical assets. As interest rates on government bonds decline and returns are low, better portfolio allocation will now become more important for households.
15. A national financial literacy strategy could establish a systematic approach to increasing financial literacy in Turkey. Increasing the financial capability of households, starting early in the life cycle, and helping them make informed financial decisions could increase saving. The government is aware of the need to raise financial literacy and developing such a strategy is on the agenda; CBRT and
iv EXECUTIVE SUMMARY
the Capital Markets Board (CMB) of Turkey sponsored a high-profile conference on the subject in March 2011. Implemented effectively, a national financial literacy strategy is likely to promote financial literacy nationwide and have a significant impact on the decisions of Turkish citizens to save.4 Such a strategy would be most successful if it is effectively managed and supported by dedicated contributions from all stakeholders. In the short term, promoting financial literacy among the 2.3 million private pension members already in the system and potential members could attract additional funds into that currently small system. This would be most effective if designed based on contributions from stakeholders. One policy option would be to provide information about the tax exemption for contributions to the private pension system to both beneficiaries and administrators in workplaces.
16. On the supply side, the intermediation role of financial markets is central. Policy options to enhance intermediation can be divided into three groups: (i) better use of existing products (such as private pensions and corporate bonds), including, but not limited to, taxation of different instruments; (ii) more investment in new products and better regulatory framework; and (iii) special saving schemes.
17. The private pension schemes recently introduced in Turkey have the potential to expand significantly. Besides raising the awareness of households about planning for retirement, making the private pension scheme attractive could help the sector grow and generate long-term savings. One option would be to increase the threshold for exemption from the current 10 percent of monthly salary, which is capped at the annual gross minimum wage. The fiscal cost of the increased exemption would likely be more than offset by the reduction in the interest on public debt and wider tax base due to the increase in long term funds. Any policy intervention of this kind needs to be designed with participation from interested public and private agencies to maximize mobilization of new savings into the private pension system. In addition to increasing tax incentives, the government might also consider increasing the vesting period to at least 3 years with no withdrawal permitted except for medical emergencies. Another policy option is to introduce direct government contributions. Clearly, there are pros and cons of different incentive schemes. The follow-up work will focus on alternative options to redesign the private pension scheme to attract more savings into the system, and the respective cost of these options.
18. Efforts to promote saving will be most effective if complemented by reforms to reinforce the financial markets. Empirical evidence suggests that the degree of financial development is important in channeling savings to growth-enhancing activities. Although Turkey’s financial markets have been growing rapidly since 2003, the system is heavily dominated by banking. Turkey would benefit from more diversified financial markets; further developing the corporate bond market might be one policy option.5 Malaysia and Thailand both have highly developed financial markets and high saving rates; their experiences may be relevant for Turkey.
19. A new comprehensive capital market law can be expected to help deepen financial markets. Turkey’s Capital Market Law has proved useful in providing a general framework for regulating
4 The World Bank Team has secured a grant to finance a nationwide financial literacy survey, to be implemented in cooperation with CBRT and CMB of Turkey. The survey will provide valuable information for the preparation of a national strategy, now in its early stages.
5 Policy options for development of the corporate bond market can be found in the forthcoming World Bank study “Corporate Bond Market Development – Priorities and Challenges.”
vEXECUTIVE SUMMARY
domestic capital markets, but the rapid developments in domestic and international financial markets demand a thorough review to bring the law up to international standards. A comprehensive new capital market law is also relevant for European Union (EU) convergence and the Istanbul International Financial Center Project. Such a law could reduce the need for rule-making through communiqués. Arrangements to protect investors in capital markets would also contribute to raising the confidence of households in capital market instruments and increasing the number of investors. In this regard, more effective use of the existing “Investor Protection Fund” may be considered.
20. The government might also consider removing financial market distortions created by taxation. Treating all financial instruments equally regardless of investor will create a level playing field that will enable financial markets to grow and become more robust. Equalizing the tax burden on similar instruments could also help achieve more balanced financial market development. For instance:
• MutualFunds. Investments in mutual funds are currently subject to 10 percent withholding tax, but investments in individual stocks are exempt. This creates a disincentive for individual investors who are not equipped to invest in shares directly through stockbrokers.
• ExchangeTradedFunds(ETFs). There is a withholding tax on ETFs, though trading in individual stocks is tax-exempt.
• BankDeposits. Bank deposits are subject to 15 percent withholding tax; for investments in government securities the tax is 10 percent.
The estimated tax loss from removing the 10 percent withholding tax on mutual funds with more than 50 percent equity content is about TL 25 million, based on an assumption of 20 percent return. A more detailed analysis of the potential fiscal impact of the above policy options is warranted, although benefits from increased mobilization of savings would likely outweigh foregone tax revenues.
21. Special saving schemes, based on good examples from other countries, could help attract new savings into the system. While Turkey had an unfavorable experience with a mandatory saving scheme, well-designed and effectively administered new schemes, mandatory or voluntary, could bring household savings into the financial system. Turkey’s significantly improved financial system and stable macroeconomic environment provide an improved environment for designing and implementing such schemes. Tax-preferred savings accounts, such as the Saving Gateway and the Child Trust Fund in the United Kingdom (UK) and 529 plans in the United States (US) (covering future education expenses of children), are examples of voluntary schemes. Government contributions to the savings accounts of individuals and favorable tax treatment of contributions and earnings could be considered. An OECD evaluation of the impact of tax-preferred saving accounts found that they did generate additional savings and suggests that it is important to appeal to moderate-income households, which given the opportunity are more likely to increase savings. Furthermore, since moderate-income individuals have a lower tax rate, the more they participate in comparison to high-income individuals the lower the foregone tax revenues.
vi EXECUTIVE SUMMARY
22. Establishment of a severance pay fund, which is currently on the agenda of the government, could contribute to increasing savings. The existing practice of the severance pay, which calls for a lump sum payment, is a significant obligation to employers, and a right that cannot be exercised in case of voluntary termination of employment. Reforming the severance pay involves reducing the pay (while increasing coverage of unemployment insurance) and introducing pre-funded severance accounts (to make it more efficient and ensuring workers are actually paid), as in Austria. Such a system consisting of premium contributions to individual severance accounts and where the accumulated amount in the fund is to be paid to employees when they quit work, would both address the rigidity in the labor market and promote domestic savings.
23. Finally, increasing public saving might increase domestic saving to the extent that extra savings are generated by cutting unproductive expenditures and encouraging formalization of the economy. The less than full Ricardian equivalence (public saving increases reducing private savings by less than one-to-one) in the case of Turkey suggests that there is potential for the public sector to contribute to increasing domestic saving. The quality of public spending and reform of state-owned enterprises are important here. There is evidence, especially from OECD countries, that fiscal consolidation that relies primarily on tax increases and cuts in public investment has not been sustainable because higher tax revenues sooner or later boost spending, and infrastructure maintenance and spending cannot be postponed forever. More lasting effects have come from fiscal consolidation supported by cuts in structural public spending— downsizing public employment and the wage bill and cutting back transfers. Furthermore, formalization of the economy through increased reliance on direct taxes, such as personal and corporate income taxes, could also promote saving by making tax collection more efficient and reducing tax evasion.6
24. The above policy options are summarized in the policy matrix below.
6 World Bank Turkey Country Economic Memorandum, Informality: Causes, Consequences, Policies (2010).
viiEXECUTIVE SUMMARY
Tabl
e ES
1. P
olic
y op
tion
s to
pro
mot
e lo
ng-t
erm
dom
esti
c sa
ving
s
Polic
y A
rea
Shor
t Ter
mM
ediu
m to
Lon
g Te
rm
Policiestoincreaseincomelevelsand
growth,suchasth
oseaimingatenh
ancedcompetitiveness,im
provedbusinessclim
atean
dform
alizationofth
eecon
omywou
ldalso
prom
otedo
mesticsa
ving
s.Inadd
ition
,improvingtheskillso
ftheworkforcean
dachievingincreasedlabo
rforceparticipation,particularlyforw
omen,arelikelyto
contrib
ute
toincreasing
saving
rates.Specificpo
licyop
tionsto
add
ressth
eseareasa
rediscussedinotherWorldBan
kstud
ies,citatio
nsofw
hichareprovidedinth
eBibliograp
hy.
Dat
a av
aila
bilit
y
ÎIn
itiat
ion
of w
ork
tow
ards
pub
licat
ion
of h
ouse
hold
an
d co
rpor
ate
acco
unts
in th
e fr
amew
ork
of n
atio
nal
acco
unts
Î
Qua
rter
ly p
ublic
atio
n of
hou
seho
ld a
nd c
orpo
rate
acc
ount
s in
th
e fr
amew
ork
of n
atio
nal a
ccou
nts
Fina
ncia
l Lite
racy
Î
Ass
essi
ng th
e le
vel o
f fina
ncia
l lite
racy
of T
urki
sh
hous
ehol
ds th
roug
h a
natio
nwid
e su
rvey
Î
Regu
larly
mon
itorin
g th
e le
vel o
f fina
ncia
l lite
racy
Î
Des
igni
ng a
nat
iona
l lev
el s
trat
egy
and
actio
n pl
an fo
r fin
anci
al
educ
atio
n
Avai
labi
lity
of a
ltern
ativ
e in
stru
men
ts
ÎEv
alua
ting
good
inte
rnat
iona
l exa
mpl
es o
f tax
-pre
ferr
ed
savi
ng a
ccou
nts
Î
Des
igni
ng n
ew s
avin
g sc
hem
es, t
arge
ted
part
icul
arly
tow
ards
ho
useh
olds
with
mod
erat
e in
com
e
ÎEs
tabl
ishm
ent o
f pre
-fund
ed s
ever
ance
acc
ount
s
Priv
ate
pens
ion
sche
me1
Î
Incr
easi
ng a
war
enes
s ab
out p
rivat
e pe
nsio
n sc
hem
es a
s a
tool
for r
etire
men
t
ÎPr
ovid
ing
mor
e w
ides
prea
d in
form
atio
n ab
out t
he ta
x ex
empt
ion
curr
ently
app
licab
le to
ben
efici
arie
s an
d ad
min
iste
rs in
wor
kpla
ces
Î
Rede
sign
ing
the
ince
ntiv
e sc
hem
e fo
r par
ticip
ants
(suc
h as
in
crea
sing
the
thre
shol
d fo
r tax
exe
mpt
ion)
Î
Incr
easi
ng th
e ve
stin
g pe
riod
to 3
yea
rs
Fina
ncia
l an
d ca
pita
l mar
kets
Î
Furt
her d
evel
opm
ent o
f the
cor
pora
te b
ond
mar
ket
(spe
cific
pol
icy
optio
ns c
an b
e fo
und
in a
rece
nt W
orld
Ba
nk re
port
on
the
subj
ect)
Î
Rem
ovin
g di
stor
tions
on
taxa
tion
of s
imila
r fina
ncia
l in
stru
men
ts
Î
New
Cap
ital M
arke
t law
Î
Mor
e eff
ectiv
e us
e of
the
“Inv
esto
r Pro
tect
ion
Fund
”
Cred
it gr
owth
– M
acro
-pr
uden
tial m
easu
res
Î
Intr
oduc
ing
inst
allm
ent l
imita
tions
for p
erso
nal
finan
ce a
nd v
ehic
le lo
ans
prov
ided
by
bank
s un
der t
he
cons
umer
loan
s ca
tego
ry
Î
Furt
her r
educ
ing
the
loan
/val
ue ra
tio in
mor
tgag
e lo
ans
(cur
rent
ly a
t 75
perc
ent)
and
intr
oduc
ing
a si
mila
r m
easu
re fo
r veh
icle
loan
s
ÎIn
trod
ucin
g in
stal
lmen
t lim
itatio
ns fo
r cre
dit c
ards
Î
Rais
ing
the
min
imum
pay
men
t rat
e fo
r cre
dit c
ards
to 4
0 pe
rcen
t
ÎEx
tend
ing
the
num
ber o
f yea
rs fo
r whi
ch a
cap
exi
sts
for
the
over
all c
redi
t car
d lim
it of
hou
seho
lds.
Hou
sing
mar
kets
Î
Esta
blis
hmen
t of a
hou
sing
pric
e m
onito
ring
syst
em
ÎH
ighe
r tax
atio
n of
sec
ond
hom
es a
nd u
nuse
d la
nd
viii EXECUTIVE SUMMARY
7 F
ollo
w-u
p w
ork
will
inve
stig
ate
alte
rnat
ive
optio
ns to
rede
sign
the
priv
ate
pens
ion
sche
me
to a
ttra
ct m
ore
savi
ngs
into
the
syst
em, a
nd th
e re
spec
tive
cost
of t
hese
opt
ions
.
SAVINg TRENDS IN TuRkEY IN INTERNATIONAl COMpARISON
1. Domestic saving in Turkey fell to a low of 12.7 percent of GDP in 2010, the lowest rate since 1980. After a temporary rise in the 1990s when the economy was in transition and inflation was high, the saving rate has declined substantially in the last 10 years. Although Turkey has had solid GDP growth, which is traditionally linked to increasing saving, the saving rate has in fact declined sharply, mainly because of a drop in household saving. The positive impact of income growth on saving was thus dominated by the acceleration of private consumption since 2001 as increased availability of credit and postponed consumption boosted private consumption.
2. Low domestic saving matters for at least two reasons. First, domestic savings finance investment and thus growth. Cross-country data suggest a positive association, especially for developing countries, between saving, investment, and growth. Second, the low level of domestic saving has increased dependence on foreign financing of Turkish investments, fueling an expansion in the external current account deficit and jeopardizing the sustainability of growth. This dependence on foreign savings has exposed Turkey to the risk of capital reversal, with attendant adverse impact on economic growth.
3. But raising domestic saving alone is not enough for sustainable growth. The role of domestic savings in achieving sustainable high growth cannot be considered apart from productivity growth. Although recently there has been an increase in the contribution of total factor productivity to growth, Turkey’s main source of growth has traditionally been capital accumulation. Turkey may further benefit from productivity growth by improving labor skills, promoting innovation, and adapting new technologies, in addition to investing more productively. Policies to increase domestic saving might promote sustainable high growth, particularly if complemented by productivity-enhancing policies.
4. This report analyzes the determinants of domestic saving in Turkey and provides policy options for increasing saving, particularly long-term saving. It summarizes work on household, corporate, and public sector saving. The first module, which was shared with the Turkish authorities in June 2010, analyzed saving trends in Turkey in an international context, the saving behavior of households, and the saving-investment relationship. This report brings these results together with findings from work carried out since. This includes household focus group discussions, time series analyses of determinants of private saving, analysis of corporate saving, the role of financial markets in intermediating saving, and public saving.
1. INTRODUCTION
5. This joint report with the Ministry of Development also incorporates valuable contributions from CBRT. CMB of Turkey, the Undersecretariat of Treasury, the Ministry of Finance, and representatives of the financial sector provided valuable insights.
6. The report has six sections: Section 2 presents trends in Turkey for public, private, household, and corporate saving, making international comparisons where available. Section 3 discusses the role of domestic saving in generating growth and possibly reducing the vulnerability created by increased dependence on foreign financing. With the importance of promoting domestic saving established, Section 4 discusses determinants of saving in Turkey. Section 5 assesses the role of financial markets in intermediating saving in Turkey, and Section 6 presents policy options to promote domestic saving, particularly long-term saving.
2 INTRODUCTION
SAVINg TRENDS IN TuRkEY IN INTERNATIONAl COMpARISON
2.1 Total, Public and Private Saving7
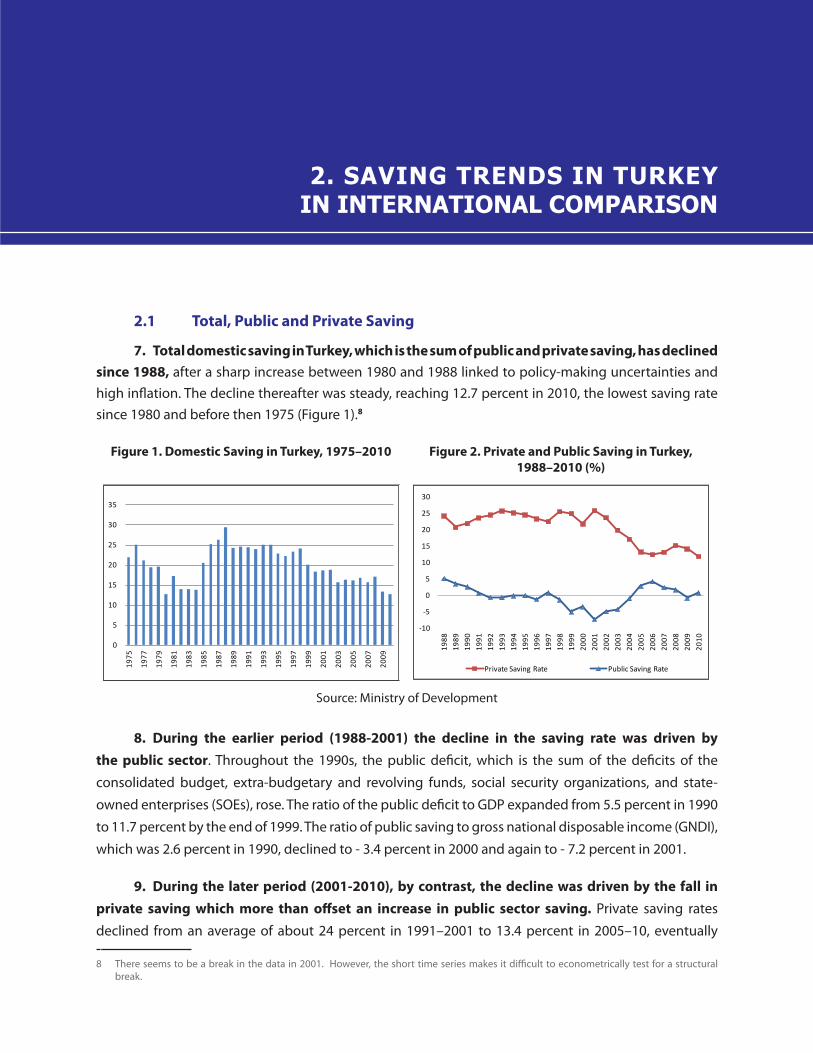
7. Total domestic saving in Turkey, which is the sum of public and private saving, has declined since 1988, after a sharp increase between 1980 and 1988 linked to policy-making uncertainties and high inflation. The decline thereafter was steady, reaching 12.7 percent in 2010, the lowest saving rate since 1980 and before then 1975 (Figure 1).8
Figure 1. Domestic Saving in Turkey, 1975–2010 Figure 2. Private and Public Saving in Turkey, 1988–2010 (%)
0
5
10
15
20
25
30
35
1975
1977
1979
1981
1983
1985
1987
1989
1991
1993
1995
1997
1999
2001
2003
2005
2007
2009
-10
-5
0
5
10
15
20
25
30
1988
1989
1990
1991
1992
1993
1994
1995
1996
1997
1998
1999
2000
2001
2002
2003
2004
2005
2006
2007
2008
2009
2010
Private Saving Rate Public Saving Rate
8. During the earlier period (1988-2001) the decline in the saving rate was driven by the public sector. Throughout the 1990s, the public deficit, which is the sum of the deficits of the
consolidated budget, extra-budgetary and revolving funds, social security organizations, and state-
owned enterprises (SOEs), rose. The ratio of the public deficit to GDP expanded from 5.5 percent in 1990
to 11.7 percent by the end of 1999. The ratio of public saving to gross national disposable income (GNDI),
which was 2.6 percent in 1990, declined to - 3.4 percent in 2000 and again to - 7.2 percent in 2001.
9. During the later period (2001-2010), by contrast, the decline was driven by the fall in private saving which more than offset an increase in public sector saving. Private saving rates
declined from an average of about 24 percent in 1991–2001 to 13.4 percent in 2005–10, eventually 7 8 There seems to be a break in the data in 2001. However, the short time series makes it difficult to econometrically test for a structural
break.
2. SAVING TRENDS IN TURKEY IN INTERNATIONAL COMPARISON
Source: Ministry of Development
pulling aggregate saving down to 16 percent. A range of factors explain the decline in private saving, particularly increased consumption driven by a rise in credit flows, in an environment of reduced interest rates and inflation. In parallel, however, public saving increased. In the aftermath of the 2001 crisis, fiscal policy was tightened to stabilize the public debt stock and a new framework for monetary and exchange rate policy was put in place. In contrast with past stabilization attempts, the focus was on improving public financial management and the budgetary system and attaining relatively high primary surplus targets. As public balances improved, the public saving rate increased substantially, from –7.2 percent in 2001 to over 4 percent in 2006, though a decline followed.
Box 1. Data on Savings in Turkey
This study uses the annual estimates for total domestic saving, private and public, produced by the Ministry of Development.* The Ministry of Development has revised the annual series for savings; the new series is used for the first time in this study.
A decomposition of private saving by households and by firms, however, is not available. Therefore, this study uses different data sources to analyze these subcomponents of private saving. For households, two main data sources are used. First, TurkStat generates household disposable income and consumption figures from the household budget survey (HBS). The study calculates household saving as a residual using these disposable income and consumption figures. Second, the survey of consumer finances, described in detail in Box 3, is used. For firms, two different data sources are used: (i) CBRT of the balance sheets of about 7,000 firms; and, (ii) Istanbul Stock Exchange (ISE) database.
* The Turkish Statistics Agency (TurkStat) currently does not produce savings data as a component of national accounts.
10. Turkey’s domestic saving rates are comparable to those of Latin America but lower than in most other regions (Figure 3). The aggregate world saving rate9 was remarkably constant for the entire sample at about 19 percent of GNDI. Saving rates by region show substantial dispersion both over time and relative to other regions. Turkey’s saving rate is below most regions except Sub-Saharan Africa (SSA) but is comparable to that of Latin America and Carribean (LAC), where Chile is a good example of an economy that has succeeded in permanently increasing its saving rate. Chile’s saving rate rose from an average of 12 percent in the 1980s to 23 percent in the 1990s and then to 24 percent in the 2000s. In the 1980s and 1990s the median country in the Middle East and North Africa (MENA) region showed stable saving rates during the 1980s and 1990s, of about 21 percent of GNDI, but then increased to over 25 percent of GNDI during the 2000s. By contrast, the Europe and Central Asia (ECA) region showed declining national saving rates over time: from more than 25 percent of GNDI in the 1980s to 21 percent in the 1990s and 18 percent in the 2000s—between the 1980s and the 1990s there was a savings collapse in transition countries in Eastern Europe.
9 The world saving rate is computed as the median rate in a sample of 104 developing and developed countries. Saving rates by regions are also computed as the median rate of the countries in a given region.
SAVING TRENDS IN TURKEY IN INTERNATIONAL COMPARISON4
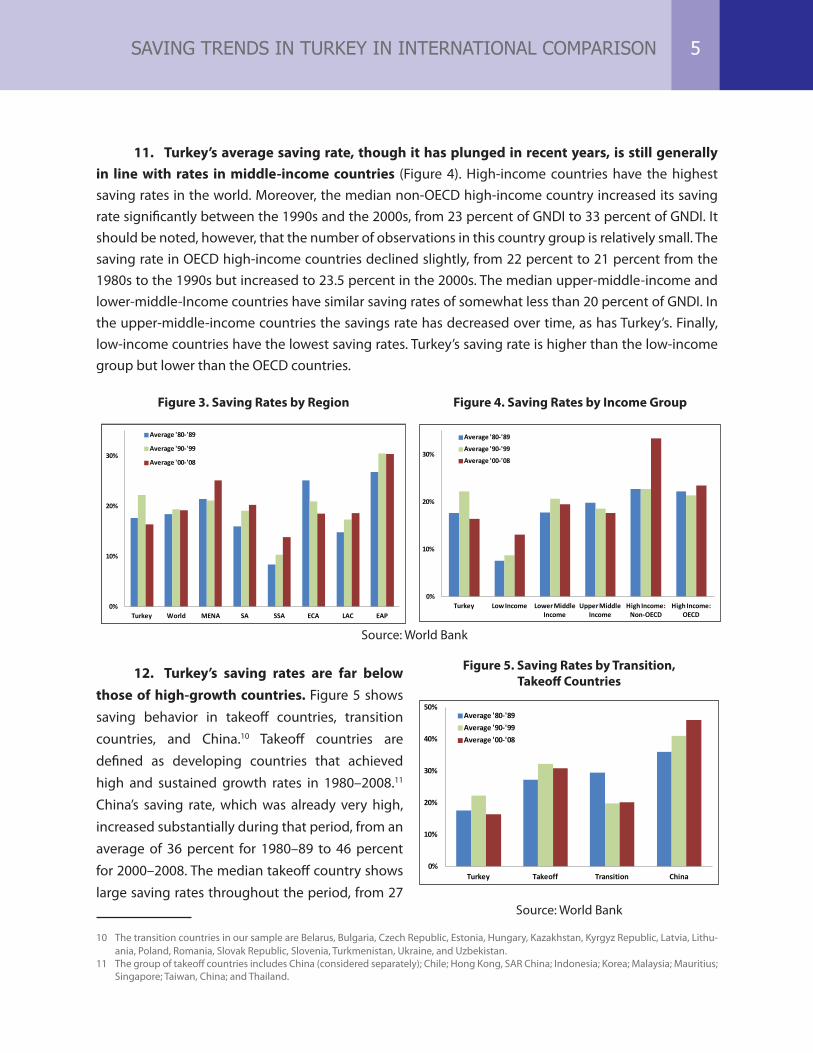
11. Turkey’s average saving rate, though it has plunged in recent years, is still generally in line with rates in middle-income countries (Figure 4). High-income countries have the highest saving rates in the world. Moreover, the median non-OECD high-income country increased its saving rate significantly between the 1990s and the 2000s, from 23 percent of GNDI to 33 percent of GNDI. It should be noted, however, that the number of observations in this country group is relatively small. The saving rate in OECD high-income countries declined slightly, from 22 percent to 21 percent from the 1980s to the 1990s but increased to 23.5 percent in the 2000s. The median upper-middle-income and lower-middle-Income countries have similar saving rates of somewhat less than 20 percent of GNDI. In the upper-middle-income countries the savings rate has decreased over time, as has Turkey’s. Finally, low-income countries have the lowest saving rates. Turkey’s saving rate is higher than the low-income group but lower than the OECD countries.
Figure 3. Saving Rates by Region Figure 4. Saving Rates by Income Group
0%
10%
20%
30%
Turkey World MENA SA SSA ECA LAC EAP
Average '80-'89
Average '90-'99
Average '00-'08
0%
10%
20%
30%
Turkey Low Income Lower Middle Income
Upper Middle Income
High Income: Non-OECD
High Income: OECD
Average '80-'89
Average '90-'99
Average '00-'08
12. Turkey’s saving rates are far below those of high-growth countries. Figure 5 shows saving behavior in takeoff countries, transition countries, and China.10 Takeoff countries are defined as developing countries that achieved high and sustained growth rates in 1980–2008.11 China’s saving rate, which was already very high, increased substantially during that period, from an average of 36 percent for 1980–89 to 46 percent for 2000–2008. The median takeoff country shows large saving rates throughout the period, from 27
10 The transition countries in our sample are Belarus, Bulgaria, Czech Republic, Estonia, Hungary, Kazakhstan, Kyrgyz Republic, Latvia, Lithu-ania, Poland, Romania, Slovak Republic, Slovenia, Turkmenistan, Ukraine, and Uzbekistan.
11 The group of takeoff countries includes China (considered separately); Chile; Hong Kong, SAR China; Indonesia; Korea; Malaysia; Mauritius; Singapore; Taiwan, China; and Thailand.
SAVING TRENDS IN TURKEY IN INTERNATIONAL COMPARISON
Figure 5. Saving Rates by Transition, Takeoff Countries
0%
10%
20%
30%
40%
50%
Turkey Takeoff Transition China
Average '80-'89Average '90-'99Average '00-'08
Source: World Bank
5
Source: World Bank
percent in the 1980s to 31 percent in the 2000s. On the other hand, between the 1980s and the 1990s saving rates in transition countries collapsed with the onset of the economic transformation that started around 1990 in Eastern European countries. There are two possible explanations for the collapse: (a) the end of involuntary savings due to the movement from a centrally planned to a market economy (Denizer and Wolf, 2000), and (b) the decline in short-term income, especially in real terms, together with the prospects of future higher economic growth and the adjustment of consumer durables, which may have depressed the national saving rate (Schmidt-Hebbel and Servén, 1998).
2.2 Household Saving
13. The previous section gave a profile of aggregate saving rates (total, public and private). From a policy perspective, it is important to investigate trends in and determinants of the individual components of private saving; household and corporate saving. This section will lay out the profile of household saving, while the next section will focus on corporate saving.
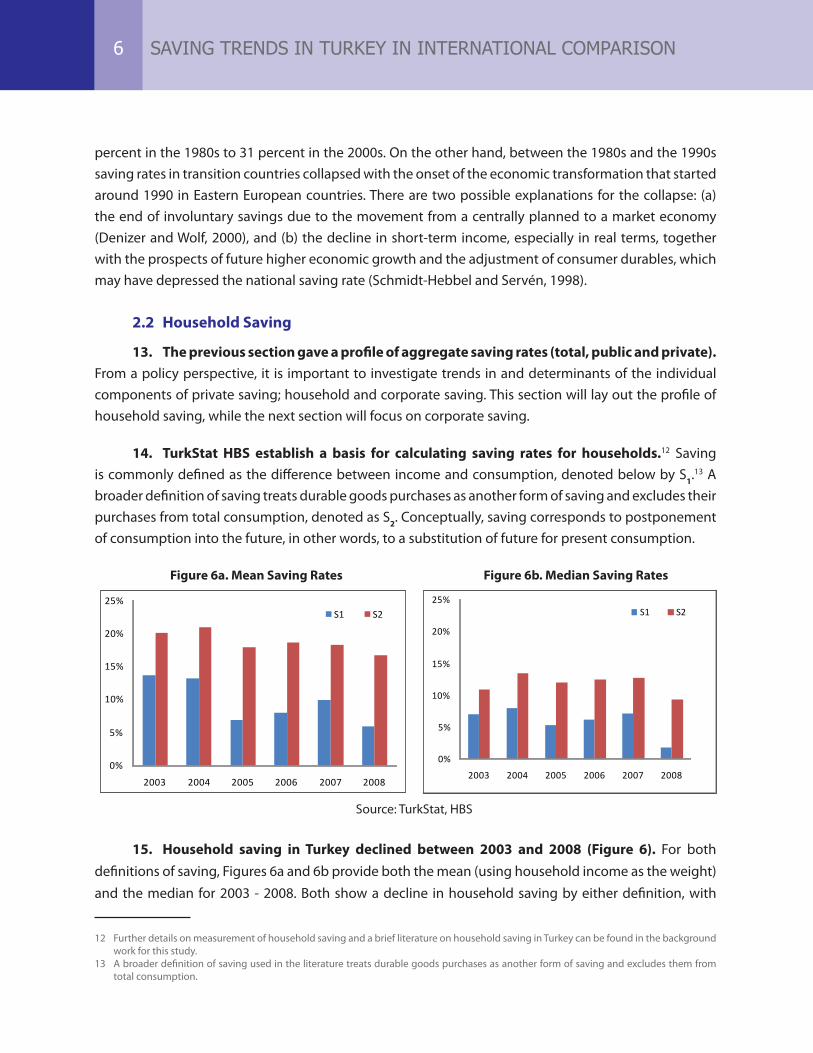
14. TurkStat HBS establish a basis for calculating saving rates for households.12 Saving is commonly defined as the difference between income and consumption, denoted below by S1.13 A broader definition of saving treats durable goods purchases as another form of saving and excludes their purchases from total consumption, denoted as S2. Conceptually, saving corresponds to postponement of consumption into the future, in other words, to a substitution of future for present consumption.
Figure 6a. Mean Saving Rates Figure 6b. Median Saving Rates
0%
5%
10%
15%
20%
25%
2003 2004 2005 2006 2007 2008
S1 S2
0%
5%
10%
15%
20%
25%
2003 2004 2005 2006 2007 2008
S1 S2
15. Household saving in Turkey declined between 2003 and 2008 (Figure 6). For both definitions of saving, Figures 6a and 6b provide both the mean (using household income as the weight) and the median for 2003 - 2008. Both show a decline in household saving by either definition, with
12 Further details on measurement of household saving and a brief literature on household saving in Turkey can be found in the background work for this study.
13 A broader definition of saving used in the literature treats durable goods purchases as another form of saving and excludes them from total consumption.
SAVING TRENDS IN TURKEY IN INTERNATIONAL COMPARISON6
Source: TurkStat, HBS
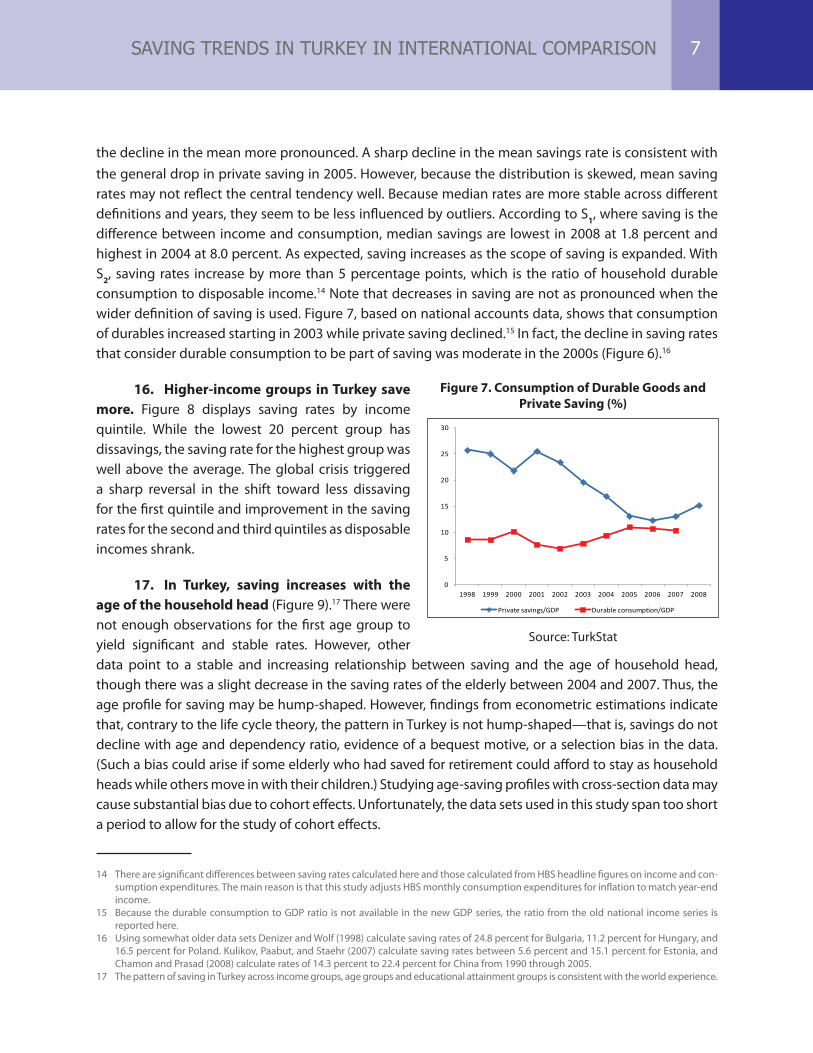
the decline in the mean more pronounced. A sharp decline in the mean savings rate is consistent with the general drop in private saving in 2005. However, because the distribution is skewed, mean saving rates may not reflect the central tendency well. Because median rates are more stable across different definitions and years, they seem to be less influenced by outliers. According to S1, where saving is the difference between income and consumption, median savings are lowest in 2008 at 1.8 percent and highest in 2004 at 8.0 percent. As expected, saving increases as the scope of saving is expanded. With S2, saving rates increase by more than 5 percentage points, which is the ratio of household durable consumption to disposable income.14 Note that decreases in saving are not as pronounced when the wider definition of saving is used. Figure 7, based on national accounts data, shows that consumption of durables increased starting in 2003 while private saving declined.15 In fact, the decline in saving rates that consider durable consumption to be part of saving was moderate in the 2000s (Figure 6).16
16. Higher-income groups in Turkey save more. Figure 8 displays saving rates by income quintile. While the lowest 20 percent group has dissavings, the saving rate for the highest group was well above the average. The global crisis triggered a sharp reversal in the shift toward less dissaving for the first quintile and improvement in the saving rates for the second and third quintiles as disposable incomes shrank.
17. In Turkey, saving increases with the age of the household head (Figure 9).17 There were not enough observations for the first age group to yield significant and stable rates. However, other data point to a stable and increasing relationship between saving and the age of household head, though there was a slight decrease in the saving rates of the elderly between 2004 and 2007. Thus, the age profile for saving may be hump-shaped. However, findings from econometric estimations indicate that, contrary to the life cycle theory, the pattern in Turkey is not hump-shaped—that is, savings do not decline with age and dependency ratio, evidence of a bequest motive, or a selection bias in the data. (Such a bias could arise if some elderly who had saved for retirement could afford to stay as household heads while others move in with their children.) Studying age-saving profiles with cross-section data may cause substantial bias due to cohort effects. Unfortunately, the data sets used in this study span too short a period to allow for the study of cohort effects.
14 There are significant differences between saving rates calculated here and those calculated from HBS headline figures on income and con-sumption expenditures. The main reason is that this study adjusts HBS monthly consumption expenditures for inflation to match year-end income.
15 Because the durable consumption to GDP ratio is not available in the new GDP series, the ratio from the old national income series is reported here.
16 Using somewhat older data sets Denizer and Wolf (1998) calculate saving rates of 24.8 percent for Bulgaria, 11.2 percent for Hungary, and 16.5 percent for Poland. Kulikov, Paabut, and Staehr (2007) calculate saving rates between 5.6 percent and 15.1 percent for Estonia, and Chamon and Prasad (2008) calculate rates of 14.3 percent to 22.4 percent for China from 1990 through 2005.
17 The pattern of saving in Turkey across income groups, age groups and educational attainment groups is consistent with the world experience.
Figure 7. Consumption of Durable Goods and Private Saving (%)
0
5
10
15
20
25
30
1998 1999 2000 2001 2002 2003 2004 2005 2006 2007 2008
Private savings/GDP Durable consumption/GDP
SAVING TRENDS IN TURKEY IN INTERNATIONAL COMPARISON 7
Source: TurkStat
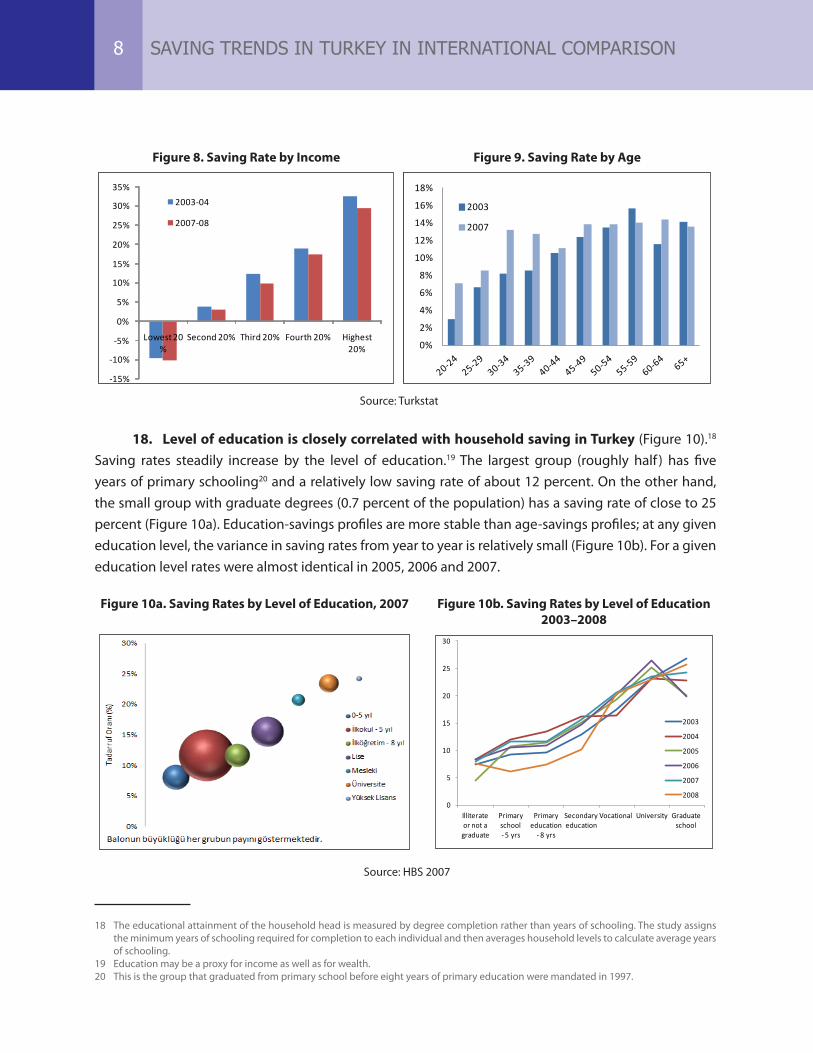
Figure 8. Saving Rate by Income Figure 9. Saving Rate by Age
-15%
-10%
-5%
0%
5%
10%
15%
20%
25%
30%
35%
Lowest 20 %
Second 20% Third 20% Fourth 20% Highest 20%
2003-04
2007-08
0%
2%
4%
6%
8%
10%
12%
14%
16%
18%
2003
2007
18. Level of education is closely correlated with household saving in Turkey (Figure 10).18 Saving rates steadily increase by the level of education.19 The largest group (roughly half ) has five years of primary schooling20 and a relatively low saving rate of about 12 percent. On the other hand, the small group with graduate degrees (0.7 percent of the population) has a saving rate of close to 25 percent (Figure 10a). Education-savings profiles are more stable than age-savings profiles; at any given education level, the variance in saving rates from year to year is relatively small (Figure 10b). For a given education level rates were almost identical in 2005, 2006 and 2007.
Figure 10a. Saving Rates by Level of Education, 2007 Figure 10b. Saving Rates by Level of Education 2003–2008
0
5
10
15
20
25
30
Illiterate or not a
graduate
Primary school- 5 yrs
Primary education
- 8 yrs
Secondary education
Vocational University Graduate school
2003
2004
2005
2006
2007
2008
18 The educational attainment of the household head is measured by degree completion rather than years of schooling. The study assigns the minimum years of schooling required for completion to each individual and then averages household levels to calculate average years of schooling.
19 Education may be a proxy for income as well as for wealth.20 This is the group that graduated from primary school before eight years of primary education were mandated in 1997.
SAVING TRENDS IN TURKEY IN INTERNATIONAL COMPARISON8
Source: Turkstat
Source: HBS 2007
2.3 Corporate Saving
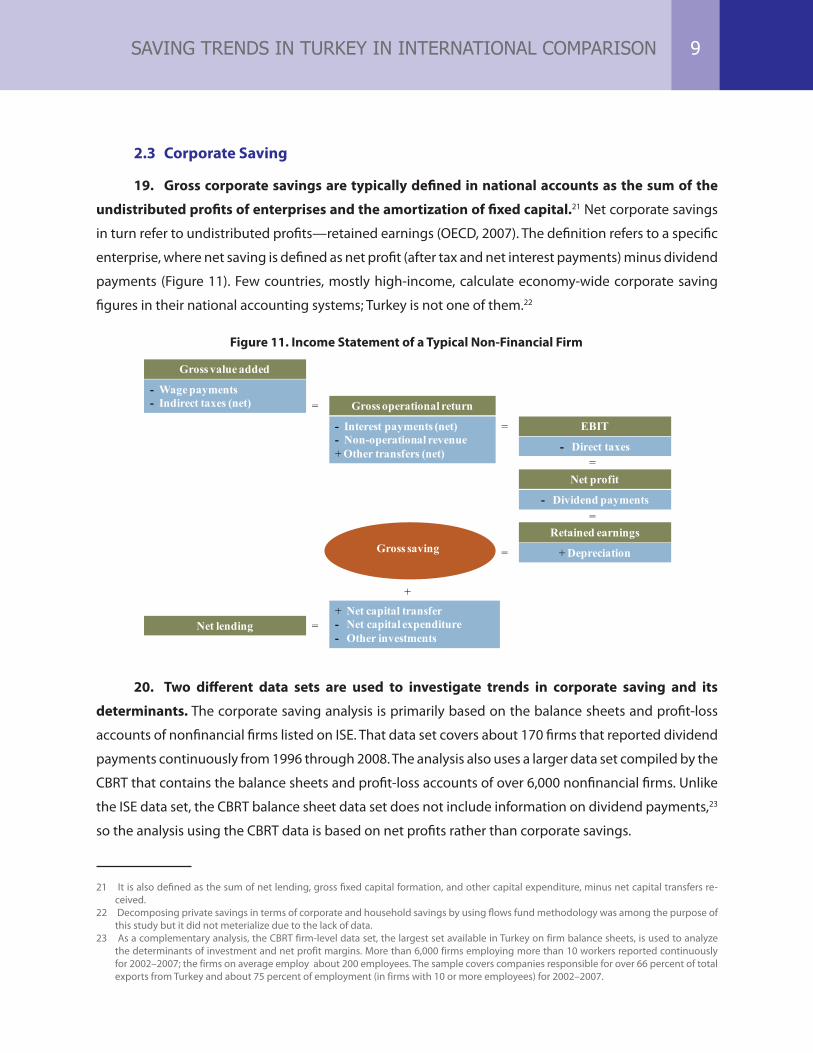
19. Gross corporate savings are typically defined in national accounts as the sum of the
undistributed profits of enterprises and the amortization of fixed capital.21 Net corporate savings
in turn refer to undistributed profits—retained earnings (OECD, 2007). The definition refers to a specific
enterprise, where net saving is defined as net profit (after tax and net interest payments) minus dividend
payments (Figure 11). Few countries, mostly high-income, calculate economy-wide corporate saving
figures in their national accounting systems; Turkey is not one of them.22
Figure 11. Income Statement of a Typical Non-Financial Firm
Gross value added
Gross operational return=
- Interest payments (net)- Non-operational revenue+ Other transfers (net)
=
EBIT
- Direct taxes
=
Net profit
- Dividend payments
=
+ Depreciation
+ Net capital transfer- Net capital expenditure- Other investments
=Net lending
- Wage payments- Indirect taxes (net)
Gross saving
=
Retained earnings
+
20. Two different data sets are used to investigate trends in corporate saving and its
determinants. The corporate saving analysis is primarily based on the balance sheets and profit-loss
accounts of nonfinancial firms listed on ISE. That data set covers about 170 firms that reported dividend
payments continuously from 1996 through 2008. The analysis also uses a larger data set compiled by the
CBRT that contains the balance sheets and profit-loss accounts of over 6,000 nonfinancial firms. Unlike
the ISE data set, the CBRT balance sheet data set does not include information on dividend payments,23
so the analysis using the CBRT data is based on net profits rather than corporate savings.
21 It is also defined as the sum of net lending, gross fixed capital formation, and other capital expenditure, minus net capital transfers re-ceived.
22 Decomposing private savings in terms of corporate and household savings by using flows fund methodology was among the purpose of this study but it did not meterialize due to the lack of data.
23 As a complementary analysis, the CBRT firm-level data set, the largest set available in Turkey on firm balance sheets, is used to analyze the determinants of investment and net profit margins. More than 6,000 firms employing more than 10 workers reported continuously for 2002–2007; the firms on average employ about 200 employees. The sample covers companies responsible for over 66 percent of total exports from Turkey and about 75 percent of employment (in firms with 10 or more employees) for 2002–2007.
SAVING TRENDS IN TURKEY IN INTERNATIONAL COMPARISON 9
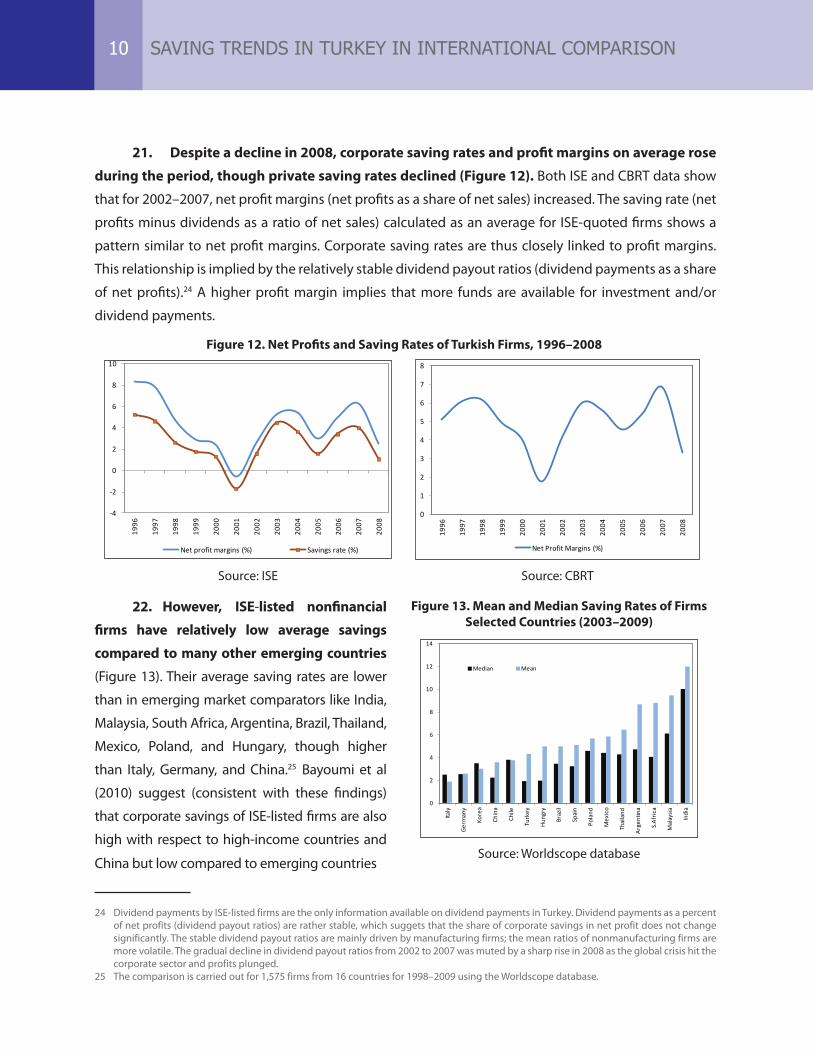
21. Despite a decline in 2008, corporate saving rates and profit margins on average rose
during the period, though private saving rates declined (Figure 12). Both ISE and CBRT data show
that for 2002–2007, net profit margins (net profits as a share of net sales) increased. The saving rate (net
profits minus dividends as a ratio of net sales) calculated as an average for ISE-quoted firms shows a
pattern similar to net profit margins. Corporate saving rates are thus closely linked to profit margins.
This relationship is implied by the relatively stable dividend payout ratios (dividend payments as a share
of net profits).24 A higher profit margin implies that more funds are available for investment and/or
dividend payments.
Figure 12. Net Profits and Saving Rates of Turkish Firms, 1996–2008
-4
-2
0
2
4
6
8
10
1996
1997
1998
1999
2000
2001
2002
2003
2004
2005
2006
2007
2008
Net profit margins (%) Savings rate (%)
0
1
2
3
4
5
6
7
8
1996
1997
1998
1999
2000
2001
2002
2003
2004
2005
2006
2007
2008
Net Profit Margins (%)
Source: ISE Source: CBRT
22. However, ISE-listed nonfinancial
firms have relatively low average savings
compared to many other emerging countries
(Figure 13). Their average saving rates are lower
than in emerging market comparators like India,
Malaysia, South Africa, Argentina, Brazil, Thailand,
Mexico, Poland, and Hungary, though higher
than Italy, Germany, and China.25 Bayoumi et al
(2010) suggest (consistent with these findings)
that corporate savings of ISE-listed firms are also
high with respect to high-income countries and
China but low compared to emerging countries
24 Dividend payments by ISE-listed firms are the only information available on dividend payments in Turkey. Dividend payments as a percent of net profits (dividend payout ratios) are rather stable, which suggets that the share of corporate savings in net profit does not change significantly. The stable dividend payout ratios are mainly driven by manufacturing firms; the mean ratios of nonmanufacturing firms are more volatile. The gradual decline in dividend payout ratios from 2002 to 2007 was muted by a sharp rise in 2008 as the global crisis hit the corporate sector and profits plunged.
25 The comparison is carried out for 1,575 firms from 16 countries for 1998–2009 using the Worldscope database.
Figure 13. Mean and Median Saving Rates of Firms Selected Countries (2003–2009)
0
2
4
6
8
10
12
14
Italy
Germ
any
Kore
a
Chin
a
Chile
Turk
ey
Hung
ry
Braz
il
Spai
n
Pola
nd
Mex
ico
Thai
land
Arge
ntin
a
S.Af
rica
Mal
aysia
Indi
a
Median Mean
Source: Worldscope database
SAVING TRENDS IN TURKEY IN INTERNATIONAL COMPARISON10
23. The analysis so far suggests that saving rates plunged in the 2000s, mainly due to the drop in household saving. It also established that saving in Turkey is low by international standards. This section addresses the implications of low saving for Turkey before discussing its determinants in Section 4. As will be explained, domestic saving or the lack thereof matters for two reasons: (i) domestic saving finances investment and thus growth; and, (ii) the substitute for domestic saving, foreign capital, creates vulnerabilities for the economy.
3.1 The implications of low savings on growth26
24. Low domestic saving jeopardizes the sustainability of high growth in Turkey. The relationship between saving and investment (depending on its nature and strength) constitutes a potential channel for transmitting savings into growth. However, irrespective of this degree of association, an increase in the share of domestic financing of growth has also a potentially important role of mitigating external vulnerability.
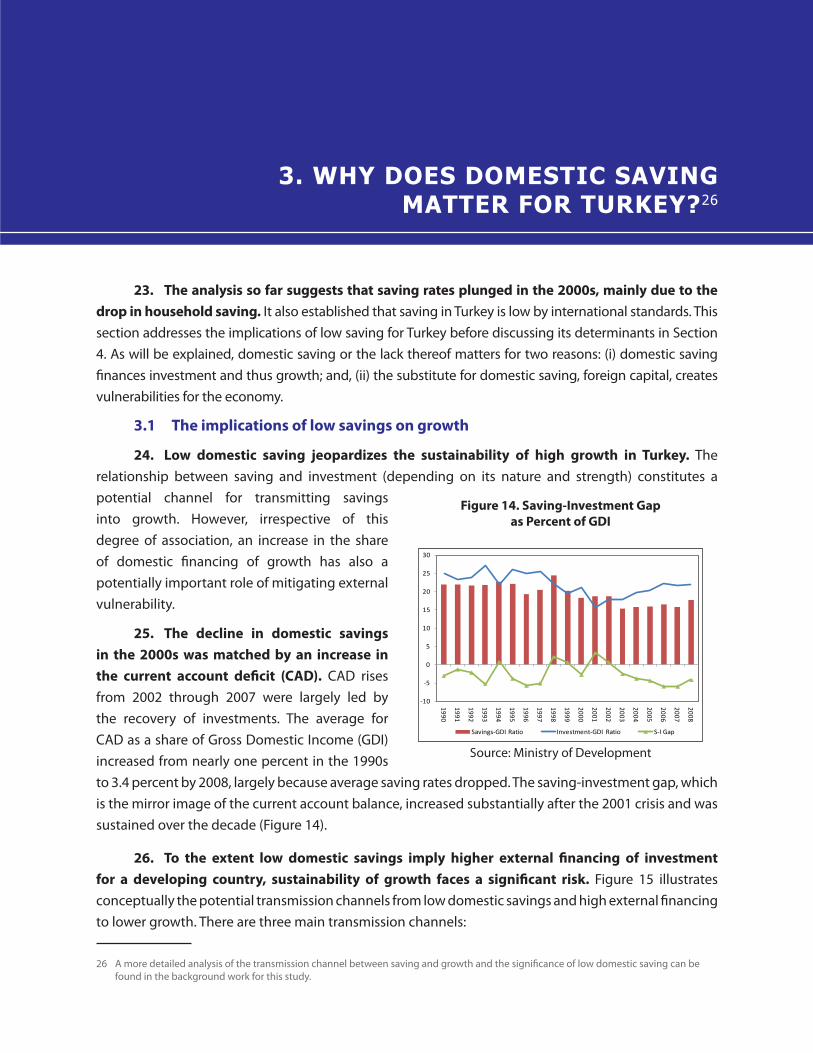
25. The decline in domestic savings in the 2000s was matched by an increase in the current account deficit (CAD). CAD rises from 2002 through 2007 were largely led by the recovery of investments. The average for CAD as a share of Gross Domestic Income (GDI) increased from nearly one percent in the 1990s to 3.4 percent by 2008, largely because average saving rates dropped. The saving-investment gap, which is the mirror image of the current account balance, increased substantially after the 2001 crisis and was sustained over the decade (Figure 14).
26. To the extent low domestic savings imply higher external financing of investment for a developing country, sustainability of growth faces a significant risk. Figure 15 illustrates conceptually the potential transmission channels from low domestic savings and high external financing to lower growth. There are three main transmission channels:
26 A more detailed analysis of the transmission channel between saving and growth and the significance of low domestic saving can be found in the background work for this study.
Figure 14. Saving-Investment Gap as Percent of GDI
-10
-5
0
5
10
15
20
25
30
1990
1991
1992
1993
1994
1995
1996
1997
1998
1999
2000
2001
2002
2003
2004
2005
2006
2007
2008
Savings-GDI Ratio Investment-GDI Ratio S-I Gap
Source: Ministry of Development
3. WHY DOES DOMESTIC SAVING MATTER FOR TURKEY?26
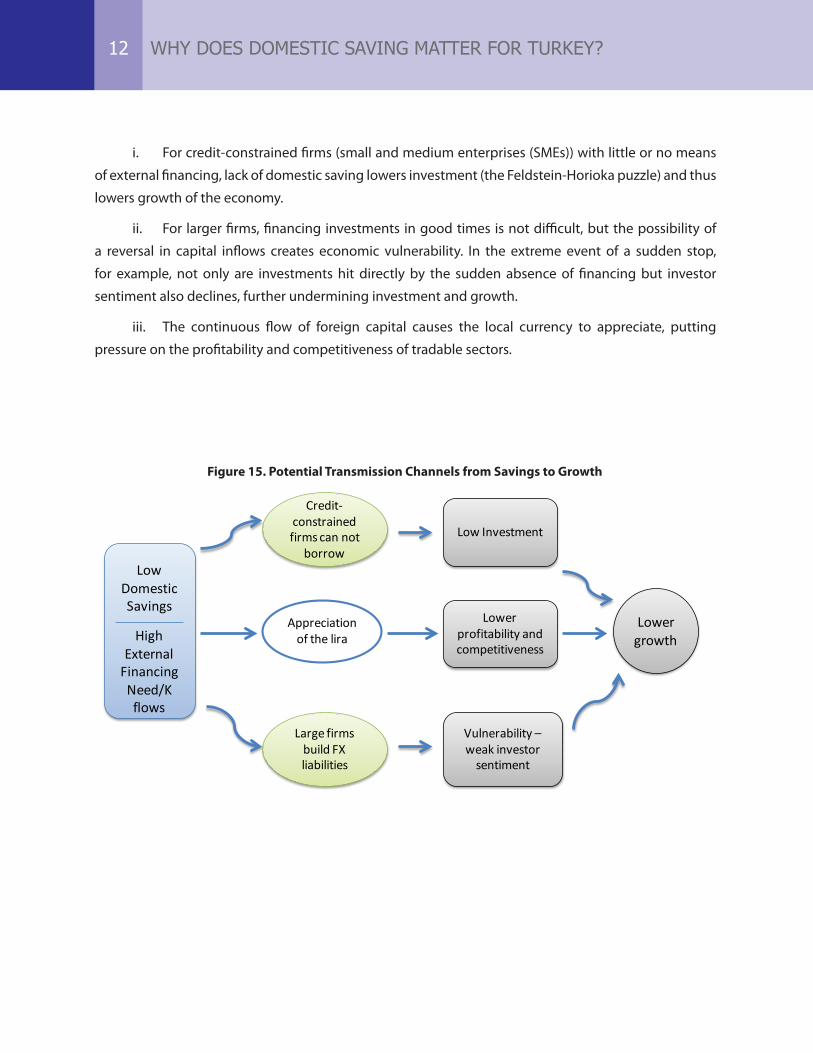
i. For credit-constrained firms (small and medium enterprises (SMEs)) with little or no means
of external financing, lack of domestic saving lowers investment (the Feldstein-Horioka puzzle) and thus
lowers growth of the economy.
ii. For larger firms, financing investments in good times is not difficult, but the possibility of
a reversal in capital inflows creates economic vulnerability. In the extreme event of a sudden stop,
for example, not only are investments hit directly by the sudden absence of financing but investor
sentiment also declines, further undermining investment and growth.
iii. The continuous flow of foreign capital causes the local currency to appreciate, putting
pressure on the profitability and competitiveness of tradable sectors.
Figure 15. Potential Transmission Channels from Savings to Growth
Low Domestic Savings
HighExternal
Financing Need/K flows
Credit-constrained firms can not
borrow
Large firms build FX liabilities
Low Investment
Vulnerability –weak investor
sentiment
Lower growth
Appreciation of the lira
Lower profitability and competitiveness
WHY DOES DOMESTIC SAVING MATTER FOR TURKEY?12
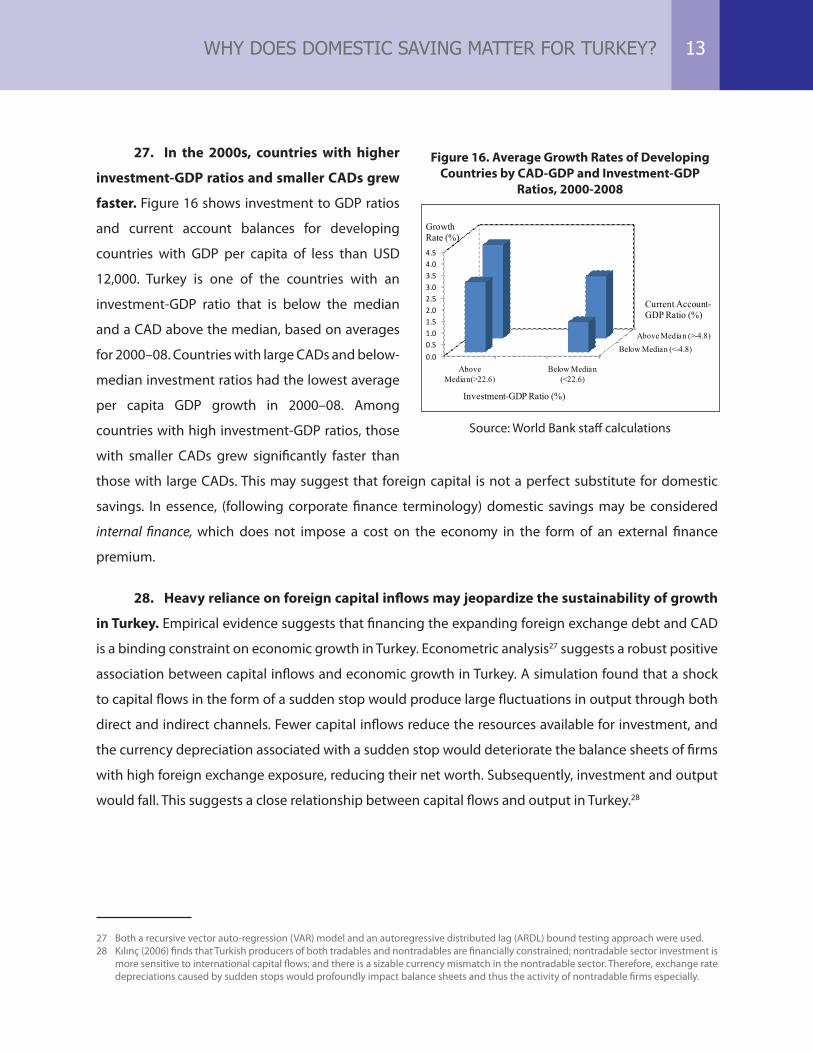
27. In the 2000s, countries with higher
investment-GDP ratios and smaller CADs grew
faster. Figure 16 shows investment to GDP ratios
and current account balances for developing
countries with GDP per capita of less than USD
12,000. Turkey is one of the countries with an
investment-GDP ratio that is below the median
and a CAD above the median, based on averages
for 2000–08. Countries with large CADs and below-
median investment ratios had the lowest average
per capita GDP growth in 2000–08. Among
countries with high investment-GDP ratios, those
with smaller CADs grew significantly faster than
those with large CADs. This may suggest that foreign capital is not a perfect substitute for domestic
savings. In essence, (following corporate finance terminology) domestic savings may be considered
internal finance,which does not impose a cost on the economy in the form of an external finance
premium.
28. Heavy reliance on foreign capital inflows may jeopardize the sustainability of growth
in Turkey. Empirical evidence suggests that financing the expanding foreign exchange debt and CAD
is a binding constraint on economic growth in Turkey. Econometric analysis27 suggests a robust positive
association between capital inflows and economic growth in Turkey. A simulation found that a shock
to capital flows in the form of a sudden stop would produce large fluctuations in output through both
direct and indirect channels. Fewer capital inflows reduce the resources available for investment, and
the currency depreciation associated with a sudden stop would deteriorate the balance sheets of firms
with high foreign exchange exposure, reducing their net worth. Subsequently, investment and output
would fall. This suggests a close relationship between capital flows and output in Turkey.28
27 Both a recursive vector auto-regression (VAR) model and an autoregressive distributed lag (ARDL) bound testing approach were used. 28 Kılınç (2006) finds that Turkish producers of both tradables and nontradables are financially constrained; nontradable sector investment is
more sensitive to international capital flows; and there is a sizable currency mismatch in the nontradable sector. Therefore, exchange rate depreciations caused by sudden stops would profoundly impact balance sheets and thus the activity of nontradable firms especially.
Figure 16. Average Growth Rates of Developing Countries by CAD-GDP and Investment-GDP
Ratios, 2000-2008
Below Median (<-4.8)Above Median (>-4.8)
0.00.51.01.52.02.53.03.54.04.5
Above Median(>22.6)
Below Median (<22.6)
Investment-GDP Ratio (%)
Current Account-GDP Ratio (%)
Growth Rate (%)
Source: World Bank staff calculations
WHY DOES DOMESTIC SAVING MATTER FOR TURKEY? 13
3.2 Evidence on the Investment-Saving Relationship in an Open Economy: International Perspective
29. The previous section identified transmission channels for the low savings rate: the resulting lack of sufficient funds leads to less investment; appreciation of the domestic currency erodes competitiveness; and the building up of foreign exchange liabilities creates vulnerability in the economy, all of which constrain growth. It also showed the relationship between high current account deficits and growth. This section presents cross-country evidence of the saving-investment relationship. Given Turkey’s continued high need for investment, establishing a close positive relationship between saving and investment will underscore the importance of increasing domestic saving in Turkey.
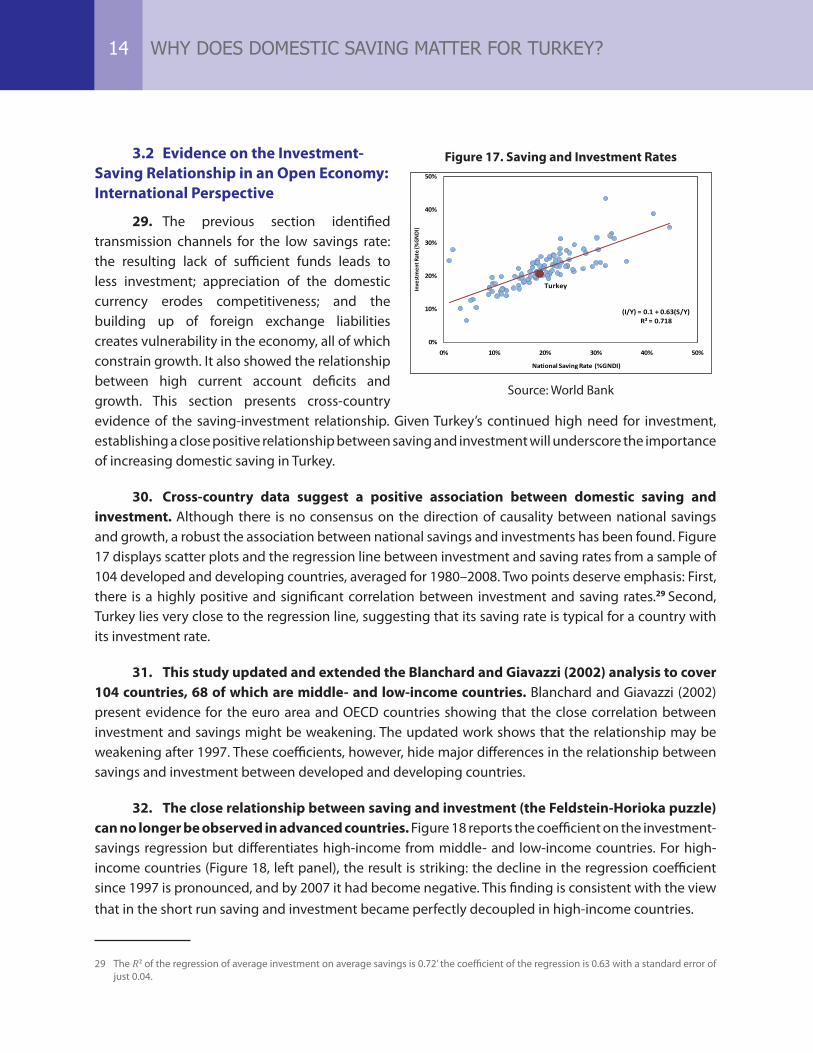
30. Cross-country data suggest a positive association between domestic saving and investment. Although there is no consensus on the direction of causality between national savings and growth, a robust the association between national savings and investments has been found. Figure 17 displays scatter plots and the regression line between investment and saving rates from a sample of 104 developed and developing countries, averaged for 1980–2008. Two points deserve emphasis: First, there is a highly positive and significant correlation between investment and saving rates.29 Second, Turkey lies very close to the regression line, suggesting that its saving rate is typical for a country with its investment rate.
31. This study updated and extended the Blanchard and Giavazzi (2002) analysis to cover 104 countries, 68 of which are middle- and low-income countries. Blanchard and Giavazzi (2002) present evidence for the euro area and OECD countries showing that the close correlation between investment and savings might be weakening. The updated work shows that the relationship may be weakening after 1997. These coefficients, however, hide major differences in the relationship between savings and investment between developed and developing countries.
32. The close relationship between saving and investment (the Feldstein-Horioka puzzle) can no longer be observed in advanced countries. Figure 18 reports the coefficient on the investment-savings regression but differentiates high-income from middle- and low-income countries. For high-income countries (Figure 18, left panel), the result is striking: the decline in the regression coefficient since 1997 is pronounced, and by 2007 it had become negative. This finding is consistent with the view that in the short run saving and investment became perfectly decoupled in high-income countries.
29 The 𝑅2 of the regression of average investment on average savings is 0.72’ the coefficient of the regression is 0.63 with a standard error of just 0.04.
Figure 17. Saving and Investment Rates
(I/Y) = 0.1 + 0.63(S/Y)R² = 0.718
0%
10%
20%
30%
40%
50%
0% 10% 20% 30% 40% 50%
Inve
stm
ent R
ate
(%GN
DI)
National Saving Rate (%GNDI)
Turkey
Source: World Bank
WHY DOES DOMESTIC SAVING MATTER FOR TURKEY?14
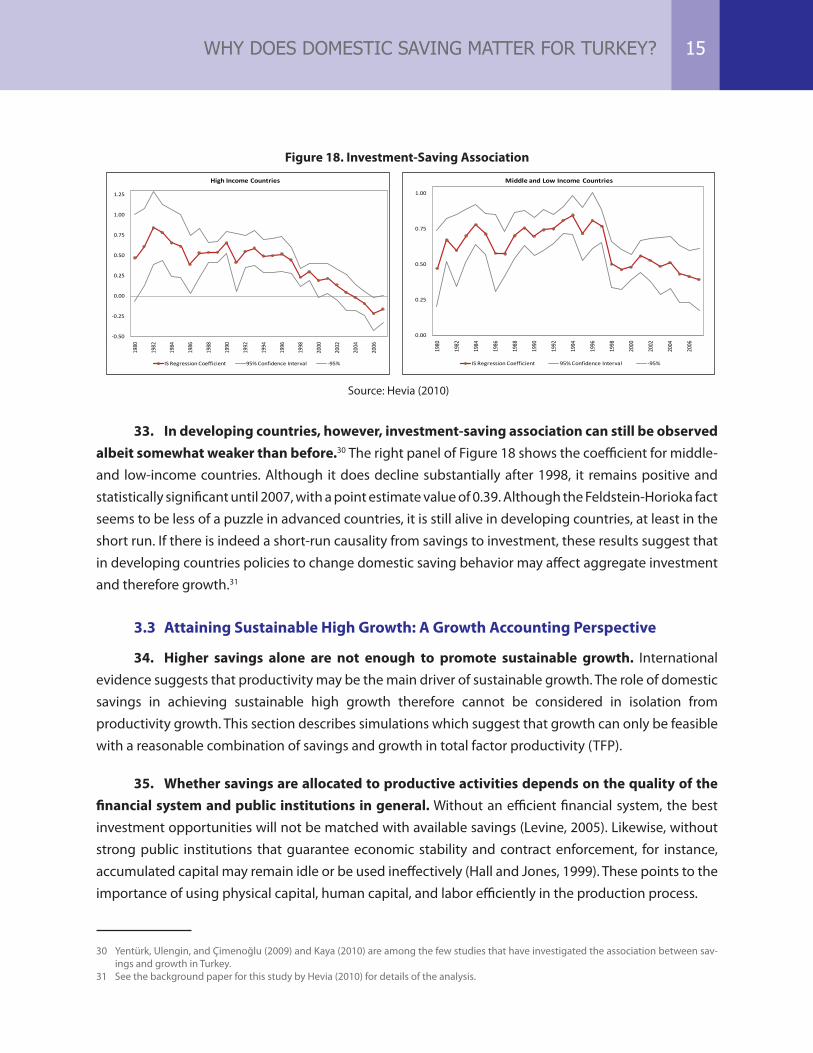
Figure 18. Investment-Saving Association
-0.50
-0.25
0.00
0.25
0.50
0.75
1.00
1.25
1980
1982
1984
1986
1988
1990
1992
1994
1996
1998
2000
2002
2004
2006
High Income Countries
IS Regression Coefficient 95% Confidence Interval -95%
0.00
0.25
0.50
0.75
1.00
1980
1982
1984
1986
1988
1990
1992
1994
1996
1998
2000
2002
2004
2006
Middle and Low Income Countries
IS Regression Coefficient 95% Confidence Interval -95%
33. In developing countries, however, investment-saving association can still be observed albeit somewhat weaker than before.30 The right panel of Figure 18 shows the coefficient for middle- and low-income countries. Although it does decline substantially after 1998, it remains positive and statistically significant until 2007, with a point estimate value of 0.39. Although the Feldstein-Horioka fact seems to be less of a puzzle in advanced countries, it is still alive in developing countries, at least in the short run. If there is indeed a short-run causality from savings to investment, these results suggest that in developing countries policies to change domestic saving behavior may affect aggregate investment and therefore growth.31
3.3 Attaining Sustainable High Growth: A Growth Accounting Perspective
34. Higher savings alone are not enough to promote sustainable growth. International evidence suggests that productivity may be the main driver of sustainable growth. The role of domestic savings in achieving sustainable high growth therefore cannot be considered in isolation from productivity growth. This section describes simulations which suggest that growth can only be feasible with a reasonable combination of savings and growth in total factor productivity (TFP).
35. Whether savings are allocated to productive activities depends on the quality of the financial system and public institutions in general. Without an efficient financial system, the best investment opportunities will not be matched with available savings (Levine, 2005). Likewise, without strong public institutions that guarantee economic stability and contract enforcement, for instance, accumulated capital may remain idle or be used ineffectively (Hall and Jones, 1999). These points to the importance of using physical capital, human capital, and labor efficiently in the production process.
30 Yentürk, Ulengin, and Çimenoğlu (2009) and Kaya (2010) are among the few studies that have investigated the association between sav-ings and growth in Turkey.
31 See the background paper for this study by Hevia (2010) for details of the analysis.
WHY DOES DOMESTIC SAVING MATTER FOR TURKEY? 15
Source: Hevia (2010)
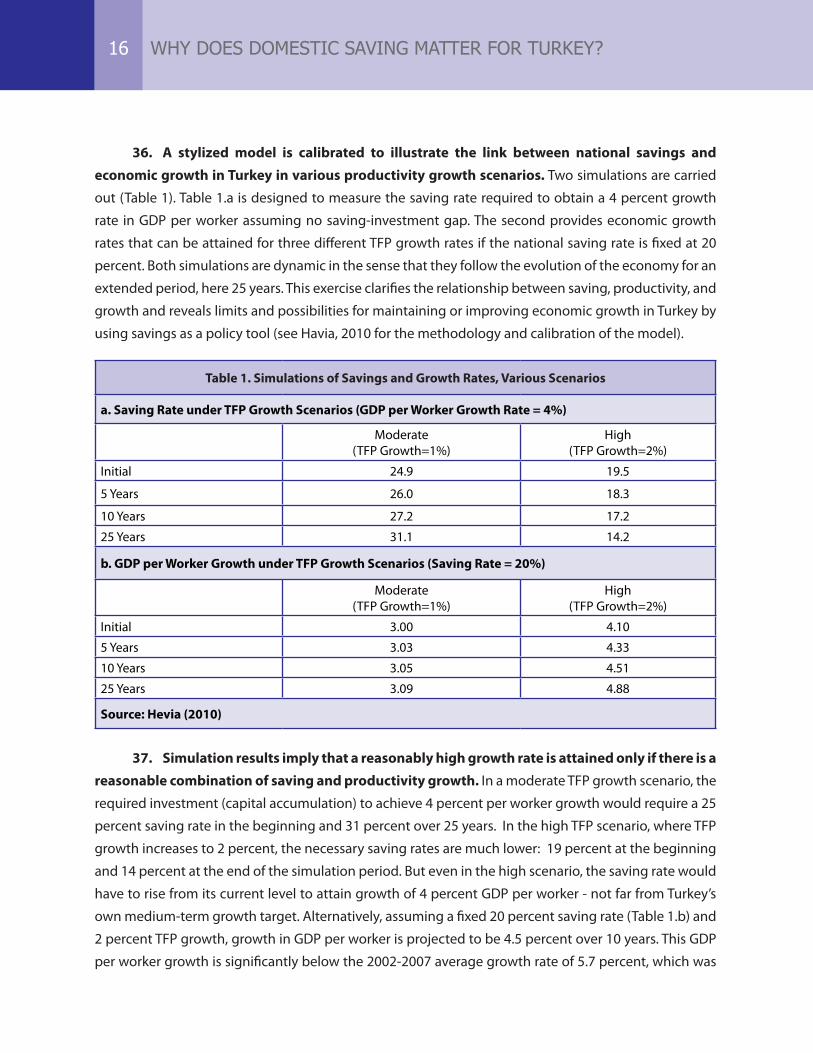
36. A stylized model is calibrated to illustrate the link between national savings and economic growth in Turkey in various productivity growth scenarios. Two simulations are carried
out (Table 1). Table 1.a is designed to measure the saving rate required to obtain a 4 percent growth
rate in GDP per worker assuming no saving-investment gap. The second provides economic growth
rates that can be attained for three different TFP growth rates if the national saving rate is fixed at 20
percent. Both simulations are dynamic in the sense that they follow the evolution of the economy for an
extended period, here 25 years. This exercise clarifies the relationship between saving, productivity, and
growth and reveals limits and possibilities for maintaining or improving economic growth in Turkey by
using savings as a policy tool (see Havia, 2010 for the methodology and calibration of the model).
Table 1. Simulations of Savings and Growth Rates, Various Scenarios
a. Saving Rate under TFP Growth Scenarios (GDP per Worker Growth Rate = 4%)
Moderate(TFP Growth=1%)
High(TFP Growth=2%)
Initial 24.9 19.5
5 Years 26.0 18.3
10 Years 27.2 17.2
25 Years 31.1 14.2
b. GDP per Worker Growth under TFP Growth Scenarios (Saving Rate = 20%)
Moderate(TFP Growth=1%)
High(TFP Growth=2%)
Initial 3.00 4.10
5 Years 3.03 4.33
10 Years 3.05 4.51
25 Years 3.09 4.88
Source: Hevia (2010)
37. Simulation results imply that a reasonably high growth rate is attained only if there is a reasonable combination of saving and productivity growth. In a moderate TFP growth scenario, the
required investment (capital accumulation) to achieve 4 percent per worker growth would require a 25
percent saving rate in the beginning and 31 percent over 25 years. In the high TFP scenario, where TFP
growth increases to 2 percent, the necessary saving rates are much lower: 19 percent at the beginning
and 14 percent at the end of the simulation period. But even in the high scenario, the saving rate would
have to rise from its current level to attain growth of 4 percent GDP per worker - not far from Turkey’s
own medium-term growth target. Alternatively, assuming a fixed 20 percent saving rate (Table 1.b) and
2 percent TFP growth, growth in GDP per worker is projected to be 4.5 percent over 10 years. This GDP
per worker growth is significantly below the 2002-2007 average growth rate of 5.7 percent, which was
WHY DOES DOMESTIC SAVING MATTER FOR TURKEY?16
not sufficient to reduce unemployment rate below 10 percent.32 Rodrik (2009) has recently argued that
an increase in domestic savings by nearly 10 percentage points is necessary to achieve growth rates that
will absorb excess labor supply and reduce unemployment in Turkey.
38. Further improving the investment climate in Turkey is crucial to promoting productivity growth. Analysis of investment climate survey data confirms a significant association between the
quality of the investment climate and productivity. Productivity analysis shows that almost one-third
of the variation in the performance of the business sector in Turkey is explained by investment climate
factors. Among these factors, the regulatory environment is the area with the largest relative contribution
to productivity. Other relevant investment climate areas include infrastructure bottlenecks, access to
finance and corporate governance, the availability of skilled labor and innovation.33
32 Pressures from a growing labor supply and sectoral transformation were instrumental in keeping unemployment sticky. In this period, average TFP growth was close to 2 percent.
33 For a detailed discussion of reforms, see World Bank Turkey Country Economic Memorandum, Informality: Causes, Consequences, Policies (2010).
WHY DOES DOMESTIC SAVING MATTER FOR TURKEY? 17
39. Domestic saving in Turkey declined in the 2000s and is low by international standards (Section 2). Section 3 showed how low saving translates into lower growth and the link between saving and investment; it argued that saving increases have to be supported by productivity growth to ensure that economic growth will be sustainable. At the core of this report is identifying policy areas for promoting domestic savings in Turkey. This section investigates determinants of domestic saving, focusing first on aggregate public and private saving and then on household and corporate saving. As discussed above, the decomposition of private saving figures (produced by the Ministry of Development) are not available and separate data sources are utilized to obtain an understanding of the dynamics behind household and corporate savings.
4.1 Private and Public Saving
Private Saving
40. A cross-country model estimation found that four variables explain most of Turkey’s private saving behavior: the real interest rate, gross private disposable income, the young age dependency ratio, and the inflation rate.34 The analysis of determinants of private saving uses the estimates in Loayza, Schmidt-Hebbel, and Servén (2000), one of the most comprehensive and detailed studies of world saving rates. In particular, using the estimated coefficients in that study and data from Turkey, mainly four variables explain Turkey’s private saving rate since 1998: the real interest rate, the gross private disposable income, the young age dependency ratio, and the inflation rate. The analysis compares the actual saving rate with an estimated saving rate by holding each of the four variables at its 1998 level throughout the period (1998–2008). If the estimated saving rate is lower than the actual, it can be concluded that the particular variable affected actual saving positively. If, however, the estimated saving rate is above the actual, the change in the particular variable affected actual saving negatively.
i. The decline in the interestrate lowered private saving. If the interest rate had remained at its 1998 level, private saving in 2002 would have been over 33 percent of Gross Private Disposable Income (GPDI) and by 2008 would have been over 23 percent rather than the actual 18.6 percent. Thus, the decline in the interest rate reduced saving.
ii. The increase in income promoted private saving, particularly after 2005. Had income remained at its 1998 level, the saving rate starting in 2006 would have been about 2 to 3 percentage points lower than was actually observed.
34 A more detailed analysis of the estimation of this model can be found in the background work for this study.
4. DETERMINANTS OF SAVING IN TURKEY
iii. The decline in the youngdependency ratio absorbed part of the decline in the private saving rate. In effect, had the young dependency ratio remained at its 1998 value, private saving between 2005 and 2008 would have been close to 15 percent.
iv. Finally, the large decline in inflation during the 2000s was important for the drop in private saving. Had inflation remained at its 1998 value, private saving in 2008 would have been about 22.5 percent of GPDI. Moreover, because predicted and actual saving rates started to differ significantly in 2002, it is likely that the effect of inflation on the saving rate is capturing the decline in economic uncertainty over the last few years.
41. Time series analysis and findings from Turkey-specific analyses35 are generally consistent with the cross-country model findings. Analysis using new Ministry of Development data generated for 1975–2008 explores the importance of various potential determinants of savings. While the four variables noted (income, interest rate, young dependency and macroeconomic stability as proxied by inflation) are confirmed to be significant determinants, other factors could also be at play. More favorable terms of trade are expected to increase private saving, potentially through promoting exports and a subsequent positive impact on income and growth. It also appears that higher female labor force participation is likely to increase private saving; this is also an important finding in the household level analysis discussed separately below.
42. Financial markets are critical in channeling private savings. Turkey has great potential for developing financial markets that would do more than promote long-term savings. Analysis of the relationship between saving and financial market depth provides the estimated thresholds required if savings are to contribute to growth (Sayek, 2010). At the mean level of savings and financial market depth over the past 30 years, Turkey has not been able to benefit from domestic saving. At the 30-year mean of financial market depth, the savings rate has to be above 58 percent to contribute to growth in real GDP per capita growth, 67 percent to contribute to TFP growth, and 27 percent to contribute to capital per labor growth. These levels are far above Turkey’s aggregate savings rate over the past 30 years. However, they do have policy relevance: policies should target both improvements in the saving rate and financial deepening (or intermediation of savings into growth-related activities) for Turkey to benefit from saving in the economy (for a more detailed discussion, see Section 5).
Public Saving36
43. The fall in private saving in the 2000s was accompanied, as noted, by an improvement in public saving. Conventionally, the public deficit is used to assess public sector fiscal performance. However, for the purpose of analyzing savings, “public saving” is more appropriate. Clearly, public saving is closely related to the public sector overall balance (deficit), but it differs from that balance by the amount of investment expenditures and capital transfers (Box 2). Before considering developments in the 2000s, it may be worthwhile to look into the earlier period (1975–2000).
35 Two background studies used the Ministry of Development’s new time-series; Apaydın, Türeli and Yalçın (2011) and Pirgan, Matur, Sabun-cu, and Bahçeci (2011).
36 This section draws on the background paper prepared by the Ministry of Development Budget and Local Administrations Department, Annual Programs and Conjuncture Evaluation Directorate General.
DETERMINANTS OF SAVING IN TURKEY 19
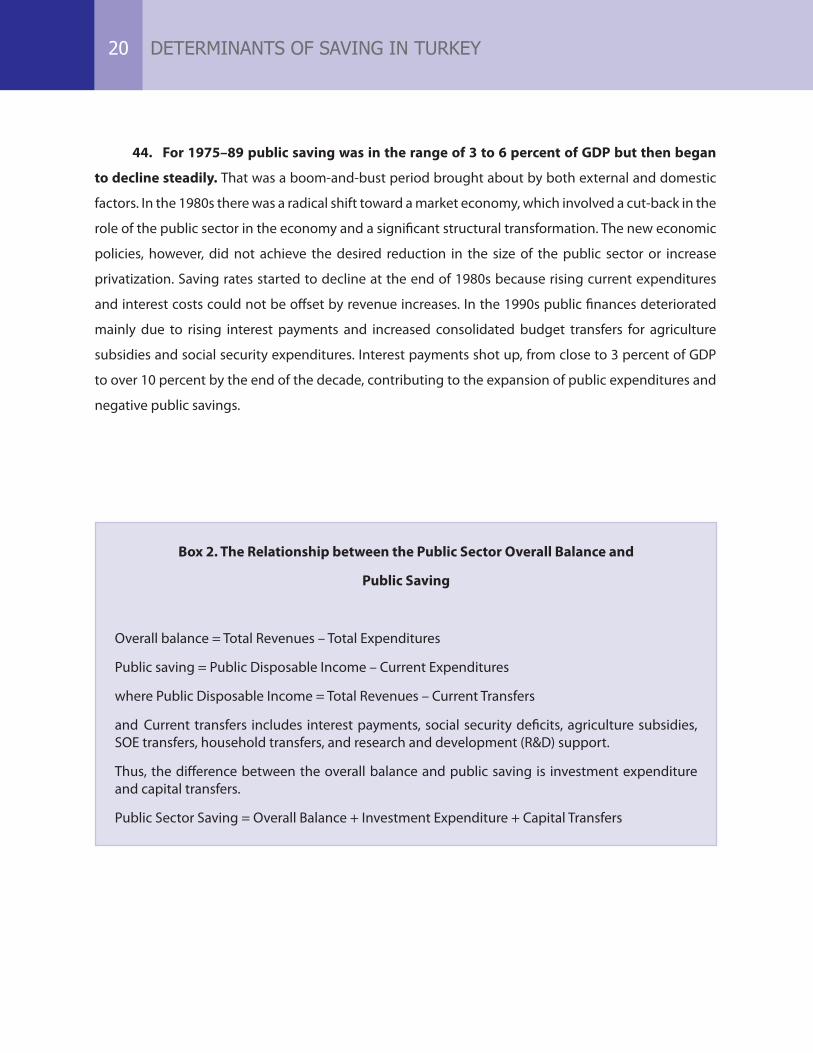
44. For 1975–89 public saving was in the range of 3 to 6 percent of GDP but then began
to decline steadily. That was a boom-and-bust period brought about by both external and domestic
factors. In the 1980s there was a radical shift toward a market economy, which involved a cut-back in the
role of the public sector in the economy and a significant structural transformation. The new economic
policies, however, did not achieve the desired reduction in the size of the public sector or increase
privatization. Saving rates started to decline at the end of 1980s because rising current expenditures
and interest costs could not be offset by revenue increases. In the 1990s public finances deteriorated
mainly due to rising interest payments and increased consolidated budget transfers for agriculture
subsidies and social security expenditures. Interest payments shot up, from close to 3 percent of GDP
to over 10 percent by the end of the decade, contributing to the expansion of public expenditures and
negative public savings.
Box 2. The Relationship between the Public Sector Overall Balance and
Public Saving
Overall balance = Total Revenues – Total Expenditures
Public saving = Public Disposable Income – Current Expenditures
where Public Disposable Income = Total Revenues – Current Transfers
and Current transfers includes interest payments, social security deficits, agriculture subsidies, SOE transfers, household transfers, and research and development (R&D) support.
Thus, the difference between the overall balance and public saving is investment expenditure and capital transfers.
Public Sector Saving = Overall Balance + Investment Expenditure + Capital Transfers
DETERMINANTS OF SAVING IN TURKEY20
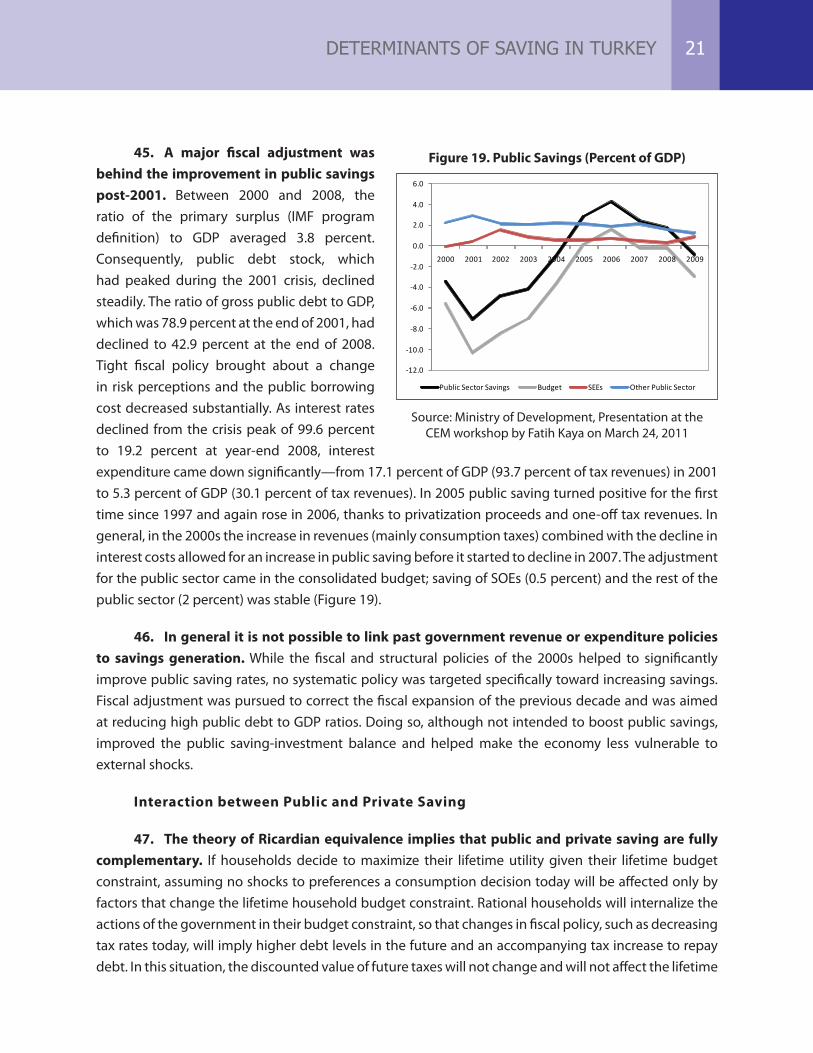
45. A major fiscal adjustment was behind the improvement in public savings post-2001. Between 2000 and 2008, the ratio of the primary surplus (IMF program definition) to GDP averaged 3.8 percent. Consequently, public debt stock, which had peaked during the 2001 crisis, declined steadily. The ratio of gross public debt to GDP, which was 78.9 percent at the end of 2001, had declined to 42.9 percent at the end of 2008. Tight fiscal policy brought about a change in risk perceptions and the public borrowing cost decreased substantially. As interest rates declined from the crisis peak of 99.6 percent to 19.2 percent at year-end 2008, interest expenditure came down significantly—from 17.1 percent of GDP (93.7 percent of tax revenues) in 2001 to 5.3 percent of GDP (30.1 percent of tax revenues). In 2005 public saving turned positive for the first time since 1997 and again rose in 2006, thanks to privatization proceeds and one-off tax revenues. In general, in the 2000s the increase in revenues (mainly consumption taxes) combined with the decline in interest costs allowed for an increase in public saving before it started to decline in 2007. The adjustment for the public sector came in the consolidated budget; saving of SOEs (0.5 percent) and the rest of the public sector (2 percent) was stable (Figure 19).
46. In general it is not possible to link past government revenue or expenditure policies to savings generation. While the fiscal and structural policies of the 2000s helped to significantly improve public saving rates, no systematic policy was targeted specifically toward increasing savings. Fiscal adjustment was pursued to correct the fiscal expansion of the previous decade and was aimed at reducing high public debt to GDP ratios. Doing so, although not intended to boost public savings, improved the public saving-investment balance and helped make the economy less vulnerable to external shocks.
Interaction between Public and Private Saving
47. The theory of Ricardian equivalence implies that public and private saving are fully complementary. If households decide to maximize their lifetime utility given their lifetime budget constraint, assuming no shocks to preferences a consumption decision today will be affected only by factors that change the lifetime household budget constraint. Rational households will internalize the actions of the government in their budget constraint, so that changes in fiscal policy, such as decreasing tax rates today, will imply higher debt levels in the future and an accompanying tax increase to repay debt. In this situation, the discounted value of future taxes will not change and will not affect the lifetime
Figure 19. Public Savings (Percent of GDP)
-12.0
-10.0
-8.0
-6.0
-4.0
-2.0
0.0
2.0
4.0
6.0
2000 2001 2002 2003 2004 2005 2006 2007 2008 2009
Public Sector Savings Budget SEEs Other Public Sector
Source: Ministry of Development, Presentation at the CEM workshop by Fatih Kaya on March 24, 2011
DETERMINANTS OF SAVING IN TURKEY 21
household budget constraint, leaving today’s household consumption decisions intact. The fact that consumption is not affected by changes in taxes (or government saving) implies that private saving is reduced by exactly the same amount as the change in government saving. This suggests a one-to-one negative relationship between private and public savings—full Ricardian equivalence. However, the assumptions underlying full Ricardian equivalence are very restrictive; in practice they are usually not satisfied and most empirical studies rejected them.37 Even though there is very little empirical support for full Ricardian equivalence, the degree to which the proposition is relevant is of interest to policy makers.
48. There is no empirical evidence in Turkey for full Ricardian equivalence, which suggests there is room to stimulate total saving by increasing public saving. Time series analyses of the determinants of private saving suggest that increasing Turkey’s public saving by 1 percent will reduce private saving by 0.38 to 0.68 percent.38 In international studies of different developed and developing countries over varying periods, the estimated Ricardian offset coefficients (the percentage decline in private saving as a result of a 1 percent increase in public saving) encompass a wide range. Lopez, Hebbel, and Serven (2000) report a range of -0.35 to -0.77. In previous estimations for Turkey, Ricardian offset coefficients similarly range from -0.42 to -0.77.39
49. On the revenue side, a correction to the current heavy reliance on indirect taxes might have a positive effect on saving. Indirect taxes in Turkey constitute about 70 percent of total tax revenues, up from 60 percent in the 1990s. This is a reflection of the informal economy that is observable throughout the value chain. For low- and middle-income households that have little flexibility to adjust their consumption, increased indirect taxes imply a higher cost of consumption (higher prices) and thus lower savings, and underreporting of revenues leads to a loss of revenues for the government and thus lower savings. As a result, making the economy more formal and tax composition more balanced is likely to promote savings.
50. Increased public interest payments lead to higher private saving. Throughout the 1990s real interest rates in Turkey rose dramatically and the interest payments to GDP ratio climbed to unsustainable heights. High real interest rates and high transfers in the form of interest payments severely affected economic decisions in Turkey for a long time. The empirical analysis shows that the ratio of interest payments to GDP has a positive and statistically significant relationship to private saving in Turkey. Furthermore, disaggregated, the estimates suggest that this relationship can be attributed to domestic rather than foreign interest payments. This result supports the findings that identified interest rates as a major determinant of private saving.
37 See Corbo and Schmidt-Hebbel (1991) for a detailed literature survey. 38 Simulations using the Loayza, Schmidt-Hebbel, Serven model suggest that the decline of private saving due to an increase in public saving
is not very significant: had the public saved at its 1998 rate, private saving would have been less than 1 percentage points higher than the actual 2008 rate. That is, the short- and medium-run Ricardian offset coefficient is very small, which suggests that public savins is a useful tool to increase the national saving rate.
39 Van Rijckeghem (2010) finds an offset coefficient of -0.63 in her key specification; Metin, Özcan, Günay, Ertaç (2003) finds an offset coefficient between –0.42 and –0.66; IMF (2007) finds an offset coefficient between –0.72 and –0.77.
DETERMINANTS OF SAVING IN TURKEY22
51. In general, the quality of fiscal adjustment is critical for channeling increased public saving into growth-enhancing activities. Because increased saving generated by cutting productive investment will hurt long-term growth, the negative impact of the decline in investments will counteract the potential contribution to growth of increased domestic savings. There is evidence, especially from OECD countries,40 that fiscal consolidations that relied primarily on tax increases and cuts in public investment have not been sustainable because higher tax revenues eventually boosted spending, and maintenance and spending on backbone infrastructure could not be postponed forever. By contrast, fiscal consolidations underpinned by structural public spending cuts have had more lasting effects because they tackled types of spending that show a strong upward drift. Countries that implemented sustained fiscal adjustments grew faster over the medium term because measures perceived as lasting pushed down real interest rates that stimulated investment. Moreover, such measures may have been perceived as implying a reduction in the future tax burden, thus generating positive wealth effects, and may have also reduced precautionarysaving by resolving uncertainties about future fiscal policy.
52. The extent to which the government pays for public services like education and health may also affect private saving. Higher proportional payments for such services by households will increase consumption spending and reduce savings. Privatization of public enterprises and the increasing number of private schools, universities, and hospitals since the early 2000s may have raised the private consumption rate.
4.2 Household Saving
53. Earlier this section argued, based on an analysis of total private saving, that lower interest rates and inflation put pressure on private saving and improvement in private disposable income and a decline in the young age dependency ratio promoted it. More favorable terms of trade and increased female labor force participation also enhance the saving rate. In what follows the objective is to identify the most effective policies for stimulating Turkish household saving (conceptually part of private saving but derived from a separate data source).
54. Empirical studies have identified a variety of determinants of household savings.41
Browning and Lusardi (1996) provide a comprehensive review of the household savings literature
and make several useful observations about empirically estimating saving functions. They argue that
the variety of determinants of savings implies significant heterogeneity between households. The
determinants they cite are the discount factor, demographics, the real interest rate, and variation in
consumption and liquidity constraints. Browning and Lusardi (1996) emphasize that while it is easy to
identify savers in many societies, it is not trivial to establish the motivation for savings empirically.
40 See Alesina & Peroti (1997), Alesina & Ardagna (1998), and Peroti (1996). 41 A summary of the literature on household savings in Turkey can be found in the background work for this study.
DETERMINANTS OF SAVING IN TURKEY 23
55. Country-specific studies point to some common determinants of household savings.42 These determinants are consistent with those identified for Turkey in Section 2: First, income has been found to be a key determinant of savings for Chile, the Philippines, and Estonia, among others. Second, education is a major contributor to savings in Chile, Pakistan and Latin America and East Asia generally. It has also been argued that lower fertility rates and the existence of extended families increase saving rates in East Asia. Finally, precautionary saving to cover health risk was a key factor in the rise in saving rates in China for 1992–2005.
4.2.1 Determinants
56. Turkish households have a strong precautionary motive for savings. There is ample evidence of precautionary saving (building reserves against unforeseeable contingencies) based on Turkey specific empirical analysis (see, for example, Ceritoğlu, 2009) and focus group discussions with Turkish households. The following are indications for the existence of precautionary motives among Turkish households,
i. Households in which the head is an employer or self-employed save more. Entrepreneurs may face more volatile income streams, which reinforce precautionary saving.
ii. Households with higherelderlydependency ratios also save more because the elderly have higher health risks and consequently higher health expenditures. On the other hand, households where pension payments constitute a higher fraction of income save less. This is due to the fact that retirement benefits also provide free health coverage to the retirees, allowing these households to save less.
iii. Households in which at least one member holds a greencard save less. Green cards entitle holders to free health care, relaxing the need for precautionary savings. The fact that green card is a means-tested program makes it difficult to disentangle the income effects and weaker precautionary motives. However, households where the head is employed in the informal sector and where there is at least one green card save less than those households where the head is employed in the informal sector and there are no green cards. In other words, for similar levels of household income, green card decreases savings, building a case for precautionary savings.
iv. As with the regression analysis, the precautionary motive is the reason cited most in focusgroup discussions. Two common rainy day examples were health risks and unemployment. Some participants said they were depending on social security schemes to pay for health care but most agreed they needed to save because the health services provided by the social security system were of low quality.
Savings for Rainy Days“Especially if you work in the private sector [you need to save more], you leave home to go to work in the morning, but when you get there, you might not have a job any more” (Denizli, wage earner, male)
“You should have money on the side for a rainy day. That is why people actually save. What happens if I get sick, if something happens, if I need to have surgery?” (Istanbul, self-employed, male)
42 This paragraph relies on the background paper by Aktaş et al. (2010) and refers to the work of Kulikov, Paabut and Staehr (2007), Butel-mann and Gallego (2000), Burney and Khan, (1992) Bersales et al. (2006), Székely and Attanasio (2000) and Chamon and Prasad (2008).
DETERMINANTS OF SAVING IN TURKEY24
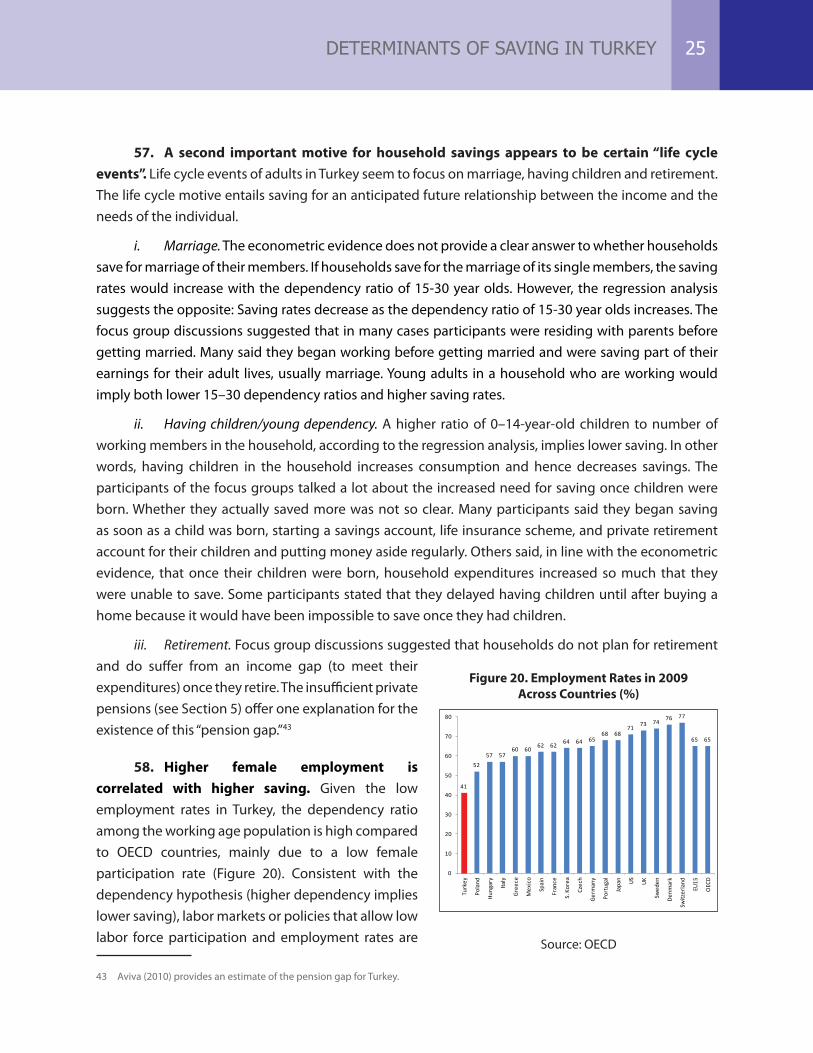
57. A second important motive for household savings appears to be certain “life cycle events”. Life cycle events of adults in Turkey seem to focus on marriage, having children and retirement. The life cycle motive entails saving for an anticipated future relationship between the income and the needs of the individual.
i. Marriage. The econometric evidence does not provide a clear answer to whether households save for marriage of their members. If households save for the marriage of its single members, the saving rates would increase with the dependency ratio of 15-30 year olds. However, the regression analysis suggests the opposite: Saving rates decrease as the dependency ratio of 15-30 year olds increases. The focus group discussions suggested that in many cases participants were residing with parents before getting married. Many said they began working before getting married and were saving part of their earnings for their adult lives, usually marriage. Young adults in a household who are working would imply both lower 15–30 dependency ratios and higher saving rates.
ii. Havingchildren/youngdependency. A higher ratio of 0–14-year-old children to number of working members in the household, according to the regression analysis, implies lower saving. In other words, having children in the household increases consumption and hence decreases savings. The participants of the focus groups talked a lot about the increased need for saving once children were born. Whether they actually saved more was not so clear. Many participants said they began saving as soon as a child was born, starting a savings account, life insurance scheme, and private retirement account for their children and putting money aside regularly. Others said, in line with the econometric evidence, that once their children were born, household expenditures increased so much that they were unable to save. Some participants stated that they delayed having children until after buying a home because it would have been impossible to save once they had children.
iii. Retirement. Focus group discussions suggested that households do not plan for retirement and do suffer from an income gap (to meet their expenditures) once they retire. The insufficient private pensions (see Section 5) offer one explanation for the existence of this “pension gap.”43
58. Higher female employment is correlated with higher saving. Given the low employment rates in Turkey, the dependency ratio among the working age population is high compared to OECD countries, mainly due to a low female participation rate (Figure 20). Consistent with the dependency hypothesis (higher dependency implies lower saving), labor markets or policies that allow low labor force participation and employment rates are
43 Aviva (2010) provides an estimate of the pension gap for Turkey.
DETERMINANTS OF SAVING IN TURKEY 25
Figure 20. Employment Rates in 2009 Across Countries (%)
41
5257 57
60 60 62 62 64 64 6568 68
71 73 74 76 77
65 65
0
10
20
30
40
50
60
70
80
Turk
ey
Pola
nd
Hung
ary
Italy
Gree
ce
Mex
ico
Spai
n
Fran
ce
S. K
orea
Czec
h
Germ
any
Port
ugal
Japa
n US UK
Swed
en
Denm
ark
Switz
erla
nd
EU15
OEC
D
Source: OECD
expected to suppress saving rates. Especially in Turkey, where the share of young population and the
number of children in school is high but the employment rate is low, the average consumption rate is
expected to be high controlling for income. The micro data analysis shows that the ratio of working
females has significant and positive effects on saving rates. Holding everything else constant including
income, households in which more women work, save more. This may have important implications
for policy in Turkey, especially because the female labor force participation rate is extremely low in
Turkey. Similarly, in the survey of consumer finances44, the probability of dissaving declines significantly
with the number of employees in the family. The focus group discussions also provide evidence that
supports this finding. More than males, female focus group participants emphasized the need to save
for their children’s college and other expenditures. It appears that the stronger the voice women have
in household finances, the more they save for their children
Women, Especially Working Women, Tend to Save More
“Girls need to have savings on the side. That is how I was taught to save. I saved more after I got married. I invested in bangles, in gold. I provide for the children’s future.” (Denizli, wage earner, female)
“My mother likes gold. When I need money, for example to buy a new car, she will give me gold instead of withdrawing from the savings account in the bank.” (Antep, self-employed, male)
“I used to give the money I saved to my father if he needed it or to my mother. But we usually keep it a secret from our fathers. We give them to our mothers so that they save it and spend it on us later on.” (Adana, self-employed, female)
59. Cross-country panel data estimations confirm the highly positive association between employment rate (and the female labor force participation rate) and saving rates. Panel
regressions45 suggest that high female labor force participation increases saving. In this analysis, a 10
percentage point increase in female labor force participation corresponds to a saving rate rise of about
1.5 percentage points.
60. Education has a positive but limited effect on saving rates, when controlled for income effects. The education level of the household head and the average education level of household
members have similar effects on the saving rates. Even though these effects are smaller in comparison
to other variables, they are surprisingly consistent across years, both in terms of magnitude and
significance. Kırdar and Cilasun (2009) also find a consistently positive relationship between education
levels and saving rates.
44 See Box 3.45 The panel regressions use data from the World Bank DDP database for about 150 countries for 1980–2008. Shares of industrial value
added, per capita income, GDP growth rate, young dependency ratio, female participation rate, terms of trade, CPI inflation rate, deposit interest rates, private sector credit-GDP ratio, and time trend are used as independent variables in explaining saving rates.
DETERMINANTS OF SAVING IN TURKEY26
61. Home ownership appears to be the single most important objective of household saving. The regression results show that ownership of a home and of a second property are positively correlated with saving rates. Since very few households owe on their homes, households appear to save to buy these items rather than take out mortgages.46 Households that save more are probably more likely to save enough to buy homes, explaining the positive relation between home ownership and saving rates. Similarly, many focus group participants stated that they were saving to buy homes. They said they save in small amounts and in different saving alternatives until they have enough for the down payment. Most also said they would buy property if their incomes were to double permanently; they consider it a way to invest. The general belief is that real estate never loses value and can always be rented. It is generally believed to yield the highest return of all alternatives.
62. There is indication of a bequest motive. The non-decreasing age profile of saving in the micro-level data may indicate bequest motives. Households may save more as the head of household ages if they would like to bequeath something to their younger members. Focus group participants were divided on this issue: some would like to leave something behind, and some believe their children should take care of themselves. Those with a bequest motive mainly want to bequeath a home. Some plan to leave their homes to their children; others try to buy them separate homes. International evidence also suggests that increasing life and health expenditure uncertainty explain why saving rates of elderly and retired people remain high.
Buying Homes to Live in, Buying Homes for Children
“I bought my home in 2004 for TL 45,000. Now it is worth TL 250,000. No bank in the world will pay this return for cash.” (Istanbul, wage earner, male)
“My children should earn and buy, just like I earned and bought.” (Antep, wage earner, female)
“[If my monthly pay were to double permanently] I would buy real estate. I have two daughters; I would want both of them to have a home.” (Istanbul, wage earner, male)
“We would like to bequeath a home if not a business. Most probably we will not be able to bequeath a lot of money. Even if they work for minimum wage, they will be able to get by if they do not have to pay rent.” (Adana, wage earner, female)
4.2.2 Portfolio Choice
63. The previous sub-section discussed the main saving motives of Turkish households. There is evidence for precautionary savings, which largely explains the drop in the private saving rate in the 2000s. Certain life cycle events, such as having children, and participation of female members of the household into the work force also affect household saving behavior. There is also some indication of a bequest motive. Having explored determinants of household saving behavior, it is informative to investigate household portfolio allocation—how they make use of their limited savings. The discussion will first focus on allocation of savings between assets within the financial system and those outside (under the mattress) and nonfinancial; it will then decompose savings inside the financial system.
46 In the raw data, out of about 5,500 home owners each year, 200-300 households owe on their current homes.
DETERMINANTS OF SAVING IN TURKEY 27
Financial vs. Nonfinancial Holdings and Saving Outside the Financial System
64. The portfolio allocation of Turkish households sheds some light on saving attitudes. A survey of consumer finances (SCF) was first conducted in Turkey in 2008 and is used in this report to complement analysis based on the HBS and focus group discussions.47 The SCF (Box 3) elicited rich information on assets, liabilities, income, attitudes toward saving and borrowing, and other financial characteristics of households in Turkey.
Box 3. The Survey of Consumer Finances*
The first SCF in Turkey was conducted in 2008. It found a comprehensive distribution of household assets and liabilities. The SCF combines portfolio data with information on demographics and income of each household and on household attitudes toward borrowing, lending, and liquidity.
Household data collected by Turkstat are more oriented toward income and consumption expenditures and do not include detailed information on assets and liabilities.
The Turkish SCF is one of the most detailed surveys of household portfolios outside developed countries. The design is similar to that of the SCF in the United States, the Survey on Household Income and Wealth in Italy, and the DNB Household Survey in the Netherlands.
The SCF is a comprehensive survey of 4,432 households. Like most surveys of consumer finances, it has a dual-frame sample design: A randomly selected area-probability sample of 4,031 households was interviewed in October-December 2007. It was supplemented by a sample of 401 high-income households representing the top 5 percent of the income distribution that was interviewed in January 2008. Samples were weighted to construct statistics. Details of the questionnaire, survey design, and calculation of the sample weights can be found in Adaman, Kaytaz, and Yılmazer (2008).
* The SCF in Turkey was undertaken by Fikret Adaman, Mehmet Kaytaz, and Tansel Yilmazer pursuant to a grant from the Scientific and Technological Research Council of Turkey (TUBITAK).
65. Households may invest in either financial or nonfinancial assets. Financial assets include transaction accounts in Turkish Lira (TL) and foreign currency, term deposits in TL and foreign currency, gold, savings outside of financial institutions, loans to others (friends, family, and businesses), and other financial assets (mutual funds, public fixed-income securities, Eurobonds, private fixed-income securities, stocks, shares in listed and unlisted companies, and savings in private pension plans). Nonfinancial assets include primary residence, other residential property, other real estate and land/farm, business, vehicles and other nonfinancial assets. Liabilities include loans utilized to purchase nonfinancial assets, credit card liabilities, installment debt and other debt (loans from friends/family, bank credit for personal use, loans from the employer and liabilities for utilities and taxes).
47 HBSs provide very little information on portfolio choice. There are no direct questions on gold or money under the mattress. Even though there are questions in the survey on life insurance, private health insurance and private retirement insurance ownership, there are very few households who seem to declare using them in the micro level data. However, in the focus group discussions, there is indication of wider usage.
DETERMINANTS OF SAVING IN TURKEY28
66. The fraction of households that have nonfinancial assets is higher than those holding financial assets. In the SCF about 67 percent of households reported having nonfinancial assets, usually a primary residence (53.5 percent), a vehicle (25.6 percent), and other property and land (10.1 percent)48, while only about 30 percent of households reported that they hold any type of financial assets.
67. As households grow older, resources are increasingly dedicated to accumulation of nonfinancial rather than financial assets. While 48 percent of households headed by individuals younger than 30 had some nonfinancial assets, 82 percent of households headed by individuals older than 60 had such assets. Both types of assets increase with household income and education of the household head, consistent with the finding from analysis of the HBS that saving increases with income and education. Across net worth groups there is significant inequality in terms of holdings of financial and nonfinancial assets. Holdings of gold decrease with the age of the household head, but age has no effect on the amount of assets held in financial institutions. For example, gold accumulated at the beginning of the lifecycle might be used in emergencies or turned into down payments on real estate.
68. At higher incomes households have a wider range of nonfinancial assets. The percentage of households that report having different types of nonfinancial assets increases with income. In terms of asset types, households with higher incomes were more likely to have secondary homes, other property, and land and businesses.
69. Households in Turkey seem to spend significant amounts on consumer durables. The median amount spent on durables is equal to the median amount of financial assets and is about one-third of median annual household income. Spending on consumer durables increases with household income, education of household head, and net worth. Borrowing rather than accumulated savings seems to be used for purchasing consumer durables.
70. Focus group participants declare a considerable amount of saving under the mattress. Informal instruments of savings are typically gold, cash and foreign currency held under the pillow, loans to family/friends and business, rather than such formal savings as transaction accounts and time deposits. Participants of focus groups declared to have a significant amount of saving under the mattress that does not enter the banking system. The money under the mattress is usually in the form of local currency, foreign currency, gold coins (for both men and women) and jewelry (mainly for women).
71. There is evidence that gold is popular for savings in Turkey. About 30 percent of households bought gold, jewelry, or watches in the past year. Many focus group participants started saving in gold and still do so; only a few have “gold accounts.” The SCF found that 14.8 percent of households have savings in gold. Policies to stimulate saving or attract savings into the financial sector could take the popularity of gold into consideration.
48 The homeownership rate in Turkey was 70.9 percent in 1994 and 71.95 percent in 2003 (TurkStat, 1994; Sarioğlu, 2007). In 2000, about 64 percent of the population resided in urban areas, where in 1994 the homeownership rate was 59.0 percent (TurkStat, 1994). In 2008, an estimated 70.5 percent lived in urban areas (TurkStat, 2008). The increase in households living in urban areas caused a decrease in home-ownership. Yılmazer, Adaman, and Kaytaz (2009) investigate the impact of financial development on homeownership.
DETERMINANTS OF SAVING IN TURKEY 29
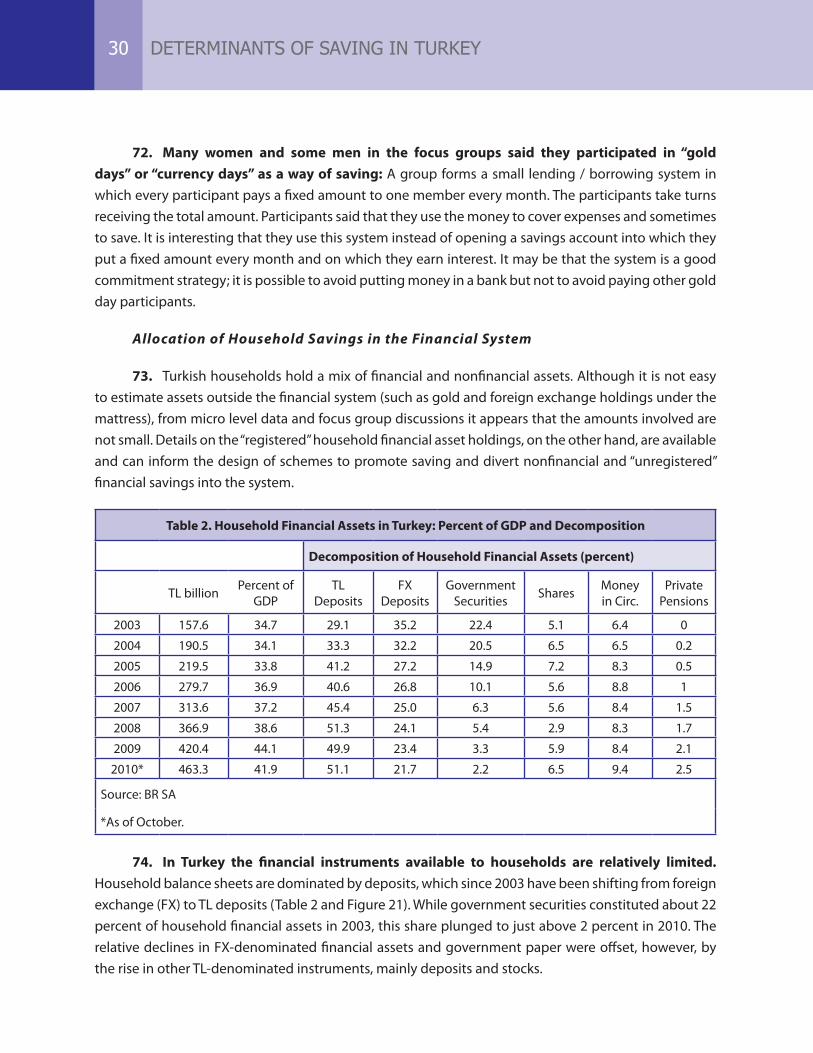
72. Many women and some men in the focus groups said they participated in “gold days” or “currency days” as a way of saving: A group forms a small lending / borrowing system in which every participant pays a fixed amount to one member every month. The participants take turns receiving the total amount. Participants said that they use the money to cover expenses and sometimes to save. It is interesting that they use this system instead of opening a savings account into which they put a fixed amount every month and on which they earn interest. It may be that the system is a good commitment strategy; it is possible to avoid putting money in a bank but not to avoid paying other gold day participants.
Allocation of Household Savings in the Financial System
73. Turkish households hold a mix of financial and nonfinancial assets. Although it is not easy to estimate assets outside the financial system (such as gold and foreign exchange holdings under the mattress), from micro level data and focus group discussions it appears that the amounts involved are not small. Details on the “registered” household financial asset holdings, on the other hand, are available and can inform the design of schemes to promote saving and divert nonfinancial and “unregistered” financial savings into the system.
Table 2. Household Financial Assets in Turkey: Percent of GDP and Decomposition
Decomposition of Household Financial Assets (percent)
TL billion Percent of GDP
TL Deposits
FX Deposits
Government Securities Shares Money
in Circ.Private
Pensions
2003 157.6 34.7 29.1 35.2 22.4 5.1 6.4 0
2004 190.5 34.1 33.3 32.2 20.5 6.5 6.5 0.2
2005 219.5 33.8 41.2 27.2 14.9 7.2 8.3 0.5
2006 279.7 36.9 40.6 26.8 10.1 5.6 8.8 1
2007 313.6 37.2 45.4 25.0 6.3 5.6 8.4 1.5
2008 366.9 38.6 51.3 24.1 5.4 2.9 8.3 1.7
2009 420.4 44.1 49.9 23.4 3.3 5.9 8.4 2.1
2010* 463.3 41.9 51.1 21.7 2.2 6.5 9.4 2.5
Source: BR SA
*As of October.
74. In Turkey the financial instruments available to households are relatively limited. Household balance sheets are dominated by deposits, which since 2003 have been shifting from foreign exchange (FX) to TL deposits (Table 2 and Figure 21). While government securities constituted about 22 percent of household financial assets in 2003, this share plunged to just above 2 percent in 2010. The relative declines in FX-denominated financial assets and government paper were offset, however, by the rise in other TL-denominated instruments, mainly deposits and stocks.
DETERMINANTS OF SAVING IN TURKEY30
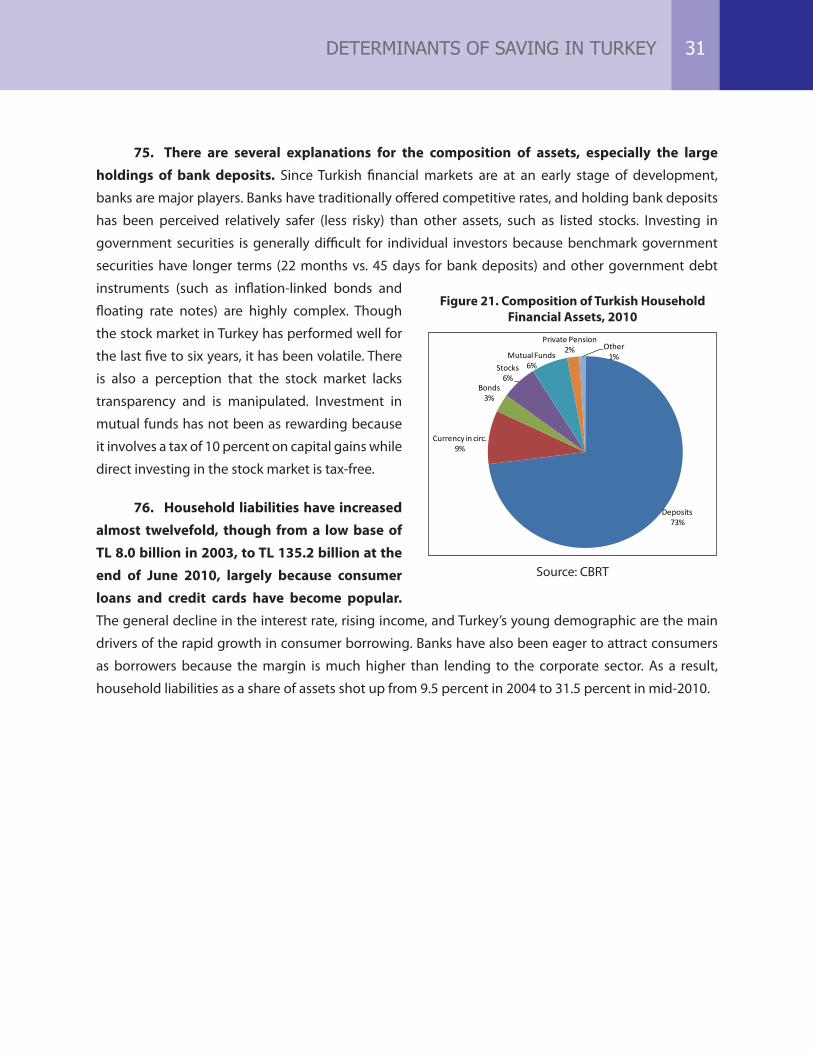
75. There are several explanations for the composition of assets, especially the large holdings of bank deposits. Since Turkish financial markets are at an early stage of development,
banks are major players. Banks have traditionally offered competitive rates, and holding bank deposits
has been perceived relatively safer (less risky) than other assets, such as listed stocks. Investing in
government securities is generally difficult for individual investors because benchmark government
securities have longer terms (22 months vs. 45 days for bank deposits) and other government debt
instruments (such as inflation-linked bonds and
floating rate notes) are highly complex. Though
the stock market in Turkey has performed well for
the last five to six years, it has been volatile. There
is also a perception that the stock market lacks
transparency and is manipulated. Investment in
mutual funds has not been as rewarding because
it involves a tax of 10 percent on capital gains while
direct investing in the stock market is tax-free.
76. Household liabilities have increased almost twelvefold, though from a low base of TL 8.0 billion in 2003, to TL 135.2 billion at the end of June 2010, largely because consumer loans and credit cards have become popular. The general decline in the interest rate, rising income, and Turkey’s young demographic are the main
drivers of the rapid growth in consumer borrowing. Banks have also been eager to attract consumers
as borrowers because the margin is much higher than lending to the corporate sector. As a result,
household liabilities as a share of assets shot up from 9.5 percent in 2004 to 31.5 percent in mid-2010.
Figure 21. Composition of Turkish HouseholdFinancial Assets, 2010
Deposits73%
Currency in circ. 9%
Bonds3%
Stocks6%
Mutual Funds6%
Private Pension 2% Other
1%
Source: CBRT
DETERMINANTS OF SAVING IN TURKEY 31
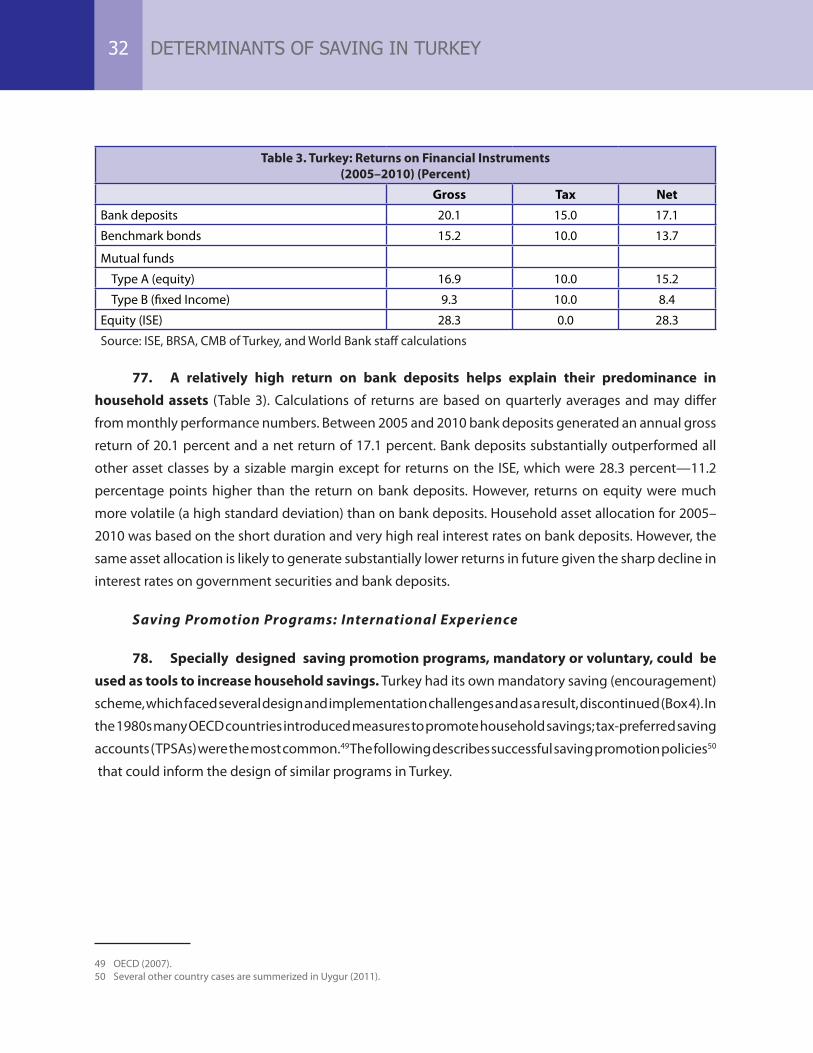
Table 3. Turkey: Returns on Financial Instruments (2005–2010) (Percent)
Gross Tax Net
Bank deposits 20.1 15.0 17.1
Benchmark bonds 15.2 10.0 13.7
Mutual funds
Type A (equity) 16.9 10.0 15.2
Type B (fixed Income) 9.3 10.0 8.4
Equity (ISE) 28.3 0.0 28.3
Source: ISE, BRSA, CMB of Turkey, and World Bank staff calculations
77. A relatively high return on bank deposits helps explain their predominance in household assets (Table 3). Calculations of returns are based on quarterly averages and may differ
from monthly performance numbers. Between 2005 and 2010 bank deposits generated an annual gross
return of 20.1 percent and a net return of 17.1 percent. Bank deposits substantially outperformed all
other asset classes by a sizable margin except for returns on the ISE, which were 28.3 percent—11.2
percentage points higher than the return on bank deposits. However, returns on equity were much
more volatile (a high standard deviation) than on bank deposits. Household asset allocation for 2005–
2010 was based on the short duration and very high real interest rates on bank deposits. However, the
same asset allocation is likely to generate substantially lower returns in future given the sharp decline in
interest rates on government securities and bank deposits.
Saving Promotion Programs: International Experience
78. Specially designed saving promotion programs, mandatory or voluntary, could be used as tools to increase household savings. Turkey had its own mandatory saving (encouragement)
scheme, which faced several design and implementation challenges and as a result, discontinued (Box 4). In
the 1980s many OECD countries introduced measures to promote household savings; tax-preferred saving
accounts (TPSAs) were the most common.49 The following describes successful saving promotion policies50
that could inform the design of similar programs in Turkey.
49 OECD (2007). 50 Several other country cases are summerized in Uygur (2011).
DETERMINANTS OF SAVING IN TURKEY32
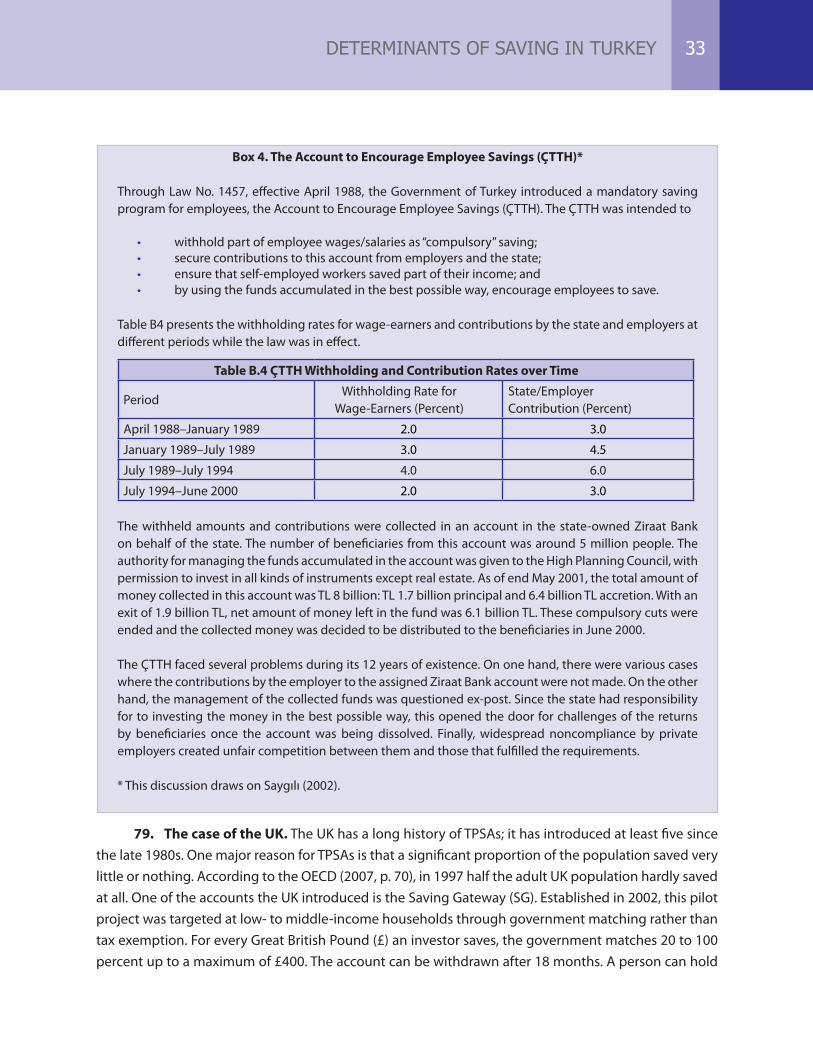
Box 4. The Account to Encourage Employee Savings (ÇTTH)*
Through Law No. 1457, effective April 1988, the Government of Turkey introduced a mandatory saving program for employees, the Account to Encourage Employee Savings (ÇTTH). The ÇTTH was intended to
• withhold part of employee wages/salaries as “compulsory” saving;• secure contributions to this account from employers and the state; • ensure that self-employed workers saved part of their income; and• by using the funds accumulated in the best possible way, encourage employees to save.
Table B4 presents the withholding rates for wage-earners and contributions by the state and employers at different periods while the law was in effect.
Table B.4 ÇTTH Withholding and Contribution Rates over Time
Period Withholding Rate for
Wage-Earners (Percent)State/EmployerContribution (Percent)
April 1988–January 1989 2.0 3.0
January 1989–July 1989 3.0 4.5
July 1989–July 1994 4.0 6.0
July 1994–June 2000 2.0 3.0
The withheld amounts and contributions were collected in an account in the state-owned Ziraat Bank on behalf of the state. The number of beneficiaries from this account was around 5 million people. The authority for managing the funds accumulated in the account was given to the High Planning Council, with permission to invest in all kinds of instruments except real estate. As of end May 2001, the total amount of money collected in this account was TL 8 billion: TL 1.7 billion principal and 6.4 billion TL accretion. With an exit of 1.9 billion TL, net amount of money left in the fund was 6.1 billion TL. These compulsory cuts were ended and the collected money was decided to be distributed to the beneficiaries in June 2000.
The ÇTTH faced several problems during its 12 years of existence. On one hand, there were various cases where the contributions by the employer to the assigned Ziraat Bank account were not made. On the other hand, the management of the collected funds was questioned ex-post. Since the state had responsibility for to investing the money in the best possible way, this opened the door for challenges of the returns by beneficiaries once the account was being dissolved. Finally, widespread noncompliance by private employers created unfair competition between them and those that fulfilled the requirements.
* This discussion draws on Saygılı (2002).
79. The case of the UK. The UK has a long history of TPSAs; it has introduced at least five since the late 1980s. One major reason for TPSAs is that a significant proportion of the population saved very little or nothing. According to the OECD (2007, p. 70), in 1997 half the adult UK population hardly saved at all. One of the accounts the UK introduced is the Saving Gateway (SG). Established in 2002, this pilot project was targeted at low- to middle-income households through government matching rather than tax exemption. For every Great British Pound (£) an investor saves, the government matches 20 to 100 percent up to a maximum of £400. The account can be withdrawn after 18 months. A person can hold
DETERMINANTS OF SAVING IN TURKEY 33
only one account. The saver can withdraw the funds, but unless the withdrawn amount is redeposited it does not earn government contributions. To open an SG account, the investor must be of working age and satisfy certain conditions.51 A second program is the Child Trust Fund (CTF), launched in January 2005; the government provides a saving bonus of £ 250 to open an account and an additional £ 250 if family income is low. The objectives of the CTF are to (i) help people understand the benefits of saving and investing and contribute to their financial education; (ii) encourage parents and children to develop saving habits and engage with financial institutions; and (iii) ensure that in future all children have a financial asset at the start of their adult life. No taxes are paid on CTF. There is a maximum of £ 1,200 a year for contributions. Withdrawals of funds before the age of 18 are not allowed but thereafter withdrawals are tax-free.
80. The UK TPSAs have made many positive contributions, according to Collard and McKay (2006). First, the schemes encouraged participants to save, and to save regularly. A large proportion of SG participants said they tended to put money away for the longer term and to continue to save regularly. Then, as money management skills improved, psychological, attitudinal, and other longer-term changes in behavior were observed. There was a notable shift in attitudes in favor of saving: over 50 percent of SG participants said they felt more financially secure; many also reported an increased propensity to plan for retirement.
81. In the US, states began to set up 529 Plans, also called Qualified Tuition Plans, in the late 1980s and early 1990s. The goal was to help families at all income levels set aside funds for higher education for their children and relatives. There is no beneficiary age limit. Contributions are not tax-deductible, but earnings on the accounts are tax-free. There are practically no limits on contributions; in many states contributions per beneficiary exceed USD 300,000. Qualified withdrawals for education expenses incurred during the year are tax-free. Nonqualified withdrawals of amounts in excess of education expenses are subject to income tax plus a 10 percent penalty.
82. With regard to TPSA effectiveness, the OECD (2007) reports the following:
i. Although wealthier households profit more from TPSAs, participation of low- and middle-income households is substantial.
ii. Contributions increase with the holder’s income. iii. Contributions as a percent of income are highest for low-income earners. iv. It is likely that the effect of TPSAs on saving lies between the hypothesis that no 529 deposits
are new saving and the hypothesis that all 529 deposits are new saving. The data indicate that TPSAs other than educational plans create new saving when moderate-income households participate.
v. How much TPSAs cost depends on whether incentives are granted through tax credits or exemption from tax of accrued earnings. The most expensive accounts are those with a tax credit or payment of a generous saving bonus by the government.
51 For the first pilot eligibility depended on (i) having children, with annual household earnings less than £15,000; (ii) disability, with annual household earnings of less than £ 15,000; (iii) neither of the above but annual household earnings of less than £11,000; or (iv) being unemployed and receiving benefits. For the second pilot, eligibility criteria were (i) qualifying for and receiving unemployment benefits; (ii) being employed and earning less than £25,000 annually with household earnings of less than £50,000.
DETERMINANTS OF SAVING IN TURKEY34
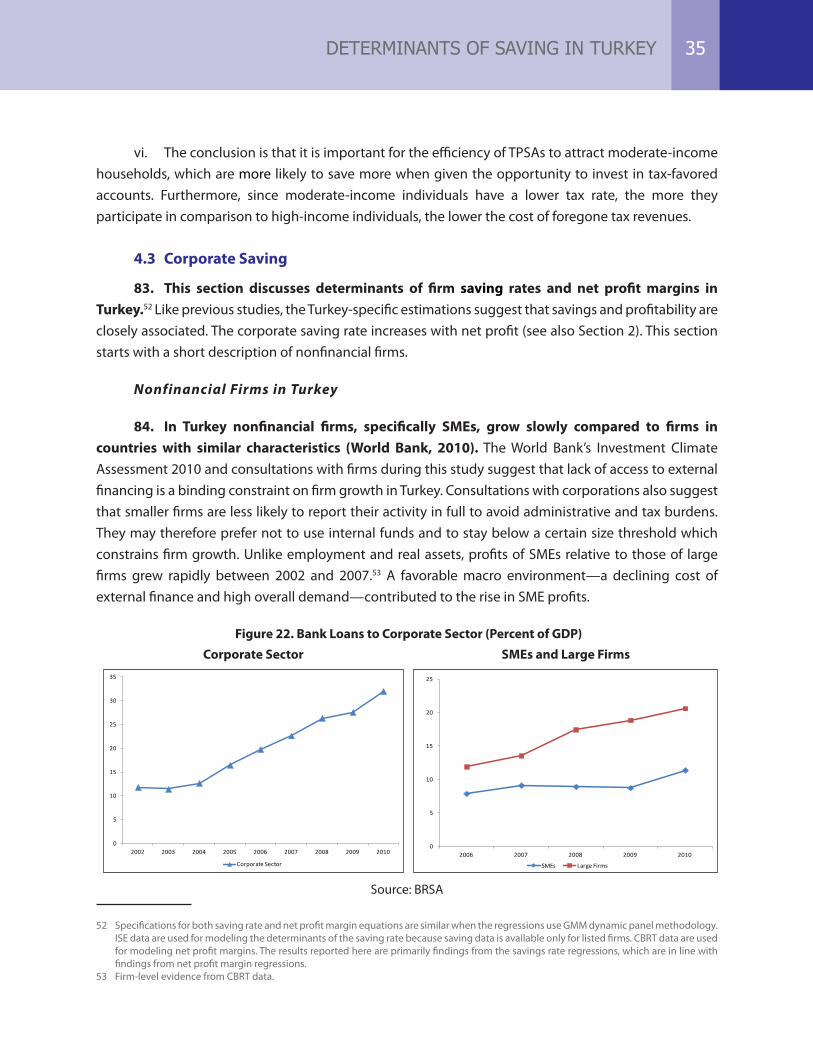
vi. The conclusion is that it is important for the efficiency of TPSAs to attract moderate-income households, which are more likely to save more when given the opportunity to invest in tax-favored accounts. Furthermore, since moderate-income individuals have a lower tax rate, the more they participate in comparison to high-income individuals, the lower the cost of foregone tax revenues.
4.3 Corporate Saving
83. This section discusses determinants of firm saving rates and net profit margins in Turkey.52 Like previous studies, the Turkey-specific estimations suggest that savings and profitability are closely associated. The corporate saving rate increases with net profit (see also Section 2). This section starts with a short description of nonfinancial firms.
Nonfinancial Firms in Turkey
84. In Turkey nonfinancial firms, specifically SMEs, grow slowly compared to firms in countries with similar characteristics (World Bank, 2010). The World Bank’s Investment Climate Assessment 2010 and consultations with firms during this study suggest that lack of access to external financing is a binding constraint on firm growth in Turkey. Consultations with corporations also suggest that smaller firms are less likely to report their activity in full to avoid administrative and tax burdens. They may therefore prefer not to use internal funds and to stay below a certain size threshold which constrains firm growth. Unlike employment and real assets, profits of SMEs relative to those of large firms grew rapidly between 2002 and 2007.53 A favorable macro environment—a declining cost of external finance and high overall demand—contributed to the rise in SME profits.
Figure 22. Bank Loans to Corporate Sector (Percent of GDP)
Corporate Sector SMEs and Large Firms
0
5
10
15
20
25
30
35
2002 2003 2004 2005 2006 2007 2008 2009 2010
Corporate Sector
0
5
10
15
20
25
2006 2007 2008 2009 2010
SMEs Large Firms
52 Specifications for both saving rate and net profit margin equations are similar when the regressions use GMM dynamic panel methodology. ISE data are used for modeling the determinants of the saving rate because saving data is available only for listed firms. CBRT data are used for modeling net profit margins. The results reported here are primarily findings from the savings rate regressions, which are in line with findings from net profit margin regressions.
53 Firm-level evidence from CBRT data.
DETERMINANTS OF SAVING IN TURKEY 35
Source: BRSA
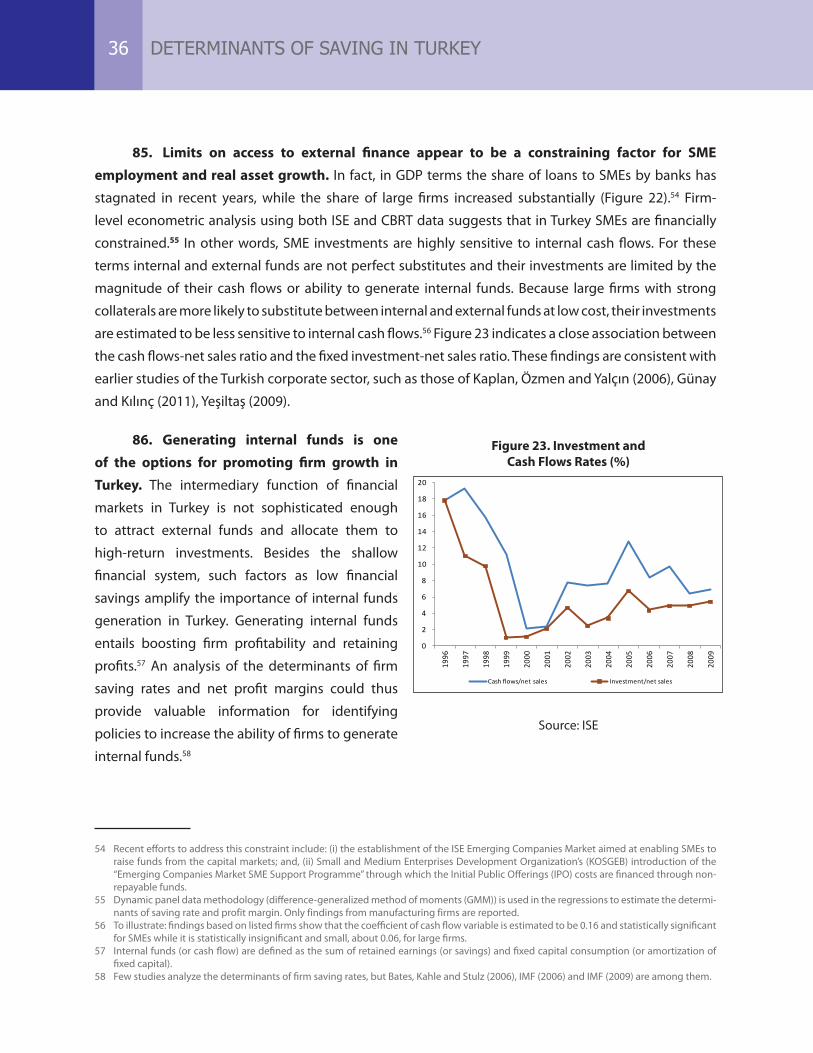
85. Limits on access to external finance appear to be a constraining factor for SME employment and real asset growth. In fact, in GDP terms the share of loans to SMEs by banks has
stagnated in recent years, while the share of large firms increased substantially (Figure 22).54 Firm-
level econometric analysis using both ISE and CBRT data suggests that in Turkey SMEs are financially
constrained.55 In other words, SME investments are highly sensitive to internal cash flows. For these
terms internal and external funds are not perfect substitutes and their investments are limited by the
magnitude of their cash flows or ability to generate internal funds. Because large firms with strong
collaterals are more likely to substitute between internal and external funds at low cost, their investments
are estimated to be less sensitive to internal cash flows.56 Figure 23 indicates a close association between
the cash flows-net sales ratio and the fixed investment-net sales ratio. These findings are consistent with
earlier studies of the Turkish corporate sector, such as those of Kaplan, Özmen and Yalçın (2006), Günay
and Kılınç (2011), Yeşiltaş (2009).
86. Generating internal funds is one of the options for promoting firm growth in Turkey. The intermediary function of financial
markets in Turkey is not sophisticated enough
to attract external funds and allocate them to
high-return investments. Besides the shallow
financial system, such factors as low financial
savings amplify the importance of internal funds
generation in Turkey. Generating internal funds
entails boosting firm profitability and retaining
profits.57 An analysis of the determinants of firm
saving rates and net profit margins could thus
provide valuable information for identifying
policies to increase the ability of firms to generate
internal funds.58
54 Recent efforts to address this constraint include: (i) the establishment of the ISE Emerging Companies Market aimed at enabling SMEs to raise funds from the capital markets; and, (ii) Small and Medium Enterprises Development Organization’s (KOSGEB) introduction of the “Emerging Companies Market SME Support Programme” through which the Initial Public Offerings (IPO) costs are financed through non-repayable funds.
55 Dynamic panel data methodology (difference-generalized method of moments (GMM)) is used in the regressions to estimate the determi-nants of saving rate and profit margin. Only findings from manufacturing firms are reported.
56 To illustrate: findings based on listed firms show that the coefficient of cash flow variable is estimated to be 0.16 and statistically significant for SMEs while it is statistically insignificant and small, about 0.06, for large firms.
57 Internal funds (or cash flow) are defined as the sum of retained earnings (or savings) and fixed capital consumption (or amortization of fixed capital).
58 Few studies analyze the determinants of firm saving rates, but Bates, Kahle and Stulz (2006), IMF (2006) and IMF (2009) are among them.
Figure 23. Investment and Cash Flows Rates (%)
0
2
4
6
8
10
12
14
16
18
20
1996
1997
1998
1999
2000
2001
2002
2003
2004
2005
2006
2007
2008
2009
Cash flows/net sales Investment/net sales
Source: ISE
DETERMINANTS OF SAVING IN TURKEY36
Firm Characteristics and Structure
87. Savings rate and net profit margin increase significantly with firm size. Large firms tend to save more, and firms that grow rapidly are more likely to save. This finding is consistent with the view that the corporate sector saves less in Turkey because of the large number of small firms, which often operate below optimal scale. In fact, the SME saving rate is more sensitive to asset size and the growth rate of assets. While policies that encourage mergers and enhancing firm capacity may contribute to savings and wealth accumulation, there may be other constraints on firm growth. In particular, consultations with corporations suggest that they tend to underreport activity due to the lack of inspection and the high administrative burdens in Turkey59. Also, because SMEs are mostly run by families, their growth is closely linked to intra-family relations. Firms may have difficulties in reaching optimal scale due to splits of capital among the second generation.
88. Indebtedness (defined as the leverage ratio) reduces firm savings and profit margins. A high premium increases the cost of external finance. As a result, the wedge between net profit margin and operating margin enlarges, leading to a lower saving rate when the dividend payout ratio is stable. However, for firms that are not financially constrained and thus have a low external financing premium, an increase in the leverage ratio affects saving less.60 Two opposite effects might emerge as financial constraints ease: (i) A decline in the external financing premium will increase net profit margins and savings rates for a given level of debt; or, (ii) it will encourage use of external finance and thus reduce the need for retaining earnings, which will lower saving rates. Improving conditions for access to external finance would not only help increase the supply of funds but also reduce their cost. This might improve net profit margins.
89. The more tangible assets firms have, the fewer funds they tend to retain. Firms with a high tangibility ratio are likely to be large firms. For large firms, it is easier to substitute external funds given their rich collaterals, which is a factor undermining the link between tangibility and the saving rate. This finding suggests that firms in general can push up savings rates and profit margins by investing in intangibles like R&D rather than in buildings and land.
The Macroeconomic and Fiscal Environment
90. Given Turkey’s shallow financial markets, the government’s fiscal position has serious implications for financially constrained firms in Turkey. In the past large public deficits often crowded out private activity. High public deficits or debt increased the cost of financial intermediation, reduced
the funds available to business (crowding out), threatened economic stability, and deteriorated investor
59 For details on informality in Turkey, see World Bank Turkey CEM, Informality: Causes, Consequences, Policies (2010).60 Estimation results confirm that the coefficient of leverage ratio in the regression of large firms is smaller in absolute terms than the coefficient in the regression using the ISE SME sample. It is often argued that large firms are not financially constrained because they are
rich in collateral options.
DETERMINANTS OF SAVING IN TURKEY 37
sentiment (Özatay, 2008; Kaplan, Özmen, and Yalçın, 2006). The evidence supports this argument: public
debt as a percent of GDP is estimated to have a negative and significant impact on saving rates and net
profit margins. Similarly, time series analysis shows that expansionary fiscal policy has a negative impact
on private saving and investment.
91. Financial depth is estimated to have a positive and significant impact on saving by manufacturing firms.61 These results support the argument that the saving rate and profit margins
increase with financial depth, which reflects the degree of financial system development. A developed
financial market is assumed to relax firm financing constraints by increasing the quantity and quality of
resources available to firms and by reducing capital market imperfections. Consequently, corporations
may benefit from using investment opportunities more effectively, which increases profitability.
92. GDP growth is estimated to have a positive impact on saving rates and profit margins, which suggests that demand conditions promote internal fund generation. The positive and
significant impact of GDP growth on firm profitability is consistent with the accelerator model of
investment (Fazzari, Hubbard, and Petersen 1988). An increase in real output accelerates profits (and thus
investments) for all firms, and in the CBRT sample the impact tends to be highest for small manufacturing
firms. This result supports the argument that policies to improve output and macroeconomic conditions
may have a conventional Keynesian multiplier/accelerator effect through firm profits and investments.
Box 5. Taxation of Retained Earnings in Chile
Saving and investment rates in Chile increased by some 10 percent of GDP in the late 1980s and 1990s. Hsieh and Parker (2007) explain that a main reason for this development and the accompanying growth boom was a reform that cut the corporate tax rate on retained corporate profits from about 50 percent to 10 percent between 1984 and 1986. Hsieh and Parker (2007) state that when firms face credit constraints, taxation of retained profits is more distortionary than taxation of dividends because taxation of retained profits draws down internal funds and thus lowers investment by the amount of the tax. Firms not so constrained can largely avoid retaining profits and fund investment through other means. They argue that by reducing the tax rate on retained earnings, the tax reform that started in 1984 in Chile increased the internal funds of credit-constrained firms and led to a significant rise in corporate savings and investments.
61 ISE and CBRT data produce slightly different results on whether size of firm is a factor in determining how financial depth affects net profit margins; while ISE data suggest financial depth has no significant impact on relatively small listed firms, using the CBRT data, the impact is significant and larger for small firms.
DETERMINANTS OF SAVING IN TURKEY38
93. Estimations for large and exporting firms suggest that corporate savings and net profit margins decline as the currency appreciates. The saving rates and profit margins of large manufacturing firms seem to be more sensitive to the real exchange rate. In addition, the negative impact of real appreciation increases with a firm’s export intensity. In other words, the saving rates and net profit margins of firms that have a high export share or are heavily involved in tradable activities seem to be more sensitive to the real exchange rate. This is consistent with previous studies suggesting that the impact of real exchange rates on corporate profitability and investments depends crucially on export and import intensities and net liability dollarization.62 The absence of firm-level data for import intensities and net liability dollarization (the difference between FX-denominated liabilities and assets) means that it is only possible to consider the competitiveness and domestic demand effects of real exchange rate changes. Consequently, the results discussed here may be biased upward for firms with higher import intensity or severe net liability dollarization. Morande (1998) argues that in Chile some tradable sectors benefited from currency depreciation, which induced them to save and invest. Hsieh and Parker (2007) argue that in Chile, along with reforms, a substantial currency depreciation had a positive effect on firm savings and investment.63 They also argue that the change in the tax treatment of retained earnings was central to promoting corporate savings in Chile (Box 5).
62 Real exchange rates may affect profitability and investments through domestic revenues if import competition or potential wealth effects shift demand for domestically produced goods. A real depreciation may be expansionary by increasing operating profits for firms that are primarily exporters by boosting relative competitiveness; the reverse may be true for import sectors or the firms that use imported inputs intensively (Campa and Goldberg, 1998). Real exchange rate depreciations may undermine the net financial position of firms with significant liability dollarization through the balance sheet effect (Galindo, Panizza and Schiantarelli, 2003 and Kesriyeli, Özmen and Yiğit, 2011).
63 There is mixed evidence on the role of real exchange rates on growth in the literature. According to Rodrik (2008) undervaluation of domestic currency stimulates economic growth especially in developing countries. In the same vein, Hausmann et al (2005) finds that depreciated real exchange rates are important in growth accelerations. On the contrary, according to Montiel and Serven (2008), the argument that real exchange rate depreciations will stimulate savings and growth is yet to be adequately supported empirically and analytically. Levy-Yeyati and Sturzenegger (2009) notes that “neomercantalist” views on the positive impact of depreciated real exchange rates on growth tends to be supported by data in the absence of financial dollarization. Under the Mundell-Flemming framework, devaluations are contractionary in financially dollarized economies due to the balance sheet effects (Frankel, 2005).
DETERMINANTS OF SAVING IN TURKEY 39
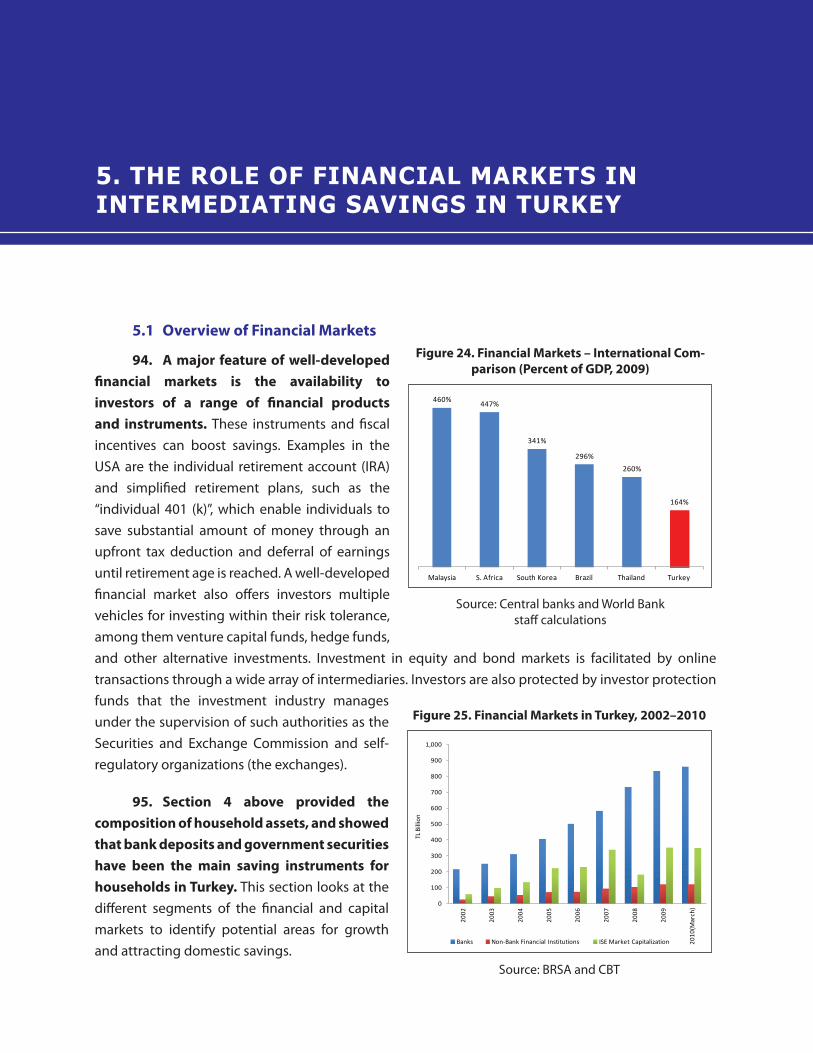
5.1 Overview of Financial Markets
94. A major feature of well-developed financial markets is the availability to investors of a range of financial products and instruments. These instruments and fiscal incentives can boost savings. Examples in the USA are the individual retirement account (IRA) and simplified retirement plans, such as the “individual 401 (k)”, which enable individuals to save substantial amount of money through an upfront tax deduction and deferral of earnings until retirement age is reached. A well-developed financial market also offers investors multiple vehicles for investing within their risk tolerance, among them venture capital funds, hedge funds, and other alternative investments. Investment in equity and bond markets is facilitated by online transactions through a wide array of intermediaries. Investors are also protected by investor protection funds that the investment industry manages under the supervision of such authorities as the Securities and Exchange Commission and self-regulatory organizations (the exchanges).
95. Section 4 above provided the composition of household assets, and showed that bank deposits and government securities have been the main saving instruments for households in Turkey. This section looks at the different segments of the financial and capital markets to identify potential areas for growth and attracting domestic savings.
Figure 24. Financial Markets – International Com-parison (Percent of GDP, 2009)
460% 447%
341%
296%
260%
164%
Malaysia S. Africa South Korea Brazil Thailand Turkey
Source: Central banks and World Bank staff calculations
Figure 25. Financial Markets in Turkey, 2002–2010
0
100
200
300
400
500
600
700
800
900
1,000
2002
2003
2004
2005
2006
2007
2008
2009
2010
(Mar
ch)
TL B
illio
n
Banks Non-Bank Financial Institutions ISE Market Capitalization
Source: BRSA and CBT
5. THE ROLE OF FINANCIAL MARKETS ININTERMEDIATING SAVINGS IN TURKEY
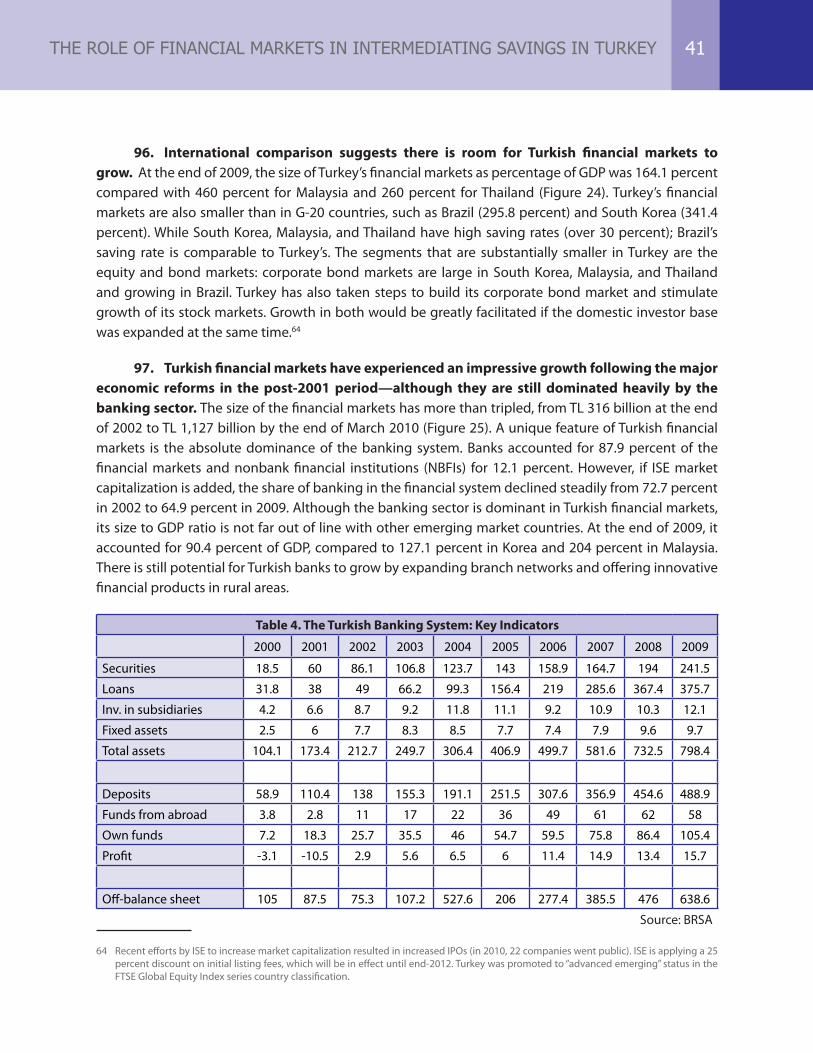
96. International comparison suggests there is room for Turkish financial markets to grow. At the end of 2009, the size of Turkey’s financial markets as percentage of GDP was 164.1 percent compared with 460 percent for Malaysia and 260 percent for Thailand (Figure 24). Turkey’s financial markets are also smaller than in G-20 countries, such as Brazil (295.8 percent) and South Korea (341.4 percent). While South Korea, Malaysia, and Thailand have high saving rates (over 30 percent); Brazil’s saving rate is comparable to Turkey’s. The segments that are substantially smaller in Turkey are the equity and bond markets: corporate bond markets are large in South Korea, Malaysia, and Thailand and growing in Brazil. Turkey has also taken steps to build its corporate bond market and stimulate growth of its stock markets. Growth in both would be greatly facilitated if the domestic investor base was expanded at the same time.64
97. Turkish financial markets have experienced an impressive growth following the major economic reforms in the post-2001 period—although they are still dominated heavily by the banking sector. The size of the financial markets has more than tripled, from TL 316 billion at the end of 2002 to TL 1,127 billion by the end of March 2010 (Figure 25). A unique feature of Turkish financial markets is the absolute dominance of the banking system. Banks accounted for 87.9 percent of the financial markets and nonbank financial institutions (NBFIs) for 12.1 percent. However, if ISE market capitalization is added, the share of banking in the financial system declined steadily from 72.7 percent in 2002 to 64.9 percent in 2009. Although the banking sector is dominant in Turkish financial markets, its size to GDP ratio is not far out of line with other emerging market countries. At the end of 2009, it accounted for 90.4 percent of GDP, compared to 127.1 percent in Korea and 204 percent in Malaysia. There is still potential for Turkish banks to grow by expanding branch networks and offering innovative financial products in rural areas.
Table 4. The Turkish Banking System: Key Indicators
2000 2001 2002 2003 2004 2005 2006 2007 2008 2009
Securities 18.5 60 86.1 106.8 123.7 143 158.9 164.7 194 241.5
Loans 31.8 38 49 66.2 99.3 156.4 219 285.6 367.4 375.7
Inv. in subsidiaries 4.2 6.6 8.7 9.2 11.8 11.1 9.2 10.9 10.3 12.1
Fixed assets 2.5 6 7.7 8.3 8.5 7.7 7.4 7.9 9.6 9.7
Total assets 104.1 173.4 212.7 249.7 306.4 406.9 499.7 581.6 732.5 798.4
Deposits 58.9 110.4 138 155.3 191.1 251.5 307.6 356.9 454.6 488.9
Funds from abroad 3.8 2.8 11 17 22 36 49 61 62 58
Own funds 7.2 18.3 25.7 35.5 46 54.7 59.5 75.8 86.4 105.4
Profit -3.1 -10.5 2.9 5.6 6.5 6 11.4 14.9 13.4 15.7
Off-balance sheet 105 87.5 75.3 107.2 527.6 206 277.4 385.5 476 638.6
Source: BRSA
64 Recent efforts by ISE to increase market capitalization resulted in increased IPOs (in 2010, 22 companies went public). ISE is applying a 25 percent discount on initial listing fees, which will be in effect until end-2012. Turkey was promoted to “advanced emerging” status in the FTSE Global Equity Index series country classification.
THE ROLE OF FINANCIAL MARKETS IN INTERMEDIATING SAVINGS IN TURKEY 41
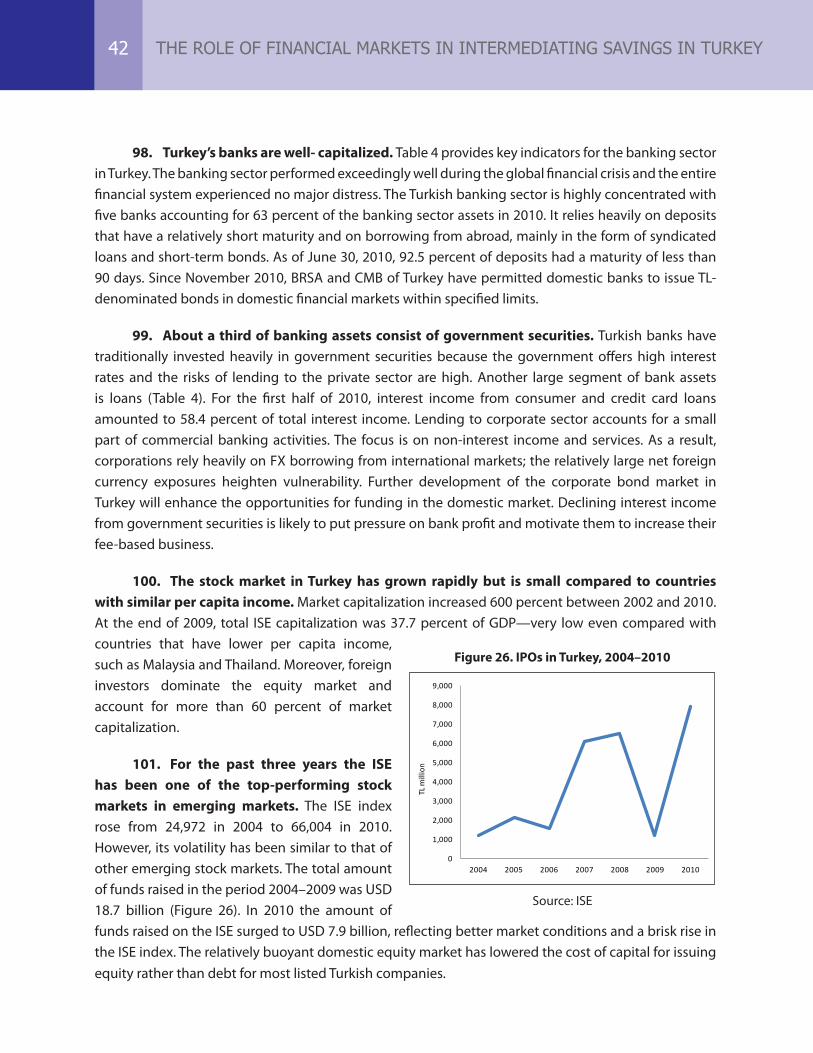
98. Turkey’s banks are well- capitalized. Table 4 provides key indicators for the banking sector in Turkey. The banking sector performed exceedingly well during the global financial crisis and the entire financial system experienced no major distress. The Turkish banking sector is highly concentrated with five banks accounting for 63 percent of the banking sector assets in 2010. It relies heavily on deposits that have a relatively short maturity and on borrowing from abroad, mainly in the form of syndicated loans and short-term bonds. As of June 30, 2010, 92.5 percent of deposits had a maturity of less than 90 days. Since November 2010, BRSA and CMB of Turkey have permitted domestic banks to issue TL-denominated bonds in domestic financial markets within specified limits.
99. About a third of banking assets consist of government securities. Turkish banks have traditionally invested heavily in government securities because the government offers high interest rates and the risks of lending to the private sector are high. Another large segment of bank assets is loans (Table 4). For the first half of 2010, interest income from consumer and credit card loans amounted to 58.4 percent of total interest income. Lending to corporate sector accounts for a small part of commercial banking activities. The focus is on non-interest income and services. As a result, corporations rely heavily on FX borrowing from international markets; the relatively large net foreign currency exposures heighten vulnerability. Further development of the corporate bond market in Turkey will enhance the opportunities for funding in the domestic market. Declining interest income from government securities is likely to put pressure on bank profit and motivate them to increase their fee-based business.
100. The stock market in Turkey has grown rapidly but is small compared to countries with similar per capita income. Market capitalization increased 600 percent between 2002 and 2010. At the end of 2009, total ISE capitalization was 37.7 percent of GDP—very low even compared with countries that have lower per capita income, such as Malaysia and Thailand. Moreover, foreign investors dominate the equity market and account for more than 60 percent of market capitalization.
101. For the past three years the ISE has been one of the top-performing stock markets in emerging markets. The ISE index rose from 24,972 in 2004 to 66,004 in 2010. However, its volatility has been similar to that of other emerging stock markets. The total amount of funds raised in the period 2004–2009 was USD 18.7 billion (Figure 26). In 2010 the amount of funds raised on the ISE surged to USD 7.9 billion, reflecting better market conditions and a brisk rise in the ISE index. The relatively buoyant domestic equity market has lowered the cost of capital for issuing equity rather than debt for most listed Turkish companies.
Figure 26. IPOs in Turkey, 2004–2010
0
1,000
2,000
3,000
4,000
5,000
6,000
7,000
8,000
9,000
2004 2005 2006 2007 2008 2009 2010
TL m
illio
n
Source: ISE
THE ROLE OF FINANCIAL MARKETS IN INTERMEDIATING SAVINGS IN TURKEY42
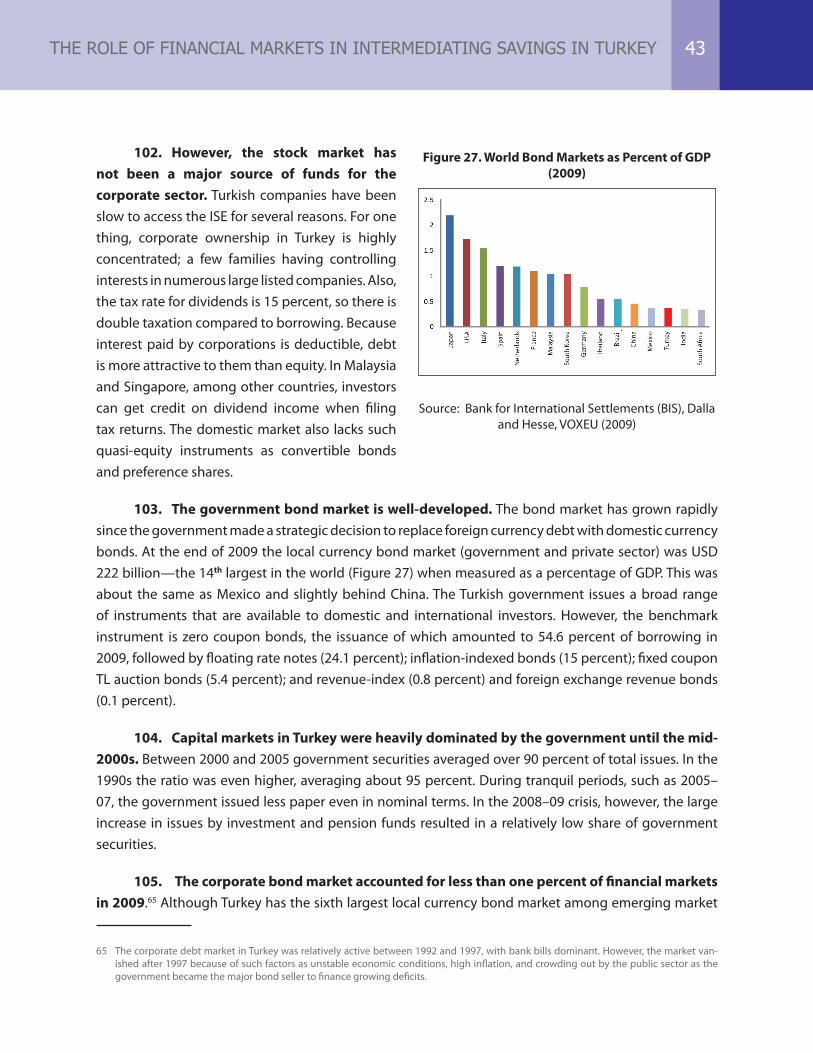
102. However, the stock market has not been a major source of funds for the corporate sector. Turkish companies have been slow to access the ISE for several reasons. For one thing, corporate ownership in Turkey is highly concentrated; a few families having controlling interests in numerous large listed companies. Also, the tax rate for dividends is 15 percent, so there is double taxation compared to borrowing. Because interest paid by corporations is deductible, debt is more attractive to them than equity. In Malaysia and Singapore, among other countries, investors can get credit on dividend income when filing tax returns. The domestic market also lacks such quasi-equity instruments as convertible bonds and preference shares.
103. The government bond market is well-developed. The bond market has grown rapidly since the government made a strategic decision to replace foreign currency debt with domestic currency bonds. At the end of 2009 the local currency bond market (government and private sector) was USD 222 billion—the 14th largest in the world (Figure 27) when measured as a percentage of GDP. This was about the same as Mexico and slightly behind China. The Turkish government issues a broad range of instruments that are available to domestic and international investors. However, the benchmark instrument is zero coupon bonds, the issuance of which amounted to 54.6 percent of borrowing in 2009, followed by floating rate notes (24.1 percent); inflation-indexed bonds (15 percent); fixed coupon TL auction bonds (5.4 percent); and revenue-index (0.8 percent) and foreign exchange revenue bonds (0.1 percent).
104. Capital markets in Turkey were heavily dominated by the government until the mid-2000s. Between 2000 and 2005 government securities averaged over 90 percent of total issues. In the 1990s the ratio was even higher, averaging about 95 percent. During tranquil periods, such as 2005–07, the government issued less paper even in nominal terms. In the 2008–09 crisis, however, the large increase in issues by investment and pension funds resulted in a relatively low share of government securities.
105. The corporate bond market accounted for less than one percent of financial markets in 2009.65 Although Turkey has the sixth largest local currency bond market among emerging market
65 The corporate debt market in Turkey was relatively active between 1992 and 1997, with bank bills dominant. However, the market van-ished after 1997 because of such factors as unstable economic conditions, high inflation, and crowding out by the public sector as the government became the major bond seller to finance growing deficits.
Figure 27. World Bond Markets as Percent of GDP (2009)
Source: Bank for International Settlements (BIS), Dalla and Hesse, VOXEU (2009)
THE ROLE OF FINANCIAL MARKETS IN INTERMEDIATING SAVINGS IN TURKEY 43
countries, at the end of 2009 its corporate bond market amounted to only TL 481 million (USD 400 million). This is far smaller than in other major emerging markets. The corporate bond market has been slow to develop because of such factors as low domestic savings, crowding out by government borrowing, bank dominance of the financial system, lack of a liquid sovereign yield curve beyond 22 months, and a small investor base. What is essential for a growing and vibrant corporate bond market are sound capital market intermediaries, risk management products, stronger credit rating agencies, enhanced creditor rights, equitable taxation, a functioning market infrastructure, sovereign benchmark yield curves, a large domestic investor base including institutional investors, encouragement for blue-chip companies to enter the market, and a coordinated effort by government and private counterparts. Since 2007 corporate bonds have gained momentum as macroeconomic conditions improved and domestic interest rates declined. In October 2010, the corporate bond market got a major boost when the BRSA decided to permit banks to issue TL debt instruments in domestic markets. By the end of 2010 the corporate bond market had increased fivefold, to TL 2.5 billion. The improvement was also a result of measures taken by the CMB of Turkey and the ISE to lower transaction costs, remove tax distortions, reduce issuing costs, and reduce the costs of trading in the secondary market. In January 2011 the government reduced the secondary market transaction cost on corporate bonds from 5 percent to 1 percent to align the cost with that of government securities and stimulate secondary market trading.
106. Further growth of the corporate bond market will be critical to the evolution of financial markets in Turkey. The government programs indicate that the private sector should be the engine for future growth. Therefore, it is important that Turkey broaden the base of the financial market and reduce reliance on the banking sector as the dominant intermediation channel. The corporate sector should be able to raise investment funds from a variety of sources so that they can produce high-quality goods and services that compete globally. Building a robust corporate bond market will require the authorities to make concerted efforts.66
107. Turkey has a reasonably well-developed mutual fund industry. At the end of 2009, total assets managed by the mutual fund industry amounted to TL 38.7 billion including TL 9.1 billion in pension mutual funds. Turkey has three types of mutual funds: Type A, Type B, and private pension funds. Type A funds must invest at least 25 percent of their assets in equities issued by Turkish companies; Type B funds do not have such a requirement. For the last five years mutual funds in Turkey have consistently underperformed their benchmarks for bonds and stocks. The lion’s share of the mutual fund industry continues to be invested in government securities and reverse repos that are liquid and provide attractive returns. It is interesting to note that performance of both types of funds substantially lagged behind their respective benchmarks. Underperformance by these funds may be due to early stage of fund management industry, high management costs and risk aversion of fund investors who were seeking safe assets with short duration. Taxes on mutual fund capital gains were probably also a major factor in limiting the growth of Type A funds.
66 The discusssion on corporate bond markets draws on the forthcoming World Bank Study “Corporate Bond Market Development – Priori-ties and Challenges.”
THE ROLE OF FINANCIAL MARKETS IN INTERMEDIATING SAVINGS IN TURKEY44

5.2 The Private Pension Scheme
108. The relatively new private pension scheme (personal pension system) has grown rapidly since its launch in 2003. Total contributions have risen to TL 9.5 billion,
and at year-end 2010 funds accumulated in the
system stood at TL 12 billion. The number of plan
participants has risen from 15,245 in 2003 to 2.3
million in 2010. These funds are offered by 13
companies licensed by the Undersecretariat of
Treasury. At the end of 2010, equities constituted
12 percent of their investments.
109. The private pension plan was introduced to supplement the public social security system. It is a voluntary, defined
contribution system. The retirement fund accumulated and invested in each participant’s account
is based on regular contributions by the participant. Thus retirement earnings depend solely on
contributions, administrative expenses, and investment returns. The private pension system aims to
diversify pension risks and increase earnings during retirement by directing individual pension savings
into the system. The second objective is to create a large pool of funds that will in turn create new
jobs and help build up capital markets by generating long-term resources for the financial system. The
system is regulated by both the Undersecretariat of Treasury and CMB of Turkey. In addition, the Pension
Monitoring Center was set up in July 2003 to provide daily information on activities of private pension
funds.
110. Despite its rapid growth, the private pension system in Turkey is quite small. Although
its size has increased, at the end of 2010 it accounted for only about 1 percent of GDP. As a percentage of
GDP, the Turkish pension system is one of the smallest among developed and major emerging market
countries (Figure 28). However, the demographic structure is very much in favor of Turkey and with
necessary reforms there is great potential for building a large pension base.
Figure 28. Pension Funds as Percent of GDP (2009)
129.8 118.3
82.3 76.8
73.0 67.8 67.1
65.1 62.9
44.1 43.0
35.5 25.2
13.5 13.4 13.1
11.8 8.1 7.5 7.3
5.2 4.9 4.6 4.1
2.3 2.2 2.2
0 20 40 60 80 100 120 140
NetherlandsIceland
AustraliaFinland
United KingdomUnited States
Weighted averageChile
CanadaIreland
DenmarkSimple average
JapanPoland
PortugalHungary
New ZealandSpain
MexicoNorway
GermanyAustria
Czech RepublicItaly
TurkeyLuxembourg
Korea
Source: OECD Global Pension Statistics
THE ROLE OF FINANCIAL MARKETS IN INTERMEDIATING SAVINGS IN TURKEY 45
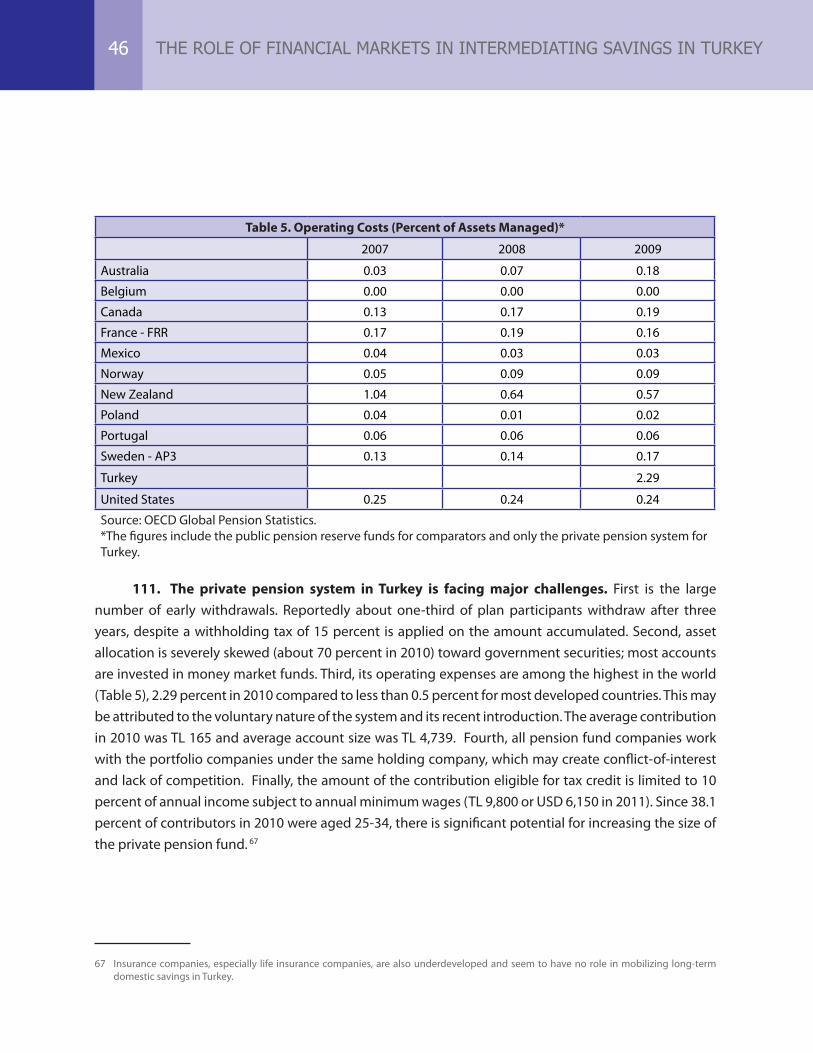
Table 5. Operating Costs (Percent of Assets Managed)*
2007 2008 2009
Australia 0.03 0.07 0.18
Belgium 0.00 0.00 0.00
Canada 0.13 0.17 0.19
France - FRR 0.17 0.19 0.16
Mexico 0.04 0.03 0.03
Norway 0.05 0.09 0.09
New Zealand 1.04 0.64 0.57
Poland 0.04 0.01 0.02
Portugal 0.06 0.06 0.06
Sweden - AP3 0.13 0.14 0.17
Turkey 2.29
United States 0.25 0.24 0.24
Source: OECD Global Pension Statistics.*The figures include the public pension reserve funds for comparators and only the private pension system for Turkey.
111. The private pension system in Turkey is facing major challenges. First is the large number of early withdrawals. Reportedly about one-third of plan participants withdraw after three years, despite a withholding tax of 15 percent is applied on the amount accumulated. Second, asset allocation is severely skewed (about 70 percent in 2010) toward government securities; most accounts are invested in money market funds. Third, its operating expenses are among the highest in the world (Table 5), 2.29 percent in 2010 compared to less than 0.5 percent for most developed countries. This may be attributed to the voluntary nature of the system and its recent introduction. The average contribution in 2010 was TL 165 and average account size was TL 4,739. Fourth, all pension fund companies work with the portfolio companies under the same holding company, which may create conflict-of-interest and lack of competition. Finally, the amount of the contribution eligible for tax credit is limited to 10 percent of annual income subject to annual minimum wages (TL 9,800 or USD 6,150 in 2011). Since 38.1 percent of contributors in 2010 were aged 25-34, there is significant potential for increasing the size of the private pension fund. 67
67 Insurance companies, especially life insurance companies, are also underdeveloped and seem to have no role in mobilizing long-term domestic savings in Turkey.
THE ROLE OF FINANCIAL MARKETS IN INTERMEDIATING SAVINGS IN TURKEY46
pOlICY OpTIONS
112. The analysis has shown that domestic savings in Turkey are low and falling, creating multiple challenges to sustained high growth. Low—and declining—savings imply fewer funds for investment. Moreover, low domestic saving increases dependence on foreign financing, fueling a rise in the current account deficit and jeopardizing the sustainability of growth. Over the past decade a significant portion of investment in Turkey has been financed through foreign savings, often short-term. The recent decline in household saving rates and the low level of domestic savings (12.7 percent of GNDI in 2010) is of particular concern.
113. A stable and enabling economic environment is crucial for raising saving rates. Section 4 reviewed the determinants of saving in Turkey. Private saving is closely linked to the real interest rate, gross private disposable income, the young age dependency ratio, and inflation. Although transition towards economic stability post-2001 led to a fall in precautionary motives for saving, in the future, a stable and enabling macroeconomic environment, building on Turkey’s robust macroeconomic policy performance over the past decade, will be critical to raising domestic saving by increasing incomes.
114. Education and higher female labor force participation have also been linked to increased private savings (Section 4). World Bank (2010) discusses policies that can help improve women’s opportunities for more and better jobs, for example, through more flexible labor market regulations, more affordable child care, and sustained investment in education.
115. Clearly, the low and declining saving rate is primarily due to a plunge in household savings. There are a number of policy tools that can help promote higher and longer-term household savings. These are the core of this report and can be grouped in two main categories: demand-side policies to inform household saving decisions and supply-side policies that improve the regulatory, institutional, and other conditions in which saving decisions are made.
116. There could be high returns to policies that (i) raise awareness about the benefits of saving, particularly long-term, and (ii) elevate the level of financial literacy of households. Because households do not generally plan for saving, they may end up suffering from an income gap later in life and become unable to sustain their living standards. In the absence of awareness about saving for the future, changing consumption habits and the easy availability of credit steer households to higher consumption expenditures than they otherwise would have made. Moreover, the household savings
6. POLICY OPTIONS
portfolio is frequently allocated without sufficient information on alternative options. The knowledge of the general public about financial markets beyond bank deposit and government securities is limited and the number of shareholders in the stock exchange is small. The availability of high-interest government securities for the last decade has reduced the need for diversification. Traditionally, household saving has often been shaped by personal and family history and saving culture and a desire to own physical assets. Improving portfolio allocation will become more important as interest and returns on government bonds decline.
117. A national financial literacy strategy would establish a framework for a systematic approach towards increasing the level of financial literacy. Increasing the financial capability of households, starting early in the lifecycle, and helping them make informed financial decisions could increase savings. The government is aware of the need to raise financial literacy, and a high profile conference sponsored by CBRT and CMB of Turkey was held in March 2011. Implemented effectively, a national financial literacy strategy is likely to have a significant impact on the saving decisions of Turkish citizens.68 Such a strategy would be most successful if there is effective management by the designated lead agency and participation by all relevant stakeholders. In the short term, promoting the financial literacy of the 2.3 million private pension holders who are already in the system and potential participants could attract additional funds into that system. This would be most effective if based on contributions from stakeholders. One policy option could be to provide information about the tax exemption for contributions to the private pension system not only to its beneficiaries but also to administrators in workplaces. Efforts in the context of the “Istanbul International Financial Center Strategy and Action Plan” which includes informing the investors about capital markets, capital market entities and instruments, investor protection systems, risks and similar matters, are also important.
118. On the supply side, the intermediation role of financial markets is central. There are three types of policy option to enhance intermediation: (i) using existing products better (e.g., private pensions, corporate bonds), including, but not limited to, taxation of different instruments; (ii) investing more in product innovation and improving regulation; and, (iii) designing special saving schemes.
119. The private pension schemes recently introduced in Turkey have the potential to grow significantly. Besides raising household awareness about planning for retirement, making the private pension scheme more attractive could help the sector generate more and longer-term savings. One option to consider is increasing tax exemption limit and different parameters (for tax exemption) could be determined to maximize the possibility of attracting new savings into the private pension system, with participation from the relevant public and private agencies. In addition to increasing tax incentives, the government could also consider increasing the vesting period to a minimum of three years with no withdrawal permitted except for medical emergencies. The follow-up work will focus on alternative options to redesign the private pension scheme to attract more savings into the system, and the respective cost of these options.
68 The World Bank team is working on a grant to finance a nationwide financial literacy survey, to be implemented jointly with CBRT and CMB of Turkey. This survey will provide valuable input for preparation of a national strategy.
POLICY OPTIONS48
120. Efforts to promote savings would be most effective if complemented by reforms to
increase the overall development level of the financial markets. Turkey’s financial markets have
been growing rapidly since 2003. However, the system remains highly dominated by the banking
system. Turkey will benefit from a more diversified financial market which can mobilize and allocate
savings more effectively and a lower cost. Further development of the corporate bond market is one
potential policy option.69 More generally, in Turkey the level of financial development seems to play an
important role in channeling savings to growth-enhancing activities. The experiences of Malaysia and
Thailand, which have both well-developed financial markets and high saving rates, may be relevant
for Turkey. It is worth noting that although in the cross-country evidence the simple unconditional
correlation between financial depth and domestic saving is positive, the marginal contribution of
financial depth (or deepening) on saving is often found to be negative (for example, Loayza et al. 2000).
One interpretation to this is that financial liberalization and deepening first reduces saving, because
constraints on credit-constrained households and SMEs are lifted, and then, over the long term, raises
saving indirectly through higher growth.
121. On the regulatory side, a new comprehensive capital market will contribute to
deepening of financial markets. The Capital Market Law in Turkey has performed a useful function in
providing a broad framework in regulating domestic capital market. Rapid developments in domestic
and international financial markets require a comprehensive review of the capital market law to bring
it to international standards. The new law is also relevant for EU convergence and Istanbul International
Financial Center Project. It will also reduce the need for rule making through communiqués.
122. The government might consider removing the distortions in the financial markets
created by taxation. Providing equal treatment for all financial instruments regardless of investors
will create a level playing field that will enable financial markets to grow and become more robust.
Equalizing the tax burden on similar instruments could help achieve a more balanced financial market.
For instance:
i. Tax on Mutual Funds. Investments in mutual funds are currently subject to 10 percent
withholding tax; investment in individual stocks is tax-exempt. This creates a disincentive for individual
investors who are not equipped to invest through stockbrokers.
ii. TaxonETFs. There is a withholding tax on ETFs but not ontrading in individual stocks.
iii. TaxonBankDeposits. Bank deposits are subject to 15 percent withholding tax; while the
investment in government securities is subject to 10 percent withholding tax.
69 Policy options for development of the corporate bond market can be found in the forthcoming World Bank study “Corporate Bond Market Development – Priorities and Challenges.”
POLICY OPTIONS 49
The estimated tax loss from removing the 10 percent withholding tax on mutual funds with more than 50 percent equity content is about TL 25 million, based on an assumption of 20 percent return. A more detailed analysis of the potential fiscal impact of the above policy options is warranted, although the benefits from increased savings would likely outweigh foregone revenues from removing tax distortions.
123. Special saving schemes, based on successful examples elsewhere, could be instrumental in attracting new savings. While Turkey previously had a bad experience with a mandatory scheme, well-designed new saving schemes, mandatory or voluntary, that are effectively administered could attract household savings into the financial system. TPSAs like the Saving Gateway and the Child Trust Fund in the UK and the 529 plans in the US (developed for covering future education expenses of the children) are good examples of voluntary saving schemes. The government contribution to individual saving accounts and favorable tax treatment of contributions and earnings might be considered primary elements in program design. The OECD evaluation of the impact of TPSAs shows they did create additional savings. It also suggests that attracting moderate-income households is important for account efficiency because they are more likely to increase saving when given the opportunity to invest in tax-favored accounts. Moreover, since the tax rate is lower on moderate-income individuals, the larger the proportion in which they participate compared to high-income individuals, the lower the cost of foregone tax revenues.
124. Saving does not automatically generate investment and a sound enabling environment is critical, particularly for the corporate sector. Additional policy measures could be considered to enhance internal fund generation of the corporate sector, including enhancing operating profits and retaining profits within the firm. In the 1980s and 1990s private saving exceeded private investment. Hence, it is critical to enable firms to grow and innovate and for labor to be used more productively. Improving work skills, enhancing competitiveness, improving the business climate, and discouraging informality will all help raise savings. These issues, however, are the subject of other studies and thus are not discussed here.
125. Sound macro policies to raise incomes and further reduce economic vulnerabilities would complement other attempts to promote domestic saving. Many studies suggest there is a negative relationship between private saving and the real exchange rate. The analysis of corporate saving in Turkey also suggested that real exchange rate appreciation may have reduced the profitability of large and exporting firms. Rapid credit expansion also suppresses savings to the extent that it is not channeled to productive activities and pushes low-income households into dissaving. Thus, it is essential that monetary and exchange rate policies be designed to control credit growth and excessive appreciation. Recent CBRT attempts may help but they may have to be complemented by other macroprudential and fiscal measures. In particular, policies and measures intended to limit the growth in credit card and consumption loans that encourage growth in consumption, could be effective in promoting saving. Potential measures for consumer loans and credit cards could be the following:70
70 As this report was being finalized in June 2011, the BRSA put in place measures to curb credit growth with a specific focus of “consumer loans”.
POLICY OPTIONS50

• Introduction of installment limitations for personal finance and vehicle loans provided by banks under the consumer loans category would reduce the amount of loans used via this channel and thus curb consumption.
• Further reducing the Loan/Value ratio in mortgage loans, which is currently 75 percent and introducing a similar measure for vehicle loans, would reduce the growth in mortgage loans.
• Introducing installment limitations for credit cards would contribute to the use of credit cards as a payment instrument rather than a borrowing instrument.
• The minimum payment rate for credit cards could be raised to 40 percent, from the current rate of 20 percent.
• Extending the number of years (from the existing 2 years) in setting credit card limit caps for households could reduce the credit limit as a share of household incomes.
126. The degree of a country’s development may be one of the most important determinants of its domestic saving rates. Household income level is clearly a major influence on savings, as suggested by the dissaving of the lowest-income quintiles and the high saving rates for the top quintiles. Not surprisingly, education is closely related to household saving behavior. The very small group of highly educated saves more than 20 percent, while the large group of the least educated saves about 10 percent, pulling down average saving rates. The more educated have also been found to hold more financial assets. Increasing education nationwide is of course a goal in itself to increase employability, promoting livelihood and welfare but would also raise saving rates.
127. Finally, increasing public sector savings may increase domestic savings to the extent extra savings are generated by cutting unproductive expenditures, and they rely on the formalization of the economy. The less than full Ricardian equivalence (public saving increases reducing private savings by less than one-to-one) in the case of Turkey suggests that there is potential for the public sector to contribute to increasing domestic saving. The quality of public spending and reform of the SOE sector are important in this respect. There is evidence, especially from OECD countries, that fiscal consolidation that relies primarily on tax increases and cuts in public investment has not been sustainable because higher revenues sooner or later boosted expenditures, and maintenance and expenditures on infrastructure could no longer be deferred. By contrast, fiscal consolidations underpinned by structural public expenditures cuts have had more lasting effects. Furthermore formalization of the economy through increased reliance on direct taxes, such as personal and corporate incomes taxes, by increasing the efficiency of tax collection and reducing tax evasion, could also promote savings.71
128. Addressing the current account deficit entails not only studying domestic saving but also an analysis of foreign trade patterns and dynamics. The next CEM to be prepared jointly with the authorities will discuss this subject.
71 World Bank Turkey Country Economic Memorandum, Informality: Causes, Consequences, Policies (2010).
POLICY OPTIONS 51
• Adaoğlu, C. 2008. “Dividend Policy of the ISE Industrial Corporations: The Evidence Revisited (1986–-2007).”, Journal of BRSA Banking and Financial Markets 2 (2), 113–-135, Banking Regulation and Supervision Agency, Ankara.
• Agenor, P.R., and J. Aizenman. 2004. “Saving and the Terms of Trade Under Borrowing Constraints.” Journal of International Economics 63 (2): 321-40.
• Aghion, P., D. Comin, P. Howitt, and I. Tecu. 2009. “When Does Domestic Saving Matter for Economic Growth?” Working Paper, Harvard Business School. Cambridge, MA: Harvard University.
• Aizenman, J. 2006. “International Reserves Managements and Current Account.” NBER Working Paper No.12734. Cambridge, MA: National Bureau of Economic Research.
• __________, B. Pinto, and A. Radziwill. 2007. “Sources for Financing Domestic Capital—Is Foreign Saving a Viable Option for Developing Countries?” Journal of International Money and Finance 26: 682–702.
• Aktaş, A., D. Güner, S. Gürsel, and G. Uysal-Kolaşin. 2010. “Structural Determinants of Household Savings in Turkey: 2002–2008.” Background study for this report. Ankara: World Bank.
• Akyüz, Y. 2009. “Exchange Rate Management, Growth and Stability: National and Regional Policy Options in Asia.”, Colombo, Sri Lanka: UNDP.
• Alesina, A. and S. Ardagna. 1998. “Tales of Fiscal Adjustment,” Economic Policy No.27. Cambridge, MA: Harvard University.
• Alesina, A., and R. Peroti. 1997. “Fiscal Adjustments in OECD Countries: Composition and Macroeconomic Effects.” V.44, 210-248.
• Apaydın, E., A. Türeli, and C. Yalçın. 2011. “Determinants of Private Sector Saving Rates in Turkey.” Presentation at the CEM workshop on March 24. Ankara: World Bank.
• Apps, P., and R. Rees. 2001. “Household Saving and Full Consumption over the Life Cycle.” IZA Discussion Paper No 280. Bonn: Institute for the Study of Labor.
• Attanasio, O., and J. Banks. 1998. “Trends in Household Saving Don’t Justify Tax Incentives to Boost Saving,” Economic Policy 27: 547 –84.
• Arellano, M., and S.R. Bond. 1991, “Some Tests of Specification for Panel Data: Monte Carlo Evidence and Application to Employment Equations.” Review of Economic Studies 58: 277–97.
BIBLIOGRAPHY
• Arellano, M., and O. Bover. 1995. “Another Look at the Instrumental-Variable Estimation of Error-
Components Models.” Journal of Econometrics 68: 29–51.
• Aviva (2010) “Quantifying Europe’s Pensions Gap”. Retrieved from http://www.aviva.com/
europe-pensions-gap/intro.html
• Auerbach, Alan J., and Kevin A. Hassett. 1991. “Corporate Savings and Shareholder
Consumption.”NBER Working Paper No. 2994. Cambridge, MA: National Bureau of Economic Research.
• Barro, R., and J. W. Lee. 2001. “International Data on Educational Attainment: Updates and
Implications.” Oxford Economic Papers 53 (3): 541–63.
• Barro and Sala-i-Martin (2004). Economic Growth. Cambridge, MA: MIT Press.
• Bates,T., K. Kahle, and R.Stulz. 2006. “Why Do U.S. Firms Hold so much more Cash than They Used
to?” NBER Working Paper No. 12534. Cambridge, MA: National Bureau of Economic Research.
• Bayoumi, T., H. Tong, and S. Wei. 2010. “The Chinese Corporate Savings Puzzle: A Firm Level Cross-
Country Perspective” NBER Working Paper No: 16432. Cambridge, MA: National Bureau of Economic
Research.
• Bernanke, B.S., and Gurkaynak, R.S. 2002. “Is Growth Exogenous? Taking Mankiw, Romer, and Weil
Seriously.” In NBER Macroeconomics Annual 2001, Vol. 16, ed. Ben S. Bernanke and Refet S. Gürkaynak,
11–72. Cambridge, MA: MIT Press.
• Bernanke, B.S., M.Gertler and S. Gilchrist. 1996. “Financial Accelerator and the Flight to Quality.”
The Review of Economics and Statistics 78(1), 1–15.
• __________. 1998. “The Financial Accelerator in a Quantitative Business Cycle Framework.” In
Handbook of Macroeconomics, Volume 1C, Cpt 21, ed. Taylor and Woodford, 1341–93. Amsterdam,
Netherlands: Elsevier.
• Bersales, S., D. S. Mapa, and L. Grace. 2006. “Patterns and Determinants of Household Saving in
the Philippines.” USAID/Philippines ECDG Technical Report. Washington, DC: USAID.
• Betcherman, G., N. M. Daysal, and C. Pages. 2008 “Do Employment Subsidies Work? Evidence
from Regionally Targeted Subsidies in Turkey.” IZA Discussion Paper Series No. 3508. Bonn: Institute for
the Study of Labor.
• Bils, M., and P. J. Klenow. 2000. “Does Schooling Cause Growth?” American Economic Review 90
(5): 1160–1183.
• Blanchard, O., and F. Giavazzi. 2002. “Current Account Deficits in the Euro Area: the End of the
Feldstein-Horioka Puzzle?” Brooking Papers on Economic Activity 2: 147–210.
• Bloom, C., D.Canning, and B. Graham. 2003. “Longevity and Life-cycle Saving.” Scandinavian
Journal of Economics 105 (3): 319–38.
BIBLIOGRAPHY 53

• Browning, M., and A. Lusardi. 1996. “Household Saving: Micro Theories and Micro Facts.” Journal of Economic Literature 34: 1797–1855.
• Bond, S. 2002. “Dynamic Panel Data Models: A Guide to Micro Data Methods and Practice.” Cemmap Working Paper CWP 09/02. London: Institute for Fiscal Studies.
• Burney, N. A., and A. H. Khan. 1992. “Socio-economic Characteristics and Household Savings: An Analysis of the Households’ Saving Behavior in Pakistan.” Pakistan Development Review. 31 (1): 31–48.
• Butelmann, A., and F. Gallego. 2000. “Household Saving in Chile: Microeconomic Evidence.” Working Papers 63. Santiago: Central Bank of Chile.
• Calvo, G., and C. Reinhart. 2000. “When Capital Inflows Come to a Sudden Stop: Consequences and Policy Options.” In Reforming the International Monetary and Financial System, ed. Peter Kenen and Alexandre Swoboda, 175–201. Washington DC: International Monetary Fund.
• Campa, J.M., and L.S. Goldberg. 1999. “Investment, Pass-through and Exchange Rates: A Cross-Country Comparison.” International Economic Review 40 (2): 287–314.
• Carroll, C. D., J. Overland, and D. N. Weil. 2000. “Saving and Growth with Habit Formation.” American Economic Review 90(3): 341–55.
• Carroll, C. D., and D. N. Weil. 1994. “Saving and Growth: A Reinterpretation.” Carnegie-Rochester Conference Series on Public Policy 40: 133–92.
• Ceritoğlu, E. 2009. “The Empirical Importance of Precautionary Savings in Turkey.” PhD thesis. University of Nottingham.
• Chamon, M., and E. Prasad. 2008. “Why Are Saving Rates of Urban Households in China Rising?” NBER Working Papers No.14546. Cambridge, MA: National Bureau of Economic Research.
• Chaturvedi, V., B. Kumar, and R. H. Dholakia. 2009. “Inter-relationship Between Economic Growth, Saving, and Inflation in Asia.” Journal of International Economic Studies 23: 1–22.
• Cilasun, S. M., and G. M. Kırdar. 2009. Türkiye’de hanehalklarının gelir, tüketim ve tasarruf davranışlarının yatay kesitlerle bir analizi.” İktisat İşletme ve Finans 24(280): 9–46.
• Coakley, J., F. Kulasi, and R. Smith. 1996. “Current Account Solvency and the Feldstein--Horioka Puzzle” Economic Journal, 106 (436): 620–27.
• Collard, SB., and McKay, SD. ‘Closing the savings gap? The role of the Saving Gateway’, Local Economy, 21 (1), 25-35.
• Dalla, Ismail. 2011. “The Role of Financial Markets in Mobilizing Household Savings.” Background study for the CEM. Ankara: World Bank
• Dayal-Gulati,A.,andC.Thimann.1997.“Saving in Southeast Asia and Latin America Compared—Searching for Policy Lessons.” IMF Working Papers 97/110. Washington, DC: International Monetary Fund.
BIBLIOGRAPHY54
• Deaton, A. S. 1990. “Saving in Developing Countries: Theory and Review.” World Bank Economic
Review, Special Issue, Proceedings of the First Annual World Bank Conference on Development
Economics, 61–96.
• Denizer, C., and H.C. Wolf. 2000. “The Saving Collapse During the Transition in Eastern Europe”
World Bank Economic Review 14 (3): 445–56.
• Edwards, S. 2002. “Does the Current Account Matter?” In Preventing Currency Crises in Emerging
Markets, ed. Sebastian Edwards and Jeffrey Frankel. Chicago, IL: University of Chicago Press.
• __________. 2005. “The End of Large Current Account Deficits, 1970–2002: Are There Lessons
for the United States?” NBER Working Paper No.11669. Cambridge, MA: National Bureau of Economic
Research.
• Fazzari, S., Hubbard, R.G., Petersen B.C., “Financing Constraints and Corporate Investment.” NBER
working Paper No.2387. Cambridge, MA: National Bureau of Economic Research.
• Feldstein, M. 1983. “Domestic Saving and International Capital Movements in the Long Run and
the Short Run.” European Economic Review 21: 129–51.
• __________ and __ Bachetta. 1991. “National Saving and International Investment.” In National
Saving and Economic Performance, ed. D. Bernheim and J. Shoven, 201–26. Chicago, IL: University of
Chicago Press.
• __________ and C. Horioka. 1980. “Domestic Saving and International Capital Flows.” Economic
Journal 90: 314–29.
• Ferrucci, G., and C. Miralles. 2007. “Saving Behavior and Global Imbalances. The Role of Emerging
Market Economies.” European Central Bank Working Paper Series No 842. Frankfurt, Germany: European
Central Bank.
• Frankel, J.A. 2005. “Mundell-Fleming Lecture: Contractionary Currency Crashes in Developing
Countries.” IMF Staff Papers 52(2): 149–92.
• Galindo, A., U. Panizza, and F. Schiantarelli. 2003. “Debt Composition and Balance Sheet Effects
of Currency Depreciation: A Summary of the Micro Evidence.” Emerging Markets Review 4: 330–39.
• Gersovitz, M. 1988 “Saving and Development,” in T. N. Srinivasan. Handbook of Development
Economics, Vol 1, ed. by T. N. Srinivasan. Amsterdam, Netherlands; Elsevier Science Publishers.
• Gollin, D. 2002. “Getting Income Shares Right.” Journal of Political Economy 110(2): 458–74.
• Günay, H., Kılınç M., 2011. “Credit Market Imperfections and Business Cycle Asymmetries in
Turkey.” Central Bank of Turkey Working Paper Series No: 11 (7), Ankara, Central Bank.
• Hall, R.E., and C.I. Jones. 1999. “Why Do Some Countries Produce so much more Output per
Worker than Others?” Quarterly Journal of Economics 114(1): 83–116.
BIBLIOGRAPHY 55
• Hausmann,R., L. Pritchett, and D. Rodrik. 2005. “Growth Accelerations.” Journal of Economic Growth 10: 303–29.
• Hausmann, R. 2008. “In Search of the Chains that Hold Brazil Back.” CID Working Paper No. 180. Cambridge, MA: Harvard University Center for International Development.
• Hevia, C. 2010. “Saving in Turkey: An International Comparison” Background study for the CEM. Ankara: World Bank.
• Horioka, C.Y., and J. Wan. 2007. “The Determinants of Household Saving in China: A Dynamic Panel Analysis of Provincial Data.” Journal of Money, Credit, and Banking 38 (8): 2077–2096.
• Hsieh, C., T., and Parker, J.,A. 2007. “Taxes and Growth in a Financially Underdeveloped Country: Evidence from Chilean Investment Boom.” NBER Working Paper No. 12104. Cambridge, MA: National Bureau of Economic Research.
• Hüfner, F., and I. Koske. 2010. “Explaining Household Saving Rates in G7 Countries: Implications for Germany.” OECD Economic Department Working Papers No. 754. Paris: Organization for Economic Cooperation and Development.
• International Monetary Fund. 2005. “Global Imbalances: A Saving and Investment Perspective.” World Economic Outlook, September, Chapter II. Washington, DC: International Monetary Fund.
• __________. 2006. “Awash with Cash: Why Are Corporate Savings so High?” World Economic. Outlook, April, Chapter IV. Washington, DC: International Monetary Fund.
• __________. 2007. “Safe to Save Less? Assessing the Recent Decline in Turkey’s Private Saving Rate.” Selected Issues, IMF Country Report No. 07/364. Washington, DC: International Monetary Fund.
• __________. 2009. “Corporate Savings and Rebalancing in Asia and Pacific: Building Sustainable Recovery.” Regional Economic Outlook. Washington, DC: International Monetary Fund.
• Investment Climate Assessment. 2010. “From Crisis to Private Sector Led Growth”. Ankara: World Bank.
• İsmihan, M., and K. Metin-Özcan. 2006. “The Growth Performance of the Turkish Economy, 1960–2004.” Paper presented at the ICE-TEA International Economics Conference, September 10–13, Ankara.
• Juster, T.F., J. P.Lupton, S.P. Smith, and F. Stafford. 2005. “The Decline in Household Saving and The Wealth Effect.” Review of Economics and Statistics 87(4): 20–27.
• Kaplan, C., E. Özmen, and C. Yalçın. 2006. “The Determinants and Implications of Financial Asset Holdings of Non-Financial Firms in Turkey: An Empirical Investigation.” Working Paper No. 06/06. Ankara: Central Bank of Turkey.
• Kaya, H. 2010. “Saving-Investment association in Turkey.” Middle East Economic Association Papers. http://meeaweb.org/meeapapers/Huseyin_kaya_meea2010.pdf.
BIBLIOGRAPHY56
• Kesriyeli, M., E. Özmen, and S. Yiğit. 2011, forthcoming. “Corporate Sector Liability Dollarization and Exchange Rate Balance Sheet Effect in Turkey. Applied Economics.
• Kılınç, M. 2006. “Sectoral Asymmetries, Currency Mismatch and Sudden Stops.” Job Market Paper. Los Angeles, CA: UCLA.
• Kiyotaki, N., and J. Moore. 1997. “Credit Cycles.” Journal of Political Economy 105(2): 211–48.
• Kulikov D., A. Paabut, and K. Staehr. 2007. “A Microeconometric Analysis of Household Saving in Estonia: Income, Wealth and Financial Exposure.” Eesti Pank Working Paper, No. 8. Talinn, Estonia: Eesti Pank.
• __________. 2005. “Finance and Growth: Theory and Evidence” In Handbook of Economic Growth, ed. Phillipe Aghion and Steven Durlauf. Amsterdam: Netherlands: Elsevier Science.
• Levine, R., N. Loayza and T.Beck. 2000. “Financial Intermediation and Growth: Causality and Causes.” Journal of Monetary Economics 46: 31–77.
• Levy-Yeyati, E., and F. Sturzenegger. 2009. “Fear of Appreciation: Exchange Rate Policy as a Development Strategy. In Monetary Policy Frameworks for Emerging Markets, ed. G. Hammoind, R. Kapur, and E. Prassad. Cheltenham, UK: Edward Elgar Publishing.
• Loayza, N., K. Schmidt-Hebbel, and L. Servén. 1998. “The World Saving Database.” Washington, DC: World Bank.
• __________. 2000. “What Drives Private Saving Across the World?” Review of Economics and Statistics 82 (2): 165–181.
• J. Humberto Lopez, K. Schmidt-Hebbel, and L. Servén. 2000. “How Effective is Fiscal Policy in Raising National Saving?.” Review of Economics and Statistics 82 (2): 226-238.
• Milesi-Ferretti, G.M., and A. Razin. 1996. Current-Account Sustainability. Princeton Studies in International Economics No. 81. Princeton, NJ: International Economics Section, Princeton University.
• Nehru, V., and A. Dhareshwar. 1993. “A New Database on Physical Capital Stock: Sources, Methodology, and Results.” Revista de Analisis Economico 8 (1): 37–59.
• Mamingi, N. 1997. “Saving-Investment Correlations and Capital Mobility: The Experience of Developing Countries.” Journal of Policy Modeling 19 (6): 605–626.
• Masson, P., T. Bayoumi, and H. Samiei. 1995. “Saving Behavior in Industrial and Developing Countries.” Staff Studies for the World Economic Outlook. Washington, D.C.: International Monetary Fund.
• __________. 1998. “International Evidence on the Determinants of Private Saving.” World Bank Economic Review 12 (3): 483–501.
• Modigliani, F., and M. Miller. 1958. “The Cost of Capital, Corporate Finance and the Theory of Investment.” American Economic Review 48: 261–97.
BIBLIOGRAPHY 57
• Modigliani, F. 1970. “The Life-Cycle Hypothesis of Saving and Intercountry Differences in the Saving Ratio” In Induction, Trade, and Growth: Essays in Honor of Sir Royd Harrod, ed. W.A. Eltis, M.F.G. Scott, and J.N. Wolfe. Oxford, UK: Clarendon Press.
• Montiel, P.J., and L. Serven.. 2008. “Real Exchange Rates, Saving and Growth: Is There a Link?“ World Bank Policy Research Working Paper No. 4636. Washington, DC: World Bank.
• Morande, Felipe G. 1998. “Savings in Chile. What Went Right?” Journal of Development Economics 57 (1): 201–28.
• Obstfeld, M. 1986. “Capital Mobility in the World Economy: Theory and Measurement.” Carnegie-Rochester Conference Series on Public Policy 24: 55–104.
• __________. 1995. “International Capital Mobility in the 1990s” In Understanding Interdependence: The Macroeconomics of the Open Economy, ed. P. B. Kenen. Princeton. NJ: Princeton University Press: 201-261
• __________ and K. Rogoff. 2000. “The Six Major Puzzles in International Economics: Is There a Common Cause?” NBER Working Paper No. 7777. Cambridge, MA: National Bureau of Economic Research.
• OECD. 2007. “Corporate Saving and Investment: Recent Trend and Prospects. OECD Economic Outlook 82: Special Chapter.
• Özatay, F. 2008. “Expansionary Fiscal Consolidations: New Evidence from Turkey.” Department of Economics Working Paper No: 08-05. Ankara: TOBB University of Economics and Technology.
• Özcan, K.M., A. Günay, and S. Ertaç. 2003. “Determinants of Private Saving Behavior in Turkey.” Applied Economics 35: 1405–16.
• Özcan, K.M., and Y.Z. Özcan. 2004. “Determinants of Private Saving in the Middle East and North Africa.” Special Issue: Money and Finance in the Middle East: Missed Opportunities or Future Prospects? Research in Middle East Economics 6: 95–113.
• Özlü, P., and C. Yalçın. 2010. “The Trade Credit Channel of Monetary Policy Transmission: Evidence from Non-financial Firms in Turkey.” CBRT Working Paper No. 10/16. Ankara: Central Bank of the Republic of Turkey.
• Peroti, R. 1996. “Fiscal Consolidation in Europe: Composition Matters.” American Economic Review, 86, 105-110.
• Pirgan Matur E., A. Sabuncu, and S. Bahçeci. 2011. “Interaction Between Public and Private Savings in Turkey.” Background study for the CEM. Ankara: World Bank.
• Prasad, E.S., R. G. Rajan, and A. Subramanian. 2007. “Foreign Capital and Economic Growth.” NBER Working Papers No.13619. Cambridge, MA: National Bureau of Economic Research.
• Rijckeghem, C., and M. Üçer. 2009. “The Evolution and Determinants of the Turkish Private Saving Rate: What Lessons for Policy?” ERF Research Report Series No. 09-01. Cairo, Egypt: Economic Research Forum.
BIBLIOGRAPHY58
• __________. 2010. “Determinants of Private Saving in Turkey: an Update,” manuscript.
• Rodrik, D. 2008. “The Real Exchange Rate and Economic Growth.” Brookings Papers on Economic
Activity Fall: 365–412.
• Rodrik, D. 2009. “The Turkish Economy after the Crisis.” Working Paper 2009-9. Ankara: Turkish
Economic Association.
• __________. 2000. “Saving Transitions: On the Causes and Consequences of Rapid Increases in
Saving Rates.” World Bank Economic Review 14 (3):481-507.
• Roodman, D. 2009. “A Note on the Theme of Too Many Instruments.” Oxford Bulletin of Economics
and Statistics 71 (1): 135–58.
• Sosyal Araştırmalar Merkezi 2011. “Household Saving Behaviours: Focus Group Discussions
Report.” Background study for the CEM. Ankara: World Bank.
• Sarıoğlu, G. P. 2007, “Turkish Housing System: History and Current Debates in Comparison with
Several EU countries.” Paper presented at Working Group Comparative Housing Policy Seminar, Dublin,
Ireland. Delft, Netherlands: European Network for Housing Research.
• Sayek, S. 2010. “Savings and Growth: A Time Series Analysis for Turkey.” Unpublished background
analysis for the CEM. Ankara.
• Saygılı, M.K. 2002. “Turkiye’de Kamu Fonu Uygulamasi” State Planning Organization expert
thesis. Ankara: Stet Planning Organization. Saygılı, Ş., and C. Cihan. 2008. “Growth Dynamics of Turkish
Economy: Source of Growth Problems and Potential Growth in 1987–2007 (in Turkish). Joint Study by
The Central Bank of Turkey and TÜSİAD No: TÜSİAD-T/2008-6/462. Ankara: Central Bank of Turkey.
• Schmidt-Hebbel, K., and L. Servén. 1998. “World Saving: Trends and Theories.” Estudios de
Economía 25 (2): 191–215.
• __________. 1999. “Chile’s Pension Revolution Coming of Age.” Manuscript.
• Skinner, J. 1988. “Risky Income, Life-Cycle Consumption, and Precautionary Saving.” Journal of
Monetary Economics 22 (2): 237–55.
• State Planning Organization. 2011. “Development of Public Savings Between 1975 and 2009,
and the Central Government Budget.” Background study for the CEM. Ankara: World Bank.
• Tanzi, V., and H. Zee. 1998. “Taxation and the Household Saving Rate: Evidence from OECD
Countries.” IMF Working Paper WP/98/36. Washington, DC: International Monetary Fund.
• Telli, Ç., and S. Çavdaroğlu. 2010. “Flow of Funds Analysis: Framework, Compilation and
Applications for Turkey.” Background study for the CEM. Ankara: World Bank.
• Tesar, L. 1991. “Saving, Investment, and International Capital Flows.” Journal of International
Economics 31: 55–78.
BIBLIOGRAPHY 59
• Tunaer, B.M., and Y.Gülcan. 2006. “Measuring Returns to Education in Turkey.” Paper presented at
the International Conference on Human and Economic Resources, Izmir.
• Turkish Statistical Institute. 1994. Statistical Yearbook of Turkey. Ankara: TSI.
• __________. 2008) 2007 Census, Population Living in Cities. Retrieved on March 1, 2010, from
http://www.turkstat.gov.tr/PreHaberBultenleri.do?id=3894
• Székely, M., and O. P. Attanasio. 2000. “Household Saving in Developing Countries—Inequality,
Demographics and All That: How Different are Latin America and South East Asia?” RES Working Papers
4221. Washington, DC: Inter-American Development Bank, Research Department.
• Uygur, Ercan. 2011. “Domestic Savings in Turkey: Policy, Institutional and Legislative Framework.”
Background study for the CEM. Ankara: World Bank.
• Uysal, Gokce. 2011. “Notes on Household Savings: Regression Analysis and Focus Group
Discussions.” Background note for the CEM. Ankara: World Bank.
• World Bank and Turkish State Planning Organization. 2009. “Female Labor Force Participation in
Turkey: Trends Determinants and Policy Framework.” Report No: 48508-TR. Washington, DC: World Bank.
• __________. 2010. Turkey Country Economic Memorandum – Informality: Causes, Consequences,
Policies. Washington, DC: World Bank.
• Yentürk, N., B. Ulengin, and A. Cimenoglu. 2009. “An Analysis of the Interaction Among Savings,
Investments and Growth in Turkey.” Applied Economics 41: 739–51.
• Yeşiltaş, S. 2009. “Financing Constraints and Investment: The Case for Manufacturing Firms.”
Master’s thesis, Department of Economics, Bilkent University, Ankara, Turkey.
• Yılmaz, G., and R. Gönenç. 2008. “How Did Turkish Industry Respond to Increased Competitive
Pressures, 1998–2007?” CBRT Working Paper No. 08/04. Ankara: Central Bank of the Republic of Turkey.
• Yılmazer, T. 2010. “The Profile and Determinants of Household Savings.” Background study for
the CEM. Ankara: World Bank.
• __________, F. Adaman, and M. Kaytaz. 2009. “The Impact of Financial Development on
Homeownership and Housing Quality: Evidence from Turkey.” Retrieved on March 1, 2010, from http://
papers.ssrn.com/sol3/papers.cfm?abstract_id=519822.
• Yükseler, Z., and E. Türkan. 2008. “Türkiye’de hanehalkı: İşgücü, gelir, harcama ve yoksulluk
açısından analizi”. 3 (455).Ankara: TÜSİAD.
• Zeldes, S.P. 1989. “Consumption and Liquidity Constraints: An Empirical Investigation.” Journal
of Political Economy 97 (2): 305–46.
BIBLIOGRAPHY60
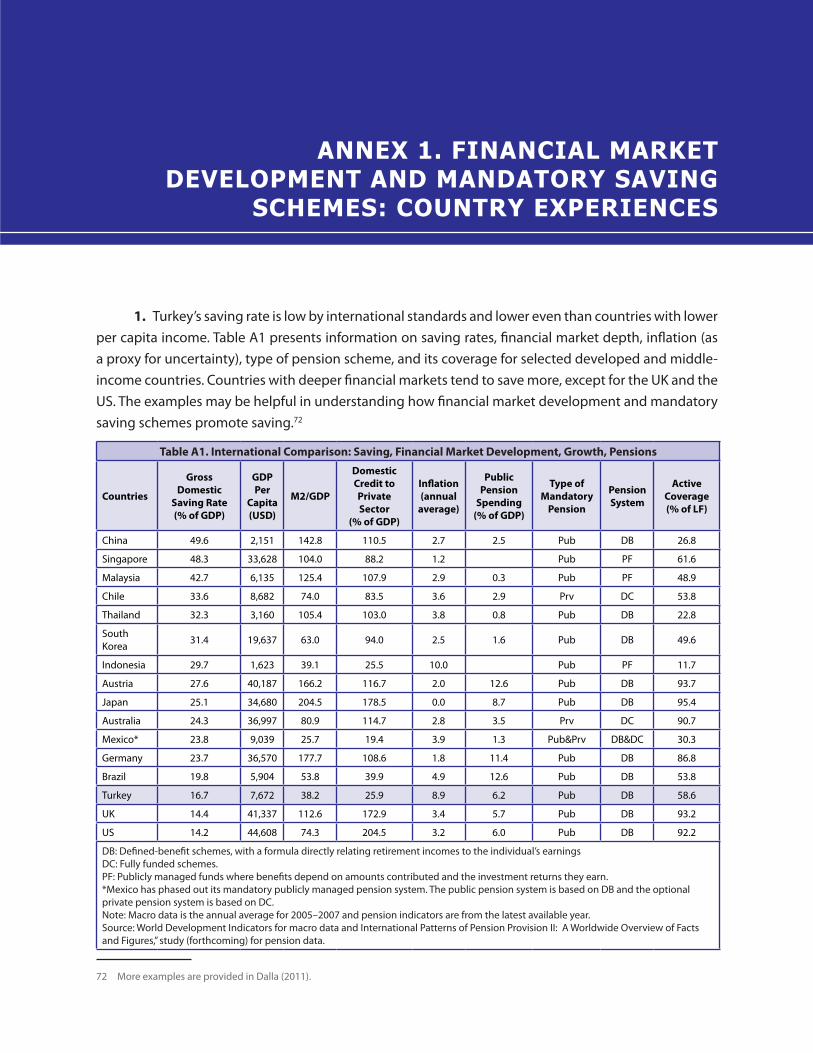
1. Turkey’s saving rate is low by international standards and lower even than countries with lower per capita income. Table A1 presents information on saving rates, financial market depth, inflation (as a proxy for uncertainty), type of pension scheme, and its coverage for selected developed and middle-income countries. Countries with deeper financial markets tend to save more, except for the UK and the US. The examples may be helpful in understanding how financial market development and mandatory saving schemes promote saving.72
Table A1. International Comparison: Saving, Financial Market Development, Growth, Pensions
Countries
Gross Domestic
Saving Rate(% of GDP)
GDP Per
Capita (USD)
M2/GDP
Domestic Credit to Private Sector
(% of GDP)
Inflation (annual
average)
Public Pension
Spending (% of GDP)
Type of Mandatory
Pension
Pension System
Active Coverage (% of LF)
China 49.6 2,151 142.8 110.5 2.7 2.5 Pub DB 26.8
Singapore 48.3 33,628 104.0 88.2 1.2 Pub PF 61.6
Malaysia 42.7 6,135 125.4 107.9 2.9 0.3 Pub PF 48.9
Chile 33.6 8,682 74.0 83.5 3.6 2.9 Prv DC 53.8
Thailand 32.3 3,160 105.4 103.0 3.8 0.8 Pub DB 22.8
South Korea 31.4 19,637 63.0 94.0 2.5 1.6 Pub DB 49.6
Indonesia 29.7 1,623 39.1 25.5 10.0 Pub PF 11.7
Austria 27.6 40,187 166.2 116.7 2.0 12.6 Pub DB 93.7
Japan 25.1 34,680 204.5 178.5 0.0 8.7 Pub DB 95.4
Australia 24.3 36,997 80.9 114.7 2.8 3.5 Prv DC 90.7
Mexico* 23.8 9,039 25.7 19.4 3.9 1.3 Pub&Prv DB&DC 30.3
Germany 23.7 36,570 177.7 108.6 1.8 11.4 Pub DB 86.8
Brazil 19.8 5,904 53.8 39.9 4.9 12.6 Pub DB 53.8
Turkey 16.7 7,672 38.2 25.9 8.9 6.2 Pub DB 58.6
UK 14.4 41,337 112.6 172.9 3.4 5.7 Pub DB 93.2
US 14.2 44,608 74.3 204.5 3.2 6.0 Pub DB 92.2
DB: Defined-benefit schemes, with a formula directly relating retirement incomes to the individual’s earningsDC: Fully funded schemes.PF: Publicly managed funds where benefits depend on amounts contributed and the investment returns they earn. *Mexico has phased out its mandatory publicly managed pension system. The public pension system is based on DB and the optional private pension system is based on DC.Note: Macro data is the annual average for 2005–2007 and pension indicators are from the latest available year.Source: World Development Indicators for macro data and International Patterns of Pension Provision II: A Worldwide Overview of Facts and Figures,” study (forthcoming) for pension data.
72 More examples are provided in Dalla (2011).
ANNEX 1. FINANCIAL MARKETDEVELOPMENT AND MANDATORY SAVING
SCHEMES: COUNTRY EXPERIENCES
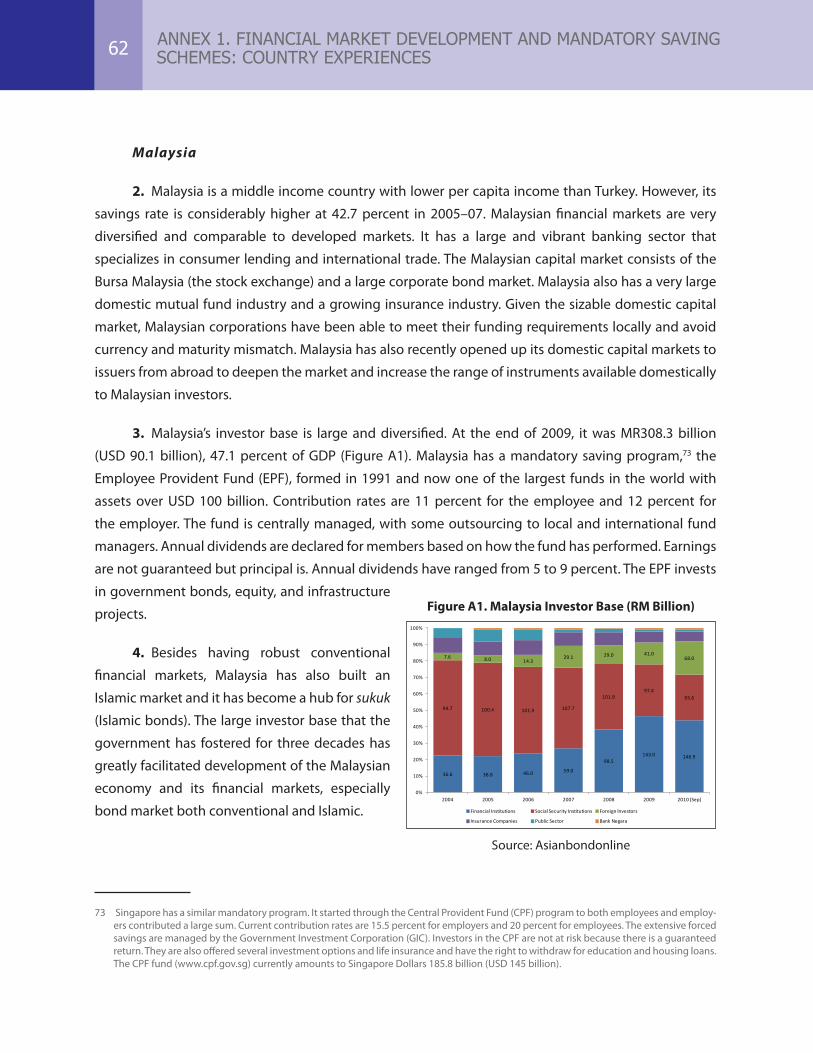
Malaysia
2. Malaysia is a middle income country with lower per capita income than Turkey. However, its
savings rate is considerably higher at 42.7 percent in 2005–07. Malaysian financial markets are very
diversified and comparable to developed markets. It has a large and vibrant banking sector that
specializes in consumer lending and international trade. The Malaysian capital market consists of the
Bursa Malaysia (the stock exchange) and a large corporate bond market. Malaysia also has a very large
domestic mutual fund industry and a growing insurance industry. Given the sizable domestic capital
market, Malaysian corporations have been able to meet their funding requirements locally and avoid
currency and maturity mismatch. Malaysia has also recently opened up its domestic capital markets to
issuers from abroad to deepen the market and increase the range of instruments available domestically
to Malaysian investors.
3. Malaysia’s investor base is large and diversified. At the end of 2009, it was MR308.3 billion
(USD 90.1 billion), 47.1 percent of GDP (Figure A1). Malaysia has a mandatory saving program,73 the
Employee Provident Fund (EPF), formed in 1991 and now one of the largest funds in the world with
assets over USD 100 billion. Contribution rates are 11 percent for the employee and 12 percent for
the employer. The fund is centrally managed, with some outsourcing to local and international fund
managers. Annual dividends are declared for members based on how the fund has performed. Earnings
are not guaranteed but principal is. Annual dividends have ranged from 5 to 9 percent. The EPF invests
in government bonds, equity, and infrastructure
projects.
4. Besides having robust conventional
financial markets, Malaysia has also built an
Islamic market and it has become a hub for sukuk
(Islamic bonds). The large investor base that the
government has fostered for three decades has
greatly facilitated development of the Malaysian
economy and its financial markets, especially
bond market both conventional and Islamic.
73 Singapore has a similar mandatory program. It started through the Central Provident Fund (CPF) program to both employees and employ-ers contributed a large sum. Current contribution rates are 15.5 percent for employers and 20 percent for employees. The extensive forced savings are managed by the Government Investment Corporation (GIC). Investors in the CPF are not at risk because there is a guaranteed return. They are also offered several investment options and life insurance and have the right to withdraw for education and housing loans. The CPF fund (www.cpf.gov.sg) currently amounts to Singapore Dollars 185.8 billion (USD 145 billion).
Figure A1. Malaysia Investor Base (RM Billion)
36.6 38.8 46.0 59.0
98.5143.0 146.9
94.7 100.4 101.9 107.7
101.997.4
93.6
7.6 8.0 14.329.1 29.0 41.0
68.0
0%
10%
20%
30%
40%
50%
60%
70%
80%
90%
100%
2004 2005 2006 2007 2008 2009 2010 (Sep)
Financial Institutions Social Security Institutions Foreign Investors
Insurance Companies Public Sector Bank Negara
Source: Asianbondonline
ANNEX 1. FINANCIAL MARKET DEVELOPMENT AND MANDATORY SAVING SCHEMES: COUNTRY EXPERIENCES62
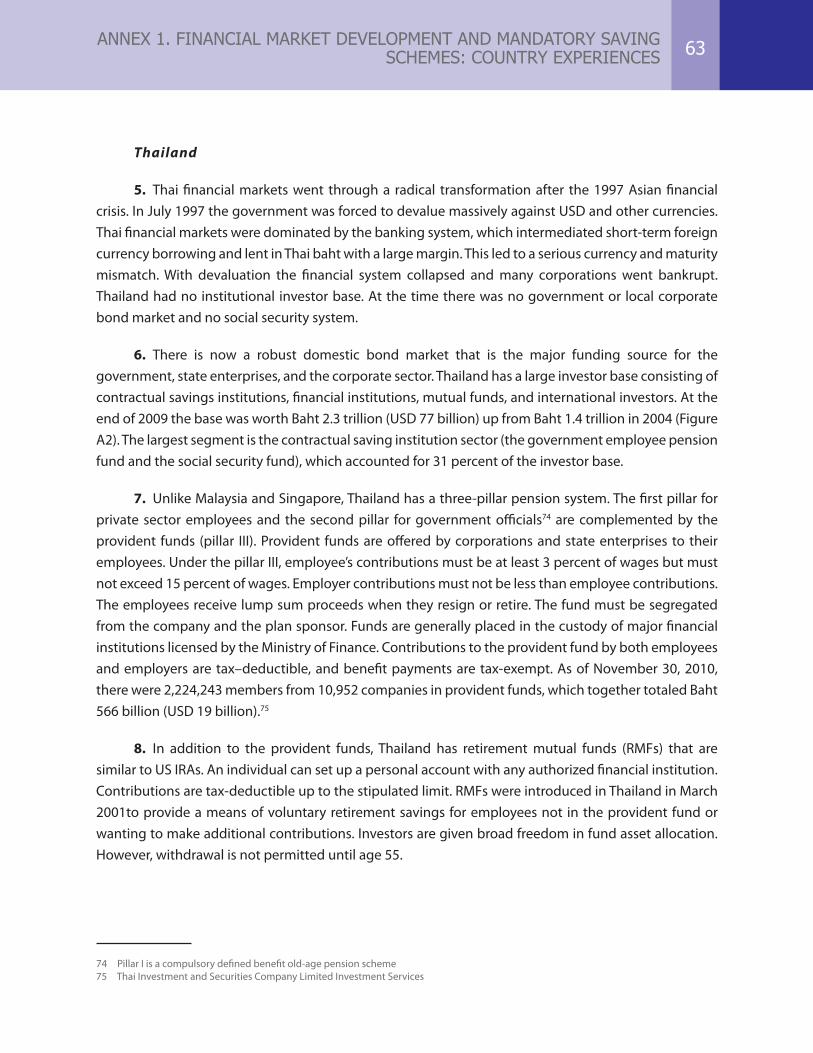
Thailand
5. Thai financial markets went through a radical transformation after the 1997 Asian financial crisis. In July 1997 the government was forced to devalue massively against USD and other currencies. Thai financial markets were dominated by the banking system, which intermediated short-term foreign currency borrowing and lent in Thai baht with a large margin. This led to a serious currency and maturity mismatch. With devaluation the financial system collapsed and many corporations went bankrupt. Thailand had no institutional investor base. At the time there was no government or local corporate bond market and no social security system.
6. There is now a robust domestic bond market that is the major funding source for the government, state enterprises, and the corporate sector. Thailand has a large investor base consisting of contractual savings institutions, financial institutions, mutual funds, and international investors. At the end of 2009 the base was worth Baht 2.3 trillion (USD 77 billion) up from Baht 1.4 trillion in 2004 (Figure A2). The largest segment is the contractual saving institution sector (the government employee pension fund and the social security fund), which accounted for 31 percent of the investor base.
7. Unlike Malaysia and Singapore, Thailand has a three-pillar pension system. The first pillar for private sector employees and the second pillar for government officials74 are complemented by the provident funds (pillar III). Provident funds are offered by corporations and state enterprises to their employees. Under the pillar III, employee’s contributions must be at least 3 percent of wages but must not exceed 15 percent of wages. Employer contributions must not be less than employee contributions. The employees receive lump sum proceeds when they resign or retire. The fund must be segregated from the company and the plan sponsor. Funds are generally placed in the custody of major financial institutions licensed by the Ministry of Finance. Contributions to the provident fund by both employees and employers are tax–deductible, and benefit payments are tax-exempt. As of November 30, 2010, there were 2,224,243 members from 10,952 companies in provident funds, which together totaled Baht 566 billion (USD 19 billion).75
8. In addition to the provident funds, Thailand has retirement mutual funds (RMFs) that are similar to US IRAs. An individual can set up a personal account with any authorized financial institution. Contributions are tax-deductible up to the stipulated limit. RMFs were introduced in Thailand in March 2001to provide a means of voluntary retirement savings for employees not in the provident fund or wanting to make additional contributions. Investors are given broad freedom in fund asset allocation. However, withdrawal is not permitted until age 55.
74 Pillar I is a compulsory defined benefit old-age pension scheme75 Thai Investment and Securities Company Limited Investment Services
ANNEX 1. FINANCIAL MARKET DEVELOPMENT AND MANDATORY SAVING SCHEMES: COUNTRY EXPERIENCES 63
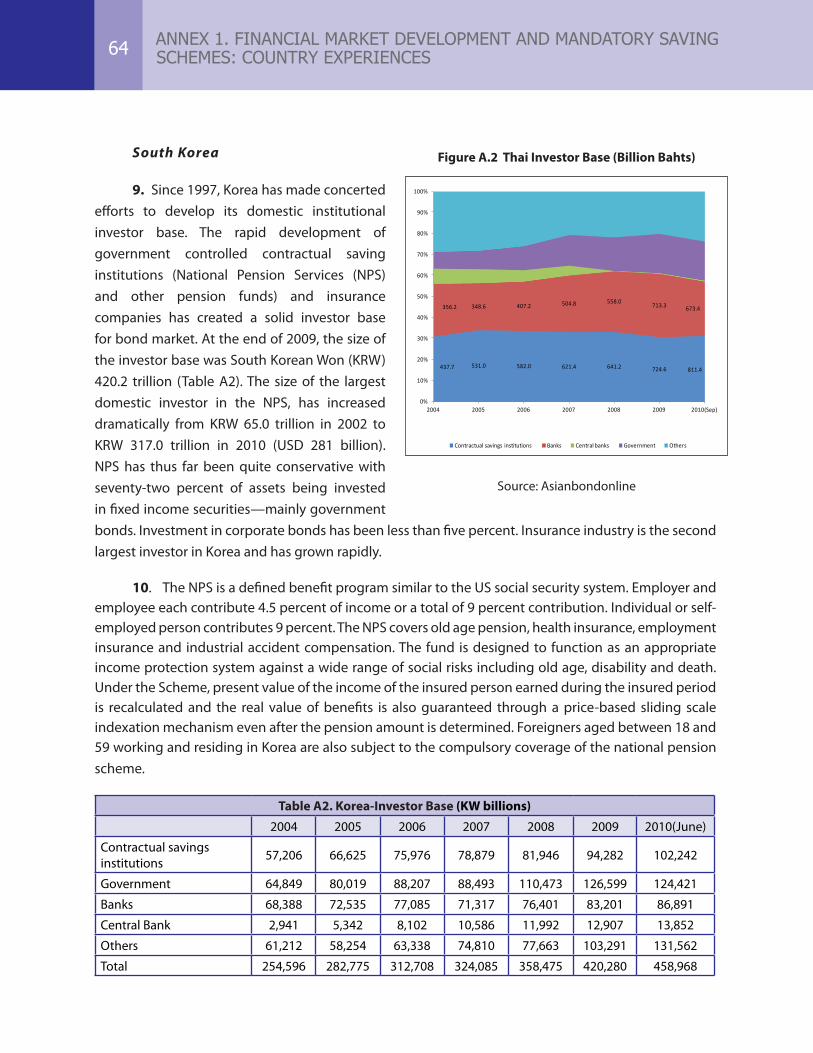
South Korea
9. Since 1997, Korea has made concerted efforts to develop its domestic institutional investor base. The rapid development of government controlled contractual saving institutions (National Pension Services (NPS) and other pension funds) and insurance companies has created a solid investor base for bond market. At the end of 2009, the size of the investor base was South Korean Won (KRW) 420.2 trillion (Table A2). The size of the largest domestic investor in the NPS, has increased dramatically from KRW 65.0 trillion in 2002 to KRW 317.0 trillion in 2010 (USD 281 billion). NPS has thus far been quite conservative with seventy-two percent of assets being invested in fixed income securities—mainly government bonds. Investment in corporate bonds has been less than five percent. Insurance industry is the second largest investor in Korea and has grown rapidly.
10. The NPS is a defined benefit program similar to the US social security system. Employer and employee each contribute 4.5 percent of income or a total of 9 percent contribution. Individual or self-employed person contributes 9 percent. The NPS covers old age pension, health insurance, employment insurance and industrial accident compensation. The fund is designed to function as an appropriate income protection system against a wide range of social risks including old age, disability and death. Under the Scheme, present value of the income of the insured person earned during the insured period is recalculated and the real value of benefits is also guaranteed through a price-based sliding scale indexation mechanism even after the pension amount is determined. Foreigners aged between 18 and 59 working and residing in Korea are also subject to the compulsory coverage of the national pension scheme.
Table A2. Korea-Investor Base (KW billions)
2004 2005 2006 2007 2008 2009 2010(June)
Contractual savingsinstitutions 57,206 66,625 75,976 78,879 81,946 94,282 102,242
Government 64,849 80,019 88,207 88,493 110,473 126,599 124,421
Banks 68,388 72,535 77,085 71,317 76,401 83,201 86,891
Central Bank 2,941 5,342 8,102 10,586 11,992 12,907 13,852
Others 61,212 58,254 63,338 74,810 77,663 103,291 131,562
Total 254,596 282,775 312,708 324,085 358,475 420,280 458,968
Figure A.2 Thai Investor Base (Billion Bahts)
0%
10%
20%
30%
40%
50%
60%
70%
80%
90%
100%
2004 2005 2006 2007 2008 2009 2010(Sep)
437.7 531.0 582.0 621.4 641.2 724.6 811.4
356.2 348.6 407.2 504.8 558.0 713.3 673.4
Contractual savings institutions Banks Central banks Government Others
Source: Asianbondonline
ANNEX 1. FINANCIAL MARKET DEVELOPMENT AND MANDATORY SAVING SCHEMES: COUNTRY EXPERIENCES64
11. The NPS has a sound governance structure. The Ministry of Health, Welfare and Family Affairs supervises the NPS Fund under the National Pension Act. National Pension Fund Management Committee is the top decision making committee that has the power to approve policy matters. The Fund Management Committee consists of 20 members from a broad range of professionals. The NPS fund is managed by investment professionals. NPS outsources a part of its assets to fund managers domestically and abroad. The NPS has consistently generated positive returns since its inception in 1988.
ANNEX 1. FINANCIAL MARKET DEVELOPMENT AND MANDATORY SAVING SCHEMES: COUNTRY EXPERIENCES 65


