336

The responsibility of the project and its implementation lies with the Ministry of Works and
Transport and the City of Windhoek
Consultancy services provided by
in consortium with
Master Plan of City of Windhoek including Rehoboth, Okahandja and Hosea Kutako International Airport
Project Team: 1. Ministry of Works and Transport Cedric Limbo Angeline Simana- Paulo Damien Mabengo Chris Fikunawa
2. City of Windhoek Ludwig Narib George Mujiwa Mayumbelo Clarence Rupingena Browny Mutrifa Horst Lisse Adam Eiseb
3. Polytechnic of Namibia 4. GIZ
Prof. Dr. Heinrich Semar Frederik Strompen Gregor Schmorl Immanuel Shipanga
5. Consulting Team Dipl.-Volksw. Angelika Zwicky Dr. Kenneth Odero Dr. Niklas Sieber James Scheepers Jaco de Vries Adri van de Wetering Dr. Carsten Schürmann, Prof. Dr. Werner Rothengatter Roloef Wittink Dipl.-Ing. Olaf Scholtz-Knobloch Dr. Carsten Simonis
Editors: Fatima Heidersbach, Frederik Strompen
Contact: Cedric Limbo Ministry of Works and Transport Head Office Building 6719 Bell St Snyman Circle Windhoek Clarence Rupingena City of Windhoek Deutsche Gesellschaft für Internationale Zusammenarbeit (GIZ) GmbH P.O Box 8016 Windhoek,Namibia, www.sutp.org
Cover photo: F Strompen, Young Designers Advertising
Layout: Frederik Strompen
Windhoek, 30/06/2013

Contents
Annex A: Contact List
Annex B: Minutes of the Steering Committee Meetings
Annex C: Memorandum of Understanding
Annex D: Maps
Annex E: Strategic Options
Annex F: Agenda and List of Invitees of Strategic Direction
Workshops
Annex G: Public Transport Operational Data per Line

Acronyms and abbreviations appearing in this Master Plan
AfDB African Development Bank
AGM Annual General Meeting
BAU Business as Usual
BEC Bicycle Empowerment Centre
BEN Bicycle Empowerment Network
BGIT Bachelor of Geo-Information Technology
BRT Bus Rapid Transit
CBD Central Business District
CBS Central Bus Station
CCC Central Control Centre
CEO Chief Executive Officer
CoW City of Windhoek
CRS Commuter Rail Service
DMU Diesel Multiple Unit
DoT Department of Transport
DoW Department of Works
FENATA Federation of Namibian Tourism Associations
FGD Focus Group Discussion
GEH Geoffrey E. Havers, inventor of a formular used in traffic planning
GIS Geographical Information System
GIZ Deutsche Gesellschaft für Internationale Zusammenarbeit
HOV High Occupancy Vehicle
IFI International Financing Institution (for technical and/or financial assistance)
ILFF Institutional, Legal and Financial Framework
ITF International Transport Forum
KfW Kreditanstalt für Wiederaufbau
LAs Local Authorities
LOV Low Occupancy Vehicles
MLTRMP Medium to Long Term Roads Master Plan
MRLGHRD Ministry of Regional and Local Government, Housing and Rural Development
MTEF Medium Term Expenditure Framework
MVA Motor Vehicle Accident Fund
MWT Ministry of Works and Transport
NABTA Namibian Bus and Taxi Association
NAMPAB Namibia Planning Advisory Board
NAMPOL Namibian Police
NaTA National Transport Authority (to be established)
NCCI Namibia Chamber of Commerce and Industry
NCT Namibia Consumer Trust
NDC Namibia Development Corporation
ND-LUP National Diploma in Land Use Planning
NDP 4 Namibia’s Fourth National Development Plan 2012/13 to 2016/17
NEIA Nachhaltige Entwicklung in Afrika e.V
NMT Non-motorised Transport
NPC National Planning Commission
NRSS Namibia Road Safety Strategy
NTB Namibia Tourism Board
NTTU Namibia Transport and Taxi Union
N$ Namibian Dollar
OECD Organisation for Economic Cooperation and Development
OMC Okahandja Municipal Council
PAY Physically Active Youth
pkm Passenger Kilometer
PoN Polytechnic of Namibia
PPP Public Private Partnership
PSO Public Service Obligation
PSP Private Sector Participation
RA Road Authority
RCC Roads Contractor Company
RCs Regional Councils
RFA Road Fund Administration
ROW Right-of-Way
RUC Road User Charging
ILFF Institutional, Legal and Financial Framework
SCST Special Commission on Sustainable Transport (to be established)
SoE State-owned Enterprise
ST Sustainable Transport
SUT Sustainable Urban Transport
SUTMP Sustainable Urban Transport Master Plan
SWAp Sector Wide Approach
TAs Traditional Authorities
TIPEEG Targeted Intervention Program for Employment and Economic Growth
TM Transport Management
TDM Transport Demand Management
TOD Transit Oriented Development
ToR Terms of Reference
WCPS Windhoek City Police Service
WP Work-Package
UK United Kingdom
USA United States of America

Annex A
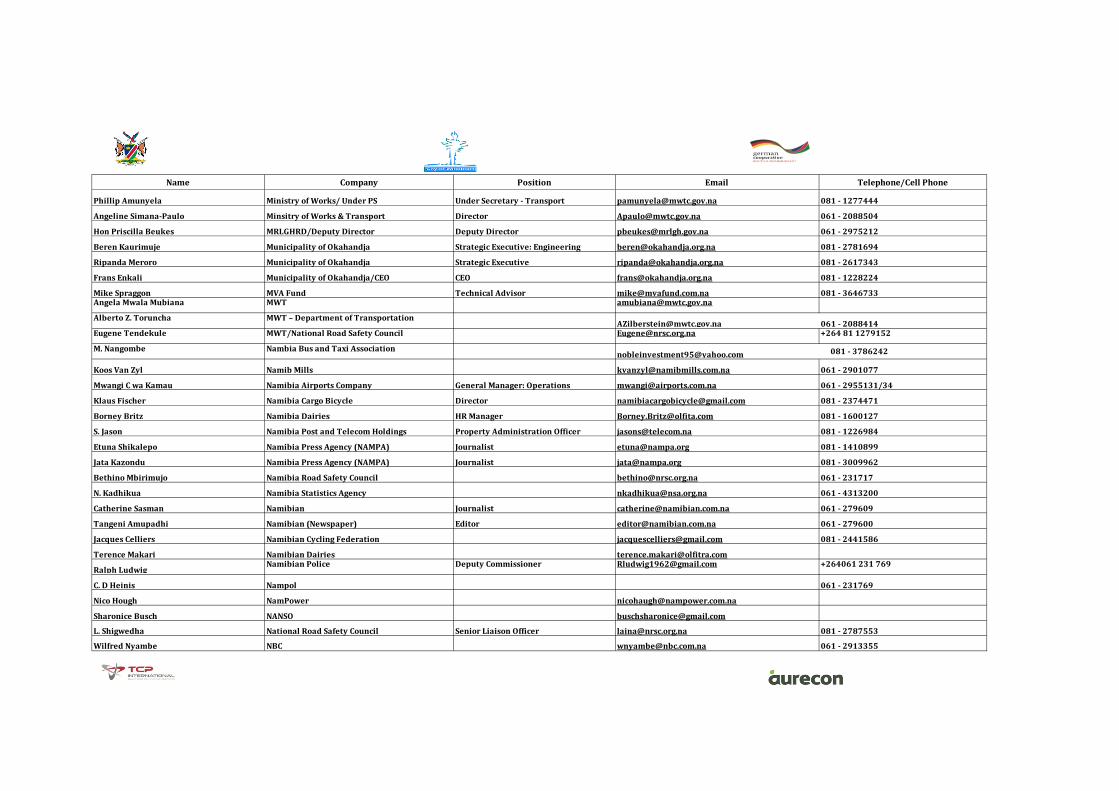
Contact List
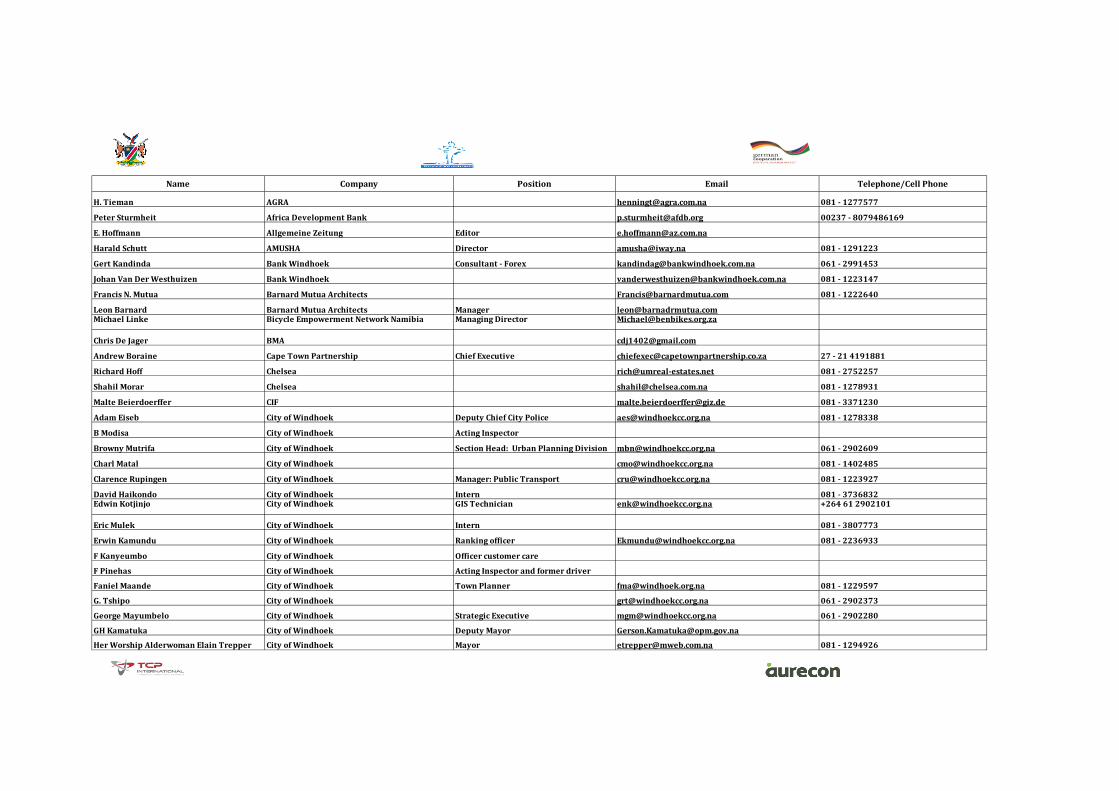
Name Company Position Email Telephone/Cell Phone
H. Tieman AGRA [email protected] 081 - 1277577
Peter Sturmheit Africa Development Bank [email protected] 00237 - 8079486169
E. Hoffmann Allgemeine Zeitung Editor [email protected]
Harald Schutt AMUSHA Director [email protected] 081 - 1291223
Gert Kandinda Bank Windhoek Consultant - Forex [email protected] 061 - 2991453
Johan Van Der Westhuizen Bank Windhoek [email protected] 081 - 1223147
Francis N. Mutua Barnard Mutua Architects [email protected] 081 - 1222640
Leon Barnard Barnard Mutua Architects Manager [email protected] Linke Bicycle Empowerment Network Namibia Managing Director [email protected]
Chris De Jager BMA [email protected]
Andrew Boraine Cape Town Partnership Chief Executive [email protected] 27 - 21 4191881
Richard Hoff Chelsea [email protected] 081 - 2752257
Shahil Morar Chelsea [email protected] 081 - 1278931
Malte Beierdoerffer CIF [email protected] 081 - 3371230
Adam Eiseb City of Windhoek Deputy Chief City Police [email protected] 081 - 1278338
B Modisa City of Windhoek Acting Inspector
Browny Mutrifa City of Windhoek Section Head: Urban Planning Division [email protected] 061 - 2902609
Charl Matal City of Windhoek [email protected] 081 - 1402485
Clarence Rupingen City of Windhoek Manager: Public Transport [email protected] 081 - 1223927
David Haikondo City of Windhoek Intern 081 - 3736832Edwin Kotjinjo City of Windhoek GIS Technician [email protected] +264 61 2902101
Eric Mulek City of Windhoek Intern 081 - 3807773
Erwin Kamundu City of Windhoek Ranking officer [email protected] 081 - 2236933
F Kanyeumbo City of Windhoek Officer customer care
F Pinehas City of Windhoek Acting Inspector and former driver
Faniel Maande City of Windhoek Town Planner [email protected] 081 - 1229597
G. Tshipo City of Windhoek [email protected] 061 - 2902373
George Mayumbelo City of Windhoek Strategic Executive [email protected] 061 - 2902280
GH Kamatuka City of Windhoek Deputy Mayor [email protected]
Her Worship Alderwoman Elain Trepper City of Windhoek Mayor [email protected] 081 - 1294926

Name Company Position Email Telephone/Cell Phone
Hilma Shikangala-Hamata City of Windhoek Town Planner [email protected] 081 - 1229050Horst Lisse City of Windhoek Chief Engineer/ Planning, Traffic flow [email protected] +264 61 290 2468
Immanuel Johannes City of Windhoek Intern 081 - 2076529
Irwin D Haihambo City of Windhoek Manager: Staffing & Remuneration [email protected] 081 - 1275171
J Ndara City of Windhoek Inspector - Route & revenue
J. Amukugo City of Windhoek [email protected] 081 - 1223929
James Kalundu City of Windhoek Manager: Community Development [email protected] 081 - 1221362
Johanna Shikukutu City of Windhoek Head: Bus Operation (Public Transport) [email protected] 061 - 2902324
John Shilongo City of Windhoek [email protected] 061 - 2902491Ludwig Narib City of Windhoek Strategic Executive: Urban Planning [email protected] +264 61 2902 073
M Kajori City of Windhoek Inspector
Mahne Kruger City of Windhoek Business Researcher [email protected] 061 - 2902974
Ndapunikwa Shanyengana City of Windhoek Intern
P Gowases City of Windhoek Inspector
Toini Paulus City of Windhoek Intern
Tomas Mutota City of Windhoek Intern 081 - 3015899
Vernonman Endjala City of Windhoek [email protected] 081 - 1403166
Zurilea Steenkamp City of Windhoek Manager: Economic Development [email protected] 081 - 2775312
G Tshipo City of Windhoek Enviromentalist [email protected] 081 - 1405034
Fred Konjo City of Windhoek- Enviroment 081 - 1402460F Koujo City of Windhoek – Planning, planning [email protected]
U Karimbue-Mupaine City of Windhoek – Planning, planning [email protected]
G. Esterhuizen City of Windhoek Strategic Executive Strategic Executive - Finance 061 - 2902008
Gerson James City of Windhoek: City police Assistant Superintendent [email protected] 081 - 1220160
Wycliff Shililifa City of Windhoek: City police Superintendent: Project Manager CCTV [email protected] 081 - 2785216
Olavi Makuti City of Windohek Enviroment 081 - 1405033Abraham Katokeni Kanime City Police Windhoek Chief City Police [email protected] +264 81 1244 479
Salatise Erastus Cycle Wholesale 081 - 1284988
Zieggy Mengerssen Cycletec [email protected]
Damien Agnew Das Bike Shop [email protected]

Name Company Position Email Telephone/Cell Phone
Carsten Antoni DHPS [email protected]
Marina Jurgens DHPS Registration [email protected] 061 - 373145
Reinhard Lipp DHPS Head of Pre-Primary Section [email protected] 061 - 373139
Cris S Fikunawa DOT: Legislation 061 - 2088152
Andriaan Van Der Merwe DP Burmeister & Partners Director: Civil & Transporting Eng [email protected] 081 - 1285662
Andriaan Van Der Merwe DP Burmeister & Partners Director: Civil & Transporting Eng [email protected] 081 - 1285662
Celestino G. Antonio Easi Move Owner [email protected] 081 - 1471157
L. Khobeto Economist Journalist [email protected] 081 - 2377422
Antonio Nunez Egis International Transport Economist [email protected] 0033 - 1 30 124881
Francois-Marc Turpin Egis International Transport Economist [email protected] 00261 - 32 41 49587
Timothy Winn Egis International Team Leader [email protected] 00264 - 818290889
Ernst Kubirske ELUNA [email protected] 081 - 1270364
Darlington Mushipe Espirit Dáfrica 081 - 2027857
Andre Snyman Feedmaster [email protected] 061 - 218713
J. Jonbet FNB 081 - 2779039
Andre Scholz German Embassy - Windhoek Standiger Vertreter [email protected] 081 - 1222745
Fikre Fedade Selasie GIZ [email protected] 081 - 4773454
Frederik Strompen GIZ Technical Advisor [email protected] 081 - 6200808
Friedrich Von Kenne GIZ Country Director
Gregor Schmorl GIZ Technical Advisor [email protected] 081 - 8114585Immanuel Shipanga GIZ Technical Advisor [email protected] +264 81 1412 330
Michael Engelskirchen GIZ [email protected]
Noag Haunjimba GIZ +264 81 1429 455
Prof. Dr.-Ing. Heinrich Semar GIZ Programme Manager [email protected] +264 81 1292 700
Sebastian Goellner GIZ [email protected]
Stefan Ruhs GIZ [email protected]
Victoria Gillam GIZ [email protected]
Detlev Hovelman Hartlief Food & Beverage Manager [email protected] 081 - 1428880
Diana Wucher Herboths Blick [email protected] 081 - 1299829
Hans Kolberg HKEcc [email protected] 081 - 1245028

Name Company Position Email Telephone/Cell Phone
Gitta Paetzold Hospitality Association [email protected] 061 - 222904
Nezar Uys Intercape Area Manager Namibia [email protected] 081 - 1415566
jessica Lavelle IRONC [email protected] 081 - 7587943
Janette Botha JB Consult Legal & Policy Advisor [email protected] 0027 - 832273717
Anna Mafwila Katu Tours [email protected] 081 - 3032856
Anna Mafwila Keith Tour and Safari [email protected]
Joschka Greve KFW Programme Manager [email protected] 081 - 1486428
Michael Jainzik KFW Director [email protected] 081 - 1492649
Franklin Chilinda Khomas Regional Council Deputy Director: Planning & Develop [email protected] 081 - 1297472
Sonja Philander Khomas Regional Council [email protected] 061 - 2924300
Taleni Mabakeng Khomas Regional Council Regional Development Planner [email protected] 081 - 1471714
Desiree Links King's Daughters Org [email protected]
Eilemi Louw King's Daughters Org [email protected]
Chris Van Der Vyver M & Z Motors [email protected] 061 - 372002
Marybeth Gallagher Maerua Rotary Club President [email protected]
Frank Snyman Maxes Toshiba Managing Director [email protected] 081 - 1240630
Eva Maasdorp Mayor of Rehoboth Mayor 062 - 521800
Poit Louw Mbm Design Consultant [email protected]
Linda F. Iipinge Metropolitan Namibia Consultant [email protected] 081 - 3773177
Manfred Sass MGS Financial & Investment Service CFA (Nam) [email protected] 081 - 2509334
E. Victor Bok Ministry of Justice/Deputy Chief Deputy Chief: Legal Advice [email protected] 081 - 2183028
Frieda Andreas Ministry of Regional Local Government [email protected] 081 - 2479445
P. Mbala Ministry of Regional Local Government pmbala@[email protected] 081 - 2221886
Cedric Limbo Ministry of Works & Transport [email protected] 081 - 1505858
Damien Mabengano Ministry of Works & Transport Deputy Director: Transportation Regulat [email protected] 081 - 2415692
Lemmy Mulongo Ministry of Works & Transport ì[email protected] 081 - 3677326
Robert Kalomho Ministry of Works & Transport Director: Railway Affairs [email protected] 081 - 1410467
Asteria Nasheya Ministry of Works and Transport DirectorTransport Infrastructure [email protected] Daes Pienaar Ministry of Works and Transport Under PS [email protected] 061 - 2088823
Peter Mwatile Ministry of Works/ PS PS [email protected] 081 - 1243938
Name Company Position Email Telephone/Cell Phone
Phillip Amunyela Ministry of Works/ Under PS Under Secretary - Transport [email protected] 081 - 1277444
Angeline Simana-Paulo Minsitry of Works & Transport Director [email protected] 061 - 2088504
Hon Priscilla Beukes MRLGHRD/Deputy Director Deputy Director [email protected] 061 - 2975212
Beren Kaurimuje Municipality of Okahandja Strategic Executive: Engineering [email protected] 081 - 2781694
Ripanda Meroro Municipality of Okahandja Strategic Executive [email protected] 081 - 2617343
Frans Enkali Municipality of Okahandja/CEO CEO [email protected] 081 - 1228224
Mike Spraggon MVA Fund Technical Advisor [email protected] 081 - 3646733Angela Mwala Mubiana MWT [email protected]
Alberto Z. Toruncha MWT – Department of [email protected] 061 - 2088414
Eugene Tendekule MWT/National Road Safety Council [email protected] +264 81 1279152
M. Nangombe Nambia Bus and Taxi [email protected] 081 - 3786242
Koos Van Zyl Namib Mills [email protected] 061 - 2901077
Mwangi C wa Kamau Namibia Airports Company General Manager: Operations [email protected] 061 - 2955131/34
Klaus Fischer Namibia Cargo Bicycle Director [email protected] 081 - 2374471
Borney Britz Namibia Dairies HR Manager [email protected] 081 - 1600127
S. Jason Namibia Post and Telecom Holdings Property Administration Officer [email protected] 081 - 1226984
Etuna Shikalepo Namibia Press Agency (NAMPA) Journalist [email protected] 081 - 1410899
Jata Kazondu Namibia Press Agency (NAMPA) Journalist [email protected] 081 - 3009962
Bethino Mbirimujo Namibia Road Safety Council [email protected] 061 - 231717
N. Kadhikua Namibia Statistics Agency [email protected] 061 - 4313200
Catherine Sasman Namibian Journalist [email protected] 061 - 279609
Tangeni Amupadhi Namibian (Newspaper) Editor [email protected] 061 - 279600
Jacques Celliers Namibian Cycling Federation [email protected] 081 - 2441586
Terence Makari Namibian Dairies [email protected]
Ralph LudwigNamibian Police Deputy Commissioner [email protected] +264061 231 769
C. D Heinis Nampol 061 - 231769
Nico Hough NamPower [email protected]
Sharonice Busch NANSO [email protected]
L. Shigwedha National Road Safety Council Senior Liaison Officer [email protected] 081 - 2787553
Wilfred Nyambe NBC [email protected] 061 - 2913355

Name Company Position Email Telephone/Cell Phone
Johanna Shiweda NCCI PRO & Manager [email protected] 081 - 1240424
Tim Parkhouse NEF Secretary General [email protected] 081 - 1270126
Paulus Paulus New Era Journalist [email protected] 081 - 3210593
Barbara Wayrach NEWS Journalist [email protected] Tierspoor NRSC Head Communications [email protected]
081 - 1555507
Barbara Huber-Schauch Nuevas Ideas cc [email protected]
Cllr David Uri-khob Okahandja Town Mayor Mayor [email protected] 081 - 2300040
Johannes Metumo Shikongo Oshinge Hair & Skin Cosmetics Owner [email protected] 061 - 212749
Uwe Pockler Pockler Consulting Consultant [email protected] 081 - 6810320
A. Christensen Polytechnic of Namibia Lecturer [email protected]
A. Jacobs Polytechnic of Namibia Lecturer [email protected] 081 - 2721901
Amos Owen Thomas Polytechnic of Namibia Professor [email protected] 061 - 2072809
C. Savage Polytechnic of Namibia Deputy Director [email protected] 081 - 7488914
Dr Robert Riethmueller Polytechnic of Namibia Lecturer [email protected] 061 - 2072967
Elfas !Owos-Oab Polytechnic of Namibia Lecturer [email protected] 081 - 4676084
Karen Muteze Polytechnic of Namibia Lecturer [email protected] 081 - 8259121 / 061 - 2072778
Morgan Hauptfleisch Polytechnic of Namibia Lecturer [email protected]
Natangue Shipiki Polytechnic of Namibia Lecturer [email protected] 081 - 2302844
Oscar Kaveru Polytechnic of Namibia Lecturer [email protected] 081 - 1227252 / 061 - 207 2650
Samson Umenne Polytechnic of Namibia Lecturer [email protected] 085 - 5502211
Jaap Blaauw Pupkewitz and Sons [email protected]
E. De Waal Rehoboth Town Council Technical Manager 081 - 3503801
E. Felix Rehoboth Town Council Chairman 062 - 521800
J.K. Iipinge Rehoboth Town Council Finance Manager 062 - 521800
Theo Jankowski Rehoboth Town Council CEO [email protected] 081 - 1223403
W.I. Swartz Rehoboth Town Council Manager: HR & Corp. Aff [email protected] 062 - 521800 / 081 - 1244761
H. Lamprecht Republikein Journalist [email protected] 061 - 2972000
Jacques Du Toit Republikein Journalist [email protected] 081 - 1477914
E. Khiba RFA [email protected] 081 - 1281415
Elina N Lumbu Road Authority Project Control Engineer [email protected] 081 - 2948422

Name Company Position Email Telephone/Cell Phone
Andreas Helmich Road Fund Manager: Programme/Policy/advice [email protected] 081 - 1284740
Dr Alan Ross Road Safety Manangement advisor Advisor [email protected] 44 - 7801428082
K. Urban Roads Authority [email protected] 061 - 2847027
Penda Hangala Roads Construction Company [email protected] 081 - 2865750
Ian Goussow Rock and Rut MTB [email protected] 081 - 2773843
Miguel Gomes Antonio sachi Executive Director [email protected] 081 - 3115232
Horst Heimstadt SAIF/Cyclist Coordinator [email protected] 081 - 2723413
Andrew Main Schrober.Main. Architects Director [email protected] 081 - 4164461
Walter Cloete Social Security Commission [email protected] 081 -3649014
Gunther Stubenrauch Stubenrauch Planning Consultants Managing Member [email protected] 081 - 1291189
Surita Smit Swaco Group of Co's [email protected] 061 - 233051
Felix Tjozongoro SWEROAD Road Transport Security Expert [email protected] 081 - 6454540
Ally Karoema TASA [email protected] 081 - 1246028
Dirk Kleinschmidt TASA [email protected] 081 - 1484104
Eugenia Taylor-Tjaronda Trans Namib Acting CEO [email protected] 081 - 1650111
Hippy Tjivikua TransNamib Operation Manager [email protected] 081 - 1242919
Reggie Du Toit TransNamib Manager: Road Operations [email protected] 081 - 1226010
Ojijo Odhiambo UNDP Economic Advisor [email protected] 081 - 4214165
Martin Esslinger Valco Sales & Service [email protected] 061 - 261199
Girbert Boois Walvisbay Corridor Group Project Manager [email protected] 081 - 4472625
H.G Roeschlau Whk Ratepayers & Rest A [email protected] 081 - 1280742
Koos Steyn Windhoek Consulting Engineering Engineer [email protected] 081 - 1243355
Victor Rieger Windhoek Consulting Engineering Director [email protected] 081 - 2782632
Justin Ellis Windhoek Pedal Power [email protected] 081 - 1244211
Alex Brock You Think Green [email protected]
Beatrice Brock You Think Green [email protected]
Jennifer Eises You Think Green [email protected]
Tracy Hoxdoes You Think Green [email protected]
Undji Usurua You Think Green
Micheal Mulunga Young Achievers [email protected] 081 - 3.860010
Jeanette Nievera Young Designers Advertising [email protected] 061 - 244458
Jessica Jacobs Young Designers Advertising [email protected] 061 - 244458GIZ Office Windhuk +264 (0) 61 222447

Annex B
Minutes of the
Steering Committee
Meetings
Inception Meeting Sustainable Urban Transport
MINUTES 18 JULY 2012 8.30 AM IMMANUEL NGATJIZEKO COMMITTEE
ROOM, 6TH FLOOR (CITY OF WINDHOEK)
MEETING CALLED BY CoW, MWT, GIZ and TCP/Aurecon
TYPE OF MEETING Inception Meeting Sustainable Urban Transport
FACILITATOR Clarence Rupingena
ATTENDEES
Name Institution Contact
1. Adam Eiseb CoW-Traffic Policing 0811278338
2. Browny Mutrifa CoW-Planning 0811225386
3. Clarence M.U Rupingena CoW-Public Transport 0811223927
4. Erwin Kamunda CoW-Public Transport 0812236933
5. Fred Konjo CoW-Environment 0811402460
6. Horst Lisse CoW-Transportation 0812505412
7. Olavi Makuti CoW-Environment 0811405033
8. CS Fikunawa DOT: Legislation 0612088152
9. Frederik Strompen GIZ Technical Advisor 0816200806
10. Gregor Schmorl GIZ Technical Advisor 0818814585
11. Immanuel Shipagga GIZ 0811412330
12. Michelle Kwa GIZ Intern
13. Prof. Heinrich Semar GIZ Program Director 0811292700
14. Alberto Zilberstein-Toruncha MWT 0813329920
15. Angeline Simana Paulo MWT-DOT 0811242735
16. Adri van de Wetering TCP/Aurecon Transport Modeller +27741050346
17. Angelika Zwicky TCP/Aurecon Team Leader 0818594545
18. James Scheepers TCP/Aurecon NMT/TDM Specialist +27124272566
19. Kenneth Odero TCP 0818594546

Agenda topics
10 MINUTES WELCOMING AND INTRODUCTION CLARIFICATION OF ROLES AND RESPONSIBILITIES
CONCLUSIONS
Introduction of attendees on roles and responsibilities
PS: Ludwig Narib was absent due to illness
20 MINUTES PRESENTATION OF TERMS OF REFERENCE FOR THE MASTER PLAN OF PUBLIC TRANSPORT
FREDERIK STROMPEN
CONCLUSIONS
Clearification of the objectives of the Master Plan of Public Transport in City of Windhoek
Examples of measures on a global level are illustrated and the vision of the Master Plan is presented
20 MINUTES PRESENTATION OF PROJECT APPROACH, SCHEDULE AND MILESTONES
ANGELIKA ZWICKY
CONCLUSIONS
Introduction on company profile and list of internal/short term experts of the transport consulting partners
Team leader of the project from Transport Consulting Partners (TCP) is represented by Angelika Zwicky together with Prof. Kenneth Odero who acts as institutional expert of TCP. Both remain as permanent long-term expert in Windhoek.
ACTION ITEMS PERSON RESPONSIBLE DEADLINE
Inception/Analysis Report TCP/Aurecon End of August 2012
Internal Workshop on Strategic Directions TCP/Aurecon End of October 2012
Final Draft of Sustainable Urban Transport Master Plan TCP/Aurecon Mid of February 2013
Final of Sustainable Urban Transport Master Plan TCP/Aurecon Early April 2013
45 MINUTES DISCUSSION ALL
DISCUSSION
A) Nomination of counterparts B) Steering committee C) Office space D) Office access E) Telephone/Fax F) Provision of data/data gathering
CONCLUSIONS
A) List of counterparts can be obtained by the end of the meeting. All agree to be fully committed to the project . Angline Simana Paulo ensured that the Department of Transport within the MWT is fully commited to the project.
B) All attendees of the meeting will be represented in the steering committee of the project C) Office has been placed in:
Public Transport Division Bus Operations Section 34 Patternson Street Southern Industria Windhoek
D) 24 hour access E) Tables, chairs and telephone/fax will be provided but not computers and internet access F) Technical issues on list and data available will be discussed on the next meeting
Angeline Simana Paulo stressed on the importance of skills to be transferred from international experts to local stakeholders in order to strengthen the foundation and initiate engagement and teamwork in the project
Achieve mutual support and encouragement from all partners by providing full commitment
Physically locate experts on the field to promote learning space and opportunities.
Action on social inclusion of the Master Plan can be instigated through NGOs participation in order to get public opinion to address inequality amongst the urban poor on mobility issues especially in Northern Windhoek
Engagement of public opinion/direct commentary can be improved if systematic measures/plans are taken ie Webpage development
Further questions on management on staff allocation, structure planning, recruitment of new members and committee on daily tasks for project assistance are raised.

10 MINUTES DISCUSSION ONF TABLE OF CONTENT OF THE MASTER PLAN
ALL
DISCUSSION
Draft of Table of Content
1. Introduction
2. Strategic Direction
3. Existing future Direction
4. Institutional Framework
5. Public Transport
Note: Taxis network/public assess are incorporated
Ideas: Not to limit or restrict measurements to city government of Windhoek but also to implement it at central government
Problems: Limited budget from the central government. Able to present better options, idea and outcome through the Master
Plan (to plan a road/networks) but also to highlight soft measures such as generating income through better infrastructure
6. Non-motorized Transport
Example: cycling/infrastructure
7. Managing Transportation
Measures: Environmental friendly alternatives such as e-mobility to control environmental pollution
8. Inter-city transportation
Example: PPP
9. Financial/Economic Analysis
Note: No bankable feasibility studies/ONLY feasibility in terms of measures
10. Financial/Implementation Plan
To integrate this Master Plan of City Windhoek to National Planning Policy
Problems: Transportation system not effective implemented, no national level interest and limitation in capacity has made it not viable
Problems: The current White Paper of Transport is outdated written in 1995 where public infrastructure is not included
CONCLUSIONS
State will materialize the Master Plan in the future as stated in Rio +20 to integrate sustainable transport services and systems as an approach to reduce poverty as well as part of MDG. This will therefore strengthen the state commitment in the field of transport.
Much has to be done to enable the mobility of the urban poor in order to change the developmental phase of the inequality.
With the implementation of this Master Plan, CoW can be a role model to other cities therefore this project is fully supported by the ministry of work and transport with the hope of increased budget allocation in the future.
ACTION ITEMS PERSON RESPONSIBLE DEADLINE
Website development: Inform public on aims, targets as well as collect feedbacks and comments from the public about the Master Plan of Sustainable Urban Transports in the City of Windhoek. Website will be transferred to CoW to provide information on public transport (exp bus schedule, routes and fare)
To date: NAMTECH ICT Solutions (PTYI Ltd
November 2012
Press release to increase visibility of the Master Plan to the public GIZ End of July 2012
Meeting ended at 10:46 am


26.02.2013
1
© 2009, Itron Inc.
Sustainable Urban Transport Master Plan for Windhoek
Inception Meeting, 18th July, 2012
Project Approach, Schedule and Milestones
A project of the
= > less accidents and fatalities
= > less pollutant
= > more oriented towards the mobility and access needs of the majority
= > affordable for all and financially viable
= > economically sound
Together thinking about and working for a more
sustainable transport in Windhoek
2
The future depends on what we do in the present (M. Ghandi)
Let us think about all mobility determining parameters
3
Traffic
Management Traffic Surface Management
Traffic
Operation
Passenger
Information
Mass
Transit Operation Parking
Manage-
ment
´Sustainable‚ Urban Mobility'
Transportation
Systems
Taxi Comm.
Taxi
Ticketing
Traffic
Infrastructure
Traffic Information
Traffic
Management
Economy &
Labour
Society &
Values Politics &
Legislation
Environment &
Resources
Streets
Rail
P+R
Bus
Stop
Airport Railway Station
Interurban Transportation
Technology
4
Experience shows that active participation, dissemination and public
information via different means, media and press involvement is a must
for achieving sustainable urban transportation systems
Joint Communication Strategy required
Sustainable transport ought to be a win/win situation for all stakeholders
We need all parts of the urban society getting actively involved

26.02.2013
2
How we intend to achieve this - suggested milestones
5
Jul
12 Aug 12 Sep 12 Oct 12 Nov 12 Dec 12 Jan 13 Feb 13 Mar 13 Apr 13 Mai 13
Imple-
men-
tation
Incorporati
ng
comments (+ strategy for
implementation
)
Modellin
g,
Analysis
,
Scenari
os
Review and
Data Collection
Master Plan
Development (refinement of forecasting,
appraisals, financing
options etc. for potential
measures)
Your project partners from TCP/Aurecon
6
Role Name Qualifications
Team Leader Angelika Zwicky
Masters degree in transport economy More then 24 years of experience in transport consulting Experience in transport strategy and master plan development for urban environments in the Cities of Moscow, Warsaw, 5 pilot cities in Uzbekistan, Bogota and Palma de Mallorca. Further strategic and master planning she did for the transport sector in Lebanon, Jordan and Egypt as well as for the TRACECA corridor from EU via Caucasus to Central Asia. Main fields of expertise are transport planning, socio-economic and legal assessments, traffic surveys and in appraisal of financial, economic, environmental, legal and institutional feasibility, project financing and project management.
Institution Building Expert
Prof. Dr. Kenneth Odero
PhD in Urban and Regional Planning and can rely on more then 20 years of working experience in the transport sector in southern Africa worked in various capacities liaising with governments, donors, universities, consultants, and communities on the policy, strategy, feasibility, design, training and implementation of projects at urban, national and regional levels. academic career with regional, rural and urban planning theories and methods and shaping institutions for development at the University of Nairobi and the University of Zimbabwe on matters of sustainable transportation such as climate change issues, decarbonisation strategies / clean vehicles, non-motorised transport in urban and rural areas, accessibility of the poor, gender and HIV aspects in transportation.
Your project partners from TCP/Aurecon
7
Role Name Qualifications
Transport Modelling Specialist
Mrs Adri van de Wetering
Masters degree in transportation planning More then 10 years of experience in transport modelling She developed the transport model for the Transport Land-Use Study of the CoW, conducted the household survey, established the base year model, forecasted the traffic and did the report writing. She is also familiar with principles of sustainable transport especially with a view to environmental impact assessments
GIS and Traffic Analysis and Data Base Specialist
Mr. Carsten Schürmann
PhD in spatial planning: “Regional Impacts of Transport Infrastructures” More then 16 years of work experience in international consulting projects
Transport and accessibility modelling
Land use - transport feedback cycle and Transport Policy Analysis and strategy development
In-depth familiar with GIS and GIS applications in transport planning
GIS and Transport Planning Expert
Mrs. Nicolene Wattel
More then 18 years of experience in Town and Regional Planning Developed GIS based public transport routes and facilities scenarios to determine the optimum location of public transport facilities and required public transport mode and frequency Interactions between public transport, motorised and non-motorised transport and proposing solutions for conflict minimisation. Concept design for taxi and bus facilities and pedestrian walkways. Measuring impacts of trips generated by residential developments such as universities, shopping malls, museums and others.
Your project partners from TCP/Aurecon
8
Role Name Qualifications
Financial and Economic Analysis and Financing of Urban Transport
Prof. Dr. Rothen-gatter
More then 30 years of experience in transport research and transport projects in Europe and worldwide Highly renowned and widely acknowledged expert in all matters related to transport planning, transport economics, transport appraisal and transport charging and financing. University lecturer, author of numerous publications and leading various European research projects on transport economic related matters. Involved in several urban strategic and master planning projects, e.g. in Stuttgart, Hamburg and other cities in Europe and Overseas.
Financial and Economic Analysis, external costs of urban transportation
Dr. Niklas Sieber
PhD in Transport Economist, with post-graduate studies on Regional Planning 20 years of professional experience in the fields transport economics, urban mobility, spatial planning and environment. University lecturer on sustainable transportation in Germany and conducts courses on sustainable urban mobility in developing countries for UNITAR (United Nations Institute for Training and Research) Participated in several urban and national transport strategy and master planning projects, e.g. Saudi Arabia, Niger Delta as well as in numerous research projects on sustainable transportation. Road transport advisor to the Namibian Minister of Transport and workshop on financing urban roads in Windhoek

26.02.2013
3
Your project partners from TCP/Aurecon
9
Role Name Qualifications
Public Transport Specialist
Olaf Scholtz-Knobloch
Rail and Public Transport Engineer (Master Degree) More then 20 years of experience in system design of public transport systems Knowhow on all major public transport systems – guided such as LRT, Metro, Heavy Rail and non-guided such as BRT, Bus, Taxi. In-depth know-how about strengths and weaknesses of different public transport systems in certain environments, gained during several comparative studies undertaken Experienced in conceptualisation and PT system design for e.g. the cities of Malaga, Tel Aviv, Haifa, Santo Domingo, Cali, Guadalajara, Saragossa, Quito, Aguascalientes, Cuautitlan Izcalli, Panama City
Urban Transport Design Specialist
Dr. Carsten Simmonis
PhD in Civil Engineering dissertation on “Demand-oriented Optimisation of Urban Bus Routes” More then 40 years of working experience in Germany, Europe and worldwide Investigated in bus route network optimisation in numerous cities Development of sustainable mobility concepts in Johannesburg, Mumbai and Jakarta Latest know-how on all bus and LRT and MRT systems and technologies Investigations and advisory services in the field of optimum institutional and organisational set-up for urban public transportation systems.
Your project partners from TCP/Aurecon
10
Role Name Qualifications
Urban Planner, NMT and Transport Management
Specialist
James Scheepers
•Master of Science in Transportation Planning •More then 15 years of experience in urban transport planning •experience in surveying and strategy development for non-motorised transport infrastructure •Road safety audits and e.g. responsible for incorporating road safety in road design in Namibia in 2009 and low cost safety enhancement measures •Developing and implementing road application standards with reference to intersection control, non-motorised transport infrastructure such as walkways, crossing facilities, bridge crossings, signalling road markings, public transport infrastructure, building frontages and building lines •promotion of public transport and transport demand management,
NMT Specialist Roloef Wittink •Master Degree in Psychology •More then 35 years of working experience in cycling inclusive transport planning; road safety and behavioural modification and social marketing •Participated in various research projects on significance of NMT for developing countries and mobility and safety of vulnerable road users •Reseach on the effectiveness of non-motorised transport in relation to economic growth, reduction of poverty and quality of life in urban areas •Know-how on costs and benefits of cycling policies •Expertise on integrating cycling in transportation planning among other countries in South Africa Ghana, Tanzania, Kenya and Uganda.
Your project partners from TCP/Aurecon
11
Role Name Qualifications
Traffic micro-simulation and traffic safety specialist
Jaco de Vries Traffic and Transportation Engineer More then 16 years of experience In-depth familiar with traffic flow situation in Windhoek’s Central Business District as he did the optimisation of the traffic signalisation to improve traffic flows. Capacity analysis of transport infrastructure Micro-simulation of intersections in view of improved traffic flow and safety enhancement Micro-simulation of LRT systems impacts on traffic flow Multi-criteria decision matrixes for project prioritisation Modal Shift estimation Pedestrian accessibility investigations Road pricing in cities Establish base data for proposed BRT Systems
Further renowned Experts as might be required by project development and after having agreed upon with the Steering Committee.
Practical issues to be discussed in order to get the project running
12
Nomination of Counterparts
Setting up of the Steering Committee and Schedule of
Meetings
Office space, facilities and equipment
Office access and normal working hours
Telephone, Fax, Internet – availability
Provision of data and data gathering support
Agree on table of content

26.02.2013
4
Thank you
for your attention
13
Back-up slide
Why Stakeholder Involvement
14
Public participation is based on the belief that those who are affected by a
decision have a right to be involved in the decision-making process. It
includes the promise that the public's contribution will influence the
decision.
The main features of a stakeholder process are:
A creative public involvement process enables citizens to participate in
developing sustainable solutions.
An interactive communication process informs citizens about progress in
designing and implementing solutions.
Citizens see the result of implemented measures originating from the
consultation process.
Citizens take ownership and change their mobility behaviour.
Back-up slide, Table of Content of SUTMP
15
1. INTRODUCTION
1.1. Purpose
1.2. Background to the Master Plan
1.3. Stakeholder Engagement Process
1.4. Implementation Process
1.5. Report Format
2. STRATEGIC DIRECTION
2.1. Developing the Strategic Direction
2.2. Reference to national Strategies and Master
Plans and other Studies
2.3. Identification of the Strategic Direction
Scenarios
2.4. Selection of the Preferred Strategic
Direction
2.5. Making Sustainable Transport Attractive
2.6. Promotion of Sustainable Urban Transport
3. EXISTING AND FUTURE CONDITIONS
3.1. Existing and Planned Land Use
3.2. Existing Transportation System and
Characteristics
3.3. Existing pedestrian and cycling facilities
3.4. Existing Transportation Demands
3.5. Population and Employment Forecasts
3.6. Projected Transportation Demands
3.7. Screenline Capacity and Network Deficiencies
3.8. Traffic Safety
3.9. Other Deficiencies and current discussions
3.10. Recommendations to land use planning
4. INSTITUTIONAL AND LEGISLATIVE
FRAMEWORK
4.1. Existing Institutional Setting
4.2. Legislative and regulative Basis
4.3. General Policies of Road Transport
4.4. Conflicts of Interest and Deficiencies
4.5. Institutional Development
4.6. Law Enforcement
4.7. Development of Legislation and Regulation
5. PUBLIC TRANSPORT
5.1. Strategy
5.2. Recommended Innovations
5.3. Options of rail for meeting public transport
requirements
5.4. Integration of Taxi Services
5.5. Integration of Minibus Services
5.6. Network Aspects
5.7. Operational Concept
5.8. Tariff Concept and Technology
5.9. Public Transport Infrastructure
Back-up slide, Table of Content of SUTMP
16
6. NON-MOTORISED TRANSPORT
6.1. Strategy
6.2. Pedestrian and cycling infrastructure
improvements
7. MANAGING TRANSPORTATION
7.1. Impact to the Road Infrastructure and Road
Traffic
7.2. Optimising the Performance of the Road Network
7.3. Transportation Demand Management (TDM)
7.4. Road Safety
7.5. Introduction of Environment friendly
Technology
8. INTERCITY TRANSPORTATION
8.1. Intercity Transportation Demand
8.2. Integration of Intercity Public Transport
9. FINANCIAL AND ECONOMIC ANALYSIS
9.1. Capital Costs
9.2. Operating Costs
9.3. Economic Costs and Benefits
9.4. Multi-Criteria Analysis
10. FINANCIAL AND IMPLEMENTATION PLAN
10.1. Public and Private Funding Sources
10.2. Financing of public transport operation
10.3. Financing of public and non-motorised
transport investment
10.4. Priority Schedule
10.5. Staging and Investment Plan


Consultancy service provided by
2nd
Steering Committee Meeting
MINUTES 15 AUGUST 2012 8.30 AM COMMUNITY DEVELOPMENT OFFICE
CORNER OF HANS DIETRICH & LEONARD AUALA STR, KATUTURA
MEETING CALLED BY CoW, MWT, GIZ and TCP/Aurecon
TYPE OF MEETING Steering Committee Meeting for guiding the project on “Sustainable Urban Transport for City of Windhoek, including Rehoboth, Okahandja and Hosea Kataku International Airport”
FACILITATOR Clarence Rupingena
ATTENDEES
Name Institution Contact
1. C.I Morkel CoW-Police 0811402485
2. Browny Mutrifa CoW-Planning 0811225386
3. Clarence M.U Rupingena CoW-Public Transport 0811223927
4. Erwin Kamundu CoW-Public Transport 0812236933
5. E.N Kotjinjo CoW 0811221210
6. Horst Lisse CoW-Transportation 0812505412
7. James Kalundu CoW 0811221362
8. Carsten Schürmann TCP International +49 176 320 346 46
9. Frederik Strompen GIZ Technical Advisor 0816200806
10. Michelle Kwa GIZ Intern 0818641633
11. Angelika Zwicky TCP/Aurecon Team Leader 0818594545
12. Laetitia English TCP/Aurecon Project Assistant 0812159628
13. Kenneth Odero TCP International 0818594546
14. V.K Tjatindi CoW 0812811302
Consultancy service provided by
Agenda topics
1. COMMUNICATION FROM THE CHAIR CLARENCE, 25 MINUTES
CONCLUSIONS
Welcome and brief introduction of agenda points and of each of the attendees
Thanks to the host of the meeting
Absence of representative of MWT due to unavailability of Angeline was regretted, in future presence of MWT should be ensured.
2. CONFIRMATION OF MINUTES OF THE PREVIOUS MEETING HELD ON 18
TH JULY 2012
CLARENCE, 5 MINUTES
CONCLUSIONS
The Minutes of the first Steering Committee Meeting (Inception Meeting) were accepted by the participants and thanks given to GIZ for writing them.
3. MATTERS ARISING ALL, 20 MINUTES
DISCUSSION
Frequency of Steering Committee Meetings, main purpose of the Meetings and attendees of the Meetings
CONCLUSIONS
Steering Committee Meeting not to be on a frequent bi -weekly basis, but only called when crucial/vivid decision are to be taken; minimum once a month is to be envisaged, in the beginning there might be the need for more frequent Steering Committee Meetings.
Invite Damien from MWT to stand in for Angeline at Steering Committee meetings when she is not available
4. INCEPTION REPORT ANGELIKA, 5 MINUTES
CONCLUSIONS
Inception report is completed and will be handed out by Friday 17. August to partners
Thanks to the partners for supporting fast mobilisation and data gathering
Main problem of data gathering is missing up-to-date traffic counts -> own agenda point 5.
5. TRAFFIC COUNTS ALL, 25 MINUTES
DISCUSSION
1. Necessity of traffic counts for transport model and availability of data
2. Suggested approach for additional traffic counts
3. Unclear responsibility for conducting traffic counts
CONCLUSIONS
1. Horst confirmed necessity of actual traffic count data for modelling and traffic planning purposes and existing data gap.
Previous count data as of 2004 are outdated; calibrating the transport model on 2004 data would lead to unreliable results.
CoW does not have newer counts available.

Consultancy service provided by
2. SUTMP Consultants handed over a first approach for additional traffic counts based on the traffic count locations of the
study of 2004 extended by additional locations to give rise to different investigation target (PT and N MT) including vehicle
occupancy surveys with estimated costs of < 260,000 N$. This approach will be revised and detailed.
3. The workload and necessary resources for conducting the traffic counts will be shared between the SUTMP Consultant, the
Polytechnic of Windhoek, the GIZ and the responsible departments in CoW. Details will be discussed in an internal meeting
between the parties.
6. MAPS AND LOGOS CARSTEN, 15 MINUTES
DISCUSSION
1. Draft layout of a map for further use in the planning process was handed out -> overall layout, application of logos
2. Completeness of GIS data provided by CoW GIS Department to the SUTMP Consultant.
CONCLUSIONS
The approved layout is attached to this meeting notes
o There is a need for 2 different map layouts, one map template for Windhoek (to show details), another one for the
whole study area, i.e. including Rehoboth, Okahandja and Hosea Kutako International Airport
o the maps should be user friendly and include latest data
o the proposed map layout was agreed with one remark: the map header should include the full project title including
remark on Rehoboth, Okahandja and Hosea Kutako int. airport.
o Each map will be handed over in a raster format (i.e. png file format) for easy inclusion in reports, presentations,
newsletters etc., and in addition in vector file format (i.e. ai or eps file format) allowing GIZ and others to process the
maps in other drawing software.
The CoW already provided some GIS datasets to the SUTMP Consultant; unfortunately the datasets only included the geometries, but no attribute information. Attributes were lost on the GIS data, update is required, latest data should be obtained at the land use department of CoW. CoW to provide new GIS datasets including all required attributes.
7. AOB ALL, 40 MINUTES
DISCUSSION
1. Angelika introduced and explained purpose of 1st
stakeholders workshop to be held at 4th
of September.
2. Draft Agenda was handed out –> sequencing, agenda topics, key note speakers, moderator
3. Media invitation and briefing, responsibility and consistency in communication with media
CONCLUSIONS
1. There are 3 objectives for this 1st stakeholder workshop, i.e. a) raise awareness for necessity of sustainability in urban transport,
and, b) obtaining first ideas and feedback for sustainable urban transport measures, and, c) identifying and if possible founding
of stakeholder working groups for further follow-up.
2. The revised Agenda as agreed upon is attached to this meeting note.
Clarence and Immanual/GIZ take up contact with protocol sections of MWT, MRLGHRD, CoW and with the German
Embassy concerning invitation and briefing of Honorables for introductory session. Clarence concentrat es on CoW,
the GIZ on the Embassy and on the Ministers.
For moderation of the entire stakeholder workshop Damien was nominated by the majority as suitable candidate. GIZ

Consultancy service provided by
will address him and the MWT accordingly. Moderator briefing is done by Angelika.
3. All related media contacts will be in the sole responsibility of the GIZ.
Meeting ended at 10:45 am


Seite 1 von 5
3rd Steering Committee Meeting
MINUTES 1. OCTOBER 2012 9.00 AM BOARDROOM OF THE CEO,
CITY OF WINDHOEK
MEETING CALLED BY
CoW, MWT, GIZ and TCP/Aurecon
TYPE OF MEETING
Steering Committee Meeting for guiding the project on “Sustainable Urban Transport for City of Windhoek, including Rehoboth, Okahandja and Hosea Kataku International Airport”
FACILITATOR Clarence Rupingena on behalf of Ludwig Narib
ATTENDEES
Name Institution Contact
1. Faniel Maanda CoW-Planning 0811225386
2. Clarence M.U Rupingena CoW-Public Transport 0811223927
3. Erwin Kamundu CoW-Public Transport 0812236933
4. Horst Lisse CoW-Transportation 0812505412
5. Immanuel Shipanga GIZ 0811412330
6. Gregor Schmorl GIZ 0818114585
7. Angelika Zwicky TCP/Aurecon Team Leader 0818594545
8. Kenneth Odero TCP International 0818594546
9. Laetitia English TCP/Aurecon Project Assistant
0812159628

Seite 2 von 5
Agenda topics
1. COMMUNICATION FROM THE CHAIR CLARENCE, 5 MINUTES
CONCLUSIONS
Welcome and brief introduction of agenda points
Absence of Delegates from the MWT and the MRLGHD was regretted
Faniel Maanda was delegated to stand in for Browny Mutrifa
2. CONFIRMATION OF MINUTES OF THE PREVIOUS MEETING HELD ON 15
TH AUGUST
2012 CLARENCE, 10 MINUTES
CONCLUSIONS
The Minutes of the second Steering Committee Meeting were accepted with the following remarks;
For the 2nd
Meeting the MWT Delegate send an apology for not being able to attend
To point 5, actually the transport division conducted traffic counts in 2011. The results were handed over to the consortium partner Aurecon. Further traffic counts were necessary for the purpose of the present transport master plan modelling.
Page numbering to be introduced to the minutes.
3. MATTERS ARISING ALL, 20 MINUTES
DISCUSSION / INFORMATION
a) GIZ remarked that Steering Committee meetings need to be conducted every month as agreed.
Discussion on how to attain higher attendance and recognition of the necessity of the Steering
Committee.
b) Traffic Counts: Angelika informed that training of supervisors did take place between 19th
and 21st
of
September, counting started in the week thereafter and is on-going. TCP is happy to have identified and
could employ about 60 enumerators with support of the Polytec, Prof. Riethmüller. 30 – 40 enumerators
are employed per day. CoW departments are actively contributing with logistical support and Angelika
expressed her gratitude for this valuable support which will contribute to further improve the SUTMP
planning basis.
c) 1st
SUTMP Stakeholder Workshop: Angelika informed briefly, that the workshop was conducted as
planned and is viewed by most counterparts and stakeholders successful. Entire workshop documentation
is given in the Stakeholder Assessment Report of the Consultant. Many useful ideas could be drawn for
further consideration in the master planning process. Stakeholder Assessment Report is not an end in
itself, but stakeholder engagement will go on with different groups. Presently, stakeholder engagement is
with taxi industry and schools as well as with a newly formed group for revival of the CBD and with
employers in the Northern Industrial.
d) Informal meeting between the Consultant and Taxi Drivers at 23rd
of Sept.: the intention was to get some
more information on cost and revenue situation in this sector. However, instead of 5 – 6 more than 60
drivers and the media participated. Nevertheless, the meeting helped to get some more ideas on how to
incorporate the taxi industry in a future PT system.
The Taxi industry asked for further more formalised meetings with the Government and the CoW.
Discussion on how best to deal with the taxi industry further on.
CONCLUSIONS
To a) Next Steering Committee Meeting to take part in the premises of the MWT as host organisation, representatives of the Cities of Rehoboth and Okahandja should also be invited.
To d) The media reaction and publications was regarded positive marketing for the SUTMP by the Steering
Committee members. However, the Consultant was advised to take no further activities with the taxi industry. GIZ will care for more formalised meetings together with the responsible Government

Seite 3 von 5
entities.
4. PRESENTATION, DISCUSSION AND DECISION ON BASIC DEVELOPMENT ASSUMPTIONS
ANGELIKA, 40 MINUTES
DISCUSSION
Angelika handed out a paper on the SUTMP methodology going to be used for the master plan (please
find it enclosed with this meeting notes). She presented the principle development assumptions such as
GDP, Household Size, Household Income etc.
The sources and calculation basis for each of the assumptions was briefly discussed.
The necessity to match SUTMP framework data with general NPC country-wide data and with
National Transport Master Plan was discussed.
The scenario and modelling calculations will be done on this basis. Later, changes are not possible
without starting from the beginning which is not possible due to time and resource constraints. However,
in sensitivity analysis main modelling outcomes will be tested on their robustness. The only variable to be
easily changed later on is the proposed discount rate of 3 %.
CONCLUSIONS
The data presented was found to be a reasonable and thoroughly elaborated basis to be used for further SUTMP modelling and calculations.
There is no need to adjust the data to the National Master Plan data as the investigation areas differ.
5. PRESENTATION, DISCUSSION AND DECISION ON PRINCIPLE OUTLINE OF ENVISAGED PLANNING SCENARIOS
ANGELIKA, 40 MINUTES
DISCUSSION
The methodology paper handed out by the Team Leader contains also the proposed reference scenario
and three land-use scenarios as well as the multi-criteria analysis to be applied for selecting, evaluating
and prioritising transport measures. The multi-criteria analysis relies on the objectives and enablers of the
Namibia Vision 2030.
For getting more detailed information about poverty related criteria, the Consultant was able to add
some transport related issues to a household survey presently conducted by the Khomas regional
council for poorest households and can use this information in the further master planning process.
The adequacy of road safety data especially from the National Road Safety Council for SUTMP
planning purposes was discussed. However, the Consultant relies on the complete data kept with the
National Police and on the more detailed data giving also locations and severity of accidents from the
Municipal Traffic Police.
Presently, the City envisages revising the outdated structure plan for the City and the interrelation
between the structure plan and strategic decision to apply a certain land-use scenario was discussed.
CONCLUSIONS
The 3 land-use scenarios are accepted in principle as a good planning and decision-making basis but
need to be elaborated further on and get more detailed.
The methodology for the multi-criteria analysis was also regarded as thoroughly elaborated and
complete. It was widely accepted by the Steering Committee. However:
a. The regional statistics will be rechecked for household and poverty related data.
b. Walking and cycling have to be separated in two assessment criteria and not in one
combined criteria.
Seite 4 von 5
6. INITIAL PLANNING FOR THE “STRATEGIC DECISION WORKSHOP” ENVISAGED FOR BEGINNING OF NOVEMBER
ANGELIKA, 30 MINUTES
DISCUSSION
Objective of the Strategic Decision Workshop: Decision-making on strategic directions of future land-use and transport developments in Public Transportation, Non-motorised Transport and Transport Management and accompanying institutional, legal and financial issues.
Thus, the strategic decision making workshop needs highest-level attendance in order to get robust strategic decisions on which the further master planning process can build upon. The Consultant suggests a 2-day workshop for about 10 high-level participants at 13. /14. November, 2012 in an attractive venue outside Windhoek. Discussion on how to prepare and obtain those robust decisions .
Clarence explained about the restructuring of the CoW administration - more departments/divisions are directly involved.
Furthermore, involvement of MRLGHRD is still pending; an official meeting with the MRLGHRD was
requested and should be attended by GIZ, Angelika and Clarence.
CONCLUSIONS
Preparatory Strategic Decision Workshop at 5./6. November, 2012 involving the technical level
One week briefing of the decision-making level by the technical level
Strategic Decision Making Workshop at 13. or 14th
of November, 2012 for a day involving decision makers from MWT, CoW and MRLGHRD.
GIZ together with the MWT as the main owner of the project will make sure that the Workshops get the necessary attendance.
Angelika will elaborate a draft agenda by next week.
7. ANY OTHER BUSINESS ALL, 15 MINUTES
DISCUSSION
a) Public Transport Day at the Windhoek Show: the Public Transport Day was a success and a lot of
people were asking for brochures. The Committee participants thanked Immanuel for his successful
engagement.
b) Table of Content of the SUTMP: the table of content with its main chapters was in principle agreed
upon during the 1st
steering committee meeting. However, the consultant suggests to change slightly
the order of the chapters to get a more logical sequencing, i.e. make chapter 2 - strategic decisions
new chapter 3 and chapter 3 - existing traffic new chapter 2.
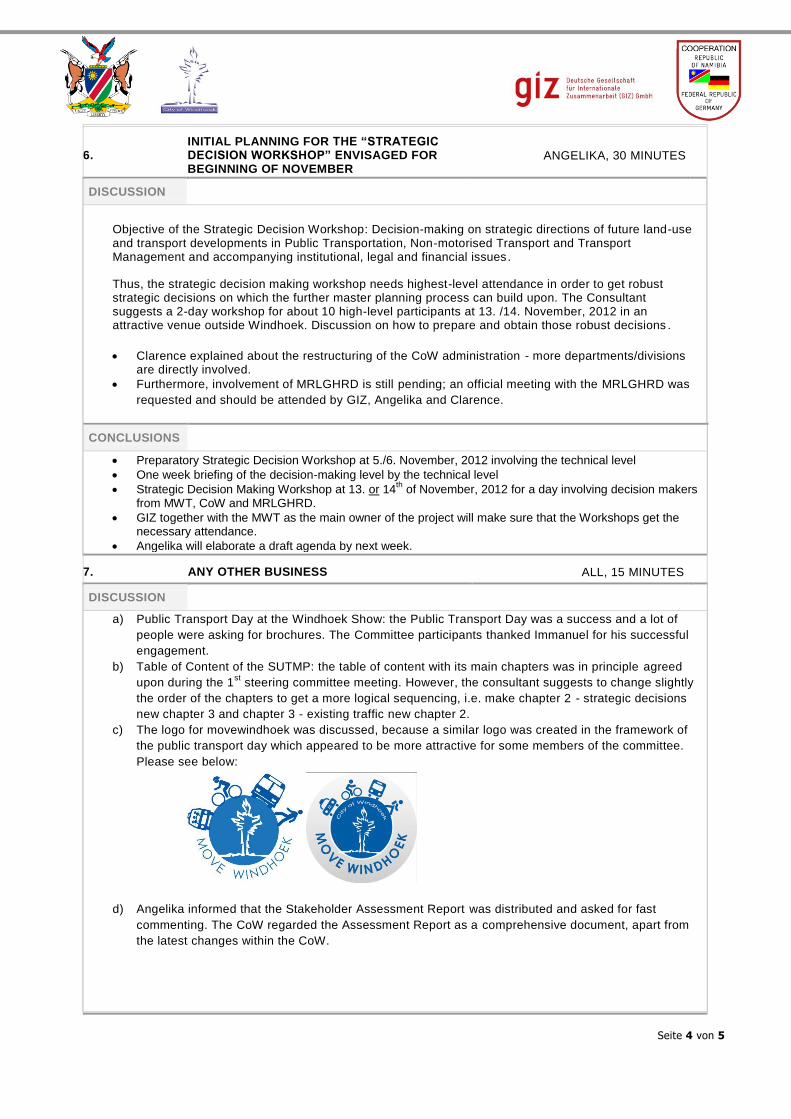
c) The logo for movewindhoek was discussed, because a similar logo was created in the framework of
the public transport day which appeared to be more attractive for some members of the committee.
Please see below:
d) Angelika informed that the Stakeholder Assessment Report was distributed and asked for fast
commenting. The CoW regarded the Assessment Report as a comprehensive document, apart from
the latest changes within the CoW.
Seite 5 von 5
CONCLUSIONS
To b) It is reasonable to change the sequencing of the SUTMP chapters 2 and 3. To c) The final movewindhoek logo is to be a mixture of both logos:
- from the left / old logo keep the icons on top, but walking and cycling from left to right - from the right / new logo that all is in one colour (check again the exact blue with the CoW), the
bold City of Windhoek script underneath, the small silhouette of the Aloe but without the script “City of Windhoek” in the blue circle, without grey circle around.
8. Meeting was closed by the Chair and ended at 11:45 am

Sustainable Urban Transport Master Plan For the City of Windhoek including Rehoboth, Okahandja and Hosea Kutako International Airport
Methodology of the Sustainable Urban Transport Master Plan
Presentation for SUTMP Steering Committee on October 1st 2012
A Project of the German – Namibian Cooperation together with the City of Windhoek

2
Authors: Dr. Niklas Sieber
Dr. Carsten Schürmann
M.Sc. (Econ) Angelika Zwicky
Editor: Prof. Dr. Rothengatter
Contact: Deutsche Gesellschaft für Internationale
Zusammenarbeit (GIZ) GmbH
P.O Box 8016 Windhoek, Namibia, www.sutp.org Ministry Work and Transport Head Office Building 6719 Bell St Snyman Circle Windhoek
Manager: Prof. Heinrich Strompen
Cover photo: Frederick Strompen
Windhoek, 01/10/2012
Consultancy services provided by
in consortium with
3
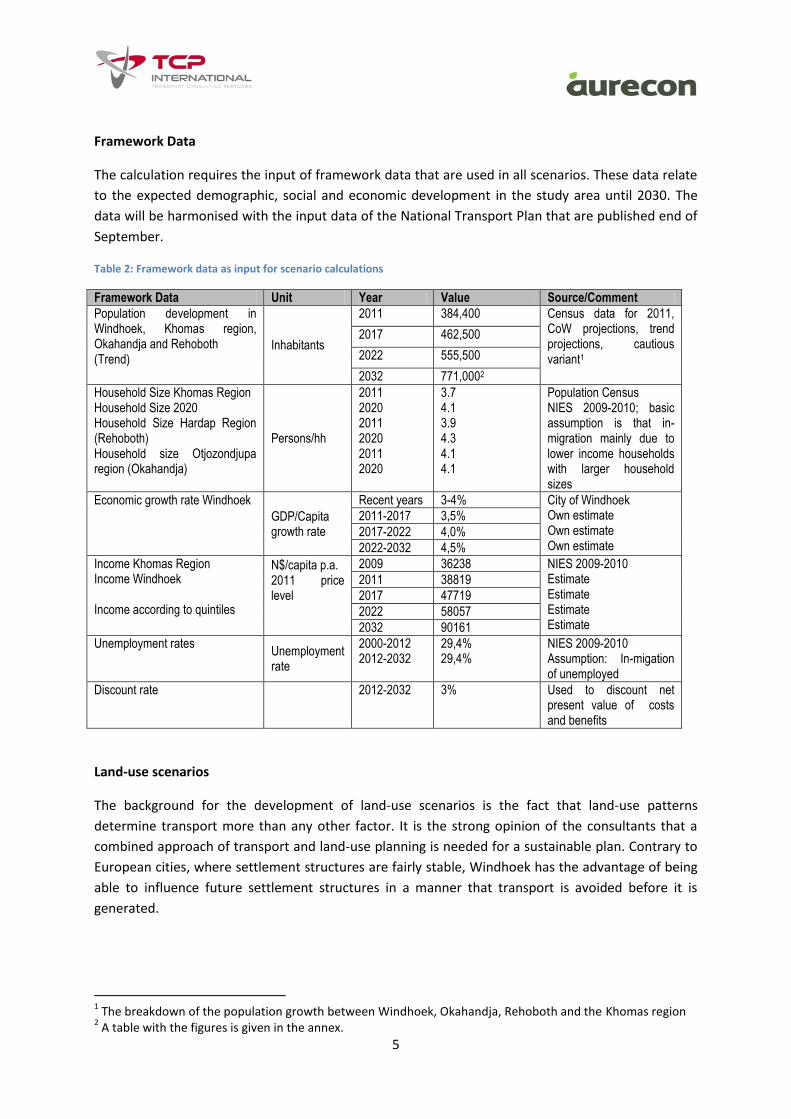
Methodology of the Sustainable Urban Transport Master
Plan
Presentation for SUTMP Steering Committee on October 1st 2012
Overview on the Approach
The Sustainable Urban Transport Master Plan will take a comprehensive multi-criteria approach to
evaluate the impacts of the various transport measures. Comprehensive implies that not only costs
and benefits are taken into account in the scenario evaluation, but as well safety, environment and
social aspects. The assessment criteria are derived from Namibia’s Vision 2030.
In order to be sustainable, the transport master plan needs to account for different future land use
options, since different settlement patterns and different urban structures will have different
impacts on the transport system, such as mode choice or route choice. Therefore, three land-use
scenarios will be developed that combine different settlement patterns with appropriate transport
interventions. An expert assessment will present the possible impacts in a matrix form that allows
decision makers to choose scenarios according to their preferences.
The Strategic Planning Workshop in November will select one scenario for which various transport
measures are calculated. The final output will be an action plan with a detailed set of activities to be
undertaken.
Proposed Multi-criteria Assessment
The assessment of the scenarios will take up the goals and basic enabling areas given in the Vision
2030. The main goal is a “high and sustained economic growth”. This shall be achieved through basic
enablers, of which “public infrastructure”, “reducing extreme poverty”, “health” and “institutional
environment” are relevant for SUTMP. These enablers will be specified by a number of variables
listed below:

4
Table 1: Goals and indicators for multi-criteria assessment of the scenarios
Topic Variable Unit Explanation
High and sustained economic growth
Cost Utility Net Present Value N$ All financial costs (infrastructure, operating) and revenues
Accessibility Average Travel time hours/day Total travel time
Impact on GDP GDP/Capita N$ Output of a system model
Impact on employment employment ratio % Output of a system model
Public infrastructure and NMT
Total investment costs Costs for roads, public transport infrastructure and vehicles
N$ Including avoided costs by improved public transport
Public transport usage Modal split of public transport % Model output
Balanced mode choice Modal split of NMT (walking&cycling combined)
X Model output
Cycle lanes Length of cycles lanes km
Walkways Length of cycles walkways km
Institutional sustainability Enabling legislative framework
Laws, by-laws and regulations related to sustainability
Marks 1-5 Expert judgement
Institutional capacities Coordination, financing, participative planning, administrative procedures, etc.
Marks 1-5 Expert judgement
Reducing extreme poverty
Transport cost for low income households
Share transport costs of disposable income
% Only lowest income group
Walking and cycling Duration of daily travel per household
minutes/day Only lowest income group
Public transport usage Share of population with less than X minutes access to next public transport stop Average travel time by PT to a set of X public facilities (for instance, to next school, next shopping centre, next bank, …) Or: Share of population with less than X minutes travel time by PT to a set of Y public facilities.
% minutes/day %
Only lowest income group; walking threshold in terms of walking times to be defined with the client number and type of facilities to be determined by the client.
Health/Environment
Road accidents Road fatalities Number p.a
Local air pollution NOx, CO,SO2, NO2 emissions Tons p.a. Model output
Climate Change Carbon dioxide emissions Tons p.a Model output
External Costs Climate Change, air pollution and accidents
N$ per year
5
Framework Data
The calculation requires the input of framework data that are used in all scenarios. These data relate
to the expected demographic, social and economic development in the study area until 2030. The
data will be harmonised with the input data of the National Transport Plan that are published end of
September.
Table 2: Framework data as input for scenario calculations
Framework Data Unit Year Value Source/Comment
Population development in Windhoek, Khomas region, Okahandja and Rehoboth (Trend)
Inhabitants
2011 384,400 Census data for 2011, CoW projections, trend projections, cautious variant1
2017 462,500
2022 555,500
2032 771,0002
Household Size Khomas Region Household Size 2020 Household Size Hardap Region (Rehoboth) Household size Otjozondjupa region (Okahandja)
Persons/hh
2011 2020 2011 2020 2011 2020
3.7 4.1 3.9 4.3 4.1 4.1
Population Census NIES 2009-2010; basic assumption is that in-migration mainly due to lower income households with larger household sizes
Economic growth rate Windhoek
GDP/Capita growth rate
Recent years 3-4% City of Windhoek Own estimate Own estimate Own estimate
2011-2017 3,5%
2017-2022 4,0%
2022-2032 4,5%
Income Khomas Region Income Windhoek Income according to quintiles
N$/capita p.a. 2011 price level
2009 36238 NIES 2009-2010 Estimate Estimate Estimate Estimate
2011 38819
2017 47719
2022 58057
2032 90161
Unemployment rates Unemployment rate
2000-2012 2012-2032
29,4% 29,4%
NIES 2009-2010 Assumption: In-migation of unemployed
Discount rate
2012-2032 3% Used to discount net present value of costs and benefits
Land-use scenarios
The background for the development of land-use scenarios is the fact that land-use patterns
determine transport more than any other factor. It is the strong opinion of the consultants that a
combined approach of transport and land-use planning is needed for a sustainable plan. Contrary to
European cities, where settlement structures are fairly stable, Windhoek has the advantage of being
able to influence future settlement structures in a manner that transport is avoided before it is
generated.
1 The breakdown of the population growth between Windhoek, Okahandja, Rehoboth and the Khomas region
2 A table with the figures is given in the annex.

6
At the same time, even in very modest scenarios the study area is expected to double population
figures until 2032 (see above), so there is urgent need for town planning to provide adequate space
for urban expansions.
The idea is, to locate new citizens and industries in a manner that reduces the overall transport
demand and volume. For this purpose, in addition to a reference scenario three different Land-Use
Scenarios for 2032 will be developed and combined with appropriate transport interventions.
The basic outlines of these scenarios are:
Reference Scenario 2012, depicting the actual situation in Windhoek. This scenario is only used as
benchmark for the other scenarios, to compare with.
Scenario A: Business as usual (BAU): This scenario will assume a continuation of the present
urban development trends. This will include further urban sprawl and the on-going, independent
development of Okahandja and Rehoboth. Only loose integration of Elisenheim in PT strategies.
No further developments in Finkenstein, Groot Aub, Omea beyond those that are currently
ongoing.
Scenario B: Densification of Windhoek: This scenario will focus the in-migration on the city of
Windhoek by increasing population densities and creating higher density settlement schemes in
vacant areas. Also, public services and jobs will be created in residence areas to achieve a higher
mix of functions. This scenario will as well apply an urban edge, mixed land-use and a moderate
development of Okahandja and Rehoboth, where Okahandja and Rehoboth apply the concepts of
urban edges and mixed land use as well.
Scenario C: Polycentric Development: moderate densification of Windhoek where possible,
moderate mixed land-use, decentral concentration, strong transit corridor oriented development
(TOD) towards Okahandja accommodating most of population growth. Strong integration of
Brakwater and Elisenheim in the TOD corridor. Possible development knots of a polycentric
scenario could be small locations in the vicinity to Windhoek, such as Finkenstein, Groot Aub,
Omea, international airport, Aris and Kappsfarm and others, which are well connected to
Windhoek via public transport.
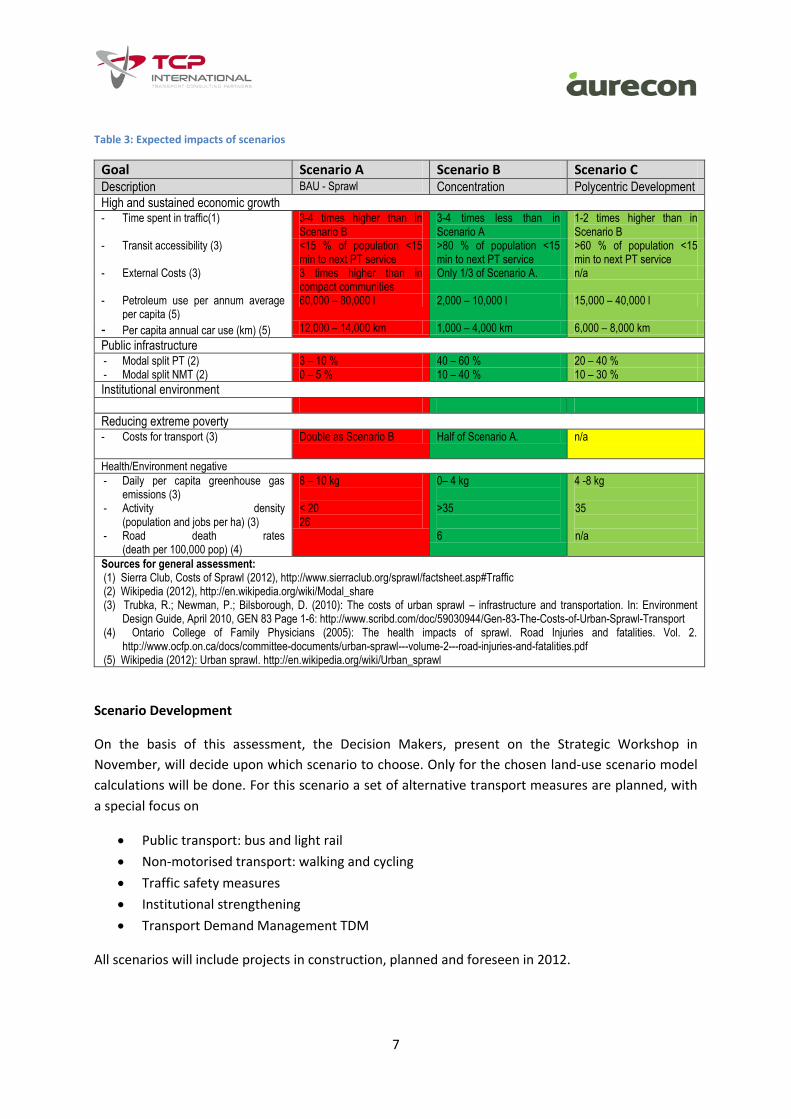
The scenarios will be compared (without model calculations) through expert assessment. The
expected impacts are estimated according to experience gained from other regions. These results are
depicted in Table 3, using the assessment criteria listed in Table 1. The valuation will be comparative
using a coloured scale from green (very positive) to red (very negative). This will enable the decision
makers to compare how specific goals may be achieved or hampered through the scenarios.
7
Table 3: Expected impacts of scenarios
Goal Scenario A Scenario B Scenario C Description BAU - Sprawl Concentration Polycentric Development
High and sustained economic growth - Time spent in traffic(1) 3-4 times higher than in
Scenario B 3-4 times less than in Scenario A
1-2 times higher than in Scenario B
- Transit accessibility (3) <15 % of population <15 min to next PT service
>80 % of population <15 min to next PT service
>60 % of population <15 min to next PT service
- External Costs (3) 3 times higher than in compact communities
Only 1/3 of Scenario A. n/a
- Petroleum use per annum average per capita (5)
60,000 – 80,000 l 2,000 – 10,000 l 15,000 – 40,000 l
- Per capita annual car use (km) (5) 12,000 – 14,000 km 1,000 – 4,000 km 6,000 – 8,000 km Public infrastructure - Modal split PT (2) 3 – 10 % 40 – 60 % 20 – 40 % - Modal split NMT (2) 0 – 5 % 10 – 40 % 10 – 30 %
Institutional environment
Reducing extreme poverty - Costs for transport (3)
Double as Scenario B Half of Scenario A. n/a
Health/Environment negative
- Daily per capita greenhouse gas emissions (3)
- Activity density (population and jobs per ha) (3)
- Road death rates (death per 100,000 pop) (4)
8 – 10 kg < 20 26
0– 4 kg >35 6
4 -8 kg 35
n/a
Sources for general assessment: (1) Sierra Club, Costs of Sprawl (2012), http://www.sierraclub.org/sprawl/factsheet.asp#Traffic (2) Wikipedia (2012), http://en.wikipedia.org/wiki/Modal_share (3) Trubka, R.; Newman, P.; Bilsborough, D. (2010): The costs of urban sprawl – infrastructure and transportation. In: Environment
Design Guide, April 2010, GEN 83 Page 1-6: http://www.scribd.com/doc/59030944/Gen-83-The-Costs-of-Urban-Sprawl-Transport (4) Ontario College of Family Physicians (2005): The health impacts of sprawl. Road Injuries and fatalities. Vol. 2.
http://www.ocfp.on.ca/docs/committee-documents/urban-sprawl---volume-2---road-injuries-and-fatalities.pdf (5) Wikipedia (2012): Urban sprawl. http://en.wikipedia.org/wiki/Urban_sprawl
Scenario Development
On the basis of this assessment, the Decision Makers, present on the Strategic Workshop in
November, will decide upon which scenario to choose. Only for the chosen land-use scenario model
calculations will be done. For this scenario a set of alternative transport measures are planned, with
a special focus on
Public transport: bus and light rail
Non-motorised transport: walking and cycling
Traffic safety measures
Institutional strengthening
Transport Demand Management TDM
All scenarios will include projects in construction, planned and foreseen in 2012.

8
Table 4: Development of transport measures
Measures Measure 1 Measure 2 Measure 3 1. Public TP Bus BRT Independence New network of buslines …
2. Public TP Taxi Taxi Measure 1 Taxi Measure 1
3. Public TP LRT - LRT Okahandja-Windhoek
4. NMT Walking Walking Measure 1 Walking Measure 2
5. NMT Cycling Cycling Measure 1 Cycling Measure 2
…
Attention: These are not the planned measurers, but only examples!
Assessment of measures
The measures will be compiled in a manner that the outcomes for each of the above defined goals
(see Table 1) are depicted in a coloured table.
Table 5: Final comparison of scenarios / measures
Goal Economic growth
Public infrastructure
Institutional environment
Reducing poverty
Health/ Environment
Public TP Bus Measure 1 Very positive Public TP Bus Measure 2 Public TP Taxi Measure 1 Public TP Taxi Measure 2 Public TP LRT Measure 1 neutral Public TP LRT Measure 2 NMT Walking Measure 1 NMT Walking Measure 2 NMT Cycling Measure 1 Very negative NMT Cycling Measure 2
…
The results will be basis for selection and prioritisation of measures. The prioritised measures will be
transformed to an implementation/action plan and presented in the Draft Transport Master Plan.

9
Annex
Population Windhoek, Okahandja, and Rehoboth
2011 2017 2022 2032
Windhoek 333,100 406,000 495,000 737,000
Rehoboth 28,800 31,500 34,000 40,000
Okahandja 22,500 25,000 26,500 31,000
Sum 384,400 462,500 555,500 808,000


Consultancy service provided by
THE FOURTH STEERING COMMITTEE MEETING OF THE SUSTAINABLE URBAN TRANSPORT MASTER PLAN (SUTMP) FOR CITY OF WINDHOEK, INCLUDING
REHOBOTH, OKAHANDJA AND HOSEA KUTAKO INTERNATIONAL AIRPORT
MINUTES 29 JANUARY 2013 9.15 AM MINISRTY OF WORKS AND TRANSPORT
BOARD ROOM, 4TH
FLOOR
MEETING CALLED BY Project Team
TYPE OF MEETING Fourth Steering Committee Meeting
CHAIRMAN GM Mayumbelo
ATTENDEES
Name Institution/Position E-mail Tel/Mobile
1. GM Mayumbelo SE, CoW [email protected] 0612902280
2. Cedric Limbo Ag Director, MWT [email protected] 0811402485
3. Clarence M.U Rupingena CoW-Public Transport [email protected] 0811223927
4. Damien Mabengano MWT [email protected] 0812415692
5. Robert Riethmueller NUST (Polytechnic) [email protected] 0612072961
6. Erwin Kamundu CoW –Public Transport [email protected] 0612903670
7. Charl Morkel CoW-Police [email protected] 0811402485
8. Frederik Strompen GIZ Technical Advisor [email protected] 0816200806
9. Angelika Zwicky TCP/Aurecon Team Leader [email protected] 0818594545
10. Niklas Sieber TCP/Aurecon [email protected] 0818596502
11. Laetitia English TCP/Aurecon [email protected] 0812159628
12. Kenneth Odero SUTMP – Institutional Advisor [email protected] 0818594546
13. Toini Paulus GIZ – Intern [email protected] 0813945764
14. Markus Dammann GIZ – Intern [email protected] 0813173864

Consultancy service provided by
Agenda topics
1. COMMUNICATION FROM THE CHAIR
5 MINUTES, CHAIR
CONCLUSIONS
The Chair welcomed the participants to this first meeting of the year
2. CONFIRMATION OF MINUTES OF THE PREVIOUS MEETING HELD ON 1
ST OCTOBER 2012
10 MINUTES, ALL
CONCLUSIONS
A true reflection of the deliberations
3. MATTERS ARISING 15 MINUTES, ALL
CONCLUSIONS
Meeting with taxi industry – there has been no follow-up from Government side; currently MWT seized; need to include all stakeholders and strive for a common approach
Chair of Steering Committee – MWT to consult and report to the next Meeting
4. SUTMP INVESTIGATIONS SINCE STRATEGIC DECISIONS - PRESENTATION AND DISCUSSIONS OF ASSESSMENT METHODOLOGY
15 MINUTES, DR. NIKLAS SIEBER
CONCLUSIONS
Brief presentation on refinement of assessment methodology as attached to this protocol
Scenario assessments to focus on polycentric land-use scenario as a basis for the Business as Usual (BAU) and the sustainable transport (ST) scenario; seven measures comprising bundles of interventions, multi-criteria methodology and comparison between BAU and ST in 2032; and four variants of PT measures are presently evaluated
A systems dynamic model to be added to the analysis and presented by Prof. Emer. Werner Rothengatter
4.
SUTMP INVESTIGATIONS SINCE STRATEGIC DECISIONS - PRESENTATION AND DISCUSSIONS ON NON-MOTORISED AND PUBLIC TRANSPORT AND INSTITUTIONAL, LEGAL AND FINANCIAL FRAMEWORK
50 MINUTES, ANGELIKA ZWICKY
DISCUSSION
Brief presentation of latest development since strategic directions as attached to this protocol
Main points of discussions concerning non-motorised Transport:
Pedestrianisation of the CBD: Urban Design competition during 1st year & traffic planning; cost estimates – prices for deconstruction, lining and marking between John Meinert and Fidel Castro streets + lump sum for design features = informed estimate on basic assumption; further parts of CBD pedestrianised from year 2023 onwards.
Western Bypass: There is an on-going discussion and outstanding institutional problems around the ownership and management of the Western Bypass between MWT and CoW regarding the Western Bypass; aggravating: there has been a mushrooming of housing development to the west of the road contributing to the heightened movement on the road and to increased no. of severe accidents along the road.
Main discussions concerning institutional, financial and implementation issues
There is political will from the principals which should be reflected in management meetings as well as continuity and regular attendance of delegates to the Steering Committee Meetings
Ensure that each key stakeholder inform their respective institution / feedback.
Briefings ought to find their way into management agenda
Role of the line ministry: to be clarified how does it fit in in the future?
Importance and need of a further Committee / Special Commission on Sustainable Transport after SUTMP delivery for implementation process.
Budget process is presently on-going: SUTMP first year budget of 64 mln needs to be broken down; indication on what budget to use from which key stakeholders needs also to be clarified.
Value of making piecemeal decisions: in the next 4 weeks the SUTMP will be presented; the decision process CoW and Ministry will intensify after receiving the Draft master plan.

Consultancy service provided by
There is a need for a meeting between the key project partners to discuss the next 5 year budget.
MWT need to look at the involved policy issues and take a pro-active role towards this project
Implementation of the Master Plan should progress and thought should be given to how this will happen
Continuity of GIZ support to this project is unclear; the main GIZ transport project is running out end of the year 2013, Namibian - German Government negotiations scheduled for Sept. 2013 will bring clarity on this issue.
CONCLUSIONS
The assumptions on pedestrianisation of CBD are realistic and implementable
NMT network should include the Western Bypass
A team from CoW and MWT will meet in short for solving SUTMP implementation budget issues
5. SUTMP DISSEMINATION STRATEGY (DATE, TIME, VENUE, PARTICIPANTS, PRESS INVITATION, ETC.)
15 MINUTES, ANGELIKA ZWICKY
CONCLUSION
The principal report structure will include
o Executive Summary for wider circulation;
o the main report for designated Steering Committee Members, and
o Technical Annex Report
Proposed date of official submission – 5 March 2013 is agreed upon;
High-level attendance is immediately to be organized by each entity represented in the Steering Committee itself.
Steering Committee Members stay in close contact for event organization.
6. STATUS OF STRATEGIC DIRECTIONS MOU SIGNATURE AND CABINET MEMO
5 MINUTES, FREDERICK STROMPEN
DISCUSSION
Progress to date has been slow and no actual information is available.
CONCLUSION
Limbo to follow up and report
7. INFORMATION ON OTHER RELATED PROJECTS BY STEERING COMMITTEE MEMBER INSTITUTIONS
10 MINUTES, ALL
DISCUSSION
National Transport Master Plan is delivered, relevant for SUTMP is the improvement of the Highway towards Okahandja for road safety
reasons. Those improvements will bring no major capacity increase.
No other relevant developments which ought to be taken into account in the SUTMP were mentioned.
CONCLUSION
SUTMP team representatives will be invited to National Master Plan dissemination at 4th
of February via Limbo.
8. ANY OTHER BUSINESS 15 MINUTES, ALL
DISCUSSION
1. Propose consultation: Sentiment shown by the Ministry, Mayor of Rehoboth – both should be briefed to get them up to speed
2. Follow up with the Mayors and MRLGHRD and give them a briefing; all stakeholders should be present
3. Media coverage very satisfying and positive, e.g.: New Era, NBC. Ministry and CoW make use of the homepage and Facebook-

Consultancy service provided by
Interview Chairperson (Mr. Mayumbelo); Positive Momentum ought to be retained in the near future.
CONCLUSION
Project Team to arrange for meeting with the two town Councils, as well as CoW and make presentations
9. Close of the Meeting 5 Minutes, Chair
Conclusion
Next meeting: 28 February 2013
The Chair closed the meeting at 11:40 am

Consultancy service provided by
Presentations

Consultancy service provided by
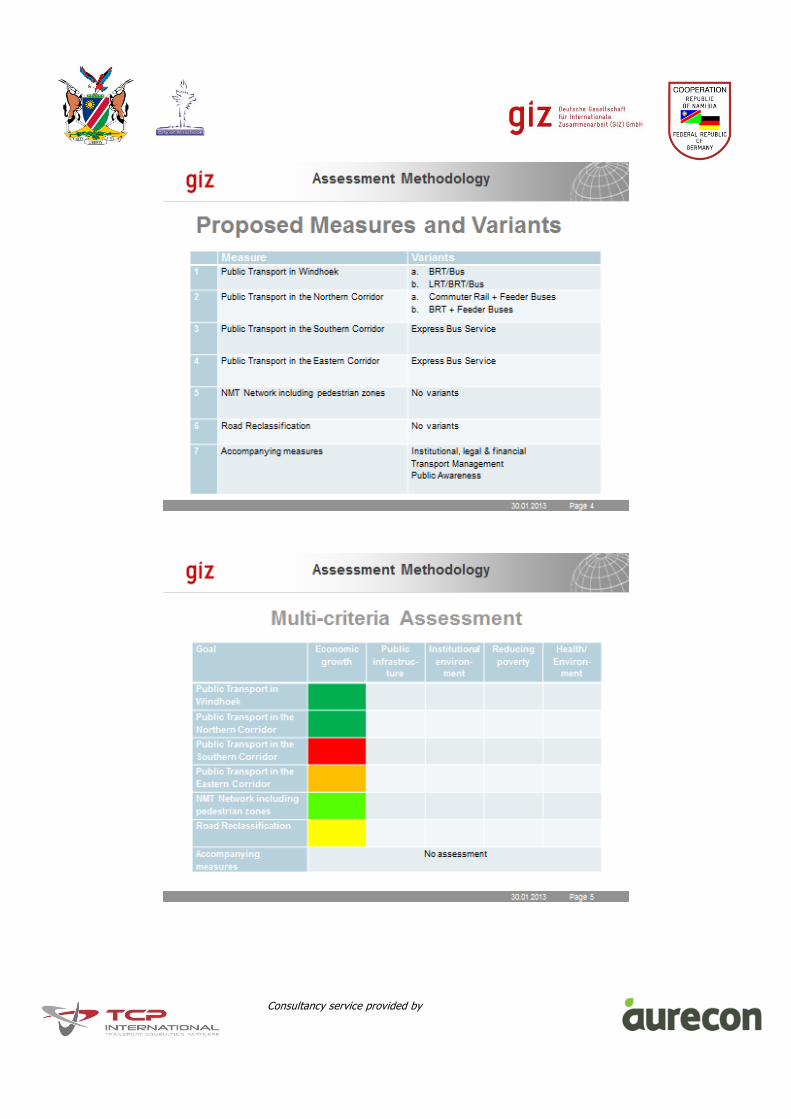
Consultancy service provided by
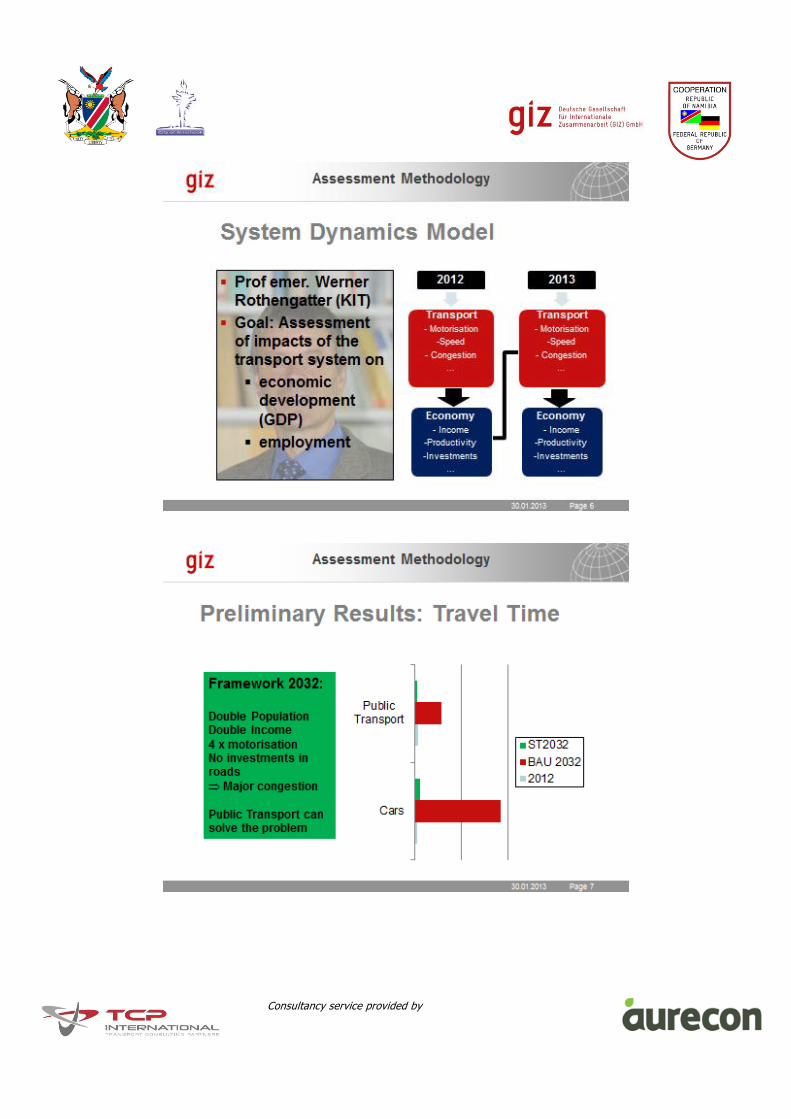
Consultancy service provided by
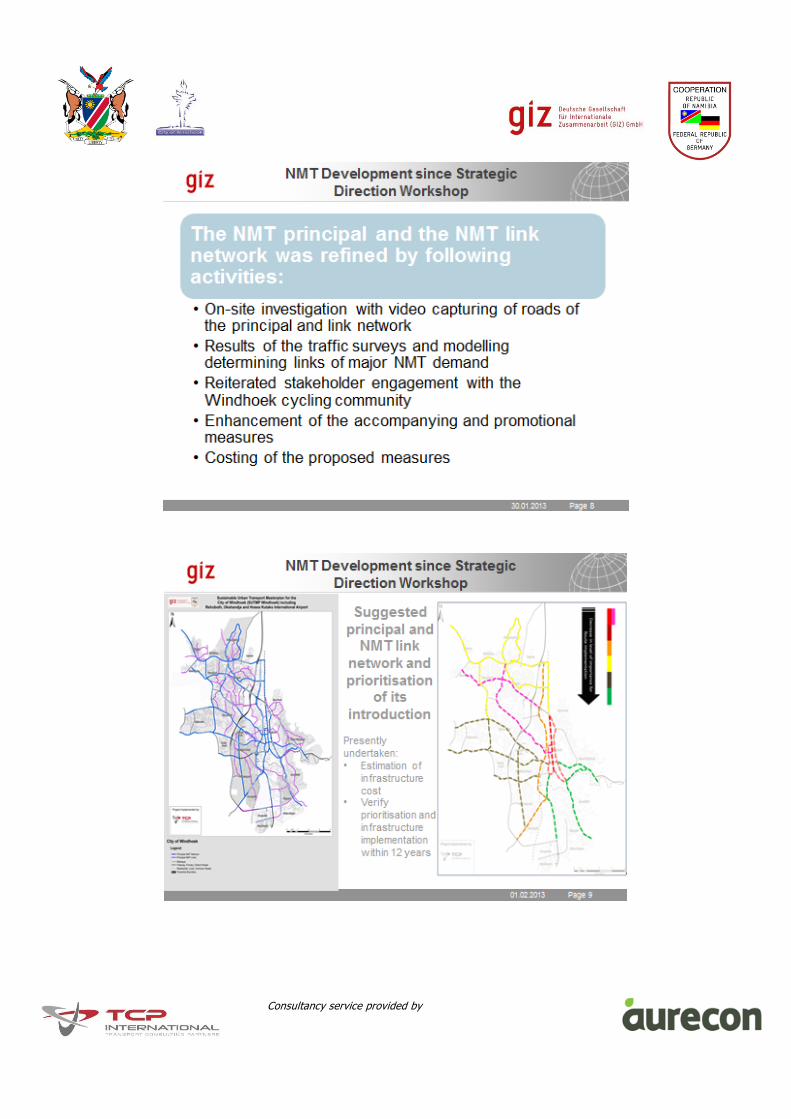
Consultancy service provided by
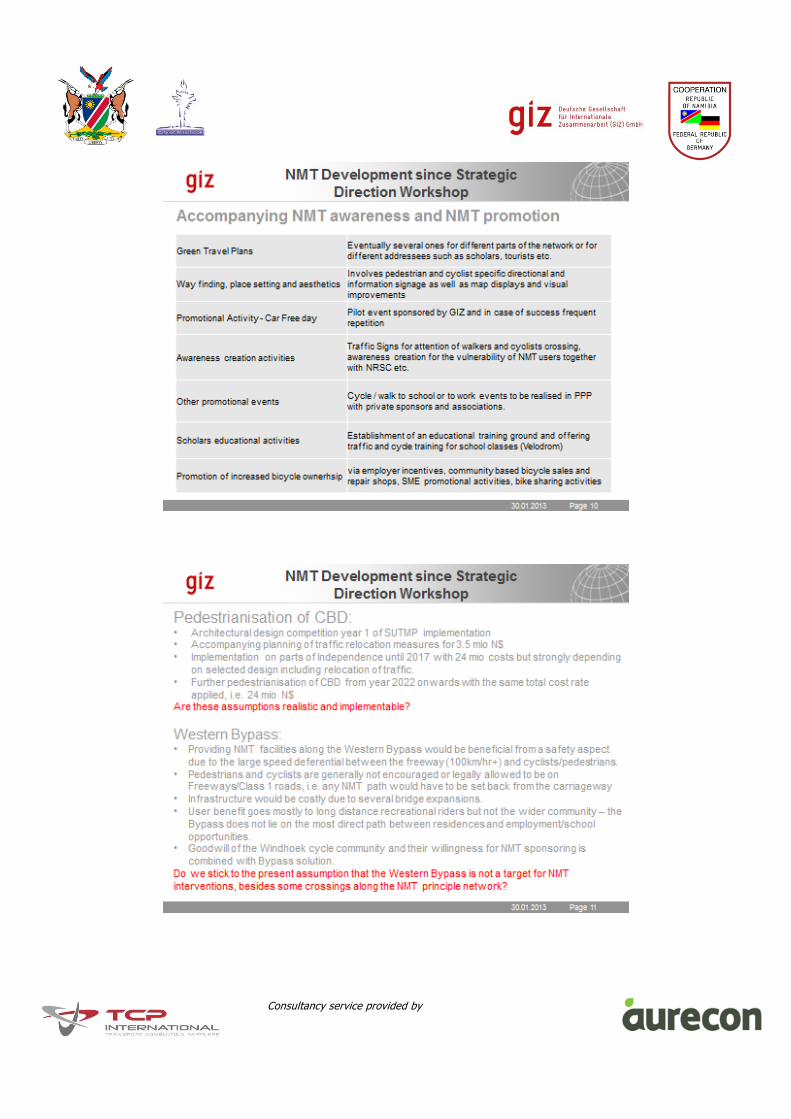
Consultancy service provided by
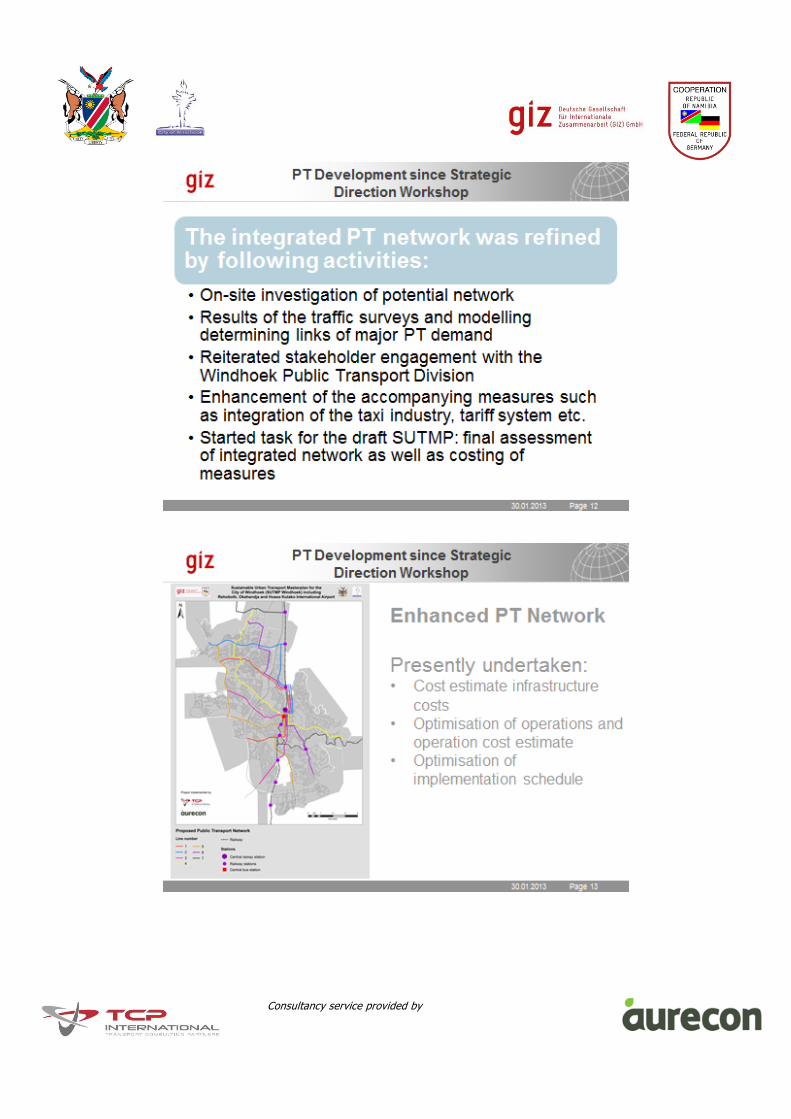
Consultancy service provided by

Consultancy service provided by

Consultancy service provided by
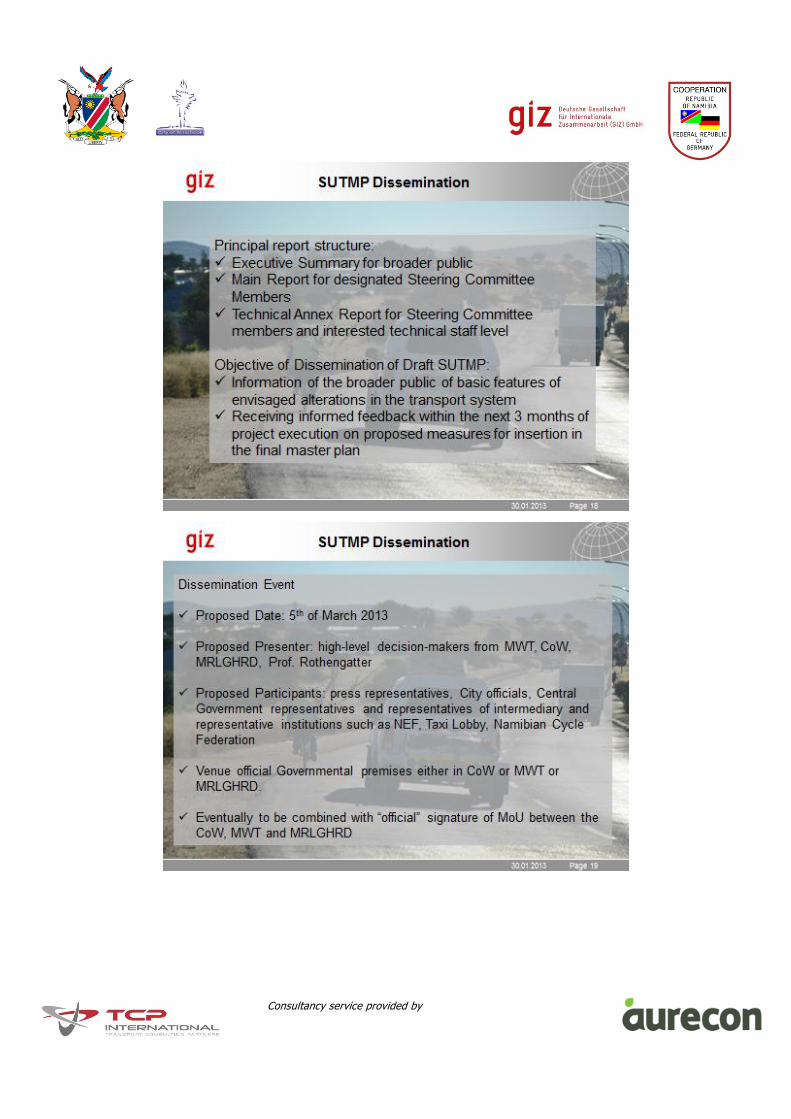
Consultancy service provided by

Consultancy service provided by


Consultancy service provided by
THE FIFTH STEERING COMMITTEE MEETING OF THE SUSTAINABLE URBAN TRANSPORT MASTER PLAN (SUTMP) FOR CITY OF WINDHOEK, INCLUDING
REHOBOTH, OKAHANDJA AND HOSEA KUTAKO INTERNATIONAL AIRPORT
MINUTES 28 FEBRUARY 2013 9.00 AM
MINISTRY OF WORKS AND TRANSPORT BOARD ROOM, 8
TH FLOOR
MEETING CALLED BY SUTMP Project Team
TYPE OF MEETING 5th
Steering Committee Meeting
CHAIRMAN Cedrik Limbo
ATTENDEES
Name Institution/Position E-mail Tel/Mobile
1. Cedric Limbo Act. Director, MWT [email protected] 0811402485
2. Clarence M.U Rupingena
CoW-Public Transport [email protected] 0811223927
3. Charl Morkel CoW-Police [email protected] 0811402485
4. Browny Mutrifa CoW Urban Planning 0612072961
5. Horst Lisse CoW-Chief Engineer
6. Robert Riethmueller Polytechnic [email protected] 0612072961
7. Angelika Zwicky TCP/Aurecon Team Leader [email protected] 0818594545
8. Kenneth Odero TCP/Aurecon – Institutional Advisor
[email protected] 0818594546
9. Laetitia English TCP/Aurecon [email protected] 0812159628
10. Frederik Strompen GIZ Technical Advisor [email protected] 0816200806
11. Toini Paulus GIZ – Intern [email protected] 0813945764
12. Immanuel Shipanga GIZ [email protected] 0811412330
13. Gregor Schmorl GIZ [email protected] 0811426844

Consultancy service provided by
Agenda topics
1. COMMUNICATION FROM THE CHAIR
5 MINUTES, CHAIR
CONCLUSIONS
The chairman welcomed the committee
Apologies: George Mayombelo, Adam Eiseb
2. CONFIRMATION OF MINUTES OF THE PREVIOUS MEETING HELD ON 29
TH JANUARY 2013
10 MINUTES, ALL
CONCLUSIONS
The printed version distributed during this meeting is an old version – apologies by the team leader for that. But the version sent right after the last meeting was the correct one.
AG should be acting director(AD) for Cedric Limbo
With above clarifications / corrections, the meeting notes of the 4th
Steering Committee Meeting were accepted.
3. MATTERS ARISING 15 MINUTES, ALL
DISCUSSION
Taxi Industry:
The representation of the taxi industry is presently rather uncertain, especially with a view that NABTA has no governmental registration any more.
Irrespective of the official status of the taxi industry representatives all three bodies should be treated as concern groups and are to be involved.
The taxi industry has been part of the stakeholder involvement and continuation in all further project stages is needed as this project will have a strong impact on their business
Responsible for the further involvement and follow-up with the taxi industry is Damien.
The SUT Master Plan contains recommendations on how to involve the taxi industry. The MWT can consider these recommendations when consulting the taxi industry.
The message for the involvement should be that they will play a role and they are not left behind.
Western Bypass
The CoW – Horst – had a meeting with the RA concerning the problems with and the hand-over of the Western Bypass to the City. However, there was a clear statement that the Western Bypass will stay a national road.
In order to achieve a common understanding and approach, the Road Authority is to be invited to all technical meetings.
Involvement of the Ministry of Regional and Local Government, Housing and Rural Development (MRLGHRD)
The MRLGHRD has to play an important role especially concerning the land use development, public transportation and
cascading SUTMP principles towards other towns.
The Deputy Minister was briefed, but further contacts need to be established and involvement needs to be strengthened, especially with
a view to 5 year budget planning and realignment between both ministries.
CoW’s role is piloting on NMT and PT, but the Central Government has to take ownership of the entire process.
Partnership between the CoW and the MRLGHRD especially with a view to the development of public transport, i.e. also stated by the Mayor of Whk.
SUTMP project related communication need to be established from one Ministry to the other, i.e. MWT and MRLGHRD need to meet on a high-level.
SUTMP Budget and Support
5 year plan for the Ministry of Works made considerable provisions for the SUTMP project realisation.
For this financial year there is not a specifically determined MWT budget item but from the next year onwards there will be a determined budget item according to the five year plan.
The CoW’s budget cycle is right now and there will be a budget item inserted for SUTMP measures.
As a consequence of the German – Namibian Consultations, where Clarence had a speech in favor of the SUTMP project, the present GIZ Transport Project is presently under review. There will be a change of its content towards urban transportation. The review team will come in September in advance to the German – Namibian Government negotiations for preparing those changes. The official political partner of the GIZ is the Ministry of Works. Thus, it is to be expe cted that the GIZ support will continue.
Cabinet memorandum
This matter is urgent with a view to the planned dissemination. Cedric is following up with Under Secretary who promised to do his part and communicate with the Permanent Secretary. It is expected that after next week, this cabinet memo is forwarded by the MWT.
The National Assembly decision on promoting PT and NMT will give a new momentum to this entire issue. The NA decision making process started two years ago but the decision came in the right time since the SUTMP is now released.
Repercussions of National Master Plan on the SUTMP
Angelika informed the audience that apart from the National Master Plan Workshop there were several further meetings and contacts with the National Master Plan team. In principle there are two fields of interaction with the national master plan, i.e.

Consultancy service provided by
o The pace in which the railway in the SUTMP study area will be rehabilitated as this will determine the pace in which the proposed commuter trains might be established and the detailed design of the rehabilitation measures must also consider the proposed commuter infrastructure needs (e.g. additional stations in Brakwater etc.). The up -dating of the master plan in 5 years must have a specific look into this area and maybe also already the feasibility study.
o The pace in which the capacity of the existing roads towards Okahandja, Rehoboth and Hosea Kutako is increased. As long as there are only safety enhancement measures such as passing lanes envisaged, and this appears to be the case right now, the modal split forecasting of the SUTMP remains valid.
Data collected and recommendations made should also be submitted to Trans Namib for further review. Meetings with Councils of Rehoboth and Okahandja
Angelika briefly informed the audience that the meetings took place in Rehoboth and in Okahandja. The participants were informed in general without forwarding already detailed findings and recommendations.
Major concerns of both cities were the road situation and what happens to the railway connection. Okahandja expressed some interest in cascading the SUTMP principles to their city.
The SUTMP Consulting Team is stand-by for Whk council meetings. This should be envisaged especially with a view to some shifts within the council.
CONCLUSIONS
Damien is responsible for the follow up with the taxi industry; all three bodies presently representing the taxi industry irrespective of their legal status will be treated as concern groups and should be invited to the SUTMP dissemination event.
Western Bypass will most probably stay a national road; RA is to be involved in all technical SUTMP meetings from now on.
MWT will take ownership and take-up contact with its counterparts at MRLGHRD to discuss outstanding issues.
Cabinett Memorandum will be further followed-up by Cedric together with the Under-Secretary.
A similar briefing as with the councils of Rehoboth and Okahandja should be undertaken for Windhoek, but referring also to findings and recommendations. Clarence Rupingena will organize. The GIZ Consulting Team is stand -by until the forthcoming week.
4. RELEASE AND DISCUSSION OF DRAFT SUTMP 20 MINUTES, ANGELIKA ZWICKY AND
KENNETH ODERO
DISCUSSION
Angelika introduced the report consisting of executive summary report, main report and technical annex report.
Kenneth gave an overview of main findings and recommendations.
The audience preferred to in-depth familiarize themselves with the content of the reports before discussing the details.
Pilot project starting on short term notice was supported for non-motorized transport, but with prior public consultation.
The importance of the summary report was stressed as this document will be the main reference document for the broader public but
also for the high-level governmental staff, politicians, media and last but not least donors.
SUTMP dissemination strategy starting with the rescheduled dissemination event was briefly discussed.
CONCLUSIONS
Hard copies of all three reports were distributed at the end of the meeting in the amount requested by the Terms of Reference.
Soft copies are in the production process and will be distributed within the next days to all members of the Steering Committee.
Presentation of recommendations and findings needs to be convincing and attractive.
The presentation for the rescheduled dissemination event should be circulated 5 days in advance.
GIZ marketing company will produce SUTMP dissemination material for the dissemination event.
The broader public will obtain access to the SUTMP findings and recommendations via the executive summary. The summary will be placed on the MoveWindhoek website and on different other media.
5. DETERMINATION OF HANDLING OF COMMENTS FOR INCLUSION IN THE FINAL REPORT
15 MINUTES, ALL
DISCUSSION
Comments from different stakeholders need to be handled in different ways. The professional governmental staff should
comment first before the SUTMP is released to the broader public.
Discussion on how the broader public could give their remarks and inputs. One way could be the radio station morning show
which frequently allows the public pose questions to different subjects which are answered by competent persons and also
newspapers.
CONCLUSION
The Steering committee Members will comment on the entire report before 26th of March 2013
Changes arising from those comments will be reflected in an up-dated version of the draft final executive summary report before the rescheduled dissemination event and releasing it to the broader public, and, in the main and technical annex report together with comments of the broader public in the final reporting before end of May.

Consultancy service provided by
Each entity (CoW, MWT and GIZ) determine someone who coordinates and channels the comments to the Consulting Team.
MWT (Cedric Limbo) gets in touch with MRLGHRD (Frieda Andreas) for obtaining their opinion and comments on the report .
The broader public is requested to comment only after the rescheduled dissemination event.
6. FINAL ORGANISATIONAL MATTERS OF ORGANISATION OF 5
TH OF MARCH EVENT
15 MINUTES, ALL
CONCLUSION
All MWT staff members will be on performance appraisals in the next week. Thus, the dissemination event of the 5th of March needs to
be postponed.
All high-level invitees/speakers are already informed accordingly
Angelika will send an official cancelation mail for the dissemination event to Clarence.
New proposed dates in the 2nd
or 3rd
week in April 2013
Briefings of the deputy minister and other VIPs could still be made as scheduled while Angelika is still in the country.
7. ANY OTHER BUSINESS 5 MINUTES, ALL
CONCLUSION
None
8. Close of the Meeting 5 Minutes, Chair
Conclusion
Next meeting: Frederik Strompen pointed out that the Steering Committee Meetings will be called upon also after the Consultant Team has finalized their work.
The Chair closed the meeting at 11:30 am


Annex C
Memorandum of
Understanding
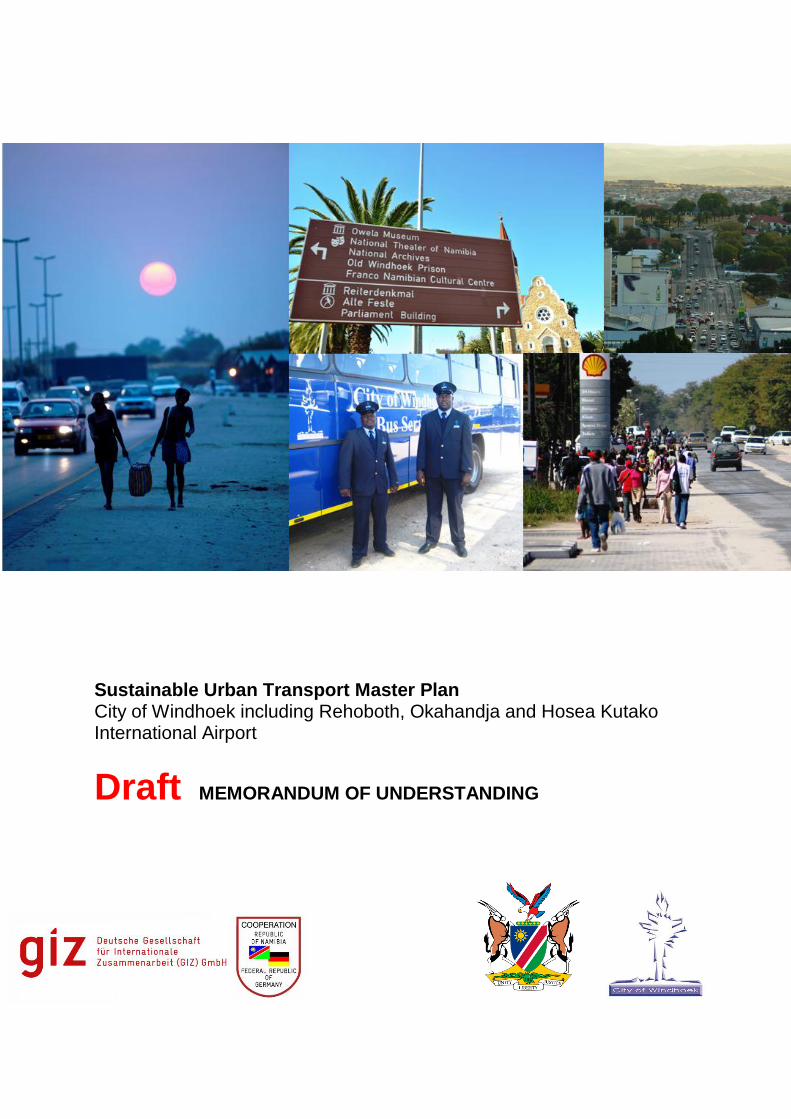
Sustainable Urban Transport Master Plan City of Windhoek including Rehoboth, Okahandja and Hosea Kutako International Airport
Draft MEMORANDUM OF UNDERSTANDING

Page | 2
Sustainable Urban Transport Master Plan for the City of Windhoek,
including Okahandja, Rehoboth and Hosea Kutako International
Airport (SUTMP)
Joint Declaration on Strategic Directions to be taken by the MWT,
MRLGHRD, CoW, Rehoboth Town Council and Municipality of
Okahandja
The Ministry of Works and Transport (MWT) and the City of Windhoek
(CoW), being joint owners and sponsor of the Sustainable Urban
Transport Master Plan (SUTMP) respectively, met at a Preparatory
Strategic Directions Workshop in Windhoek during 5-6 November 2012
and a Strategic Decision Making Workshop at 13th of November, 2012 to
formulate strategic directions for future land use and transportation for
the City of Windhoek including Rehoboth Town Council, Municipality of
Okahandja and Hosea Kutako International Airport.
The Workshop participants confirmed the mutual interest for the
progressive integration of their respective transport networks and
markets in accordance with international standards with the aim to
enhance performance of the urban public transport sector including non-
motorised transport. Moreover, they recognised the importance of public
involvement and an enhanced co-operation in the transport sector for
achieving sustainable economic, environmental and social development
as well as contributing to social inclusion, growth and income generation,
in the project region.
Page | 3
1) For Land Use Planning:
Having considered three land use scenarios (Scenario A – Business as
Usual, Scenario B – Densification of Windhoek, and Scenario C –
Polycentric Development);
And further having considered that there is a need for strong
commitment by all levels of Government, stakeholders and partners to
incorporate public transport in all future settlement structures;
And having stated that there is a need for revising the national housing
and land-use strategy in order to get the scenario reality;
it is agreed that:
Scenario C – Polycentric development will be the basis for further
SUTMP elaborations.
2) For Public Transport:
Bearing in mind the need to modernise public transport in Windhoek and
surrounding region;
And having considered the various strategic options for modernising
public transport, namely normal bus, bus on dedicated marked bus lane,
bus rapid transit (Bus Rapid Transit), light rail transit (Light Rail Transit),
minibus and taxi distributor service, and commuter rail as well as
integrated approaches comprising several of the Public Transport
options;
And based on the land-use scenario C;
Page | 4
And aiming at providing affordable transport for all residents in the
project region;
It is agreed that:
a. a highly integrated system of Public Transport is required in
Windhoek;
b. Bus Rapid Transit and Light Rail Transit options will be further
investigated (costs, required capacities according to forecasted
passenger volumes) for high frequency transit corridors;
c. the Public Transport system requires space which needs to be
secured either from existing road space in high frequency (transit)
corridors; or within railway servitudes; or acquisition of additional
land.
d. in further land developments there need to be reservations for rail
right of-way and bus lanes and stations;
e. the Public Transport system needs to have priority at intersections;
f. the Public Transport system needs to be implemented stepwise
and gradually extended according to actual demands;
g. within existing railway servitudes, options for commuter trains
integrated with improved inner city options for urban transport will
be further investigated;
h. easy access for mobility restricted persons;
i. The taxi industry is to be integrated in the overall public
transportation scheme.
Page | 5
3) For Non-motorised Transport:
Bearing in mind that the majority of trips generated are by pedestrians
and walking and cycling as affordable, efficient, environmental friendly,
healthy modes;
And considering that improved, safe and secure facilities for walking and
cycling will considerably contribute to liveable cities;
And having considered the options for core and secondary Non-
motorised Transport networks;
And being of the opinion that only continuous networks will have the
desired effects;
It is therefore agreed that:
a. the core network and the links for Non-motorised Transport is a
good basis for further SUTMP elaborations;
b. within the core network there is need for optimisation and
extended coverage towards the following areas, for example
routes to Otjomuise, the riverbed tracks from Avis dam to Eros
and northerly expansion to Okuryangava;
c. the yellow route (strategic links to various employment and social
opportunities in the north), the red route (CBD and further north)
and the pink route (north-western Windhoek along two hospitals
and linked with Red Route) should be developed in parallel as
priority;
d. the Western Bypass is a barrier to Non-motorised Transport and
appropriate grade separated crossings are a necessity;
Page | 6
e. the network coverage for educational facilities needs to be further
investigated and prioritised (precedence needs to be given to
school precincts);
f. to convert portion(s) of Independence Avenue to pedestrianised
zones, sequenced with suitable public transport alternatives;
g. non-motorised Transport campaigns are critical to the successful
implementation of Non-motorised Transport networks and
facilities;
h. there is a need to provide also for adequate Non-motorised
Transport facilities such as bicycle storage, lockers, and safe
interchange with Public Transport;
i. security issues are to be addressed when developing Non-
motorised Transport networks and facilities;
j. easy access for mobility restricted persons.
4) For Traffic Management:
Bearing in mind that there is a need to accompany the objectives for a
modal shift and improvement of sustainable modes of transport;
And bearing in mind, that efficient, reliable, affordable, safe, secure,
integrated, convenient Public Transport and Non-motorised Transport
contribute to sustainability;
And having considered the wide variety of possible transport demand
measures;
It is agreed:

Page | 7
a. to reclassify the urban road network, e.g. in arterial roads,
collector roads, residential access roads, residential street and
pedestrian area, and attribute different speed limits combined with
modern, low cost design standards;
b. that the reclassification ought to be done in close consultation with
residents, stakeholders and partners, tested via pilot schemes;
c. that the reclassification should also incorporate Non-motorised
Transport and Public Transport infrastructure provisions;
d. that the taxi industry has to be incorporated in all relevant
transport demand management measures;
e. that parking management is important but parking restrictions
should not be implemented before viable Public Transport and
Non-motorised Transport Alternatives are provided;
f. that education and awareness measures are essential for
achieving sustainable urban transport objectives through
Transport Demand Management measures.
g. that all SUTMP measures should take road safety impacts into
account within the entire life cycle of the measures.
5) For Institutions, Legal Framework and Financing Options
Having considered the various strategic options for the institutional set-
up of efficient sustainable modes, namely strengthening of existing
institutional set-up, establishing a Transport Agency, privatisation of
existing operational PT services, and Public Private Partnership for
complete renewal of Public Transport system;
And taking into account the financial constraints of the City of Windhoek;
Page | 8
And taking into account that the operational costs of Public Transport
systems need to be covered by efficient Public Transport operations;
And taking into account uneven investments of the Central Government
for different modes of transport;
It is agreed that:
a. commercialisation of public transport has to go along with secure
financing;
b. there is a need for a strong regulatory entity and ensuring that
Public Transport operation is tendered for competitively;
c. Road Fund Administration can take over part of the investment
costs, if overall life cycle costs are reduced e.g. by low cost design
standards;
d. the potential for increasing fuel levy in order to finance Public
Transport and Non-motorised Transport needs to be investigated;
e. the regulation and administrative functions for Public Transport
ought to be taken over by a national transport agency;
f. the coverage of investment costs is not a challenge as long as it
follows certain principles such as user chooses his/her services,
Public Service Obligations are addressed and the Government
does not limit service provision;
g. coverage of public service obligations is not a challenge if it goes
along with efficient service provision;
h. the process of legal reforms should be supported;
i. to form an interagency/intergovernmental Committee aiming at
further elaboration of institutional, legal and funding implications of
Public Transport and Non-motorised Transport measures after
SUTMP submission.

Page | 9
The participants underlined the importance of ensuring continuous
dialogue and consultation.
Signed at Windhoek, the xth of November, 2012
_______________________ _______________________
MWT MRLGHRD
_______________________ _______________________
City of Windhoek City of Okahandja
_______________________
City of Rehoboth

Page | 10
Deutsche Gesellschaft für Internationale Zusammenarbeit (GIZ) GmbH P.O Box 8016 Windhoek,Namibia, www.sutp.org Ministry Work and Transport Head Office Building 6719 Bell St Snyman Circle Windhoek

Annex D
Maps

The following tables give an overview of all maps inserted in this annex as announced in the main report. In case of need of another print out forms, please address the SUTMP Team Members.
The following tables give an overview of all maps inserted in this annex as announced in the main report. In case of need of another print out forms, please address the SUTMP Team Members.
Map Title Description
Map 1.1 Population
density
The highest population figures can be found to the North-western
part of the city of Windhoek. These areas are characterised by their
informal structures. The areas with the highest population figures are
Okuryangava, Kakahana, Wanaheda, Goreangab and Havan with
population figures ranging from 4401 to 28 000.
Map 1.2 Land use CBD, commercial, industrial and institutional land-uses, including
retail and open spaces. As shown, it is evident that there is an
adequate open space network in Windhoek that connects to all major
land uses and retail centres. This is specifically important the
formulation of attractive NMT routes.
Map 2.1 Bus stops and
bus routes
The map shows the bus routes and bus stops. All scheduled buses
depart from most areas of the north-western residential suburb of
Katutura, including Goreagab and parts of Otjomuise to various
employment locations in the east, the south and in the city centre.
Map 2.2 Type of
Busstops
The map shows wether the bus stops on the road are marked or not
or wether it is in the form of a bus cap. The majority is in the form
of a bus cap.
Map 2.3 Availability of
Signs indicating
a bus stop
The map gives the location where bus stops are marked. 134 of the
total are not signed at all and thus hard to recognise for the
(potential) users.
Map 2.4 Availability of
Shelters
The map shows where shelters for passenger convenience are
provided at the bus stops.
Map 2.5. Shelter
conditions
The map shows the shelter condition of the bus stops. Very good
and good condition stops can be found mainly in the central districts,
no shelter at all or poor conditions are to be found mainly in the
outer areas of Windhoek
Map 2.6 Current
Advertisement
This map shows that presently only 19 out of the total of bus stops
are used for the disposal of advertisements. This leaves room for
future income generation via advertisements at additional stops.
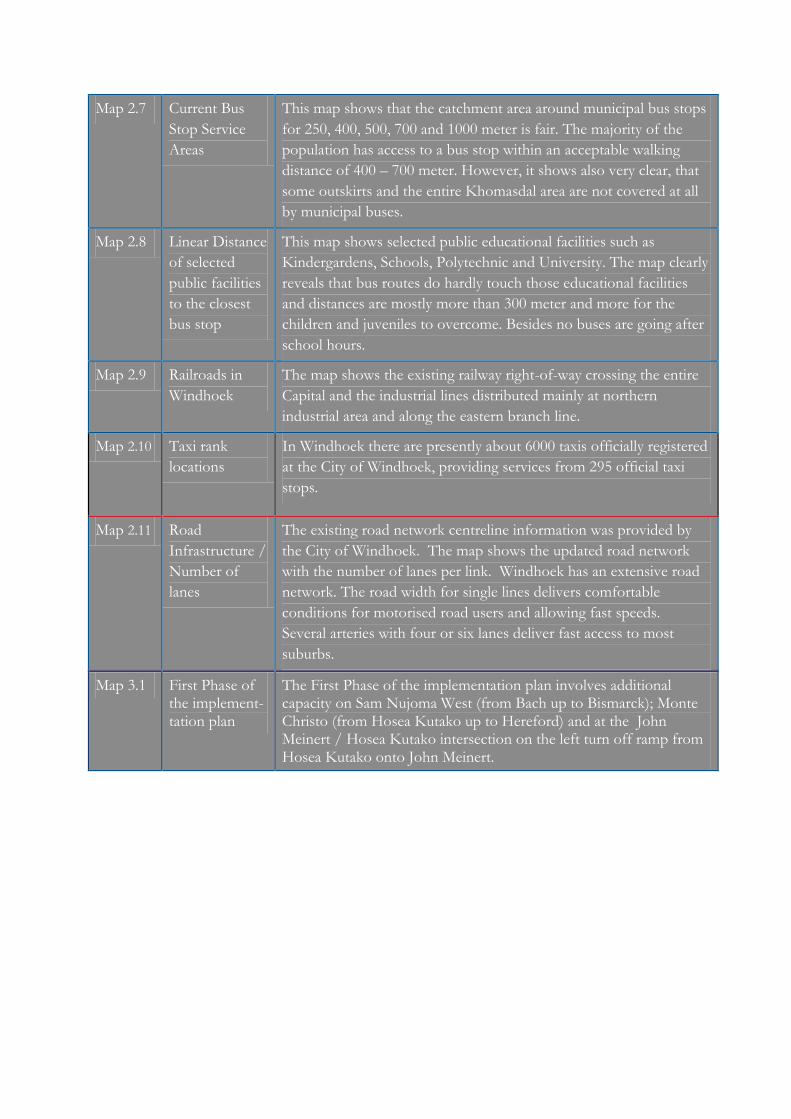
Map 2.7 Current Bus
Stop Service
Areas
This map shows that the catchment area around municipal bus stops
for 250, 400, 500, 700 and 1000 meter is fair. The majority of the
population has access to a bus stop within an acceptable walking
distance of 400 – 700 meter. However, it shows also very clear, that
some outskirts and the entire Khomasdal area are not covered at all
by municipal buses.
Map 2.8 Linear Distance
of selected
public facilities
to the closest
bus stop
This map shows selected public educational facilities such as
Kindergardens, Schools, Polytechnic and University. The map clearly
reveals that bus routes do hardly touch those educational facilities
and distances are mostly more than 300 meter and more for the
children and juveniles to overcome. Besides no buses are going after
school hours.
Map 2.9 Railroads in
Windhoek
The map shows the existing railway right-of-way crossing the entire
Capital and the industrial lines distributed mainly at northern
industrial area and along the eastern branch line.
Map 2.10 Taxi rank
locations
In Windhoek there are presently about 6000 taxis officially registered
at the City of Windhoek, providing services from 295 official taxi
stops.
Map 2.11 Road
Infrastructure /
Number of
lanes
The existing road network centreline information was provided by
the City of Windhoek. The map shows the updated road network
with the number of lanes per link. Windhoek has an extensive road
network. The road width for single lines delivers comfortable
conditions for motorised road users and allowing fast speeds.
Several arteries with four or six lanes deliver fast access to most
suburbs.
Map 3.1 First Phase of the implement-tation plan
The First Phase of the implementation plan involves additional capacity on Sam Nujoma West (from Bach up to Bismarck); Monte Christo (from Hosea Kutako up to Hereford) and at the John Meinert / Hosea Kutako intersection on the left turn off ramp from Hosea Kutako onto John Meinert.

Map 3.2 Second Phase of the implementation plan
The map shows the Second Phase of the implementation plan. It includes capacity improvements on:
Sam Nujoma West (between the Western Bypass and Hendrik Witbooi Drive)
Sam Nujoma East (from Mission up to Gobabis District Road)
Florence Nightingale (from Bach up to Frans Indongo)
Aus Road (from Sean McBride up to Mandume Ndemufayo)
Hochland Road (from Mandume Ndemufayo up to Snyman Circle)
Otjomuise Road (from Independence up to Sam Nujoma); and
Independence Avenue from (Western Bypass up to Robert Mugabe Circle)
Map 4.1 Survey
locations:
Classified
intersection
counts
The map shows the location of the
15 Classified Intersection Counts.
The Consortium proposed that the
counts and surveys be undertaken at
the same locations as in 2004, with
some additional counts proposed to
improve the accuracy of the model.
Map 4.2 Survey
locations:
Vehicle
occupancy
counts
The map shows the location 6
Vehicle Occupancy Counts. Vehicle
occupancy is of particularly
important since the study will have a
strong focus on public transport.
Map 4.3 Survey
locations: OD
surveys and
link counts
The map shows the location 3 OD
Surveys & Link Counts. OD surveys
added great value especially since the
study also focussed on longer
commuter trips. 12-hour link counts
were also carried out at these
locations
Map 4.4 Survey
locations:
Pedestrian and
bicycle counts
The map shows the location 10
Pedestrian & Bicycle Counts. It was
proposed that 10 pedestrian/bicycle
screenline counts be undertaken with
the focus on the northern suburbs in
particular between Katatura and the
industrial area as well as Katatura
and the Central Business District.

Map 5.1 Reference
Scenario (2012)
AM Peak Hour
Vehicle
Volumes
The map shows the AM peak hour vehicle volumes for the
Reference scenario (2012). There are high volumes of traffic from
the north and north-west of Windhoek moving towards the CBD.
There is also a clear difference between the volumes moving from
the north and north-west to the CBD, and the volumes originating
from the south-east.
Map 5.2 Reference
Scenario (2012)
AM Peak Hour
Public
Transport
Passengers
The map shows the AM peak hour public transport passenger
volumes for the Reference scenario (2012).
Map 6.1 Workplace
Projection
The map shows the workplace projection over time following the
basic land use schemes for the chosen scenario C – polycentric
development.
Map 7.1 Business as
Usual Scenario
(2032) AM
Peak Hour
Vehicle
Volumes
The map shows the AM peak hour vehicle volumes for the Business
as Usual Scenario (2032). The results reveal very high vehicle
volumes from the Brakwater area towards Windhoek as a result of a
lack of formal public transport in the Northern Corridor.
Map 7.2 Business as
Usual Scenario
(2032) AM
Peak Hour
Public
Transport
Passengers
The map shows the AM peak hour public transport passenger
volumes for the Business as Usual Scenario (2032). The results
shows limited public transport passengers from the Brakwater area
towards Windhoek as a result of a lack of formal public transport in
the Northern Corridor.
Map 7.3 Sustainable
Transport
Scenario (2032)
AM Peak Hour
Vehicle
Volumes
The map shows the AM peak hour vehicle volumes for the
Sustainable Transport Scenario (2032). The results reveal reduced
vehicle volumes from the Brakwater area towards Windhoek as a
result of the introduction of a formal mass-transit public transport
system in the Northern Corridor.
Map 7.4 Sustainable
Transport
Scenario (2032)
AM Peak Hour
Public
Transport
Passengers
The map shows the AM peak hour public transport passenger
volumes for the Sustainable Transport Scenario (2032). The results
show an increase in public transport passengers from the Brakwater
area towards Windhoek as a result of the introduction of a formal
mass-transit public transport system in the Northern Corridor.
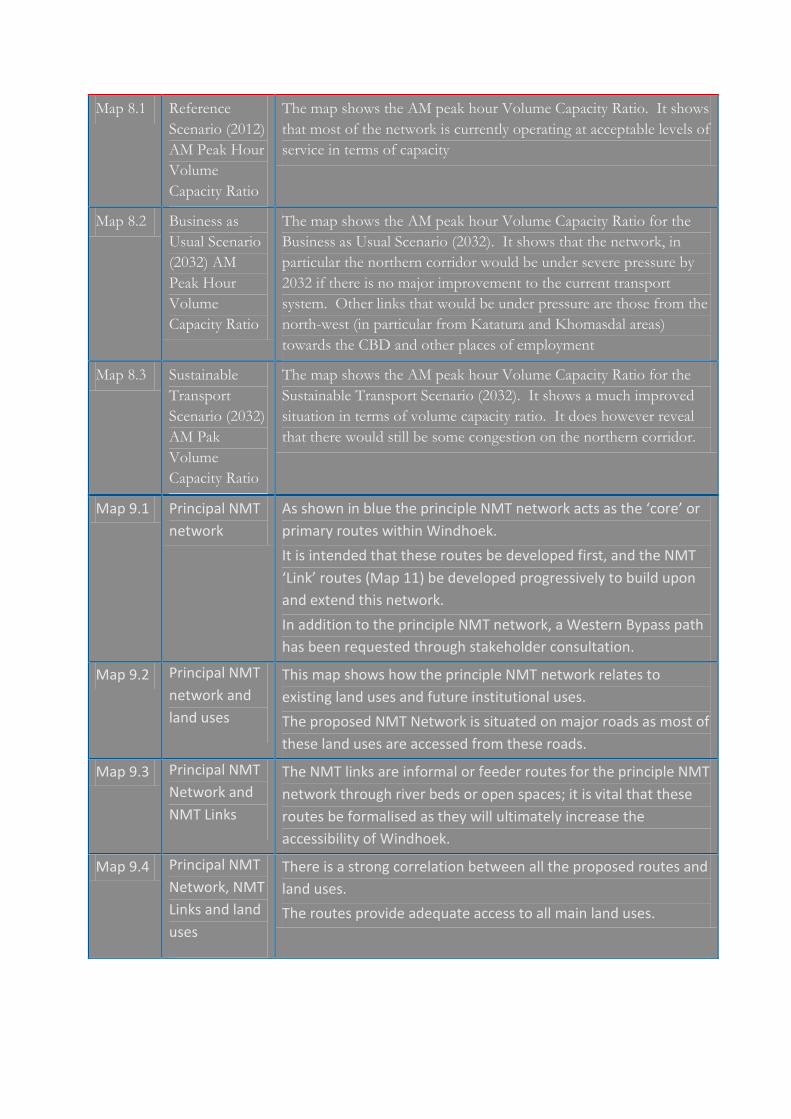
Map 8.1 Reference
Scenario (2012)
AM Peak Hour
Volume
Capacity Ratio
The map shows the AM peak hour Volume Capacity Ratio. It shows
that most of the network is currently operating at acceptable levels of
service in terms of capacity
Map 8.2 Business as
Usual Scenario
(2032) AM
Peak Hour
Volume
Capacity Ratio
The map shows the AM peak hour Volume Capacity Ratio for the
Business as Usual Scenario (2032). It shows that the network, in
particular the northern corridor would be under severe pressure by
2032 if there is no major improvement to the current transport
system. Other links that would be under pressure are those from the
north-west (in particular from Katatura and Khomasdal areas)
towards the CBD and other places of employment
Map 8.3 Sustainable
Transport
Scenario (2032)
AM Pak
Volume
Capacity Ratio
The map shows the AM peak hour Volume Capacity Ratio for the
Sustainable Transport Scenario (2032). It shows a much improved
situation in terms of volume capacity ratio. It does however reveal
that there would still be some congestion on the northern corridor.
Map 9.1 Principal NMT
network
As shown in blue the principle NMT network acts as the ‘core’ or
primary routes within Windhoek.
It is intended that these routes be developed first, and the NMT
‘Link’ routes (Map 11) be developed progressively to build upon
and extend this network.
In addition to the principle NMT network, a Western Bypass path
has been requested through stakeholder consultation.
Map 9.2 Principal NMT
network and
land uses
This map shows how the principle NMT network relates to
existing land uses and future institutional uses.
The proposed NMT Network is situated on major roads as most of
these land uses are accessed from these roads.
Map 9.3 Principal NMT
Network and
NMT Links
The NMT links are informal or feeder routes for the principle NMT
network through river beds or open spaces; it is vital that these
routes be formalised as they will ultimately increase the
accessibility of Windhoek.
Map 9.4 Principal NMT
Network, NMT
Links and land
uses
There is a strong correlation between all the proposed routes and
land uses.
The routes provide adequate access to all main land uses.

Map 9.5 Pre-Primary
School
(500m buffer)
Maximum capture distance = 500m.
Pre-primary school children cannot travel vast distances.
Map 9.6 Primary
Schools
(1 km buffer)
Maximum capture distance = 1km.
This is considered an acceptable distance to walk or cycle to
school for children between the ages of 6 and 12.
Map 9.7 Secondary
Schools
(2km buffer)
Maximum capture distance = 2km.
It is considered that young adults between the ages of 13 and 18
can travel larger distances to access educational facilities. Thus
2km can be seen as an acceptable capture zone.
Map 9.8 Tertiary
Institution
(5km buffer)
Maximum capture distance = 5km.
Adults from the age of 18 attend these institutions. Due to the
lack of options in terms of tertiary institutions the willingness to
travel is bigger, thus capture zones are larger.
Map 9.9 Speciality
Institutions
(500 m buffer)
Maximum capture distance = 1km.
These are a variety of institutions that cater for either disabled
children or provide other specialised services. The distance of
1km was seen as a realistic walking or cycling capture zone; as
people may not have the capabilities to walk or cycle to these
institutions.
Map
9.10
Other Training
Institution’s
(1 km buffer)
Maximum capture distance = 1km.
Institutions that provide skills development such as artisan skills,
etc. Due to the nature of these training facilities and the fact that
specialised tools may be needed to attend these institutions, 1km
was seen as a reasonable distance to travel.
Map
9.11
Hospital and
Clinics
(8km and 3km
buffer
respectively)
Maximum capture distance = 8km hospital, 3km clinic
Clinics generally act as a neighbourhood facility and thus the
capture site is not as extensive as is the case for Hospitals. The
proposed capture zone for hospitals is estimated to be 8km; as
hospitals will ultimately cater for a greater region.
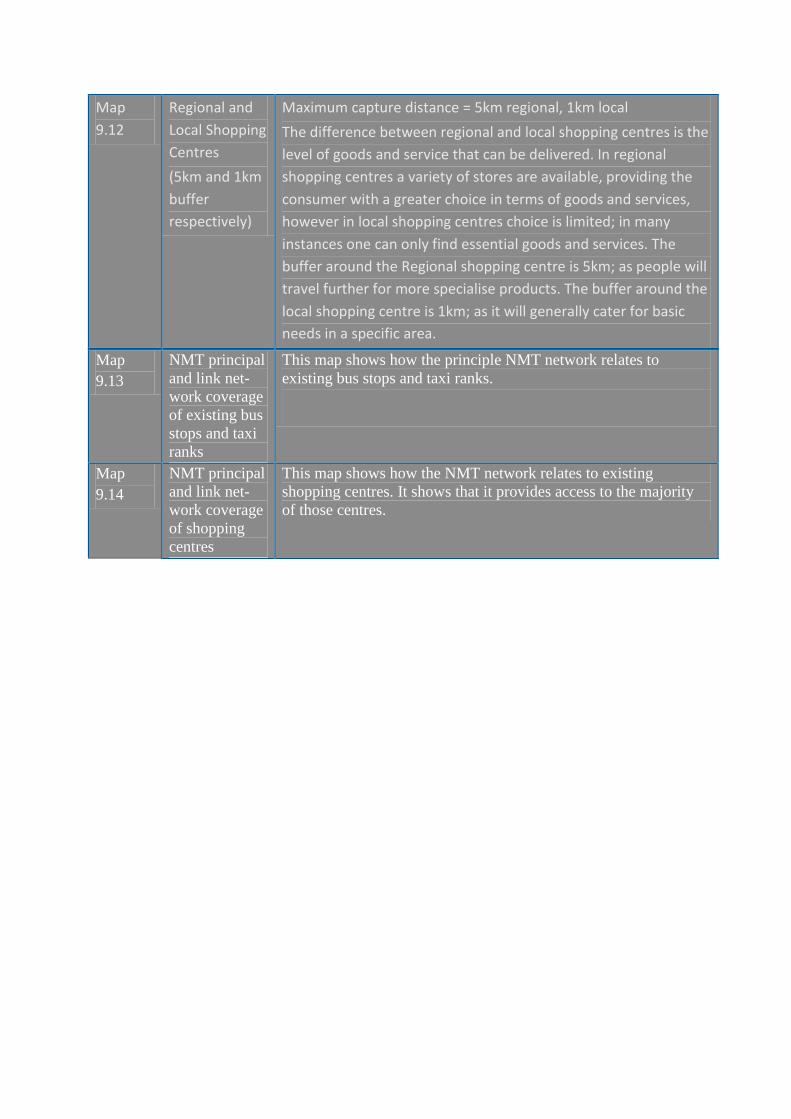
Map
9.12
Regional and
Local Shopping
Centres
(5km and 1km
buffer
respectively)
Maximum capture distance = 5km regional, 1km local
The difference between regional and local shopping centres is the
level of goods and service that can be delivered. In regional
shopping centres a variety of stores are available, providing the
consumer with a greater choice in terms of goods and services,
however in local shopping centres choice is limited; in many
instances one can only find essential goods and services. The
buffer around the Regional shopping centre is 5km; as people will
travel further for more specialise products. The buffer around the
local shopping centre is 1km; as it will generally cater for basic
needs in a specific area.
Map
9.13
NMT principal
and link net-
work coverage
of existing bus
stops and taxi
ranks
This map shows how the principle NMT network relates to
existing bus stops and taxi ranks.
Map
9.14
NMT principal
and link net-
work coverage
of shopping
centres
This map shows how the NMT network relates to existing
shopping centres. It shows that it provides access to the majority
of those centres.

Map 1.1. New population information
85


Map 1.2. New land-use information
87


Map 2.1. Current bus routes and bus stops in Windhoek.

Map 2.2. Bus stops: Type of bus stops.

Map 2.3. Bus stops: Availability of signs in the street profile indicating a bus stop.
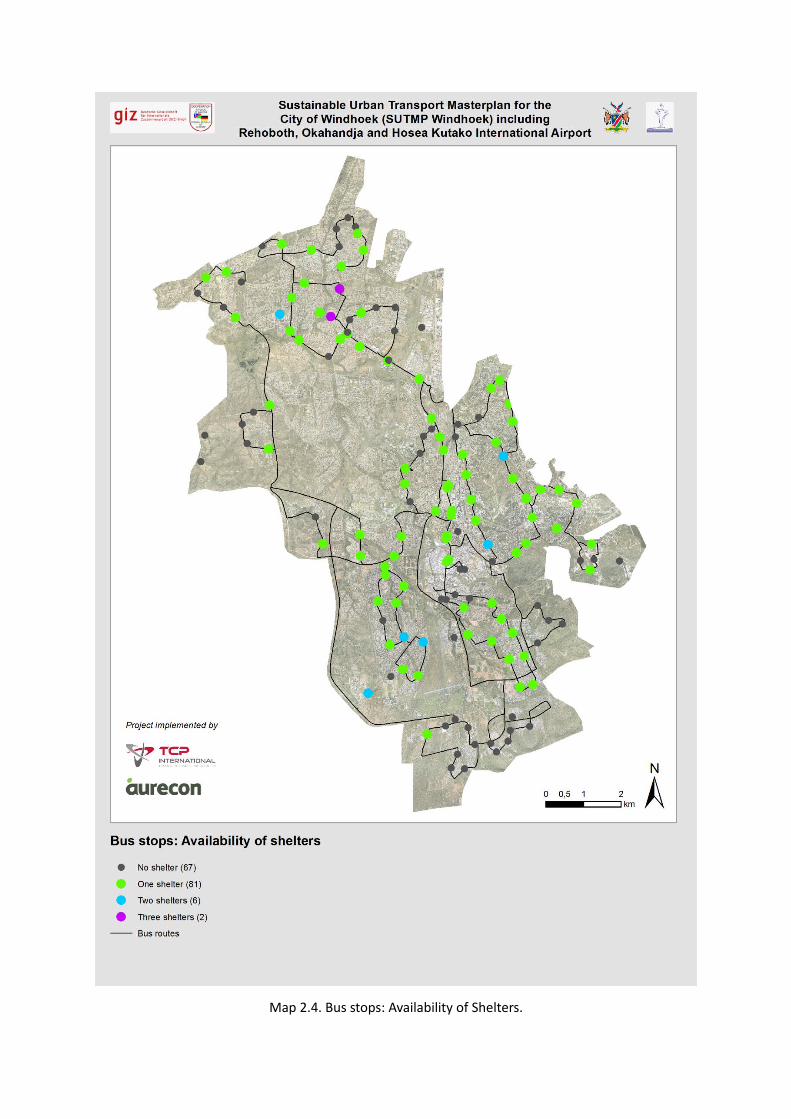
Map 2.4. Bus stops: Availability of Shelters.

Map 2.5. Bus stops: General shelter conditions.
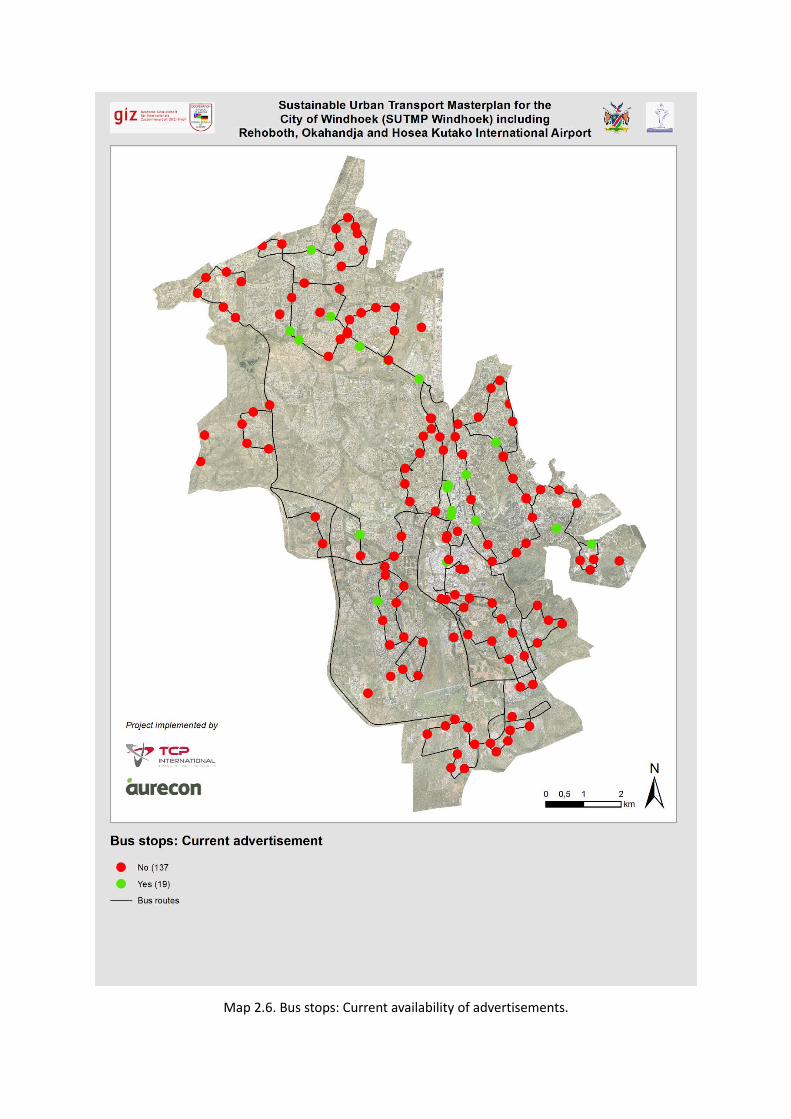
Map 2.6. Bus stops: Current availability of advertisements.
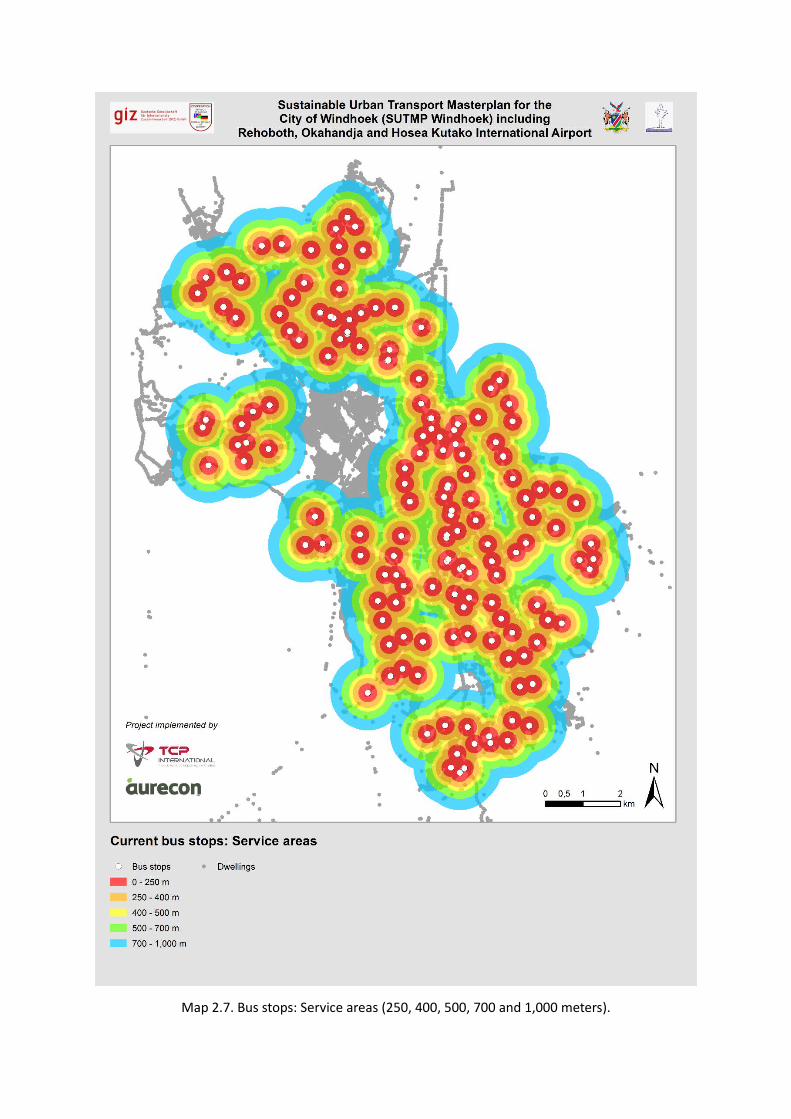
Map 2.7. Bus stops: Service areas (250, 400, 500, 700 and 1,000 meters).
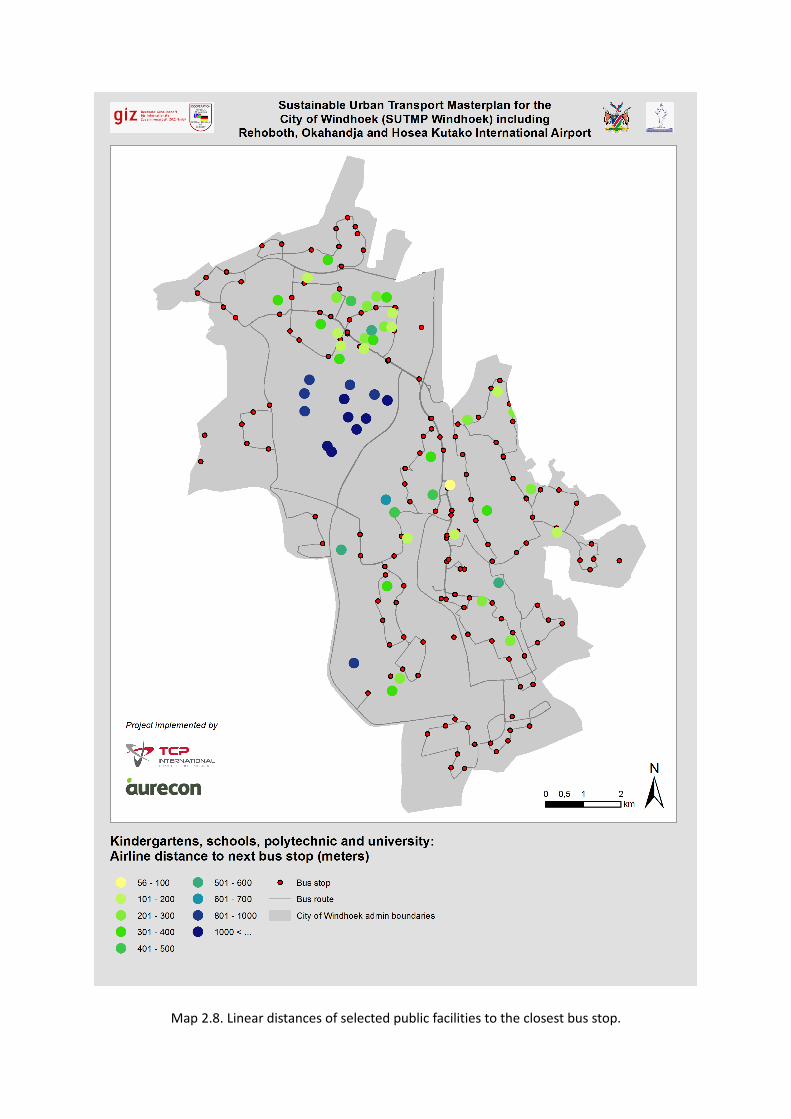
Map 2.8. Linear distances of selected public facilities to the closest bus stop.

Map 2.9. Railroads in Windhoek.
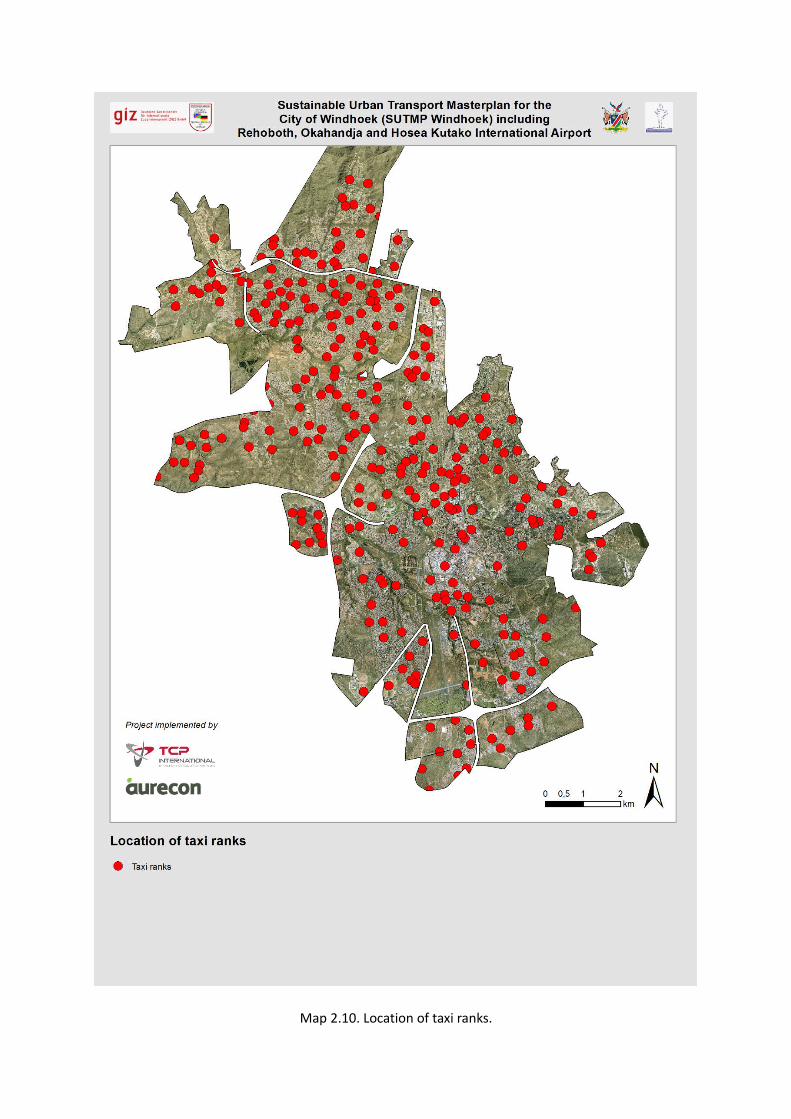
Map 2.10. Location of taxi ranks.

Ist Latest Network information die erstefolie.
99

Map 3.1. First Phase of the arterial roadmaster plan implementation
100
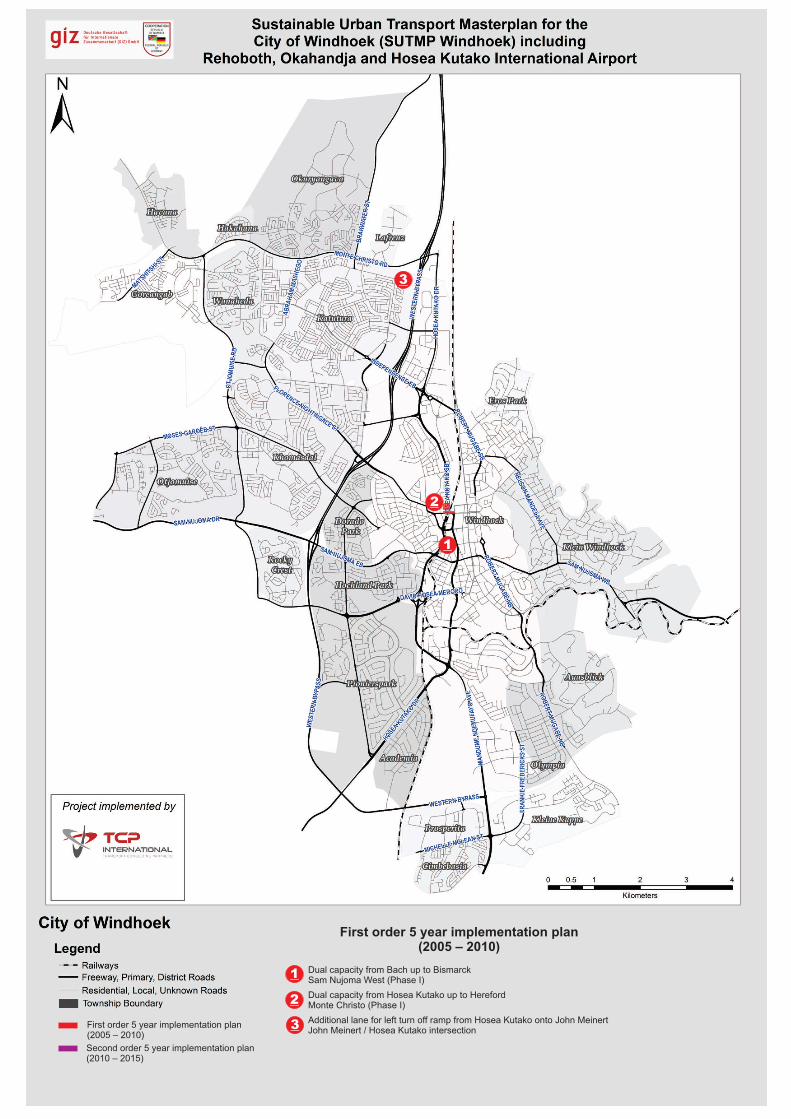
1
2
3
First order 5 year implementation plan(2005 – 2010)
1
2
3
Dual capacity from Bach up to BismarckSam Nujoma West (Phase I)
Dual capacity from Hosea Kutako up to HerefordMonte Christo (Phase I)
Additional lane for left turn off ramp from Hosea Kutako onto John MeinertJohn Meinert / Hosea Kutako intersection
First order 5 year implementation plan(2005 – 2010)
Second order 5 year implementation plan(2010 – 2015)

Map 3.2. Second Phase of the arterialroad master plan implementation
102

1
Second order 5 year implementation plan(2010 – 2015)
1Dual capacity from Western Bypass up to Hendrik Witbooi DriveSam Nujoma West (Phase II)
Dual capacity from Mission up to Gobabis District RoadSam Nujoma East (Phase I)
Dual capacity from Bach up to Frans IndongoFlorence Nightingale (Phase I)
2
3
4
6
5
7
2
3
4
5
Dual capacity from Sean McBride up to Mandume NdemufayoAuas Road
Additional lane to three lanes per direction from Mandume Ndemufayo up to Snyman CircletHochland (Phase I)
6Dual capacity from Independence up to Sam NujomaOtjomuise
Additional lane to four lanes per direction fromWestern Bypass up to Robert Mugabe CircleIndependence
7
First order 5 yearimplementation plan (2005 – 2010)
Second order 5 yearimplementation plan(2010 – 2015)

Surveys Locations:
§ Map 4.1. Classified Intersection Counts
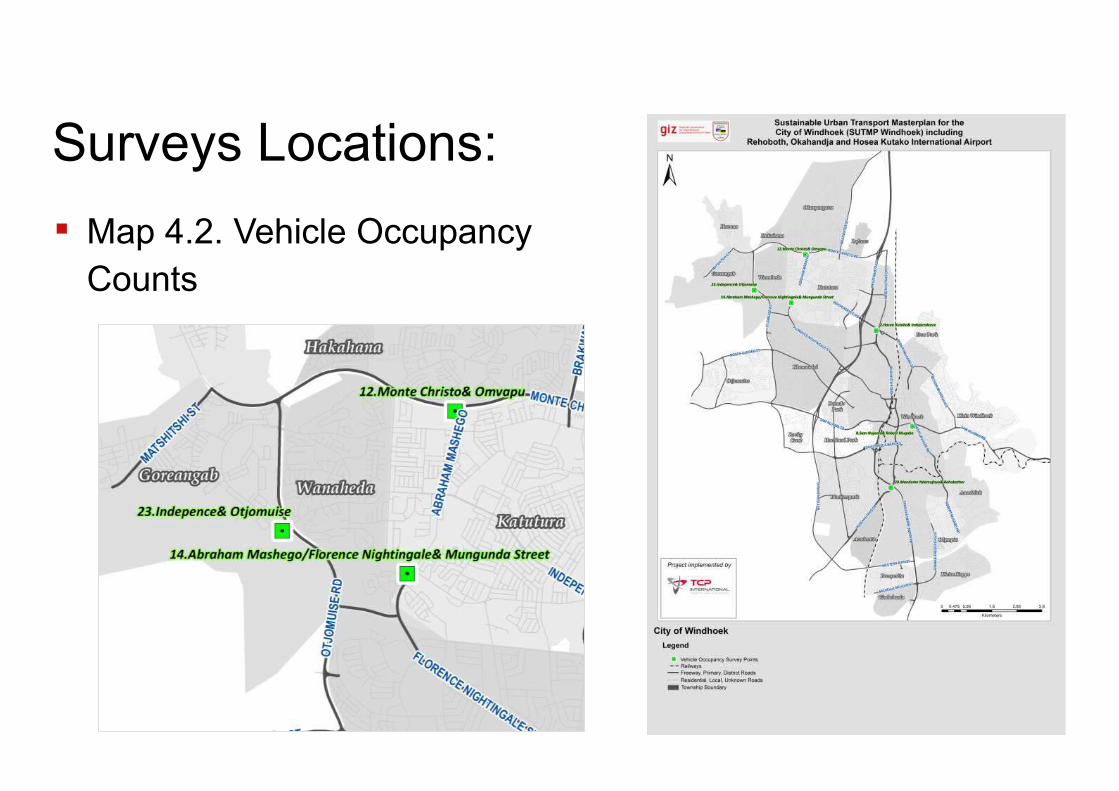
Surveys Locations:
§ Map 4.2. Vehicle Occupancy Counts

Surveys Locations:
§ Map 4.3. OD Surveys & LinkCounts

Surveys Locations:
§ Map 4.4. Pedestrian & Bicycle Counts

Map 5.1. Reference Scenario(2012) AMPeak Hour Vehicle Volumes
108

Map 5.2. Reference Scenario(2012) AMPeak Hour Public Transport Passengers
110


Map 6.1. Workplace Projection
112
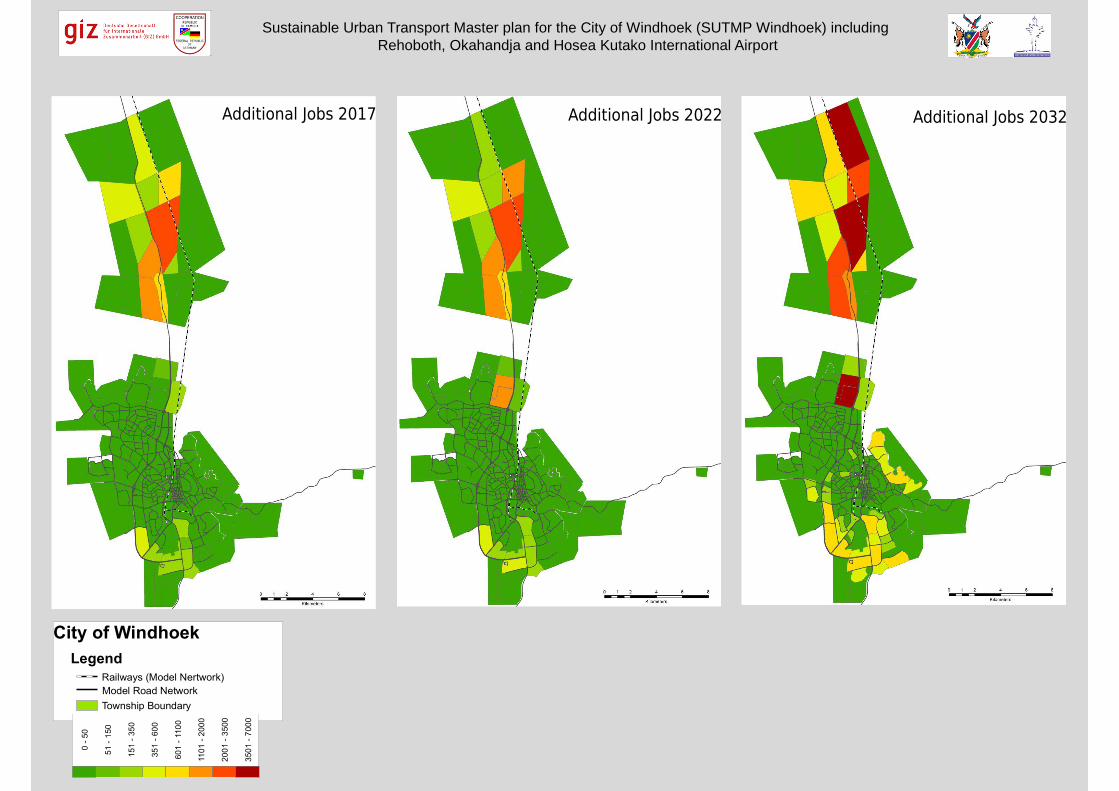
Sustainable Urban Transport Master plan for the City of Windhoek (SUTMP Windhoek) including Rehoboth, Okahandja and Hosea Kutako International Airport
Township Boundary
Model Road NetworkRailways (Model Nertwork)
Additional Jobs 2017
0 -
50
51 -
150
151
- 3
50
351
- 60
0
601
- 1
10
0
1101
- 2
000
200
1 -
350
0
3501
- 7
000
Legend
City of Windhoek
Additional Jobs 2017 Additional Jobs 2022 Additional Jobs 2032
Additional Jobs 2017
0 -
50
51
- 1
50
151
- 3
50
351
- 6
00
601
- 1
100
110
1 -
20
00
200
1 -
350
0
350
1 -
700
0

Map 7.1. Business as UsualScenario(2032) AM Peak Hour Vehicle
Volumes
114

Map 7.2. Business as UsualScenario(2032) AM Peak Hour Public
Transport Passengers
116
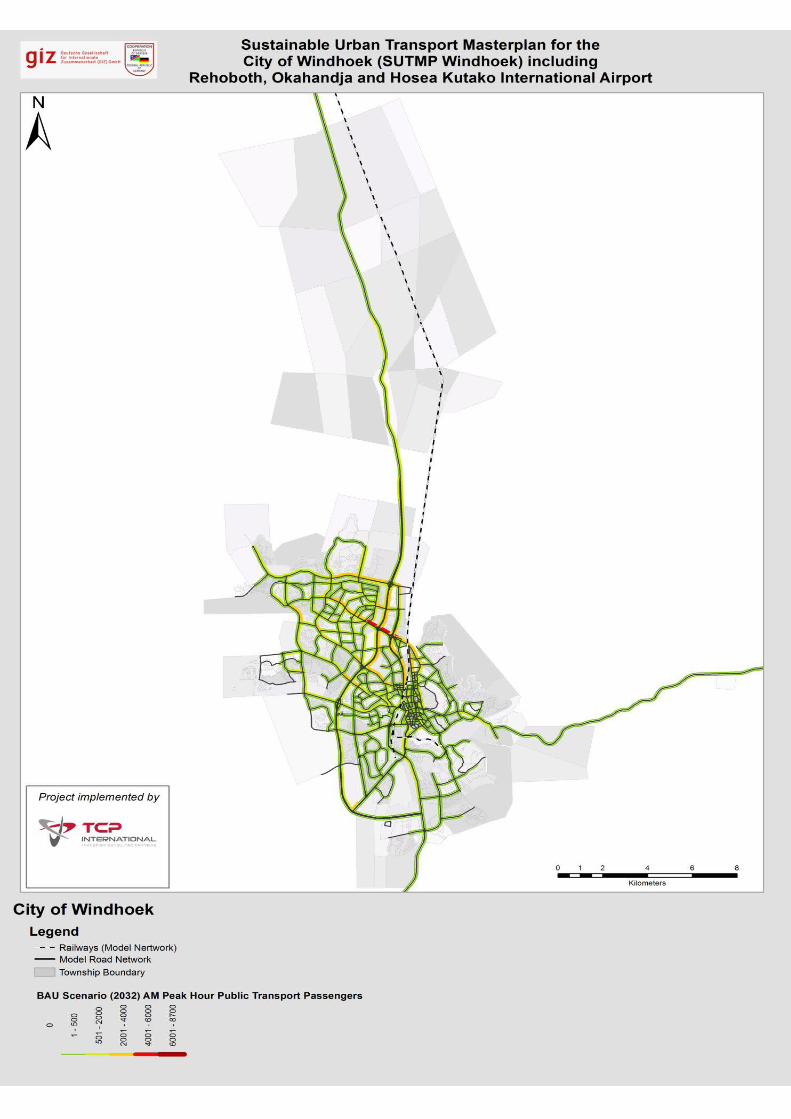

Map 7.3. Sustainable Transport Scenario(2032) AM Peak Hour Vehicle Volumes
118

Map 7.4. Sustainable Transport Scenario(2032) AM Peak Hour Public Transport
Passengers
120
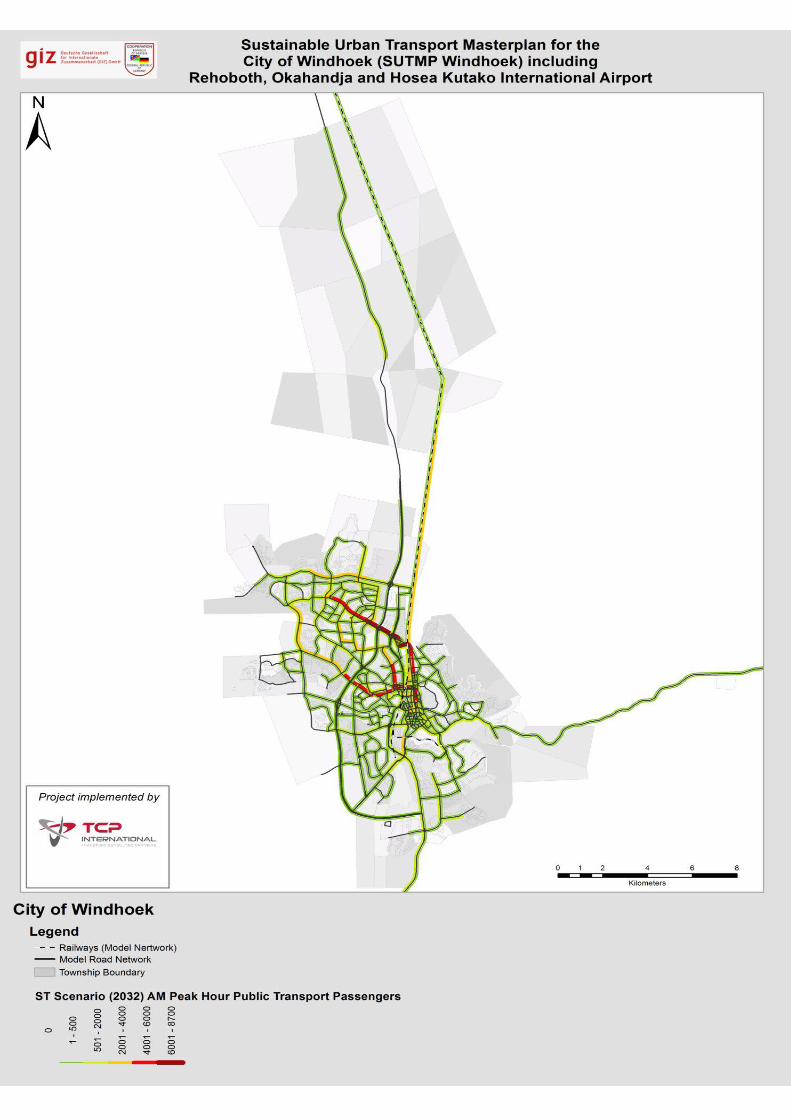

Map 8.1. Reference Scenario (2012) AMPeak Hour Volume Capacity Ratio
122
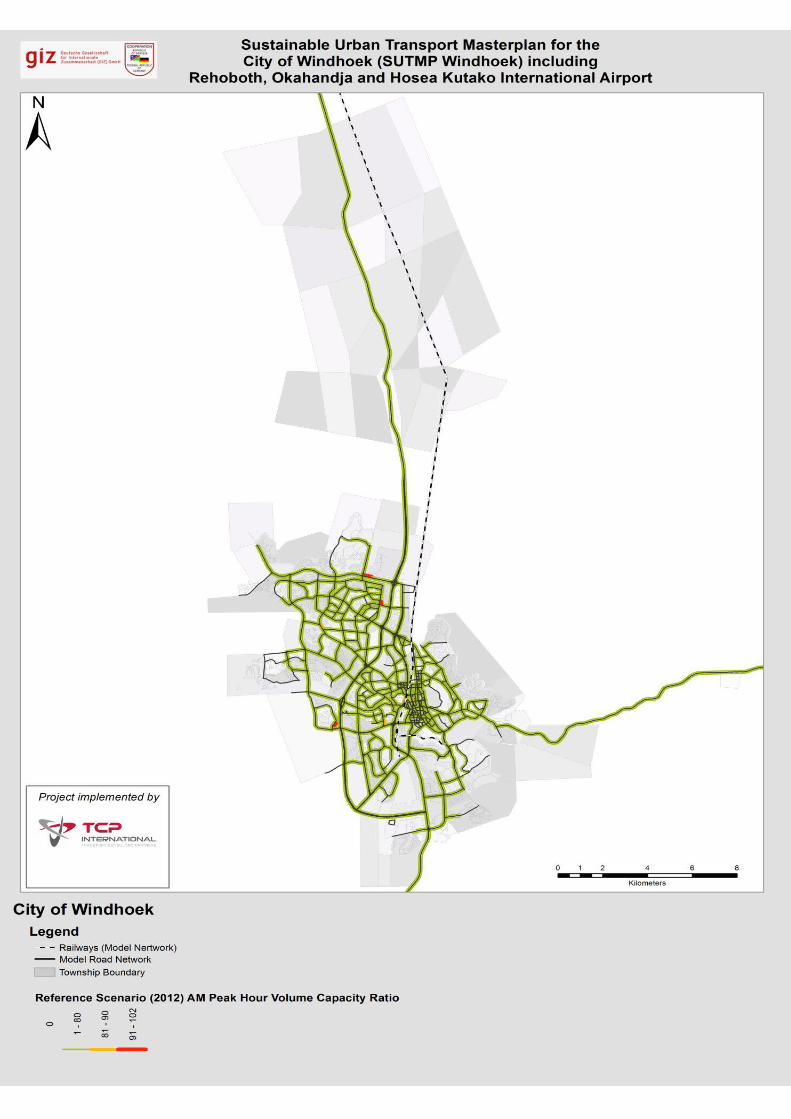
Map 8.2.Business as Usual Scenario(2032) AM Peak Hour Volume Capacity
Ratio
124
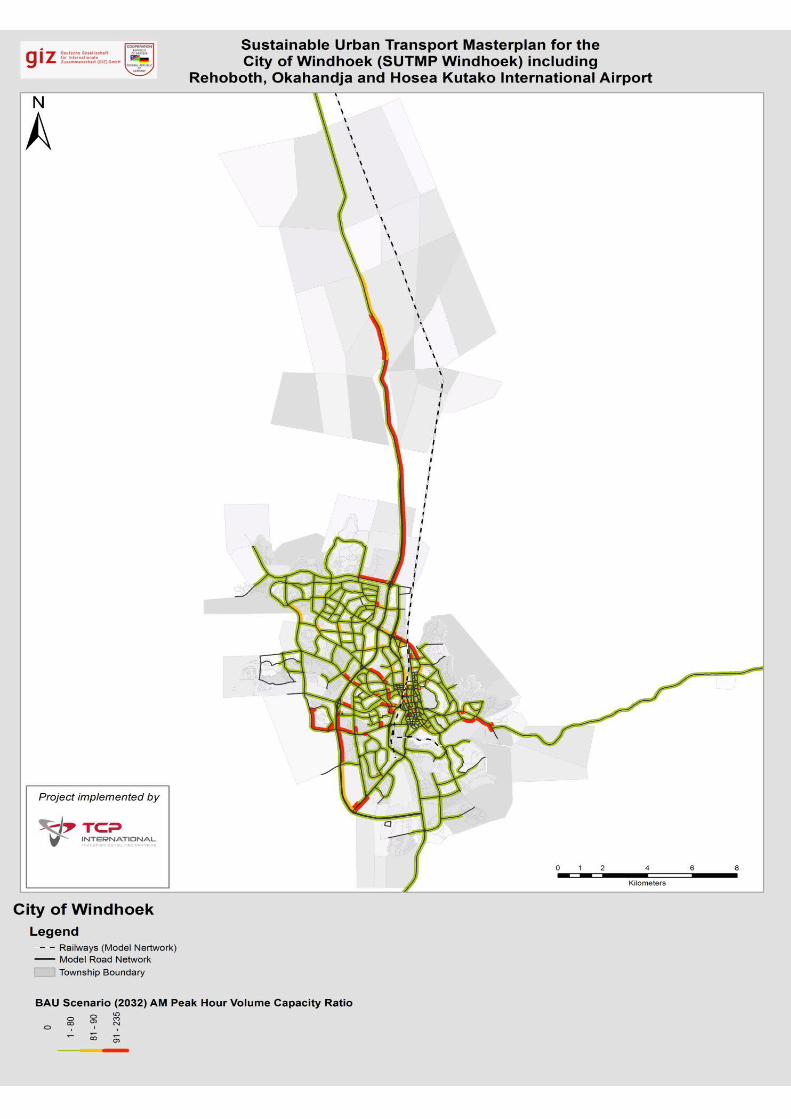
Map 8.3.Sustainable Transport Scenario(2032) AM Pak Volume Capacity Ratio
126
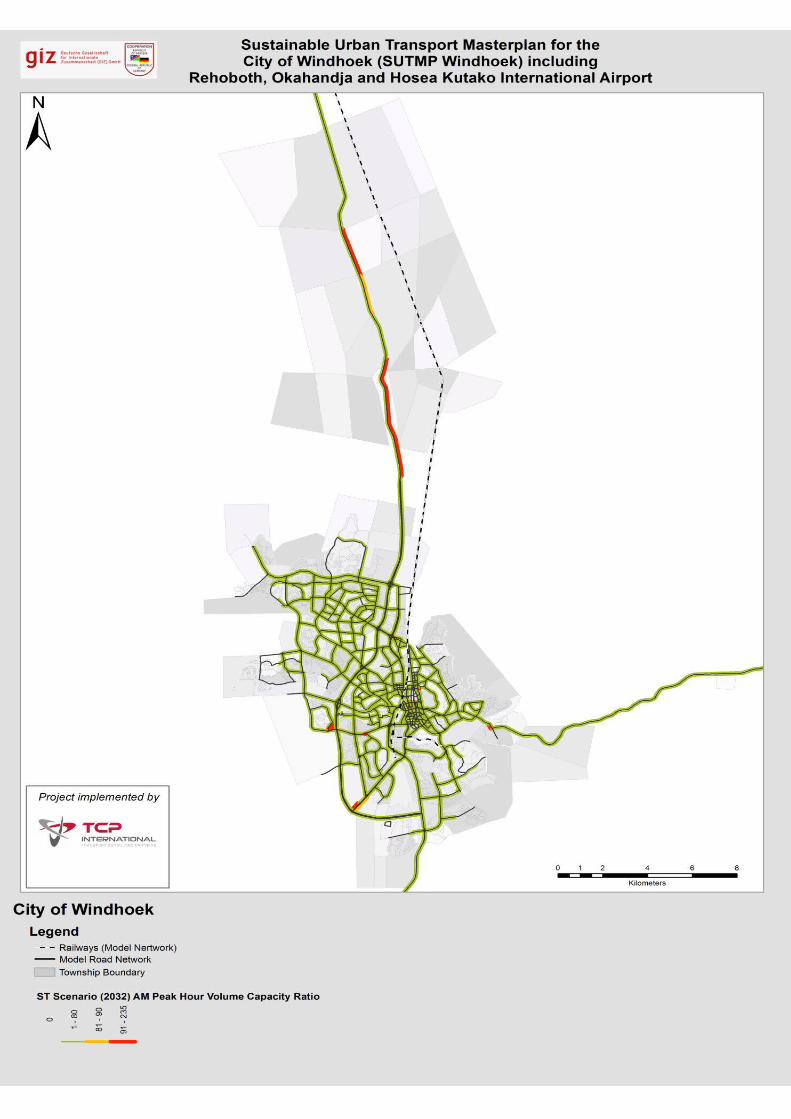

Map 9.1. Principal NMT network
128

RO
BE
RT M
UG
AB
E N
BN
ELS
ON
MA
ND
ELA
AVE
AB
RA
HA
M M
AS
HE
GO
WE
ST
ER
N B
YP
AS
S
FR
AN
KIE
FR
ED
ER
ICK
S S
T
WESTERN BYPASS
WE
ST
ER
N B
YP
AS
S
Windhoek
Katutura
Khomasdal
Goreangab
Okuryangava
Klein Windhoek
Pionierspark
Otjomuise
Auasblick
Kleine Kuppe
Olympia
Havana
Wanaheda
Hochland Park
Academia
Prosperita
Eros Park
Cimbebasia
Rocky Crest
Dorado Park
LafrenzHakahana
OT
JOM
UIS
E R
D
HO
SE
A K
UTA
KO
SB
MOSES GAROËB ST
MONTE CHRISTO RD
DAVID HOSEA MERORO
SAM NUJOMA DR
HO
SE
A K
UTA
KO
DR
BR
AK
WA
TE
R S
T
RO
BE
RT M
UG
AB
E SB
SAM NUJOMA EB
RO
BE
RT M
UG
AB
E N
B
MA
ND
UM
E N
DE
MU
FAY
O A
VE
MATSHIT
SHI ST
INDEPENDENCE EB
MICHELLE MCLEAN ST
FLORENCE NIGHTINGALE ST
HOSEA K
UTAKO
DR
SAM NUJOMA WB
City of Windhoek
±
0 1 2 3 40.5
Kilometers
Sustainable Urban Transport Masterplan for theCity of Windhoek (SUTMP Windhoek) including
Rehoboth, Okahandja and Hosea Kutako International Airport
Project implemented by
Legend
Railways
Residential, Local, Unknown RoadsFreeway, Primary, District Roads
Township Boundary
Principle NMT Network

Map 9.2. Principal NMT network andland uses
130
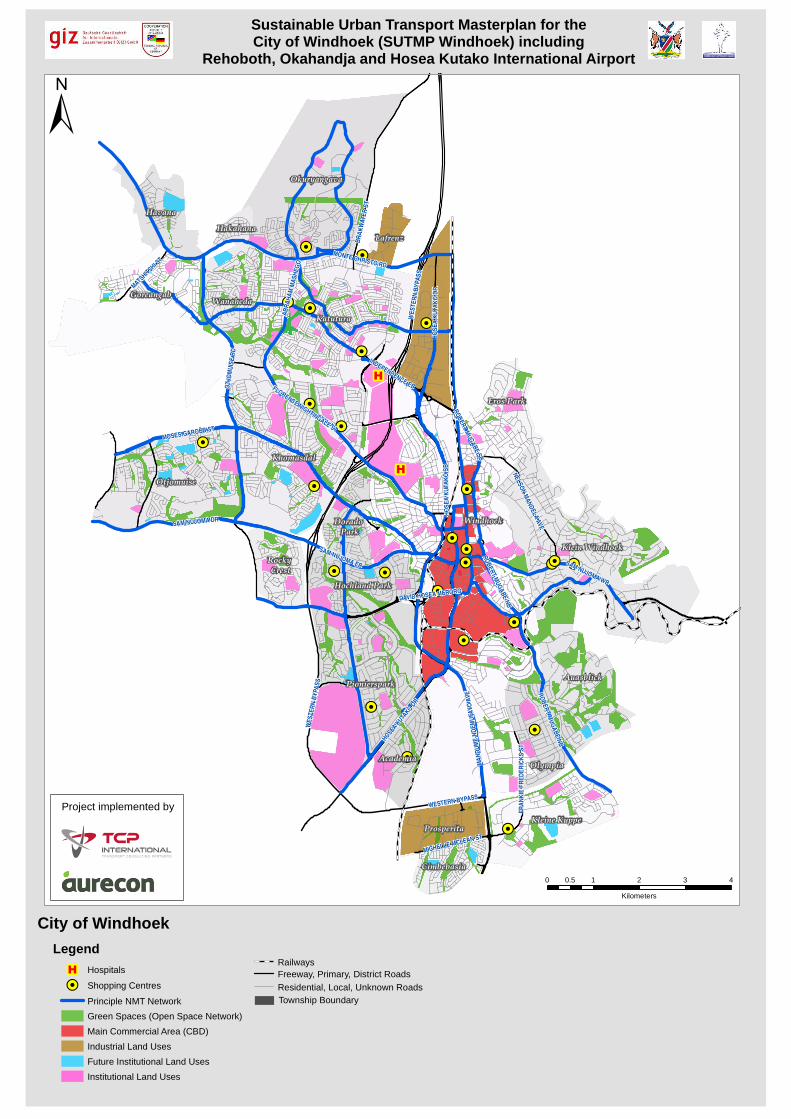
!H
!H
!H
!H
!H
!H
!H
!H
!H
!H!H
!H
!H
!H
!H
!H
!H!H
!H
!H
!H
!H!H
!H
!H
!H
H
H
RO
BE
RT M
UG
AB
E N
BN
ELS
ON
MA
ND
ELA
AVE
AB
RA
HA
M M
AS
HE
GO
WE
ST
ER
N B
YP
AS
S
FR
AN
KIE
FR
ED
ER
ICK
S S
T
WESTERN BYPASS
WE
ST
ER
N B
YP
AS
S
Windhoek
Katutura
Khomasdal
Goreangab
Okuryangava
Klein Windhoek
Pionierspark
Otjomuise
Auasblick
Kleine Kuppe
Olympia
Havana
Wanaheda
Hochland Park
Academia
Prosperita
Eros Park
Cimbebasia
Rocky Crest
Dorado Park
LafrenzHakahana
OT
JOM
UIS
E R
D
HO
SE
A K
UTA
KO
SB
MOSES GAROËB ST
MONTE CHRISTO RD
DAVID HOSEA MERORO
SAM NUJOMA DR
HO
SE
A K
UTA
KO
DR
BR
AK
WA
TE
R S
T
RO
BE
RT M
UG
AB
E SB
SAM NUJOMA EB
RO
BE
RT M
UG
AB
E N
B
MA
ND
UM
E N
DE
MU
FAY
O A
VE
MATSHIT
SHI ST
INDEPENDENCE EB
MICHELLE MCLEAN ST
FLORENCE NIGHTINGALE ST
HOSEA K
UTAKO
DR
SAM NUJOMA WB
City of Windhoek
±
0 1 2 3 40.5
Kilometers
Sustainable Urban Transport Masterplan for theCity of Windhoek (SUTMP Windhoek) including
Rehoboth, Okahandja and Hosea Kutako International Airport
Project implemented by
LegendRailways
Residential, Local, Unknown RoadsFreeway, Primary, District Roads
Township Boundary
H Hospitals
!H Shopping Centres
Principle NMT Network
Green Spaces (Open Space Network)
Main Commercial Area (CBD)
Industrial Land Uses
Future Institutional Land Uses
Institutional Land Uses

Map 9.3. Principal NMT Network andNMT Links
132

RO
BE
RT M
UG
AB
E N
BN
ELS
ON
MA
ND
ELA
AVE
AB
RA
HA
M M
AS
HE
GO
WE
ST
ER
N B
YP
AS
S
FR
AN
KIE
FR
ED
ER
ICK
S S
T
WESTERN BYPASS
WE
ST
ER
N B
YP
AS
S
Windhoek
Katutura
Khomasdal
Goreangab
Okuryangava
Klein Windhoek
Pionierspark
Otjomuise
Auasblick
Kleine Kuppe
Olympia
Havana
Wanaheda
Hochland Park
Academia
Prosperita
Eros Park
Cimbebasia
Rocky Crest
Dorado Park
LafrenzHakahana
OT
JOM
UIS
E R
D
HO
SE
A K
UTA
KO
SB
MOSES GAROËB ST
MONTE CHRISTO RD
DAVID HOSEA MERORO
SAM NUJOMA DR
HO
SE
A K
UTA
KO
DR
BR
AK
WA
TE
R S
T
RO
BE
RT M
UG
AB
E SB
SAM NUJOMA EB
RO
BE
RT M
UG
AB
E N
B
MA
ND
UM
E N
DE
MU
FAY
O A
VE
MATSHIT
SHI ST
INDEPENDENCE EB
MICHELLE MCLEAN ST
FLORENCE NIGHTINGALE ST
HOSEA K
UTAKO
DR
SAM NUJOMA WB
City of Windhoek
±
0 1 2 3 40.5
Kilometers
Sustainable Urban Transport Masterplan for theCity of Windhoek (SUTMP Windhoek) including
Rehoboth, Okahandja and Hosea Kutako International Airport
Project implemented by
Legend
Railways
Residential, Local, Unknown RoadsFreeway, Primary, District Roads
Township Boundary
Principle NMT NetworkPrinciple NMT Links

Map 9.4. Principal NMT Network, NMTLinks and land uses
134
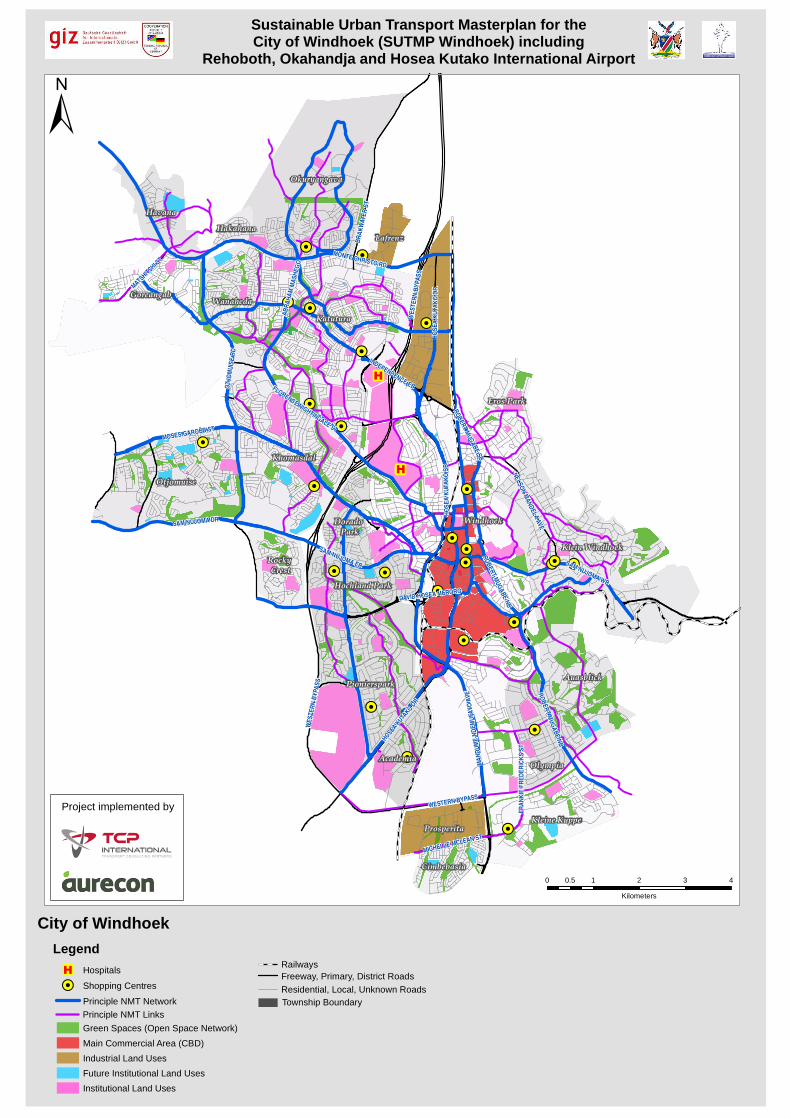
!H
!H
!H
!H
!H
!H
!H
!H
!H
!H!H
!H
!H
!H
!H
!H
!H!H
!H
!H
!H
!H!H
!H
!H
!H
H
H
RO
BE
RT M
UG
AB
E N
BN
ELS
ON
MA
ND
ELA
AVE
AB
RA
HA
M M
AS
HE
GO
WE
ST
ER
N B
YP
AS
S
FR
AN
KIE
FR
ED
ER
ICK
S S
T
WESTERN BYPASS
WE
ST
ER
N B
YP
AS
S
Windhoek
Katutura
Khomasdal
Goreangab
Okuryangava
Klein Windhoek
Pionierspark
Otjomuise
Auasblick
Kleine Kuppe
Olympia
Havana
Wanaheda
Hochland Park
Academia
Prosperita
Eros Park
Cimbebasia
Rocky Crest
Dorado Park
LafrenzHakahana
OT
JOM
UIS
E R
D
HO
SE
A K
UTA
KO
SB
MOSES GAROËB ST
MONTE CHRISTO RD
DAVID HOSEA MERORO
SAM NUJOMA DR
HO
SE
A K
UTA
KO
DR
BR
AK
WA
TE
R S
T
RO
BE
RT M
UG
AB
E SB
SAM NUJOMA EB
RO
BE
RT M
UG
AB
E N
B
MA
ND
UM
E N
DE
MU
FAY
O A
VE
MATSHIT
SHI ST
INDEPENDENCE EB
MICHELLE MCLEAN ST
FLORENCE NIGHTINGALE ST
HOSEA K
UTAKO
DR
SAM NUJOMA WB
City of Windhoek
±
0 1 2 3 40.5
Kilometers
Sustainable Urban Transport Masterplan for theCity of Windhoek (SUTMP Windhoek) including
Rehoboth, Okahandja and Hosea Kutako International Airport
Project implemented by
LegendRailways
Residential, Local, Unknown RoadsFreeway, Primary, District Roads
Township Boundary
H Hospitals
!H Shopping Centres
Principle NMT Network
Green Spaces (Open Space Network)
Main Commercial Area (CBD)
Industrial Land Uses
Future Institutional Land Uses
Institutional Land Uses
Principle NMT Links

Map 9.5. Pre-Primary School (500mbuffer)
136
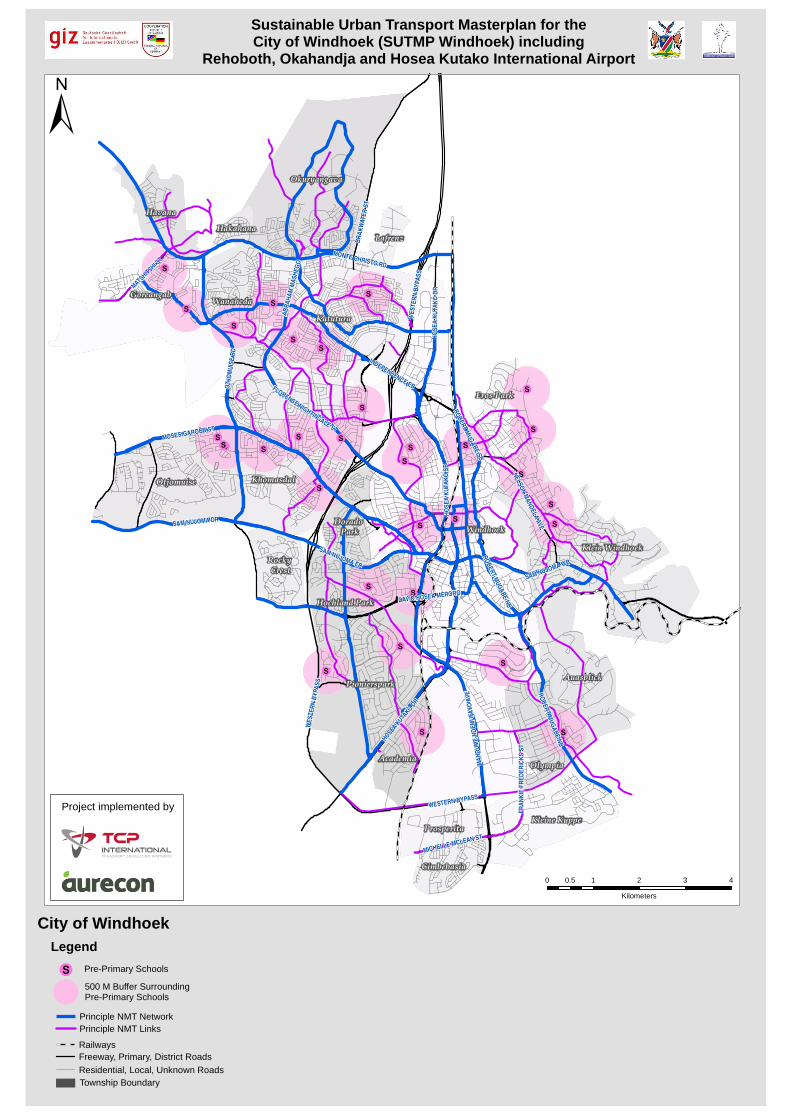
!S
!S
!S
!S
!S
!S
!S
!S
!S
!S!S
!S
!S
!S!S!S
!S
!S
!S
!S
!S!S
!S
!S
!S
!S
!S
!S
!S !S!S!S
RO
BE
RT M
UG
AB
E N
BN
ELS
ON
MA
ND
ELA
AVE
AB
RA
HA
M M
AS
HE
GO
WE
ST
ER
N B
YP
AS
S
FR
AN
KIE
FR
ED
ER
ICK
S S
T
WESTERN BYPASS
WE
ST
ER
N B
YP
AS
S
Windhoek
Katutura
Khomasdal
Goreangab
Okuryangava
Klein Windhoek
Pionierspark
Otjomuise
Auasblick
Kleine Kuppe
Olympia
Havana
Wanaheda
Hochland Park
Academia
Prosperita
Eros Park
Cimbebasia
Rocky Crest
Dorado Park
LafrenzHakahana
OT
JOM
UIS
E R
D
HO
SE
A K
UTA
KO
SB
MOSES GAROËB ST
MONTE CHRISTO RD
DAVID HOSEA MERORO
SAM NUJOMA DR
HO
SE
A K
UTA
KO
DR
BR
AK
WA
TE
R S
T
RO
BE
RT M
UG
AB
E SB
SAM NUJOMA EB
RO
BE
RT M
UG
AB
E N
B
MA
ND
UM
E N
DE
MU
FAY
O A
VE
MATSHIT
SHI ST
INDEPENDENCE EB
MICHELLE MCLEAN ST
FLORENCE NIGHTINGALE ST
HOSEA K
UTAKO
DR
SAM NUJOMA WB
City of Windhoek
±
0 1 2 3 40.5
Kilometers
Sustainable Urban Transport Masterplan for theCity of Windhoek (SUTMP Windhoek) including
Rehoboth, Okahandja and Hosea Kutako International Airport
Project implemented by
Legend
Railways
Residential, Local, Unknown RoadsFreeway, Primary, District Roads
Township Boundary
Pre-Primary Schools
500 M Buffer Surrounding Pre-Primary Schools!
!S
Principle NMT NetworkPrinciple NMT Links

Map 9.6. Primary Schools (1 km buffer)
138

!S
!S!S
!S
!S
!S
!S
!S
!S
!S
!S
!S
!S
!S
!S
!S
!S
!S
!S
!S
!S
!S
!S
!S
!S
!S
!SR
OB
ER
T MU
GA
BE
NB
NE
LSO
N M
AN
DE
LA AV
E
AB
RA
HA
M M
AS
HE
GO
WE
ST
ER
N B
YP
AS
S
FR
AN
KIE
FR
ED
ER
ICK
S S
T
WESTERN BYPASS
WE
ST
ER
N B
YP
AS
S
Windhoek
Katutura
Khomasdal
Goreangab
Okuryangava
Klein Windhoek
Pionierspark
Otjomuise
Auasblick
Kleine Kuppe
Olympia
Havana
Wanaheda
Hochland Park
Academia
Prosperita
Eros Park
Cimbebasia
Rocky Crest
Dorado Park
LafrenzHakahana
OT
JOM
UIS
E R
D
HO
SE
A K
UTA
KO
SB
MOSES GAROËB ST
MONTE CHRISTO RD
DAVID HOSEA MERORO
SAM NUJOMA DR
HO
SE
A K
UTA
KO
DR
BR
AK
WA
TE
R S
T
RO
BE
RT M
UG
AB
E SB
SAM NUJOMA EB
RO
BE
RT M
UG
AB
E N
B
MA
ND
UM
E N
DE
MU
FAY
O A
VE
MATSHIT
SHI ST
INDEPENDENCE EB
MICHELLE MCLEAN ST
FLORENCE NIGHTINGALE ST
HOSEA K
UTAKO
DR
SAM NUJOMA WB
City of Windhoek
±
0 1 2 3 40.5
Kilometers
Sustainable Urban Transport Masterplan for theCity of Windhoek (SUTMP Windhoek) including
Rehoboth, Okahandja and Hosea Kutako International Airport
Project implemented by
LegendPrimary Schools
1 KM Buffer Surrounding Primary Schools!
!S
Railways
Residential, Local, Unknown Roads
Freeway, Primary, District Roads
Township Boundary
Principle NMT NetworkPrinciple NMT Links

Map 9.7. Secondary Schools (2km buffer)
140

!S
!S
!S
!S
!S
!S
!S
!S
!S
!S
!S!S
!S
!S
!S
!S
!S
!S
!S
!S
RO
BE
RT M
UG
AB
E N
BN
ELS
ON
MA
ND
ELA
AVE
AB
RA
HA
M M
AS
HE
GO
WE
ST
ER
N B
YP
AS
S
FR
AN
KIE
FR
ED
ER
ICK
S S
T
WESTERN BYPASS
WE
ST
ER
N B
YP
AS
S
Windhoek
Katutura
Khomasdal
Goreangab
Okuryangava
Klein Windhoek
Pionierspark
Otjomuise
Auasblick
Kleine Kuppe
Olympia
Havana
Wanaheda
Hochland Park
Academia
Prosperita
Eros Park
Cimbebasia
Rocky Crest
Dorado Park
LafrenzHakahana
OT
JOM
UIS
E R
D
HO
SE
A K
UTA
KO
SB
MOSES GAROËB ST
MONTE CHRISTO RD
DAVID HOSEA MERORO
SAM NUJOMA DR
HO
SE
A K
UTA
KO
DR
BR
AK
WA
TE
R S
T
RO
BE
RT M
UG
AB
E SB
SAM NUJOMA EB
RO
BE
RT M
UG
AB
E N
B
MA
ND
UM
E N
DE
MU
FAY
O A
VE
MATSHIT
SHI ST
INDEPENDENCE EB
MICHELLE MCLEAN ST
FLORENCE NIGHTINGALE ST
HOSEA K
UTAKO
DR
SAM NUJOMA WB
City of Windhoek
±
0 1 2 3 40.5
Kilometers
Sustainable Urban Transport Masterplan for theCity of Windhoek (SUTMP Windhoek) including
Rehoboth, Okahandja and Hosea Kutako International Airport
Project implemented by
LegendSecondary Schools
2 KM Buffer Surrounding Secondary Schools!
!S
Railways
Residential, Local, Unknown RoadsFreeway, Primary, District Roads
Township Boundary
Principle NMT NetworkPrinciple NMT Links

Map 9.8. Tertiary Institution (5kmbuffer)
142

0
0
0
0
0
0
RO
BE
RT M
UG
AB
E N
BN
ELS
ON
MA
ND
ELA
AVE
AB
RA
HA
M M
AS
HE
GO
WE
ST
ER
N B
YP
AS
S
FR
AN
KIE
FR
ED
ER
ICK
S S
T
WESTERN BYPASS
WE
ST
ER
N B
YP
AS
S
Windhoek
Katutura
Khomasdal
Goreangab
Okuryangava
Klein Windhoek
Pionierspark
Otjomuise
Auasblick
Kleine Kuppe
Olympia
Havana
Wanaheda
Hochland Park
Academia
Prosperita
Eros Park
Cimbebasia
Rocky Crest
Dorado Park
LafrenzHakahana
OT
JOM
UIS
E R
D
HO
SE
A K
UTA
KO
SB
MOSES GAROËB ST
MONTE CHRISTO RD
DAVID HOSEA MERORO
SAM NUJOMA DR
HO
SE
A K
UTA
KO
DR
BR
AK
WA
TE
R S
T
RO
BE
RT M
UG
AB
E SB
SAM NUJOMA EB
RO
BE
RT M
UG
AB
E N
B
MA
ND
UM
E N
DE
MU
FAY
O A
VE
MATSHIT
SHI ST
INDEPENDENCE EB
MICHELLE MCLEAN ST
FLORENCE NIGHTINGALE ST
HOSEA K
UTAKO
DR
SAM NUJOMA WB
City of Windhoek
±
0 1 2 3 40.5
Kilometers
Sustainable Urban Transport Masterplan for theCity of Windhoek (SUTMP Windhoek) including
Rehoboth, Okahandja and Hosea Kutako International Airport
Project implemented by
LegendTertiary Institutions
5 KM Buffer Surrounding Tertiary Institutions!
.
Railways
Residential, Local, Unknown Roads
Freeway, Primary, District Roads
Township Boundary
Principle NMT NetworkPrinciple NMT Links

Map 9.9. Speciality Institutions (500 mbuffer)
144
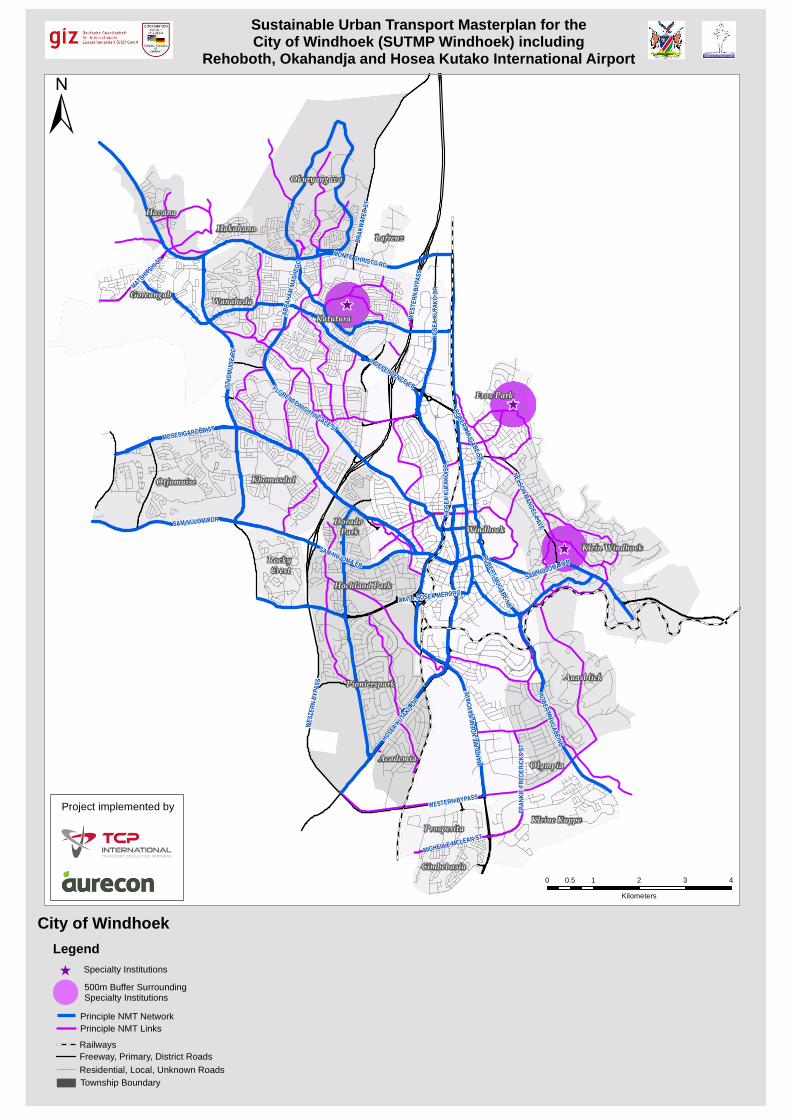
[
[
[R
OB
ER
T MU
GA
BE
NB
NE
LSO
N M
AN
DE
LA AV
E
AB
RA
HA
M M
AS
HE
GO
WE
ST
ER
N B
YP
AS
S
FR
AN
KIE
FR
ED
ER
ICK
S S
T
WESTERN BYPASS
WE
ST
ER
N B
YP
AS
S
Windhoek
Katutura
Khomasdal
Goreangab
Okuryangava
Klein Windhoek
Pionierspark
Otjomuise
Auasblick
Kleine Kuppe
Olympia
Havana
Wanaheda
Hochland Park
Academia
Prosperita
Eros Park
Cimbebasia
Rocky Crest
Dorado Park
LafrenzHakahana
OT
JOM
UIS
E R
D
HO
SE
A K
UTA
KO
SB
MOSES GAROËB ST
MONTE CHRISTO RD
DAVID HOSEA MERORO
SAM NUJOMA DR
HO
SE
A K
UTA
KO
DR
BR
AK
WA
TE
R S
T
RO
BE
RT M
UG
AB
E SB
SAM NUJOMA EB
RO
BE
RT M
UG
AB
E N
B
MA
ND
UM
E N
DE
MU
FAY
O A
VE
MATSHIT
SHI ST
INDEPENDENCE EB
MICHELLE MCLEAN ST
FLORENCE NIGHTINGALE ST
HOSEA K
UTAKO
DR
SAM NUJOMA WB
City of Windhoek
±
0 1 2 3 40.5
Kilometers
Sustainable Urban Transport Masterplan for theCity of Windhoek (SUTMP Windhoek) including
Rehoboth, Okahandja and Hosea Kutako International Airport
Project implemented by
LegendSpecialty Institutions
500m Buffer Surrounding Specialty Institutions!
[
Railways
Residential, Local, Unknown Roads
Freeway, Primary, District Roads
Township Boundary
Principle NMT NetworkPrinciple NMT Links

Map 9.10. Other Training Institution’s (1km buffer)
146
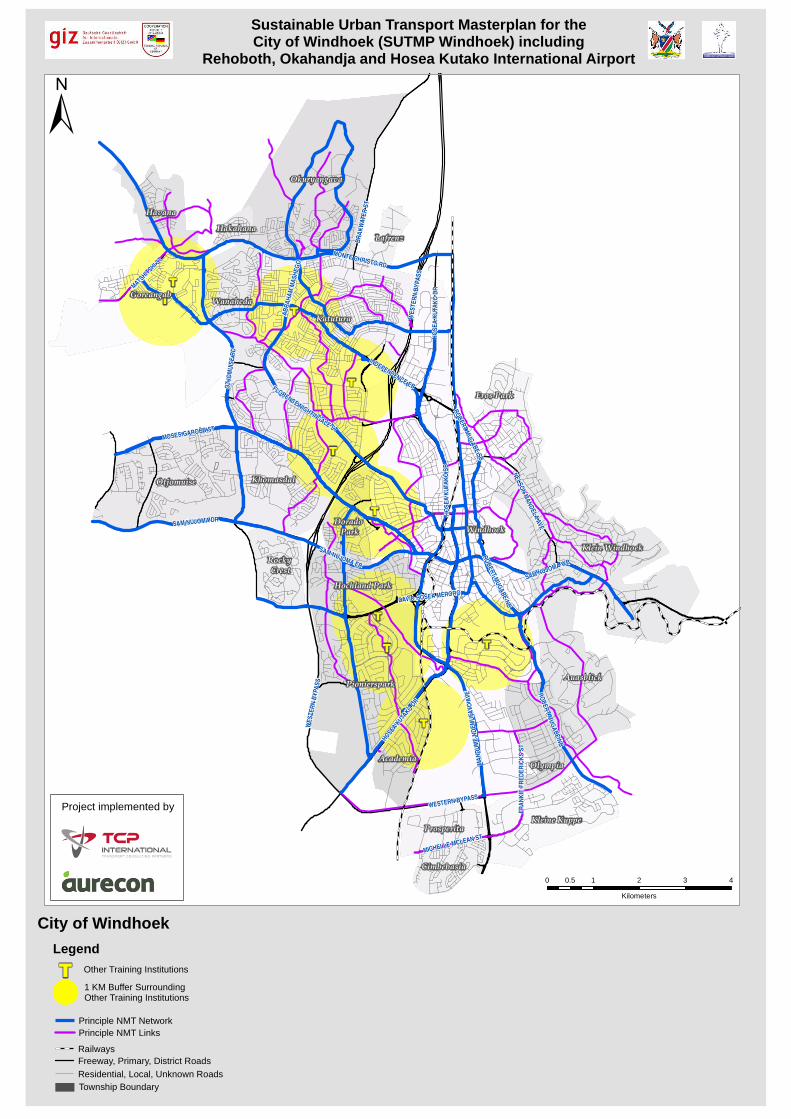
T
T
T
T
T
T
T
T
T
T
RO
BE
RT M
UG
AB
E N
BN
ELS
ON
MA
ND
ELA
AVE
AB
RA
HA
M M
AS
HE
GO
WE
ST
ER
N B
YP
AS
S
FR
AN
KIE
FR
ED
ER
ICK
S S
T
WESTERN BYPASS
WE
ST
ER
N B
YP
AS
S
Windhoek
Katutura
Khomasdal
Goreangab
Okuryangava
Klein Windhoek
Pionierspark
Otjomuise
Auasblick
Kleine Kuppe
Olympia
Havana
Wanaheda
Hochland Park
Academia
Prosperita
Eros Park
Cimbebasia
Rocky Crest
Dorado Park
LafrenzHakahana
OT
JOM
UIS
E R
D
HO
SE
A K
UTA
KO
SB
MOSES GAROËB ST
MONTE CHRISTO RD
DAVID HOSEA MERORO
SAM NUJOMA DR
HO
SE
A K
UTA
KO
DR
BR
AK
WA
TE
R S
T
RO
BE
RT M
UG
AB
E SB
SAM NUJOMA EB
RO
BE
RT M
UG
AB
E N
B
MA
ND
UM
E N
DE
MU
FAY
O A
VE
MATSHIT
SHI ST
INDEPENDENCE EB
MICHELLE MCLEAN ST
FLORENCE NIGHTINGALE ST
HOSEA K
UTAKO
DR
SAM NUJOMA WB
City of Windhoek
±
0 1 2 3 40.5
Kilometers
Sustainable Urban Transport Masterplan for theCity of Windhoek (SUTMP Windhoek) including
Rehoboth, Okahandja and Hosea Kutako International Airport
Project implemented by
LegendOther Training Institutions
1 KM Buffer Surrounding Other Training Institutions!
T
Railways
Residential, Local, Unknown RoadsFreeway, Primary, District Roads
Township Boundary
Principle NMT NetworkPrinciple NMT Links

Map 9.11. Hospital and Clinics (8km and3km buffer respectively)
148

�q
�q
�q
�q
�qG
G
G
Windhoek
Katutura
Khomasdal
Goreangab
Okuryangava
Klein Windhoek
Pionierspark
Otjomuise
Auasblick
Kleine Kuppe
Olympia
Havana
Wanaheda
Hochland Park
Academia
Prosperita
Eros Park
Cimbebasia
Rocky Crest
Dorado Park
LafrenzHakahana
City of Windhoek
±
0 1 2 3 40.5
Kilometers
Sustainable Urban Transport Masterplan for theCity of Windhoek (SUTMP Windhoek) including
Rehoboth, Okahandja and Hosea Kutako International Airport
Project implemented by
Legend
G
q
!
!
Clinics
Hospitals
3 KM Buffer Surrounding Clinics
8 KM Buffer Surrounding Hospitals
Railways
Residential, Local, Unknown RoadsFreeway, Primary, District Roads
Township Boundary
Principle NMT NetworkPrinciple NMT Links

Map 9.12. Regional and Local ShoppingCentres (5km and 1km buffer
respectively)
150
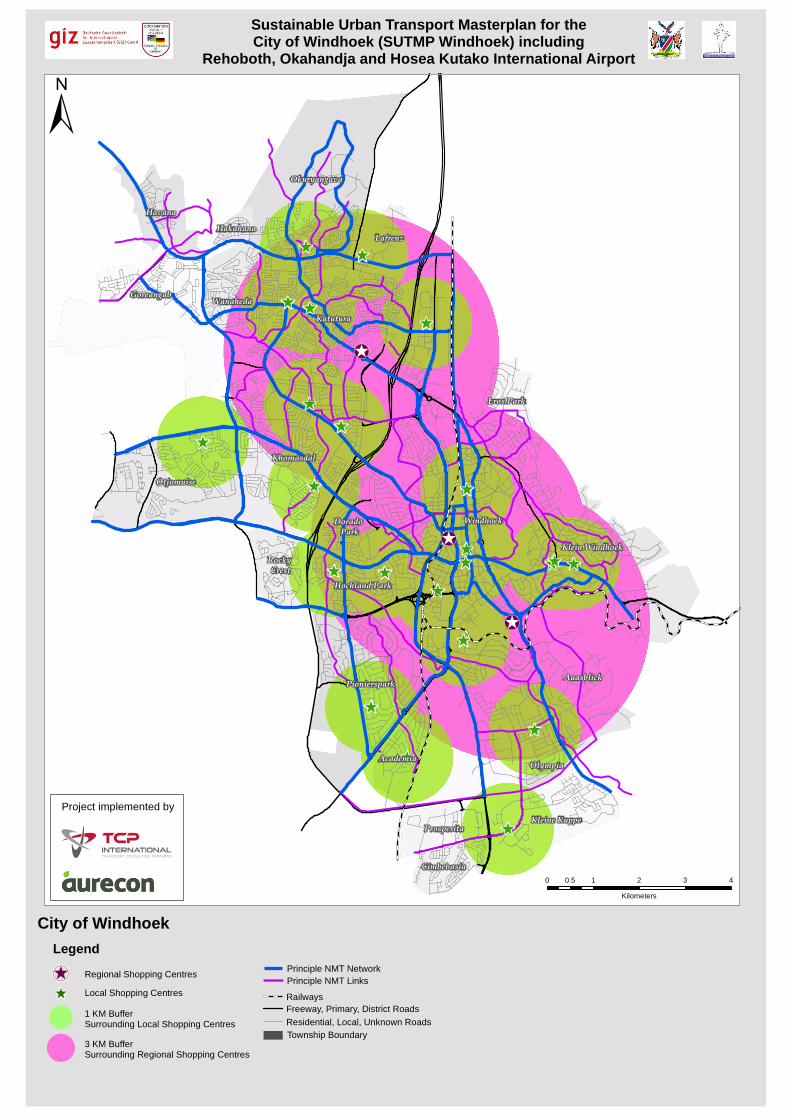
[
[
[
[
[
[
[
[
[
[[
[
[
[
[[
[[
[[
[
[
[
!\
!\
!\
Windhoek
Katutura
Khomasdal
Goreangab
Okuryangava
Klein Windhoek
Pionierspark
Otjomuise
Auasblick
Kleine Kuppe
Olympia
Havana
Wanaheda
Hochland Park
Academia
Prosperita
Eros Park
Cimbebasia
Rocky Crest
Dorado Park
LafrenzHakahana
City of Windhoek
±
0 1 2 3 40.5
Kilometers
Sustainable Urban Transport Masterplan for theCity of Windhoek (SUTMP Windhoek) including
Rehoboth, Okahandja and Hosea Kutako International Airport
Project implemented by
Legend
\
[
!
!
Regional Shopping Centres
Local Shopping Centres
1 KM Buffer Surrounding Local Shopping Centres
3 KM Buffer Surrounding Regional Shopping Centres
Railways
Residential, Local, Unknown RoadsFreeway, Primary, District Roads
Township Boundary
Principle NMT NetworkPrinciple NMT Links

Map 9.13. NMT principal and linknetwork coverage of existing bus stops
and taxi ranks
152
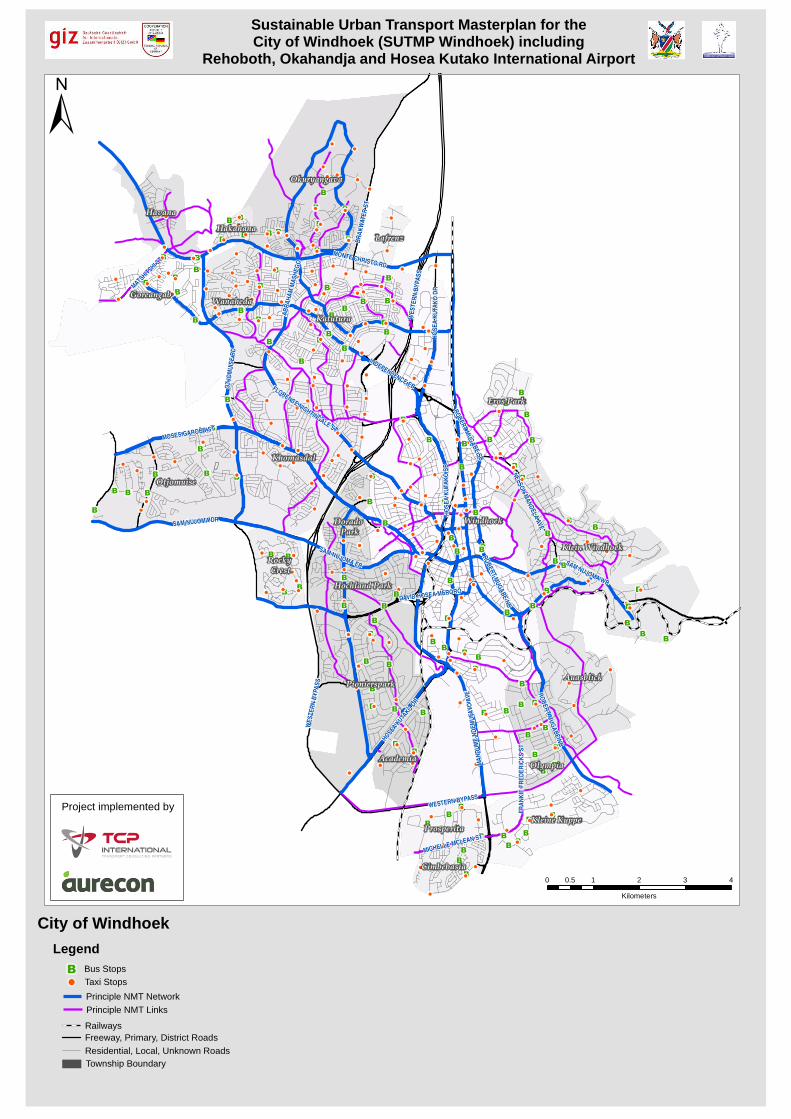
B!!!!
!!!!
!!
B!!
B!!
B
!!!!B
B!!!!
B!!
!!
!!B!!
!! B!!B
!!
!!
B!!B!! !!
!!BBB!!
B!!B
!!
B!! !!
!!
B!!
B !!
B!!
BB!!
!!!! B
!!
B!!B !!B
!!
B!!
!!B!!
B!!
!!B
!!!! BBB!!
!!
!!
!!
B!!
!!!!
BB
B!! !!!!
!!
!!
B!!!!B
!!
!!!!
B!!
!!
B!!
!!B!!
!!B
BB
!!
B!!
!!!!
!!
!!
B
!!
B
B
B
B!!!!
!!!!
!!B!!!!B
!!B
B!!
!!
B
!!
!!
B
!!B!!B
!!
!!
!!
!!
!!!!
!!
B!!
!!
B!!
!!
!!
B
B!!
!!
!!B
!!
!!
!!
!!
!!
!!B!!
B
B
!!
!!
!!
!!
!!!!
!! !!B!!B
!!
B!!!!
!!
!!!!
B!!!! !!
!!
!!
!!B
!! !! !!B B
!!
!!
B!!
!!B!!
!!
!!
!!!!B B
B!!
!!B
!!
!!B
!!
!!B
!!
!!
!!
!!B
!!
!!B
!!B
!! !!!!
!!
!!!!!!
!!
!!
!!
!!
!!!!
!!
!!
!!
!!
!!
B!!
!!!!
!!
!!
!!
B!!
!!!!
!! !!!!B
!!
!!
!!
!!!!
!!
!!B
!!
!!B
!!
B!!
B!!!!
!!B
!!
!!!!
!!!!
!!!!
B!!
B
!!B!!!!B !!
!!B
!!
!!B
!!
!!
!!
!!B
!!
!B
!!
!!
!!B
!!
!!
!!B
!!
!!B
!!B
B
!!
!
!!
!!
!!
B!!B
!!
B!!B!!
!!
!!
!!
!!
!!!!B
!!
!!
!!
!!!!
!!B!!
!!
!!
!!
!!
!!
B!!
!!!
!!!!
B!!
!!
!!
!!
!!
!!
B
B
!!
B
B!!
!!
!
!!!!
!!B
!!
!!
!!
!!
!!
!!
!!
!!
!!B
B!!
!!
B!!
!!
!!
!!
!!B!!
B!!
B
!!
!!
!!
!!
!!
!!!!!!
!!
B
B!!
!!
B!!
B!!
!!
RO
BE
RT M
UG
AB
E N
BN
ELS
ON
MA
ND
ELA
AVE
AB
RA
HA
M M
AS
HE
GO
WE
ST
ER
N B
YP
AS
S
FR
AN
KIE
FR
ED
ER
ICK
S S
T
WESTERN BYPASS
WE
ST
ER
N B
YP
AS
S
Windhoek
Katutura
Khomasdal
Goreangab
Okuryangava
Klein Windhoek
Pionierspark
Otjomuise
Auasblick
Kleine Kuppe
Olympia
Havana
Wanaheda
Hochland Park
Academia
Prosperita
Eros Park
Cimbebasia
Rocky Crest
Dorado Park
LafrenzHakahana
OT
JOM
UIS
E R
D
HO
SE
A K
UTA
KO
SB
MOSES GAROËB ST
MONTE CHRISTO RD
DAVID HOSEA MERORO
SAM NUJOMA DR
HO
SE
A K
UTA
KO
DR
BR
AK
WA
TE
R S
T
RO
BE
RT M
UG
AB
E SB
SAM NUJOMA EB
RO
BE
RT M
UG
AB
E N
B
MA
ND
UM
E N
DE
MU
FAY
O A
VE
MATSHIT
SHI ST
INDEPENDENCE EB
MICHELLE MCLEAN ST
FLORENCE NIGHTINGALE ST
HOSEA K
UTAKO
DR
SAM NUJOMA WB
City of Windhoek
±
0 1 2 3 40.5
Kilometers
Sustainable Urban Transport Masterplan for theCity of Windhoek (SUTMP Windhoek) including
Rehoboth, Okahandja and Hosea Kutako International Airport
Project implemented by
Legend
Railways
Residential, Local, Unknown RoadsFreeway, Primary, District Roads
Township Boundary
Bus StopsTaxi Stops!
B
Principle NMT Network
Principle NMT Links

Map 9.14. NMT principal and linknetwork coverage of shopping centres
154

!H
!H
!H
!H
!H
!H
!H
!H
!H
!H!H
!H
!H
!H
!H
!H
!H!H
!H
!H
!H
!H!H
!H
!H
!H
RO
BE
RT M
UG
AB
E N
BN
ELS
ON
MA
ND
ELA
AVE
AB
RA
HA
M M
AS
HE
GO
WE
ST
ER
N B
YP
AS
S
FR
AN
KIE
FR
ED
ER
ICK
S S
T
WESTERN BYPASS
WE
ST
ER
N B
YP
AS
S
Windhoek
Katutura
Khomasdal
Goreangab
Okuryangava
Klein Windhoek
Pionierspark
Otjomuise
Auasblick
Kleine Kuppe
Olympia
Havana
Wanaheda
Hochland Park
Academia
Prosperita
Eros Park
Cimbebasia
Rocky Crest
Dorado Park
LafrenzHakahana
OT
JOM
UIS
E R
D
HO
SE
A K
UTA
KO
SB
MOSES GAROËB ST
MONTE CHRISTO RD
DAVID HOSEA MERORO
SAM NUJOMA DR
HO
SE
A K
UTA
KO
DR
BR
AK
WA
TE
R S
T
RO
BE
RT M
UG
AB
E SB
SAM NUJOMA EB
RO
BE
RT M
UG
AB
E N
B
MA
ND
UM
E N
DE
MU
FAY
O A
VE
MATSHIT
SHI ST
INDEPENDENCE EB
MICHELLE MCLEAN ST
FLORENCE NIGHTINGALE ST
HOSEA K
UTAKO
DR
SAM NUJOMA WB
City of Windhoek
±
0 1 2 3 40.5
Kilometers
Sustainable Urban Transport Masterplan for theCity of Windhoek (SUTMP Windhoek) including
Rehoboth, Okahandja and Hosea Kutako International Airport
Project implemented by
Legend
Railways
Residential, Local, Unknown RoadsFreeway, Primary, District Roads
Township Boundary
!H Shopping Centres
Principle NMT NetworkPrinciple NMT Links

Annex E
Strategic Options

07.11.2012 Seite 1
Preparatory Meeting for the Strategic Decision Making Workshop
Sustainable Urban Transport Master Plan
Introductory Note by Angelika Zwicky
5th of November 2012

07.11.2012 Seite 2 Page 2 07.11.2012
Quotations: “Within the next 13 – 18 years urban growth will fill the Windhoek Basin. Thereafter,
i.e. from about 2010 – 2015, the bulk of growth will take place outside the basin…”
“….Opportunities for public transport should be designed into the developing structure of the
City…..”
Traffic will be more widely distributed requiring a good road and public transport system that is
able to reach a larger area. Many out of the population do not have or cannot afford their own
vehicle. Public transport in one form or another is expected to grow in importance.
“…result in a high frequency of busses along the most important areas of job opportunities and
trade and, with only one change of bus, could make all areas of the City reasonably accessible.
The road pattern of the City will support such a service, but must be built upon to ensure public
transport can operate without being clogged by congestion….”
“...Public transport, cycling and walking can be encouraged in place of car use…”
Already in 1996, the Windhoek Structure Plan stated the
necessity for an efficient Public Transport System and
non-motorised Transport latest from 2010 onwards.
And here we are, its high time to decide upon and
implement it.
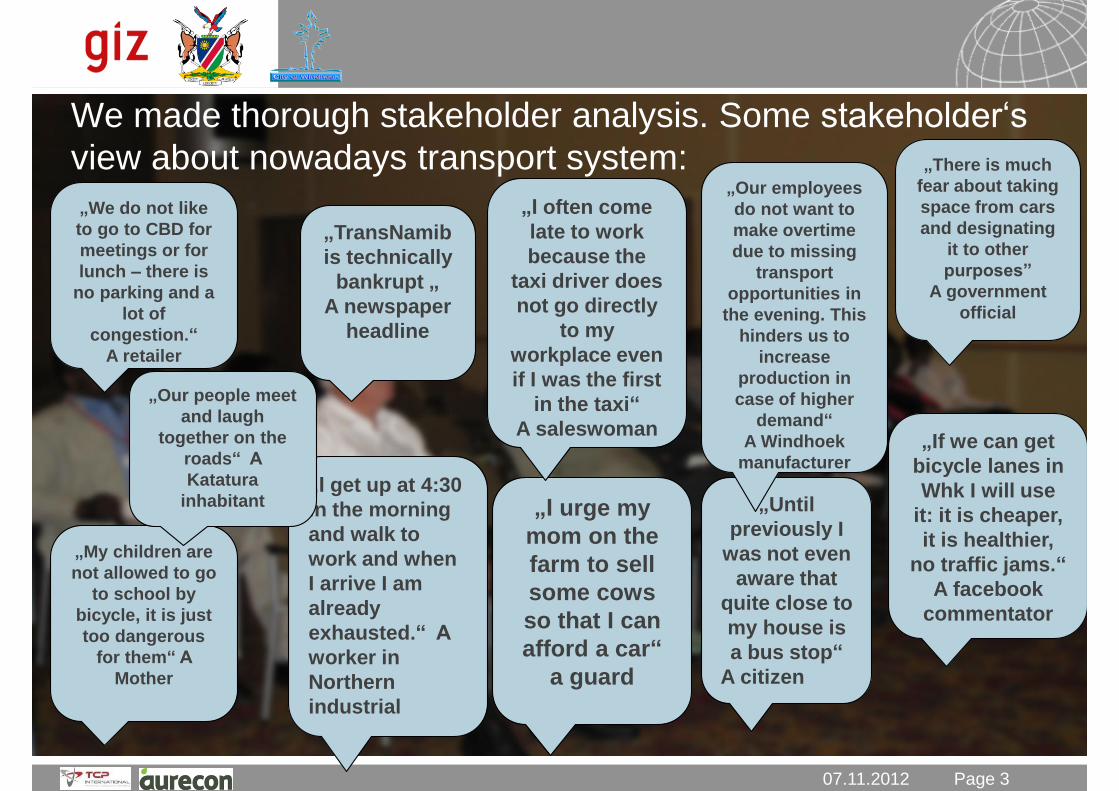
07.11.2012 Seite 3 Page 3
We made thorough stakeholder analysis. Some stakeholder‘s
view about nowadays transport system:
07.11.2012
„I get up at 4:30
in the morning
and walk to
work and when
I arrive I am
already
exhausted.“ A
worker in
Northern
industrial
„My children are
not allowed to go
to school by
bicycle, it is just
too dangerous
for them“ A
Mother
„TransNamib
is technically
bankrupt „
A newspaper
headline
„Until
previously I
was not even
aware that
quite close to
my house is
a bus stop“
A citizen
„If we can get
bicycle lanes in
Whk I will use
it: it is cheaper,
it is healthier,
no traffic jams.“
A facebook
commentator
„There is much
fear about taking
space from cars
and designating
it to other
purposes”
A government
official
„I urge my
mom on the
farm to sell
some cows
so that I can
afford a car“
a guard
„We do not like
to go to CBD for
meetings or for
lunch – there is
no parking and a
lot of
congestion.“
A retailer
„I often come
late to work
because the
taxi driver does
not go directly
to my
workplace even
if I was the first
in the taxi“
A saleswoman
„Our employees
do not want to
make overtime
due to missing
transport
opportunities in
the evening. This
hinders us to
increase
production in
case of higher
demand“
A Windhoek
manufacturer
„Our people meet
and laugh
together on the
roads“ A
Katatura
inhabitant

07.11.2012 Seite 4 Page 4
Transport is a means to an end (derived demand)
07.11.2012
Over-provision is as bad as inadaquate provision
If the population grows, if the economy grows, transport
supply needs to grow
Or vice versa: if mobility needs and demands are not
satisfied, the economy can not prosper and people are
socially isolated and excluded.

07.11.2012 Seite 5 Page 5
It is up to your dedication how this City is developing
07.11.2012
car dependent with good mobility
opportunities for the minority
revitalised, attractive urban spaces offering mobility to the
majority

07.11.2012 Seite 6 Page 6
SUTMP
Study Area
07.11.2012

07.11.2012 Seite 7 Page 7
SUTMP Windhoek Project - Objectives
“Structured sustainable urban transport master plan, allowing decision makers to develop
affordable, accessible, attractive and efficient public transport and non-motorised transport
system, including implementation strategies and actions, benchmarked with world-wide urban
transport systems.”
07.11.2012
State-of-the-art transport master plan
Modal split shift &
participation

07.11.2012 Seite 8 Page 8 07.11.2012
Stakeholder Engagement and Public Hearings
Creating the enabling institutional and legal and financial framework
Capacity Building
Accompanying transport management measures
SUTMP
Pre-/ Feasibi-
lity Studies for PT
and NMT
Design Ten-
dering
Execu-tion
drawings
Civil works
and systems
Trial runs and accep-tance
testing
Opera-tion,
mainte-nance and
network exten-sion
The SUTMP will give the overall picture, but it is just the beginning of a long
way towards more sustainable transportation in the study area

07.11.2012 Seite 9 Page 9 07.11.2012
The next two days we will hear, discuss and decide upon
WS 5 - Institutional, Legal and Financial Implications and Options
WS 4 - Transport Management and Road Safety Options
WS 3 - Non-motorised Transport Options
WS 2 - Public Transport Options
WS 1 - Existing traffic situation and land-use planning
07.11.2012 Seite 10 Page 10 07.11.2012
Developing
Strategic
Directions
Part 1

07.11.2012 Seite 11 Page 11 07.11.2012
Developing
Strategic
Directions
Part 2

07.11.2012 Seite 12 Page 12 07.11.2012
Developing
Strategic
Directions
Part 3

07.11.2012 Seite 13 Page 13 07.11.2012
Thank you for your attention

07.11.2012 Seite 1
Preparatory Meeting for the Strategic Decision Making Workshop
Sustainable Urban Transport Master Plan
Land Use Scenarios
N.Sieber/C.Schürmann, November 5, 2012

07.11.2012 Seite 2 Page 2
Land use transport feedback cycle
07.11.2012
M. Wegener
Inte
gra
ted
tra
ns
po
rt
& l
an
d u
se
pla
nn
ing
ne
ed
ed
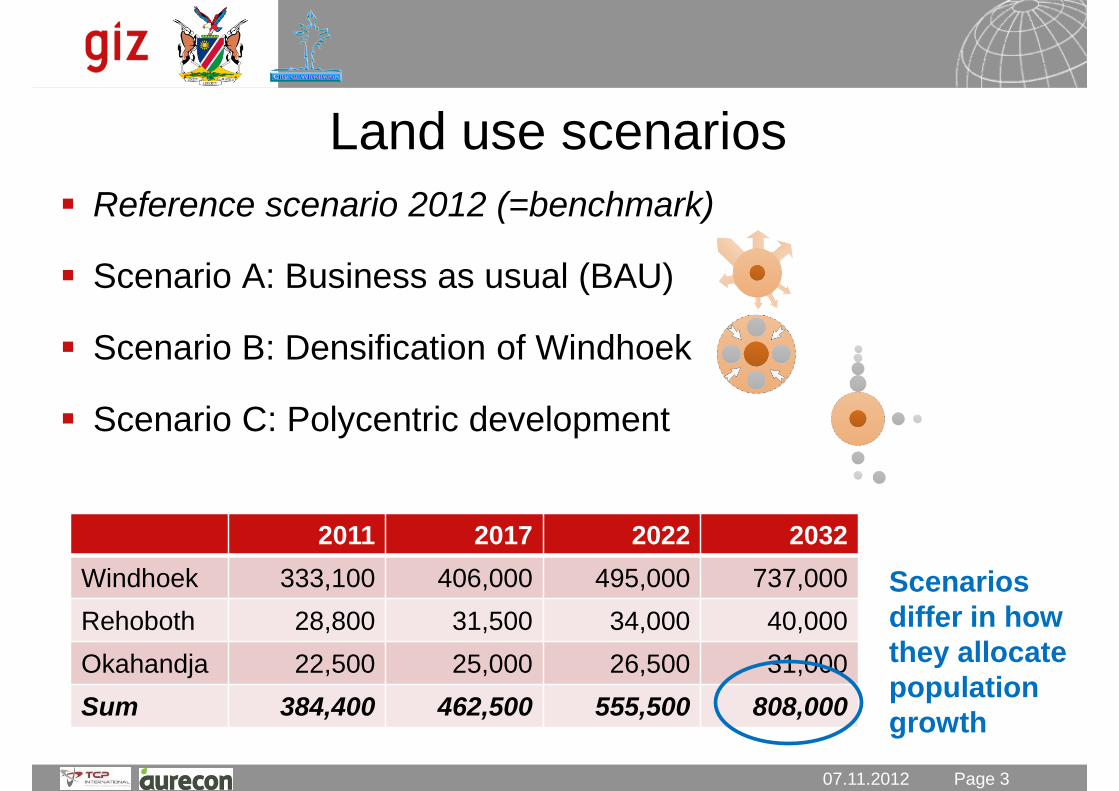
07.11.2012 Seite 3 Page 3
Land use scenarios
Reference scenario 2012 (=benchmark)
Scenario A: Business as usual (BAU)
Scenario B: Densification of Windhoek
Scenario C: Polycentric development
07.11.2012
2011 2017 2022 2032
Windhoek 333,100 406,000 495,000 737,000
Rehoboth 28,800 31,500 34,000 40,000
Okahandja 22,500 25,000 26,500 31,000
Sum 384,400 462,500 555,500 808,000
Scenarios
differ in how
they allocate
population
growth
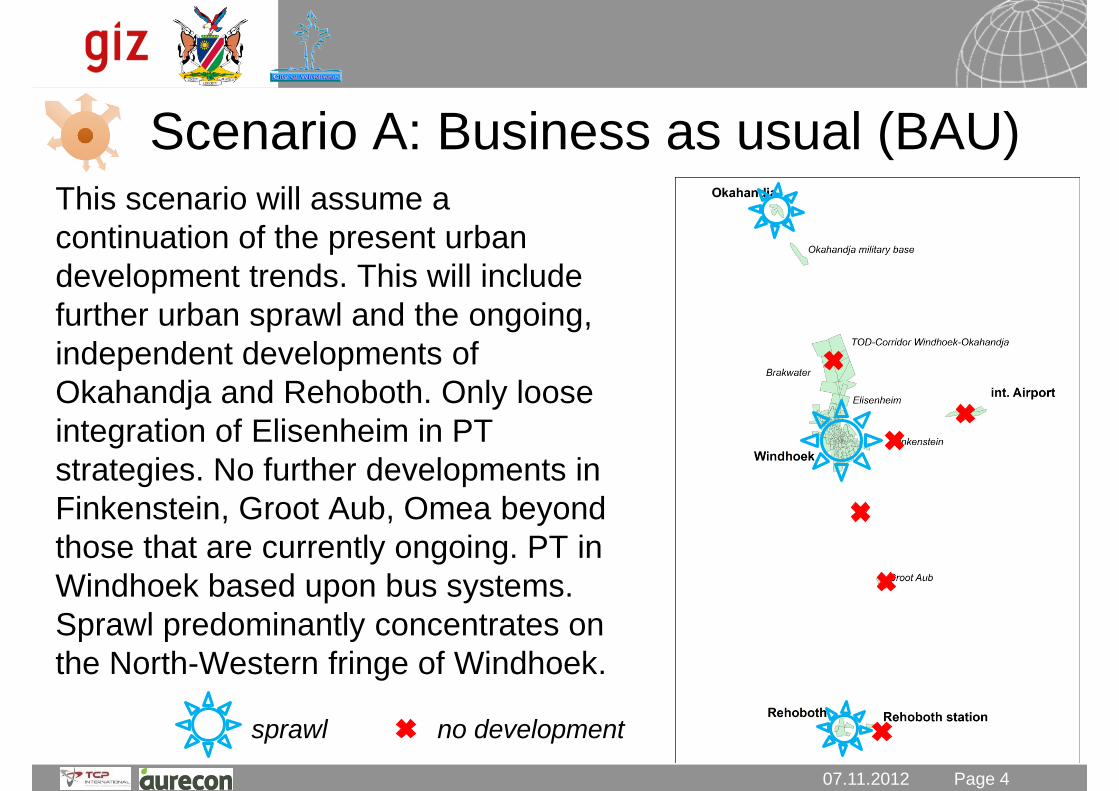
07.11.2012 Seite 4 Page 4
Scenario A: Business as usual (BAU) This scenario will assume a
continuation of the present urban
development trends. This will include
further urban sprawl and the ongoing,
independent developments of
Okahandja and Rehoboth. Only loose
integration of Elisenheim in PT
strategies. No further developments in
Finkenstein, Groot Aub, Omea beyond
those that are currently ongoing. PT in
Windhoek based upon bus systems.
Sprawl predominantly concentrates on
the North-Western fringe of Windhoek.
sprawl no development
07.11.2012

07.11.2012 Seite 5 Page 5
Scenario B: Densification of Windhoek This scenario allocates the in-migration
into the city of Windhoek by increasing
population densities and creating
higher density settlement schemes in
vacant areas. Public services and jobs
will be created in residence areas to
achieve a higher mix of functions. The
scenario will also apply an urban edge,
mixed land use and a moderate
development of Okahandja and
Rehoboth, where Okahandja and
Rehoboth apply the concept of urban
edges and mixed land use as well.
densification no development
07.11.2012
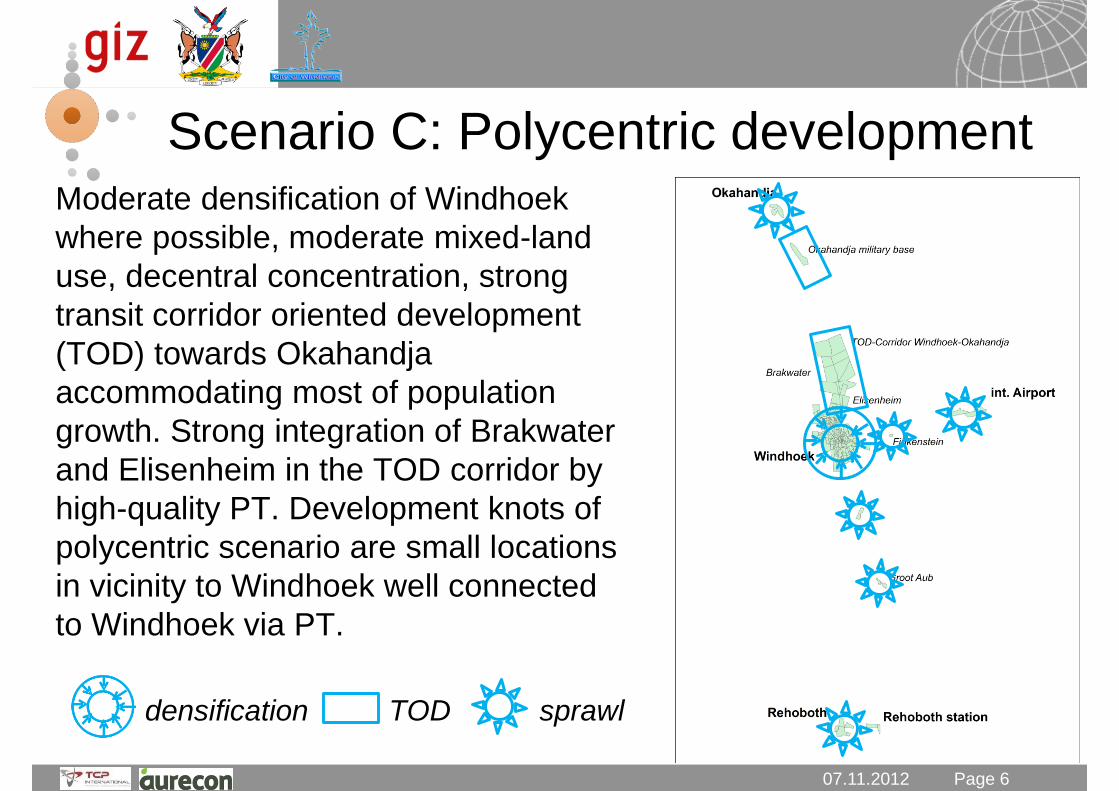
07.11.2012 Seite 6 Page 6
Scenario C: Polycentric development Moderate densification of Windhoek
where possible, moderate mixed-land
use, decentral concentration, strong
transit corridor oriented development
(TOD) towards Okahandja
accommodating most of population
growth. Strong integration of Brakwater
and Elisenheim in the TOD corridor by
high-quality PT. Development knots of
polycentric scenario are small locations
in vicinity to Windhoek well connected
to Windhoek via PT.
densification TOD sprawl
07.11.2012

07.11.2012 Seite 7 Page 7
Scenarios: Population growth (abs.)
07.11.2012
Stu
dy
are
a
Win
dh
oek
Scenario A Scenario B Scenario C
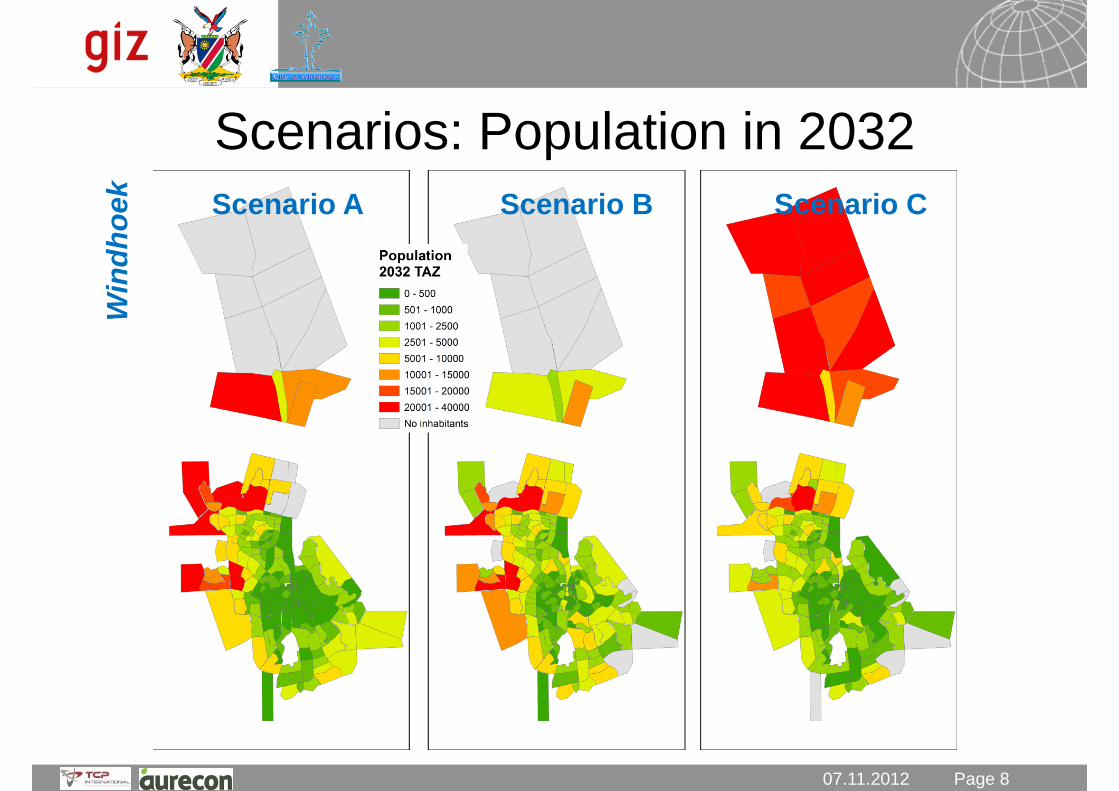
07.11.2012 Seite 8 Page 8
Scenarios: Population in 2032
07.11.2012
Stu
dy
are
a
Win
dh
oek
Scenario A Scenario B Scenario C

07.11.2012 Seite 9 Page 9
Scenarios: Population density in 2032
07.11.2012
Stu
dy
are
a
Win
dh
oek
Scenario A Scenario B Scenario C

07.11.2012 Seite 10 Page 10
Comparison of Scenarios (I)
07.11.2012
A: BAU B: Densification C: Polycentric
Time spent in traffic 3-4 > Scenario B 3-4 < Scenario A 1-2 > Scenario B
Transit accessibility < 15% of pop less
than 15 min to next
PT
>80% of pop less
than 15 min to next
PT
> 60% of pop less
than15 min to next
PT
External costs 3x higher than in
compact cities
Only 1/3 of
Scenario A
n/a
Fuel use per capita
60,000 – 80,000 l 2,000 – 10,000 l 15,000 – 40,000 l
Per capita car use 12,000 – 14,000 km 1,000 – 4,000 km 6,000 – 8,000 km
Modal split PT 3 – 10 % 40 – 60 % 20 – 40 %
Modal split NMT 0 – 5 % 10 – 40 % 10 – 30 %
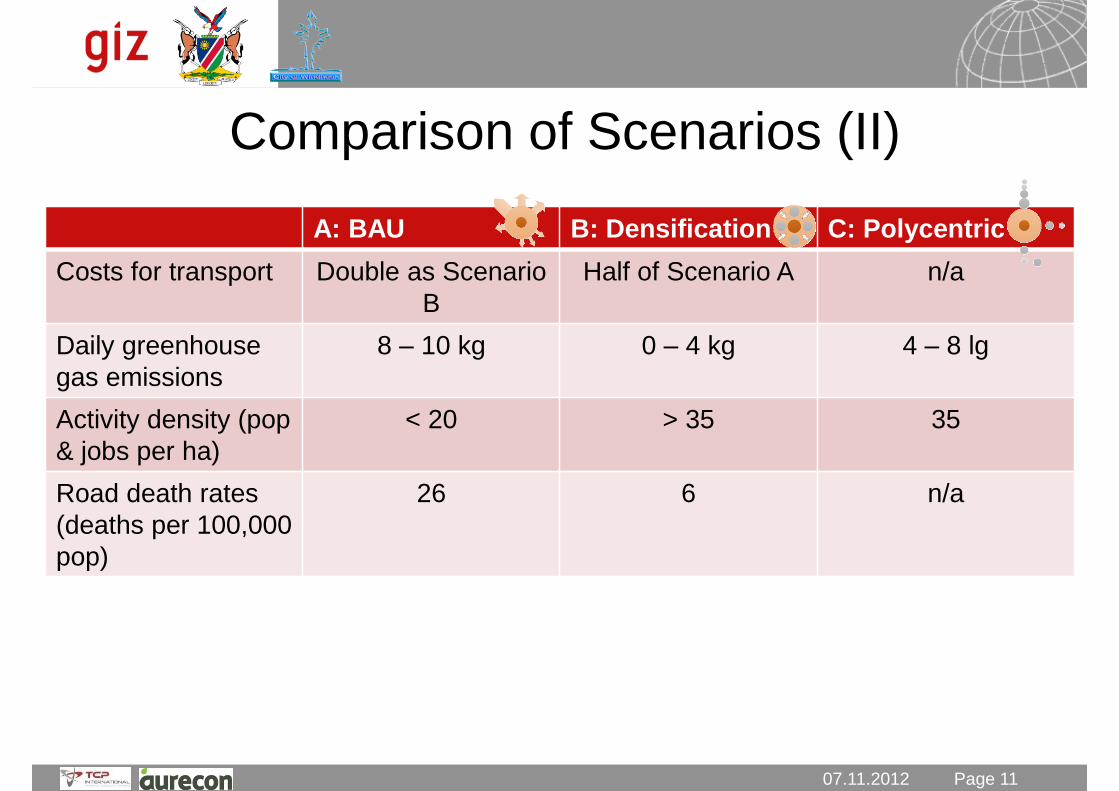
07.11.2012 Seite 11 Page 11
Comparison of Scenarios (II)
07.11.2012
A: BAU B: Densification C: Polycentric
Costs for transport Double as Scenario
B
Half of Scenario A n/a
Daily greenhouse
gas emissions
8 – 10 kg 0 – 4 kg 4 – 8 lg
Activity density (pop
& jobs per ha)
< 20 > 35 35
Road death rates
(deaths per 100,000
pop)
26 6 n/a

07.11.2012 Seite 12 Page 12
Implementation Scenario A
07.11.2012
It represents a continuation of current trend, no particular
policies required. Danger that game reserve and other
ecological values areas are affected.
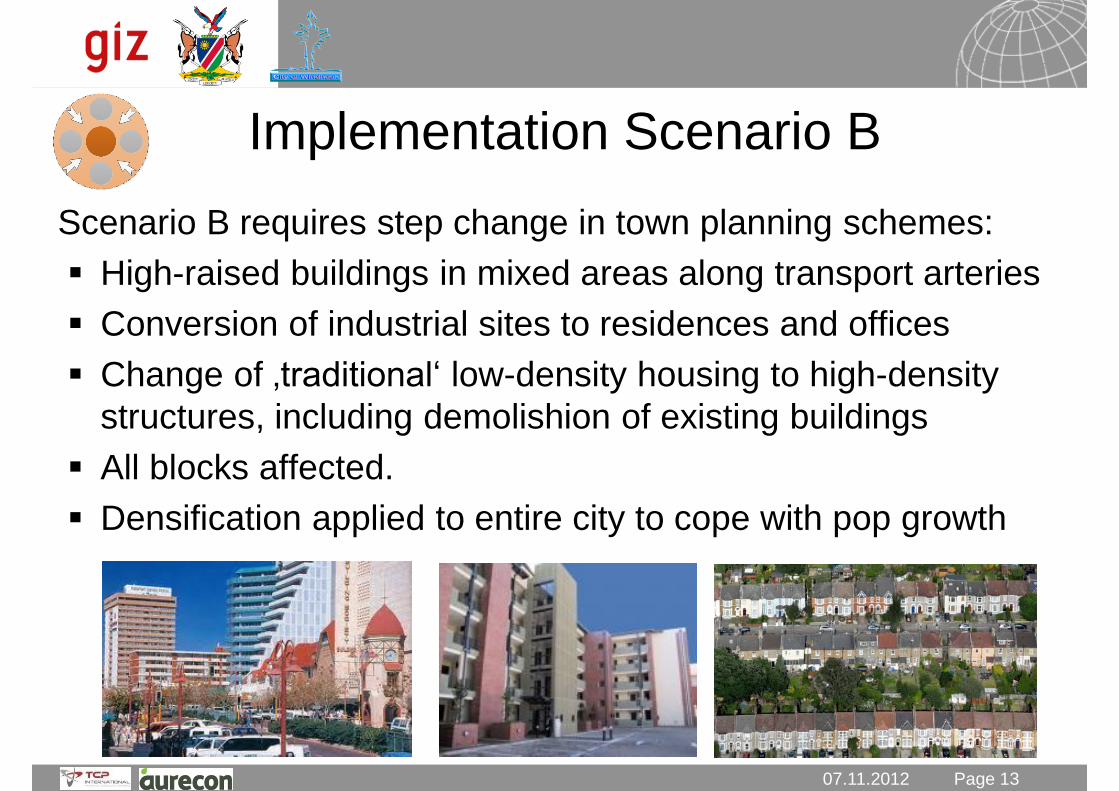
07.11.2012 Seite 13 Page 13
Implementation Scenario B
07.11.2012
Scenario B requires step change in town planning schemes:
High-raised buildings in mixed areas along transport arteries
Conversion of industrial sites to residences and offices
Change of ‚traditional‘ low-density housing to high-density
structures, including demolishion of existing buildings
All blocks affected.
Densification applied to entire city to cope with pop growth

07.11.2012 Seite 14 Page 14
Implementation Scenario C
07.11.2012
Scenario C requires change in town planning with
- strong focus on TOD corridor towards the north
- development of polycentric growth poles.
- restriction of developments in other parts of the town.

07.11.2012 Seite 15 Page 15 07.11.2012
Thank you for your attention

07.11.2012 Seite 1
Preparatory Meeting for the Strategic Decision Making Workshop
Sustainable Urban Transport Master Plan
Existing Traffic Situation and Land-Use
Adri van de Wetering, 5th of November 2012

07.11.2012 Seite 2 Page 2 07.11.2012
Contents
Why demand modelling?
SUTMP Transport Demand Model
Surveys
Base year results
Future Land-use scenarios?

07.11.2012 Seite 3 Page 3 07.11.2012
Why demand modelling?
Valuable for scenario comparisons
A model is a simplified representation of the real world
Replicate as system through mathematical equations
based on some theoretical statements
Typical output:
Demand estimates per mode
Traffic volumes
Vehicle km
Passenger km
Travel time
Level of congestion

07.11.2012 Seite 4 Page 4 07.11.2012
SUTMP Transport Demand Model
Models are problem and viewpoint specific
This model is strategic in nature
Based on existing transport demand model of Windhoek
(2006)
Expanded to include:
Okanhadja
Rehoboth
Hosea Kutako International Airport
Latest network information
New population and land-use information
Traffic surveys
Latest airport data
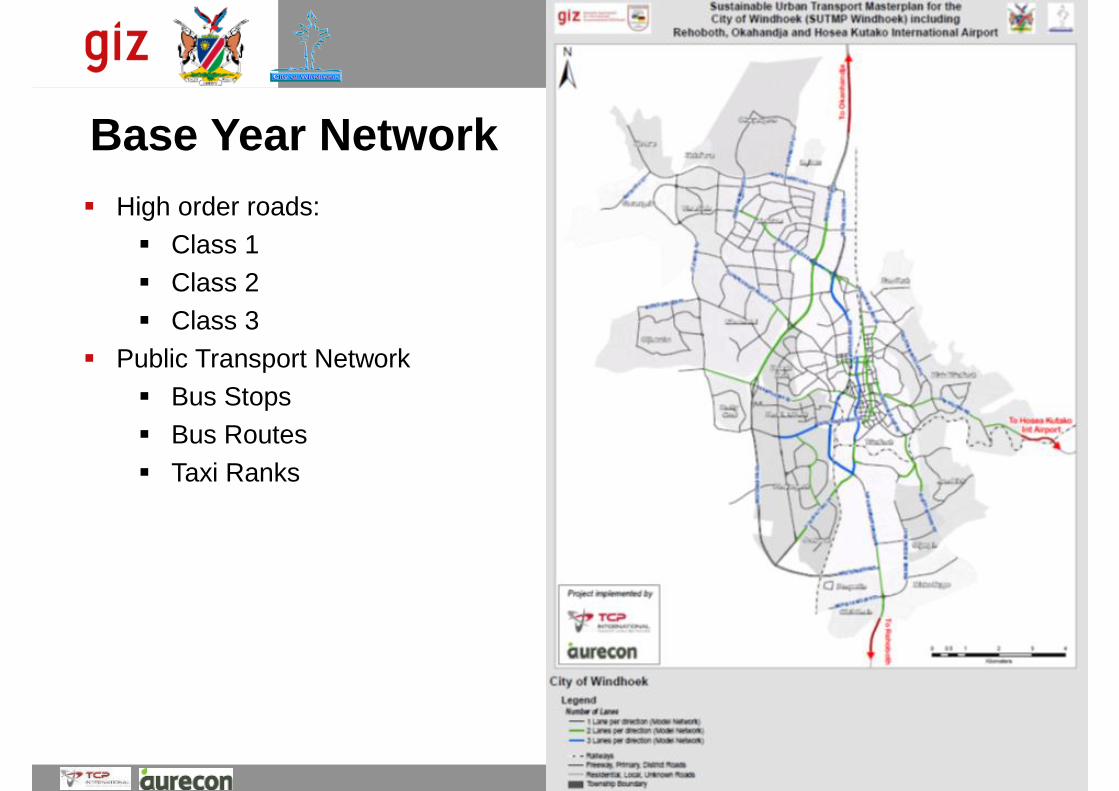
07.11.2012 Seite 5 Page 5 07.11.2012
Base Year Network
High order roads:
Class 1
Class 2
Class 3
Public Transport Network
Bus Stops
Bus Routes
Taxi Ranks
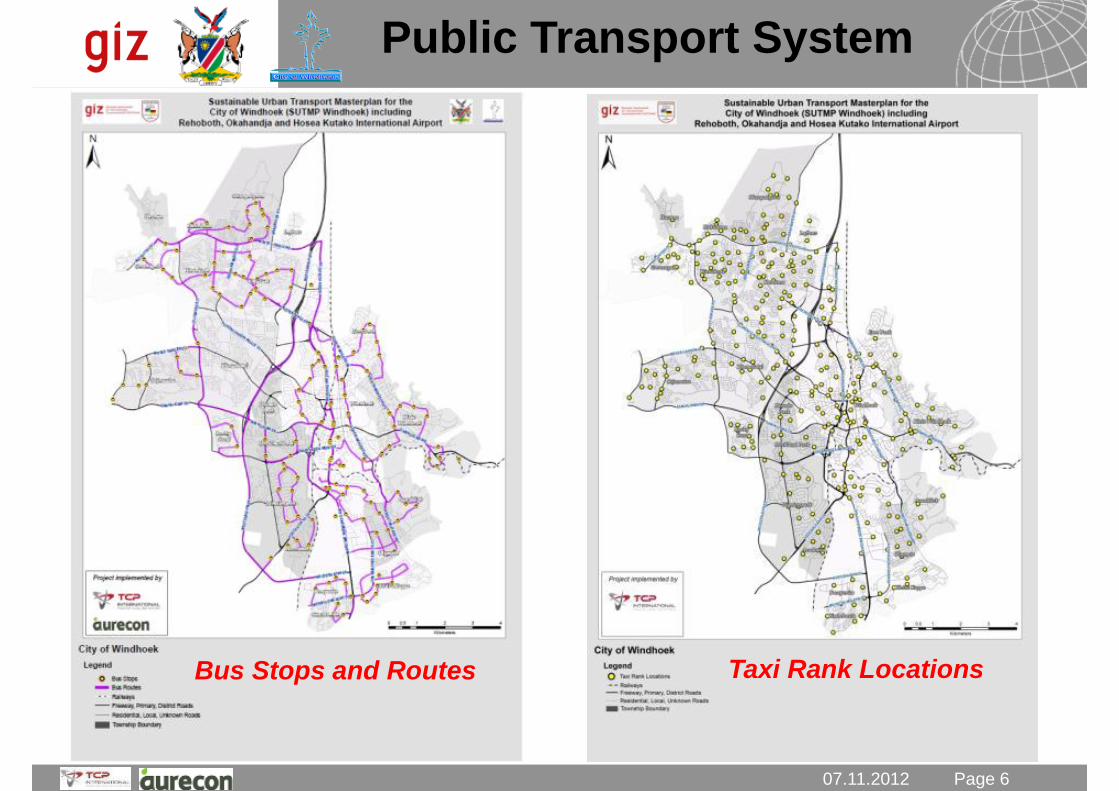
07.11.2012 Seite 6 Page 6 07.11.2012
Public Transport System
Bus Stops and Routes Taxi Rank Locations

07.11.2012 Seite 7 Page 7 07.11.2012
Population
The majority
of the
population
resides in the
north-west
Discrepancy
between
population
density and
income levels
between
north-west
and south-
east
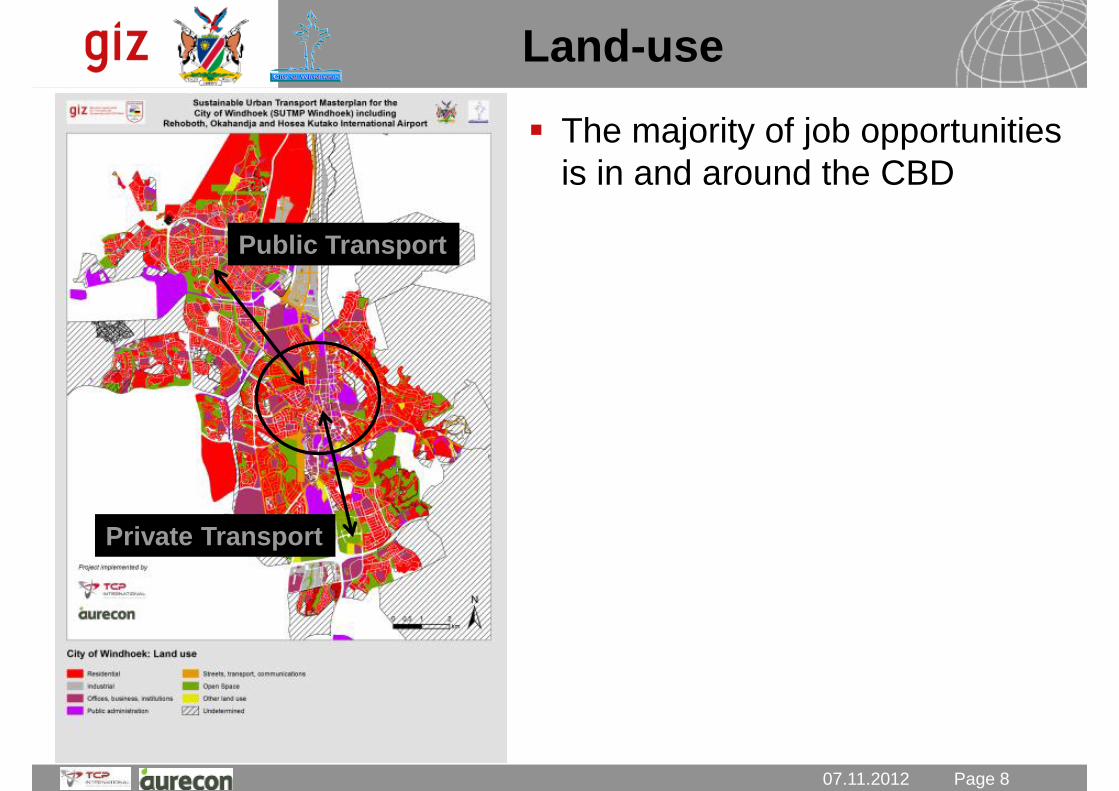
07.11.2012 Seite 8 Page 8 07.11.2012
Land-use
The majority of job opportunities
is in and around the CBD
Public Transport
Private Transport

07.11.2012 Seite 9 Page 9
Classified Intersection Counts
AM, Midday & PM peak periods
Link Counts
12-hours
Vehicle Occupancy Counts
AM & PM peak periods
Pedestrian & Bicycle Link Counts
AM, Midday & PM peak periods
Origin-Destination Surveys
12-hours
07.11.2012
Traffic Surveys Types:

07.11.2012 Seite 10 Page 10
Traffic Surveys Process:
07.11.2012
Supervisor Training - Theory
Trial Supervisor Survey - Practical
Enumerator Introductory Training
Conduct Surveys
Data capturing, Processing & Analyses

07.11.2012 Seite 11 Page 11
Surveys Locations:
07.11.2012
15 Classified Intersection
Counts

07.11.2012 Seite 12 Page 12
Surveys Locations:
07.11.2012
6 Vehicle Occupancy Counts

07.11.2012 Seite 13 Page 13
Surveys Locations:
3 OD Surveys & Link Counts
07.11.2012

07.11.2012 Seite 14 Page 14
Surveys Locations:
10 Pedestrian & Bicycle
Counts
07.11.2012

07.11.2012 Seite 15 Page 15
Nine (9) Supervisors trained to perform and
supervise five (5) different types of surveys
60+ Enumerators trained and undertook surveys
Surveys undertaken over six (6) days
34 locations surveyed
07.11.2012
Surveys Quick Facts:
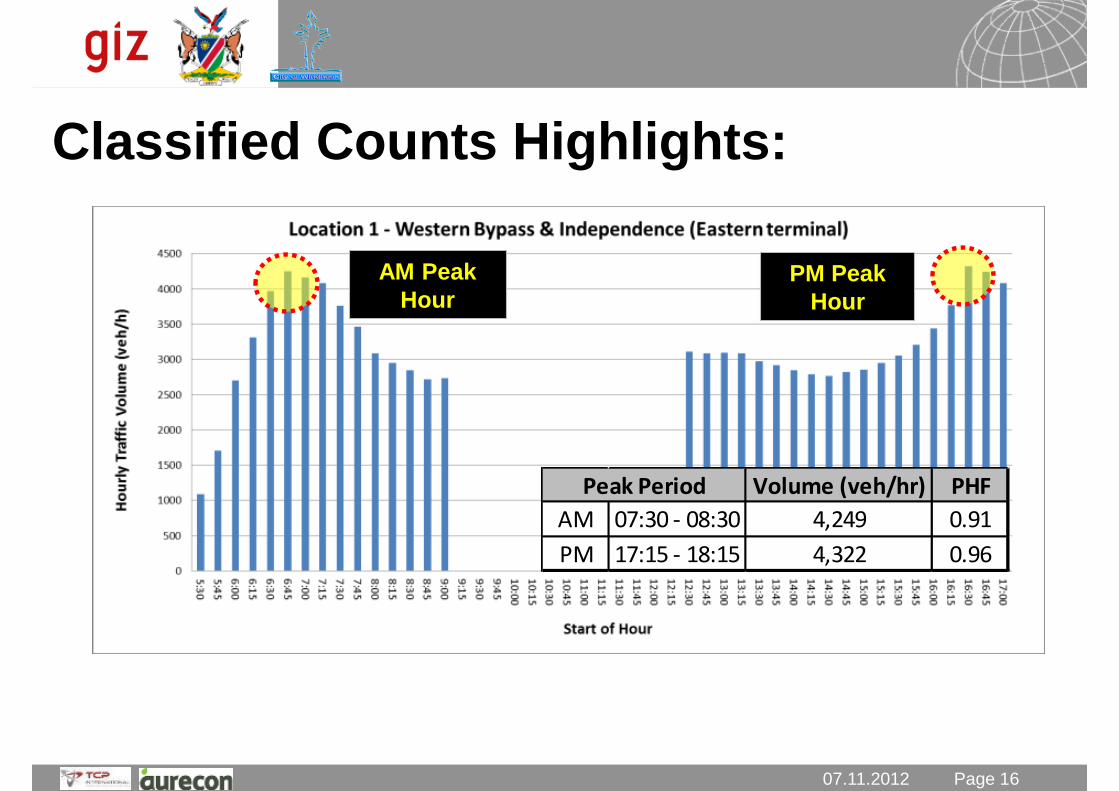
07.11.2012 Seite 16 Page 16
07.11.2012
Classified Counts Highlights:
AM Peak
Hour PM Peak
Hour
Volume (veh/hr) PHF
AM 07:30 - 08:30 4,249 0.91
PM 17:15 - 18:15 4,322 0.96
Peak Period
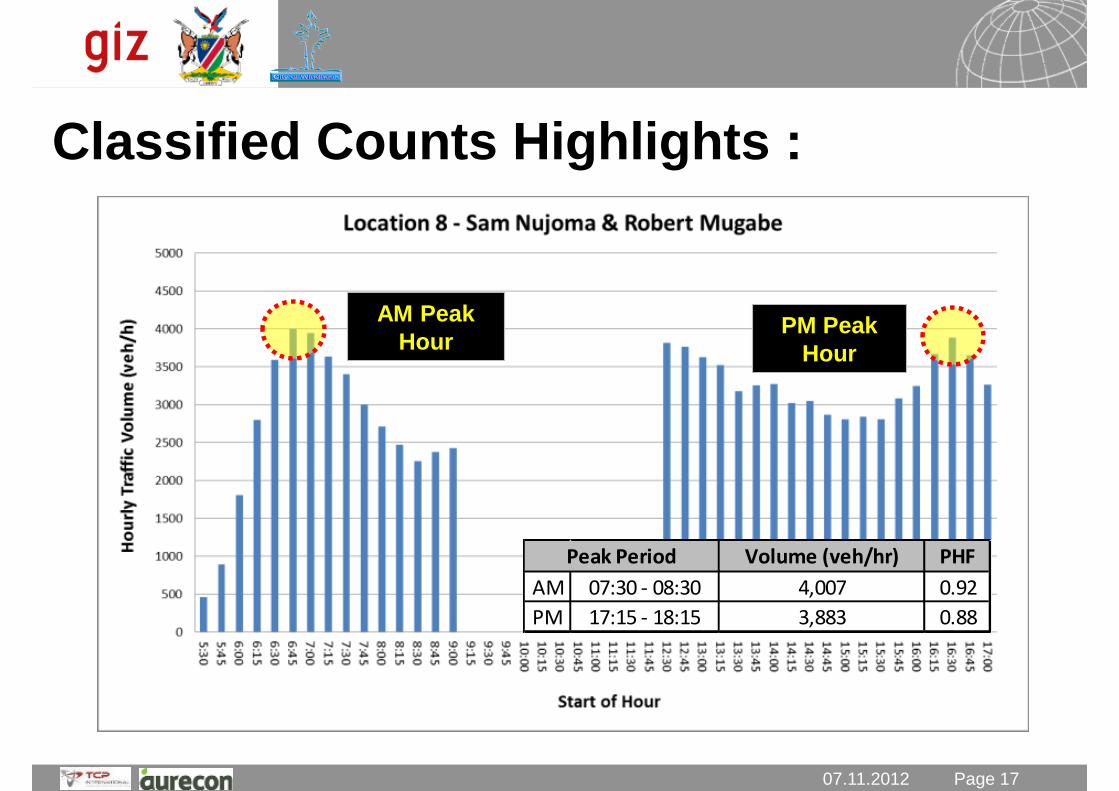
07.11.2012 Seite 17 Page 17
07.11.2012
Classified Counts Highlights :
AM Peak
Hour PM Peak
Hour
Volume (veh/hr) PHF
AM 07:30 - 08:30 4,007 0.92
PM 17:15 - 18:15 3,883 0.88
Peak Period

07.11.2012 Seite 18 Page 18
07.11.2012
Classified Counts Highlights :
AM Peak
Hour PM Peak
Hour
Volume (veh/hr) PHF
AM 07:30 - 08:30 2,596 0.85
PM 17:30 - 18:30 2,087 0.94
Peak Period

07.11.2012 Seite 19 Page 19
07.11.2012
Classified Counts Summary :
Peak Period Volume (veh/hr) PHF Peak Period Volume (veh/hr) PHF
Western Bypass & Independence (East) 07:30 - 08:30 4,249 0.91 17:15 - 18:15 4,322 0.96
Western Bypass & Independence (West) 07:45 - 08:45 4,359 0.92 17:30 - 18:30 3,587 0.67
2 Hosea Kutako & Independence 08:15 - 09:15 4,369 0.96 17:15 - 18:15 4,863 0.89
3 Western Bypass & Nightingale (East) 07:30 - 08:30 4,121 0.95 17:30 - 18:30 3,285 0.91
7 Sam Nujoma & Hosea Kutako 07:30 - 08:30 3,812 0.91 17:30 - 18:30 3,661 0.95
8 Sam Nujoma & Robert Mugabe 07:30 - 08:30 4,007 0.92 17:15 - 18:15 3,883 0.88
9 Nelson Mandela & Sam Nujoma 07:30 - 08:30 2,749 0.94 17:30 - 18:30 2,503 0.87
12 Monte Christo & Omvapu 07:15 - 08:15 1,743 0.95 17:00 - 18:00 1,933 0.99
13 Abraham Mashengo & Independence 07:30 - 08:30 2,873 0.97 17:45 - 18:45 3,000 0.93
14 Mungunda & Florence Nightingale 07:30 - 08:30 1,763 0.98 17:45 - 18:45 1,767 0.94
18 Hendrik Witbooi & Hocland (David Hosea) 07:30 - 08:30 3,886 0.89 17:30 - 18:30 3,185 0.90
19 Hochland & Hosea Kutako 07:30 - 08:30 4,281 0.93 17:30 - 18:30 1,732 0.89
20 Rehoboth & Mandume 07:30 - 08:30 4,776 0.93 17:30 - 18:30 4,824 0.72
23 Independence & Otjomuise 07:15 - 08:15 2,544 0.94 17:45 - 18:45 2,380 0.95
24 Moses Garoeb & Otjomuise 07:30 - 08:30 2,596 0.85 17:30 - 18:30 2,087 0.94
PMAMLocation
1
Common Peaks:
07:30 – 08:30 (AM) & 17:30 – 18:30 (PM)
Weighted PHF:
0.93 (AM) & 0.88 (PM)
AM Peak Hour
– more dominant in most regions

07.11.2012 Seite 20 Page 20 07.11.2012
Airport data
Main operator is Air Namibia
Other Operators
South African Airways
British Airways
AirBerlin
TAAG
Source: Namibia Airports Company

07.11.2012 Seite 21 Page 21 07.11.2012
Airport data
Origins and destinations
Johannesburg, Cape Town,
Walvis Bay, Accra, Berlin,
Frankfurt, Gaborone, Harare,
Luanda, Lubango, Luderitz,
Lusaka, Maun, Ondjiva &
Victoria Falls
On average weekday 17
aircraft arrivals and 17
aircraft departures
90% international trips; larger
aircrafts
Source: Airline Route Maps.com

07.11.2012 Seite 22 Page 22 07.11.2012
Reference year / Base year results
High volumes of traffic from the
north and north-west moving
towards the CBD
The minibus taxi dominates the
public transport sector
Most taxi users are in the north-
west.
The bus service is underutilised
Persons whose main mode of
transport is walking are
concentrated in north and north-
west.
Taxi transport / Walking

07.11.2012 Seite 23 Page 23 07.11.2012
Reference year
results
Relative high volumes
to & from Rehoboth,
Okahandja & Hosea
Kutako per day
Peak hour travel is
between 4% and 10%
for Okahandja &
Hosea Kutako
Peak hour travel to
and from Rehoboth is
25%

07.11.2012 Seite 24 Page 24 07.11.2012
Future Land-Use Scenarios
Decision makers will decide upon future land-use
scenario
Detail calculations will be done for chosen land-use
scenario

07.11.2012 Seite 25 Page 25 07.11.2012
Thank you for your attention
07.11.2012 Seite 1
Preparatory Meeting for the Strategic Decision Making Workshop
Sustainable Urban Transport Master Plan
Strategic Options for Modernising Public Transport
Dr. Simonis 5th of November 2012

07.11.2012 Seite 2 Page 2 07.11.2012
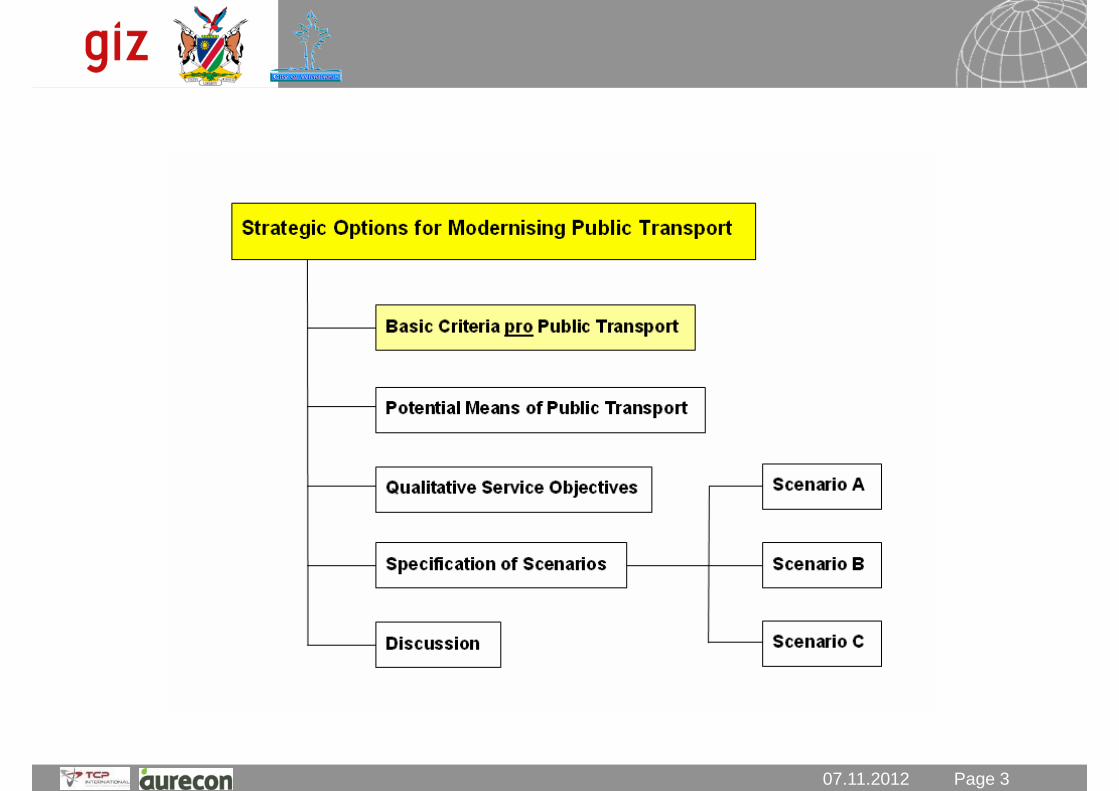
07.11.2012 Seite 3 Page 3 07.11.2012
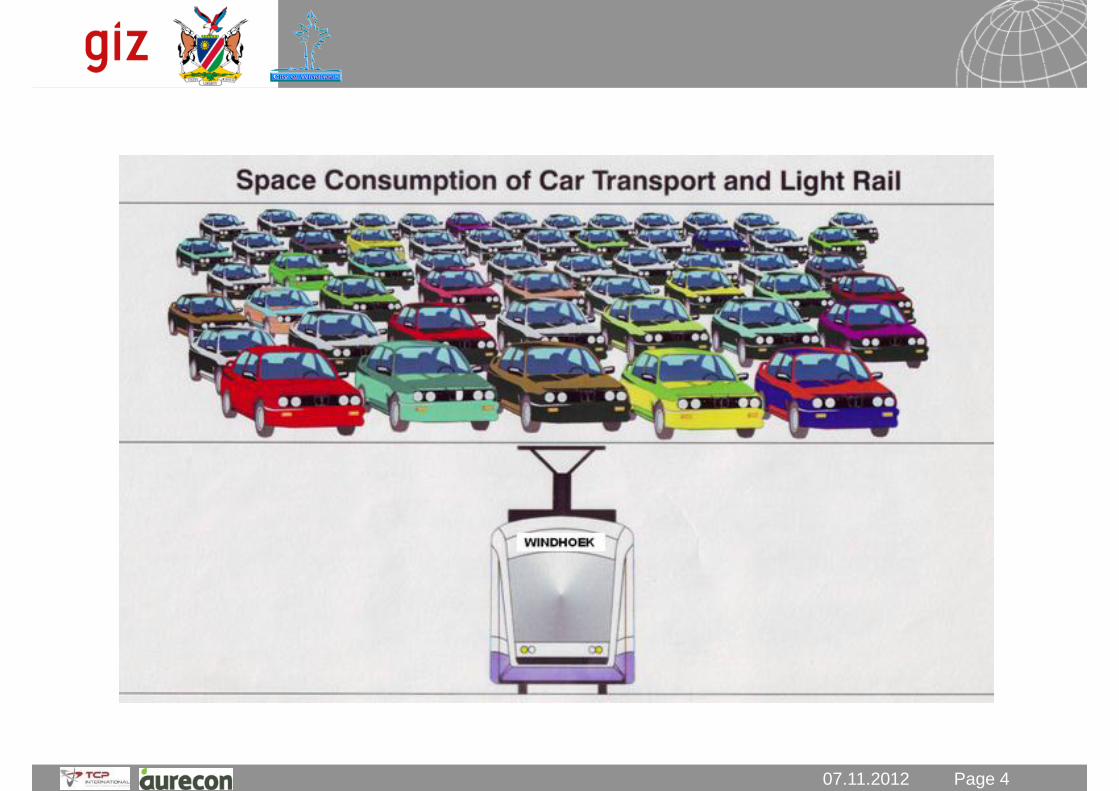
07.11.2012 Seite 4 Page 4 07.11.2012

07.11.2012 Seite 5 Page 5

07.11.2012 Seite 6 Page 6 07.11.2012

07.11.2012 Seite 7 Page 7 07.11.2012

07.11.2012 Seite 8 Page 8 07.11.2012

07.11.2012 Seite 9 Page 9
Develop a clear «Pro- Public Transport Policy» providing
priority of public transport
at road intersections
during road rehabilitation measures
during road new construction measures
during development of land use concepts
etc.
Quintessence of the Basic Criteria pro Public Transport

07.11.2012 Seite 10 Page 10 07.11.2012

07.11.2012 Seite 11 Page 11
Normal Bus
07.11.2012
operating on normal city streets in
normally non-segregated ROW
sometimes seamless access (also) for mobility-restricted persons
diesel or electric (Trolley Bus) or CNG or LPG propulsion
often with ticket selling by the driver
sometimes comfortable stations with shelters and other equipment

07.11.2012 Seite 12 Page 12 07.11.2012
=> Bus Lanes
Normal Bus on dedicated / marked Right of Way
widely without disturbances from MIT
possibly with priority at intersections
often with ticket selling by the driver
comfortable stations with shelters etc.
possibly with housed stations and preboarding
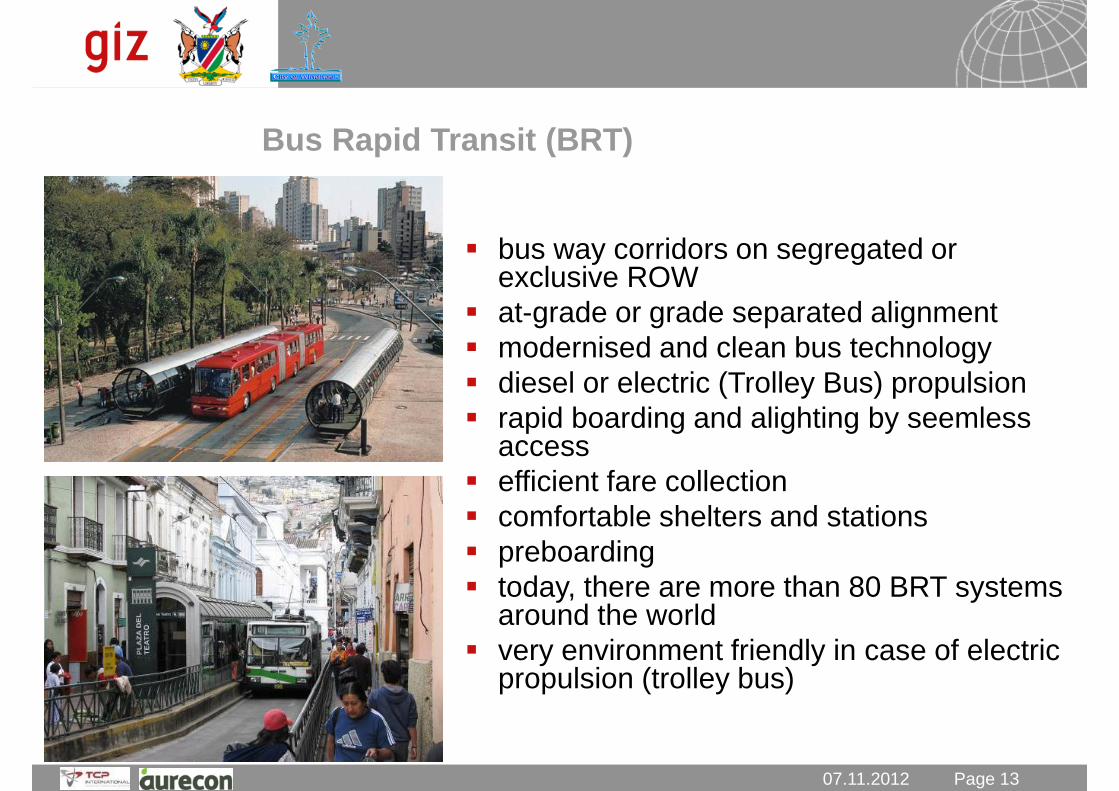
07.11.2012 Seite 13 Page 13
Bus Rapid Transit (BRT)
07.11.2012
bus way corridors on segregated or exclusive ROW
at-grade or grade separated alignment
modernised and clean bus technology
diesel or electric (Trolley Bus) propulsion
rapid boarding and alighting by seemless access
efficient fare collection
comfortable shelters and stations
preboarding
today, there are more than 80 BRT systems around the world
very environment friendly in case of electric propulsion (trolley bus)
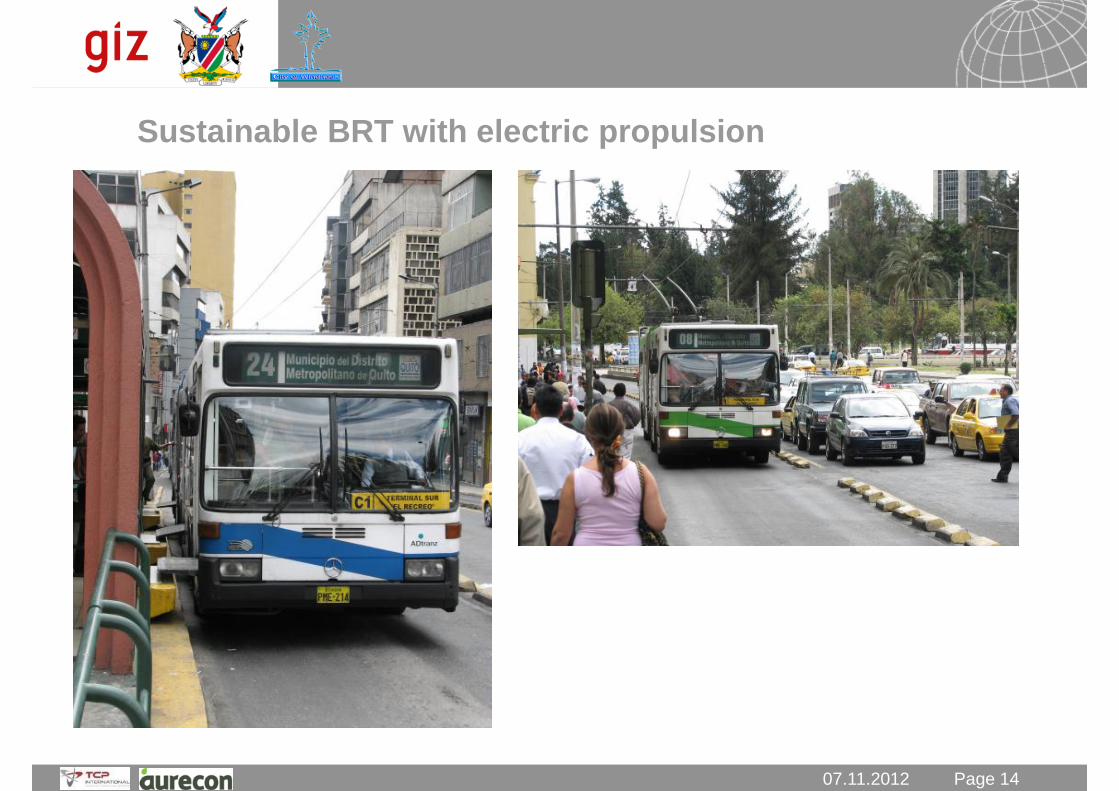
07.11.2012 Seite 14 Page 14 07.11.2012
Sustainable BRT with electric propulsion

07.11.2012 Seite 15 Page 15
Light Rail Transit (LRT)
07.11.2012
Metropolitan electric Railway System
variable frequencies, capacities and
speeds
operates in mixed traffic as well as on
segregated and exclusive Right of Way
can partly combine standards of tramway,
light metro or commuter rail
Cairo, Egypt
Hannover, Germany

07.11.2012 Seite 16 Page 16
Minibus / Taxi
07.11.2012
distributor and feeder service in areas aside of main corridors
small units with relatively low capacity (max. 20 passengers)
various possibilities of organization
operating on demand

07.11.2012 Seite 17 Page 17
Commuter Rail
07.11.2012
electric or diesel Railway System
interurban, suburban and urban service
variable frequencies, capacities and speeds
mostly in adapted existing railway corridors
can be combined with LRT-Technology
(Tramtrain)
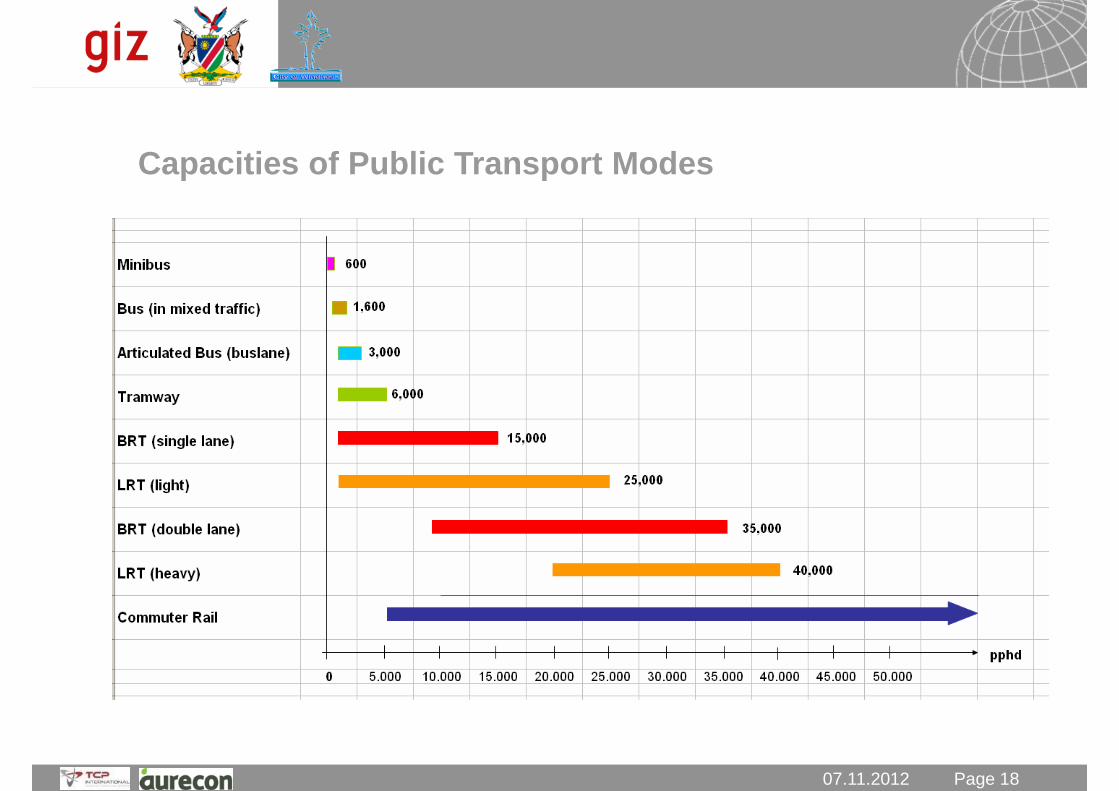
07.11.2012 Seite 18 Page 18 07.11.2012
Capacities of Public Transport Modes
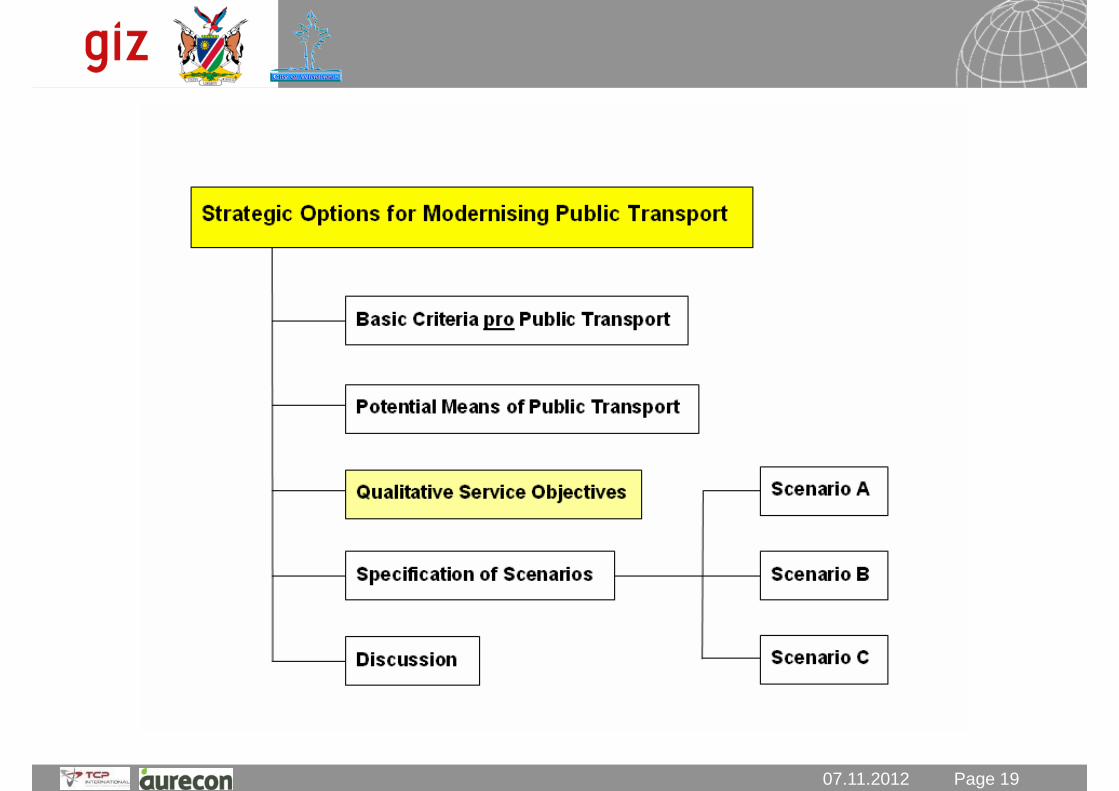
07.11.2012 Seite 19 Page 19 07.11.2012
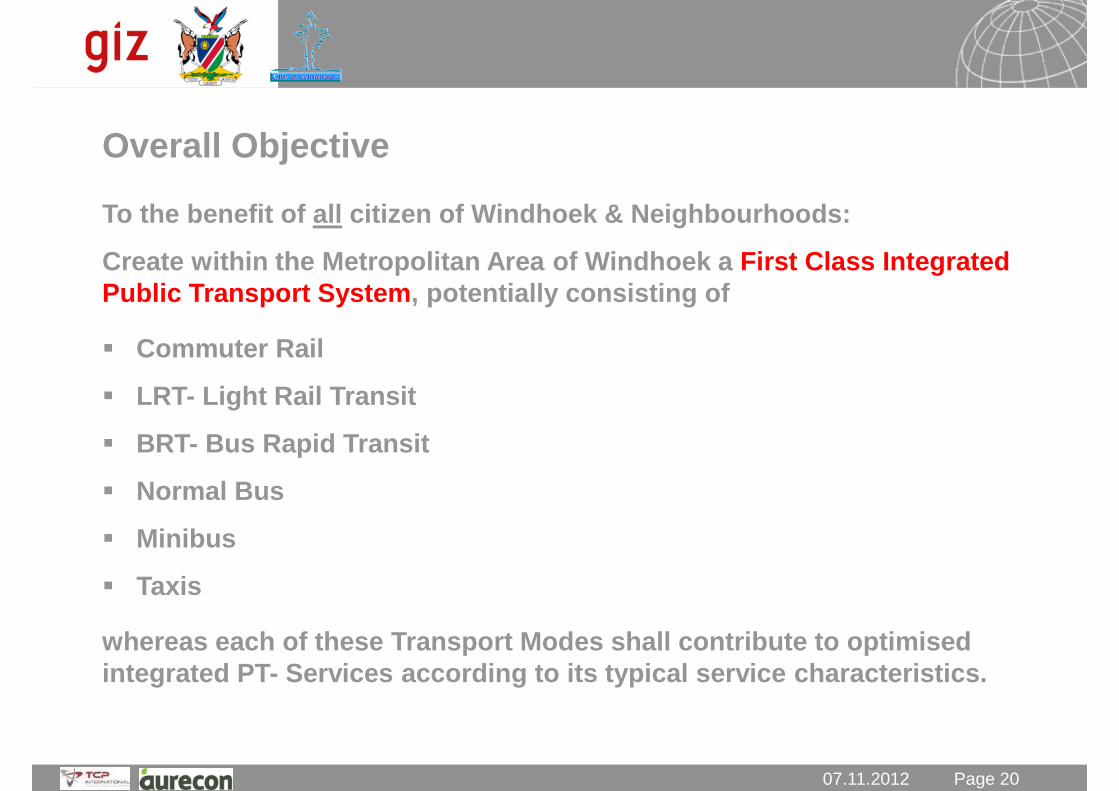
07.11.2012 Seite 20 Page 20 07.11.2012
Overall Objective
To the benefit of all citizen of Windhoek & Neighbourhoods:
Create within the Metropolitan Area of Windhoek a First Class Integrated
Public Transport System, potentially consisting of
Commuter Rail
LRT- Light Rail Transit
BRT- Bus Rapid Transit
Normal Bus
Minibus
Taxis
whereas each of these Transport Modes shall contribute to optimised
integrated PT- Services according to its typical service characteristics.

07.11.2012 Seite 21 Page 21 07.11.2012
Qualitative Service Objectives for Public Transport
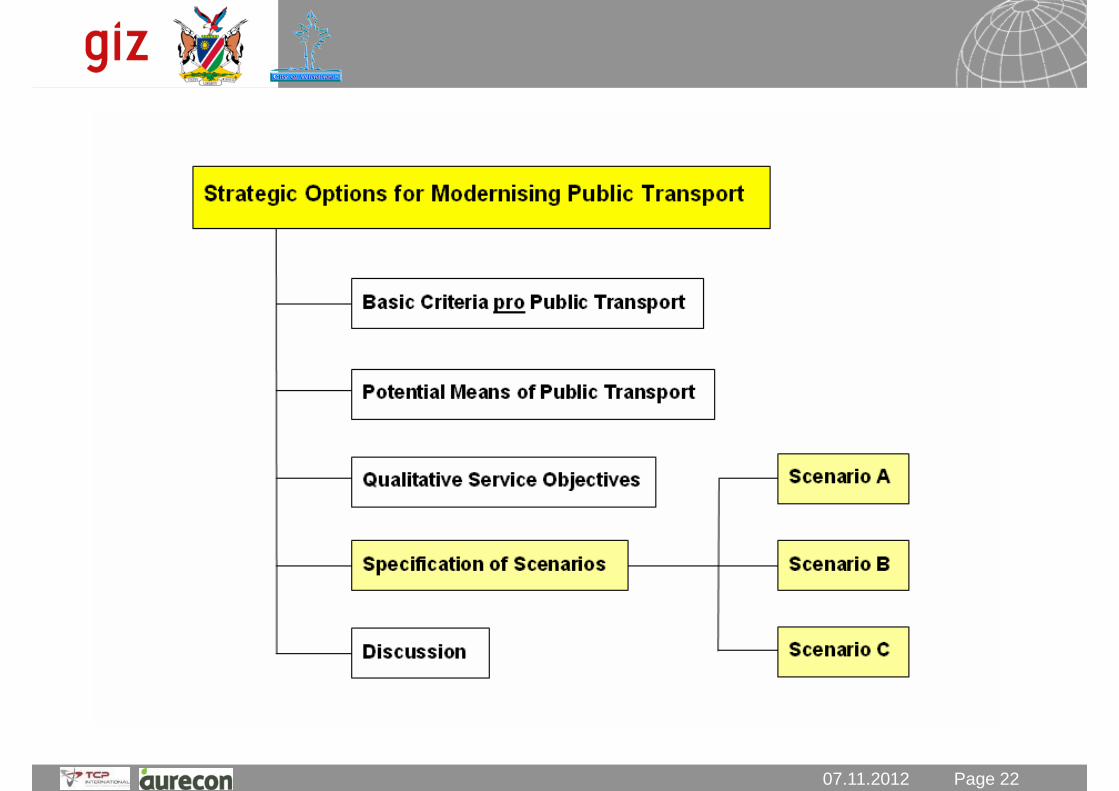
07.11.2012 Seite 22 Page 22 07.11.2012

07.11.2012 Seite 23 Page 23 07.11.2012
Scenario A: Business as usual (BAU)
City of Windhoek • same Bus-System as before
• some more lines, some more Buses

07.11.2012 Seite 24 Page 24 07.11.2012
Scenario A: Business as usual (BAU)
Windhoek Regional Area
Regional Public Transport Network
Okahandja and Rehoboth
• like at present: Minibus services
• frequency probably adapted to demand
Airport Hosea Kutako
• like at present: no regular Bus services

07.11.2012 Seite 25 Page 25 07.11.2012
Scenario B -
Densification of Windhoek:
City of Windhoek
Urban Public Transport Network
Option 1: Buses on dedicated Bus lanes
• dense Bus network
• accessibility to all neighborhoods
• high frequency on all Bus lines (due to high density
settlement all over the city)
• feeder services by minibuses / taxis

07.11.2012 Seite 26 Page 26 07.11.2012
Scenario B -
Densification of Windhoek:
City of Windhoek
Urban Public Transport Network
Option 2: On main corridors: BRT or LRT;
on further lines: buses on bus lanes
• dense network
• accessibility of all neighbourhoods
• high frequency on all PT lines (due to high density
settlement all over the city)
• main lines (1,3 and 6) operated by BRT or LRT
• feeder services by minibuses / taxis

07.11.2012 Seite 27 Page 27 07.11.2012
Scenario B:
Densification of Windhoek
Windhoek Regional Area
Regional Public Transport Network
Okahandja and Rehoboth
• hourly Bus services during the day
• densified services during peak hour
Airport Hosea Kutako
• hourly Bus services during the day
• additional Bus services in accordance to landing
and starting of aircrafts

07.11.2012 Seite 28 Page 28 07.11.2012
Scenario C:
Polycentric Development
City of Windhoek and
Windhoek Regional Area
Urban and Regional Public Transport Network
• accessibility to all neighborhoods
• dense PT network
• high frequency only in densly settled corridors or
between densly settled centers
• Main line (1) may be changed to Tramtrain, operating partly
on existing Rail ROW
• in further corridors: Bus or BRT services depending on future
passenger volumes
• feeder services by minibuses / taxis
• Commuter Railway Line Okahandja - Windhoek - Rehoboth
• Commuter Railway Line Windhoek - Hosea Kutako Airport

07.11.2012 Seite 29 Page 29 07.11.2012
Scenario C:
Polycentric Development
City of Windhoek and
Windhoek Regional Area
Windhoek Central Station
Windhoek north (several stations)
Brackwater (several stations)
Windhoek south (several stations)
Urban and Regional Public Transport Network /
Option 1 Commuter Rail
• accessibility of sub-centers
• main corridor operation
• medium frequency of trains, higher capacity per rail vehicle
compared to urban transport
Okahandja
Rehoboth
Airport Hosea Kutako
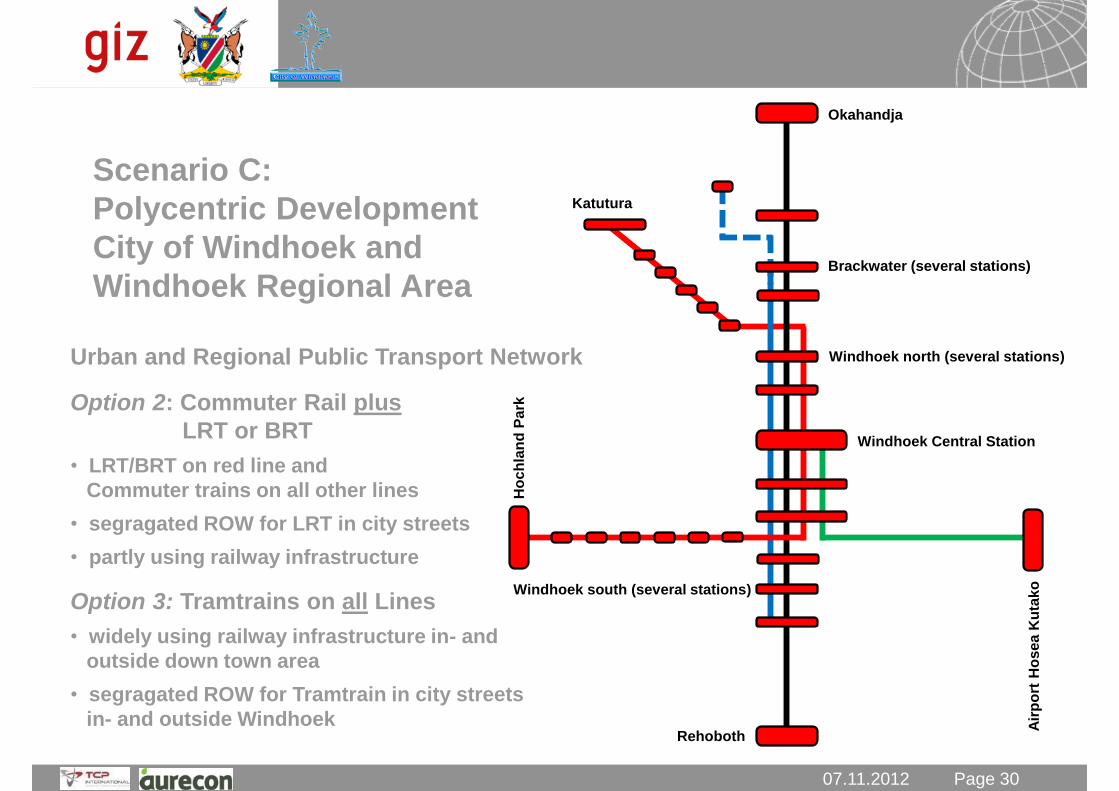
07.11.2012 Seite 30 Page 30 07.11.2012
Scenario C:
Polycentric Development
City of Windhoek and
Windhoek Regional Area
Windhoek Central Station
Windhoek north (several stations)
Brackwater (several stations)
Windhoek south (several stations)
Okahandja
Rehoboth
Air
po
rt H
osea K
uta
ko
Katutura
Urban and Regional Public Transport Network
Option 2: Commuter Rail plus
LRT or BRT
• LRT/BRT on red line and
Commuter trains on all other lines
• segragated ROW for LRT in city streets
• partly using railway infrastructure
Option 3: Tramtrains on all Lines
• widely using railway infrastructure in- and
outside down town area
• segragated ROW for Tramtrain in city streets
in- and outside Windhoek
Ho
ch
lan
d P
ark

07.11.2012 Seite 31 Page 31 07.11.2012
07.11.2012 Seite 32 Page 32 07.11.2012
Thank you for your attention

07.11.2012 Seite 1
Preparatory Meeting for the Strategic Decision Making Workshop
Sustainable Urban Transport Master Plan
Non-Motorised Transport
James Scheepers, 5th of November 2012

Content
Background and Context
NMT Methodology
Current Situation / Status Quo
NMT Network Proposals
NMT Route Options
NMT Facility Options (per land use)
Prioritisation of Interventions
NMT Promotional Activities
Summary of Options

1st Stakeholder Workshop
• Pedestrian Walkways and Cycle Paths
NMT Infrastructure and Facility Provision
• Awareness Campaigns
• Changing Perceptions of NMT
Awareness and Institution / Legislative reforms
• Cargo Transport
• NMT Taxis / “Rickshaws”
• NMT Ambulances
Promotion and role out of different cycle modes and their role in urban transport
1
2
3
Main Issues

Thought Process

Contextual Analysis
Pockets of Poor (High Density)
Education
(University
students)
High Income
Pockets (Low
Density)
Employment Opportunity
NW of city segregated from major
employment & commercial
opportunities. Links required to
integrate with the CBD.
Education Pocket reliant upon
NMT modes to access
opportunities. Link required to
strengthen access to CBD.
Proposed NMT routes should:
Promote access to various
opportunities in poor areas
Create networks that are
viable and readily accessible
to all
Decrease travel time for NMT
users by implementing most
direct paths to work
opportunities.
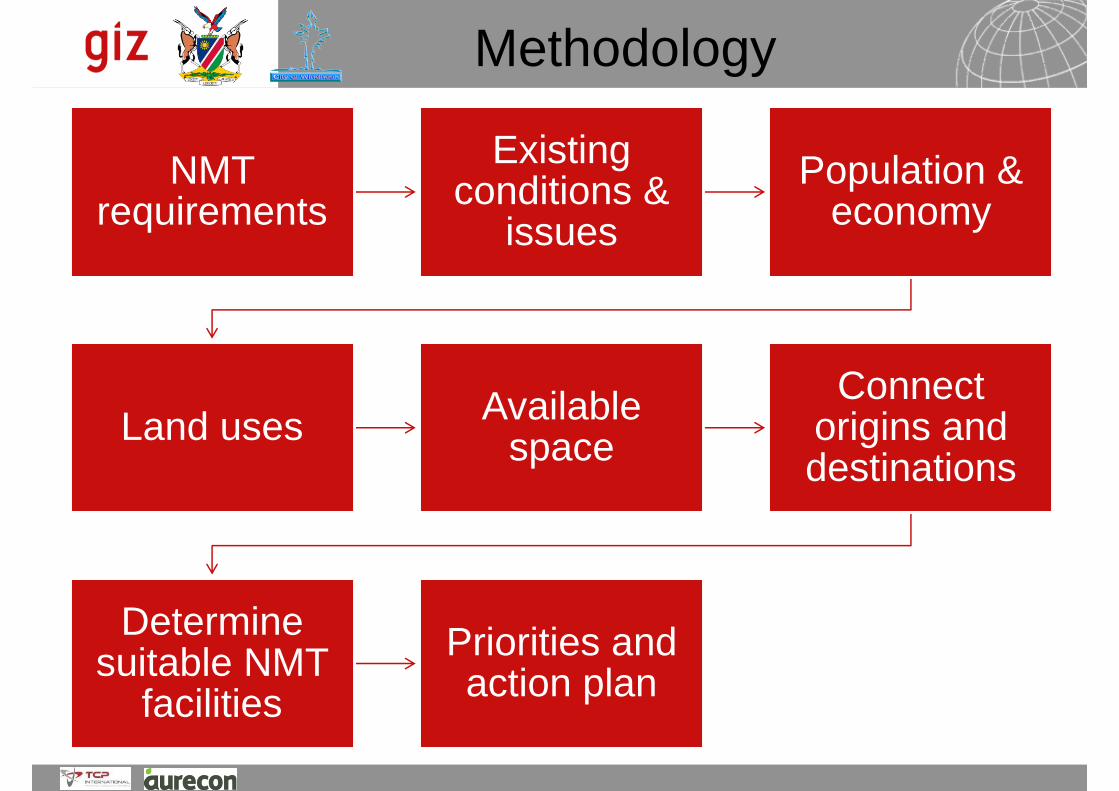
Methodology
NMT requirements
Existing conditions &
issues
Population & economy
Land uses Available
space
Connect origins and destinations
Determine suitable NMT
facilities
Priorities and action plan

NMT Network
• Space to ride
• Smooth riding surfaces
• Speed maintenance
• Clear sight lines
• Connectivity
• Information
• Connected
• Convivial
• Comfortable
• Convenient
• Coherent
•Cyclist paths
•Crossings
•Storage facilities / lockers / showers
•Interchange spaces
•Public spaces
• Links / footpaths
• Crossings
• Public transport waiting areas
• Interchange spaces
• Public spaces
Pedestrian facilities
Cyclist facilities
Cyclist network
Pedestrian network

Density and Income

Vehicle Ownership and Mode
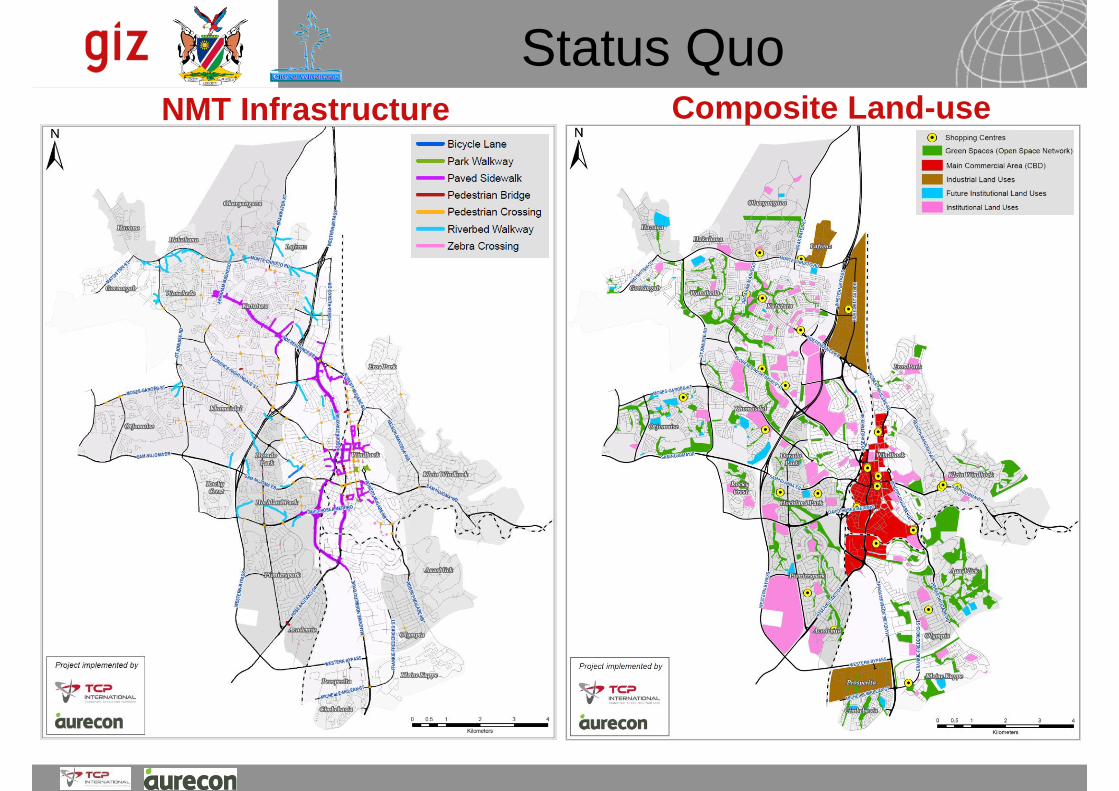
Status Quo NMT Infrastructure Composite Land-use

Principle NMT Network
Possible
Car-free
Zone
Possible
Car-free
Zone
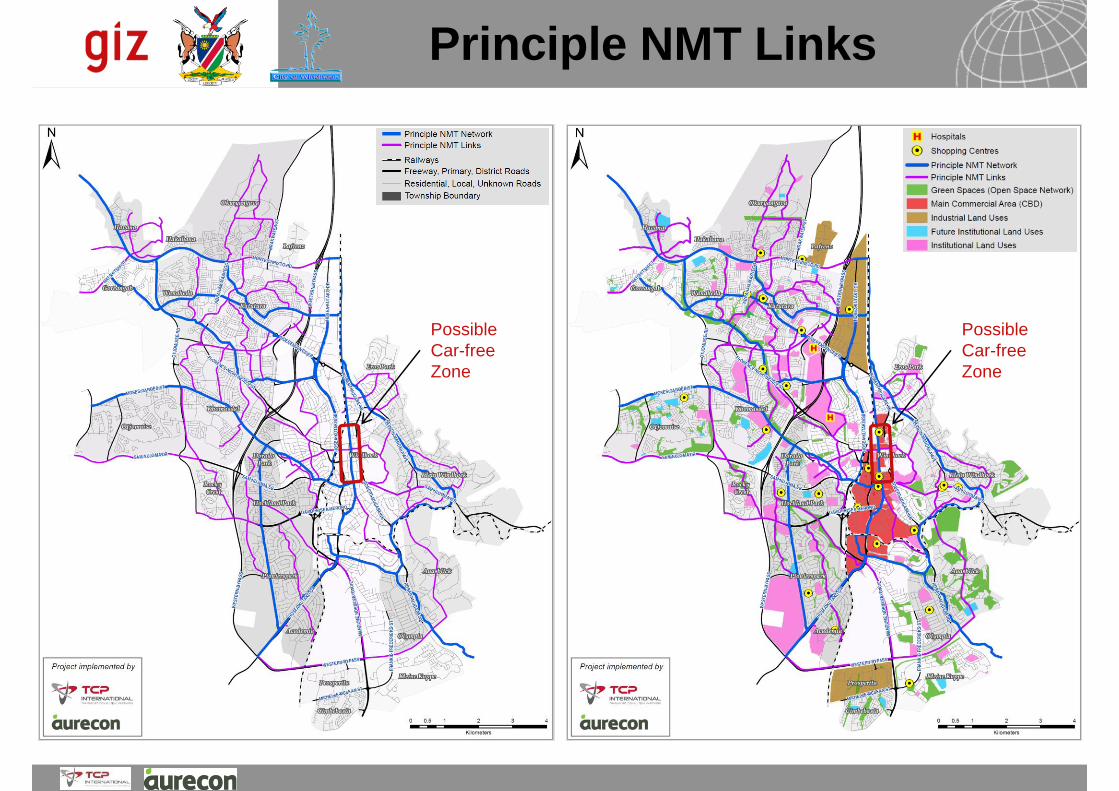
Principle NMT Links
Possible
Car-free
Zone
Possible
Car-free
Zone
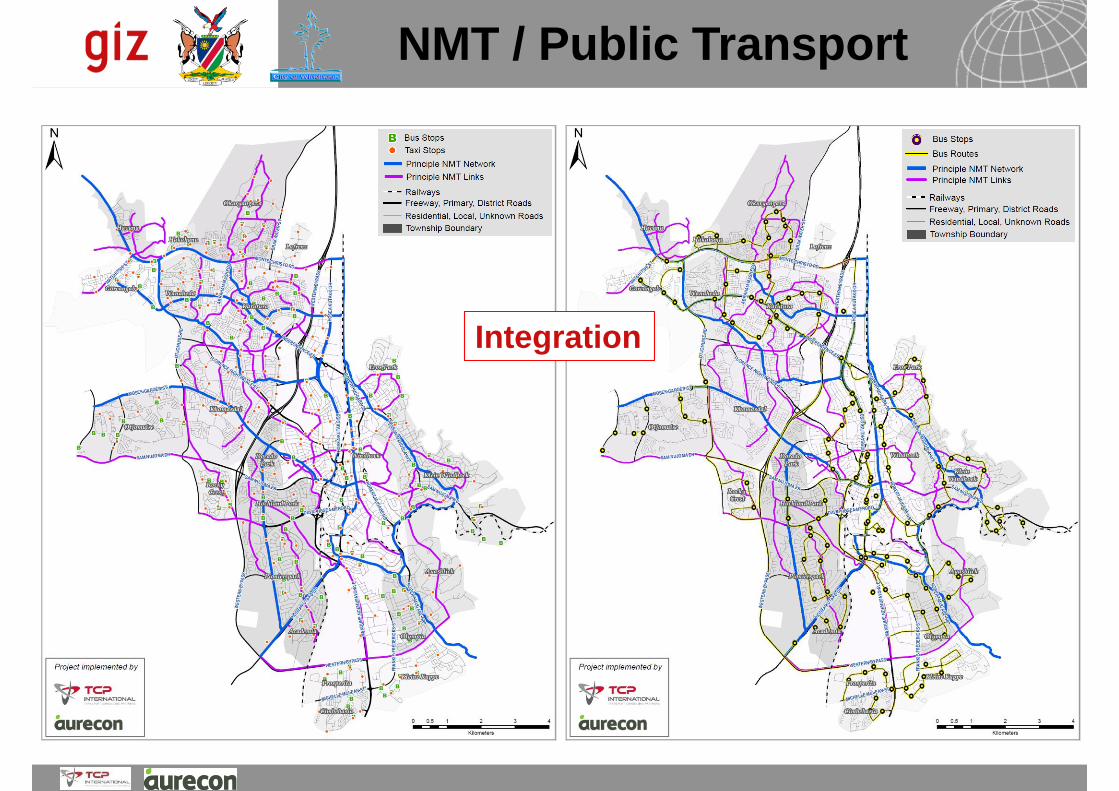
NMT / Public Transport
Integration
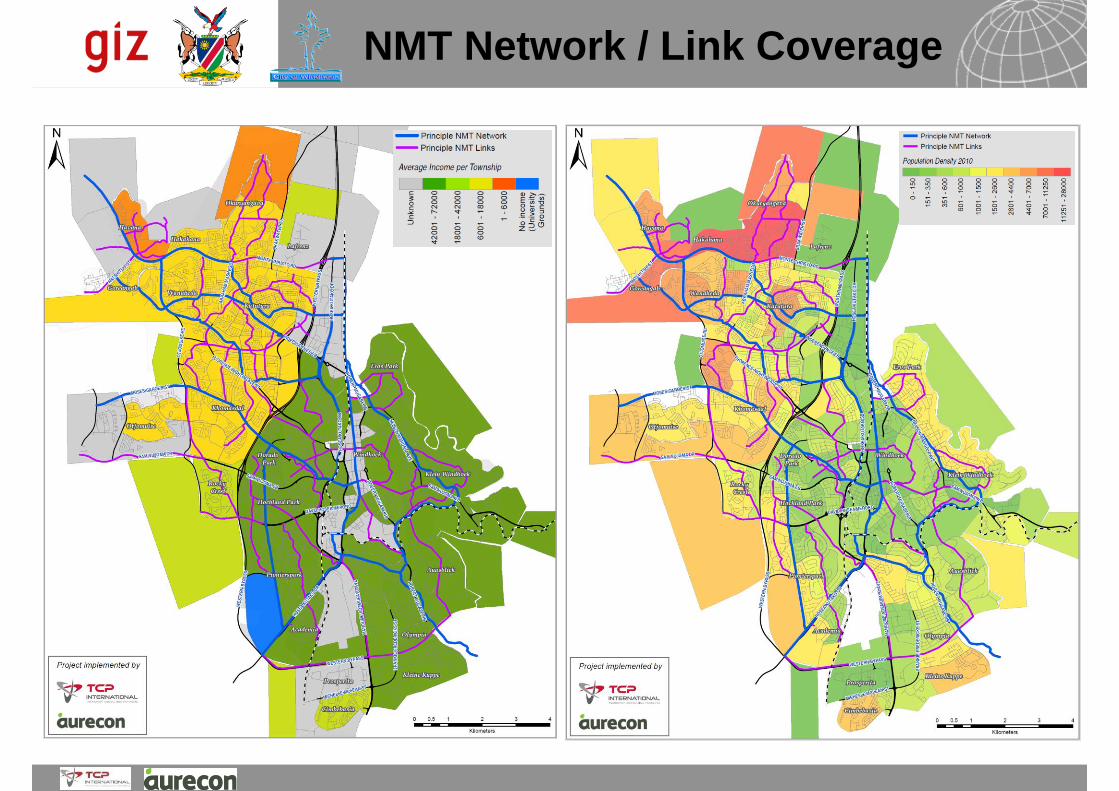
NMT Network / Link Coverage

NMT Network / Link Coverage
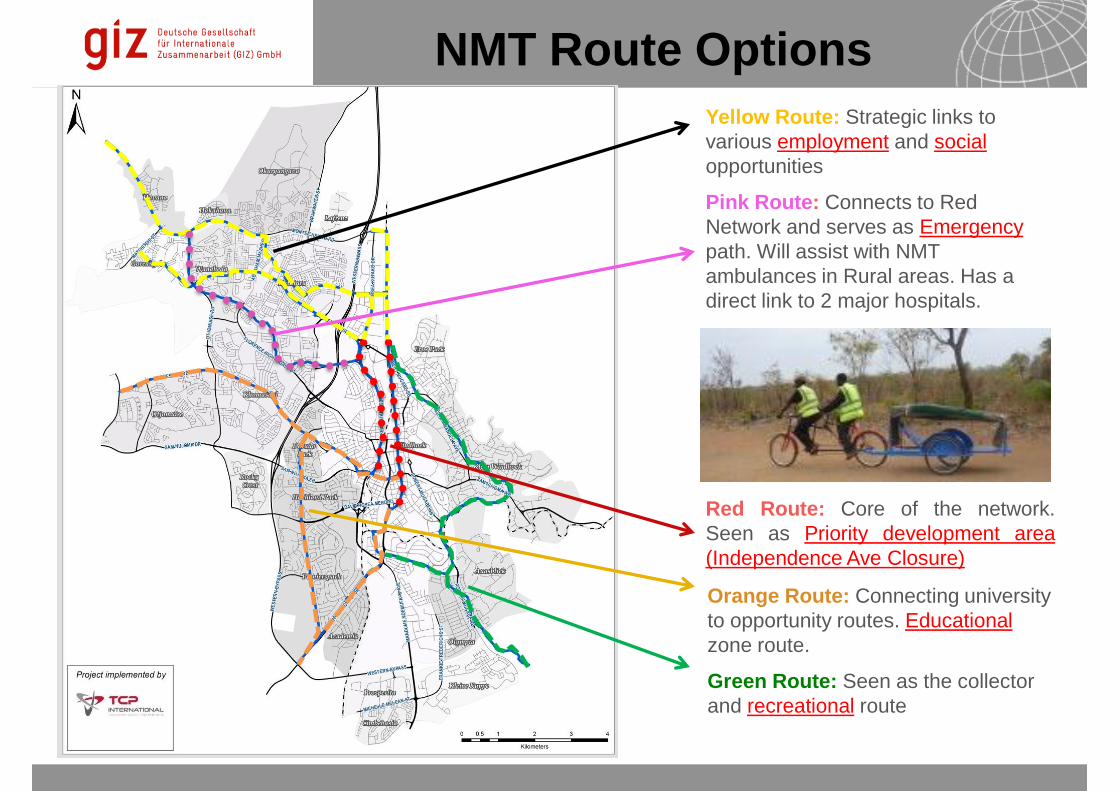
07.11.2012 Seite 16
Red Route: Core of the network.
Seen as Priority development area
(Independence Ave Closure)
Pink Route: Connects to Red
Network and serves as Emergency
path. Will assist with NMT
ambulances in Rural areas. Has a
direct link to 2 major hospitals.
Yellow Route: Strategic links to
various employment and social
opportunities
Orange Route: Connecting university
to opportunity routes. Educational
zone route.
Green Route: Seen as the collector
and recreational route
NMT Route Options

07.11.2012 Seite 17
Bicycle Hierarchy
Bicycle roads
Class I
Independently aligned; typically not provided in road reserve
Class II
Parallel to a street or road;
within road reserve
On-road bicycle lanes
Class III
Marked on road pavement
Class IV
Not specifically marked; shared with other traffic

Class II or III
Class IV
Class I
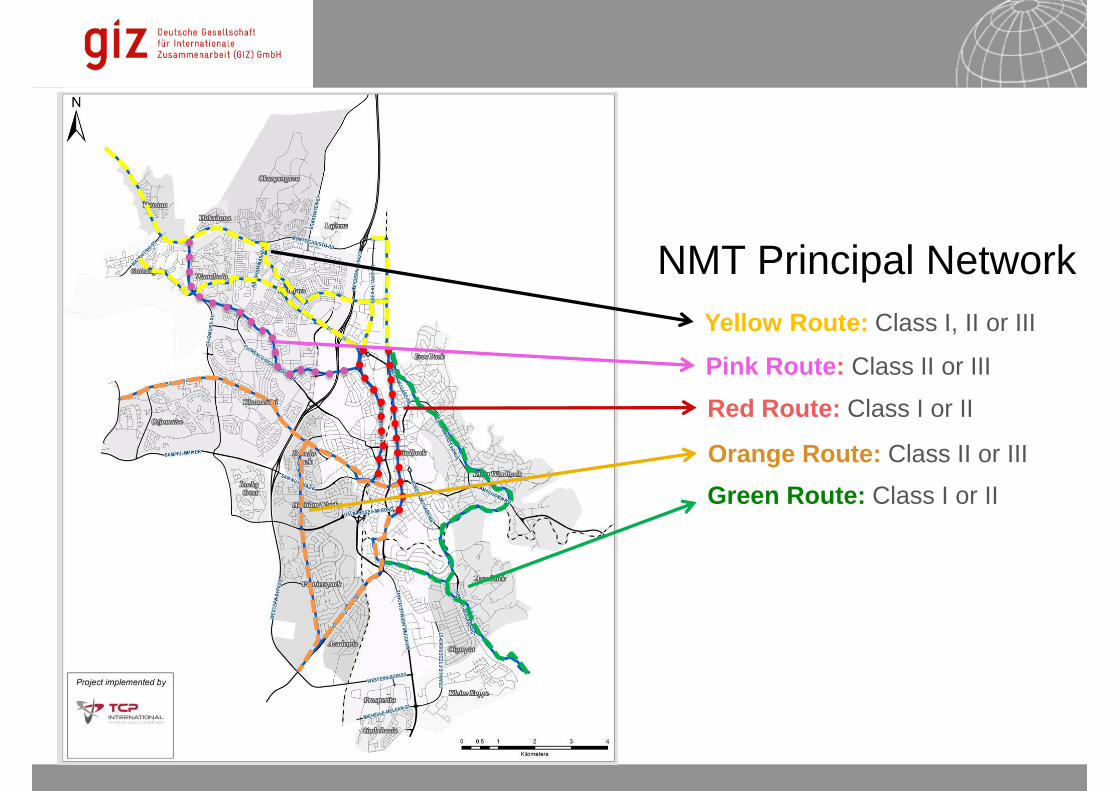
07.11.2012 Seite 19
Red Route: Class I or II
Pink Route: Class II or III
Yellow Route: Class I, II or III
Orange Route: Class II or III
Green Route: Class I or II
NMT Principal Network

NMT facilities for critical land uses
Education
NMT required radius
Pedestrian path
Minimum cycle path provision
On premises
Primary school
500m walking, 2km cycling
Continuous path on one side (min.)
Class I or II
Secure bicycle storage, drinking
fountains
High school
1km walking, 2km cycling
Continuous path on one side (min.)
Class I or II
Secure bicycle storage, drinking
fountains, showers
Tertiary
2km walking, 5km cycling
Continuous path on one side (min.)
Class II or III
Secure bicycle storage, drinking
fountains, showers
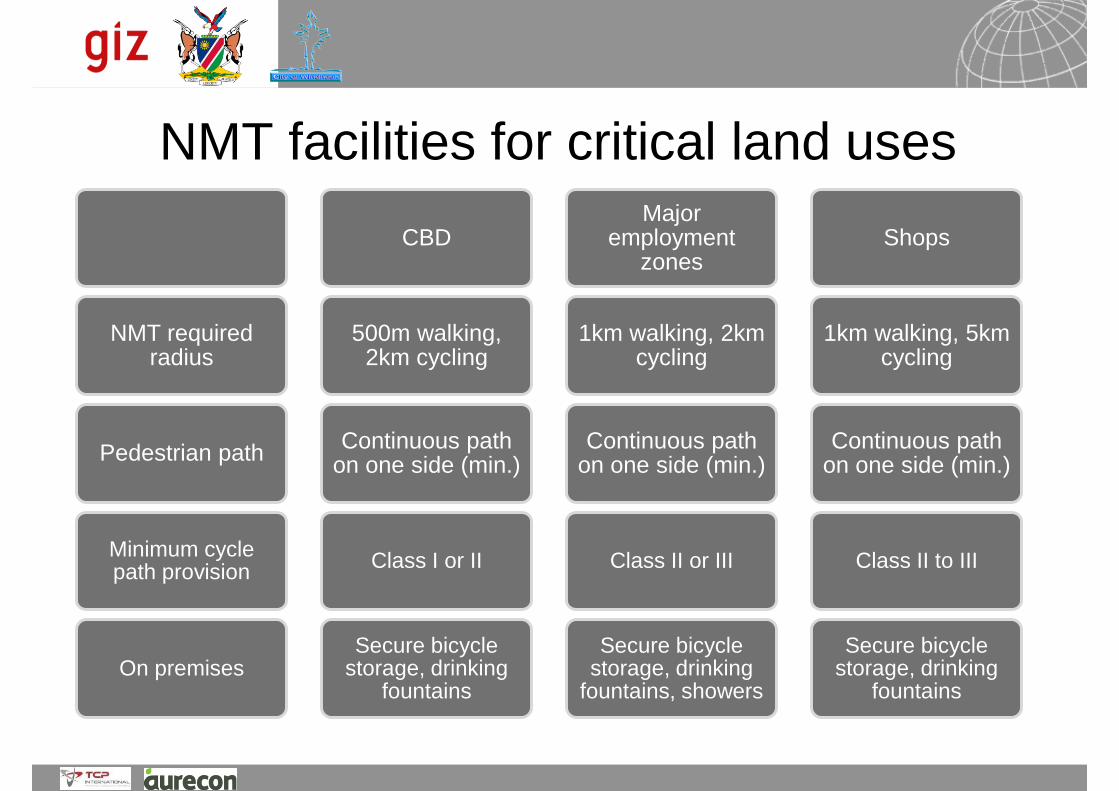
NMT facilities for critical land uses
NMT required radius
Pedestrian path
Minimum cycle path provision
On premises
CBD
500m walking, 2km cycling
Continuous path on one side (min.)
Class I or II
Secure bicycle storage, drinking
fountains
Major employment
zones
1km walking, 2km cycling
Continuous path on one side (min.)
Class II or III
Secure bicycle storage, drinking
fountains, showers
Shops
1km walking, 5km cycling
Continuous path on one side (min.)
Class II to III
Secure bicycle storage, drinking
fountains
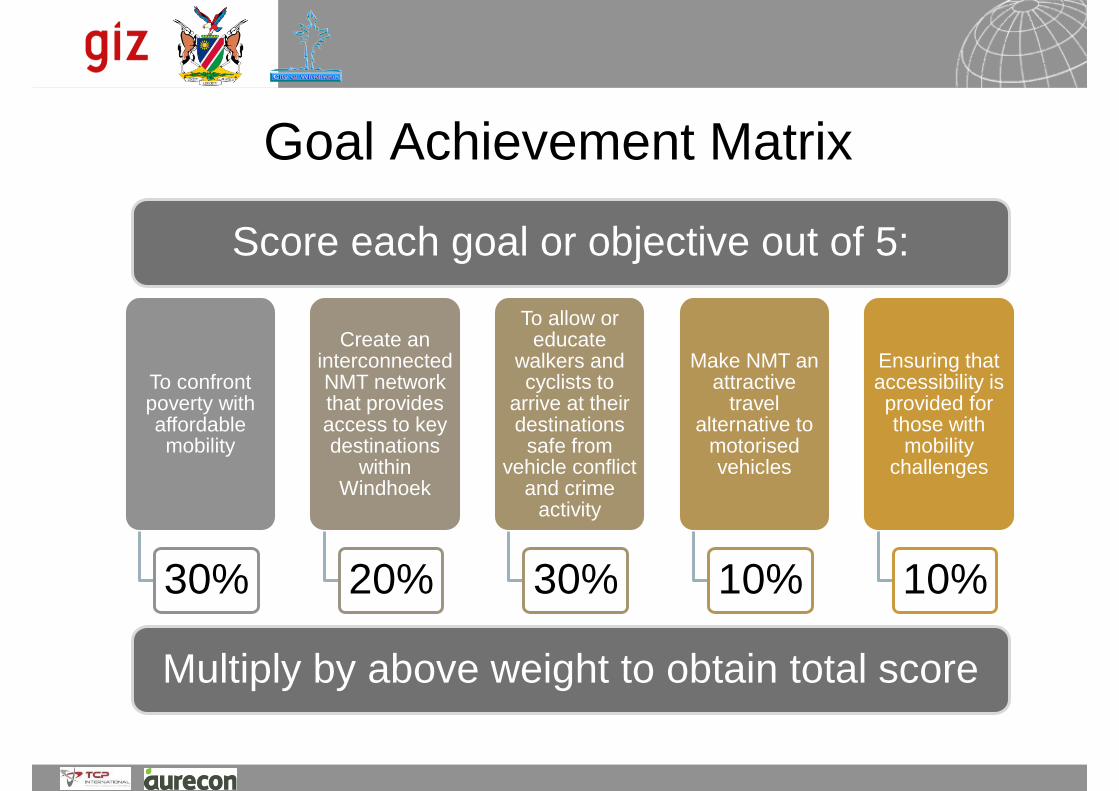
Goal Achievement Matrix
To confront poverty with affordable mobility
30%
Create an interconnected NMT network that provides access to key destinations
within Windhoek
20%
To allow or educate
walkers and cyclists to
arrive at their destinations
safe from vehicle conflict
and crime activity
30%
Make NMT an attractive
travel alternative to
motorised vehicles
10%
Ensuring that accessibility is provided for those with mobility
challenges
10%
Score each goal or objective out of 5:
Multiply by above weight to obtain total score

Principal NMT Network
Route
Total score
Importance
Timeframe
Red route
5
Crucial
Immediate
Pink route
4.8
Crucial
Immediate
Yellow route
4.7
High
Short
Orange route
4.4
High
Short
Green route
3.4
Medium
Medium
Principle Network Priorities

Principal NMT Links
Area
Total score
Importance
Timeframe
Red area
4.8
Crucial
Immediate
Pink area
4.6
High
Short
Yellow area
4.5
High
Short
Orange area
4.2
High
Short
Green area
3
Low
Long
Principle Link Priorities
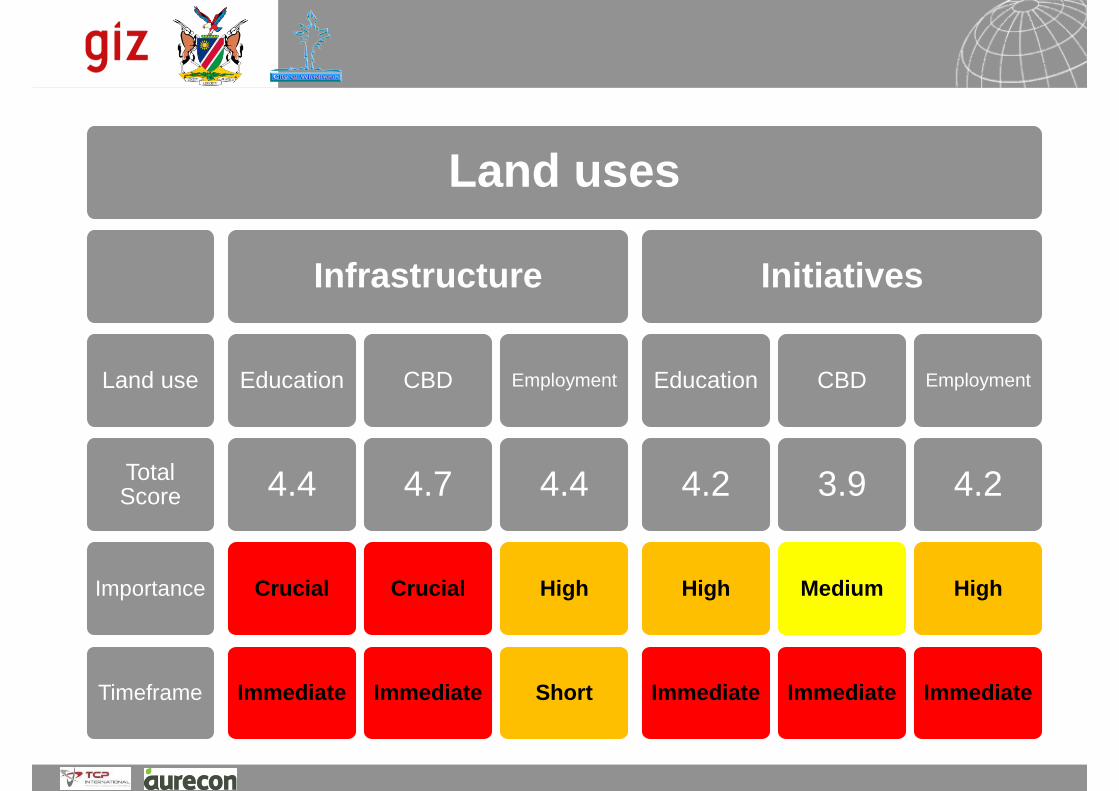
Land uses
Land use
Total Score
Importance
Timeframe
Infrastructure
Education
4.4
Crucial
Immediate
CBD
4.7
Crucial
Immediate
Employment
4.4
High
Short
Initiatives
Education
4.2
High
Immediate
CBD
3.9
Medium
Immediate
Employment
4.2
High
Immediate
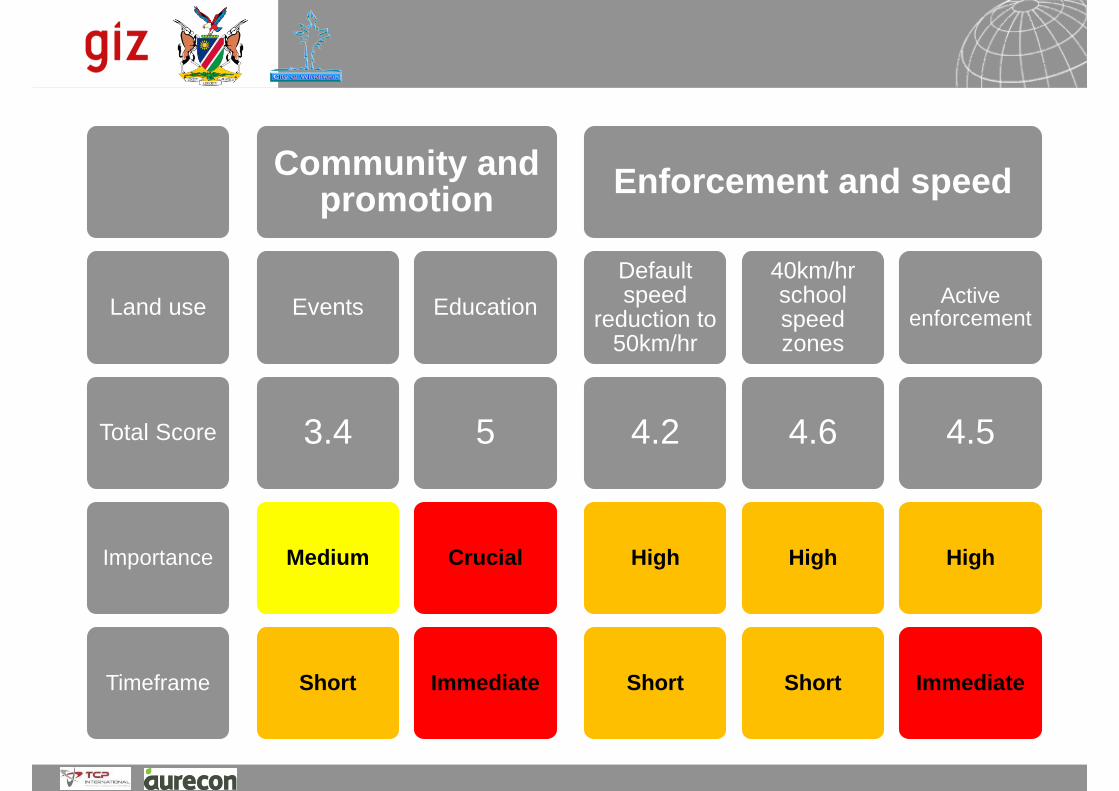
Land use
Total Score
Importance
Timeframe
Community and promotion
Events
3.4
Medium
Short
Education
5
Crucial
Immediate
Enforcement and speed
Default speed
reduction to 50km/hr
4.2
High
Short
40km/hr school speed zones
4.6
High
Short
Active enforcement
4.5
High
Immediate

Options for NMT Promotion
Successful Campaigning
Understand measures that allow movement towards NMT
Understanding the stages of change that takes place for a person to move toward NMT
Understanding the economic context
Reaching the desired target group
Making use of existing campaign examples and comparing them
to the African context
Understand conditions for sustainable campaign
implementation
Understanding what the promotional barriers are
• Newspaper
• Social Media (Blogs,
Facebook, Twitter)
• Radio
• Bill Boards
• Television
• Webpage
• Pamphlets (School
and Work)
Substance
• Content of campaigns
• Vision, mission and objectives
• Target groups
• Intended outcomes
• Implementation criteria
Political
• Bureaucracy and political willingness to:
• Support and implement campaign initiatives
• Endorse campaigns through local policies
• Allocate budgets to assist campaigns
• Create enabling environment for all
stakeholders
Organizational
• Capacity of various planners, designers and executors to implement
campaign
• Institutional and technical knowledge
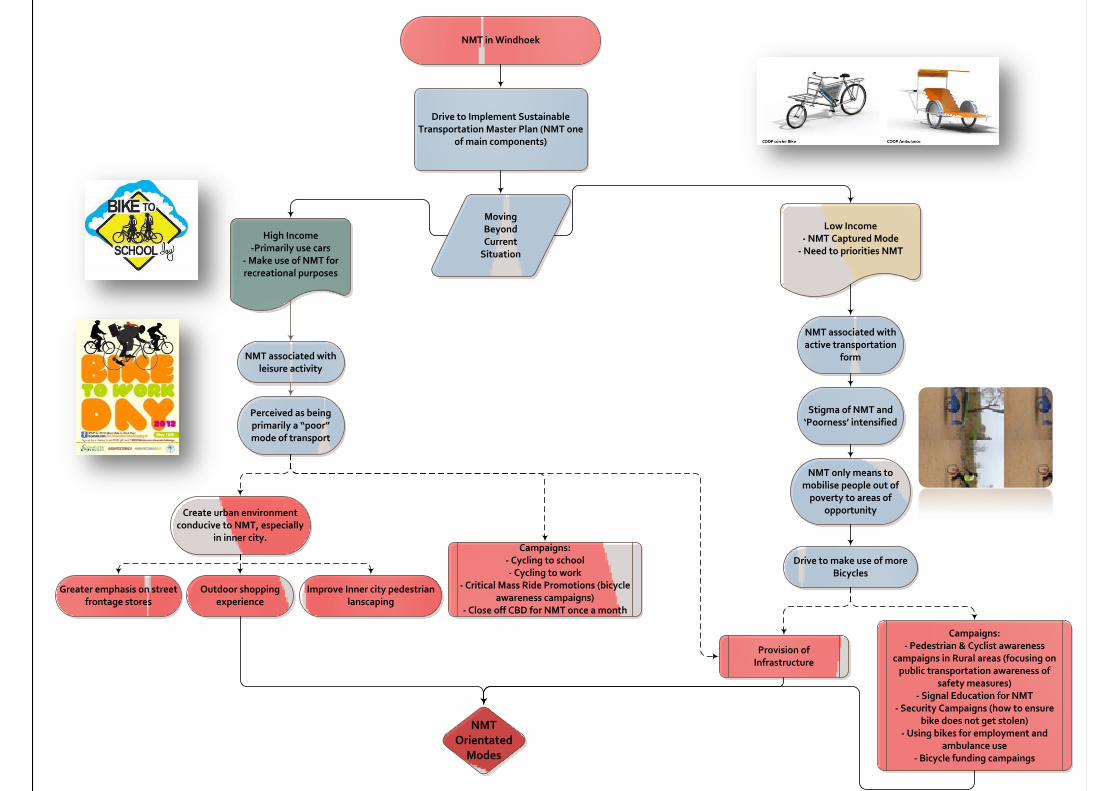
NMT in Windhoek
High Income-Primarily use cars
- Make use of NMT for recreational purposes
Low Income - NMT Captured Mode
- Need to priorities NMT
Perceived as being primarily a “poor” mode of transport
NMT associated with active transportation
form
NMT only means to mobilise people out of
poverty to areas of opportunity
Stigma of NMT and ‘Poorness’ intensified
Drive to make use of more Bicycles
Outdoor shopping experience
Drive to Implement Sustainable Transportation Master Plan (NMT one
of main components)
Moving Beyond Current
Situation
NMT associated with leisure activity
Create urban environment conducive to NMT, especially
in inner city.
Greater emphasis on street frontage stores
Improve Inner city pedestrian lanscaping
Campaigns:- Pedestrian & Cyclist awareness
campaigns in Rural areas (focusing on public transportation awareness of
safety measures)- Signal Education for NMT
- Security Campaigns (how to ensure bike does not get stolen)
- Using bikes for employment and ambulance use
- Bicycle funding campaings
Provision of Infrastructure
NMT Orientated
Modes
Campaigns:- Cycling to school- Cycling to work
- Critical Mass Ride Promotions (bicycle awareness campaigns)
- Close off CBD for NMT once a month

Development of a core
network of continuous
bicycling links.
Safe pedestrian access to
all service centres and bus
stops
Establishment of intermodal
facilities for NMT at major
PT stops
Conduct promotional
activities for NMT
Convert Independence
Avenue into a car-free
zone.
Summary of Options
Possible
Car-free
Zone

07.11.20
12
Thank you for your attention

07.11.2012 Seite 1
Preparatory Meeting for the Strategic Decision Making Workshop
Sustainable Urban Transport Master Plan
Transport Management including
Safety Enhancement
6th of November 2012

07.11.2012 Seite 2 Page 2
What is Traffic Management /Traffic Demand Management?
07.11.2012
TDM refers to transport strategies
which encourage efficient,
sustainable transport.
It aims to:
reduce private vehicle trips;
specifically that of single-
occupancy vehicles;
change travel demand – in terms
of mode and time; and
provides options for person trip
demand.
Gives priority to the use of public
transport and NMT, whilst
constraining private vehicle
usage.
A TDM approach to
transport can deliver
a cost-effective
alternative to
increasing capacity,
improving
environmental
outcomes, road
safety, resulting in
more prosperous and
liveable cities.

07.11.2012 Seite 3 Page 3
Possible TM Options Demand side measures:
ensure better usage of existing road
capacities and restrict access to urban space / urban roads for unsustainable or unsafe
usage
• On-road Travel Information
• Network TDM capacity improvements
• Work schedules
• Parking management / Parking Supply Limitations
• Access restriction / access control, e.g. private vehicle restriction zones, freeway ramp control, HOV lanes
• Ride-share programmes
• Intersection control, intersection design, traffic signal settings
• Taxation policy e.g. on car purchases, fuels, vehicle registration tax
• Shadow tolls, road pricing, congestion pricing
• Tele-commuting, conferencing and education
• Freight management
• Land use / Zoning policies
• In vehicle travel
Supply side measures:
expand the supply, availability, attractiveness, safety and security of the more sustainable
modes
• Connector / Feeder Services
• Uninterrupted non-motorised transport facilities
• Bike share systems
• Dense public transport network
• Improved public transport service (optimal time table, punctuality, attractive tariffs, safety and security, comfort, clean vehicles)
• User-friendly stations and easy transfers between modes
• Park-and-Ride / Bike-and-ride
• Marketing measures to influence traffic behaviour and NMT and PT image
• Public transport subsidies
• Pre-Trip Travel Information
07.11.2012

07.11.2012 Seite 4 Page 4
Impact of TM measures
07.11.2012
Implement TDM Mechanism # 1
Implement TDM Mechanism #2
Implement TDM Mechanism #3
Time
Desired Level of Service
Traffic Congestion
Reduction in Level of
service
Improved Level of Service

07.11.2012 Seite 5 Page 5
Effectiveness of selected TDM measures
07.11.2012
Supply Side Management
De
ma
nd
Sid
e M
an
ag
em
en
t
· Congestion Pricing
Hig
h Im
pa
ct
(re
du
ce
trip
s o
r
sig
nific
an
t m
od
al sh
ift)
Lo
w Im
pa
ct
(M
inim
al tr
ip r
ed
uctio
n
or
mo
da
l sh
ift)
Low Impact (Minimal reduction infrastructure
provision)
High Impact (Major reduction infrastructure
provision)
· Travel pricing
· Parking management
· Work schedules
· Ride share
programmes
· Land use and zoning
policies
· Private vehicle
restriction zones
· Taxation policies
· Transit subsidies
· Tele-commuting,
conferencing and
education
· Pre-trip traveller
information
· Improved public transport
service/ image
· Shadow tolling
· Parking supply
limitations
· In vehicle travel
information
· On road travel
information · Freeway ramp control
· Traffic signal settings
· Network TDM capacity
improvements
· HOV lanes
· Park and ride
· Connector/feeder
services
· NMT facilities
· Supply side TDM measures · Demand Side TDM Measures
· Freight management
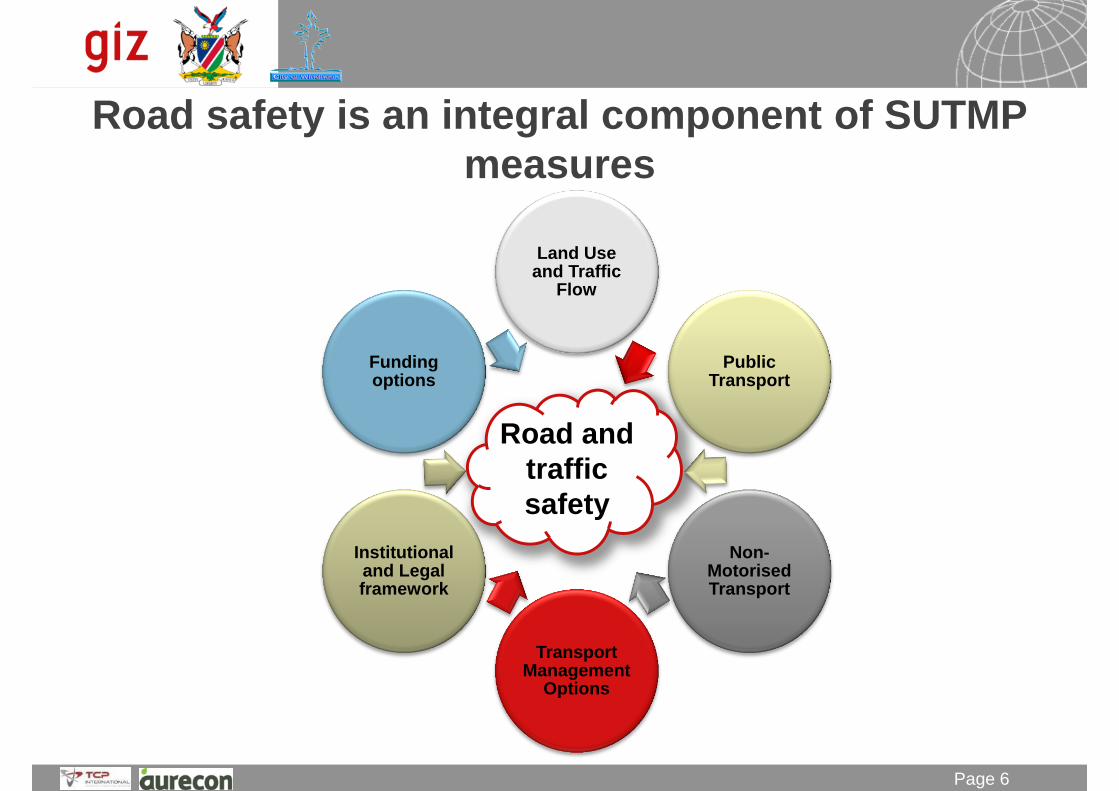
07.11.2012 Seite 6 Page 6
Road and
traffic
safety
Land Use and Traffic
Flow
Public Transport
Non-Motorised Transport
Transport Management
Options
Institutional and Legal framework
Funding options
Road safety is an integral component of SUTMP
measures
07.11.2012

07.11.2012 Seite 8 Page 8
Regional Roads with the highest number of accidents (normalised per km, 2007-2009)

07.11.2012 Seite 9 Page 9 07.11.2012
Roads with the
highest number of
fatalities (2007-2009)
Areas with the
highest number of
fatalities (2007-2009)
Road safety – the current reality in the study area

07.11.2012 Seite 10 Page 10
Road safety – the current reality in the study area
07.11.2012
50% of all Namibian accidents occur in Khomas
50% of all accidents Khomas involves pedestrians
The suburbs with the most accidents are the CBD, the greater Katatura and Khomasdal.
The number of fatalities per suburb correlates with the suburbs where the hightest number of pedestrians can
be expected
Source: Transport Safety Plan for the Khomas Region

07.11.2012 Seite 11 Page 11
Several TM strategic options fit also in the
Namibian Road Safety Strategy
Functional Programme Strategic Goals
Functional Programme Areas
NRSS Action Plan:
30% reduction in Casualties by 2015
50% reduction in Casualties by 2030
Safer Road Users
Improved Road User Behaviour
Safer Vehicles
Improved Vehicle Safety
Safer Roads
Improved Safety of Road Infrastructure
and Road Environment
Trauma Response
Improved Trauma
Care and Medical
Emergency Services
Administration, Research and
Legislation
Improved Organisational
set-up, Administration
and Information Management
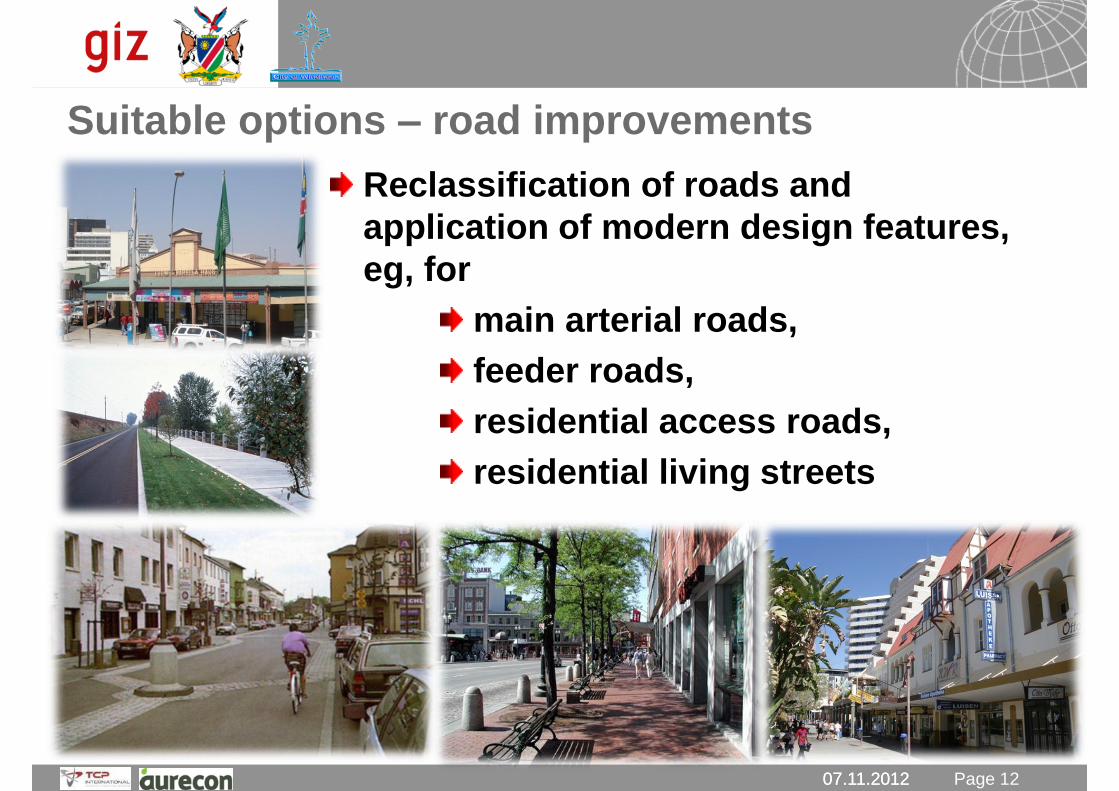
07.11.2012 Seite 12 Page 12 07.11.2012 07.11.2012
Suitable options – road improvements
Reclassification of roads and
application of modern design features,
eg, for
main arterial roads,
feeder roads,
residential access roads,
residential living streets

07.11.2012 Seite 13 Page 13 07.11.2012
Suitable options for modern road design features
Roadway designs that reduce
traffic speeds (different
design speeds for different
road categories)
Segregated bicycle lanes
when car traffic has high
speeds
Integrated bicycle lanes
where vehicles travel at low
speeds
Speed limits according to
road classes
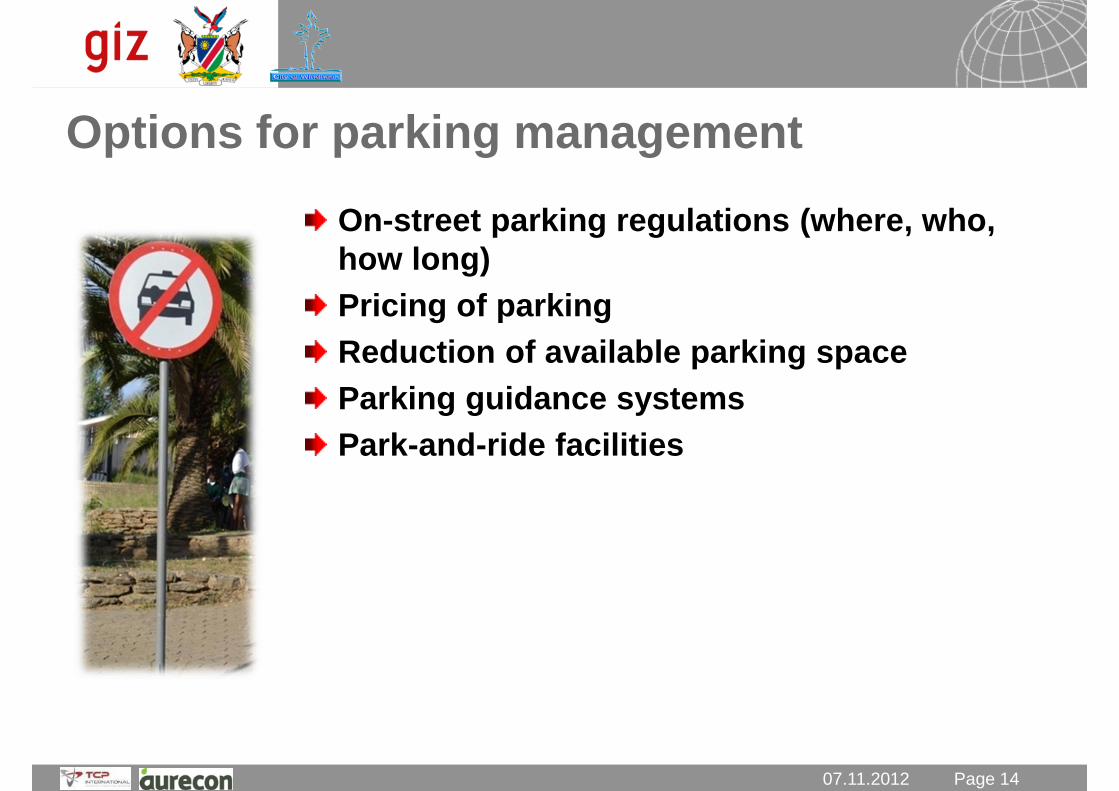
07.11.2012 Seite 14 Page 14 07.11.2012
Options for parking management
On-street parking regulations (where, who,
how long)
Pricing of parking
Reduction of available parking space
Parking guidance systems
Park-and-ride facilities

07.11.2012 Seite 15 Page 15 07.11.2012
Suitable options I – transit priority
Reserved lanes
Turn restrictions
Reduced on-street parking
Enforcement
Ease of modal transfers

07.11.2012 Seite 16 Page 16 07.11.2012
Use of “signal priority” for
Public Transport (ie, installing
a system in which a
transmitter signals to traffic
lights upon a bus’s approach,
keeping green lights green or
changing red lights to green)
Suitable options II – transit priority
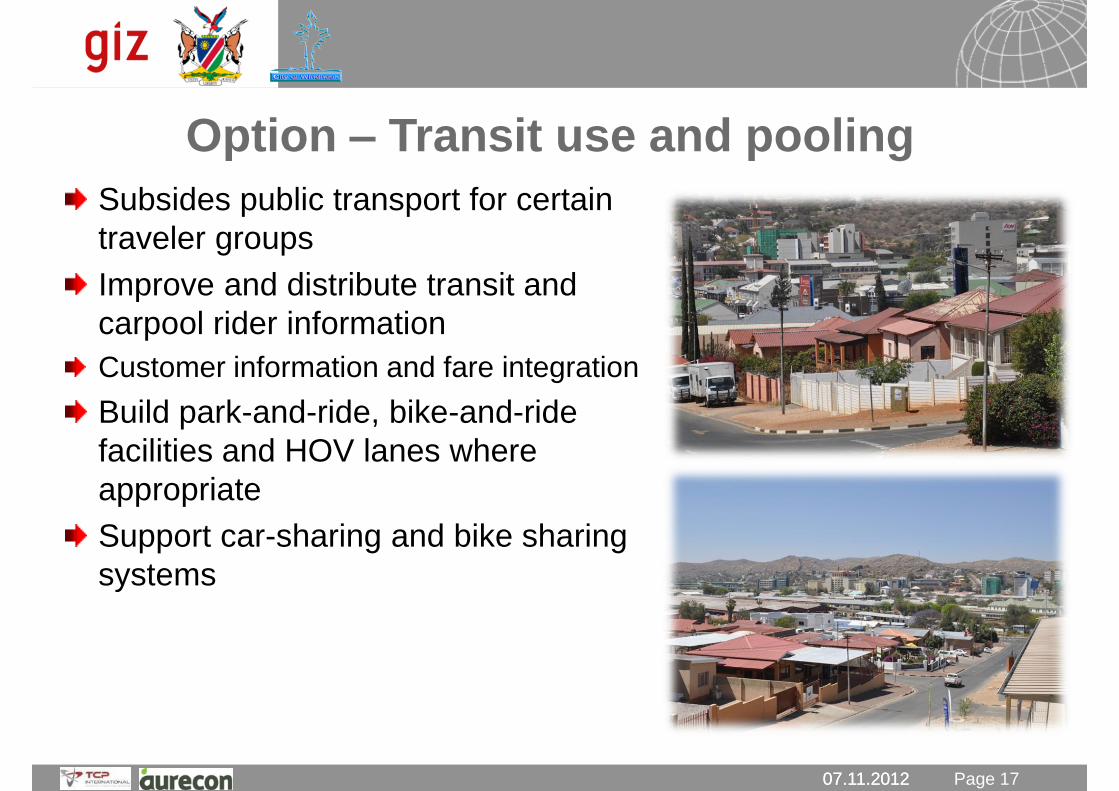
07.11.2012 Seite 17 Page 17 07.11.2012
Option – Transit use and pooling
07.11.2012
Subsides public transport for certain
traveler groups
Improve and distribute transit and
carpool rider information
Customer information and fare integration
Build park-and-ride, bike-and-ride
facilities and HOV lanes where
appropriate
Support car-sharing and bike sharing
systems

07.11.2012 Seite 18 Page 18 07.11.2012
Suitable options to integrate taxis/minibus
Integrate taxi/minibus into overall PT
system as provider of feeder service
Optimised taxi ranks and off-loading
zones and new zoning
Vehicle renewal schemes with low
emission and noise
Better regulation and education
Extended service hours
Easy to board and alight for mobility
restricted persons
Defined access (eg. secondary arterials,
shared use with bus lanes)
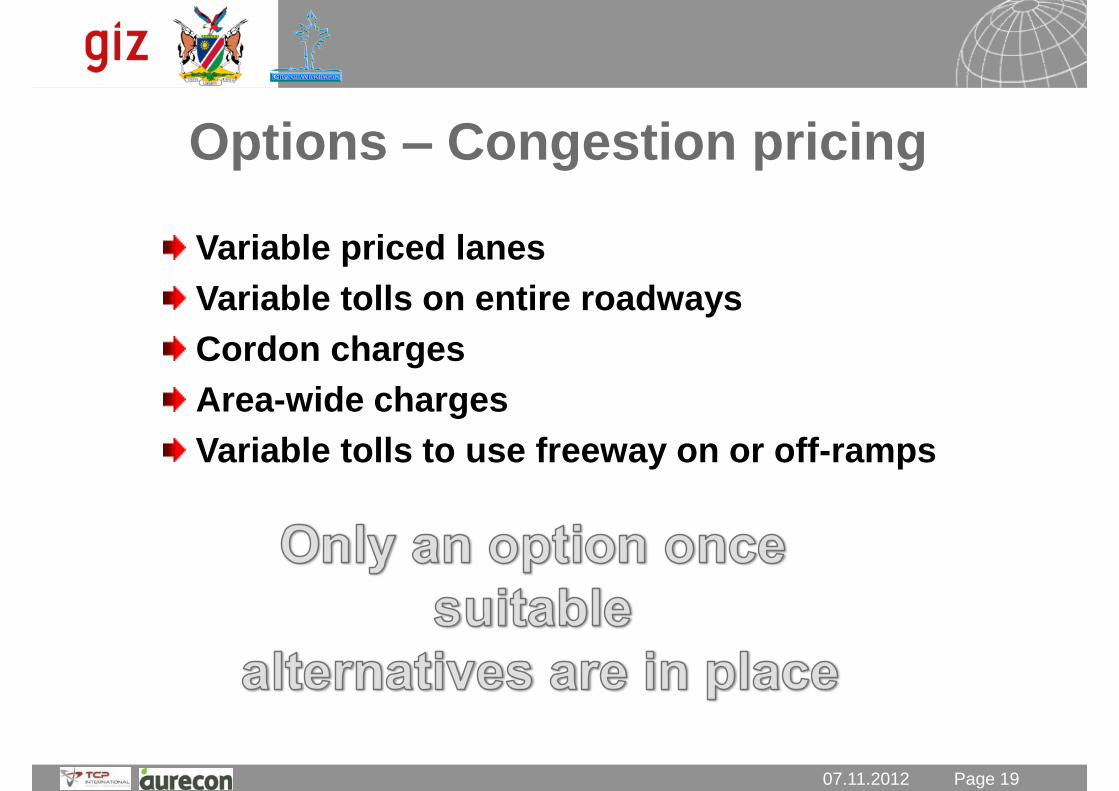
07.11.2012 Seite 19 Page 19 07.11.2012
Options – Congestion pricing
Variable priced lanes
Variable tolls on entire roadways
Cordon charges
Area-wide charges
Variable tolls to use freeway on or off-ramps

07.11.2012 Seite 20 Page 20 07.11.2012
Thank you for your attention

07.11.2012 Seite 1
Preparatory Meeting for the Strategic Decision Making Workshop
Sustainable Urban Transport Master Plan
Institutional, Legal and Funding Options Angelika Zwicky, Dr. Kenneth Odero, 6th of November 2012
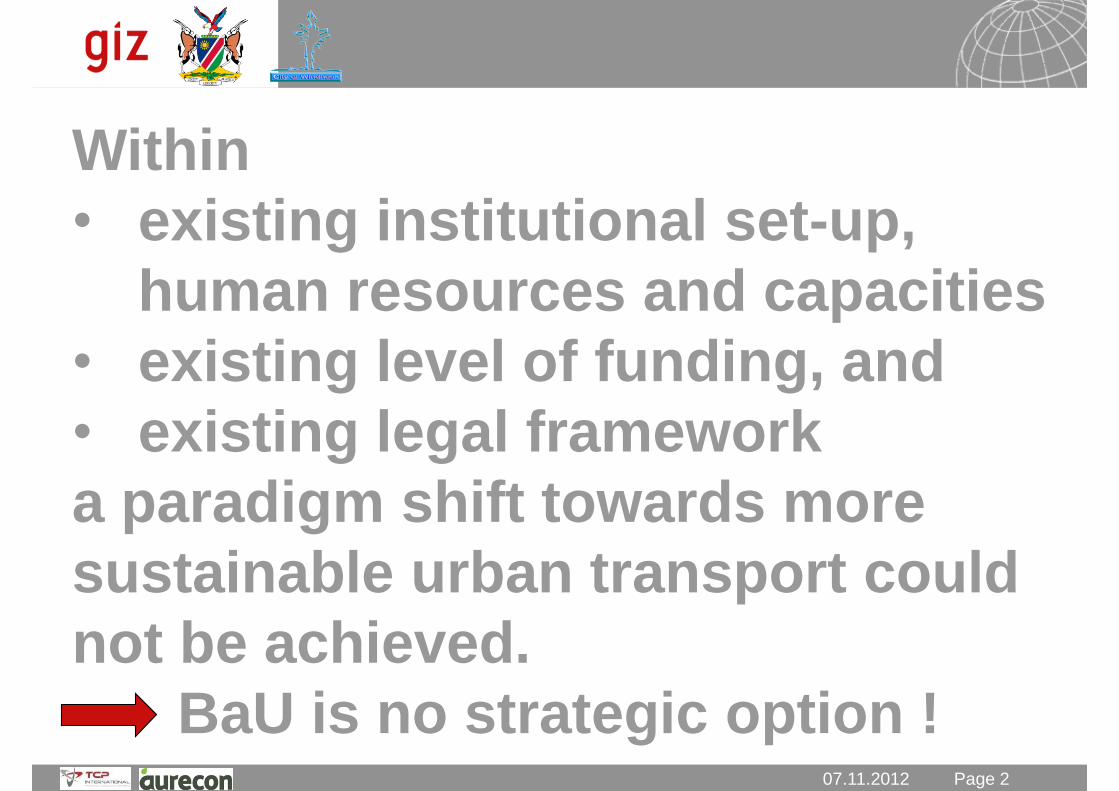
07.11.2012 Seite 2 Page 2 07.11.2012
Within
• existing institutional set-up,
human resources and capacities
• existing level of funding, and
• existing legal framework
a paradigm shift towards more
sustainable urban transport could
not be achieved.
BaU is no strategic option !
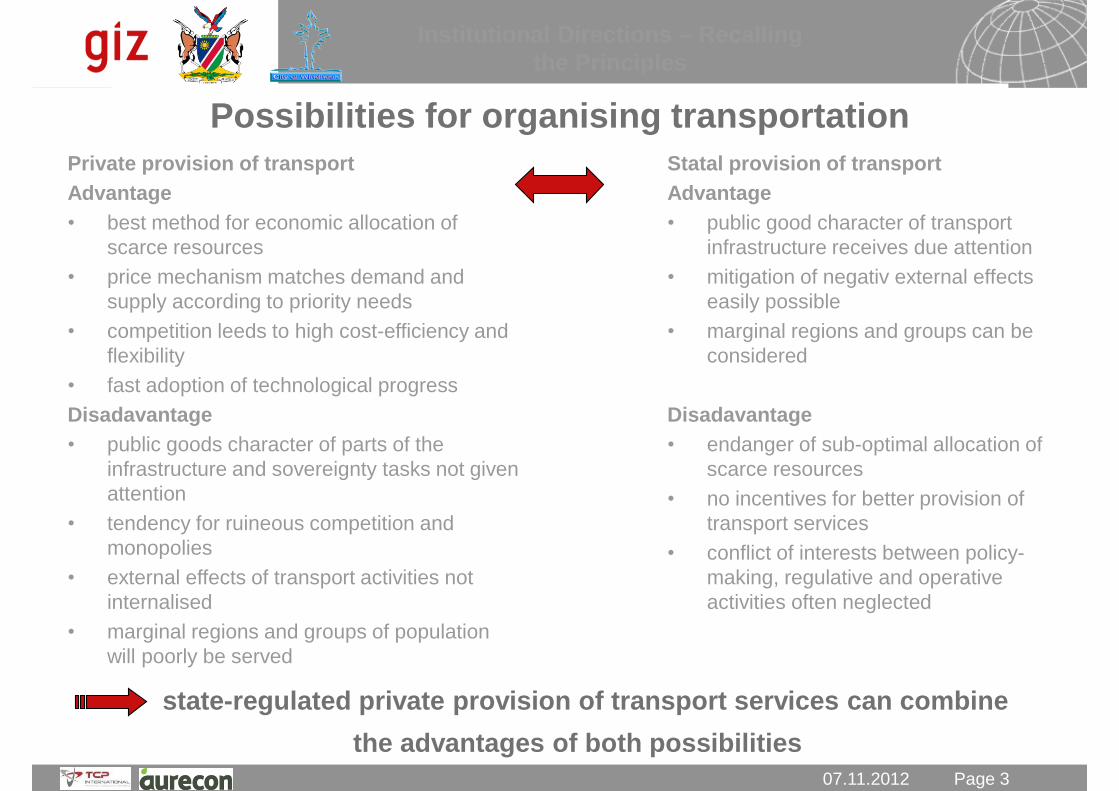
07.11.2012 Seite 3 Page 3 07.11.2012
Possibilities for organising transportation
Statal provision of transport
Advantage
• public good character of transport
infrastructure receives due attention
• mitigation of negativ external effects
easily possible
• marginal regions and groups can be
considered
Disadavantage
• endanger of sub-optimal allocation of
scarce resources
• no incentives for better provision of
transport services
• conflict of interests between policy-
making, regulative and operative
activities often neglected
Private provision of transport
Advantage
• best method for economic allocation of
scarce resources
• price mechanism matches demand and
supply according to priority needs
• competition leeds to high cost-efficiency and
flexibility
• fast adoption of technological progress
Disadavantage
• public goods character of parts of the
infrastructure and sovereignty tasks not given
attention
• tendency for ruineous competition and
monopolies
• external effects of transport activities not
internalised
• marginal regions and groups of population
will poorly be served
state-regulated private provision of transport services can combine
the advantages of both possibilities
Institutional Directions – Recalling
the Principles
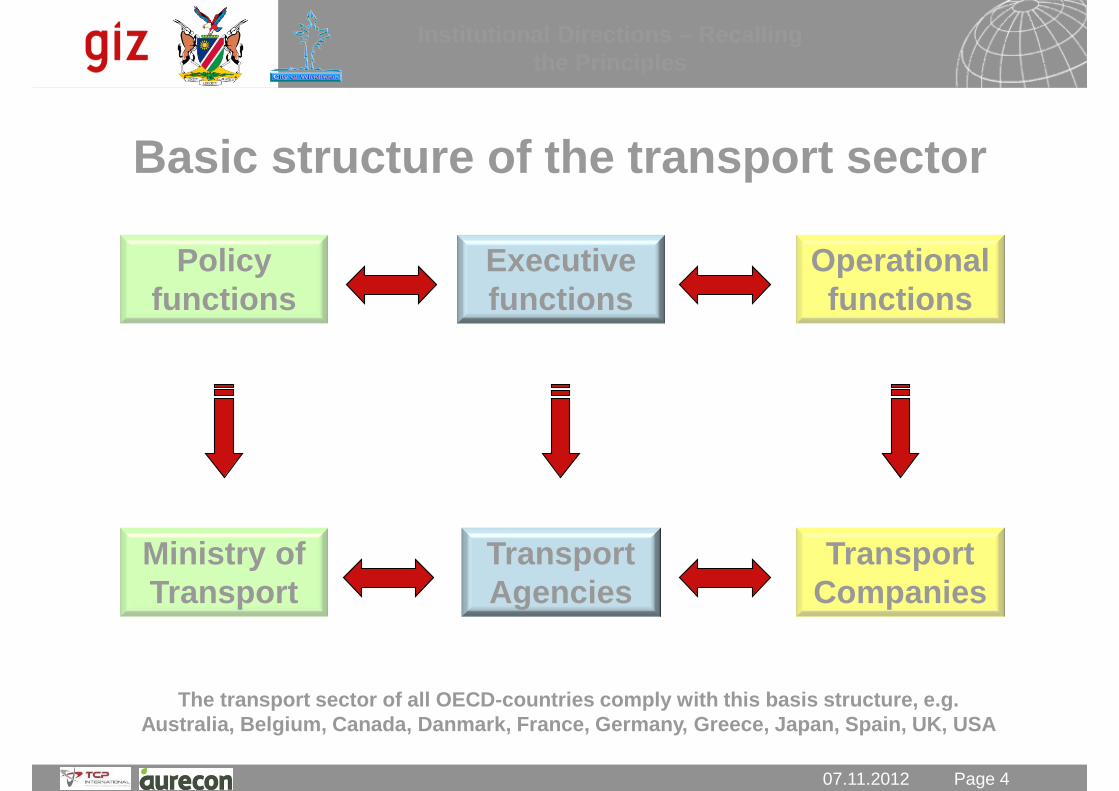
07.11.2012 Seite 4 Page 4 07.11.2012
Policy
functions
Executive
functions
Operational
functions
Ministry of
Transport
Transport
Agencies
Transport
Companies
Basic structure of the transport sector
The transport sector of all OECD-countries comply with this basis structure, e.g.
Australia, Belgium, Canada, Danmark, France, Germany, Greece, Japan, Spain, UK, USA
Institutional Directions – Recalling
the Principles
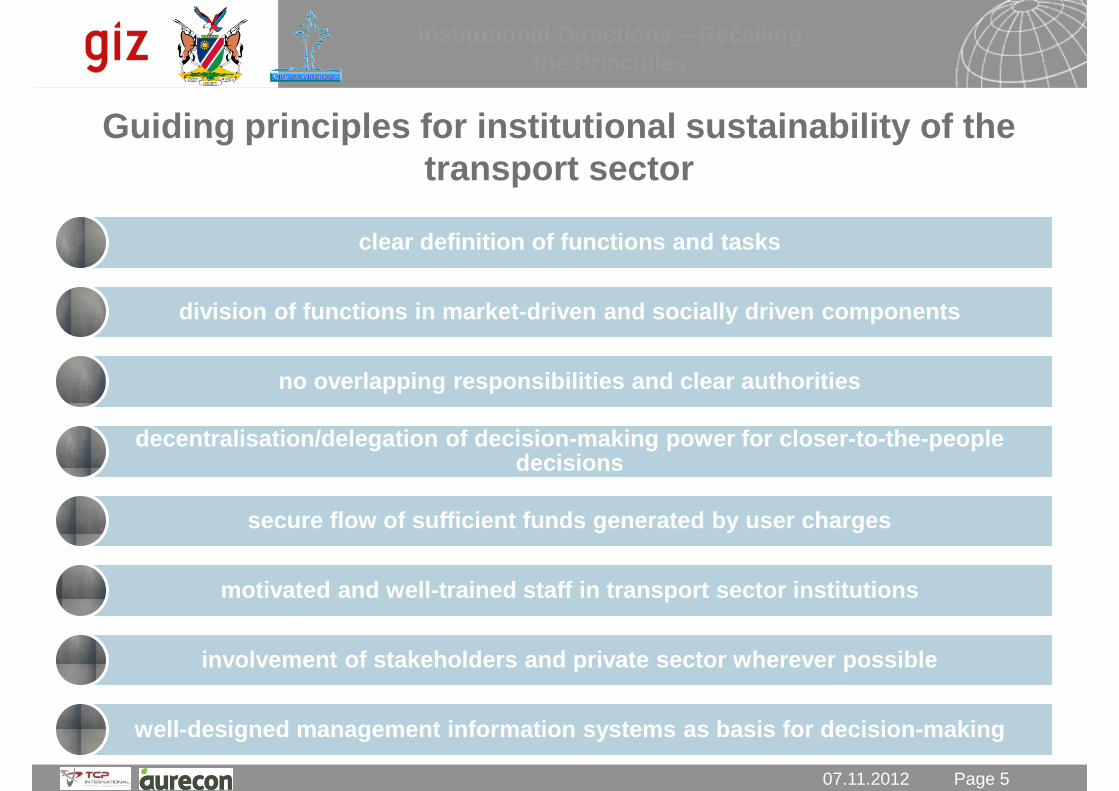
07.11.2012 Seite 5 Page 5 07.11.2012
Guiding principles for institutional sustainability of the
transport sector
clear definition of functions and tasks
division of functions in market-driven and socially driven components
no overlapping responsibilities and clear authorities
decentralisation/delegation of decision-making power for closer-to-the-people decisions
secure flow of sufficient funds generated by user charges
motivated and well-trained staff in transport sector institutions
involvement of stakeholders and private sector wherever possible
well-designed management information systems as basis for decision-making
Institutional Directions – Recalling
the Principles

07.11.2012 Seite 6 Page 6 07.11.2012
policy
level
executive
functions
provision
of transport
Transport Authority / Agency / Departments
Public and Private rail and road-based Transport Providers
Desired level and quality
MT, NMT and PT services
Provision of desired,
services
Institutional Directions
Strategic Options to be decided upon
Cow Khomas
Region
MWT MLRGHD Okahan-
dja
Reho-
both
Interest
Groups
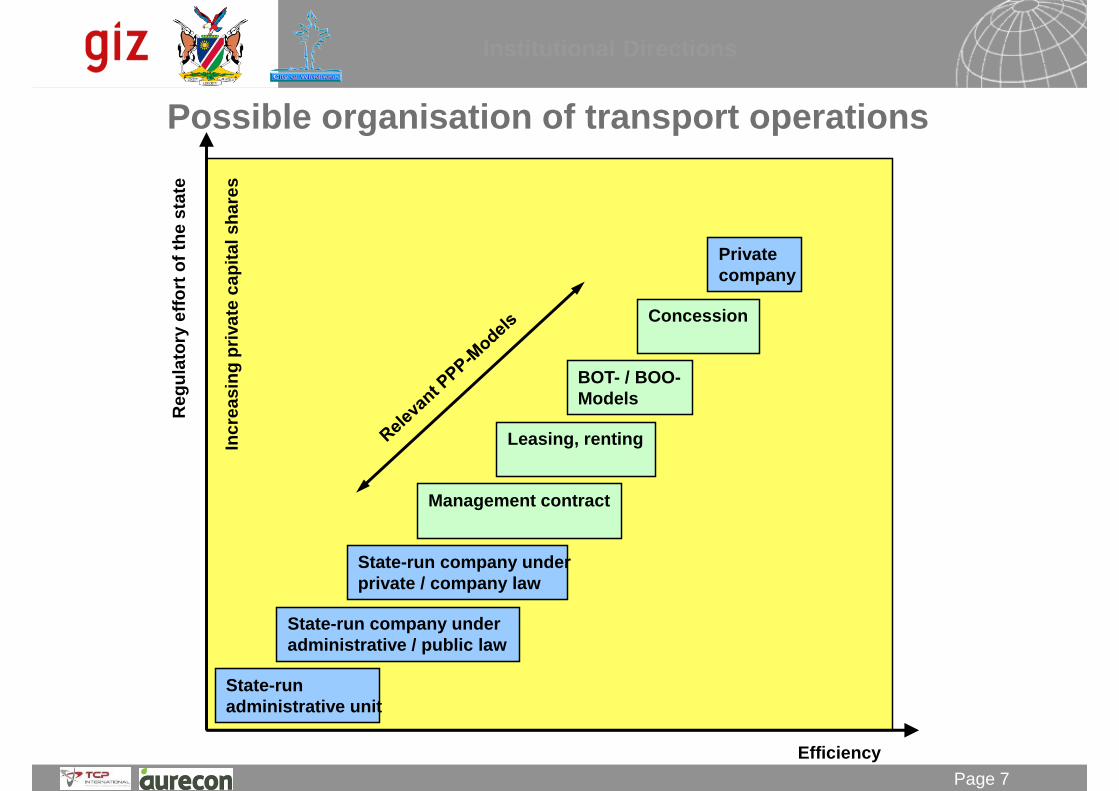
07.11.2012 Seite 7 Page 7
07.11.2012
Possible organisation of transport operations
Efficiency
Re
gu
lato
ry e
ffo
rt o
f th
e s
tate
State-run
administrative unit
State-run company under
administrative / public law
State-run company under
private / company law
Management contract
Leasing, renting
BOT- / BOO-
Models
Concession
Private
company
Inc
rea
sin
g p
riva
te c
ap
ita
l s
ha
res
Institutional Directions

07.11.2012 Seite 8 Page 8 07.11.2012
There are numerous examples for the
institutional set-up of urban transport.
But
The success of an institutional and
organisational structure is measured in terms of
its results.
What brings good results within one city does
not necessarily bring the same results in another
political and institutional culture.
Institutional Directions

07.11.2012 Seite 9 Page 9 07.11.2012
Possible Strategic Directions for the policy and executive functions
• Strengthen the NMT planning function within existing MWT and CoW road and traffic planning divisions
• Further enhancing cooperation between land-use and transport planning (MT; NMT; PT)
• Strengthen the PT service planning and PT regulatory functions including taxi regulation
• Expanding PT services within existing division of CoW
• Maintaining self-regulating rail company TransNamib and amend task description of TransNamib by commuter and eventually railbound PT systems.
• Maintaining safety monitoring for infrastructure, vehicles and drivers within traffic police and road administration
Strategic Direction 1 -
Strengthening of existing
institutional set-up
Fast and easy
implementation
Minimum changes in legal
and funding framework
required
Organisational behavior might be persistent
Easy political interference in day-to-day management
might cause «muddling through»
Low Image of PT and NMT in existing institutional
set-up will be hard to overcome
Intensive training requirements
Funding options restricted mainly to budgetary
funding incl. general PT deficit coverage
Institutional Directions
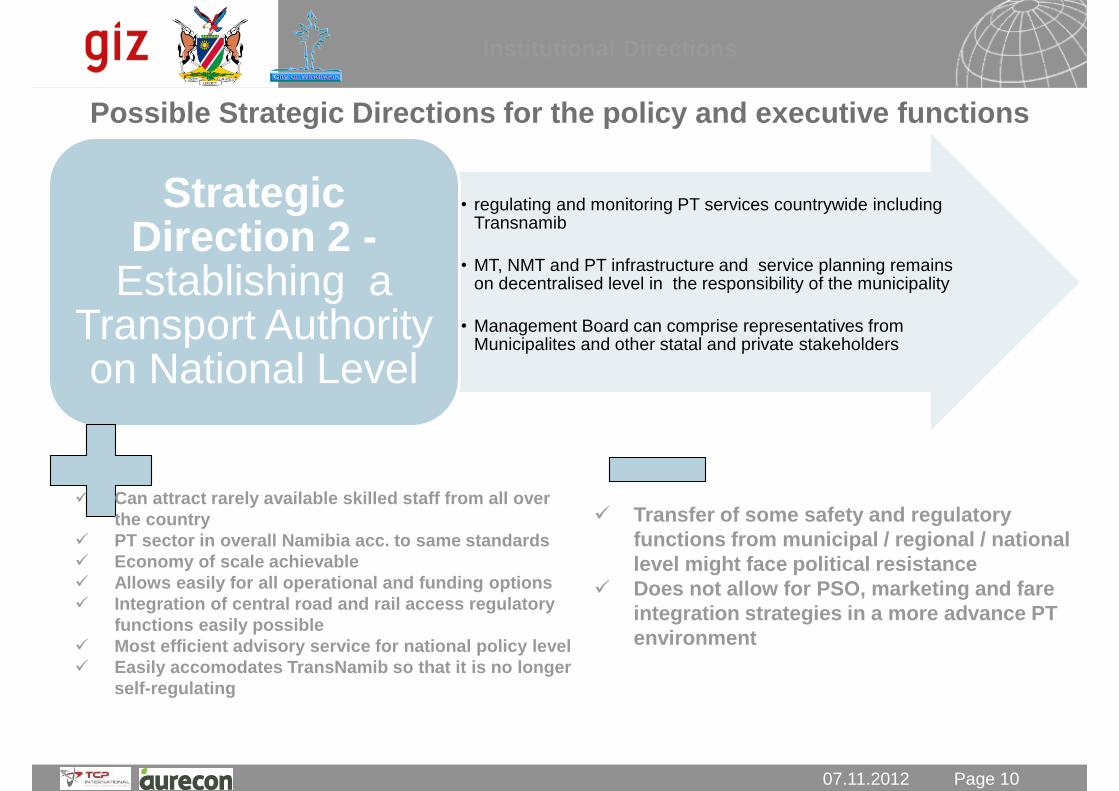
07.11.2012 Seite 10 Page 10 07.11.2012
Possible Strategic Directions for the policy and executive functions
• regulating and monitoring PT services countrywide including Transnamib
• MT, NMT and PT infrastructure and service planning remains on decentralised level in the responsibility of the municipality
• Management Board can comprise representatives from Municipalites and other statal and private stakeholders
Strategic Direction 2 -
Establishing a Transport Authority on National Level
Can attract rarely available skilled staff from all over
the country
PT sector in overall Namibia acc. to same standards
Economy of scale achievable
Allows easily for all operational and funding options
Integration of central road and rail access regulatory
functions easily possible
Most efficient advisory service for national policy level
Easily accomodates TransNamib so that it is no longer
self-regulating
Transfer of some safety and regulatory
functions from municipal / regional / national
level might face political resistance
Does not allow for PSO, marketing and fare
integration strategies in a more advance PT
environment
Institutional Directions

07.11.2012 Seite 11 Page 11 07.11.2012
Possible Strategic Directions for the policy and executive functions
• regulating and monitoring PT services countrywide including Transnamib
• MT, NMT and PT infrastructure and service planning remains on decentralised level in the responsibility of the municipality
• Management Board can comprise representatives from Municipalites and other statal and private stakeholders
Strategic Direction 3 -
Establishing a Transport Agency
on City Level
Close-to-people decisions
Can start small scale with view functions and
be easily stepwise extended for taking over
more and more regulatory functions and
marketing and fare integration strategies
Can easily be extended to accommodate
further stakeholders
Allows easily for all operational and funding
options
Advisory service for national policy level
No economy of scale achievable
Integration of TransNamib in municipal PT
schemes aggravated
Institutional Directions
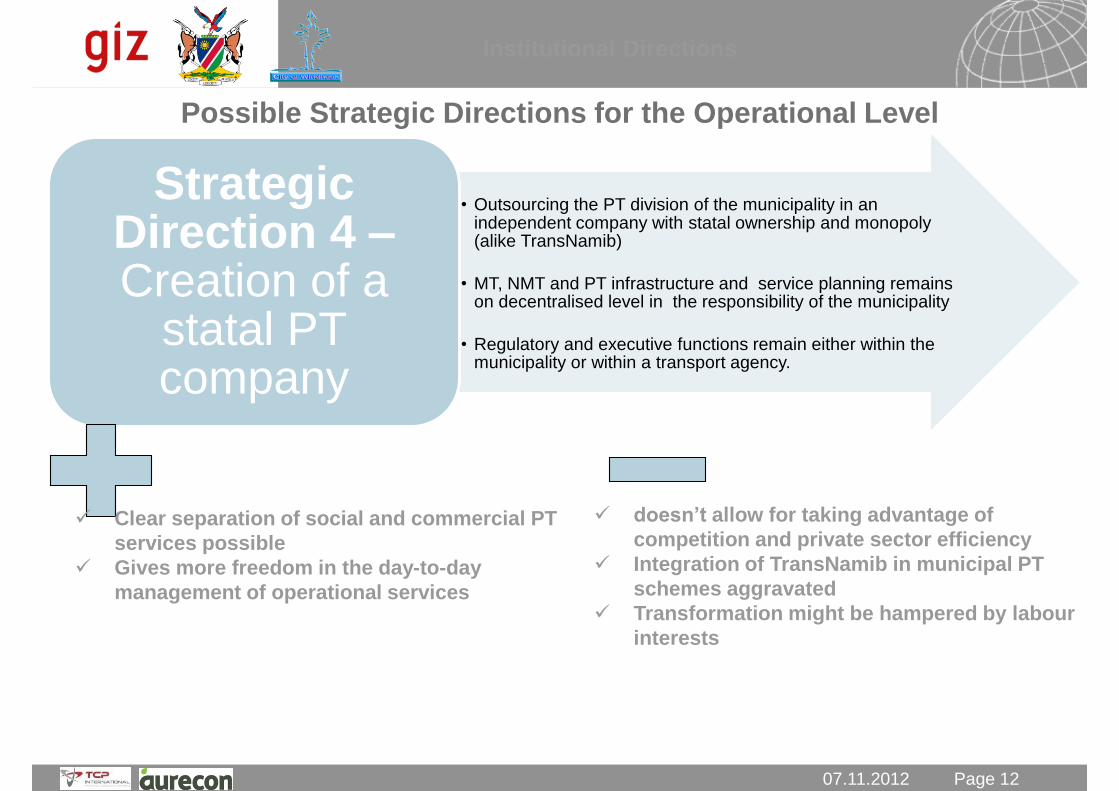
07.11.2012 Seite 12 Page 12 07.11.2012
Possible Strategic Directions for the Operational Level
• Outsourcing the PT division of the municipality in an independent company with statal ownership and monopoly (alike TransNamib)
• MT, NMT and PT infrastructure and service planning remains on decentralised level in the responsibility of the municipality
• Regulatory and executive functions remain either within the municipality or within a transport agency.
Strategic Direction 4 – Creation of a
statal PT company
Clear separation of social and commercial PT
services possible
Gives more freedom in the day-to-day
management of operational services
doesn’t allow for taking advantage of
competition and private sector efficiency
Integration of TransNamib in municipal PT
schemes aggravated
Transformation might be hampered by labour
interests
Institutional Directions

07.11.2012 Seite 13 Page 13 07.11.2012
Possible Strategic Directions for the Operational Level
• Outsourcing the PT division of the municipality in a independent company with statal ownership and monopoly (alike TransNamib)
• MT, NMT and PT infrastructure and service planning remains on decentralised level in the responsibility of the municipality
• Regulatory and executive functions remain either within the municipality or within a transport agency.
• Requires organisation of regulated competition for the market
Strategic Direction 5 –
Privatisation of existing operational
PT services
Enhances efficiency
Allows easily for PSOs to compensate for
social obligations
Easy integration of TransNamib in overall PT
scheme
Allows easily to accommodate taxi drivers
interest
Requires advanced competences in order to
fulfil the regulatory and executive functions
Integration of TransNamib in municipal PT
schemes aggravated
Transformation might be hampered by labour
interests
Institutional Directions

07.11.2012 Seite 14 Page 14 07.11.2012
Possible Strategic Directions for the Operational Level
• Strategic Planning remains within City
• Determination of PPP form and statal PT assets and involvement
• Tendering for private sector participation in construction, financing , etc.
• Foundation of a SPV with private and public involvement
• Transfer of existing statal PT assets (bus stops, right-of-way, vehicles) etc. to the SPV
Strategic Direction 6 – Foundation of a PPP for complete
renewal of PT system
Enhances efficiency
Allows easily for PSOs to compensate for
social obligations
TransNamib could participate in such a PPP
scheme
Allows for considerable private know-how and
funds influx to the PT market in Namibia
Requires advanced competences in order to
optimise contracting and fulfil the regulatory
and executive functions
lack of capacity in the transport sector
Transformation might be hampered by labour
interests
New image to PT easy to achieve
Institutional Directions
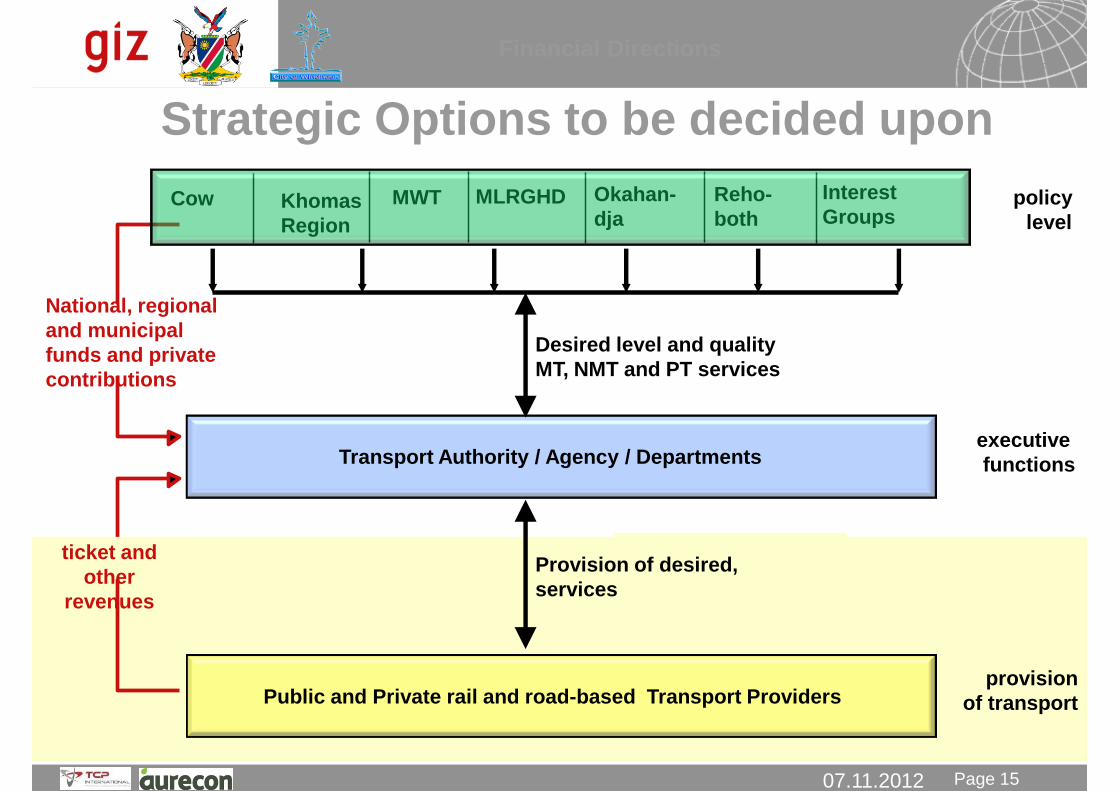
07.11.2012 Seite 15 Page 15 07.11.2012
policy
level
executive
functions
provision
of transport
Transport Authority / Agency / Departments
Public and Private rail and road-based Transport Providers
National, regional
and municipal
funds and private
contributions
Desired level and quality
MT, NMT and PT services
Provision of desired,
services
ticket and
other
revenues
Financial Directions
Strategic Options to be decided upon
Cow Khomas
Region
MWT MLRGHD Okahan-
dja
Reho-
both
Interest
Groups

07.11.2012 Seite 16 Page 16 07.11.2012
• Government funds come from
• the general budget or
• dedicated funds such as the road fund or
• loans which spread the burden on government budget over a number of years
• Private sector funds come through private development of transport infrastructure and systems and private provision of transport services
• Public-private-partnership (PPP) between the government and private sector
Government can fund
investment in transport either itself or through the private
sector
Funding Options
Financial Directions – Recalling the
Principles

07.11.2012 Seite 17 Page 17 07.11.2012
Revenues from
transport:
Public transport:
ticket revenues
other revenues
Private transport:
tax on vehicles purchases
registration tax
annual tax
fuel tax
parking fees
road pricing
fines
Spending for
transport:
Urban public transport by Bus:
infrastructure investment
rolling stock investment
operation and maintenance
Railways:
infrastructure investment
(rolling stock investment)
(operation and maintenance)
Roads:
infrastructure investment
operation and maintenance
traffic control
Others:
shipping and ports
aviation and airports
Public
budgets
Financial Directions - Main financing
streams for transport in Namibia
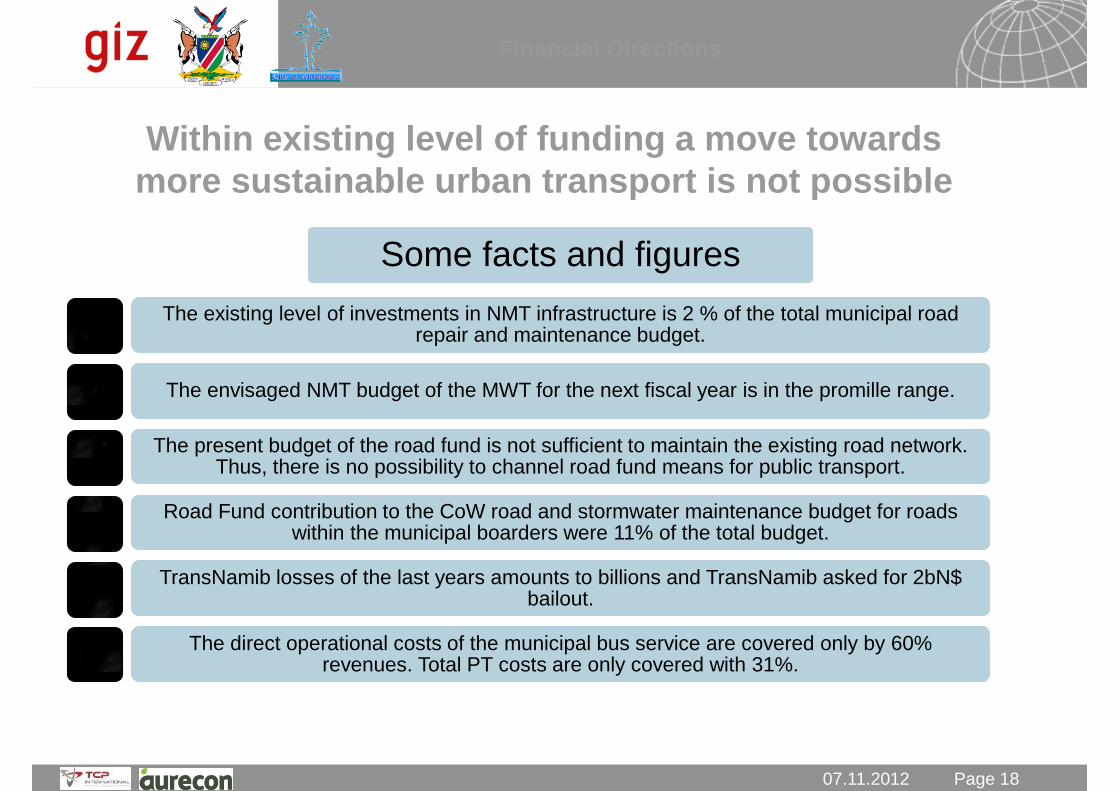
07.11.2012 Seite 18 Page 18 07.11.2012
Within existing level of funding a move towards
more sustainable urban transport is not possible
Some facts and figures
The existing level of investments in NMT infrastructure is 2 % of the total municipal road repair and maintenance budget.
The envisaged NMT budget of the MWT for the next fiscal year is in the promille range.
The present budget of the road fund is not sufficient to maintain the existing road network. Thus, there is no possibility to channel road fund means for public transport.
Road Fund contribution to the CoW road and stormwater maintenance budget for roads within the municipal boarders were 11% of the total budget.
TransNamib losses of the last years amounts to billions and TransNamib asked for 2bN$ bailout.
The direct operational costs of the municipal bus service are covered only by 60% revenues. Total PT costs are only covered with 31%.
Financial Directions

07.11.2012 Seite 19 Page 19 07.11.2012
Possible Strategic Directions for financing sustainable transport
• Closely combined with institutional strategy 1 but also valid for most other institutional options
• Revise tariff structure for bus and taxi usage along with an improved service provision
• Increase income by advertisement and marketing, parking fees, fines for offences, etc.
• Introduce sponsorships for bus stations
• Impose improvement of sidewalks on land-owners but with clear construction standards,
• draw on other budgets such as park management etc.
• Earmark revenues from municipal and government land sales for NMT and PT links
• Stepwise increase of regular available budget for PT and NMT
Strategic Direction 1 –
Revenue optimising
strategy and stepwise
increase of available budgets
Requires only slight up-dates of legal
framework
Makes best use of existing assets and
potentials
Increased fees and fines can be also taken
as pull measure for influencing the modal
split
Will not allow for major investments, but small
step approach
Requires some adaptation in fiscal laws
concerning statutory funds
Some measures might have negativ
repercussions on low-income groups
Needs every fiscal year renewed justification.
Financial Directions
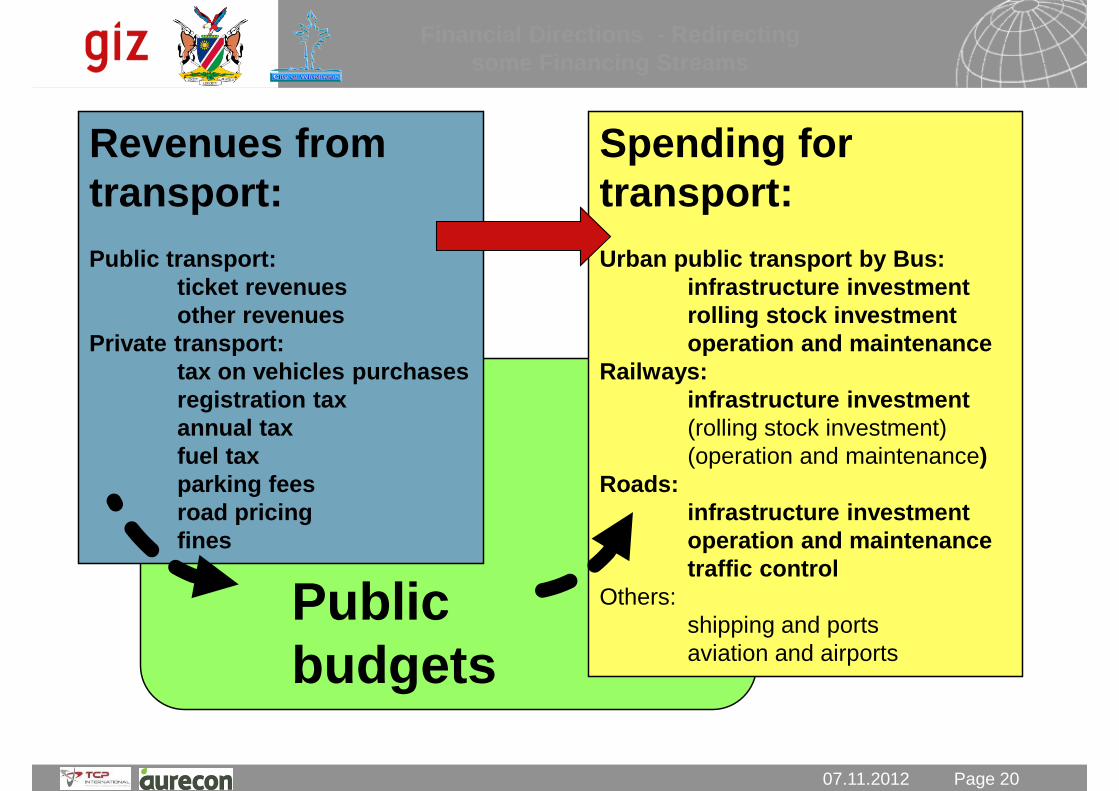
07.11.2012 Seite 20 Page 20 07.11.2012
Revenues from
transport:
Public transport:
ticket revenues
other revenues
Private transport:
tax on vehicles purchases
registration tax
annual tax
fuel tax
parking fees
road pricing
fines
Spending for
transport:
Urban public transport by Bus:
infrastructure investment
rolling stock investment
operation and maintenance
Railways:
infrastructure investment
(rolling stock investment)
(operation and maintenance)
Roads:
infrastructure investment
operation and maintenance
traffic control
Others:
shipping and ports
aviation and airports
Public
budgets
Financial Directions - Redirecting
some Financing Streams

07.11.2012 Seite 21 Page 21 07.11.2012
Possible Strategic Directions for financing sustainable transport
• Can go along with all institutional strategies and involves financial strategy no. 1
• Earmark budgetary funds (revenues, fines for traffic offences, parking fees, additional fuel levies, etc.) stemming from transport users to the utmost extent possible towards NMT, road safety and PT
• Must go along with all options for commercialisation of PT operations
• Includes adding a fuel levy designated for PT and NMT to relieve road network usage and channel additional funds through road fund towards municipalities NMT and PT tasks
Strategic Direction
2– Revenue increasing
strategy (User-pays-principle)
Increases accountability
Can go along with introduction of PSOs
Enables long-term viable financing
streams
Imcreases efficiency and better allocation
of resources
Reduces deficits of present PT systems
Some measures might have negativ
repercussions on low-income groups which need
to be mitigated
Requires major adaptions of the legal framework
and political commitment
Financial Directions
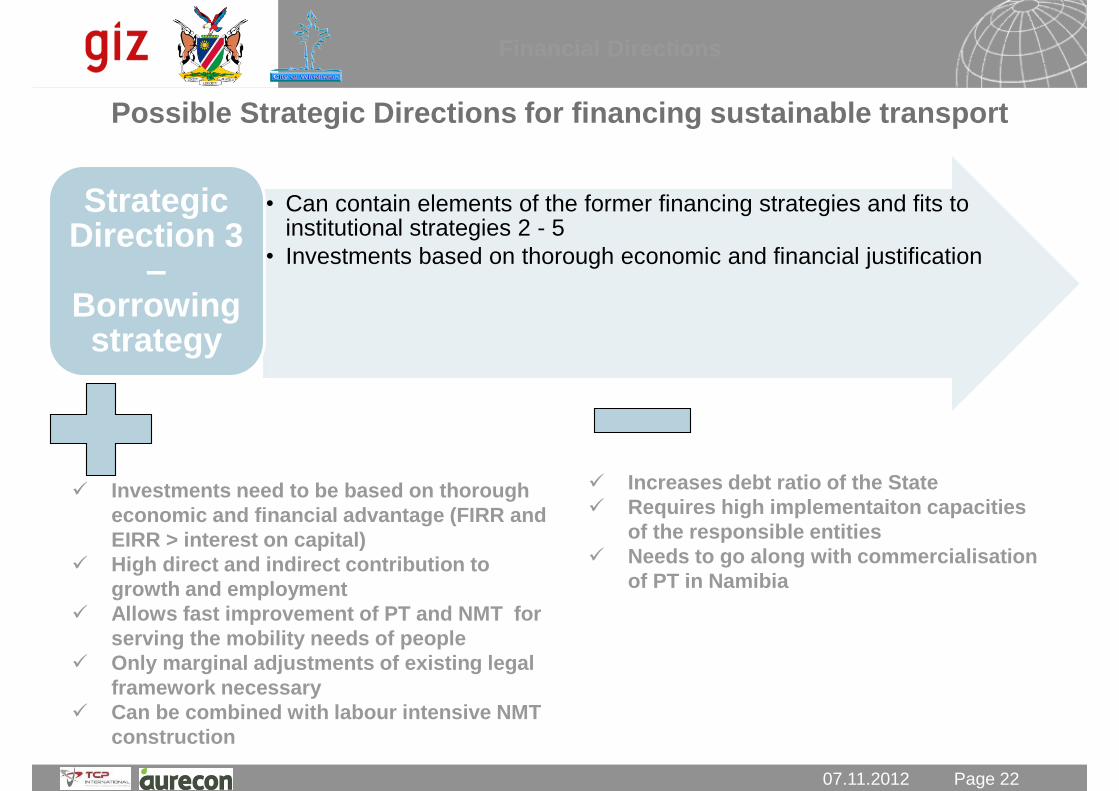
07.11.2012 Seite 22 Page 22 07.11.2012
Possible Strategic Directions for financing sustainable transport
• Can contain elements of the former financing strategies and fits to institutional strategies 2 - 5
• Investments based on thorough economic and financial justification
Strategic Direction 3
– Borrowing
strategy
Investments need to be based on thorough
economic and financial advantage (FIRR and
EIRR > interest on capital)
High direct and indirect contribution to
growth and employment
Allows fast improvement of PT and NMT for
serving the mobility needs of people
Only marginal adjustments of existing legal
framework necessary
Can be combined with labour intensive NMT
construction
Increases debt ratio of the State
Requires high implementaiton capacities
of the responsible entities
Needs to go along with commercialisation
of PT in Namibia
Financial Directions
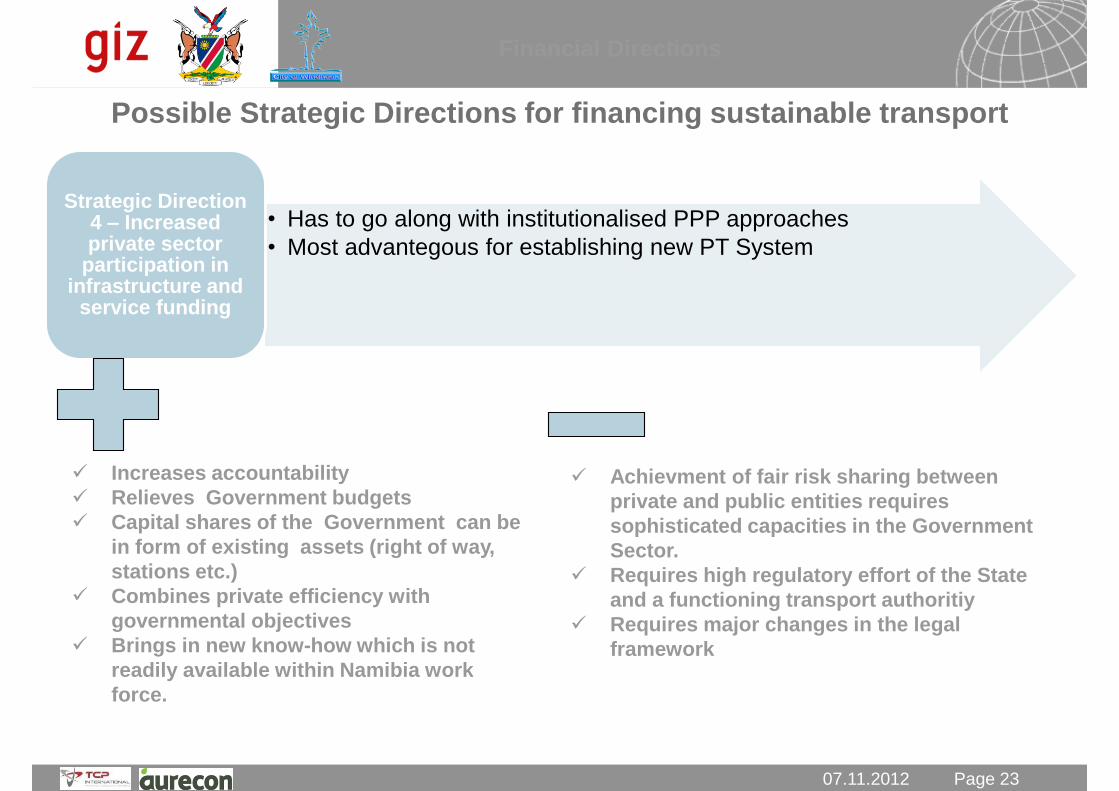
07.11.2012 Seite 23 Page 23 07.11.2012
Possible Strategic Directions for financing sustainable transport
• Has to go along with institutionalised PPP approaches
• Most advantegous for establishing new PT System
Strategic Direction 4 – Increased private sector
participation in infrastructure and
service funding
Increases accountability
Relieves Government budgets
Capital shares of the Government can be
in form of existing assets (right of way,
stations etc.)
Combines private efficiency with
governmental objectives
Brings in new know-how which is not
readily available within Namibia work
force.
Achievment of fair risk sharing between
private and public entities requires
sophisticated capacities in the Government
Sector.
Requires high regulatory effort of the State
and a functioning transport authoritiy
Requires major changes in the legal
framework
Financial Directions
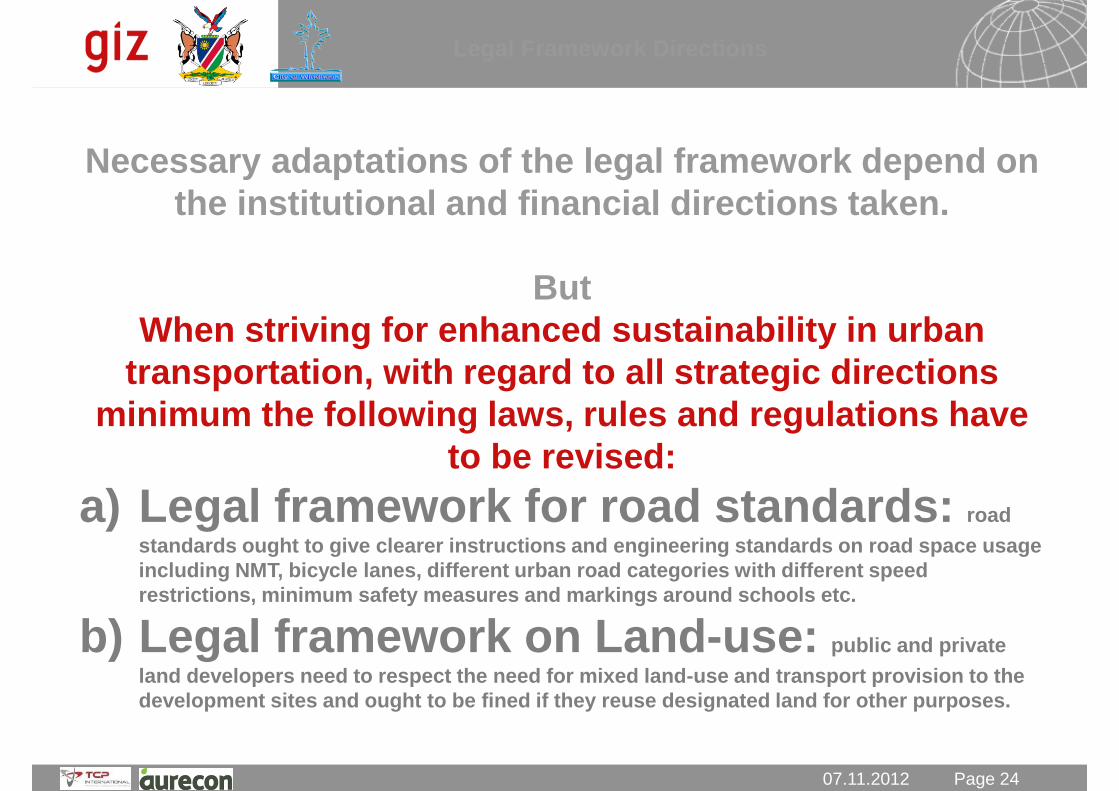
07.11.2012 Seite 24 Page 24 07.11.2012
Necessary adaptations of the legal framework depend on
the institutional and financial directions taken.
But
When striving for enhanced sustainability in urban
transportation, with regard to all strategic directions
minimum the following laws, rules and regulations have
to be revised:
a) Legal framework for road standards: road
standards ought to give clearer instructions and engineering standards on road space usage
including NMT, bicycle lanes, different urban road categories with different speed
restrictions, minimum safety measures and markings around schools etc.
b) Legal framework on Land-use: public and private
land developers need to respect the need for mixed land-use and transport provision to the
development sites and ought to be fined if they reuse designated land for other purposes.
Legal Framework Directions
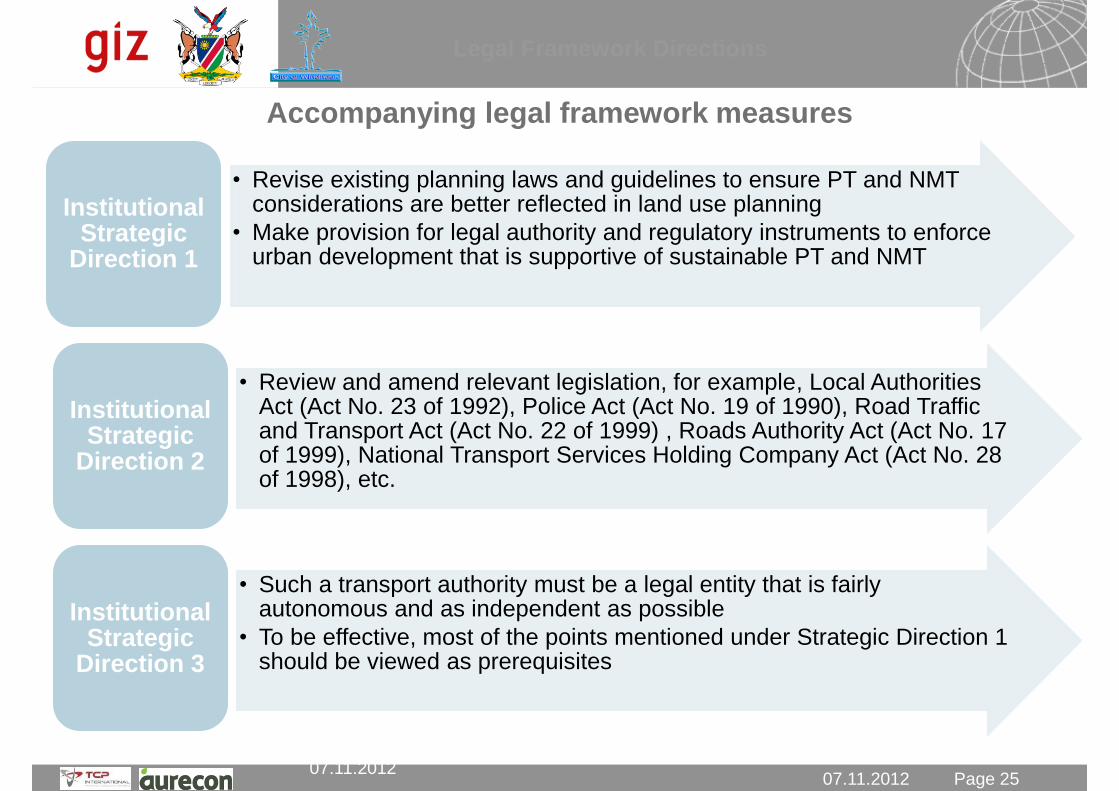
07.11.2012 Seite 25 Page 25 07.11.2012
Accompanying legal framework measures
Legal Framework Directions
07.11.2012
• Revise existing planning laws and guidelines to ensure PT and NMT considerations are better reflected in land use planning
• Make provision for legal authority and regulatory instruments to enforce urban development that is supportive of sustainable PT and NMT
Institutional Strategic
Direction 1
• Review and amend relevant legislation, for example, Local Authorities Act (Act No. 23 of 1992), Police Act (Act No. 19 of 1990), Road Traffic and Transport Act (Act No. 22 of 1999) , Roads Authority Act (Act No. 17 of 1999), National Transport Services Holding Company Act (Act No. 28 of 1998), etc.
Institutional Strategic
Direction 2
• Such a transport authority must be a legal entity that is fairly autonomous and as independent as possible
• To be effective, most of the points mentioned under Strategic Direction 1 should be viewed as prerequisites
Institutional Strategic
Direction 3
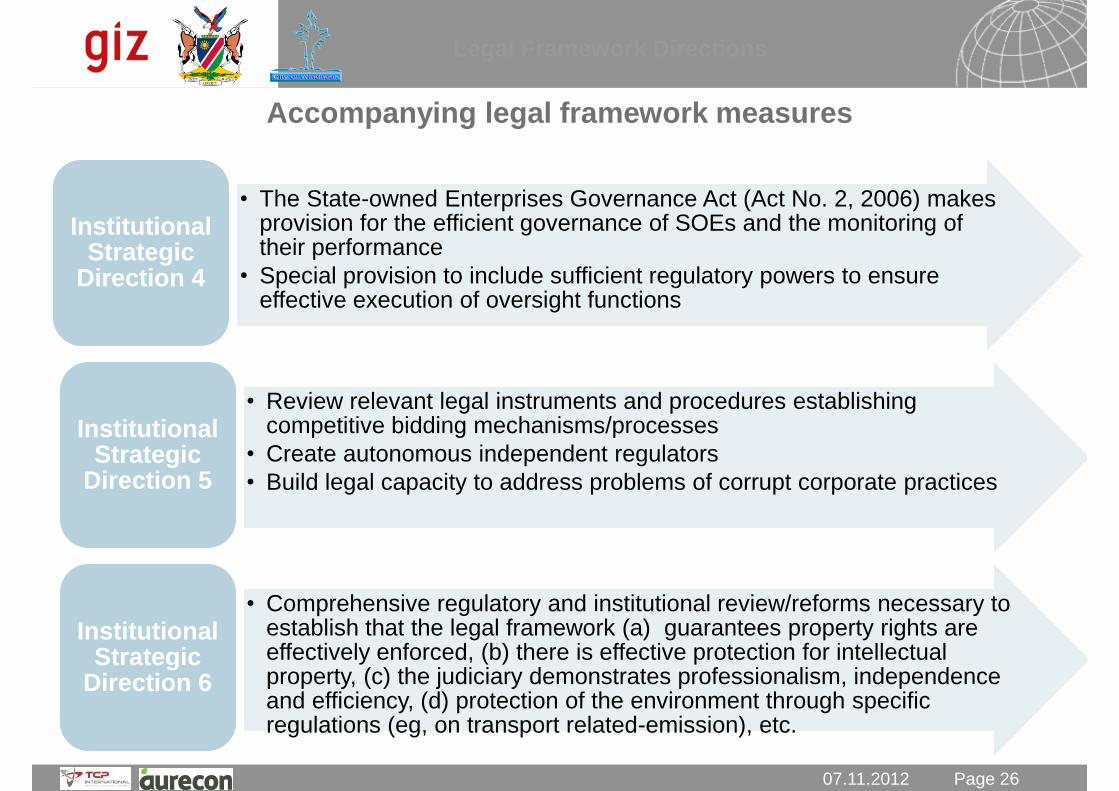
07.11.2012 Seite 26 Page 26 07.11.2012
Accompanying legal framework measures
Legal Framework Directions
• The State-owned Enterprises Governance Act (Act No. 2, 2006) makes provision for the efficient governance of SOEs and the monitoring of their performance
• Special provision to include sufficient regulatory powers to ensure effective execution of oversight functions
Institutional Strategic
Direction 4
• Review relevant legal instruments and procedures establishing competitive bidding mechanisms/processes
• Create autonomous independent regulators
• Build legal capacity to address problems of corrupt corporate practices
Institutional Strategic
Direction 5
• Comprehensive regulatory and institutional review/reforms necessary to establish that the legal framework (a) guarantees property rights are effectively enforced, (b) there is effective protection for intellectual property, (c) the judiciary demonstrates professionalism, independence and efficiency, (d) protection of the environment through specific regulations (eg, on transport related-emission), etc.
Institutional Strategic
Direction 6

07.11.2012 Seite 27 Page 27 07.11.2012
Several stakeholders and also the SUTMP Consulting Team strongly recommends the establishment of an interministerial / interagency ILF (institutional, legal and
financial) – Committee consisting of representatives of relevant government
entities and municipal departments.
07.11.2012 Seite 28 Page 28 07.11.2012
Thank you for your attention
Annex F
Agenda and List of
Invitees of Strategic
Direction Workshops

Consultancy services provided by
PREPARATORY MEETING FOR THE STRATEGIC DECISION MAKING WORKSHOP OF THE SUSTAINABLE URBAN TRANSPORT MASTER PLAN (SUTMP) FOR CITY OF WINDHOEK,
INCLUDING REHOBOTH, OKAHANDJA AND HOSEA KUTAKO INTERNATIONAL AIRPORT
DATE OF MEETING: 05th and 6th of November 2012
VENUE: Kalahari Sands Hotel, Moringa Room, Rooftop
MEETING AGENDA
DAY 1
Opening Session
8:30 – 9:00 hours
Welcome Philip Amunyela, Under-Secretary, Ministry of Works and Transport
Welcome NK Taapopi,- CEO, City of Windhoek
Introductory Presentation Angelika Zwicky, SUTMP Team Leader
1. Working Session Existing Traffic Situation and Land-Use Scenarios
Facilitator and main presenter: Adri van de Wetering Co-Facilitator: Dr. Niklas Sieber
09:00 – 09:30 hours Presentation 09:30 – 10:30 hours Discussions, Input, Comments 10:30 – 11:00 hours Summary and Conclusion of the 1st working session 11:00 –11:15 hours Tea Break

Consultancy services provided by
2. Working Session Strategic Options for Modernising Public Transport
Facilitator and main presenter: Carsten Simonis Co-Facilitator: Angelika Zwicky
11:15 – 11:45 hours Presentation 11:45 – 12:45 hours Discussions, Input, Comments
12:45 –14:00 hours Lunch Break
2. Continuation 2nd Working Session 14:00 – 14:30 hours Summary and Conclusion of the 2nd working session 3. Working Session Strategic Options for Enhancing and Improving Non-Motorised
Transport Facilitator and main presenter: James Scheeper
Co-Facilitator: Dr. Niklas Sieber
14:30 – 15:00 hours Presentation 15:00 – 16:00 hours Discussions, Input, Comments 16:00 – 16:30 hours Summary and Conclusion of the 3rd working session
16:30 hours End of Day 1
DAY 2
Welcome Session
8:00 – 08:15 hours Welcome by the host MWT
4. Working Session Strategic Options in the field of Transport Management including Safety Enhancement
Facilitator and main presenter: Jaco de Vries
Co-Facilitator: Angelika Zwicky
08:15 – 80:45 hours Presentation 08:45 – 09:45 hours Discussions, Input, Comments 09:45 – 10:15 hours Summary and Conclusion of the 4th working session
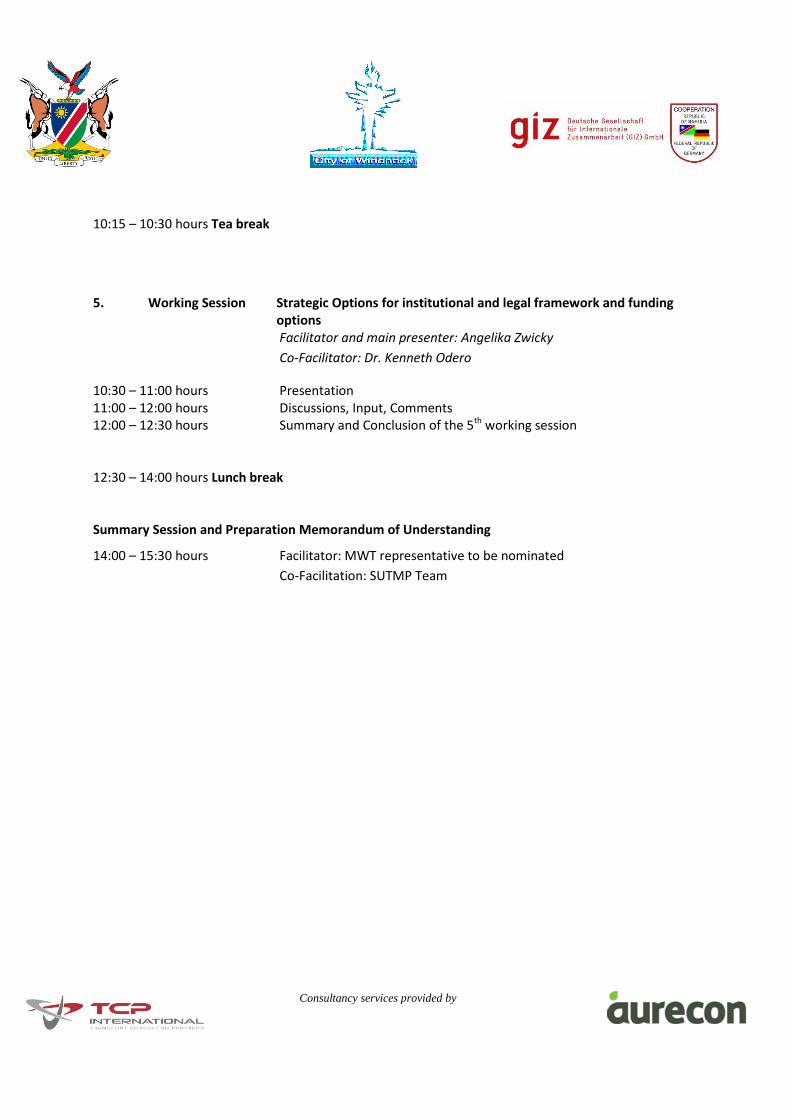
Consultancy services provided by
10:15 – 10:30 hours Tea break
5. Working Session Strategic Options for institutional and legal framework and funding options
Facilitator and main presenter: Angelika Zwicky
Co-Facilitator: Dr. Kenneth Odero
10:30 – 11:00 hours Presentation 11:00 – 12:00 hours Discussions, Input, Comments 12:00 – 12:30 hours Summary and Conclusion of the 5th working session 12:30 – 14:00 hours Lunch break Summary Session and Preparation Memorandum of Understanding
14:00 – 15:30 hours Facilitator: MWT representative to be nominated
Co-Facilitation: SUTMP Team

Suggested List of Participants
Preparatory Workshop for the Strategic Decision Making
5./6. November, 2012
(Opening by the MWT Under-Secretary Department of Transport Philip Amunyela)
Name Position Institution
Philip Amunyela Under-Secretary Department of Transport
Ministry of Works and Transport
Ludwig Narib Strategic Executive Urban Planning and Property Management
City of Windhoek
Horst Lisse Planning, Design and Traffic Flow
City of Windhoek
Browny Mutrifa Urban Planner City of Windhoek Faniel Maanda Urban Planner City of Windhoek George Mayumbelo Strategic Executive
Community Services City of Windhoek
Clarence Rupingena Community Services City of Windhoek Johanna Shikukutu Bus Operations City of Windhoek Adam Eiseb Deputy Chief City of Windhoek RM Gertze Strategic Executive
Finance City of Windhoek
Utete Karimbue-Mupaine Strategic Executive Economic Developm. and Environment
City of Windhoek
Angelina Paulo Simana Director Policy and Regulation
Ministry of Works and Transport
Cedric Limbo Deputy Director Policy Ministry of Works and Transport Damien Mabengano Deputy Director
Regulation Ministry of Works and Transport
Cris Fikunawa Deputy Director: Legislation
Ministry of Works and Transport
Asteria Nashaya Director Transportation Infrastructure
Ministry of Works and Transport
Alberto Zilberstein Toruncha
Chief Engineer Transportation Infrastructure
Ministry of Works and Transport
Robert Kalomo Director Railways Ministry of Works and Transport Gregor Schmorl Technical Advisor GIZ Immanuel Shipanga Technical Advisor GIZ Transport Project Frederik Strompen Technical Advisor GIZ Transport Project Relevant SUTMP Team Members
Advisors TCP /Aurecon
Rauna Hanghuwo Manager Network Planning
Roads Authority
Hippy Tjivikua Manager Operations TransNamib To be defined MRLGHD E. Goaseb Road Fund Administration

Ben Mulongeni CRO Khomas Regional Council Theo Jankowski CEO Rehoboth Town Council E de Waal Technical Manager Rehoboth Town Council Frans Enkali CEO Okahandja Town Council Beven Kaurimuje Strategic Executive
Engineering Okahandja Town Council
Struggle Lihuhua Airport Manager Hosea Kutako
NAC - Hosea Kutako
Robert Riethmüller Lecturer Polytechnic of Namibia, Department of Land Management
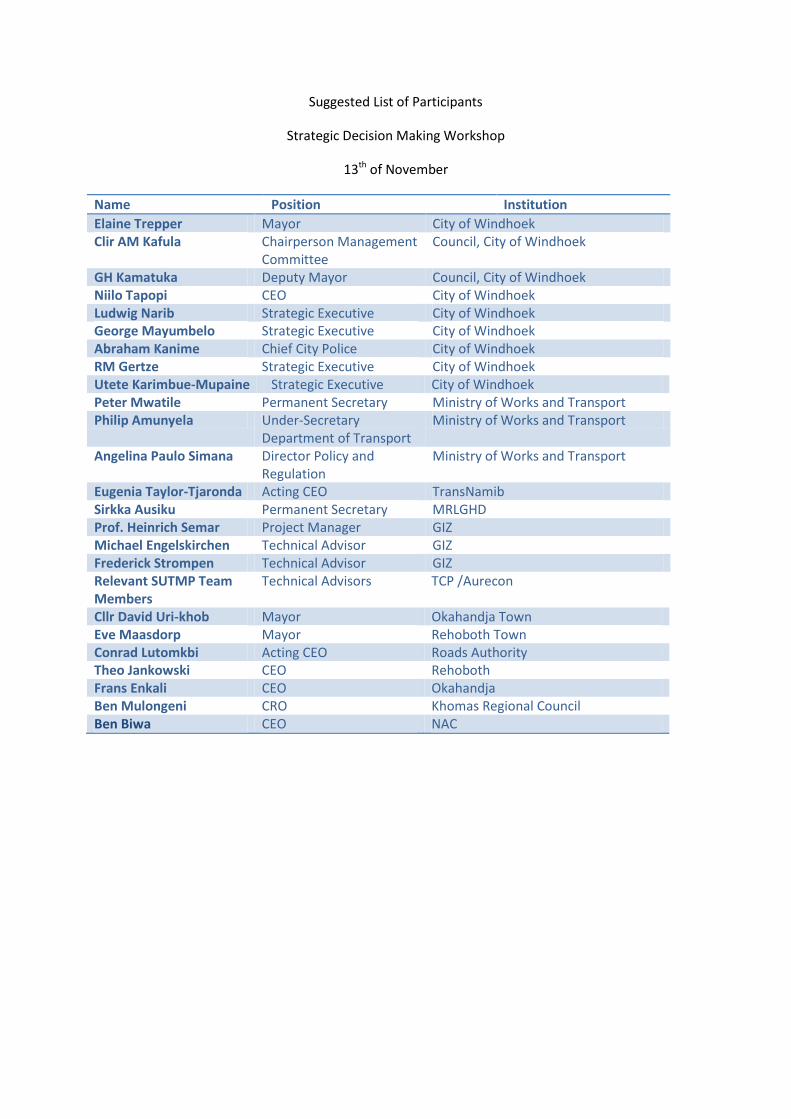
Suggested List of Participants
Strategic Decision Making Workshop
13th of November
Name Position Institution
Elaine Trepper Mayor City of Windhoek Clir AM Kafula Chairperson Management
Committee Council, City of Windhoek
GH Kamatuka Deputy Mayor Council, City of Windhoek Niilo Tapopi CEO City of Windhoek Ludwig Narib Strategic Executive City of Windhoek George Mayumbelo Strategic Executive City of Windhoek Abraham Kanime Chief City Police City of Windhoek RM Gertze Strategic Executive City of Windhoek Utete Karimbue-Mupaine Strategic Executive City of Windhoek Peter Mwatile Permanent Secretary Ministry of Works and Transport Philip Amunyela Under-Secretary
Department of Transport Ministry of Works and Transport
Angelina Paulo Simana Director Policy and Regulation
Ministry of Works and Transport
Eugenia Taylor-Tjaronda Acting CEO TransNamib Sirkka Ausiku Permanent Secretary MRLGHD Prof. Heinrich Semar Project Manager GIZ Michael Engelskirchen Technical Advisor GIZ Frederick Strompen Technical Advisor GIZ Relevant SUTMP Team Members
Technical Advisors TCP /Aurecon
Cllr David Uri-khob Mayor Okahandja Town Eve Maasdorp Mayor Rehoboth Town Conrad Lutomkbi Acting CEO Roads Authority Theo Jankowski CEO Rehoboth Frans Enkali CEO Okahandja Ben Mulongeni CRO Khomas Regional Council Ben Biwa CEO NAC

Annex G
Public Transport
Operational Data per
Line

Annexes Public Transportation
a) PT demand according to the traffic modell for 2012, 2017, 2032
1

b) Simulation runs for the different Public Transportation lines.
I: Line 1 Independence north bound
II: Line 2 Monte Cristo
III: Line 1 Independence complete
IV: Line 3 Rocky Crest
V: Line 4 Florence Nightingaile
VI: Line 5 Eros Airport
VII: Line 6 Hosea Kutako
2
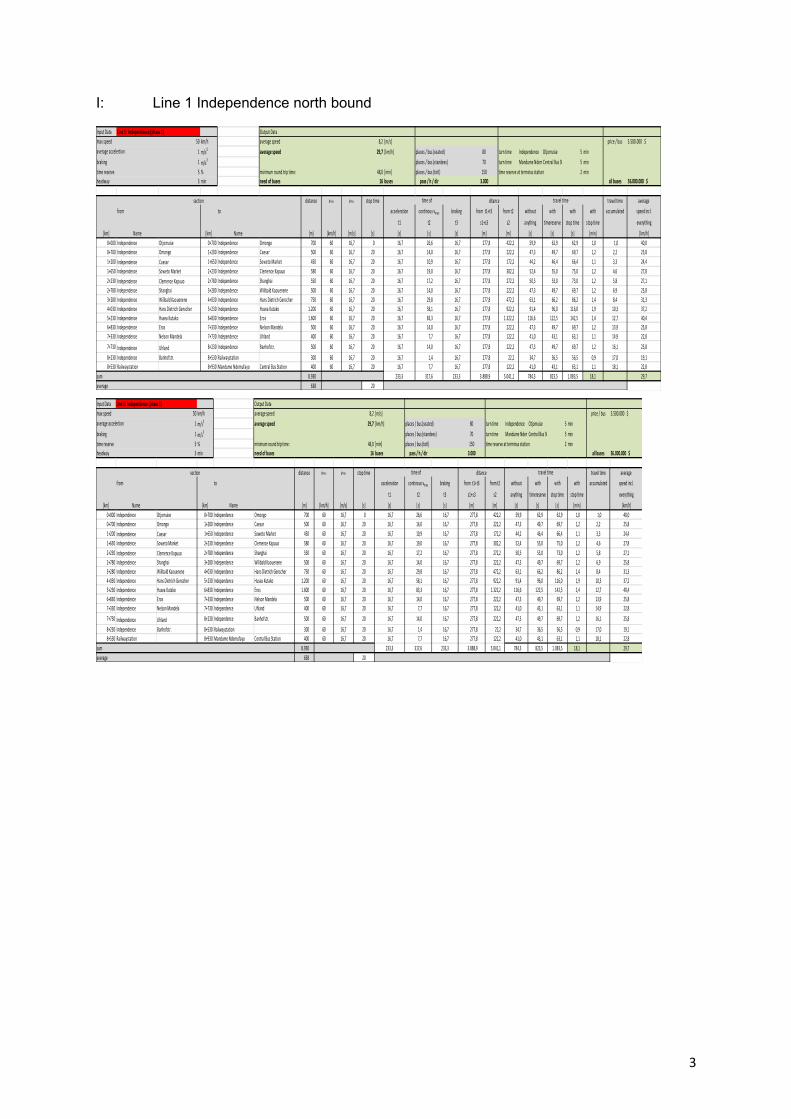
I: Line 1 Independence north bound
Input Data Line 1: Independence (phase 1) Output Datamax speed 50 km/h average speed 8,2 [m/s] price / bus 3.500.000 $
1 m/s2 average speed 29,7 [km/h] places / bus (seated) 80 turn time Independence Otjomuise 5 min1 m/s3 places / bus (standees) 70 turn time Mandume NdemufayoCentral Bus Station 5 min5 % minimum round trip time: 48,0 [min] places / bus (totl) 150 time reserve at terminus station 2 min
headway 3 min need of buses 16 buses pass / h / dir 3.000 all buses 56.000.000 $
section distance vma x vmax stop time ditance travel time average from to acceleration continous vmax braking from t1+t3 from t2 without with with with accumulated speed incl.
t1 t2 t3 s1+s3 s2 anything timereserve stop time stop time everything
[km] Name [km] Name [m] [km/h] [m/s] [s] [s] [s] [s] [m] [m] [s] [s] [s] [min] [km/h]0+000 Independence Otjomuise 0+700 Independence Omongo 700 60 16,7 0 16,7 26,6 16,7 277,8 422,2 59,9 62,9 62,9 1,0 1,0 40,00+700 Independence Omongo 1+200 Independence Caesar 500 60 16,7 20 16,7 14,0 16,7 277,8 222,2 47,3 49,7 69,7 1,2 2,2 25,81+200 Independence Caesar 1+650 Independence Soweto Market 450 60 16,7 20 16,7 10,9 16,7 277,8 172,2 44,2 46,4 66,4 1,1 3,3 24,41+650 Independence Soweto Market 2+230 Independence Clemence Kapuuo 580 60 16,7 20 16,7 19,0 16,7 277,8 302,2 52,4 55,0 75,0 1,2 4,6 27,82+230 Independence Clemence Kapuuo 2+780 Independence Shanghai 550 60 16,7 20 16,7 17,2 16,7 277,8 272,2 50,5 53,0 73,0 1,2 5,8 27,12+780 Independence Shanghai 3+280 Independence Wilibald Kaouenene 500 60 16,7 20 16,7 14,0 16,7 277,8 222,2 47,3 49,7 69,7 1,2 6,9 25,83+280 Independence Wilibald Kaouenene 4+030 Independence Hans Dietrich Genscher 750 60 16,7 20 16,7 29,8 16,7 277,8 472,2 63,1 66,2 86,2 1,4 8,4 31,34+030 Independence Hans Dietrich Genscher 5+230 Independence Husea Kutako 1.200 60 16,7 20 16,7 58,1 16,7 277,8 922,2 91,4 96,0 116,0 1,9 10,3 37,25+230 Independence Husea Kutako 6+830 Independence Eros 1.600 60 16,7 20 16,7 83,3 16,7 277,8 1.322,2 116,6 122,5 142,5 2,4 12,7 40,46+830 Independence Eros 7+330 Independence Nelson Mandela 500 60 16,7 20 16,7 14,0 16,7 277,8 222,2 47,3 49,7 69,7 1,2 13,9 25,87+330 Independence Nelson Mandela 7+730 Independence Uhland 400 60 16,7 20 16,7 7,7 16,7 277,8 122,2 41,0 43,1 63,1 1,1 14,9 22,87+730 Independence Uhland 8+230 Independence Banhofstr. 500 60 16,7 20 16,7 14,0 16,7 277,8 222,2 47,3 49,7 69,7 1,2 16,1 25,8
8+230 Independence Banhofstr. 8+530 Railwaystation 300 60 16,7 20 16,7 1,4 16,7 277,8 22,2 34,7 36,5 56,5 0,9 17,0 19,18+530 Railwaystation 8+930 Mandume Ndemufayo Central Bus Station 400 60 16,7 20 16,7 7,7 16,7 277,8 122,2 41,0 43,1 63,1 1,1 18,1 22,8
sum 8.930 233,3 317,6 233,3 3.888,9 5.041,1 784,3 823,5 1.083,5 18,1 29,7average 638 20
average accelertion
brakingtime reserve
time of travel time
Input Data Line 1: Independence (phase 1) Output Datamax speed 50 km/h average speed 8,2 [m/s] price / bus 3.500.000 $
1 m/s2 average speed 29,7 [km/h] places / bus (seated) 80 turn time Independence Otjomuise 5 min1 m/s3 places / bus (standees) 70 turn time Mandume NdemufayoCentral Bus Station 5 min5 % minimum round trip time: 48,0 [min] places / bus (totl) 150 time reserve at terminus station 2 min
headway 3 min need of buses 16 buses pass / h / dir 3.000 all buses 56.000.000 $
section distance vmax vmax stop time ditance travel time average from to acceleration continous vma x braking from t1+t3 from t2 without with with with accumulated speed incl.
t1 t2 t3 s1+s3 s2 anything timereserve stop time stop time everything
[km] Name [km] Name [m] [km/h] [m/s] [s] [s] [s] [s] [m] [m] [s] [s] [s] [min] [km/h]0+000 Independence Otjomuise 0+700 Independence Omongo 700 60 16,7 0 16,7 26,6 16,7 277,8 422,2 59,9 62,9 62,9 1,0 1,0 40,00+700 Independence Omongo 1+200 Independence Caesar 500 60 16,7 20 16,7 14,0 16,7 277,8 222,2 47,3 49,7 69,7 1,2 2,2 25,81+200 Independence Caesar 1+650 Independence Soweto Market 450 60 16,7 20 16,7 10,9 16,7 277,8 172,2 44,2 46,4 66,4 1,1 3,3 24,41+650 Independence Soweto Market 2+230 Independence Clemence Kapuuo 580 60 16,7 20 16,7 19,0 16,7 277,8 302,2 52,4 55,0 75,0 1,2 4,6 27,82+230 Independence Clemence Kapuuo 2+780 Independence Shanghai 550 60 16,7 20 16,7 17,2 16,7 277,8 272,2 50,5 53,0 73,0 1,2 5,8 27,12+780 Independence Shanghai 3+280 Independence Wilibald Kaouenene 500 60 16,7 20 16,7 14,0 16,7 277,8 222,2 47,3 49,7 69,7 1,2 6,9 25,83+280 Independence Wilibald Kaouenene 4+030 Independence Hans Dietrich Genscher 750 60 16,7 20 16,7 29,8 16,7 277,8 472,2 63,1 66,2 86,2 1,4 8,4 31,34+030 Independence Hans Dietrich Genscher 5+230 Independence Husea Kutako 1.200 60 16,7 20 16,7 58,1 16,7 277,8 922,2 91,4 96,0 116,0 1,9 10,3 37,25+230 Independence Husea Kutako 6+830 Independence Eros 1.600 60 16,7 20 16,7 83,3 16,7 277,8 1.322,2 116,6 122,5 142,5 2,4 12,7 40,46+830 Independence Eros 7+330 Independence Nelson Mandela 500 60 16,7 20 16,7 14,0 16,7 277,8 222,2 47,3 49,7 69,7 1,2 13,9 25,87+330 Independence Nelson Mandela 7+730 Independence Uhland 400 60 16,7 20 16,7 7,7 16,7 277,8 122,2 41,0 43,1 63,1 1,1 14,9 22,87+730 Independence Uhland 8+230 Independence Banhofstr. 500 60 16,7 20 16,7 14,0 16,7 277,8 222,2 47,3 49,7 69,7 1,2 16,1 25,8
8+230 Independence Banhofstr. 8+530 Railwaystation 300 60 16,7 20 16,7 1,4 16,7 277,8 22,2 34,7 36,5 56,5 0,9 17,0 19,18+530 Railwaystation 8+930 Mandume Ndemufayo Central Bus Station 400 60 16,7 20 16,7 7,7 16,7 277,8 122,2 41,0 43,1 63,1 1,1 18,1 22,8
sum 8.930 233,3 317,6 233,3 3.888,9 5.041,1 784,3 823,5 1.083,5 18,1 29,7average 638 20
average accelertion
brakingtime reserve
time of travel time
3

II: Line 2 Monte Cristo
Input Data Line 2: Monte Cristo (phase 1) Output Datamax speed 60 km/h average speed 8,3 [m/s] price / bus 3.500.000 $
1 m/s2 average speed 30,0 [km/h] places / bus (seated) 80 turn time Monte Cristo 5 min1 m/s3 places / bus (standees) 70 turn time Central Bus Station 5 min
5 % minimum round trip time: 60,0 [min] places / bus (totl) 150 time reserve at terminus station 2 min
headway 3 min need of buses 20 vehicles pass / h / dir 3.000 all buses 70.000.000 $
section distance vmax vmax stop time ditance travel time average from to acceleration continous vma x braking from t1+t3 from t2 without with with with accumulated speed incl.
t1 t2 t3 s1+s3 s2 anything timereserve stop time stop time everything
[km] Name [km] Name [m] [km/h] [m/s] [s] [s] [s] [s] [m] [m] [s] [s] [s] [min] [km/h]
0+000 Monte Cristo 0+600 Monte Cristo 600 60 16,7 0 16,7 20,3 16,7 277,8 322,2 53,6 56,3 56,3 0,9 0,9 38,40+600 Monte Cristo 1+300 Monte Cristo 700 60 16,7 20 16,7 26,6 16,7 277,8 422,2 59,9 62,9 82,9 1,4 2,3 30,41+300 Monte Cristo 2+000 Monte Cristo 700 60 16,7 20 16,7 26,6 16,7 277,8 422,2 59,9 62,9 82,9 1,4 3,7 30,42+000 Monte Cristo 2+700 Monte Cristo 700 60 16,7 20 16,7 26,6 16,7 277,8 422,2 59,9 62,9 82,9 1,4 5,1 30,42+700 Monte Cristo 3+400 Monte Cristo 700 60 16,7 20 16,7 26,6 16,7 277,8 422,2 59,9 62,9 82,9 1,4 6,5 30,43+400 Monte Cristo 3+900 Monte Cristo 500 60 16,7 20 16,7 14,0 16,7 277,8 222,2 47,3 49,7 69,7 1,2 7,6 25,83+900 Monte Cristo 4+400 Monte Cristo 500 60 16,7 20 16,7 14,0 16,7 277,8 222,2 47,3 49,7 69,7 1,2 8,8 25,84+400 Monte Cristo 5+400 Monte Cristo 1.000 60 16,7 20 16,7 45,5 16,7 277,8 722,2 78,8 82,8 102,8 1,7 10,5 35,0
5+400Monte Cristo
6+100 Hosa Kutako 700 60 16,7 20 16,7 26,6 16,7 277,8 422,2 59,9 62,9 82,9 1,4 11,9 30,4
6+100
Hosa Kutako
6+800 Hosa Kutako 700 60 16,7 20 16,7 26,6 16,7 277,8 422,2 59,9 62,9 82,9 1,4 13,3 30,4
6+800 Hosa Kutako 7+600 Hosa Kutako 800 60 16,7 20 16,7 32,9 16,7 277,8 522,2 66,2 69,5 89,5 1,5 14,8 32,27+600 Hosa Kutako 8+400 Independence 800 60 16,7 20 16,7 32,9 16,7 277,8 522,2 66,2 69,5 89,5 1,5 16,3 32,28+400 Independence 10+000 Independence 1.600 60 16,7 20 16,7 83,3 16,7 277,8 1.322,2 116,6 122,5 142,5 2,4 18,6 40,4
10+000 Independence 10+500 Independence 500 50 13,9 20 13,9 23,2 13,9 192,9 307,1 51,0 53,5 73,5 1,2 19,9 24,510+500 Independence 11+000 Independence 500 50 13,9 20 13,9 23,2 13,9 192,9 307,1 51,0 53,5 73,5 1,2 21,1 24,511+000 Independence 11+400 Independence 400 50 13,9 20 13,9 15,7 13,9 192,9 207,1 43,4 45,6 65,6 1,1 22,2 21,911+400 Independence 11+700 Railwaystation 300 50 13,9 20 13,9 8,1 13,9 192,9 107,1 35,9 37,7 57,7 1,0 23,1 18,711+700 Railwaystation 12+100 Central Bus Station 400 50 13,9 20 13,9 15,7 13,9 192,9 207,1 43,4 45,6 65,6 1,1 24,2 21,9
sum 12.100 286,1 488,3 286,1 4.575,6 7.524,4 1.060,6 1.113,6 1.453,6 24,2 30,0
average 672 20
average accelertionbraking
time reserve
time of travel time
4

III: Line 1 Independence complete
Input Data Line 1: Independence (phase 2) Output Datamax speed 50 km/h average speed 7,8 [m/s] price / bus 3.500.000 $
1 m/s2 average speed 28,1 [km/h] places / bus (seated) 80 turn time Independence Otjomuise 5 min
1 m/s3 places / bus (standees) 70 turn time University UNAM 5 min5 % minimum round trip time: 75,0 [min] places / bus (totl) 150 time reserve at terminus station 1 min3 min need of buses 25 buses pass / h / dir 3.000 all buses 87.500.000 $
section distance vma x vmax stop time ditance travel time average from to acceleration continous vmax braking from t1+t3 from t2 without with with with accumulated speed incl.
t1 t2 t3 s1+s3 s2 anything timereserve stop time stop time everything[km] Name [km] Name [m] [km/h] [m/s] [s] [s] [s] [s] [m] [m] [s] [s] [s] [min] [km/h]
0+000 Independence Otjomuise 0+700 Independence Omongo 700 60 16,7 0 16,7 26,6 16,7 277,8 422,2 59,9 62,9 62,9 1,0 1,0 40,00+700 Independence Omongo 1+200 Independence Caesar 500 60 16,7 20 16,7 14,0 16,7 277,8 222,2 47,3 49,7 69,7 1,2 2,2 25,81+200 Independence Caesar 1+650 Independence Soweto Market 450 60 16,7 20 16,7 10,9 16,7 277,8 172,2 44,2 46,4 66,4 1,1 3,3 24,41+650 Independence Soweto Market 2+230 Independence Clemence Kapuuo 580 60 16,7 20 16,7 19,0 16,7 277,8 302,2 52,4 55,0 75,0 1,2 4,6 27,82+230 Independence Clemence Kapuuo 2+780 Independence Shanghai 550 60 16,7 20 16,7 17,2 16,7 277,8 272,2 50,5 53,0 73,0 1,2 5,8 27,12+780 Independence Shanghai 3+280 Independence Wilibald Kaouenene 500 60 16,7 20 16,7 14,0 16,7 277,8 222,2 47,3 49,7 69,7 1,2 6,9 25,83+280 Independence Wilibald Kaouenene 4+030 Independence Hans Dietrich Genscher 750 60 16,7 20 16,7 29,8 16,7 277,8 472,2 63,1 66,2 86,2 1,4 8,4 31,34+030 Independence Hans Dietrich Genscher 5+230 Independence Husea Kutako 1.200 60 16,7 20 16,7 58,1 16,7 277,8 922,2 91,4 96,0 116,0 1,9 10,3 37,25+230 Independence Husea Kutako 6+830 Independence Eros 1.600 60 16,7 20 16,7 83,3 16,7 277,8 1.322,2 116,6 122,5 142,5 2,4 12,7 40,46+830 Independence Eros 7+330 Independence Nelson Mandela 500 60 16,7 20 16,7 14,0 16,7 277,8 222,2 47,3 49,7 69,7 1,2 13,9 25,87+330 Independence Nelson Mandela 7+730 Independence Uhland 400 60 16,7 20 16,7 7,7 16,7 277,8 122,2 41,0 43,1 63,1 1,1 14,9 22,87+730 Independence Uhland 8+230 Independence Banhofstr. 500 60 16,7 20 16,7 14,0 16,7 277,8 222,2 47,3 49,7 69,7 1,2 16,1 25,88+230 Independence Banhofstr. 8+530 Railwaystation 300 60 16,7 20 16,7 1,4 16,7 277,8 22,2 34,7 36,5 56,5 0,9 17,0 19,18+530 Railwaystation 8+930 Mandume Ndemufayo Central Bus Station 400 60 16,7 20 16,7 7,7 16,7 277,8 122,2 41,0 43,1 63,1 1,1 18,1 22,88+930 Mandume Ndemufayo Central Bus Station 9+480 0 0 550 60 16,7 20 16,7 17,2 16,7 277,8 272,2 50,5 53,0 73,0 1,2 19,3 27,19+480 10+030 550 60 16,7 20 16,7 17,2 16,7 277,8 272,2 50,5 53,0 73,0 1,2 20,5 27,1
10+030 10+580 550 50 13,9 20 13,9 27,0 13,9 192,9 357,1 54,8 57,5 77,5 1,3 21,8 25,510+580 11+130 550 50 13,9 20 13,9 27,0 13,9 192,9 357,1 54,8 57,5 77,5 1,3 23,1 25,511+130 11+680 550 50 13,9 20 13,9 27,0 13,9 192,9 357,1 54,8 57,5 77,5 1,3 24,4 25,511+680 12+230 550 51 14,2 20 14,2 25,9 14,2 200,7 349,3 54,2 56,9 76,9 1,3 25,6 25,712+230 12+780 550 52 14,4 20 14,4 24,8 14,4 208,6 341,4 53,7 56,4 76,4 1,3 26,9 25,912+780 13+330 550 53 14,7 20 14,7 23,8 14,7 216,7 333,3 53,2 55,9 75,9 1,3 28,2 26,113+330 13+880 550 54 15,0 20 15,0 22,8 15,0 225,0 325,0 52,8 55,4 75,4 1,3 29,4 26,313+880 14+430 550 55 15,3 20 15,3 21,8 15,3 233,4 316,6 52,3 54,9 74,9 1,2 30,7 26,414+430 14+980 University UNAM 550 56 15,6 20 15,6 20,8 15,6 242,0 308,0 51,9 54,5 74,5 1,2 31,9 26,6
sum 14.980 397,5 572,7 397,5 6.349,6 8.630,4 1.367,7 1.436,0 1.916,0 31,9 28,1average 599 20
average accelertion
braking
headway during peak hourtime reserve
time of travel time
Input Data Line 1: Independence (phase 2) Output Datamax speed 50 km/h average speed 7,8 [m/s] price / bus 3.500.000 $
1 m/s2 average speed 28,1 [km/h] places / bus (seated) 80 turn time Independence Otjomuise 5 min
1 m/s3 places / bus (standees) 70 turn time University UNAM 5 min5 % minimum round trip time: 75,0 [min] places / bus (totl) 150 time reserve at terminus station 1 min3 min need of buses 25 buses pass / h / dir 3.000 all buses 87.500.000 $
section distance vmax vma x stop time ditance travel time average from to acceleration continous vma x braking from t1+t3 from t2 without with with with accumulated speed incl.
t1 t2 t3 s1+s3 s2 anything timereserve stop time stop time everything[km] Name [km] Name [m] [km/h] [m/s] [s] [s] [s] [s] [m] [m] [s] [s] [s] [min] [km/h]
0+000 Independence Otjomuise 0+700 Independence Omongo 700 60 16,7 0 16,7 26,6 16,7 277,8 422,2 59,9 62,9 62,9 1,0 1,0 40,00+700 Independence Omongo 1+200 Independence Caesar 500 60 16,7 20 16,7 14,0 16,7 277,8 222,2 47,3 49,7 69,7 1,2 2,2 25,81+200 Independence Caesar 1+650 Independence Soweto Market 450 60 16,7 20 16,7 10,9 16,7 277,8 172,2 44,2 46,4 66,4 1,1 3,3 24,41+650 Independence Soweto Market 2+230 Independence Clemence Kapuuo 580 60 16,7 20 16,7 19,0 16,7 277,8 302,2 52,4 55,0 75,0 1,2 4,6 27,82+230 Independence Clemence Kapuuo 2+780 Independence Shanghai 550 60 16,7 20 16,7 17,2 16,7 277,8 272,2 50,5 53,0 73,0 1,2 5,8 27,12+780 Independence Shanghai 3+280 Independence Wilibald Kaouenene 500 60 16,7 20 16,7 14,0 16,7 277,8 222,2 47,3 49,7 69,7 1,2 6,9 25,83+280 Independence Wilibald Kaouenene 4+030 Independence Hans Dietrich Genscher 750 60 16,7 20 16,7 29,8 16,7 277,8 472,2 63,1 66,2 86,2 1,4 8,4 31,34+030 Independence Hans Dietrich Genscher 5+230 Independence Husea Kutako 1.200 60 16,7 20 16,7 58,1 16,7 277,8 922,2 91,4 96,0 116,0 1,9 10,3 37,25+230 Independence Husea Kutako 6+830 Independence Eros 1.600 60 16,7 20 16,7 83,3 16,7 277,8 1.322,2 116,6 122,5 142,5 2,4 12,7 40,46+830 Independence Eros 7+330 Independence Nelson Mandela 500 60 16,7 20 16,7 14,0 16,7 277,8 222,2 47,3 49,7 69,7 1,2 13,9 25,87+330 Independence Nelson Mandela 7+730 Independence Uhland 400 60 16,7 20 16,7 7,7 16,7 277,8 122,2 41,0 43,1 63,1 1,1 14,9 22,87+730 Independence Uhland 8+230 Independence Banhofstr. 500 60 16,7 20 16,7 14,0 16,7 277,8 222,2 47,3 49,7 69,7 1,2 16,1 25,88+230 Independence Banhofstr. 8+530 Railwaystation 300 60 16,7 20 16,7 1,4 16,7 277,8 22,2 34,7 36,5 56,5 0,9 17,0 19,18+530 Railwaystation 8+930 Mandume Ndemufayo Central Bus Station 400 60 16,7 20 16,7 7,7 16,7 277,8 122,2 41,0 43,1 63,1 1,1 18,1 22,88+930 Mandume Ndemufayo Central Bus Station 9+480 0 0 550 60 16,7 20 16,7 17,2 16,7 277,8 272,2 50,5 53,0 73,0 1,2 19,3 27,19+480 10+030 550 60 16,7 20 16,7 17,2 16,7 277,8 272,2 50,5 53,0 73,0 1,2 20,5 27,1
10+030 10+580 550 50 13,9 20 13,9 27,0 13,9 192,9 357,1 54,8 57,5 77,5 1,3 21,8 25,510+580 11+130 550 50 13,9 20 13,9 27,0 13,9 192,9 357,1 54,8 57,5 77,5 1,3 23,1 25,511+130 11+680 550 50 13,9 20 13,9 27,0 13,9 192,9 357,1 54,8 57,5 77,5 1,3 24,4 25,511+680 12+230 550 51 14,2 20 14,2 25,9 14,2 200,7 349,3 54,2 56,9 76,9 1,3 25,6 25,712+230 12+780 550 52 14,4 20 14,4 24,8 14,4 208,6 341,4 53,7 56,4 76,4 1,3 26,9 25,912+780 13+330 550 53 14,7 20 14,7 23,8 14,7 216,7 333,3 53,2 55,9 75,9 1,3 28,2 26,113+330 13+880 550 54 15,0 20 15,0 22,8 15,0 225,0 325,0 52,8 55,4 75,4 1,3 29,4 26,313+880 14+430 550 55 15,3 20 15,3 21,8 15,3 233,4 316,6 52,3 54,9 74,9 1,2 30,7 26,414+430 14+980 University UNAM 550 56 15,6 20 15,6 20,8 15,6 242,0 308,0 51,9 54,5 74,5 1,2 31,9 26,6
sum 14.980 397,5 572,7 397,5 6.349,6 8.630,4 1.367,7 1.436,0 1.916,0 31,9 28,1average 599 20
average accelertion
braking
headway during peak hourtime reserve
time of travel time
5

IV: Line 3 Rocky Crest
Input Data Line 3: Rocky Crest (phase 2) Output Datamax speed 50 50 km/h average speed 7,6 [m/s] price / bus 2.500.000 $
1 m/s2 average speed 27,3 [km/h] places / bus (seated) 80 turn time Indpendence Otjomuise 5 minbraking 1 m/s3 places / bus (standees) 70 turn time Mandume NdemufayoRocky Crest 5 min
5 % minimum round trip time: 85,0 [min] places / bus (totl) 150 time reserve at endstation 3 minheadway 5 min need of buses 17,0 buses pass / h / dir 1.800 all buses 42.500.000 $
section distance vmax vma x stop time ditance travel time average from to acceleration continous vma x braking from t1+t3 from t2 without with with with accumulated speed incl.
t1 t2 t3 s1+s3 s2 anything timereserve stop time stop time everything[km] Name [km] Name [m] [km/h] [m/s] [s] [s] [s] [s] [m] [m] [s] [s] [s] [min] [km/h]
0+000 Indpendence Otjomuise 0+550 2 550 50 13,9 0 13,9 27,0 13,9 192,9 357,1 54,8 57,5 57,5 1,0 1,0 34,4
0+550 2 1+100 3 550 50 13,9 20 13,9 27,0 13,9 192,9 357,1 54,8 57,5 77,5 1,3 2,3 25,5
1+100 3 1+650 4 550 50 13,9 20 13,9 27,0 13,9 192,9 357,1 54,8 57,5 77,5 1,3 3,5 25,5
1+650 4 2+200 5 550 50 13,9 20 13,9 27,0 13,9 192,9 357,1 54,8 57,5 77,5 1,3 4,8 25,5
2+200 5 2+750 6 550 50 13,9 20 13,9 27,0 13,9 192,9 357,1 54,8 57,5 77,5 1,3 6,1 25,5
2+750 6 3+300 7 550 50 13,9 20 13,9 27,0 13,9 192,9 357,1 54,8 57,5 77,5 1,3 7,4 25,5
3+300 7 3+850 8 550 50 13,9 20 13,9 27,0 13,9 192,9 357,1 54,8 57,5 77,5 1,3 8,7 25,5
3+850 8 4+400 9 550 50 13,9 20 13,9 27,0 13,9 192,9 357,1 54,8 57,5 77,5 1,3 10,0 25,5
4+400 9 4+950 10 550 50 13,9 20 13,9 27,0 13,9 192,9 357,1 54,8 57,5 77,5 1,3 11,3 25,5
4+950 10 5+500 11 550 50 13,9 20 13,9 27,0 13,9 192,9 357,1 54,8 57,5 77,5 1,3 12,6 25,5
5+500 11 6+050 12 550 50 13,9 20 13,9 27,0 13,9 192,9 357,1 54,8 57,5 77,5 1,3 13,9 25,5
6+050 12 6+600 13 550 50 13,9 20 13,9 27,0 13,9 192,9 357,1 54,8 57,5 77,5 1,3 15,2 25,5
6+600 13 7+150 14 550 50 13,9 20 13,9 27,0 13,9 192,9 357,1 54,8 57,5 77,5 1,3 16,5 25,5
7+150 14 7+700 15 550 50 13,9 20 13,9 27,0 13,9 192,9 357,1 54,8 57,5 77,5 1,3 17,8 25,5
7+700 15 8+250 16 550 50 13,9 20 13,9 27,0 13,9 192,9 357,1 54,8 57,5 77,5 1,3 19,0 25,5
8+250 16 8+800 17 550 50 13,9 20 13,9 27,0 13,9 192,9 357,1 54,8 57,5 77,5 1,3 20,3 25,5
8+800 17 9+350 18 550 50 13,9 20 13,9 27,0 13,9 192,9 357,1 54,8 57,5 77,5 1,3 21,6 25,59+350 18 9+900 19 550 50 13,9 20 13,9 27,0 13,9 192,9 357,1 54,8 57,5 77,5 1,3 22,9 25,59+900 19 10+300 20 400 50 13,9 20 13,9 15,7 13,9 192,9 207,1 43,4 45,6 65,6 1,1 24,0 21,9
10+300 20 10+700 21 400 50 13,9 20 13,9 15,7 13,9 192,9 207,1 43,4 45,6 65,6 1,1 25,1 21,910+700 21 11+550 22 850 50 13,9 20 13,9 49,7 13,9 192,9 657,1 77,5 81,3 101,3 1,7 26,8 30,211+550 22 12+250 23 700 50 13,9 20 13,9 38,3 13,9 192,9 507,1 66,1 69,4 89,4 1,5 28,3 28,212+250 23 13+450 24 1.200 50 13,9 20 13,9 76,1 13,9 192,9 1.007,1 103,9 109,1 129,1 2,2 30,4 33,513+450 24 14+100 25 650 50 13,9 20 13,9 34,6 13,9 192,9 457,1 62,3 65,5 85,5 1,4 31,9 27,414+100 25 15+300 26 1.200 50 13,9 20 13,9 76,1 13,9 192,9 1.007,1 103,9 109,1 129,1 2,2 34,0 33,515+300 26 16+400 Mandume Ndemufayo Rocky Crest 1.100 50 13,9 20 13,9 68,6 13,9 192,9 907,1 96,4 101,2 121,2 2,0 36,0 32,7
sum 16.400 361,1 860,7 361,1 5.015,4 11.384,6 1.582,9 1.662,0 2.162,0 36,0 27,3average 631 20
average accelertion
time reserve
time of travel time
6
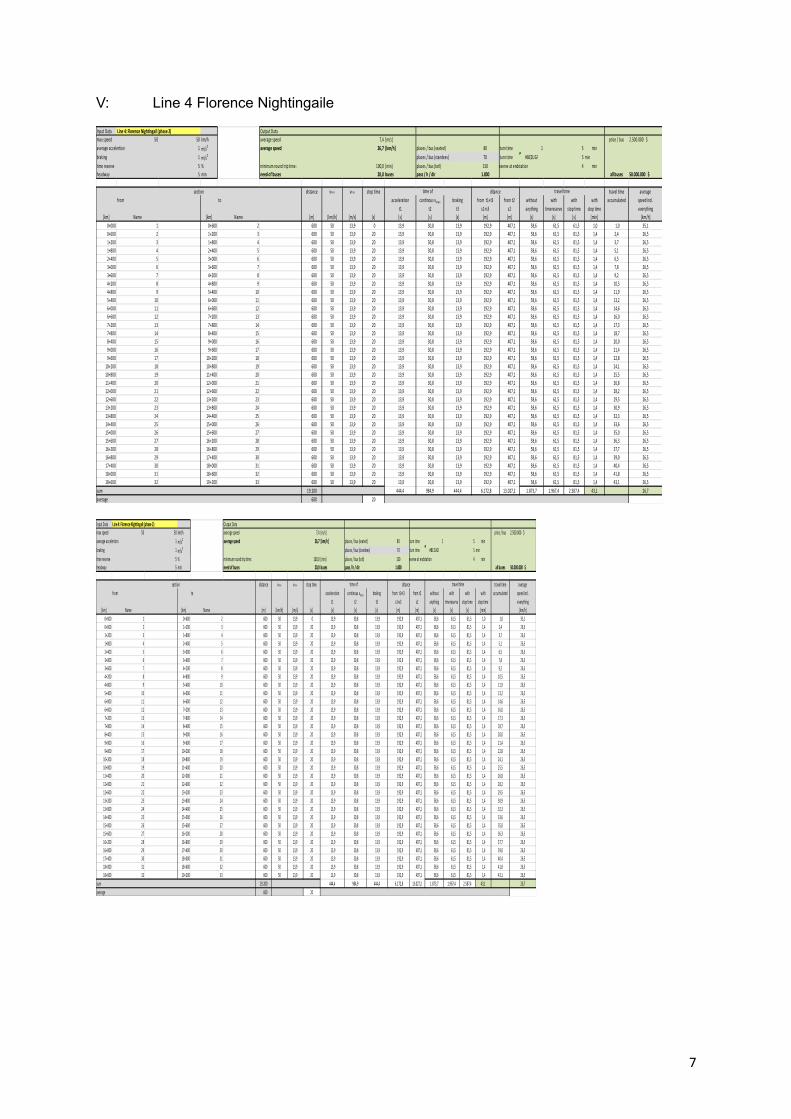
V: Line 4 Florence Nightingaile
Input Data Line 4: Florence Nightingail (phase 2) Output Datamax speed 50 50 km/h average speed 7,4 [m/s] price / bus 2.500.000 $average accelertion 1 m/s2 average speed 26,7 [km/h] places / bus (seated) 80 turn time 1 5 min
1 m/s3 places / bus (standees) 70 turn time #BEZUG! 5 mintime reserve 5 % minimum round trip time: 100,0 [min] places / bus (totl) 150 time reserve at endstation 4 min
5 min need of buses 20,0 buses pass / h / dir 1.800 all buses 50.000.000 $
section distance vmax vma x stop time ditance travel time average from to acceleration continous vma x braking from t1+t3 from t2 without with with with accumulated speed incl.
t1 t2 t3 s1+s3 s2 anything timereserve stop time stop time everything[km] Name [km] Name [m] [km/h] [m/s] [s] [s] [s] [s] [m] [m] [s] [s] [s] [min] [km/h]
0+000 1 0+600 2 600 50 13,9 0 13,9 30,8 13,9 192,9 407,1 58,6 61,5 61,5 1,0 1,0 35,10+600 2 1+200 3 600 50 13,9 20 13,9 30,8 13,9 192,9 407,1 58,6 61,5 81,5 1,4 2,4 26,51+200 3 1+800 4 600 50 13,9 20 13,9 30,8 13,9 192,9 407,1 58,6 61,5 81,5 1,4 3,7 26,51+800 4 2+400 5 600 50 13,9 20 13,9 30,8 13,9 192,9 407,1 58,6 61,5 81,5 1,4 5,1 26,52+400 5 3+000 6 600 50 13,9 20 13,9 30,8 13,9 192,9 407,1 58,6 61,5 81,5 1,4 6,5 26,53+000 6 3+600 7 600 50 13,9 20 13,9 30,8 13,9 192,9 407,1 58,6 61,5 81,5 1,4 7,8 26,53+600 7 4+200 8 600 50 13,9 20 13,9 30,8 13,9 192,9 407,1 58,6 61,5 81,5 1,4 9,2 26,54+200 8 4+800 9 600 50 13,9 20 13,9 30,8 13,9 192,9 407,1 58,6 61,5 81,5 1,4 10,5 26,54+800 9 5+400 10 600 50 13,9 20 13,9 30,8 13,9 192,9 407,1 58,6 61,5 81,5 1,4 11,9 26,55+400 10 6+000 11 600 50 13,9 20 13,9 30,8 13,9 192,9 407,1 58,6 61,5 81,5 1,4 13,2 26,56+000 11 6+600 12 600 50 13,9 20 13,9 30,8 13,9 192,9 407,1 58,6 61,5 81,5 1,4 14,6 26,56+600 12 7+200 13 600 50 13,9 20 13,9 30,8 13,9 192,9 407,1 58,6 61,5 81,5 1,4 16,0 26,57+200 13 7+800 14 600 50 13,9 20 13,9 30,8 13,9 192,9 407,1 58,6 61,5 81,5 1,4 17,3 26,57+800 14 8+400 15 600 50 13,9 20 13,9 30,8 13,9 192,9 407,1 58,6 61,5 81,5 1,4 18,7 26,58+400 15 9+000 16 600 50 13,9 20 13,9 30,8 13,9 192,9 407,1 58,6 61,5 81,5 1,4 20,0 26,59+000 16 9+600 17 600 50 13,9 20 13,9 30,8 13,9 192,9 407,1 58,6 61,5 81,5 1,4 21,4 26,59+600 17 10+200 18 600 50 13,9 20 13,9 30,8 13,9 192,9 407,1 58,6 61,5 81,5 1,4 22,8 26,5
10+200 18 10+800 19 600 50 13,9 20 13,9 30,8 13,9 192,9 407,1 58,6 61,5 81,5 1,4 24,1 26,510+800 19 11+400 20 600 50 13,9 20 13,9 30,8 13,9 192,9 407,1 58,6 61,5 81,5 1,4 25,5 26,511+400 20 12+000 21 600 50 13,9 20 13,9 30,8 13,9 192,9 407,1 58,6 61,5 81,5 1,4 26,8 26,512+000 21 12+600 22 600 50 13,9 20 13,9 30,8 13,9 192,9 407,1 58,6 61,5 81,5 1,4 28,2 26,512+600 22 13+200 23 600 50 13,9 20 13,9 30,8 13,9 192,9 407,1 58,6 61,5 81,5 1,4 29,5 26,513+200 23 13+800 24 600 50 13,9 20 13,9 30,8 13,9 192,9 407,1 58,6 61,5 81,5 1,4 30,9 26,513+800 24 14+400 25 600 50 13,9 20 13,9 30,8 13,9 192,9 407,1 58,6 61,5 81,5 1,4 32,3 26,514+400 25 15+000 26 600 50 13,9 20 13,9 30,8 13,9 192,9 407,1 58,6 61,5 81,5 1,4 33,6 26,515+000 26 15+600 27 600 50 13,9 20 13,9 30,8 13,9 192,9 407,1 58,6 61,5 81,5 1,4 35,0 26,515+600 27 16+200 28 600 50 13,9 20 13,9 30,8 13,9 192,9 407,1 58,6 61,5 81,5 1,4 36,3 26,516+200 28 16+800 29 600 50 13,9 20 13,9 30,8 13,9 192,9 407,1 58,6 61,5 81,5 1,4 37,7 26,516+800 29 17+400 30 600 50 13,9 20 13,9 30,8 13,9 192,9 407,1 58,6 61,5 81,5 1,4 39,0 26,517+400 30 18+000 31 600 50 13,9 20 13,9 30,8 13,9 192,9 407,1 58,6 61,5 81,5 1,4 40,4 26,518+000 31 18+600 32 600 50 13,9 20 13,9 30,8 13,9 192,9 407,1 58,6 61,5 81,5 1,4 41,8 26,518+600 32 19+200 33 600 50 13,9 20 13,9 30,8 13,9 192,9 407,1 58,6 61,5 81,5 1,4 43,1 26,5
sum 19.200 444,4 984,9 444,4 6.172,8 13.027,2 1.873,7 1.967,4 2.587,4 43,1 26,7average 600 20
braking
headway
time of travel time
Input Data Line 4: Florence Nightingail (phase 2) Output Datamax speed 50 50 km/h average speed 7,4 [m/s] price / bus 2.500.000 $average accelertion 1 m/s2 average speed 26,7 [km/h] places / bus (seated) 80 turn time 1 5 min
1 m/s3 places / bus (standees) 70 turn time #BEZUG! 5 mintime reserve 5 % minimum round trip time: 100,0 [min] places / bus (totl) 150 time reserve at endstation 4 min
5 min need of buses 20,0 buses pass / h / dir 1.800 all buses 50.000.000 $
section distance vmax vmax stop time ditance travel time average from to acceleration continous vma x braking from t1+t3 from t2 without with with with accumulated speed incl.
t1 t2 t3 s1+s3 s2 anything timereserve stop time stop time everything[km] Name [km] Name [m] [km/h] [m/s] [s] [s] [s] [s] [m] [m] [s] [s] [s] [min] [km/h]
0+000 1 0+600 2 600 50 13,9 0 13,9 30,8 13,9 192,9 407,1 58,6 61,5 61,5 1,0 1,0 35,10+600 2 1+200 3 600 50 13,9 20 13,9 30,8 13,9 192,9 407,1 58,6 61,5 81,5 1,4 2,4 26,51+200 3 1+800 4 600 50 13,9 20 13,9 30,8 13,9 192,9 407,1 58,6 61,5 81,5 1,4 3,7 26,51+800 4 2+400 5 600 50 13,9 20 13,9 30,8 13,9 192,9 407,1 58,6 61,5 81,5 1,4 5,1 26,52+400 5 3+000 6 600 50 13,9 20 13,9 30,8 13,9 192,9 407,1 58,6 61,5 81,5 1,4 6,5 26,53+000 6 3+600 7 600 50 13,9 20 13,9 30,8 13,9 192,9 407,1 58,6 61,5 81,5 1,4 7,8 26,53+600 7 4+200 8 600 50 13,9 20 13,9 30,8 13,9 192,9 407,1 58,6 61,5 81,5 1,4 9,2 26,54+200 8 4+800 9 600 50 13,9 20 13,9 30,8 13,9 192,9 407,1 58,6 61,5 81,5 1,4 10,5 26,54+800 9 5+400 10 600 50 13,9 20 13,9 30,8 13,9 192,9 407,1 58,6 61,5 81,5 1,4 11,9 26,55+400 10 6+000 11 600 50 13,9 20 13,9 30,8 13,9 192,9 407,1 58,6 61,5 81,5 1,4 13,2 26,56+000 11 6+600 12 600 50 13,9 20 13,9 30,8 13,9 192,9 407,1 58,6 61,5 81,5 1,4 14,6 26,56+600 12 7+200 13 600 50 13,9 20 13,9 30,8 13,9 192,9 407,1 58,6 61,5 81,5 1,4 16,0 26,57+200 13 7+800 14 600 50 13,9 20 13,9 30,8 13,9 192,9 407,1 58,6 61,5 81,5 1,4 17,3 26,57+800 14 8+400 15 600 50 13,9 20 13,9 30,8 13,9 192,9 407,1 58,6 61,5 81,5 1,4 18,7 26,58+400 15 9+000 16 600 50 13,9 20 13,9 30,8 13,9 192,9 407,1 58,6 61,5 81,5 1,4 20,0 26,59+000 16 9+600 17 600 50 13,9 20 13,9 30,8 13,9 192,9 407,1 58,6 61,5 81,5 1,4 21,4 26,59+600 17 10+200 18 600 50 13,9 20 13,9 30,8 13,9 192,9 407,1 58,6 61,5 81,5 1,4 22,8 26,5
10+200 18 10+800 19 600 50 13,9 20 13,9 30,8 13,9 192,9 407,1 58,6 61,5 81,5 1,4 24,1 26,510+800 19 11+400 20 600 50 13,9 20 13,9 30,8 13,9 192,9 407,1 58,6 61,5 81,5 1,4 25,5 26,511+400 20 12+000 21 600 50 13,9 20 13,9 30,8 13,9 192,9 407,1 58,6 61,5 81,5 1,4 26,8 26,512+000 21 12+600 22 600 50 13,9 20 13,9 30,8 13,9 192,9 407,1 58,6 61,5 81,5 1,4 28,2 26,512+600 22 13+200 23 600 50 13,9 20 13,9 30,8 13,9 192,9 407,1 58,6 61,5 81,5 1,4 29,5 26,513+200 23 13+800 24 600 50 13,9 20 13,9 30,8 13,9 192,9 407,1 58,6 61,5 81,5 1,4 30,9 26,513+800 24 14+400 25 600 50 13,9 20 13,9 30,8 13,9 192,9 407,1 58,6 61,5 81,5 1,4 32,3 26,514+400 25 15+000 26 600 50 13,9 20 13,9 30,8 13,9 192,9 407,1 58,6 61,5 81,5 1,4 33,6 26,515+000 26 15+600 27 600 50 13,9 20 13,9 30,8 13,9 192,9 407,1 58,6 61,5 81,5 1,4 35,0 26,515+600 27 16+200 28 600 50 13,9 20 13,9 30,8 13,9 192,9 407,1 58,6 61,5 81,5 1,4 36,3 26,516+200 28 16+800 29 600 50 13,9 20 13,9 30,8 13,9 192,9 407,1 58,6 61,5 81,5 1,4 37,7 26,516+800 29 17+400 30 600 50 13,9 20 13,9 30,8 13,9 192,9 407,1 58,6 61,5 81,5 1,4 39,0 26,517+400 30 18+000 31 600 50 13,9 20 13,9 30,8 13,9 192,9 407,1 58,6 61,5 81,5 1,4 40,4 26,518+000 31 18+600 32 600 50 13,9 20 13,9 30,8 13,9 192,9 407,1 58,6 61,5 81,5 1,4 41,8 26,518+600 32 19+200 33 600 50 13,9 20 13,9 30,8 13,9 192,9 407,1 58,6 61,5 81,5 1,4 43,1 26,5
sum 19.200 444,4 984,9 444,4 6.172,8 13.027,2 1.873,7 1.967,4 2.587,4 43,1 26,7average 600 20
braking
headway
time of travel time
7
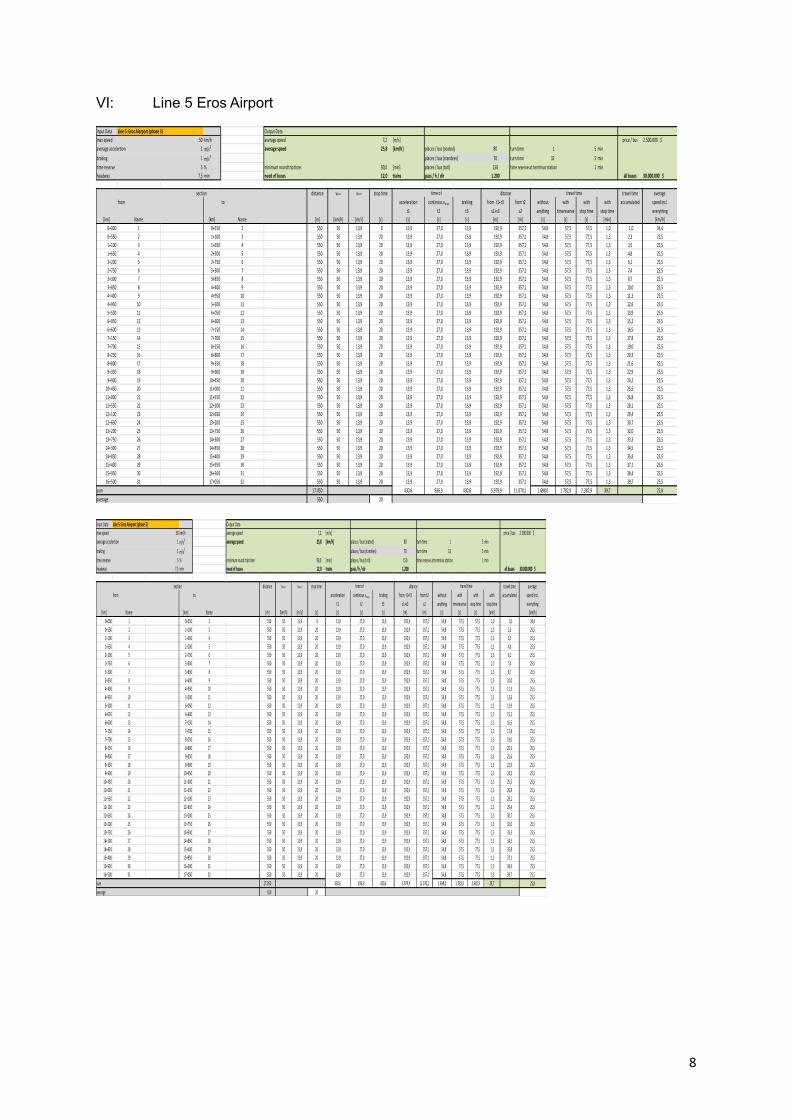
VI: Line 5 Eros Airport
Input Data Line 5: Eros Aierport (phase 3) Output Datamax speed 50 km/h average speed 7,2 [m/s] price / bus 2.500.000 $
1 m/s2 average speed 25,8 [km/h] places / bus (seated) 80 turn time 1 5 min1 m/s3 places / bus (standees) 70 turn time 32 5 min5 % minimum round trip time: 90,0 [min] places / bus (totl) 150 time reserve at terminus station 1 min
headway 7,5 min need of buses 12,0 trains pass / h / dir 1.200 all buses 30.000.000 $
section distance vmax vma x stop time ditance travel time average from to acceleration continous vma x braking from t1+t3 from t2 without with with with accumulated speed incl.
t1 t2 t3 s1+s3 s2 anything timereserve stop time stop time everything[km] Name [km] Name [m] [km/h] [m/s] [s] [s] [s] [s] [m] [m] [s] [s] [s] [min] [km/h]
0+000 1 0+550 2 550 50 13,9 0 13,9 27,0 13,9 192,9 357,1 54,8 57,5 57,5 1,0 1,0 34,40+550 2 1+100 3 550 50 13,9 20 13,9 27,0 13,9 192,9 357,1 54,8 57,5 77,5 1,3 2,3 25,51+100 3 1+650 4 550 50 13,9 20 13,9 27,0 13,9 192,9 357,1 54,8 57,5 77,5 1,3 3,5 25,51+650 4 2+200 5 550 50 13,9 20 13,9 27,0 13,9 192,9 357,1 54,8 57,5 77,5 1,3 4,8 25,52+200 5 2+750 6 550 50 13,9 20 13,9 27,0 13,9 192,9 357,1 54,8 57,5 77,5 1,3 6,1 25,52+750 6 3+300 7 550 50 13,9 20 13,9 27,0 13,9 192,9 357,1 54,8 57,5 77,5 1,3 7,4 25,53+300 7 3+850 8 550 50 13,9 20 13,9 27,0 13,9 192,9 357,1 54,8 57,5 77,5 1,3 8,7 25,53+850 8 4+400 9 550 50 13,9 20 13,9 27,0 13,9 192,9 357,1 54,8 57,5 77,5 1,3 10,0 25,54+400 9 4+950 10 550 50 13,9 20 13,9 27,0 13,9 192,9 357,1 54,8 57,5 77,5 1,3 11,3 25,54+950 10 5+500 11 550 50 13,9 20 13,9 27,0 13,9 192,9 357,1 54,8 57,5 77,5 1,3 12,6 25,55+500 11 6+050 12 550 50 13,9 20 13,9 27,0 13,9 192,9 357,1 54,8 57,5 77,5 1,3 13,9 25,56+050 12 6+600 13 550 50 13,9 20 13,9 27,0 13,9 192,9 357,1 54,8 57,5 77,5 1,3 15,2 25,56+600 13 7+150 14 550 50 13,9 20 13,9 27,0 13,9 192,9 357,1 54,8 57,5 77,5 1,3 16,5 25,57+150 14 7+700 15 550 50 13,9 20 13,9 27,0 13,9 192,9 357,1 54,8 57,5 77,5 1,3 17,8 25,57+700 15 8+250 16 550 50 13,9 20 13,9 27,0 13,9 192,9 357,1 54,8 57,5 77,5 1,3 19,0 25,58+250 16 8+800 17 550 50 13,9 20 13,9 27,0 13,9 192,9 357,1 54,8 57,5 77,5 1,3 20,3 25,58+800 17 9+350 18 550 50 13,9 20 13,9 27,0 13,9 192,9 357,1 54,8 57,5 77,5 1,3 21,6 25,59+350 18 9+900 19 550 50 13,9 20 13,9 27,0 13,9 192,9 357,1 54,8 57,5 77,5 1,3 22,9 25,59+900 19 10+450 20 550 50 13,9 20 13,9 27,0 13,9 192,9 357,1 54,8 57,5 77,5 1,3 24,2 25,5
10+450 20 11+000 21 550 50 13,9 20 13,9 27,0 13,9 192,9 357,1 54,8 57,5 77,5 1,3 25,5 25,511+000 21 11+550 22 550 50 13,9 20 13,9 27,0 13,9 192,9 357,1 54,8 57,5 77,5 1,3 26,8 25,511+550 22 12+100 23 550 50 13,9 20 13,9 27,0 13,9 192,9 357,1 54,8 57,5 77,5 1,3 28,1 25,512+100 23 12+650 24 550 50 13,9 20 13,9 27,0 13,9 192,9 357,1 54,8 57,5 77,5 1,3 29,4 25,512+650 24 13+200 25 550 50 13,9 20 13,9 27,0 13,9 192,9 357,1 54,8 57,5 77,5 1,3 30,7 25,513+200 25 13+750 26 550 50 13,9 20 13,9 27,0 13,9 192,9 357,1 54,8 57,5 77,5 1,3 32,0 25,513+750 26 14+300 27 550 50 13,9 20 13,9 27,0 13,9 192,9 357,1 54,8 57,5 77,5 1,3 33,3 25,514+300 27 14+850 28 550 50 13,9 20 13,9 27,0 13,9 192,9 357,1 54,8 57,5 77,5 1,3 34,5 25,514+850 28 15+400 29 550 50 13,9 20 13,9 27,0 13,9 192,9 357,1 54,8 57,5 77,5 1,3 35,8 25,515+400 29 15+950 30 550 50 13,9 20 13,9 27,0 13,9 192,9 357,1 54,8 57,5 77,5 1,3 37,1 25,515+950 30 16+500 31 550 50 13,9 20 13,9 27,0 13,9 192,9 357,1 54,8 57,5 77,5 1,3 38,4 25,516+500 31 17+050 32 550 50 13,9 20 13,9 27,0 13,9 192,9 357,1 54,8 57,5 77,5 1,3 39,7 25,5
sum 17.050 430,6 836,9 430,6 5.979,9 11.070,1 1.698,0 1.782,9 2.382,9 39,7 25,8average 550 20
time reserve
average accelertionbraking
time of travel time
Input Data Line 5: Eros Aierport (phase 3) Output Datamax speed 50 km/h average speed 7,2 [m/s] price / bus 2.500.000 $
1 m/s2 average speed 25,8 [km/h] places / bus (seated) 80 turn time 1 5 min1 m/s3 places / bus (standees) 70 turn time 32 5 min5 % minimum round trip time: 90,0 [min] places / bus (totl) 150 time reserve at terminus station 1 min
headway 7,5 min need of buses 12,0 trains pass / h / dir 1.200 all buses 30.000.000 $
section distance vm ax vmax stop time ditance travel time average from to acceleration continous vm a x braking from t1+t3 from t2 without with with with accumulated speed incl.
t1 t2 t3 s1+s3 s2 anything timereserve stop time stop time everything[km] Name [km] Name [m] [km/h] [m/s] [s] [s] [s] [s] [m] [m] [s] [s] [s] [min] [km/h]
0+000 1 0+550 2 550 50 13,9 0 13,9 27,0 13,9 192,9 357,1 54,8 57,5 57,5 1,0 1,0 34,40+550 2 1+100 3 550 50 13,9 20 13,9 27,0 13,9 192,9 357,1 54,8 57,5 77,5 1,3 2,3 25,51+100 3 1+650 4 550 50 13,9 20 13,9 27,0 13,9 192,9 357,1 54,8 57,5 77,5 1,3 3,5 25,51+650 4 2+200 5 550 50 13,9 20 13,9 27,0 13,9 192,9 357,1 54,8 57,5 77,5 1,3 4,8 25,52+200 5 2+750 6 550 50 13,9 20 13,9 27,0 13,9 192,9 357,1 54,8 57,5 77,5 1,3 6,1 25,52+750 6 3+300 7 550 50 13,9 20 13,9 27,0 13,9 192,9 357,1 54,8 57,5 77,5 1,3 7,4 25,53+300 7 3+850 8 550 50 13,9 20 13,9 27,0 13,9 192,9 357,1 54,8 57,5 77,5 1,3 8,7 25,53+850 8 4+400 9 550 50 13,9 20 13,9 27,0 13,9 192,9 357,1 54,8 57,5 77,5 1,3 10,0 25,54+400 9 4+950 10 550 50 13,9 20 13,9 27,0 13,9 192,9 357,1 54,8 57,5 77,5 1,3 11,3 25,54+950 10 5+500 11 550 50 13,9 20 13,9 27,0 13,9 192,9 357,1 54,8 57,5 77,5 1,3 12,6 25,55+500 11 6+050 12 550 50 13,9 20 13,9 27,0 13,9 192,9 357,1 54,8 57,5 77,5 1,3 13,9 25,56+050 12 6+600 13 550 50 13,9 20 13,9 27,0 13,9 192,9 357,1 54,8 57,5 77,5 1,3 15,2 25,56+600 13 7+150 14 550 50 13,9 20 13,9 27,0 13,9 192,9 357,1 54,8 57,5 77,5 1,3 16,5 25,57+150 14 7+700 15 550 50 13,9 20 13,9 27,0 13,9 192,9 357,1 54,8 57,5 77,5 1,3 17,8 25,57+700 15 8+250 16 550 50 13,9 20 13,9 27,0 13,9 192,9 357,1 54,8 57,5 77,5 1,3 19,0 25,58+250 16 8+800 17 550 50 13,9 20 13,9 27,0 13,9 192,9 357,1 54,8 57,5 77,5 1,3 20,3 25,58+800 17 9+350 18 550 50 13,9 20 13,9 27,0 13,9 192,9 357,1 54,8 57,5 77,5 1,3 21,6 25,59+350 18 9+900 19 550 50 13,9 20 13,9 27,0 13,9 192,9 357,1 54,8 57,5 77,5 1,3 22,9 25,59+900 19 10+450 20 550 50 13,9 20 13,9 27,0 13,9 192,9 357,1 54,8 57,5 77,5 1,3 24,2 25,5
10+450 20 11+000 21 550 50 13,9 20 13,9 27,0 13,9 192,9 357,1 54,8 57,5 77,5 1,3 25,5 25,511+000 21 11+550 22 550 50 13,9 20 13,9 27,0 13,9 192,9 357,1 54,8 57,5 77,5 1,3 26,8 25,511+550 22 12+100 23 550 50 13,9 20 13,9 27,0 13,9 192,9 357,1 54,8 57,5 77,5 1,3 28,1 25,512+100 23 12+650 24 550 50 13,9 20 13,9 27,0 13,9 192,9 357,1 54,8 57,5 77,5 1,3 29,4 25,512+650 24 13+200 25 550 50 13,9 20 13,9 27,0 13,9 192,9 357,1 54,8 57,5 77,5 1,3 30,7 25,513+200 25 13+750 26 550 50 13,9 20 13,9 27,0 13,9 192,9 357,1 54,8 57,5 77,5 1,3 32,0 25,513+750 26 14+300 27 550 50 13,9 20 13,9 27,0 13,9 192,9 357,1 54,8 57,5 77,5 1,3 33,3 25,514+300 27 14+850 28 550 50 13,9 20 13,9 27,0 13,9 192,9 357,1 54,8 57,5 77,5 1,3 34,5 25,514+850 28 15+400 29 550 50 13,9 20 13,9 27,0 13,9 192,9 357,1 54,8 57,5 77,5 1,3 35,8 25,515+400 29 15+950 30 550 50 13,9 20 13,9 27,0 13,9 192,9 357,1 54,8 57,5 77,5 1,3 37,1 25,515+950 30 16+500 31 550 50 13,9 20 13,9 27,0 13,9 192,9 357,1 54,8 57,5 77,5 1,3 38,4 25,516+500 31 17+050 32 550 50 13,9 20 13,9 27,0 13,9 192,9 357,1 54,8 57,5 77,5 1,3 39,7 25,5
sum 17.050 430,6 836,9 430,6 5.979,9 11.070,1 1.698,0 1.782,9 2.382,9 39,7 25,8average 550 20
time reserve
average accelertionbraking
time of travel time
8

VII: Line 6 Hosea Kutako
Input Data Line 6: Hosea Kotako (phase 3) Output Datamax speed 50 km/h average speed 7,2 [m/s] price / bus 2.500.000 $
1 m/s2 average speed 25,7 [km/h] places / bus (seated) 80 turn time 1 5 min1 m/s3 places / bus (standees) 70 turn time 34 5 min5 % minimum round trip time: 97,5 [min] places / bus (totl) 150 time reserve at terminus station 3 min
headway 7,5 min need of buses 13,0 trains pass / h / dir 1.200 all buses 32.500.000 $
section distance vmax vmax stop time ditance Fahrzeit travel time average from to acceleration continous vma x braking from t1+t3 from t2 without with with with accumulated speed incl.
t1 t2 t3 s1+s3 s2 anything timereserve stop time stop time everything[km] Name [km] Name [m] [km/h] [m/s] [s] [s] [s] [s] [m] [m] [s] [s] [s] [min] [km/h]
0+000 1 0+550 2 550 50 13,9 0 13,9 27,0 13,9 192,9 357,1 54,8 57,5 57,5 1,0 1,0 34,40+550 2 1+100 3 550 50 13,9 20 13,9 27,0 13,9 192,9 357,1 54,8 57,5 77,5 1,3 2,3 25,51+100 3 1+650 4 550 50 13,9 20 13,9 27,0 13,9 192,9 357,1 54,8 57,5 77,5 1,3 3,5 25,51+650 4 2+200 5 550 50 13,9 20 13,9 27,0 13,9 192,9 357,1 54,8 57,5 77,5 1,3 4,8 25,52+200 5 2+750 6 550 50 13,9 20 13,9 27,0 13,9 192,9 357,1 54,8 57,5 77,5 1,3 6,1 25,52+750 6 3+300 7 550 50 13,9 20 13,9 27,0 13,9 192,9 357,1 54,8 57,5 77,5 1,3 7,4 25,53+300 7 3+850 8 550 50 13,9 20 13,9 27,0 13,9 192,9 357,1 54,8 57,5 77,5 1,3 8,7 25,53+850 8 4+400 9 550 50 13,9 20 13,9 27,0 13,9 192,9 357,1 54,8 57,5 77,5 1,3 10,0 25,54+400 9 4+950 10 550 50 13,9 20 13,9 27,0 13,9 192,9 357,1 54,8 57,5 77,5 1,3 11,3 25,54+950 10 5+500 11 550 50 13,9 20 13,9 27,0 13,9 192,9 357,1 54,8 57,5 77,5 1,3 12,6 25,55+500 11 6+050 12 550 50 13,9 20 13,9 27,0 13,9 192,9 357,1 54,8 57,5 77,5 1,3 13,9 25,56+050 12 6+600 13 550 50 13,9 20 13,9 27,0 13,9 192,9 357,1 54,8 57,5 77,5 1,3 15,2 25,56+600 13 7+150 14 550 50 13,9 20 13,9 27,0 13,9 192,9 357,1 54,8 57,5 77,5 1,3 16,5 25,57+150 14 7+700 15 550 50 13,9 20 13,9 27,0 13,9 192,9 357,1 54,8 57,5 77,5 1,3 17,8 25,57+700 15 8+250 16 550 50 13,9 20 13,9 27,0 13,9 192,9 357,1 54,8 57,5 77,5 1,3 19,0 25,58+250 16 8+800 17 550 50 13,9 20 13,9 27,0 13,9 192,9 357,1 54,8 57,5 77,5 1,3 20,3 25,58+800 17 9+350 18 550 50 13,9 20 13,9 27,0 13,9 192,9 357,1 54,8 57,5 77,5 1,3 21,6 25,59+350 18 9+900 19 550 50 13,9 20 13,9 27,0 13,9 192,9 357,1 54,8 57,5 77,5 1,3 22,9 25,59+900 19 10+450 20 550 50 13,9 20 13,9 27,0 13,9 192,9 357,1 54,8 57,5 77,5 1,3 24,2 25,5
10+450 20 11+000 21 550 50 13,9 20 13,9 27,0 13,9 192,9 357,1 54,8 57,5 77,5 1,3 25,5 25,511+000 21 11+550 22 550 50 13,9 20 13,9 27,0 13,9 192,9 357,1 54,8 57,5 77,5 1,3 26,8 25,511+550 22 12+100 23 550 50 13,9 20 13,9 27,0 13,9 192,9 357,1 54,8 57,5 77,5 1,3 28,1 25,512+100 23 12+650 24 550 50 13,9 20 13,9 27,0 13,9 192,9 357,1 54,8 57,5 77,5 1,3 29,4 25,512+650 24 13+200 25 550 50 13,9 20 13,9 27,0 13,9 192,9 357,1 54,8 57,5 77,5 1,3 30,7 25,513+200 25 13+750 26 550 50 13,9 20 13,9 27,0 13,9 192,9 357,1 54,8 57,5 77,5 1,3 32,0 25,513+750 26 14+300 27 550 50 13,9 20 13,9 27,0 13,9 192,9 357,1 54,8 57,5 77,5 1,3 33,3 25,514+300 27 14+850 28 550 50 13,9 20 13,9 27,0 13,9 192,9 357,1 54,8 57,5 77,5 1,3 34,5 25,514+850 28 15+400 29 550 50 13,9 20 13,9 27,0 13,9 192,9 357,1 54,8 57,5 77,5 1,3 35,8 25,515+400 29 15+950 30 550 50 13,9 20 13,9 27,0 13,9 192,9 357,1 54,8 57,5 77,5 1,3 37,1 25,515+950 30 16+500 31 550 50 13,9 20 13,9 27,0 13,9 192,9 357,1 54,8 57,5 77,5 1,3 38,4 25,516+500 31 17+050 32 550 50 13,9 20 13,9 27,0 13,9 192,9 357,1 54,8 57,5 77,5 1,3 39,7 25,517+050 32 17+600 33 550 50 13,9 20 13,9 27,0 13,9 192,9 357,1 54,8 57,5 77,5 1,3 41,0 25,517+600 33 18+150 34 550 50 13,9 20 13,9 27,0 13,9 192,9 357,1 54,8 57,5 77,5 1,3 42,3 25,5
sum 18.150 458,3 890,9 458,3 6.365,7 11.784,3 1.807,6 1.897,9 2.537,9 42,3 25,7average 550 20
average accelertionbrakingtime reserve
time of
Input Data Line 6: Hosea Kotako (phase 3) Output Datamax speed 50 km/h average speed 7,2 [m/s] price / bus 2.500.000 $
1 m/s2 average speed 25,7 [km/h] places / bus (seated) 80 turn time 1 5 min1 m/s3 places / bus (standees) 70 turn time 34 5 min5 % minimum round trip time: 97,5 [min] places / bus (totl) 150 time reserve at terminus station 3 min
headway 7,5 min need of buses 13,0 trains pass / h / dir 1.200 all buses 32.500.000 $
section distance vmax vmax stop time ditance Fahrzeit travel time average from to acceleratio n continous vma x braking from t1+t3 from t2 without with with with accumulated speed incl.
t1 t2 t3 s1+s3 s2 anything timereserve stop time sto p time everything[km] Name [km] Name [m] [km/h] [m/s] [s] [s] [s] [s] [m] [m] [s] [s] [s] [min] [km/h]
0+000 1 0+550 2 550 50 13,9 0 13,9 27,0 13,9 192,9 357,1 54,8 57,5 57,5 1,0 1,0 34,40+550 2 1+100 3 550 50 13,9 20 13,9 27,0 13,9 192,9 357,1 54,8 57,5 77,5 1,3 2,3 25,51+100 3 1+650 4 550 50 13,9 20 13,9 27,0 13,9 192,9 357,1 54,8 57,5 77,5 1,3 3,5 25,51+650 4 2+200 5 550 50 13,9 20 13,9 27,0 13,9 192,9 357,1 54,8 57,5 77,5 1,3 4,8 25,52+200 5 2+750 6 550 50 13,9 20 13,9 27,0 13,9 192,9 357,1 54,8 57,5 77,5 1,3 6,1 25,52+750 6 3+300 7 550 50 13,9 20 13,9 27,0 13,9 192,9 357,1 54,8 57,5 77,5 1,3 7,4 25,53+300 7 3+850 8 550 50 13,9 20 13,9 27,0 13,9 192,9 357,1 54,8 57,5 77,5 1,3 8,7 25,53+850 8 4+400 9 550 50 13,9 20 13,9 27,0 13,9 192,9 357,1 54,8 57,5 77,5 1,3 10,0 25,54+400 9 4+950 10 550 50 13,9 20 13,9 27,0 13,9 192,9 357,1 54,8 57,5 77,5 1,3 11,3 25,54+950 10 5+500 11 550 50 13,9 20 13,9 27,0 13,9 192,9 357,1 54,8 57,5 77,5 1,3 12,6 25,55+500 11 6+050 12 550 50 13,9 20 13,9 27,0 13,9 192,9 357,1 54,8 57,5 77,5 1,3 13,9 25,56+050 12 6+600 13 550 50 13,9 20 13,9 27,0 13,9 192,9 357,1 54,8 57,5 77,5 1,3 15,2 25,56+600 13 7+150 14 550 50 13,9 20 13,9 27,0 13,9 192,9 357,1 54,8 57,5 77,5 1,3 16,5 25,57+150 14 7+700 15 550 50 13,9 20 13,9 27,0 13,9 192,9 357,1 54,8 57,5 77,5 1,3 17,8 25,57+700 15 8+250 16 550 50 13,9 20 13,9 27,0 13,9 192,9 357,1 54,8 57,5 77,5 1,3 19,0 25,58+250 16 8+800 17 550 50 13,9 20 13,9 27,0 13,9 192,9 357,1 54,8 57,5 77,5 1,3 20,3 25,58+800 17 9+350 18 550 50 13,9 20 13,9 27,0 13,9 192,9 357,1 54,8 57,5 77,5 1,3 21,6 25,59+350 18 9+900 19 550 50 13,9 20 13,9 27,0 13,9 192,9 357,1 54,8 57,5 77,5 1,3 22,9 25,59+900 19 10+450 20 550 50 13,9 20 13,9 27,0 13,9 192,9 357,1 54,8 57,5 77,5 1,3 24,2 25,5
10+450 20 11+000 21 550 50 13,9 20 13,9 27,0 13,9 192,9 357,1 54,8 57,5 77,5 1,3 25,5 25,511+000 21 11+550 22 550 50 13,9 20 13,9 27,0 13,9 192,9 357,1 54,8 57,5 77,5 1,3 26,8 25,511+550 22 12+100 23 550 50 13,9 20 13,9 27,0 13,9 192,9 357,1 54,8 57,5 77,5 1,3 28,1 25,512+100 23 12+650 24 550 50 13,9 20 13,9 27,0 13,9 192,9 357,1 54,8 57,5 77,5 1,3 29,4 25,512+650 24 13+200 25 550 50 13,9 20 13,9 27,0 13,9 192,9 357,1 54,8 57,5 77,5 1,3 30,7 25,513+200 25 13+750 26 550 50 13,9 20 13,9 27,0 13,9 192,9 357,1 54,8 57,5 77,5 1,3 32,0 25,513+750 26 14+300 27 550 50 13,9 20 13,9 27,0 13,9 192,9 357,1 54,8 57,5 77,5 1,3 33,3 25,514+300 27 14+850 28 550 50 13,9 20 13,9 27,0 13,9 192,9 357,1 54,8 57,5 77,5 1,3 34,5 25,514+850 28 15+400 29 550 50 13,9 20 13,9 27,0 13,9 192,9 357,1 54,8 57,5 77,5 1,3 35,8 25,515+400 29 15+950 30 550 50 13,9 20 13,9 27,0 13,9 192,9 357,1 54,8 57,5 77,5 1,3 37,1 25,515+950 30 16+500 31 550 50 13,9 20 13,9 27,0 13,9 192,9 357,1 54,8 57,5 77,5 1,3 38,4 25,516+500 31 17+050 32 550 50 13,9 20 13,9 27,0 13,9 192,9 357,1 54,8 57,5 77,5 1,3 39,7 25,517+050 32 17+600 33 550 50 13,9 20 13,9 27,0 13,9 192,9 357,1 54,8 57,5 77,5 1,3 41,0 25,517+600 33 18+150 34 550 50 13,9 20 13,9 27,0 13,9 192,9 357,1 54,8 57,5 77,5 1,3 42,3 25,5
sum 18.150 458,3 890,9 458,3 6.365,7 11.784,3 1.807,6 1.897,9 2.537,9 42,3 25,7average 550 20
average accelertionbrakingtime reserve
time of
9

Deutsche Gesellschaft für Internationale Zusammenarbeit (GIZ) GmbH P.O Box 8016 Windhoek, Namibia, www.sutp.org Ministry Works and Transport Head Office Building 6719 Bell St Snyman Circle Windhoek


