46
www.suzlon.com 1 Suzlon windfarm at Dhule, India Suzlon Energy Limited Q4 FY 2010-11 Earnings Presentation 14 th May, 2011
| Date post: | 26-May-2015 |
| Category: |
Investor Relations |
| Upload: | suzlon-group |
| View: | 96 times |
| Download: | 1 times |

www.suzlon.com1
Suzlon windfarm at Dhule, India
Suzlon Energy LimitedQ4 FY 2010-11 Earnings Presentation14th May, 2011
www.suzlon.com
Disclaimer
• This presentation and the accompanying slides (the “Presentation”), which have been prepared by Suzlon Energy Limited (the“Company”), have been prepared solely for information purposes and do not constitute any offer, recommendation or invitation topurchase or subscribe for any securities, and shall not form the basis or be relied on in connection with any contract or bindingcommitment whatsoever. No offering of securities of the Company will be made except by means of a statutory offering documentcontaining detailed information about the Company.
• This Presentation has been prepared by the Company based on information and data which the Company considers reliable, but theCompany makes no representation or warranty, express or implied, whatsoever, and no reliance shall be placed on, the truth, accuracy,completeness, fairness and reasonableness of the contents of this Presentation. This Presentation may not be all inclusive and may notcontain all of the information that you may consider material. Any liability in respect of the contents of, or any omission from, thisPresentation is expressly excluded.
• Certain matters discussed in this Presentation may contain statements regarding the Company’s market opportunity and businessprospects that are individually and collectively forward-looking statements. Such forward-looking statements are not guarantees of futureperformance and are subject to known and unknown risks, uncertainties and assumptions that are difficult to predict. These risks anduncertainties include, but are not limited to, the performance of the Indian economy and of the economies of various internationalmarkets, the performance of the wind power industry in India and world-wide, competition, the company’s ability to successfullyimplement its strategy, the Company’s future levels of growth and expansion, technological implementation, changes and advancements,changes in revenue, income or cash flows, the Company’s market preferences and its exposure to market risks, as well as other risks. TheCompany’s actual results, levels of activity, performance or achievements could differ materially and adversely from results expressed in orimplied by this Presentation. The Company assumes no obligation to update any forward-looking information contained in thisPresentation. Any forward-looking statements and projections made by third parties included in this Presentation are not adopted by theCompany and the Company is not responsible for such third party statements and projections.
• No offering of the Company’s securities will be registered under the U.S. Securities Act of 1933, as amended (the “Securities Act”).Accordingly, unless an exemption from registration under the Securities Act is available, the Company’s securities may not be offered, sold,resold, delivered or distributed, directly or indirectly, into the United States or to, or for the account or benefit of, any U.S. Person (asdefined in regulation S under the Securities Act).
• The distribution of this document in certain jurisdictions may be restricted by law and persons into whose possession this presentationcomes should inform themselves about and observe any such restrictions.
2
www.suzlon.com
• Suzlon Group: Key highlights
– Volumes & EBIT continues to improve
– Starting FY12 with strong order book backed by meteoric rise in order flows in India
– Key milestones achieved during FY11
– Turbine availability– consistently above par
– SE Forge – on a growth curve
• Outlook for FY12 and beyond
– Industry estimates suggests 15%+ growth over next five years
– India and Offshore to lead growth with 40-50% growth YoY
• Focus areas for FY12
– Completion of “squeeze-out “process in REpower
– Increased focus on India, emerging markets and Offshore
– Suzlon Group: Guidance
• Detailed financials
Contents
3

www.suzlon.com
• Suzlon Group: Key highlights – Q4 FY2011
– Volumes continue to grow sequentially and YoY
– Strong order book, improving visibility for FY2012
– Robust turbine fleet performance across the globe
• Outlook for the FY2012 and beyond
– Green shoots visible in the wind industry
– Developed and emerging markets: improving regulatory environment
– Offshore market: growth momentum continues
– India: new emerging revenue models with regulatory policies materializing
– Brazil: continues to provide positive momentum
– New products: well received by customers
• Detailed financials – Q4 FY2011
Contents
4
Suzlon windfarm at Utah, USA
Suzlon Group - Key highlights : Q4 FY2011

www.suzlon.com
Financial performance snapshot
ParticularsQ4
FY11
Unaudited
Q4FY10
Unaudited
Full YearFY11
Unaudited
Full Year
FY10
Unaudited(a)
Consolidated revenue 7,276 6,084 17,879 18,133
Consolidated EBITDA 1,024 535 808 703
Consolidated EBIT 773 390 151 220
Net Working Capital 3,788 4,872
Net Debt 9,142 9,764
INR Crs.
(a) Consolidated ex Hansen5
Performance against Guidance
• REpower revenues Euro 1.27bn with EBIT margin of ~5%, in line with the guidance
• Suzlon Wind delivered 1,521 MW as against management expectation of 1,700 MW. The shortfall was due to
- ~160 MW of deliveries postponed to Q1FY12

www.suzlon.com6
7,276
Q4 FY11Q4 FY10
6,084
+20%
Q4 performance confirms the upward trend
Consolidated Revenues (Rs Crs) Consolidated EBITDA (Rs Crs) Consolidated EBIT (Rs Crs)
535
1,024
Q4 FY11Q4 FY10
+91%
390
773
Q4 FY11Q4 FY10
+98%
www.suzlon.com7
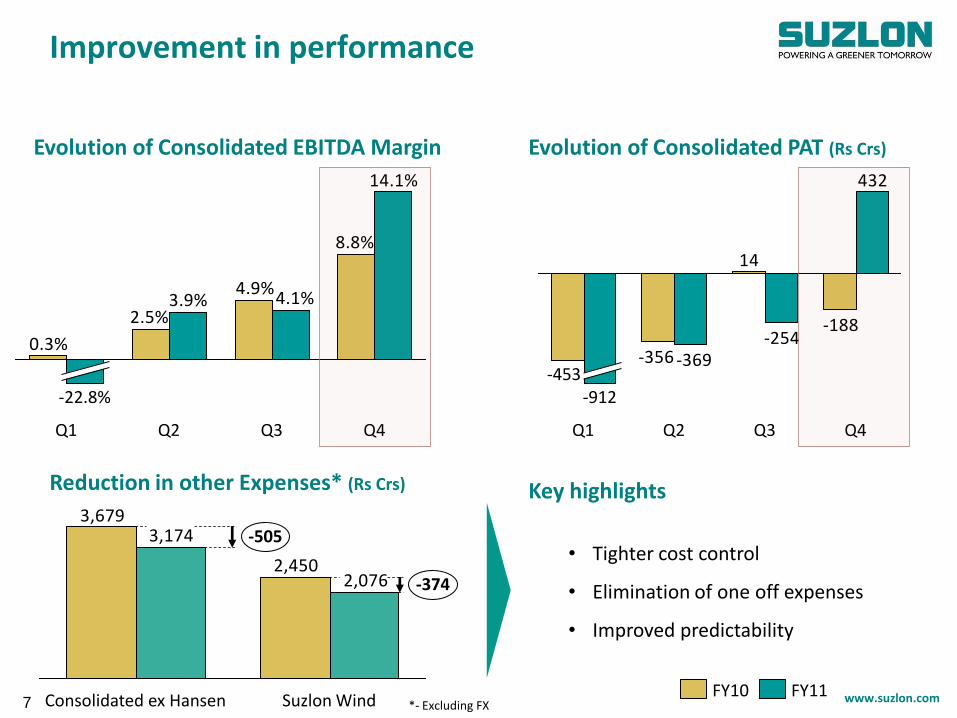
Improvement in performance
8.8%
4.9%
2.5%
0.3%
4.1%3.9%
14.1%
Q4Q3Q2Q1
-22.8%
Evolution of Consolidated EBITDA Margin
-188
14
-356
432
-254-369
Q4Q3Q2Q1
-912-453
FY11FY10
Evolution of Consolidated PAT (Rs Crs)
2,450
3,679
2,076
3,174
-374
-505
Suzlon WindConsolidated ex Hansen
Reduction in other Expenses* (Rs Crs)
• Tighter cost control
• Elimination of one off expenses
• Improved predictability
Key highlights
*- Excluding FX
www.suzlon.com
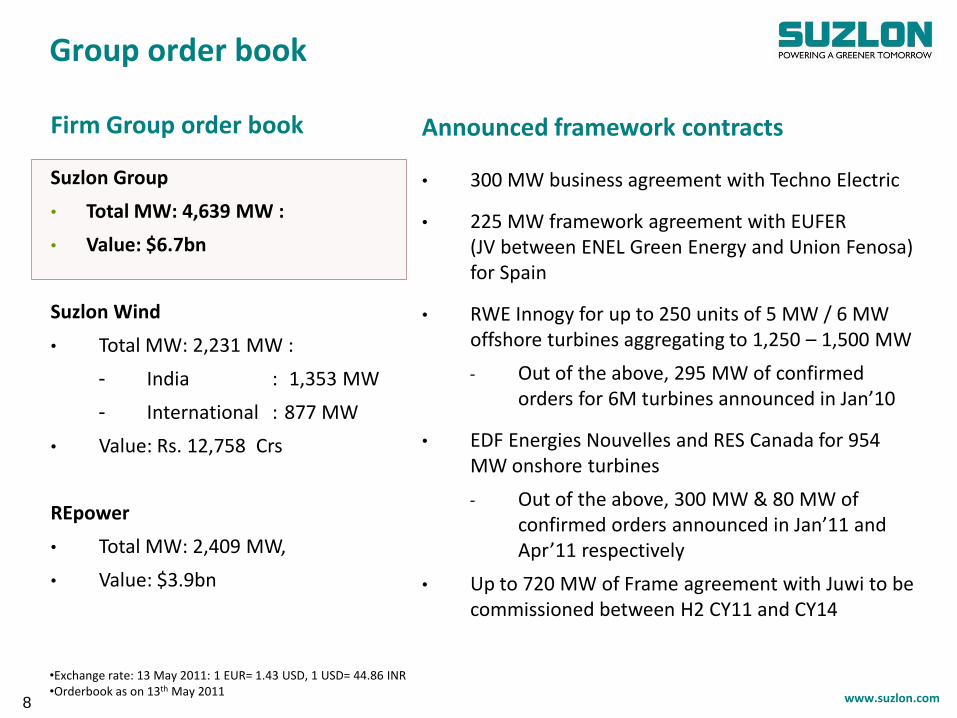
Firm Group order book
Suzlon Group
• Total MW: 4,639 MW :
• Value: $6.7bn
Suzlon Wind
• Total MW: 2,231 MW :
- India : 1,353 MW
- International : 877 MW
• Value: Rs. 12,758 Crs
REpower
• Total MW: 2,409 MW,
• Value: $3.9bn
•Exchange rate: 13 May 2011: 1 EUR= 1.43 USD, 1 USD= 44.86 INR•Orderbook as on 13th May 2011
Announced framework contracts
• 300 MW business agreement with Techno Electric
• 225 MW framework agreement with EUFER (JV between ENEL Green Energy and Union Fenosa) for Spain
• RWE Innogy for up to 250 units of 5 MW / 6 MW offshore turbines aggregating to 1,250 – 1,500 MW
- Out of the above, 295 MW of confirmed orders for 6M turbines announced in Jan’10
• EDF Energies Nouvelles and RES Canada for 954 MW onshore turbines
- Out of the above, 300 MW & 80 MW of confirmed orders announced in Jan’11 and Apr’11 respectively
• Up to 720 MW of Frame agreement with Juwi to be commissioned between H2 CY11 and CY14
Group order book
8

www.suzlon.com
Order book update – momentum continues
9
1,317 1,7562,409
FY10 End*
2,882
896230
FY09 End*
2,780
1,38875
4,639
+60%
FY11 End*
877
1,353
REpowerSuzlon Wind - InternationalSuzlon Wind - India
Suzlon Group Year End* order book* (MW)
1,093 1,280 1,400
4,026
+68%
FY11 End*
2,626
FY10 End*
2,402
1,122
FY09 End*
2,327
1,234
Suzlon Group yearly order intake^ (MW)
Developing trends
• Largest annual Order
Intake of 4, 026 MW
(Suzlon Wind 2626 MW)
• Robust Order book, up 60%
YoY
• Starting FY12 with strong
order visibility
• Strong growth momentum
in order intake in India &
offshore
* - Order book as announced at the end of the year
^ - Order inflow is net of cancellations, if any, order inflow reflects difference in order book as announced (closing – opening) less sales in FY11
REpowerSuzlon Wind

www.suzlon.com
Operational
• Suzlon Group: Largest yearly order intake booked in last three years: 4,026 MW, with Suzlon wind accounting for 2,626 MW (largest in last three years)
• New products (3XM, S9X) launched and order inflows growing
• Turbine availability rates above 97% consistently
• Consistently improving quarterly performance
Financial
• Successful issuance of FCCBs of $175mn for strategic initiatives
• Successful Rights Issue of Rs1,188 Crs
• Rupee Loan refinancing of Rs10,694 Crs completed- 2 year covenant holiday and
principal moratorium achieved
• FCCBs restructuring completed- All covenants removed
Strategic
• “Squeeze-out” threshold of 95% achieved in REpower and “squeeze-out” process initiated
Key milestones
10
Key milestones achieved in FY11
* - between 31/05/2010 to 13/05/2011
www.suzlon.com
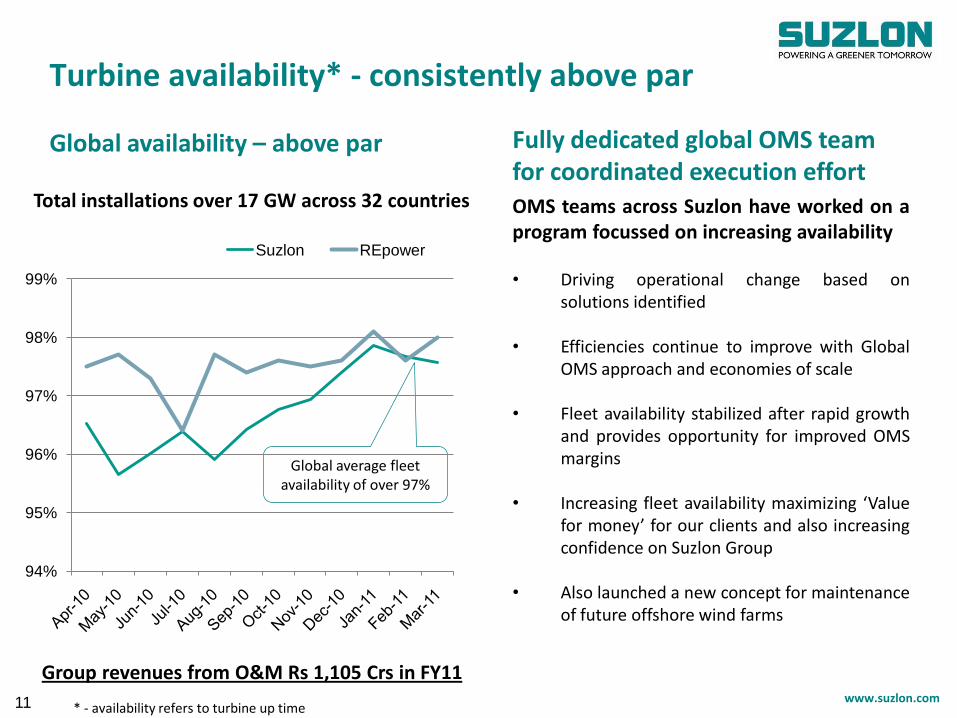
Global availability – above par
Global average fleet availability of over 97%
Total installations over 17 GW across 32 countries
Fully dedicated global OMS team for coordinated execution effortOMS teams across Suzlon have worked on aprogram focussed on increasing availability
• Driving operational change based onsolutions identified
• Efficiencies continue to improve with GlobalOMS approach and economies of scale
• Fleet availability stabilized after rapid growthand provides opportunity for improved OMSmargins
• Increasing fleet availability maximizing ‘Valuefor money’ for our clients and also increasingconfidence on Suzlon Group
• Also launched a new concept for maintenanceof future offshore wind farms
Turbine availability* - consistently above par
11
94%
95%
96%
97%
98%
99%
Suzlon REpower
Group revenues from O&M Rs 1,105 Crs in FY11
* - availability refers to turbine up time

www.suzlon.com12
SE Forge – on a growth curve
• Improving volumes
• High operational leverage
• Proportion of non Suzlon
business increasing
• Widening product
portfolio
• Marquee client profile,
from both wind and non-
wind industries
• Order book continuously
improving
358
104
+244%
FY11FY10
24
-25
49(196%)
FY11FY10
SE Forge – Revenues (Rs Crs)
SE Forge – EBITDA (Rs Crs)
118
49
+141%
Q4 FY11Q4 FY10
11
-1
12(109%)
Q4 FY11Q4 FY10
Developing trends
www.suzlon.com
Improving global fleet availability*...
Global average fleet availability of over 97%
*Suzlon Wind monthly availability figures
Total installations across the Globe over 10 GW
...is the result of a globally coordinated execution effort
OMS teams across Suzlon have worked on aprogram focussed on increasing availability
• Monthly performance review
• Root cause analysis and identifyingsolutions
• Driving operational change basedon solutions identified
Robust turbine fleet performance
13
Outlook for the FY12 and beyond
REpower offshore project : Beatrice
www.suzlon.com
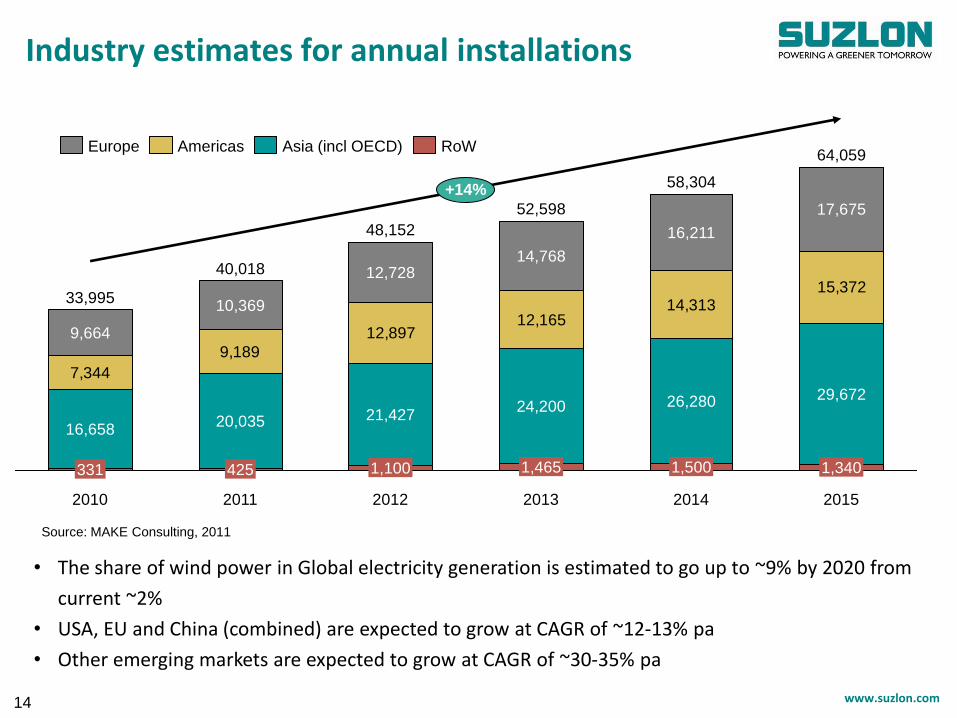
Industry estimates for annual installations
14
7,344
9,189
12,89712,165
14,31315,372
+14%
2015
64,059
1,340
29,672
17,675
2014
33,995
331
16,658
9,664
58,304
1,500
26,280
16,211
2013
52,598
1,465
24,200
14,768
2012
48,152
1,100
21,427
12,728
2011
40,018
425
20,035
10,369
2010
• The share of wind power in Global electricity generation is estimated to go up to ~9% by 2020 from
current ~2%
• USA, EU and China (combined) are expected to grow at CAGR of ~12-13% pa
• Other emerging markets are expected to grow at CAGR of ~30-35% pa
RoWEurope Americas Asia (incl OECD)
Source: MAKE Consulting, 2011
www.suzlon.com15
+37%
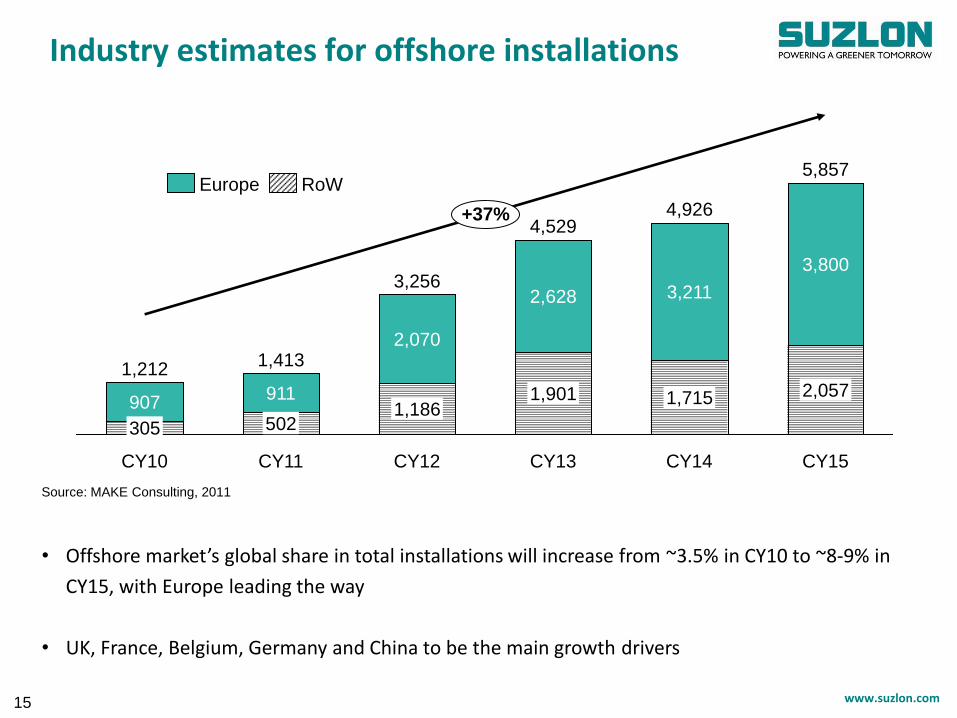
CY15
5,857
2,057
3,800
CY14
4,926
1,715
3,211
CY13
4,529
1,901
2,628
CY12
3,256
1,186
2,070
CY11
1,413
502
911
CY10
1,212
305
907
RoWEurope
Industry estimates for offshore installations
• Offshore market’s global share in total installations will increase from ~3.5% in CY10 to ~8-9% in
CY15, with Europe leading the way
• UK, France, Belgium, Germany and China to be the main growth drivers
Source: MAKE Consulting, 2011
www.suzlon.com16
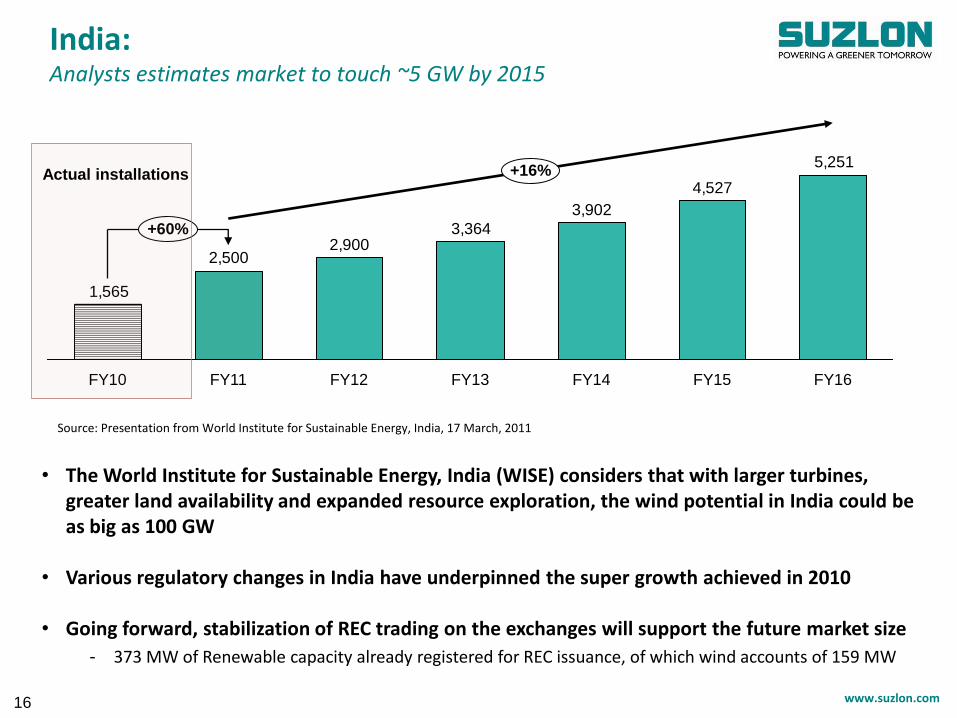
India: Analysts estimates market to touch ~5 GW by 2015
5,251
4,527
3,902
3,3642,900
2,500
1,565
+16%
+60%
FY16FY15FY14FY13FY12FY11FY10
Source: Presentation from World Institute for Sustainable Energy, India, 17 March, 2011
• The World Institute for Sustainable Energy, India (WISE) considers that with larger turbines, greater land availability and expanded resource exploration, the wind potential in India could be as big as 100 GW
• Various regulatory changes in India have underpinned the super growth achieved in 2010
• Going forward, stabilization of REC trading on the exchanges will support the future market size
- 373 MW of Renewable capacity already registered for REC issuance, of which wind accounts of 159 MW
Actual installations

www.suzlon.com
Emerging Economies - Growth continues with strong policy push
China:
• Again a year of record installations, dominated by domestic players
• 12th Five Year Plan sets a target of 90 GW of wind installations by 2015
• China is targeting wind power capacity to reach 150 GW by 2020, enough potential to support the target
• Official take-off of offshore wind energy development plan in China
India:
• Visible growth of 50%+ in near term
• REC market stabilizing, RPO targets among states calibrated, preferential tariffs revised upwards - creating enough levers for continuing momentum
• Estimates suggest renewable installations during the 11th Five Year Plan to be c90% of the proposed target, helped by the policy developments after the release of the NAPCC in mid-2008
• Market is supply-constrained in the near term
Brazil:
• 3rd auction of ~2 GW for wind expected in Q3 CY11
Emerging economies continue to grow strongly
17

www.suzlon.com
Americas - Growth in Canada and Brazil to offset sluggish US market
USA:
• Annual installations dropped by ~50% in 2010, mainly due to ongoing recession & delays in project financing
• Industry buffeted by tepid order inflows and uncertainty over federal level RPO
Canada:
• Most of the provinces established wind energy targets
• Quebec and Ontario expect each installations of > 4 GW by 2015
Europe - Stable, but more saturated and hence growing slowly
Onshore:
• Onshore market saw a slight de-growth in 2010
• Germany, Spain, France, UK, Italy continue to dominate regional installations
• Huge growth seen in countries like Sweden, Poland and Romania
Offshore:
• UK dominated offshore wind installations in 2010 with ~40% of new installed capacity
• France is expected to conduct a tender for 3,000 MW of offshore wind power projects
• Other growing markets include Germany, Belgium, Denmark
Developed western economies gaining momentum
18
www.suzlon.com
Rest of the World - Positive developments continue
South Africa:
• Approved RE feed-in tariff of ZAR1.25 per KWh
• South Africa Wind Association targets to achieve 25% of total generation from wind by 2025
Australia:
• Australia saw a huge drop in installations,
• Falling prices of RECs – key reason for decline in installations
• However, market is expected to rebound in 2012 (8000 MW wind energy capacity to be installed by 2020)
Other Countries:
• Chile, Argentina and other countries in South America also show promise of decent growth, with an objective to diversify the current power generation mix, dominated by Hydro power & dependency on imported gas
• Mexico has also grown in significance in 2010 nearly tripling its installed capacity from 2009
Few economies showing some early promise
19
www.suzlon.com
Mr. Tulsi Tanti, Chairman and Managing Director – Suzlon Group, said: “I am pleased toreport that our Group performance is steadily improving. Emerging, offshore and keymatured markets are showing sustained momentum. Our strategy to focus on thesemarkets is delivering for us, as evidenced by our steady inflow of major orders over thepast few months in India, Brazil, Canada and Belgium. Our ~US$ 7 billion orderbook(~5,000 MW) is one of the best in the industry, and gives us strong visibility for futuregrowth.
“While the business environment remains challenging, particularly in the US and partsof Europe, our competitive position remains strong with a global sales and serviceorganization - spanning 32 countries and 15 GW operating wind capacity worldwide –which is delivering in excess of 97 per cent availability. Our customer focus,comprehensive product portfolio and low cost supply chain has allowed us in just 15years to build a base of over 1,800 customers, including 11 out of 15 of the largest windcustomers worldwide.”
Chairman’s Message
20
Focus Areas for FY12
REpower offshore project : Thorntonbank

www.suzlon.com21
Focus areas
• Strengthening
Group’s
competitive
positioning
• Completion of
Squeeze out
process in
REpower
• Increased focus on
India, emerging
markets and Offshore
• Higher revenues and
strong margins
• High penetration of
new products in
various markets
• New products
specially for low
wind regimes with
higher hub heights
Markets Products Strategic
FY12: Turnaround year
Operational Efficiency
• Reduction in Product
costs
• Focus on cash
generation
• Lower Working
Capital intensity &
lower CAPEX
1 2 3 4

www.suzlon.com
Strengthening our position in Emerging Markets through end-to-end business model
End-to-End Solutions
Wind Resources Mapping
Land and Site
Identification
Supply of WTG &
Accessories
Site Infrastructure Development
Installation & Commissioning
Power Evacuation
Life time O&M
Support to customers
for all ancillary activities
End to end
solution
provider –
Key to
Emerging
Markets
• Allows customers to benefit
from cost-efficiencies and
economies of scale in wind
farms
• Avoids need for customers to
undertake cumbersome wind
farm development process
• Provides greater control over
execution timeline
• Control on value chain from
planning to maintenance
stages
• Leverages Suzlon’s deep
experience across Wind energy
value chain
• Best partner for IPP customers
1

www.suzlon.com
...backed by successful track record of executing large end-to-end projects in India
• Installed base of 6,200+ MW in India (>1,000 MW sites in four states)
• Capacity to deliver large scale projects (three mega size windfarms of >700 MW each
• More than 50 project sites across 8 states
- Rajasthan, Gujarat, MP, Maharashtra, Karnataka, AP, Tamil Nadu & Kerala
• Suzlon is well placed to cater to the growing market due to its
- Unique business model of concept to commissioning,
- Strong EPC execution capabilities and
- Access to large wind sites
1
Sankaneri wind farm in Tamil Nadu Over 700 MW & expanding…
Dhule wind farm in Maharashtra 750+ MW & expanding…
19 MW facility at Agali in Kerela
Tirupati wind farm in A.P. with a capacity of 10 MW
Jaisalmer Windpark in Rajasthan with a total capacity of 800 MW+
2 Farms in Madhya Pradesh with total capacity of 100 MW
3 Farms in Karnataka; total capacity – 650 MW+
Asia’s largest wind farm at Kutch, Gujarat Over 850 MW & expanding…
Some of our largest wind farms in India
Illustrative map, not as per scale
www.suzlon.com
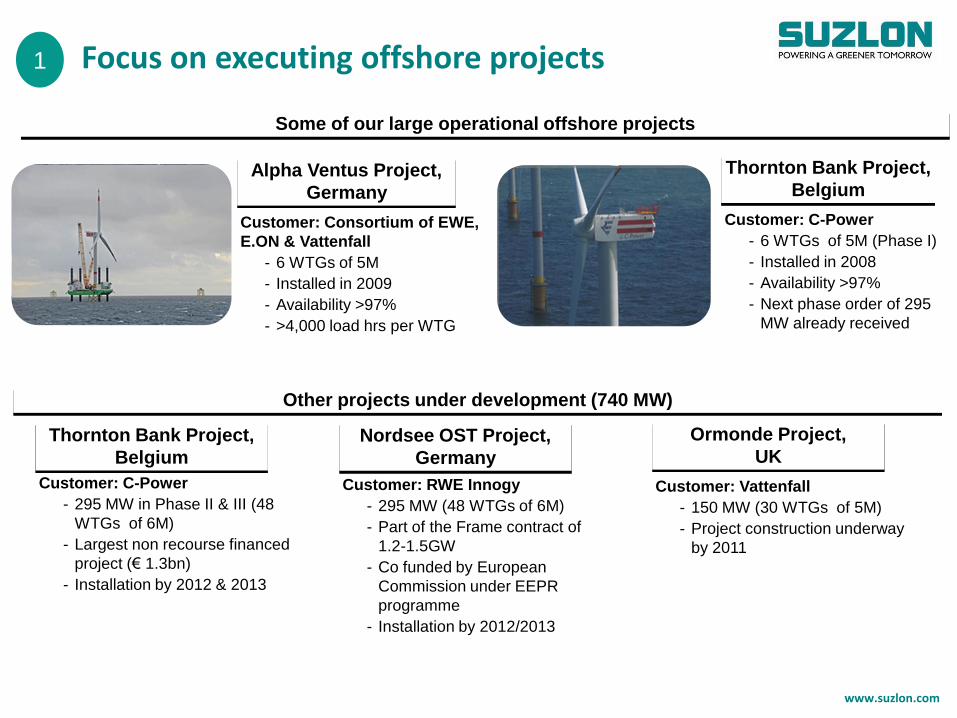
Focus on executing offshore projects
Some of our large operational offshore projects
Alpha Ventus Project,
Germany
Customer: Consortium of EWE,
E.ON & Vattenfall
- 6 WTGs of 5M
- Installed in 2009
- Availability >97%
- >4,000 load hrs per WTG
Thornton Bank Project,
Belgium
Customer: C-Power
- 6 WTGs of 5M (Phase I)
- Installed in 2008
- Availability >97%
- Next phase order of 295
MW already received
Thornton Bank Project,
Belgium
Customer: C-Power
- 295 MW in Phase II & III (48
WTGs of 6M)
- Largest non recourse financed
project (€ 1.3bn)
- Installation by 2012 & 2013
Other projects under development (740 MW)
Nordsee OST Project,
Germany
Customer: RWE Innogy
- 295 MW (48 WTGs of 6M)
- Part of the Frame contract of
1.2-1.5GW
- Co funded by European
Commission under EEPR
programme
- Installation by 2012/2013
Ormonde Project,
UK
Customer: Vattenfall
- 150 MW (30 WTGs of 5M)
- Project construction underway
by 2011
1

www.suzlon.com25
2High penetration of new products in various markets
New products launched
Suzlon S9X for low windy sites- Suzlon S97: 2.1 MW platform, with a 97
meter rotor diameter- Suzlon S95: 2.1 MW platform, with a 95
meter rotor diameter
REpower MM100: MM100-1.8 MW developed for low wind sites
REpower 3.XM: - 3.2M with a 114 meter rotor diameter
for Class-III wind sites, with a hub height of 100m, 123m & 143m
- 3.4M with a 104 meter rotor diameter for Class-II wind sites
Status update
S9X- Already launched for all geographies- Proto types have already been installed- Certifications to be received shortly- Orders already received for the new products
REpower MM100/3XM: - Already launched for relevant geographies- Cold climate versions to follow- Large sized orders received for new products
• New products backed by proven performance and efficient processes, as well as customer-focused team with a global company and local reach
• Enhancements, innovation and comprehensive design driven through the entire technology platform for even better reliability and higher power yield in low windy sites

www.suzlon.com
With new products, Suzlon Group boasts of a complete commercially proven portfolio
0.60 –1.25MW
Products spanning all capacities - sub-MW to multi-MW turbines
Products spanning technologies - variable, semi-variable and fixed speeds
Product variants spanning climatic conditions, all wind class sites and grid requirements
Ability to supply large volumes across various geographies
1.25 –1.5MW
1.5 – 2.5MW 2.5 – 3.XMW 5.0 – 6.15MW
India
China
USA / Australia / Brazil / Europe Offshore
2

www.suzlon.com27
Focus on cash generation3
• Operations to be cash generating
- Maximise volumes
- Endeavours to generate cash from operations, while keeping investments into balance sheet at a
minimum
• Focused efforts to reduce working capital intensity
- Reduce debtor days, with efforts to recover slow moving debtors in USA
- Structurally reduce inventories tied up in overseas markets for executing ex-Asia orders
• Continued policy of incurring only ‘MUST HAVE’ CAPEX
- Suzlon wind to incur zero ‘New Capacity CAPEX’, only to incur maintenance CAPEX
- REpower to incur CAPEX only for offshore turbine manufacturing

www.suzlon.com28
Completion of “squeeze-out” in REpower
Status update on Squeeze out process:
Squeeze out initiated by Suzlon’s wholly owned subsidiary AE-Rotor Holding B.V. (“AERH”)
Valuation auditor appointed by AERH
Independent valuation auditor has also been appointed by German Court
Annual General Meeting for REpower expected in H1 FY12
4

www.suzlon.com
Group well positioned in current market environment
Emerging markets
Offshore & key stable EU markets
Product portfolio
Low cost manufacturing &
sourcing
• India: A high growth market
• Entrenched in China, Brazil
• Early entrant in South Africa, Chile, Argentina and Mexico
• Comprehensive product portfolio for Offshore
• Performing well in Germany, France, UK, Italy and Turkey
• Covering all wind classes I, II, III and all customer and market segments
• Product range from 600 KW to 6.15 MW delivering competitive cost / kWh
• End-to-end business solution provider with strong execution skills
• Majority of the manufacturing in the low cost countries already established
• Additional capacity creation requires low capex
• Fully developed Asia centric supply chain
• Healthy gross profit margins
1
2
4
5
Global Sales & Service
Organisation3
• Relationship with 11 clients out of Top 15 customers
• Robust global sales infrastructure ensuring excellent service with higher
machine availability & reliability
29

www.suzlon.com30
Suzlon Group: Guidance for FY12
• Revenues: Rs 24,000 – 26,000 Crs ($5.3bn – $5.8bn)
• EBIT Margin: 7%-8%
Assuming exchange rate $/Rs - 45
www.suzlon.com
Mr. Tulsi Tanti, Chairman and Managing Director – Suzlon Group, said: “I am pleased toreport that our Group performance is steadily improving. Emerging, offshore and keymatured markets are showing sustained momentum. Our strategy to focus on thesemarkets is delivering for us, as evidenced by our steady inflow of major orders over thepast few months in India, Brazil, Canada and Belgium. Our ~US$ 7 billion orderbook(~5,000 MW) is one of the best in the industry, and gives us strong visibility for futuregrowth.
“While the business environment remains challenging, particularly in the US and partsof Europe, our competitive position remains strong with a global sales and serviceorganization - spanning 32 countries and 15 GW operating wind capacity worldwide –which is delivering in excess of 97 per cent availability. Our customer focus,comprehensive product portfolio and low cost supply chain has allowed us in just 15years to build a base of over 1,800 customers, including 11 out of 15 of the largest windcustomers worldwide.”
Chairman’s Message
31
Detailed financials –Q4 FY2011
REpower offshore project : Thorntonbank

www.suzlon.com
Consolidated financial results(Suzlon Wind + SE Forge + Hansen + REpower)
ParticularsQ4 FY11
UnauditedQ4 FY10
UnauditedFull Year 2011
UnauditedFull Year 2010
Audited(a)
Sales 7,276 6,084 17,879 20,620
Raw material cost 5,110 3,822 12,454 13,628
Gross Profit 2,166 2,262 5,425 6,992
Gross Profit margin 29.77% 37.18% 30.34% 33.91%
Manpower cost 456 423 1,676 2,145
Operating income 96 81 211 160
Other operating expenses 1,003 1,274 3,174 4.104
Forex loss / (Gain) (220) 111 (23) (42)
EBITDA 1,024 535 808 943
EBITDA margin 14.07% 8.79% 4.52% 4.57%
Depreciation 251 145 657 663
EBIT 773 390 151 280
Interest 279 281 1,005 1,081
Interest on acquisition loans 33 19 131 114
Exceptional items 37 (212)
Other non-operating Income 29 10 107 69
Taxes 41 295 181 356
Add:/(Less) Share in associate’s PAT (9) 12 (28) 16
Add/(Less): Share of profit of minority (8) (12) 21 (9)
PAT 432 (188) (1,103) (983)
(a) Financial numbers for Hansen consolidated till November 2009 as subsidiary and subsequently as an associate32
INR Cr.

www.suzlon.com
ParticularsQ4 FY11 (unaudited) (INR Cr.) Q4 FY10 (unaudited) (INR Cr.)
Suzlon SE Forge Hansen REpower Consol. Suzlon SE Forge Hansen REpower Consol.
Sales MW 492 650
Sales 3,037 118 -- 4,204 7,276 4,150 49 -- 1,923 6,084
Raw material cost 1,953 67 -- 3,174 5,110 2,548 31 -- 1,282 3,822
Gross Profit 1,084 51 -- 1030 2,166 1,603 18 -- 642 2,262
Gross Profit margin 35.70% 43.27% -- 24.49% 29.77% 38.61% 35.82% -- 33.37% 37.18%
Manpower cost 257 6 -- 193 456 238 5 -- 179 423
Operating income 23 1 -- 72 96 29 1 -- 51 81
Other operating expenses 615 32 -- 355 1003 901 16 -- 358 1385
Forex loss / (Gain) (235) 2 12 (220) 112 (2) 111
EBIDTA 470 11 -- 542 1,024 380 (1) -- 155 535
EBIDTA margin 15.47% 9.1% -- 13.89% 14.07% 9.17% (1.43%) -- 8.07% 8.79%
Depreciation 107 18 -- 126 251 106 0 -- 39 145
EBIT 363 (7) 416 773 274 0 116 390
Interest 231 18 -- 31 279 233 18 -- 31 281
Interest on acquisition 0 -- 33 33 -- -- -- 19 19
Exceptional items 0 -- -- 0 (7) -- -- -- (7)
Other non-operating Income 22 0 -- 7 29 -- 1 -- 9 10
Taxes (60) 0 0 101 41 285 (4) 14 295
Add/(Less): Share in associate’s PAT/ minority interest 2 0 (9) (10) (17) (6) 2 12 (9) 0
PAT 214 (25) 258 448 (236) (14) 61 (189)
PAT incl. minority interest 216 (25) (9) 248 432 (242) (11) 12 52 (188)
Consolidated financial results - Q4 FY11
33
www.suzlon.com34
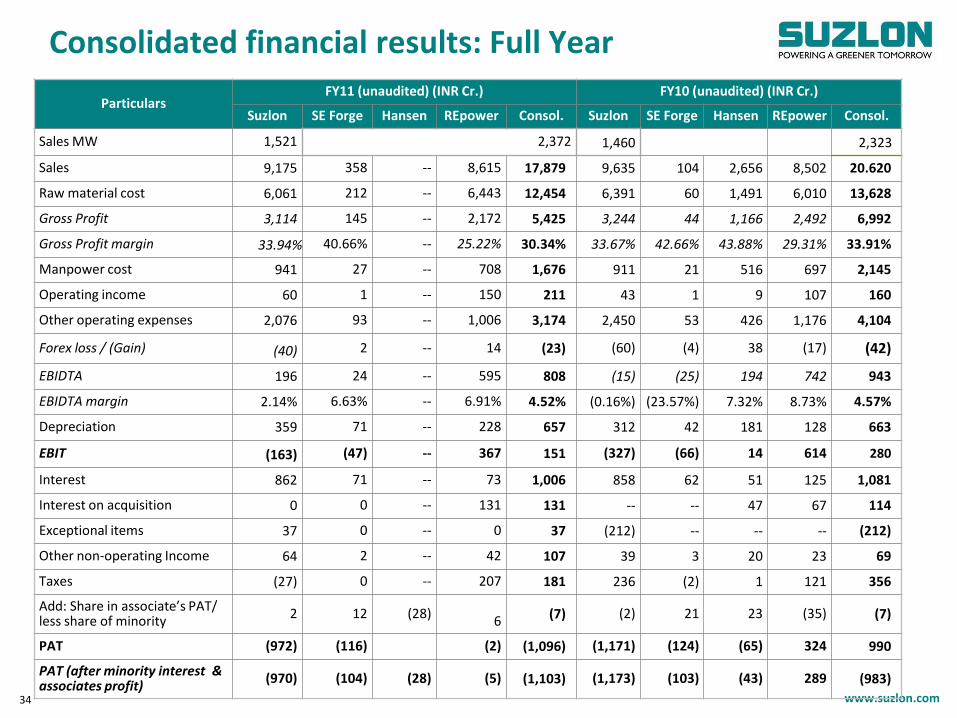
ParticularsFY11 (unaudited) (INR Cr.) FY10 (unaudited) (INR Cr.)
Suzlon SE Forge Hansen REpower Consol. Suzlon SE Forge Hansen REpower Consol.
Sales MW 1,521 2,372 1,460 2,323
Sales 9,175 358 -- 8,615 17,879 9,635 104 2,656 8,502 20.620
Raw material cost 6,061 212 -- 6,443 12,454 6,391 60 1,491 6,010 13,628
Gross Profit 3,114 145 -- 2,172 5,425 3,244 44 1,166 2,492 6,992
Gross Profit margin 33.94% 40.66% -- 25.22% 30.34% 33.67% 42.66% 43.88% 29.31% 33.91%
Manpower cost 941 27 -- 708 1,676 911 21 516 697 2,145
Operating income 60 1 -- 150 211 43 1 9 107 160
Other operating expenses 2,076 93 -- 1,006 3,174 2,450 53 426 1,176 4,104
Forex loss / (Gain) (40) 2 -- 14 (23) (60) (4) 38 (17) (42)
EBIDTA 196 24 -- 595 808 (15) (25) 194 742 943
EBIDTA margin 2.14% 6.63% -- 6.91% 4.52% (0.16%) (23.57%) 7.32% 8.73% 4.57%
Depreciation 359 71 -- 228 657 312 42 181 128 663
EBIT (163) (47) -- 367 151 (327) (66) 14 614 280
Interest 862 71 -- 73 1,006 858 62 51 125 1,081
Interest on acquisition 0 0 -- 131 131 -- -- 47 67 114
Exceptional items 37 0 -- 0 37 (212) -- -- -- (212)
Other non-operating Income 64 2 -- 42 107 39 3 20 23 69
Taxes (27) 0 -- 207 181 236 (2) 1 121 356
Add: Share in associate’s PAT/ less share of minority
2 12 (28)6 (7) (2) 21 23 (35) (7)
PAT (972) (116) (2) (1,096) (1,171) (124) (65) 324 990
PAT (after minority interest & associates profit)
(970) (104) (28) (5) (1,103) (1,173) (103) (43) 289 (983)
Consolidated financial results: Full Year

www.suzlon.com
ParticularsConsolidated – Ex Hansen Consolidated – Ex Hansen
FY11 FY10 Q4 FY11 Q4 FY10
Sales 17,879 18,133 7,276 6,084
Raw material cost 12,454 12,353 5,110 3,822
Gross Profit 5,425 5,780 2,166 2,262
Gross Profit margin 30.34% 31.88% 29.77% 37.18%
Manpower cost 1,676 1,629 456 423
Operating income 211 151 96 81
Other operating expenses (inc FX) 3,152 3,599 782 1,385
EBIDTA 808 703 1,024 535
EBIDTA margin 4.52% 3.87% 14.07% 8.79%
Depreciation 657 482 251 145
EBIT 151 220 773 390
Interest 1,005 1,045 279 281
Interest on acquisition 131 67 33 19
Exceptional items 37 (212) 0 (7)
Other non-operating Income 107 65 29 10
Taxes 181 355 41 295
Share of minority and associate loss (7) (16) (17) (12)
PAT (1,096) (970) 448 (189)
PAT After minority interest and associate loss (1,103) (986) 432 (201)
Consolidated financial results ex Hansen
35
INR Cr.

www.suzlon.com
RegionOrders as on
04/02/11New
OrdersSales in Q4 FY11
Orders as on 13/05/11
Sales in FY10 Sales in FY09 Sales in FY08
India 1,624 144 415 1,353 688 749 975
USA 246 0 0 246 410 989 593
China 324 0 20 304 182 249 134
ANZ 4 0 0 4 128 430 143
Europe 162 0 57 105 53 166 298
S. America 218 0 0 218 -- 197 168
Others -- -- 10 --
Total * 2,578MW 144 492 2,231 MW 1,460MW 2,790MW 2,311MW
Total value Rs. 14,635 Crs. Rs. 12,758 Crs Rs.9,635 Crs. Rs.15,897 Crs. Rs.11,467 Crs.
$ 2.8bn*
REpower order book as on 13th May 2011 $ 3.9bn*
Group order book $ 6.7bn*
Sales of period April 2011 to date not deducted from orders as on 14th May 2011
Suzlon Group: Firm order book of 4,639MW valuing ~$6.7bn
Suzlon Group order book
36•Exchange rate: 13 May 2011: 1 EUR= 1.43 USD, 1 USD= 44.86 INR
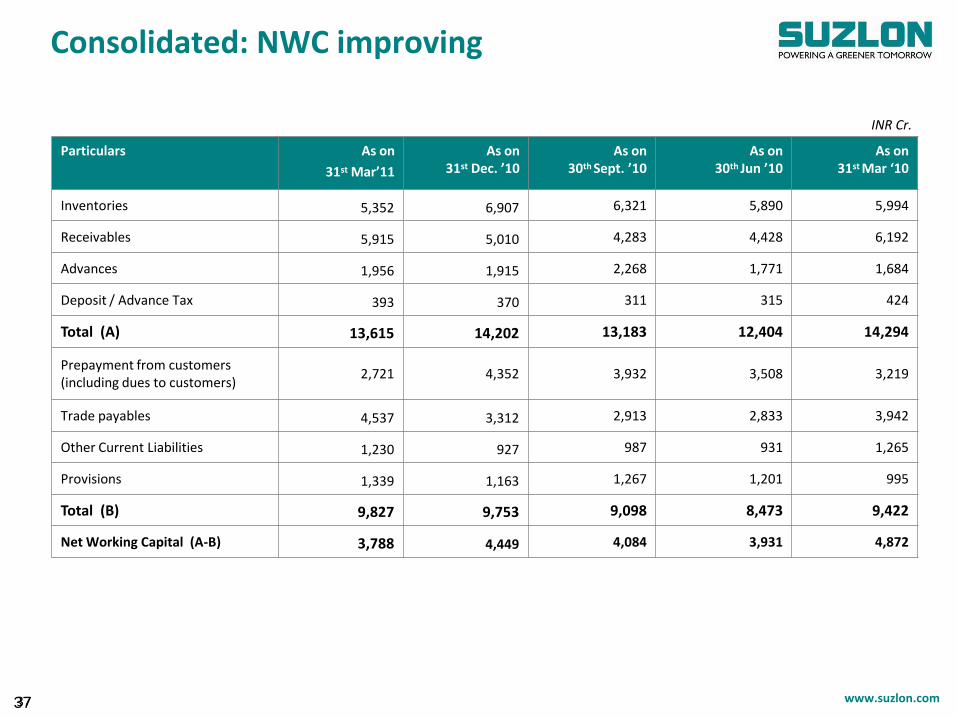
www.suzlon.com37
INR Cr.
Particulars As on
31st Mar’11
As on 31st Dec. ’10
As on 30th Sept. ’10
As on 30th Jun ’10
As on 31st Mar ‘10
Inventories 5,352 6,907 6,321 5,890 5,994
Receivables 5,915 5,010 4,283 4,428 6,192
Advances 1,956 1,915 2,268 1,771 1,684
Deposit / Advance Tax 393 370 311 315 424
Total (A) 13,615 14,202 13,183 12,404 14,294
Prepayment from customers (including dues to customers)
2,721 4,352 3,932 3,508 3,219
Trade payables 4,537 3,312 2,913 2,833 3,942
Other Current Liabilities 1,230 927 987 931 1,265
Provisions 1,339 1,163 1,267 1,201 995
Total (B) 9,827 9,753 9,098 8,473 9,422
Net Working Capital (A-B) 3,788 4,449 4,084 3,931 4,872
Consolidated: NWC improving
37

www.suzlon.com38
INR Cr.
Particulars As on
31st March’11
As on 31st Dec. ’10
As on 30th Sept. ’10
As on 30th Jun ’10
As on 31st Mar ‘10
Inventories 3,144 3,241 3,013 2,910 2,877
Receivables 4,156 4,180 3,304 3,798 4,726
Advances 1,272 1,266 1,578 1,209 1,187
Deposit / Advance Tax 391 367 310 315 449
Total (A) 8,963 9,054 8,205 8,232 9,328
Prepayment from customers (including dues to customers)
640 1,029 910 1,002 696
Trade payables 2,948 2,434 2,015 2,071 2,990
Other Current Liabilities 875 798 813 783 963
Provisions 811 814 894 862 732
Total (B) 5,273 5,075 4,633 4,718 5,381
Net Working Capital (A-B) 3,689 3,979 3,572 3,513 3,857
Suzlon Wind: Net Working Capital
38
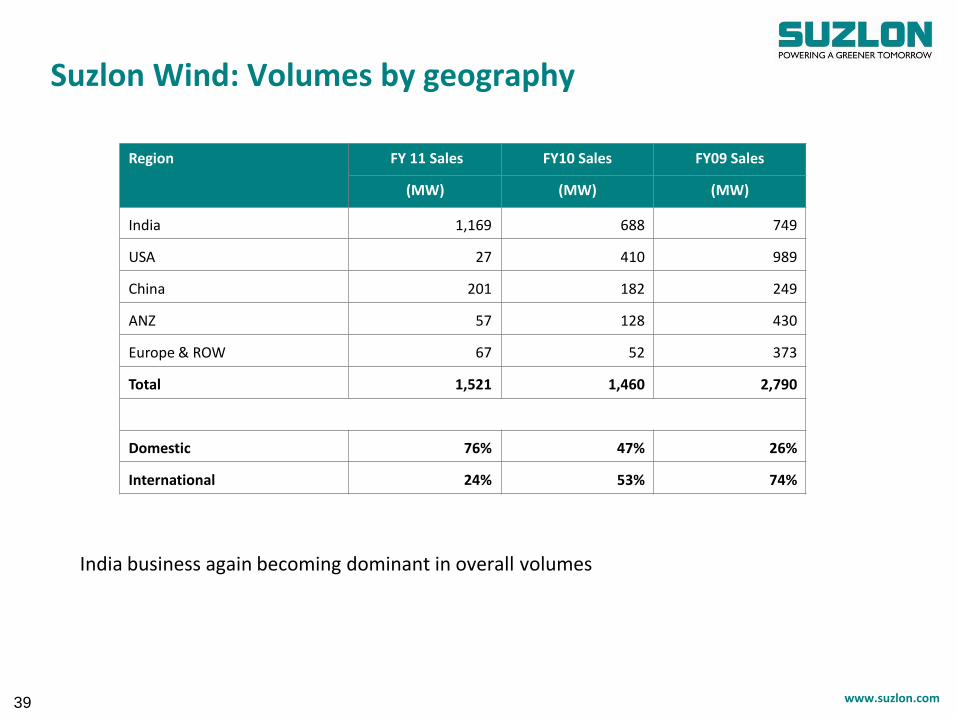
www.suzlon.com
Region FY 11 Sales FY10 Sales FY09 Sales
(MW) (MW) (MW)
India 1,169 688 749
USA 27 410 989
China 201 182 249
ANZ 57 128 430
Europe & ROW 67 52 373
Total 1,521 1,460 2,790
Domestic 76% 47% 26%
International 24% 53% 74%
Suzlon Wind: Volumes by geography
39
India business again becoming dominant in overall volumes

www.suzlon.com
Particulars
As at 31st Mar. 2011 As at
31st Dec. 2010As at
30th Sept. 2010As at
30th June 2010As at
31st March 2010
SEL Wind
(a)
Consol. Group
(a)
SEL Wind
(a)
Consol. Group
(a)
SEL Wind
(a)
Consol. Group
(a)
SEL Wind
(a)
Consol. Group
(a)
SEL Wind
(a)
Consol. Group
(a)
Gross External Debt (A)
11,233 12,264 11,112 12,087 11,070 12,073 10,853 11,812 10,519 11,493
Loans from Promoters (B)
- - -- -- -- -- 1,175 1,175 1,175 1,175
Cash (C) 1,023 3,131 945 2,712 1,260 2,822 1,258 2,866 1,541 2,904
Net Debt (A+B-C) 10,210 9,142 10,167 9,375 9,809 9,252 10,770 10,121 10,153 9,764
Net External Debt (A-C)
10,210 9,142 10,167 9,375 9,809 9,252 9,595 8,946 8,978 8,589
(a) Unaudited
Net Debt to Equity - ~1.36x as on 31st March 2011
Group Financial Leverage
40

www.suzlon.com
Debt type Balance as on 31st Mar. 2011
Balance as on 31st Dec. 2010
Balance as on 30th Sept. 2010
Balance as on 30th June 2010
Balance as on 31st March 2010
Acquisition loans 2,074 2,073 2,085 2,155 2,083
FCCBs 2,136 2,141 2,153 2,225 2,151
W.Cap, Capex and other loans 7,023 6,898 6,832 6,473 6,284
Gross external debt (A) 11,233 11,112 11,070 10,853 10,519
Loans from promoter group (B) -- -- -- 1,175 1,175
Cash (C) 1,023 945 1,260 1,258 1,541
Net Debt (A+B-C) 10,210 10,167 9,809 10,770 10,153
Net external debt (A-C) 10,210 10,167 9,809 9,595 8,978
(a) Unaudited
Suzlon Wind: Financial leverage (a)
41
INR Cr.
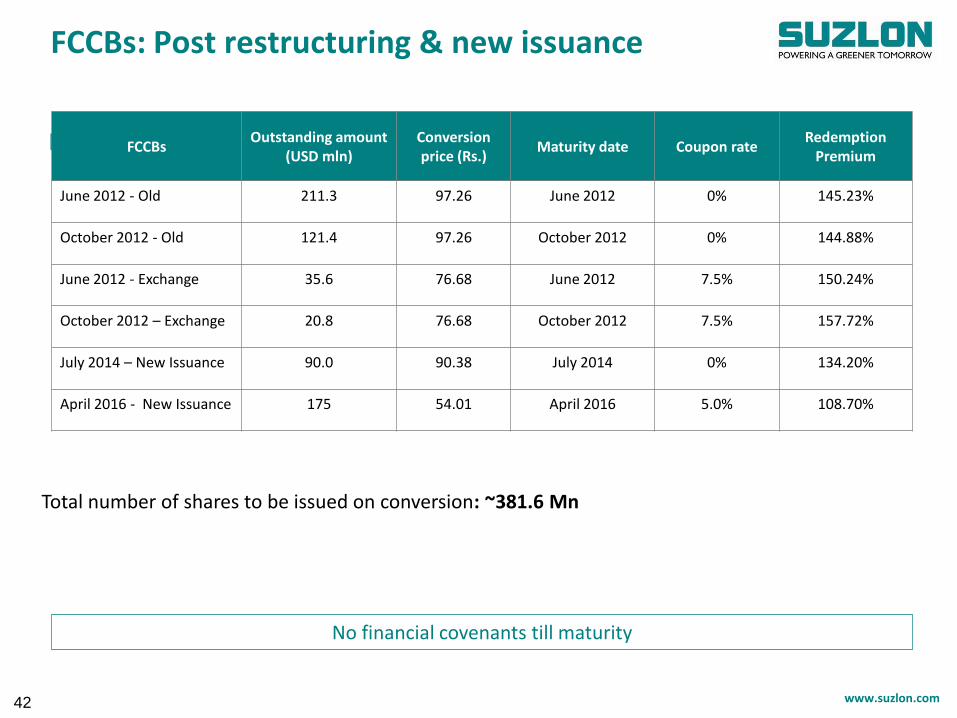
www.suzlon.com
Key Terms:
No financial covenants till maturity
Total number of shares to be issued on conversion: ~381.6 Mn
FCCBsOutstanding amount
(USD mln)Conversion price (Rs.)
Maturity date Coupon rateRedemption
Premium
June 2012 - Old 211.3 97.26 June 2012 0% 145.23%
October 2012 - Old 121.4 97.26 October 2012 0% 144.88%
June 2012 - Exchange 35.6 76.68 June 2012 7.5% 150.24%
October 2012 – Exchange 20.8 76.68 October 2012 7.5% 157.72%
July 2014 – New Issuance 90.0 90.38 July 2014 0% 134.20%
April 2016 - New Issuance 175 54.01 April 2016 5.0% 108.70%
FCCBs: Post restructuring & new issuance
42

www.suzlon.com43
Consolidated Balance Sheet:Sources of Funds
ParticularsFY11
Unaudited (a)
FY10
Audited (b)
Share Capital 355 311
Employee Stock options 20 16
Reserves and Surplus 6,361 6,274
Shareholders’ funds 6,736 6,601
Preference share issued by subsidiary company 3 3
Minority Interest 307 328
Loan Funds 12,264 12,668
Secured loans 9,257 8,123
Unsecured loans 3,007 4,545
Deferred tax liability 271 183
Sources of Funds 19,580 19,783
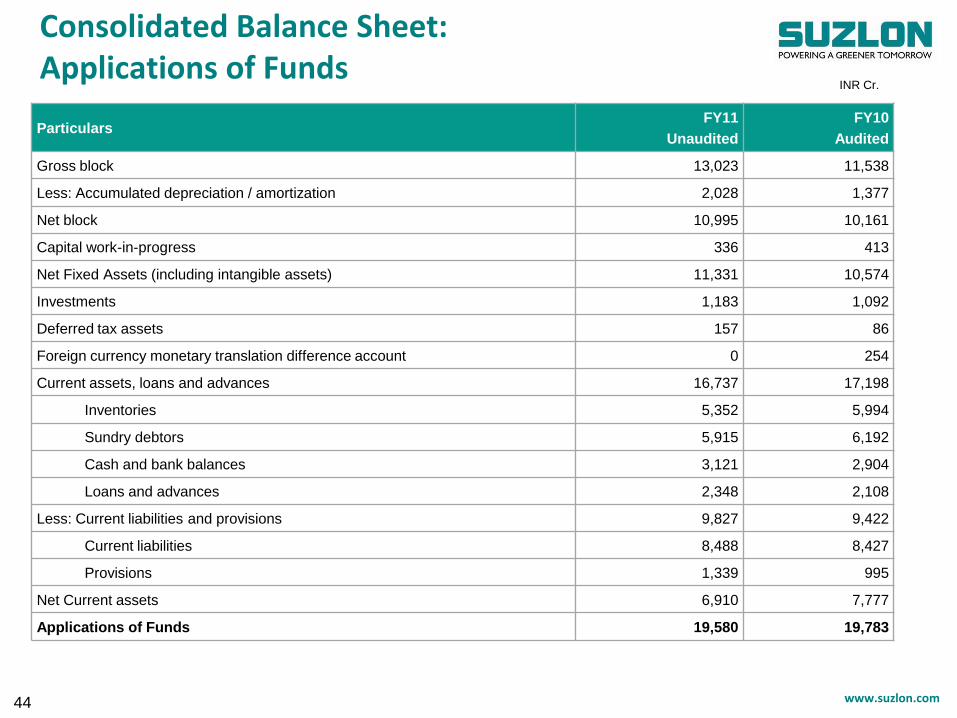
www.suzlon.com44
Consolidated Balance Sheet:Applications of Funds
INR Cr.
ParticularsFY11
Unaudited
FY10
Audited
Gross block 13,023 11,538
Less: Accumulated depreciation / amortization 2,028 1,377
Net block 10,995 10,161
Capital work-in-progress 336 413
Net Fixed Assets (including intangible assets) 11,331 10,574
Investments 1,183 1,092
Deferred tax assets 157 86
Foreign currency monetary translation difference account 0 254
Current assets, loans and advances 16,737 17,198
Inventories 5,352 5,994
Sundry debtors 5,915 6,192
Cash and bank balances 3,121 2,904
Loans and advances 2,348 2,108
Less: Current liabilities and provisions 9,827 9,422
Current liabilities 8,488 8,427
Provisions 1,339 995
Net Current assets 6,910 7,777
Applications of Funds 19,580 19,783

www.suzlon.com
ParticularsQ4 FY 2011 FY 2011
EURO m INR Crs. EURO m INR Crs.
Profit / (loss) as per REpower books 30.1 184 56.3 343
Less: Policy alignment impact (16.1) (77) (18.1) (88)
Profit / (loss) before translation loss 46.2 261 74.4 431
Less: FX loss on translation of COGS (5.5) (30) 49.8 303
Profit / (loss) as per Suzlon Books 51.7 291 24.6 128
Total Difference (21.6) (107) 32 215
(a) Unaudited
REpower Net Profit Reconciliation
45

www.suzlon.com
ParticularsQ4 FY 2011 9m FY 2011
EURO m INR Crs. EURO m INR Crs.
Profit / (loss) as per REpower books 4 32 26 158
Less: Policy alignment impact (6) (36) (2) (12)
Profit / (loss) before translation loss 10 68 28 171
Less: FX loss on translation of COGS 18 109 55 332
Profit / (loss) as per Suzlon Books (7) (41) (27) (162)
Total Delta 11 73 53 320
(a) Unaudited
REpower Net Profit Reconciliation
46
Thank You
Suzlon windfarm at Snowtown, Australia


