31 Digital Health Outlook: Mapping Digital Solutions for Advancing Healthcare
33 About the Authors
36 About Silicon Valley Bank and SVB Analytics
See Appendix for complete sources and additional information.
What is Digital Health?
Digital Health Report 3
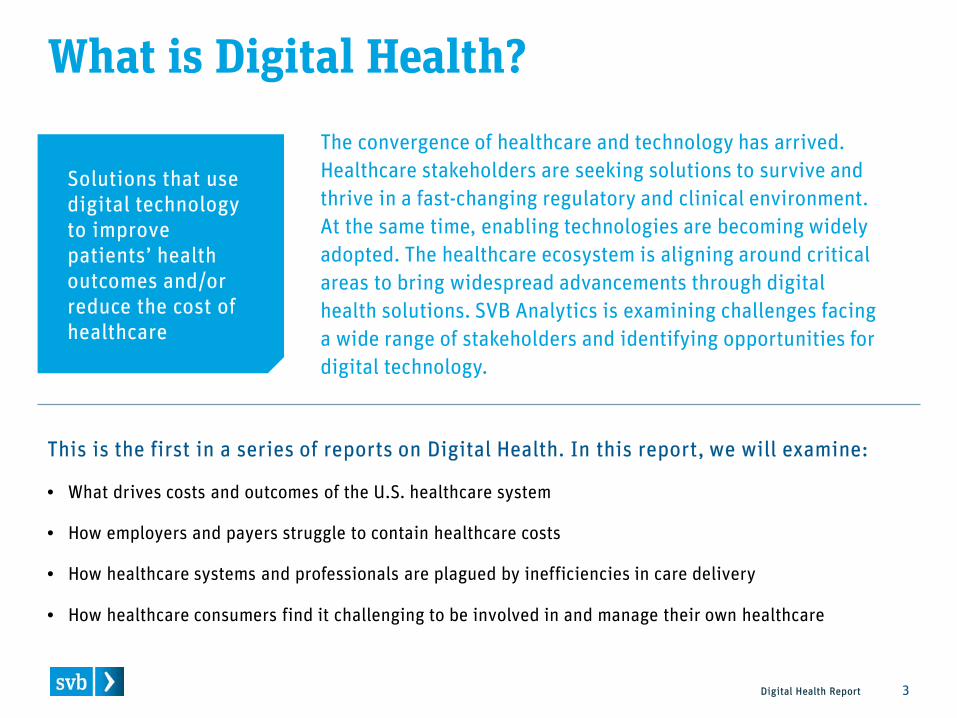
Solutions that use digital technology to improve patients’ health outcomes and/or reduce the cost of healthcare
The convergence of healthcare and technology has arrived. Healthcare stakeholders are seeking solutions to survive and thrive in a fast-changing regulatory and clinical environment. At the same time, enabling technologies are becoming widely adopted. The healthcare ecosystem is aligning around critical areas to bring widespread advancements through digital health solutions. SVB Analytics is examining challenges facing a wide range of stakeholders and identifying opportunities for digital technology.
This is the first in a series of reports on Digital Health. In this report, we will examine:
• What drives costs and outcomes of the U.S. healthcare system
• How employers and payers struggle to contain healthcare costs
• How healthcare systems and professionals are plagued by inefficiencies in care delivery
• How healthcare consumers find it challenging to be involved in and manage their own healthcare
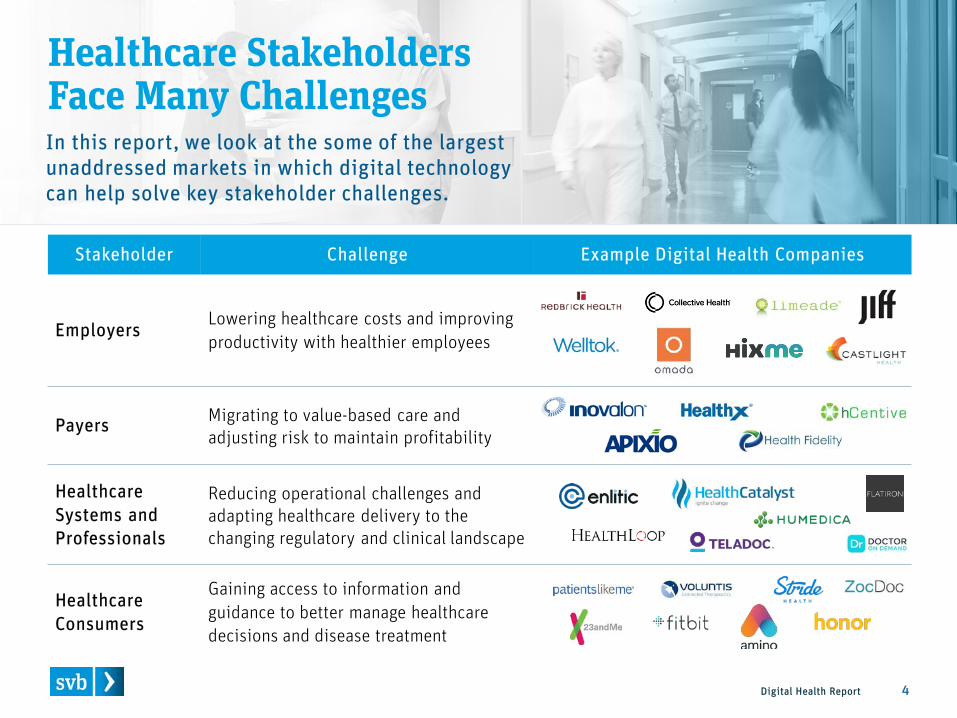
Stakeholder Challenge Example Digital Health Companies
Employers Lowering healthcare costs and improving productivity with healthier employees
Payers Migrating to value-based care and adjusting risk to maintain profitability
Healthcare Systems and Professionals
Reducing operational challenges and adapting healthcare delivery to the changing regulatory and clinical landscape
Healthcare Consumers
Gaining access to information and guidance to better manage healthcare decisions and disease treatment
Digital Health Report 4
Healthcare Stakeholders Face Many Challenges In this report, we look at the some of the largest unaddressed markets in which digital technology can help solve key stakeholder challenges.
State of U.S. Healthcare: What Drives Costs and Outcomes
Digital Health Report 6
High Costs, Dissatisfaction Drive Demand for Innovation
$- $2,000 $4,000 $6,000 $8,000 $10,000
United StatesSwitzerland
NorwayNetherlands
SwedenGermanyDenmark
AustriaCanada
BelgiumFranceJapan
IcelandFinland
New ZealandUnited Kingdom
ItalyPortugal
Healthcare Expenditure per Capita, PPP* in USD, 2013
U.S. Healthcare Expenditures Far Outpace Other Countries
Digital Health Report
In many respects, the U.S. healthcare system has fallen behind other developed countries – costs more but results in less satisfaction.
7 *PPP: Purchasing power parity
0% 20% 40% 60%
United States
United Kingdom
Luxembourg
Canada
Finland
Germany
Israel
Netherlands
Sweden
Italy
Switzerland
Japan
Korea
% of Population that is Overweight or Obese in OECD Countries, 2013
Obese population, >30 BMI Overweight population , 25-30 BMI
0 2 4 6
United StatesUnited Kingdom
BelgiumNetherlandsSwitzerland
IsraelFrance
IrelandDenmarkPortugal
AustraliaGermany
AustriaSpainItaly
SwedenNorwayFinlandIceland
Death per 1000 births
Infant Mortality Rates in OECD Countries, Death per 1000 Births, 2012
But Health Outcomes Are No Better, Despite Investment
Digital Health Report 8
Despite higher per capita spending on healthcare in the U.S., the health outcomes are often no better. The U.S. system remains focused on sick-care rather than upon improving wellness and providing preventive care.
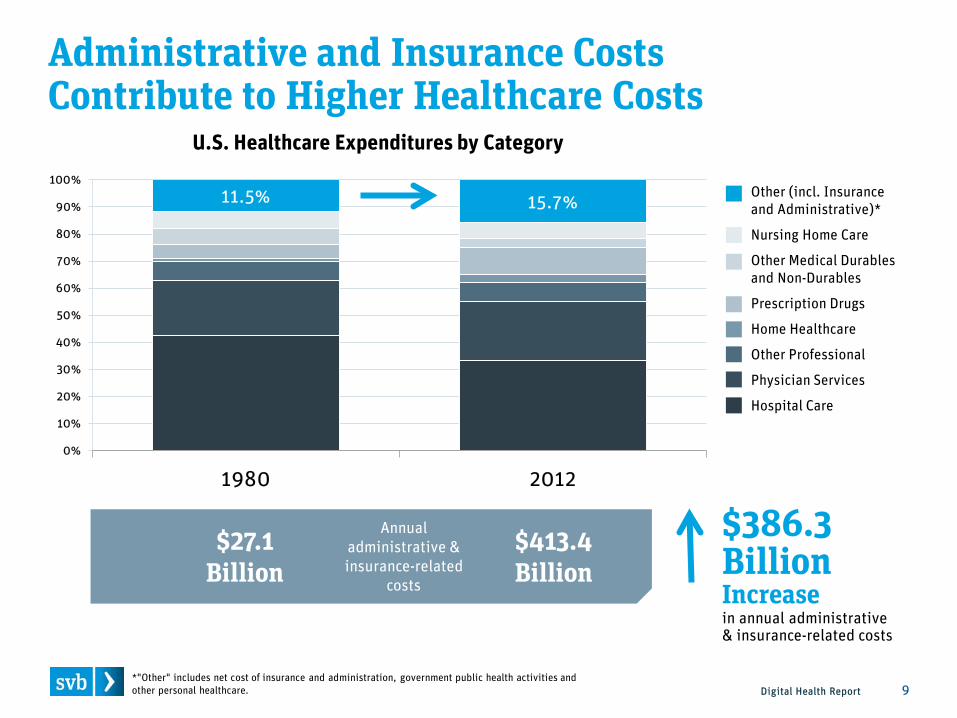
11.5% 15.7%
0%
10%
20%
30%
40%
50%
60%
70%
80%
90%
100%
1980 2012
Administrative and Insurance Costs Contribute to Higher Healthcare Costs
$27.1 Billion
$386.3 Billion Increase
$413.4 Billion
Annual administrative & insurance-related
costs
9
U.S. Healthcare Expenditures by Category
in annual administrative & insurance-related costs
Other (incl. Insurance and Administrative)*
Nursing Home Care
Other Medical Durables and Non-Durables
Prescription Drugs
Home Healthcare
Other Professional
Physician Services
Hospital Care
*"Other" includes net cost of insurance and administration, government public health activities and other personal healthcare. Digital Health Report
Digital Health Report 10
Employers and Payers: Improve Outcomes and Lower Costs
Challenge Opportunity Example Digital Health Companies
Growing Cost of Healthcare Benefits
Implement platforms that improve healthcare benefit management and lead to employer cost savings
Competition to Attract and Retain Talent
Provide employees access to innovative services, such as telemedicine and genetic testing, to better manage their health
Productivity Loss Due to Employee Health Issues
Offer technology-based tools and services to emphasize wellness and preventive health
Digital Health Report 11
Overview: Employers Face High Healthcare Costs and Lost Productivity
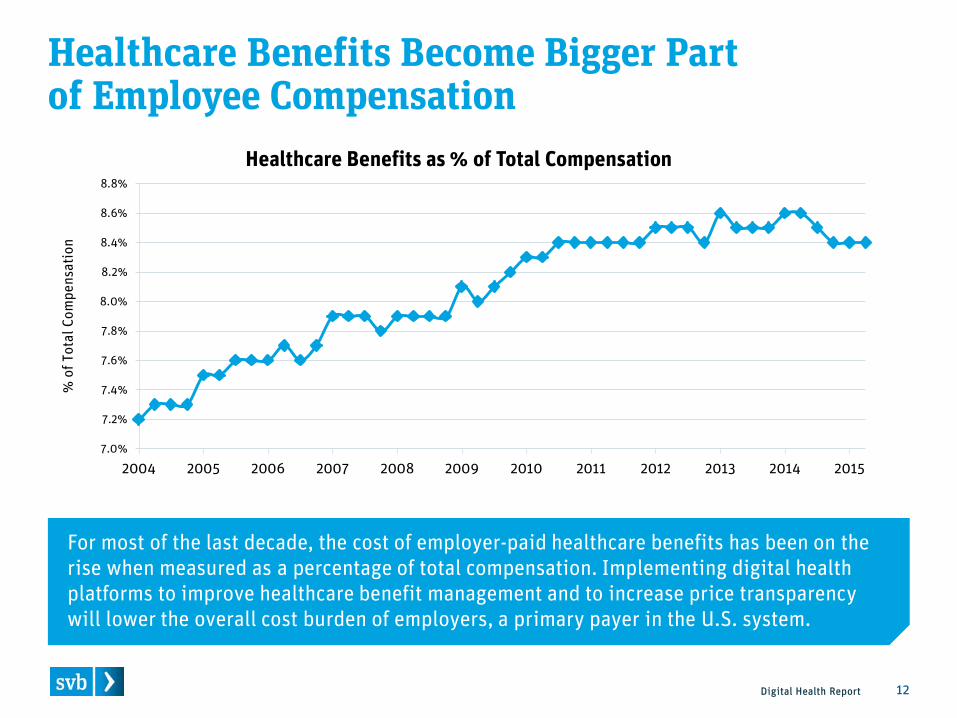
For most of the last decade, the cost of employer-paid healthcare benefits has been on the rise when measured as a percentage of total compensation. Implementing digital health platforms to improve healthcare benefit management and to increase price transparency will lower the overall cost burden of employers, a primary payer in the U.S. system.
0% 10% 20% 30% 40% 50% 60% 70% 80% 90% 100%
Leveraged Benefits Program to Recruit Employees
Leveraged Benefits Program to Retain Employees
Positively Used Health Care Benefits To Recruit
Positively Used Health Care Benefits To Retain
201520142013
Employers Increasingly Use Benefits to Attract and Retain Workers
Digital Health Report 13
Increasingly, employers are leveraging healthcare and preventive/wellness benefits to attract and retain employees. Employers are providing employees access to innovative services, such as telemedicine and genetic testing, to better manage their health.
Percentage of Companies
Unhealthy Workforce Impacts Productivity and Bottom Line
Digital Health Report 14
Improving employee health management can help reduce the impact of health-related productivity loss, which presents opportunities for digital health companies focused on wellness and preventive care.
Employees Replacement Workers are 36.6% less productive
Bottom Line Absences cost an average 15.4% of payroll
Challenge Opportunity Example Digital Health Companies
Consumerism is Changing Insurance Market Dynamics, Increasing Pricing Pressure
Use technology tools to be more consumer-friendly and competitive
Lack of Insight and Tools to Accurately Measure Risk
Use big data and machine learning to improve risk management
Shift from Fee-Based to Value-Based Care
Implement population health tools that manage care delivery and control costs by risk population
Digital Health Report 15
Overview: Payers Seek Solutions in Price Competitive Marketplace
Emergence of Public and Private Exchanges Increases Pricing Pressure on Payers
Digital Health Report 16 *Private Exchanges: Healthcare exchange that is created by employers for their employees.
The Affordable Care Act created public exchanges; now employers are embracing private exchanges.*
Public Exchanges Public exchanges
are expected to cover 15 million people
by 2017
Private Exchanges An estimated
20-30% of employers plan to create private exchanges
within 5 years
Consumers on exchanges tend to choose lower-cost plans, impacting payer revenues.
$322 is the potential annual savings for consumers actively shopping for coverage in 2016
As many as 66% of employees choose plans with lower premiums when switching to private exchange plans
Exchanges make it easier for consumers to change their health insurance plans, which creates pricing pressure on payers.
Data Remains in Silos, Making Claims and Costs Difficult to Predict
Electronic Health Records
Medical Claims Data
Lab Data
Government regulations and standards are adding to challenges of controlling medical claims and costs.
Disparate data sources impact payers’ ability to accurately access risk.
Regulatory Changes May Increase Medical Claims and Costs
Payers Face New Challenges in Cost Control and Risk Management
Digital Health Report 17
Ongoing difficulty in capturing and measuring standardized data remains the biggest challenge for payers when assessing risk and medical claim costs. An opportunity exists for digital health companies that specialize in providing risk and analytics solutions.
@
@
@
@
@
@
World Health Organization: Implementation of ICD-10
U.S. Government: Minimum Medical Loss Ratio
Payers Struggle in Shift to Value-Based Care
Digital Health Report 18
Payers Rate Value-Based Care Payment Models as More Difficult to Implement
0% 2% 4% 6% 8% 10% 12% 14% 16%
Pay for Performance
Episode of Care / Bundled Payments
Capitation
Global Payment
Other (i.e.Shared Savings)
Fee For Service
% of Payers Rating Model as Difficult to Implement
Value-Based Care
Traditional Payment Model
Payers cite data standardization and analysis measures as major challenges in implementing value-based care, especially in pay for performance and shared savings models. Digital health solutions can help more accurately assess medical claims.
Fee for Service – Fixed fee payment for service rendered Pay for Performance – Incentives to providers based on KPIs Global Payments - Fixed budget of care for population of patients with sophisticated risk adjustments incorporated
Capitation – Fixed budget of care for population of patients Bundled Payments – Single payment per episode of care Other (Shared Savings) –Incentives to encourage cost saving
Digital Health Report 19
Healthcare Systems and Professionals: Impacting Care Delivery
Challenge Opportunity Example Digital Health Companies
High Administrative Costs
Digitize records and improve communications and workflows
Shift to Value-based Care
Develop new ways to analyze costs and patient population risks to deliver more efficient care
Explosion of Data in Clinical Decision-Making
Implement clinical outcomes analysis and personalized medicine
Digital Health Report 20
Overview: Healthcare Systems and Professionals Face Pressure to Improve Care Delivery
$128 $35
$192
$131
$177
$248 Failures of Care Delivery
Failures of Care Coordination
Overtreatment
Pricing Failures
Fraud and Abuse
Administrative Complexity
Healthcare Systems and Professionals Are Plagued by Operational Challenges
Digital Health Report 21
Lack of automation is prevalent in the industry. The majority of the inefficiencies and waste in the healthcare system relates to administrative complexity, pricing failures and fraud and abuse. Overlaying electronic documentation support and data analytics tools across these disparate data silos will better identify outliers and lower total systematic costs.
Estimated Annual Cost of Operational Inefficiencies on Healthcare System ($B) $910 Billion
Estimated annual cost of inefficiencies in the U.S. healthcare system
Provision of Care
Failure of Health System
Healthcare Systems and Professionals Struggle with Basic Communications
Digital Health Report 22
0 10 20 30 40
Prescribing and/orAdministering Medications
Completing Documentation
Communicating and Consultingwith Colleagues
Conducting Patient Care
Minutes per Day Wasted
Estimated Time Wasted by Care Providers Due to Inefficient Systems and Workflow
Main Reasons Time is Wasted in Communicating with Colleagues
Inefficient and outdated communications systems in clinical settings waste, on average, an estimated $1.7 million annually per hospital. Deploying and mandating modern digital health communication tools will improve health system profitability.
Text messaging is not allowed
Pagers are not efficient
Wi-Fi is not available
Email is not efficient
Digital Health Report 23
High Workload Leads to Increased Risk of Medical Error
Today the healthcare professional…
Healthcare professionals often work long shifts, which correlates with a higher frequency of medical errors. Digital health opportunities include electronic medical records, improved workflow management and better communications tools to help reduce medical errors.
74% of Nurses cite stress and overwork as top concerns
Is Stressed
Only 6% of Doctors describe their morale as positive
Faces High Workload
Over 20% of Physicians report workload has likely contributed to patient transfers, morbidity or even mortality
Adding a nurse FTE leads to a 16% reduction in the odds of death in a surgical setting
Value-Based Care Creates New Challenges for Systems
Digital Health Report 24
Healthcare Systems Rate Value-Based Care Payment Models More Difficult to Implement
0% 5% 10% 15% 20%
Pay for Performance
Episode of Care / Bundled Payments
Capitation
Global Payment
Other (i.e.Shared Savings)
Fee For Service
% of Payers Rating Model as Difficult to Implement
Episode of Care / Bundled Payments
Other (e,g, Shared Savings)
Value- Based Care
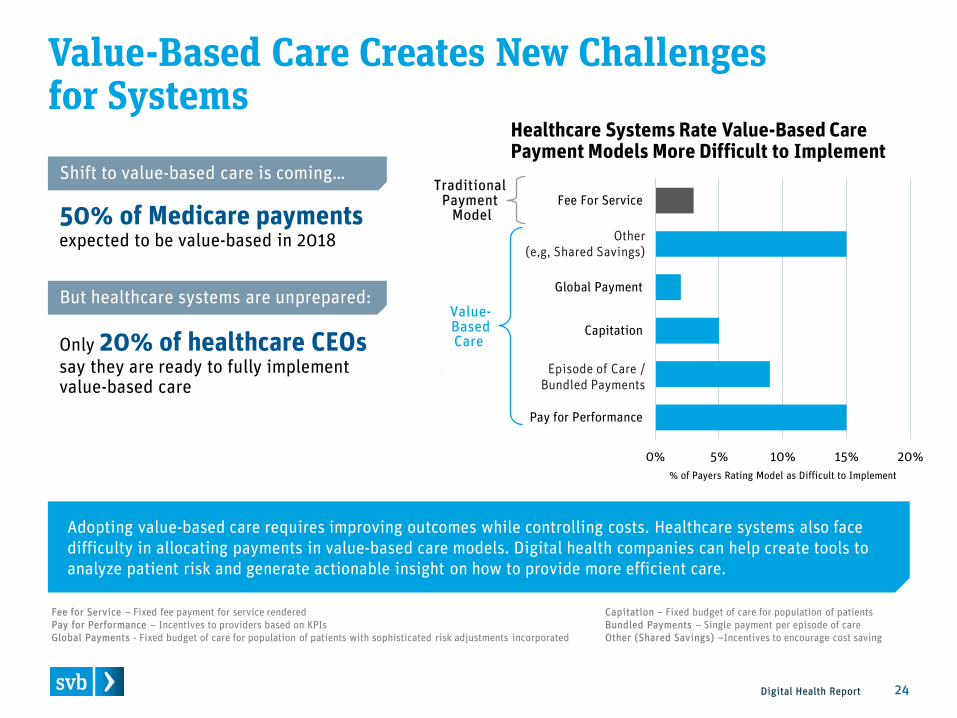
Traditional Payment Model 50% of Medicare payments
expected to be value-based in 2018
Only 20% of healthcare CEOs say they are ready to fully implement value-based care
Shift to value-based care is coming…
But healthcare systems are unprepared:
Adopting value-based care requires improving outcomes while controlling costs. Healthcare systems also face difficulty in allocating payments in value-based care models. Digital health companies can help create tools to analyze patient risk and generate actionable insight on how to provide more efficient care.
Fee for Service – Fixed fee payment for service rendered Pay for Performance – Incentives to providers based on KPIs Global Payments - Fixed budget of care for population of patients with sophisticated risk adjustments incorporated
Capitation – Fixed budget of care for population of patients Bundled Payments – Single payment per episode of care Other (Shared Savings) –Incentives to encourage cost saving
Clinicians Face a Deluge of Medical Information
Increasing drug approvals (~1600 cumulative in 2015)
Alert fatigue
More treatment & diagnostic options
Impacts decision-making, causing errors
Over 80% of primary care physicians believe they receive an
excessive number of alerts.
Clinicians Need Tools to Tackle Information Overload
Digital Health Report 25
Increased academic literature & research ~2M articles published in a single year
Increased genomic & mutation data >187M DNA sequences recorded (200 terabytes of data)
Increased clinician stress
Imprecise clinical judgment
Clinicians struggle to keep up with rapidly advancing medical research. They and their patients can benefit from effective data analysis and personalized medicine to improve clinical outcomes.
Patients Are Often Uninformed on Costs, Treatment Options
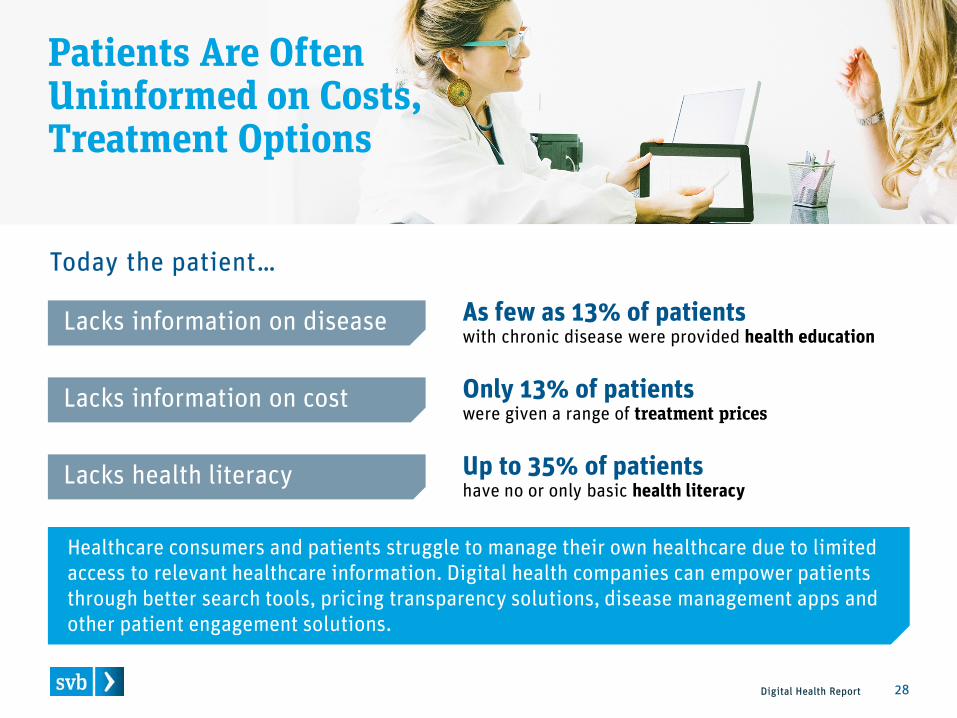
Healthcare consumers and patients struggle to manage their own healthcare due to limited access to relevant healthcare information. Digital health companies can empower patients through better search tools, pricing transparency solutions, disease management apps and other patient engagement solutions.
Lacks information on disease As few as 13% of patients with chronic disease were provided health education
Only 13% of patients were given a range of treatment prices
Lacks information on cost
Lacks health literacy Up to 35% of patients have no or only basic health literacy
Today the patient…
$966
$840 $783 $799
$500
$600
$700
$800
$900
$1,000
Pred
icte
d co
sts
per p
atie
nt
Engaged Patients Correlate with Lower Costs and Better Outcomes
Digital Health Report 29
Lower readmission rates Higher survival rates
• Higher rates of medical errors • Less likely to follow healthcare
professional’s advice
Poorer Outcomes Better Outcomes
Higher Costs Lower Costs
Healthcare costs for the least-engaged patients are 21% higher than those for the most-engaged patients
Least Engaged Most Engaged
24%
38%
31%
6%
1%
To be Completely in Charge
To Make Final Decision with Doctor input
To Make Joint Decision with Doctor
To Give Input with Decision made byDoctor
For Doctor to be Completely in Charge
Patients Want to Be Active Decision-Makers
Digital Health Report 30
More than 90 percent of adults say they want to be actively involved in decision-making with their doctors, and 24 percent want to be completely in charge. Looking ahead, patients’ interest in their own healthcare represents opportunities for digital health technologies that empower patients.
Asked how much they want to be involved in their healthcare decisions, patients wanted…
For Doctor to Be Completely in Charge
To Give Input with Decision Made by Doctor
To Make Joint Decision with Doctor
To Make Final Decision with Doctor Input
To Be Completely in Charge
Patient Actively Involved
Doctor Makes Final Decision
Digital Health Report 31
Digital Health Outlook: Mapping Digital Solutions for Advancing Healthcare
Clinical Operations
Patient Surveillance
Image Management / Analytics
Electronic Medical Records
Decision Support & Analytics / Predictive Medicine
Marketing / Customer Experience
Networking / Education
Care Coordination / Communication
Population Health Management Practice Management & Operational Workflows
Digital Health Companies Are Changing the Face of Healthcare
Digital Health Report
Patients / Consumers
32
Digital health companies are innovating in the healthcare space by focusing on improving outcomes and reducing costs. In the next report, we will evaluate the most promising opportunities and solutions that address the needs of patients and healthcare consumers.
Focu
s on
Hea
lth O
utco
mes
Employers / Payers
Life Science / Other Systems / Healthcare Professionals
Steve Allan, CFA Steve Allan is the Head of SVB Analytics, responsible for the three areas of information services provided to the innovation economy: Strategic Advisory Services, Compliance Valuations, and Insights. Strategic Advisory Services provides consultative guidance around valuations, benchmarking and inorganic growth strategies. Compliance Valuations issues valuation opinions for private companies. Insight focuses on studying trends and opportunities in the private venture-backed innovation ecosystem. Steve brings a strong financial background and passion for entrepreneurship to his role at SVB Analytics.
Steve earned a master’s in business administration from Duke University's Fuqua School of Business and a bachelor's degree in finance from the University of Notre Dame.
Emily Wengel Emily Wengel is a Valuation Associate with SVB Analytics, responsible for conducting due diligence and financial analysis on valuation engagements for early-stage, venture-backed life sciences companies.
Prior to joining SVB Analytics, Emily worked as a business analyst at BioMotiv, an early stage biotech accelerator. Emily graduated cum laude from University of Pennsylvania, where she earned a bachelor of science in economics and a bachelor of arts in biology.
Alex Lee Alex Lee is a Valuation Manager at SVB Analytics, responsible for conducting due diligence and financial analysis on valuation engagements for venture-backed companies in the Life Science sectors.
Prior to joining SVB Analytics, Alex worked as a consultant for biopharmaceutical companies, diagnostic companies and medical research institutions, assisting in corporate development, product commercialization and strategic advisory activities. Alex holds a master’s of bioscience degree from Keck Graduate Institute and a bachelor’s of science degree in biochemistry from the University of Nebraska-Lincoln.
Scott Winder Scott Winder is a Director at SVB Analytics, responsible for managing client valuation assignments and issuing valuation opinions. Prior to joining SVB Analytics, Scott was a manager in the Business Valuation practice of Deloitte Financial Advisory Services LLP based in San Francisco. While at Deloitte, Scott provided financial advisory services related to mergers and acquisitions, accounting compliance, tax reporting and strategic planning for clients in the technology and life sciences industries, with particular experience in the biotechnology and biopharmaceutical industry segments.
Scott holds a master's degree in business administration from the Haas School of Business (University of California at Berkeley), and a bachelor’s degree in human biology from Occidental College.
Slide 7: U.S. Healthcare Expenditures Far Outpace Other Countries • “OECD Health Statistics 2015.” Slide 8: But Health Outcomes Are No Better, Despite Investment • “OECD Health Statistics 2015.” Slide 9: Administrative and Insurance Costs Contribute to Higher Healthcare Costs • Centers for Medicare & Medicaid Services, Office of the Actuary. Data
released January 7, 2014 Slide 12: Healthcare Benefits Become Bigger Part of Employee Compensation • “Employment Cost Trend.” US Bureau of Labor Statistics. Last
modified June 30, 2015. Slide 13: Employers Increasingly Use Benefits to Attract and Retain Workers • “2015 Strategic Benefits Survey – Leveraging Benefits to Recruit
Employees.” Society For Human Resource Management (SHRM). Slide 14: Workforce Impacts Productivity and Bottom Line • “Total Financial Impact of Employee Absences in the U.S, 2014.”
Society For Human Resource Management (SHRM).
Slide 16: Emergence of Public and Private Exchanges Increase Pricing Pressure on Payers • “Potential Savings from Actively Shopping for Marketplace Coverage
in 2016.” Kaiser Family Foundation. • “Examining Private Exchanges in the Employer-Sponsored Insurance
Market” Kaiser Family Foundation. September 2014.
• “Private Health Insurance Exchanges.” Kaiser Family Foundation. • “The Budget and Economic Outlook: 2016 to 2026.” Congressional
Budget Office. Slide 18: Payers Struggle in Shift to Value-Based Care • “The 2014 State of Value-Based Reimbursement and the Transition
from Volume to Value in 2014.” McKesson Corporation. Slide 21: Healthcare Systems and Professionals Are Plagued by Operational Challenges • Donald M. Berwick and Andrew D. Hackbarth, “Eliminating Waste in
US Health Care,” JAMA 307, no. 14 (April 11, 2012):1513–6. Slide 22: Healthcare Systems and Professionals Struggle with Basic Communications • “The Imprivata Report on the Economic Impact of Inefficient
Communications in Healthcare.” June 2014. Slide 23: High Workload Leads to Increased Risk of Medical Error • Sandeep Jauhar. “Why Doctors Are Sick of Their Profession.” Wall
Street Journal. August 29, 2014. http://www.wsj.com/articles/the-u-s-s-ailing-medical-system-a-doctors-perspective-1409325361
• Paul G Shekelle. ”Effect of Nurse-to-Patient Staffing Ratios on Patient Morbidity and Mortality.” in Making Health Care Safer II: An Updated Critical Analysis of the Evidence for Patient Safety Practices. Rockville (MD): Agency for Healthcare Research and Quality (US); 2013 Mar. (Evidence Reports/Technology Assessments, No. 211.)
• Henry J. Michtalik. et al. “Impact of Attending Physician Workload on Patient Care: A Survey of Hospitalists.” JAMA Intern Med. 2013;173(5):375-377. doi:10.1001/jamainternmed.2013.1864.
Appendix: Sources (continued)
Digital Health Report 35
Slide 24: Value-Based Care Creates New Challenges for Systems • “The 2014 State of Value-Based Reimbursement and the Transition
from Volume to Value in 2014.” McKesson Corporation. • “The State of Population Health: Numerof Survey Report.” 2016. • “Just 20% of health care CEOs are ready to get rid of fee-for-service.”
The Advisory Board Company. 2015 Slide 25: Clinicians Need Tools to Tackle Information Overload • Amanda Hall and Graham Walton. “Information overload within the
health care system: a literature review.” Health Information & Libraries Journal, 21: 102–108. doi: 10.1111/j.1471-1842.2004.00506.x
• Information Overload and Missed Test Results in Electronic Health Record–Based Settings JAMA Intern Med. 2013;173(8):702-704. doi:10.1001/2013.jamainternmed.61.
• FDA • “GenBank and WGS Statistics.” National Center for Biotechnology
Information. August 2015. • Lutz Bornmann and Rüdiger Mutz. “Growth rates of modern science:
A bibliometric analysis based on the number of publications and cited references.” Journal of the Association for Information Science and Technology. 66: 2215–2222. doi: 10.1002/asi.23329
Slide 28: Patients Are Often Uninformed on Costs, Treatment Options • Ritsema TS, Bingenheimer JB, Scholting P, Cawley JF. Differences in
the Delivery of Health Education to Patients With Chronic Disease by Provider Type, 2005–2009. Prev Chronic Dis 2014; ;11:130175. DOI: http://dx.doi.org/10.5888/pcd11.130175
• Blumenthal-Barby, et al. The Neglected Topic: Presentation of Cost Information in Patient Decision Aids. Med Decis Making May 2015 vol. 35 no. 4 412-418
• “America’s Health Literacy: Why We Need Accessible Health Information.” US Department of Health and Human Services. 2008.
Slide 29: Engaged Patients Correlate With Lower Costs and Better Outcomes • “Chronic Care: A Call to Action for Health Reform.” AARP Public
Policy Institute. • Suzanne Mitchell, et. al. Patient Activation and 30-Day Post-
Discharge Hospital Utilization. Jornal of General Internal Medicine. 2013. 2014 Feb;29(2):349-55. doi: 10.1007/s11606-013-2647-2.
• Judith H. Hibbard, et. al. “Patients With Lower Activation Associated With Higher Costs; Delivery Systems Should Know Their Patients’ ‘Scores.’” Health Aff February 2013 vol. 32 no. 2 216-222. doi: 10.1377/hlthaff.2012.1064
• David H. Gustafson et al. An eHealth System Supporting Palliative Care for Patients with Non-small Cell Lung Cancer: A Randomized Trial. Cancer. 2013 May 1; 119(9): 1744–1751; doi: 10.1002/cncr.27939.
Slide 30: Patients Want to Be Active Decision-Makers • “The State of Patient Engagement and Health IT” HIMSS. 2014.
About Silicon Valley Bank For more than 30 years, Silicon Valley Bank has helped innovative companies and their investors move bold ideas forward, fast. SVB provides targeted financial services and expertise through its offices in innovation centers around the world. With commercial, international and private banking services, SVB helps address the unique needs of innovators.
About SVB Analytics SVB Analytics, a non-bank affiliate of Silicon Valley Bank, serves the strategic business needs of entrepreneurs, corporates and investors in the global innovation economy. For more than a decade, SVB Analytics has helped global business leaders make informed decisions by providing market intelligence, research, and consulting services. Powered by proprietary data, SVB Analytics has a unique view into the technology and life science sectors.