101
Sveriges Riksbank Economic Review PUBLISHED BY SVERIGES RIKSBANK 2006:1 SVERIGES RIKSBANK
| Date post: | 08-May-2018 |
| Category: |
Documents |
| Upload: | trinhthuan |
| View: | 230 times |
| Download: | 3 times |

SV
ER
IG
ES
R
IK
SB
AN
K2
00
6:
1E
CO
NO
MI
C
RE
VI
EW
Sveriges RiksbankSE-103 37 Stockholm
Tel +46 8 787 00 00Fax +46 8 21 05 31
Sveriges RiksbankEconomic ReviewPUBLISHED BY SVERIGES RIKSBANK
2006:1
S V E R I G E S R I K S B A N KPRODUCTION: SVERIGES RIKSBANK PRINTER: ELANDERS GOTABISSN 1404-6768
Omslag 8 mm eng 06-03-13 11.00 Sida 1

EconomicReview
2006:1

341 123Trycksak
SVERIGES RIKSBANK ECONOMIC REVIEW
is issued by Sveriges Riksbank three to four times a year.
PUBLISHER: STEFAN INGVES
GOVERNOR OF SVERIGES RIKSBANK
EDITORS: STAFFAN VIOTTI, KERSTIN MITLID
AND THE COMMUNICATIONS SECRETARIAT
Sveriges Riksbank, SE-103 37 Stockholm, Sweden.
Telephone +46 8 787 00 00
The views expressed in signed articles are the
responsibility of the authors and are not to be
regarded as representing the view of the Riksbank
in the matters concerned.
Subscription to the journal and single copies
can be ordered from:
the website of the Riksbank
www.riksbank.se/Published/Publications/Economic Review,
E-mail [email protected],
Fax +46 8 787 0526, and
Communications secretariat
Sveriges Riksbank
SE-103 37 Stockholm.

Contents
■ Financial asset management at the Riksbank 5
Tomas Ernhagen and Fredrik OlssonAt end 2005 the Riksbank's financial assets were valued at approximately SEK 200 bil-
lion. Foreign fixed-income securities made up the major item and the other items in-
cluded gold, monetary policy repos and currency swaps. In this article we describe the
principles and considerations that underlie the long-term direction of investment in
these assets.
■ Controlling legal risks in financial asset management 24
Magnus GeorgssonLegal risks are prevalent in financial asset management but seldom feature in overall risk
calculations, where the emphasis is rather on financial risk. One reason for this is proba-
bly that legal risks seldom materialise, besides being difficult to measure and evaluate.
But if they do materialise, the damage can be considerable. There is therefore every rea-
son to take legal risk seriously.
■ How do large current-account surpluses co-exist with a weak interna-
tional investment position? 37
Gunnar Blomberg and Maria FalkIn the past ten years the balance of payments has shown large surpluses without this
leading to a corresponding improvement in the international investment position. A
major explanation lies in valuation changes to external financial assets and liabilities. The
parts played by exchange rate fluctuations, equity price movements in Sweden and
abroad and the market value of direct investment entities are factors that we discuss in
this article.
■ Effective exchange rates - theory and practice 58
Jan AlsterlindThe value of the krona in terms of another currency is known as a bilateral exchange
rate. The information in a number of bilateral exchange rates can be combined into a
variety of weighted averages, known as effective exchange rate indices. This article
describes alternative ways of calculating an effective exchange rate index, the bilateral
rates to include and how to weigh them together.
■ Notices 78
■ Monetary policy calender 82
E C O N O M I C R E V I E W 1 / 2 0 0 6 3

■ Statistical appendix 85
■ Articles in earlier issues 94
E C O N O M I C R E V I E W 1 / 2 0 0 64

E C O N O M I C R E V I E W 1 / 2 0 0 6 5
■ Financial assetmanagement at theRiksbank
BY TOMAS ERNHAGEN AND FREDRIK OLSSONTomas Ernhagen works at the Financial Stability Department, Fredrik Olsson at the MarketOperations Department.
At end 2005 the Riksbank’s financial assets were valued at approximately
SEK 200 billion. Foreign fixed-income securities made up the major item
and the other items included gold, monetary policy repos and currency
swaps. In this article we describe the principles and considerations that
underlie the long-term direction of investment in these assets.
The question of how financial assets are managed by central banks has
traditionally been veiled in secrecy. More information has been forthcom-
ing, however, as central banks become more open about their operations.
An example is the central bank in Denmark, which has published its view
of the financial risks it takes in order to achieve various objectives.1 This
article is a first step towards a similar openness on the part of the Riks-
bank in that we present the basic principles and points of view behind the
management of the Bank’s financial assets.
Financial management at the Riksbank is divided into two levels:
strategic and tactical. The strategic matters, which concern the long-term
direction of financial management, are decided by the Riksbank’s Execu-
tive Board. The tactical management is decided by the Head of the Mar-
ket Operations Department (MOP) within deviations mandated by the
Executive Board.2 The Head of MOP in turn delegates a mandate for
short-term positioning by the investment division.
This article sets out to explain the considerations that apply at the
strategic level. We refer to the tactical level of management only when
this is motivated for pedagogic reasons. First we review the major items in
the Riksbank’s balance sheet in order to clarify the links between asset
management and the Riksbank’s various assignments. Then we go
1 Danmarks Nationalbank (2004).2 Mandated deviations provide a specified scope for deviating from the management’s long-term direction.
They can be used to increase or reduce exposure to a particular type of risk.
Financial managementat the Riksbank isdivided into two levels:strategic and tactical.

through the various financial risks the Executive Board has to decide
about when laying down the management’s long-term direction. The arti-
cle ends with a summary discussion.
Starting points
As in all financial management, the Riksbank’s objective in this context is
to generate return. However, the Executive Board also has to consider
how the financial management is to be arranged so that the Riksbank is in
a position to perform its statutory assignments as a central bank as re-
gards monetary policy and the stability of the financial system. It is obvi-
ously the statutory duties that have preference here; return can be a con-
sideration only to the extent that it does not jeopardise the Bank’s central
policy functions. In general terms, the balance sheet, which is presented
in a stylised form in Figure 1, represents the view of the Executive Board
in this respect.
Liabilities
The Riksbank’s assignment as regards financial stability is formulated in
the requirement that the Riksbank shall promote a safe and efficient pay-
ment system. The functions this assignment entails are reflected in the
balance sheet’s liabilities. The Riksbank’s statutory function of ensuring
the supply of banknotes and coins can be linked in a wider sense to this
E C O N O M I C R E V I E W 1 / 2 0 0 66
Figure 1. The Riksbank’s balance sheet
Assets Liabilities
Gold and foreignexchange reserve
Banknotes and coins in circulation
Foreign exchange swapsCapital
Monetary policy repos – Emergency liquidity assistance
– Operating costs
– Financial risksOther assets
Source: The Riksbank.

assignment. The public demand for cash, which is influenced in the short
run by, for example, interest rates and in the longer run by, for example,
the cash market’s structure, determines the volume of banknotes and
coins in circulation. Demand also varies with seasonal factors, peaking in
connection with major public holidays and pay-days, which lead to
increased public demand for cash.
The other main liability, equity capital, is linked to the Riksbank’s
independent status, which presupposes that the Bank has the financial
strength to cope with losses and costs that arise in its operations. Inade-
quate capital could weaken public confidence in the Riksbank’s capacity
to fulfil its statutory functions. If the Riksbank were to be dependent for
its operations on capital contributions from the state, there would be a
potential risk of this lack of financial independence leading to speculation
that such contributions will be accompanied by specific demands from the
Government and the Riksdag (parliament) concerning the direction of the
operations. It could then be more difficult for the Riksbank to fulfil its
functions.
Losses can arise in connection with the Riksbank’s emergency liquidi-
ty assistance, which may be provided so that a disruption of the payment
system does not result in a financial crisis. The assistance is conditional on
the bank or financial enterprise being solvent and supervised by Finans-
inspektionen (Sweden’s Financial Supervisory Authority) but problems in
the affected bank or enterprises may get worse. There is ultimately a risk
of the enterprise or bank failing, which means that the Riksbank can incur
financial losses. To avoid the Riksbank having to request capital contribu-
tions from the state, its capital needs to be large enough to cover such
losses.
The capital requirement is not solely linked to losses that may arise in
connection with emergency liquidity assistance. In order to safeguard
financial independence in the long run, capital is also needed to finance
the Bank’s operating costs, such as wages, real estate expenditure, etce-
tera.3 Moreover, the Riksbank may need capital to cope with losses in-
curred in the day-to-day management of its financial assets. The back-
ground to losses of this type is that the Riksbank’s assets are marked-to-
market. Losses then arise when the Swedish krona appreciates against the
currencies in the foreign exchange reserves or from changes in market
interest rates or the price of gold. A certain amount of capital may also be
needed to cover credit risk in the holding of securities, as well as opera-
tional risk.
E C O N O M I C R E V I E W 1 / 2 0 0 6 7
3 This and other issues concerning the Riksbank’s capital requirement are discussed in Ernhagen, Vesterlund& Viotti (2002).
The Riksbank isresponsible for thesupply of banknotesand coins, a functionthat is linked to thepromotion of a safe andefficient paymentsystem.
Capital is linked to theRiksbank’s independentstatus.
In order to safeguardfinancial independencein the long run, capitalis also needed forfinancing currentoperations.
Losses can arise inconnection with theRiksbank’s emergencyliquidity assistance.

Assets
The dominant item on the asset side of the balance sheet is assets de-
nominated in foreign currency.4 The basic purpose of these assets is to
provide for the contingency that exchange market interventions are need-
ed for reasons to do with monetary policy. In a crisis, these assets can also
be used for emergency liquidity assistance in foreign currency.
The Riksbank, like most other central banks, also owns gold. This is
primarily a consequence of the historical importance of gold but the hold-
ing can also be seen as an ultimate safeguard for a crisis in which other
assets are not acceptable.5 Nowadays, however, the main justification for
holding gold is that it contributes to diversification of the total portfolio of
financial assets. However, agreements with other central banks limit the
possibility of adjusting the size of the gold reserve for this purpose.6
When balance-sheet liabilities exceed the holding of gold and foreign
exchange reserves, the banking system has a structural deficit vis-à-vis
the Riksbank. The banking system then needs to borrow kronor from the
Riksbank. This borrowing requirement varies in the short run with public
demand for cash. A part of the requirement is handled by means of
weekly repo transactions,7 which are a component of the Riksbank’s
monetary policy steering of interest rates.8 Return considerations have led
the Riksbank to use foreign exchange swaps to extend the duration of the
remaining requirement.9
The item “Other assets” consists mainly of holdings in the form of
claims on the International Monetary Fund (IMF) and equity in the Bank
for International Settlements (BIS).
From this brief account of the balance sheet it will be clear that the
primary explanation for the Executive Board’s strategic decisions about
the direction of asset management lies in the Riksbank’s assignments. In
summary, a part of the assets has to consist of foreign reserves for the
purpose of intervention. Monetary policy repos are needed as another
part in order to manage interest rates. In addition, in order to safeguard
the Riksbank’s financial independence, risks must be taken in balanced
E C O N O M I C R E V I E W 1 / 2 0 0 68
4 The currency assets in the foreign reserves are invested in foreign fixed-income securities. Over 90 per centof the capital is held in government bonds issued in a range of six countries; the remaining capital is invest-ed in US agencies, that is, institutions associated directly or indirectly with the US state.
5 The role of the gold reserves is considered in more detail in Henriksson (2002).6 In order to counter a fall in the price of gold, in September 1999 fifteen European central banks agreed to
regulate a disposal of gold reserves over a period of five years. The agreement was renewed in 2004 andruns for another five years.
7 A repo transaction meets the banks’ borrowing requirement by the Riksbank purchasing securities fromthem and simultaneously agreeing to sell back the securities after a specified time.
8 For a detailed account of the Riksbank’s monetary policy steering of interest rates, see Otz (2005).9 This is done by the Riksbank selling Swedish kronor for euro in the spot market and depositing the euro,
accompanied by a forward agreement to buy back the kronor up to six months later. The forward contractserves to eliminate exchange risk. The swap portfolio is to have an average duration of three months.
The dominant item onthe asset side of the
balance sheet is assetsdenominated in foreign
currency.
When balance-sheetliabilities exceed theholding of gold and
foreign exchangereserves, the banking
system has a structuraldeficit vis-à-vis the
Riksbank.
Strategic decisions bythe Executive Board areprimarily explained by
the Riksbank’sassignments.

forms so that the danger of capital being eroded is minimised. Not until
these asset requirements are met can the management consider taking
financial risks in order to generate return.
In order to ensure that assets are invested in accordance with these
needs, the Riksbank has internal rules10 with a clear specification of which
financial risks are acceptable and why they may be taken. The rules state
that asset management is to be reviewed annually by the Executive Board
to ensure that its direction agrees with the stated objectives. The review
clarifies which risks are taken in order to fulfil the statutory assignments
and which are taken in order to generate return. This distinction is essen-
tially a matter of deciding the Riksbank’s exposures to risks of three types:
currency, interest rate and credit risks. The considerations behind the Riks-
bank’s choice of exposures to these risks are outlined below.
Currency risk
In accordance with the Currency Rate Policy Act (1998:1404, § 2), the
system for establishing the value of the krona in relation to foreign cur-
rencies is decided by the Government. The application of the exchange
rate regime decided by the Government is then, in accordance with the
Sveriges Riksbank Act (1988:1385, Chapter 7, § 1), the Riksbank’s
responsibility. It follows that the Riksbank must be in a position to inter-
vene in the foreign exchange market in order to defend the exchange
rate regime and this in turn requires that the Riksbank holds assets
denominated in foreign currency. With a fixed exchange rate regime, the
Riksbank is responsible for maintaining the value of the kronor in relation
to one or more other currencies. This entails the Riksbank intervening in
the foreign exchange market with a varying frequency and that in turn
calls for a holding of foreign currency assets that are readily traded.11
The size of this holding is primarily determined by the needs associat-
ed with the current exchange rate regime. Besides requiring reasonable
knowledge of how the financial markets are functioning at the time of an
intervention, gauging these needs calls for an opinion about the extent to
which the exchange rate regime is likely to be tested by market partici-
pants. It would be hazardous to attempt an exact assessment but it is rea-
sonable to assume that the need for liquid foreign currency assets is
greater with a fixed than with a variable exchange rate regime. Even if a
E C O N O M I C R E V I E W 1 / 2 0 0 6 9
10 The Riksbank’s rules for financial asset management were revised in the autumn of 2005. The revised ver-sion, which is available as “Rules for the Riksbank’s financial asset management” on the Riksbank’s web-site, entered into force on 1 January 2006.
11 The tradability (liquidity) of an asset is defined by the Riksbank in terms of the amount that can be soldwithin the requisite time limit in order to perform the Riksbank’s tasks without exerting an considerableinfluence on the asset’s market price.
The Riksbank hasinternal rules thatspecify acceptablefinancial risks.
The size of the foreigncurrency holding isprimarily determined bythe needs associatedwith the currentexchange rate regime.

variable exchange rate makes the need less pronounced, interventions
may still be called for to promote price stability.12 Moreover, the Riksbank
may have occasion to participate in interventions together with other cen-
tral banks (concerted interventions). To secure the capacity for interven-
tions, a large part of the Riksbank’s assets is held in government bonds
denominated in the probable intervention currencies (the euro and the US
dollar).
Currency risk lies in kronor exchange rate movements relative to cur-
rencies in the foreign reserve. This is a consequence of the Riksbank’s
accounts being expressed in kronor. An appreciation of the krona reduces
the value of the foreign reserve, just as a depreciation has the opposite
effect. In this context, an appreciation of the krona is a negative event
that generates exchange losses which show up on the Riksbank’s balance
sheet. There is a risk of these losses being so large that they have to be
covered with the capital the Riksbank has intended to use in the event of
financial crises and for financing day-to-day operations. There are there-
fore grounds for limiting a krona appreciation’s effect on the Riksbank’s
earnings. At the same time, the Riksbank needs to have foreign exchange
assets for interventions. In other words, a change in the currency compo-
sition of the foreign currency reserve must take into account both the
intervention aspect and the risk of capital erosion.
For a capital manager that, like the Riksbank, mainly holds foreign
government-backed fixed-income securities, the dominant risk is currency
risk. The foreign currency exposure can lead to very large fluctuations in
the market value of the assets, measured in kronor, and thereby in the
annual result. An illustration of this is presented in Diagram 1, which
shows the annual and accumulated exchange rate effect between the US
dollar and the Swedish krona in the period 1994–2005.
Short-run fluctuations have to be accepted, however, because the
Riksbank holds assets in foreign currency primarily for the purpose of
intervention. Such fluctuations could admittedly be avoided by covering
the currency risk but that would function like an intervention and could
thereby have an undesirable effect on the krona’s exchange rate. In prac-
tice, short-run fluctuations need not be a major problem because the
Riksbank’s foreign currency holding is of a long-term nature. In the coun-
tries whose currencies are included in the foreign reserve, monetary policy
is much the same as in Sweden, so in principle it is only real economic dif-
ferences that lead to trendwise exchange rate movements. If real eco-
nomic developments are similar in these countries, it is reasonable to
E C O N O M I C R E V I E W 1 / 2 0 0 610
12 For a fuller discussion of the Riksbank’s intervention policy, see Heikensten & Borg (2002).
Currency risk ariseswhen the krona
exchange rate movesrelative to currencies in
the foreign reserve.
The foreign currencyexposure can lead to
large fluctuations in themarket value of the
assets in kronor andthereby in the annual
result.
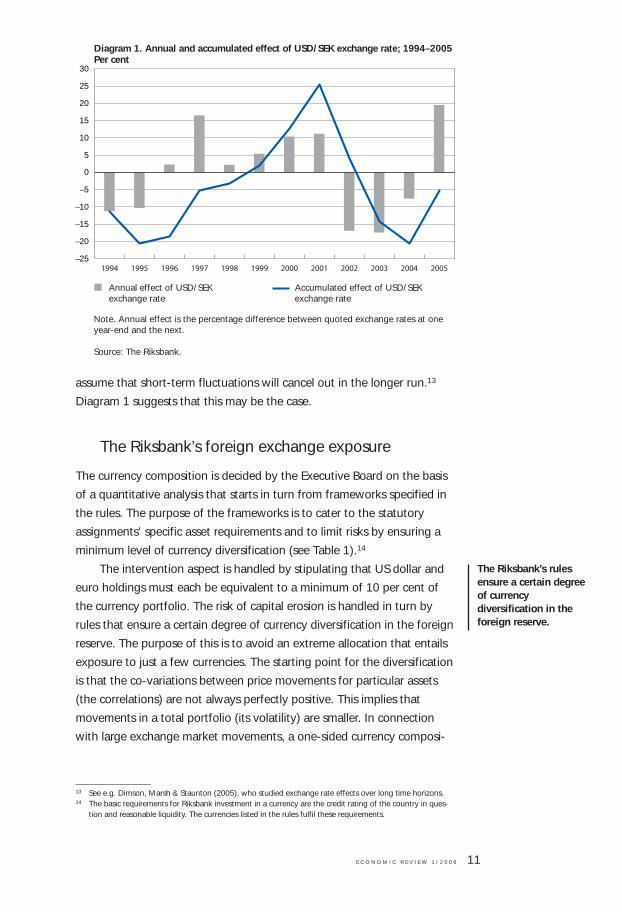
assume that short-term fluctuations will cancel out in the longer run.13
Diagram 1 suggests that this may be the case.
The Riksbank’s foreign exchange exposure
The currency composition is decided by the Executive Board on the basis
of a quantitative analysis that starts in turn from frameworks specified in
the rules. The purpose of the frameworks is to cater to the statutory
assignments’ specific asset requirements and to limit risks by ensuring a
minimum level of currency diversification (see Table 1).14
The intervention aspect is handled by stipulating that US dollar and
euro holdings must each be equivalent to a minimum of 10 per cent of
the currency portfolio. The risk of capital erosion is handled in turn by
rules that ensure a certain degree of currency diversification in the foreign
reserve. The purpose of this is to avoid an extreme allocation that entails
exposure to just a few currencies. The starting point for the diversification
is that the co-variations between price movements for particular assets
(the correlations) are not always perfectly positive. This implies that
movements in a total portfolio (its volatility) are smaller. In connection
with large exchange market movements, a one-sided currency composi-
E C O N O M I C R E V I E W 1 / 2 0 0 6 11
13 See e.g. Dimson, Marsh & Staunton (2005), who studied exchange rate effects over long time horizons.14 The basic requirements for Riksbank investment in a currency are the credit rating of the country in ques-
tion and reasonable liquidity. The currencies listed in the rules fulfil these requirements.
Diagram 1. Annual and accumulated effect of USD/SEK exchange rate; 1994–2005Per cent
Annual effect of USD/SEK Accumulated effect of USD/SEKexchange rate exchange rate
–25
–20
–15
–10
–5
0
5
10
15
20
25
30
200520042003200220012000199919981997199619951994
Note. Annual effect is the percentage difference between quoted exchange rates at one year-end and the next.
Source: The Riksbank.
The Riksbank’s rulesensure a certain degreeof currencydiversification in theforeign reserve.

tion can result in sizeable negative changes in value, which can lead in
turn to a marked reduction of equity capital.
A relatively low ceiling for smaller currencies is motivated by liquidity
considerations. Moreover, correlations between currencies tend to rise in
periods of financial turbulence,15 which means that these currencies’ con-
tribution to diversification is liable to diminish when the need is greatest.
It is also in such situations that the Riksbank is most likely to need to dis-
pose of assets for the purpose of intervention. Holding an unduly large
proportion of assets in less liquid currencies is therefore undesirable. That
is not to deny that under normal circumstances these currencies do con-
tribute to diversification; it simply underscores the importance of not hav-
ing holdings of them that are too large.
The quantitative analysis the Riksbank uses when deciding the cur-
rency composition, subject to the frameworks in the rules, is based on
fundamental and standard portfolio theory.16 The Riksbank’s purpose with
such an analysis is to arrive at the composition of currencies that, while
safeguarding the capacity for intervention, minimises the effects of
exchange rate movements as measured in Swedish kronor. The expected
return from foreign currency is not considered, only the estimated volatili-
ty and correlations of the currencies. These are estimated on time series
E C O N O M I C R E V I E W 1 / 2 0 0 612
15 See e.g. Dimson, Marsh & Staunton (2002), who studied how correlations tend to develop in periods offinancial turbulence.
16 This refers to the mean variance analysis that was originally presented in the 1950s by Harry M. Marko-witz. On account of this model’s sensitivity, the analysis is supplemented with Value-at-Risk (VaR) calcula-tions, risk contribution analyses and stress tests. VaR is an estimate of the risk of a potential loss, defined asthe expected maximum loss of value in an asset or portfolio of assets that will occur with a specified proba-bility over a specified period of time; see e.g. Jorion (2001).
TABLE 1. THE RIKSBANK’S FRAMEWORK FOR HOLDINGS OF DIFFERENT CURRENCIES
Currencies allowed Holding allowed;per cent
EUR (euro) 10–60
USD (US dollar) 10–60
Aggregate for EUR and USD 20–70
GBP (Pound sterling) 0–20
JPY (Japanese yen) 0–20
Aggregate for GBP and JPY 0–40
AUD (Australian dollar) 0–10
CAD (Canadian dollar) 0–10
CHF (Swiss franc) 0–10
DKK (Danish krone) 0–10
NOK (Norwegian krone) 0–10
NZD (New Zealand dollar) 0–10
Aggregate for AUD, CAD, CHF, DKK, NOK and NZD 0–40
Total 100
The quantitativeanalysis behind the
currency composition isbased on fundamentaland standard portfolio
theory.

for the direct exchange rate effect between the currencies and Swedish
kronor. The current currency composition is shown in Diagram 2.
Expected returns from the currencies could, in principle, also be taken
into account in the analysis. This would require an estimation of “risk pre-
mia” for each currency; as that is difficult to do and also somewhat arbi-
trary, these premia are usually assumed to be zero or constant in the long
run.17 So the analysis does not include an assessment of potential changes
in the values of the currencies in terms of the krona. Neither does the
analysis allow for the currency reserve being held in fixed-income instru-
ments.18 That is not done because the effect on the outcome of the
analysis would be marginal since bond returns are normally considerably
less volatile than exchange rates.
As the Riksbank’s view on the currency composition is based on his-
torical risk, there is no reason to delegate an active mandate for the pur-
pose of speculation in short-term exchange rate movements. Minor
changes as a consequence of exchange rate movements are permitted,
however, in order to curb the transaction costs associated with foreign
reserve adjustments designed to maintain the currency composition. This
operating mandate amounts to ±3 percentage points per currency.
Interest rate risk
As mentioned earlier, the Riksbank’s currency risk is a direct consequence
of its tasks of being capable of intervening in the foreign exchange mar-
ket and of providing emergency liquidity assistance in connection with a
E C O N O M I C R E V I E W 1 / 2 0 0 6 13
17 Such an assumption implies that the expected return on an open (that is, un-hedged) currency positionwith a given short duration is the same as for an equivalent domestic investment.
18 The expected return does play an important part in the analysis of the composition of fixed-income assets.The main concern is the term premia that it is reasonable to expect but also the risks in particular fixed-income markets and the correlation between these. As the currency composition is analysed separatelyfrom the analysis of the market distribution of fixed-income assets, they may result in different portfolioweights. Such a mismatch in the holding between currencies and fixed-income markets is known as curren-cy overlay and can be managed with derivative instruments.
Diagram 2. Currency composition of the foreign exchange reservePer cent
Source: The Riksbank.
GBP 10%
NOK 10%
CAD 5%
AUD 5%
USD 20%
EUR 50%

financial crisis. There is no such direct link between interest rate risk and
the Riksbank’s statutory assignments. In so far as the Riksbank chooses to
take interest rate risk – by investing in securities with an average duration
that extends beyond the accounting period – the reason is to increase the
expected return on its assets. The background to this is that interest rate
risk does not clearly threaten equity capital in the way that currency risk
does. The considerations behind the Riksbank’s view of interest rate risk
are described in the following.
Interest rate risk lies in changes in the yield curve, which represents
the market rates for different maturities. Analysis of the yield curve usual-
ly focuses on three factors: parallel shift,19 slope and curvature.20 A paral-
lel shift is when the entire curve moves to the same extent up or down.
Historically, it is such shifts that have contributed the largest part of the
variation in the yield curve. The dominance of parallel shift has led many
asset managers to focus their choice of interest rate exposure on various
measurements connected with this shift. This is also true for the Riksbank,
where interest rate risk is managed by using the measure modified dura-
tion. As this measures the effect of parallel shifts in the yield curve, it pro-
vides only an approximate estimate of how the market value of a bond
portfolio reacts to a change in market rates of interest.21 But as duration is
the Riksbank’s basic measure of interest rate risk, the following account
concentrates on the choice of duration.22
The choice of duration is often discussed on the assumption that the
yield curve normally slopes upwards – interest rates are assumed to
increase with their duration. So the choice of a longer duration can be
expected to give a higher return on an investment.23 This is accompanied
by a higher risk because the volatility of returns increases as a rule with
duration. A longer duration is therefore associated with larger fluctuations
in a portfolio’s market value and return.
There is empirical support for this. Historical analyses show that the
E C O N O M I C R E V I E W 1 / 2 0 0 614
19 This factor is often referred to in academic literature as “level”.20 Changes in slope are when the short and/or long end of the curve move, making the slope steeper or flat-
ter. Changes in curvature are when the long and short ends move in the same direction and the middlesegment moves in the opposite direction or is unchanged. For a detailed description of the yield curve, seee.g. Golub & Tilman (2000).
21 Modified duration is a linear description of a bond portfolio’s market value in relation to the developmentof interest rates. This relationship is in fact not linear but convex, so it is only for marginal interest ratemovements that modified duration gives a good picture of the risk (the change in market value). For largerinterest rate movements, modified duration should be supplemented with “convexity”, which takes non-linear effects into account. Modified duration is often used to indicate the approximate extent to which afixed-income portfolio changes when the market rates of interest rise 1 percentage points. The value of aportfolio with a modified duration of 4 is assumed to fall 4 per cent.
22 At the Riksbank, the management of changes in slope and curvature is handled as a tactical issue.23 Note that the yield curve defined as quoted market interest rates for different maturities is not the same as
the total expected return from bonds with these maturities. The difference is partly due to the size of bondcoupons. The theoretical account in this article refers to the total return.
The Riksbank usesmodified duration to
handle interest raterisk.
In so far as theRiksbank chooses to
take interest rate risk,the reason is to
increase the expectedreturn on its assets.
slope of the yield curve is normally positive.24 In general, interest rates for
different maturities are determined by supply and demand. Assuming that
the supply is given, demand and hence the interest rates can be deter-
mined by the investors’ horizons, risk propensity and expectations of
future interest rates. A curve that slopes upwards can then be explained
as a short-term preference among investors, who want to reduce the
accounting risk. With an accounting period of one year, for example, in-
vestors may prefer to place a relatively large proportion in one-year secu-
rities. Another explanation may be that short-term securities are preferred
for reasons to do with liquidity. If this is the case for many investors, the
high demand for these securities will depress interest rates for the dura-
tions in question. At the same time, longer bonds carry a positive risk pre-
mium to compensate for the higher volatility of their return. But although
the slope of the yield curve is therefore normally positive, it may be un-
wise to take this for granted. Moreover, an upward sloping yield curve
does not necessarily imply that the return increases along with duration.
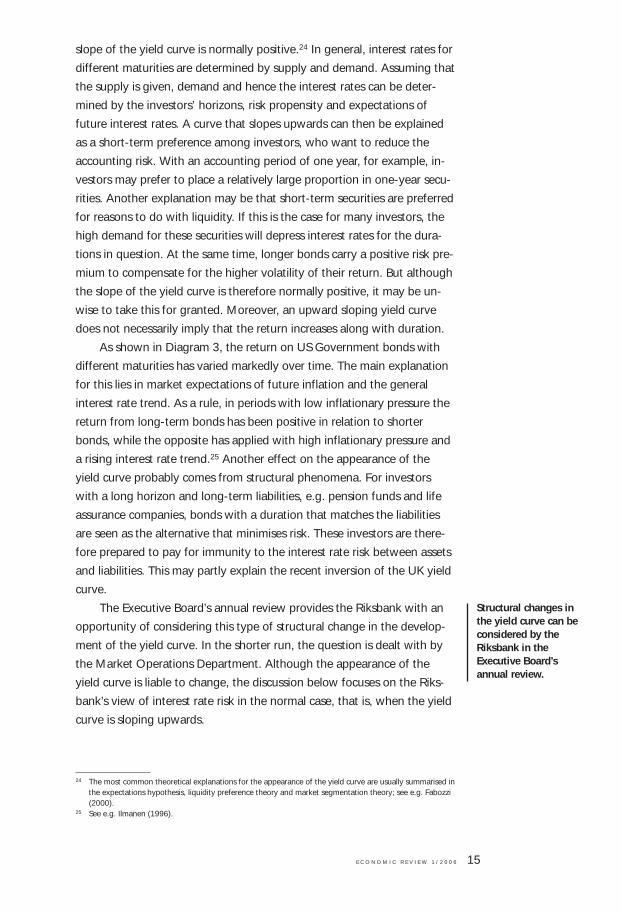
As shown in Diagram 3, the return on US Government bonds with
different maturities has varied markedly over time. The main explanation
for this lies in market expectations of future inflation and the general
interest rate trend. As a rule, in periods with low inflationary pressure the
return from long-term bonds has been positive in relation to shorter
bonds, while the opposite has applied with high inflationary pressure and
a rising interest rate trend.25 Another effect on the appearance of the
yield curve probably comes from structural phenomena. For investors
with a long horizon and long-term liabilities, e.g. pension funds and life
assurance companies, bonds with a duration that matches the liabilities
are seen as the alternative that minimises risk. These investors are there-
fore prepared to pay for immunity to the interest rate risk between assets
and liabilities. This may partly explain the recent inversion of the UK yield
curve.
The Executive Board’s annual review provides the Riksbank with an
opportunity of considering this type of structural change in the develop-
ment of the yield curve. In the shorter run, the question is dealt with by
the Market Operations Department. Although the appearance of the
yield curve is liable to change, the discussion below focuses on the Riks-
bank’s view of interest rate risk in the normal case, that is, when the yield
curve is sloping upwards.
E C O N O M I C R E V I E W 1 / 2 0 0 6 15
24 The most common theoretical explanations for the appearance of the yield curve are usually summarised inthe expectations hypothesis, liquidity preference theory and market segmentation theory; see e.g. Fabozzi(2000).
25 See e.g. Ilmanen (1996).
Structural changes inthe yield curve can beconsidered by theRiksbank in theExecutive Board’sannual review.
The Riksbank’s choice of interest rate exposure26
Having a clear investment horizon simplifies the choice of a portfolio’s
duration. For the pension funds and life assurance companies we men-
tioned above, it is natural to try to obtain immunity to market risk by
matching the interest rate sensitivities of assets and liabilities. An interest
rate movement that increases the value of the liabilities will then be neu-
tralised by the corresponding increase in asset values. In the absence of
such a self-evident investment horizon, an investor has to arrive at the
choice of duration from other starting points. The reasonable approach is
to look at the relationship between returns and risks.
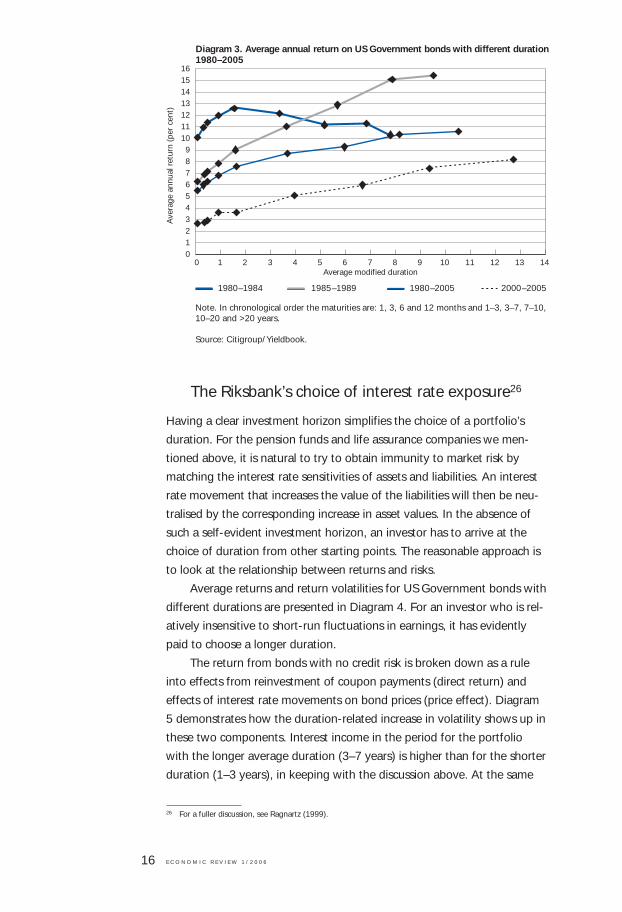
Average returns and return volatilities for US Government bonds with
different durations are presented in Diagram 4. For an investor who is rel-
atively insensitive to short-run fluctuations in earnings, it has evidently
paid to choose a longer duration.
The return from bonds with no credit risk is broken down as a rule
into effects from reinvestment of coupon payments (direct return) and
effects of interest rate movements on bond prices (price effect). Diagram
5 demonstrates how the duration-related increase in volatility shows up in
these two components. Interest income in the period for the portfolio
with the longer average duration (3–7 years) is higher than for the shorter
duration (1–3 years), in keeping with the discussion above. At the same
E C O N O M I C R E V I E W 1 / 2 0 0 616
26 For a fuller discussion, see Ragnartz (1999).
Note. In chronological order the maturities are: 1, 3, 6 and 12 months and 1–3, 3–7, 7–10,10–20 and >20 years.
Source: Citigroup/Yieldbook.
Average modified duration
Ave
rage
ann
ual r
etur
n (p
er c
ent)
Diagram 3. Average annual return on US Government bonds with different durations1980–2005
0 1 2 3 4 5 6 7 8 9 10 11 12 13 140123456789
10111213141516
1980–1984 1985–1989 1980–2005 2000–2005
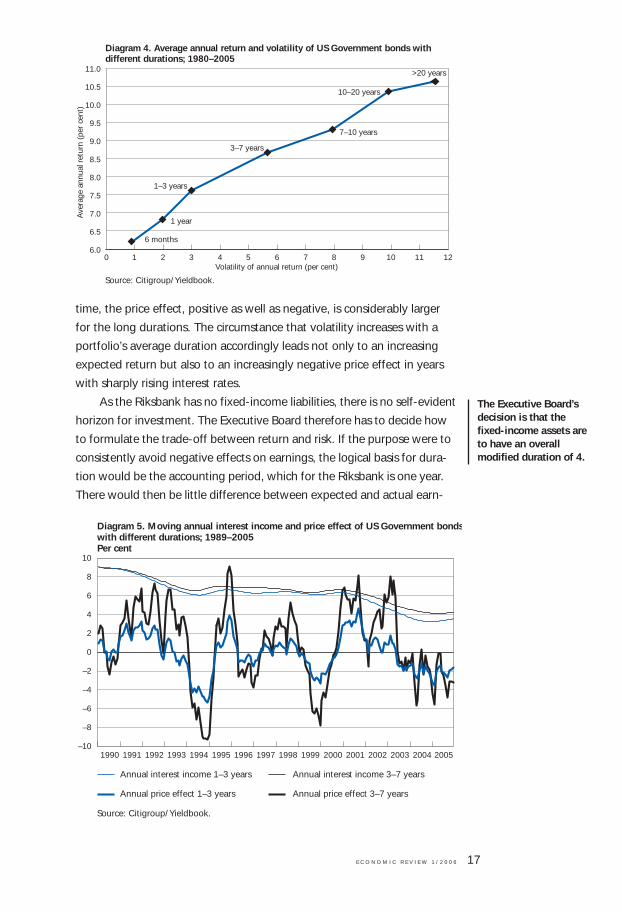
time, the price effect, positive as well as negative, is considerably larger
for the long durations. The circumstance that volatility increases with a
portfolio’s average duration accordingly leads not only to an increasing
expected return but also to an increasingly negative price effect in years
with sharply rising interest rates.
As the Riksbank has no fixed-income liabilities, there is no self-evident
horizon for investment. The Executive Board therefore has to decide how
to formulate the trade-off between return and risk. If the purpose were to
consistently avoid negative effects on earnings, the logical basis for dura-
tion would be the accounting period, which for the Riksbank is one year.
There would then be little difference between expected and actual earn-
E C O N O M I C R E V I E W 1 / 2 0 0 6 17
The Executive Board’sdecision is that thefixed-income assets areto have an overallmodified duration of 4.
Diagram 4. Average annual return and volatility of US Government bonds with different durations; 1980–2005
0 1 2 3 4 5 6 7 8 9 10 11 12
Source: Citigroup/Yieldbook.
6.0
6.5
7.0
7.5
8.0
8.5
9.0
9.5
10.0
10.5
11.0
6 months
1 year
Volatility of annual return (per cent)
1–3 years
3–7 years
7–10 years
10–20 years
>20 yearsA
vera
ge a
nnua
l ret
urn
(per
cen
t)
1990 1991 1992 1993 1994 1995 1996 1997 1998 1999 2000 2001 2002 2003 2004 2005
Annual interest income 1–3 years Annual interest income 3–7 years
Annual price effect 1–3 years Annual price effect 3–7 years
–10
–8
–6
–4
–2
0
2
4
6
8
10
Diagram 5. Moving annual interest income and price effect of US Government bondswith different durations; 1989–2005Per cent
Source: Citigroup/Yieldbook.

ings. However, such a short strategic investment horizon entails an
increased reinvestment risk27 as well as a lower expected return. As a cen-
tral government agency, the Riksbank starts instead from a sovereign’s
long-term perspective on assets, where a good long-term return is pre-
ferred despite larger short-run variations in the annual result.28 With such a
long-term perspective on assets, the Riksbank avoids the extra liquidity
premia for shorter securities that market players seem to find acceptable.
Against this background, the Executive Board’s decision is that the fixed-
income assets are to have an overall modified duration of 4, with a tactical
mandate for deviations of ±1.5. This choice is based on an assessment that
price risk29 is not considered to be a threat to equity capital.
In deciding the duration of the Riksbank’s krona assets, the Executive
Board has chosen a balance between return and clarity in the practical
work of managing interest rate formation in the economy. As discussed
initially, the Riksbank manages the shortest market rates by means of
weekly repo transactions. As the return on these repos is comparatively
low, the Executive Board has chosen to minimise the size of monetary pol-
icy repos.
Other assets (see the section on the balance sheet), which are neither
foreign fixed-income securities nor gold, can then be managed with a
view to generating higher return.30
Credit risk
Thus, as indicated above, the choice of a relatively long duration has no
link to the Riksbank’s statutory assignments. It rests solely on the assump-
tion that the state prefers a high return to minor fluctuations in the annual
result. The same assumption lies behind the Riksbank being prepared to
consider investment in securities other than government bonds and there-
by take a credit risk in order to obtain a higher risk-adjusted return.31
The Riksbank’s fixed-income assets are currently dominated by gov-
ernment bonds and the same is generally true of other central banks.
E C O N O M I C R E V I E W 1 / 2 0 0 618
27 Reinvestment risk arises when capital is invested over more than one period, the reason being that the rein-vestment rate in future periods is not known in the current period. Investing in assets (with no credit risk)with the same duration as the accounting period confines exposure to the reinvestment risk and the annualoutcome will be given from the beginning of the year.
28 In view of the principle for transferring Riksbank profits to the Treasury, it is reasonable to assume that pri-ority is accorded to the return in the long run. The principle is that 80 per cent of the average annual profitin the past five years is to be transferred annually to the Treasury; this does not include the share of theresult that is due to exchange rate movements vis-à-vis the Swedish krona.
29 Price risk is the risk that interest rates and hence bond prices move unfavourably, with a direct effect onearnings. This risk grows with the average duration of the investments.
30 The Riksbank does this by using foreign exchange swaps to extend the duration from one week to threemonths.
31 Risk-adjusted return is the return on an investment in relation to its risk. A higher risk-adjusted return canaccordingly be achieved by either increasing the return for a given risk or by reducing the risk for a givenreturn.

However, increased possibilities of managing and monitoring financial
risks, together with less frequent interventions as more and more coun-
tries switch to a variable exchange rate, have made central banks around
the world32 increasingly interested in investing in assets that carry a credit
risk. Capital markets, above all in the United States and Europe, provide a
number of alternatives for fixed-income investment that give a higher
interest rate than government bonds. The interest rate is higher because
the issuer represents a higher credit risk33 and liquidity as a rule is some-
what lower than for government bonds. These two components are mir-
rored in the risk premium (in the form of a higher interest rate) the market
requires for investment in these assets.
As a rule, converting a certain portion of a fixed-income portfolio
from government bonds to credit bonds has positive diversification
effects. This is because the returns on government and credit bonds sel-
dom show a perfect positive correlation. A certain portion of credit bonds
can accordingly increase the risk-adjusted return. It should be under-
scored, however, that investing in credit bonds introduces an additional
type of financial risk in the form of credit risk. It therefore places greater
demands on risk management, analysis and capital, over and above what
is caught in risk measures such as volatility calculated from historical
returns. It is therefore also important to maintain a high degree of diversi-
fication in the segment with credit risk by spreading the investments over
an adequate variety of issuers and sectors.
The Riksbank’s credit exposure
As shown in Table 1, the rules stipulate that at least 20 per cent of the
foreign reserve is to be held in US dollars and euro. As this currency expo-
sure is intended to suffice for the most acute intervention requirements
under the current flexible exchange rate regime, US and European gov-
ernment securities are to make up 20 per cent of the underlying spot
assets. It follows that other assets do not need to be as liquid, which
enables the Riksbank to invest in other asset categories than government
paper. As discussed above, spreading capital over more categories of asset
probably gives a better relationship between risk and return, assuming a
less than perfect co-variation between asset returns. A greater degree of
diversification is therefore likely to have a positive effect on the risk-
adjusted return. The limit to altering the composition of assets in this way
is ultimately set by provisions in the Sveriges Riksbank Act (1988:1385,
E C O N O M I C R E V I E W 1 / 2 0 0 6 19
32 See The Royal Bank of Scotland (2003) and (2006).33 Credit risk refers here to the risk of an issuer suspending payment commitments on issued debt securities.
The Riksbank’s fixed-income assets arecurrently dominated bygovernment bonds.
A certain portion ofcredit bonds canincrease the risk-adjusted return.
An increased degree ofdiversification is likelyto have a positive effecton the risk-adjustedreturn.

Chapters 6 and 7) to the effect that the Riksbank may trade and invest in
various fixed-income securities, with the attendant rights and obligations.
In 2001 the Riksbank took a first step in this direction when the
Executive Board decided to invest a minor part of the foreign reserve in
bonds issued by US agencies, i.e. American institutions with a direct or
indirect link to the US Federal Government.34 On account of a higher
credit and liquidity risk, these bonds normally pay a higher interest rate
than equivalent government bonds. The historical interest rate spread
between US agencies and equivalent Government bonds is shown in Dia-
gram 6. While the interest rate spread between US agencies and Govern-
ment bonds was clearly positive throughout the period, there were single
months in which the difference in return was negative. This is because of
the negative relative price effect on investment that comes from widened
spreads.
The current rules for risk management make it possible to take diver-
sification even further by investing in additional asset categories. Given a
secure legal foundation and adequate risk management, the Riksbank is
entitled to invest not only in government bonds, gold and US agencies,
but also in the following fixed-income securities: securities with a govern-
E C O N O M I C R E V I E W 1 / 2 0 0 620
34 The Riksbank invests in the following US agencies: Tennessee Valley Authority and three mortgage institu-tions – Federal Home Loan Bank, Fannie Mae and Freddie Mac.
35 Debt securities under loans or issuers with a government guarantee.36 Debt securities issued by supranational or international institutions (e.g. the IBRD).37 Mortgage-Backed Securities, e.g. German “Pfandbriefe”, which are debt securities backed by loans that
are backed in turn by residential property. 38 Asset-Backed Securities, debt instruments backed by assets other than those referred to in the preceding
footnote.
In 2001 the ExecutiveBoard decided to invest
a minor part of theforeign reserve in
bonds issued by USagencies.
Interest rate spread Monthly return differential
-1,2
-1,0
-0,8
-0,6
-0,4
-0,2
0,0
0,2
0,4
0,6
0,8
1,0
1,2
1989 1990 1991 1992 1993 1994 1995 1996 1997 1998 1999 2000 2001 2002 2003 2004 2005
1.2
1.0
0.8
0.6
0.4
0.2
0.0
–0.2
–0.4
–0.6
–0.8
–1.0
–1.2
Diagram 6. Interest rate spread and monthly return differential between US agencies and US Government bonds; 1989–2005Per cent
Note. The differences refer to indices for 3–7 year durations.
Source: Citigroup/Yieldbook.
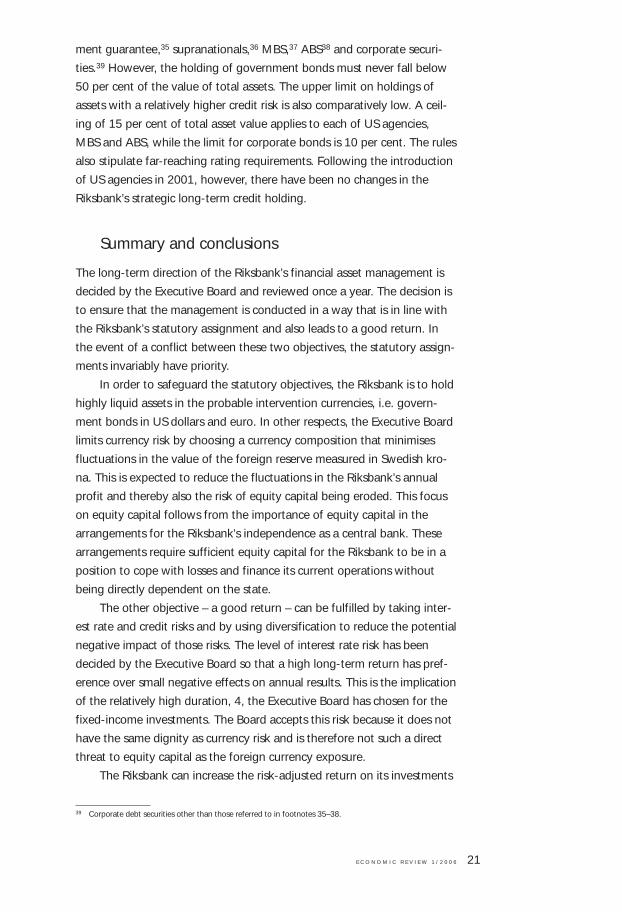
ment guarantee,35 supranationals,36 MBS,37 ABS38 and corporate securi-
ties.39 However, the holding of government bonds must never fall below
50 per cent of the value of total assets. The upper limit on holdings of
assets with a relatively higher credit risk is also comparatively low. A ceil-
ing of 15 per cent of total asset value applies to each of US agencies,
MBS and ABS, while the limit for corporate bonds is 10 per cent. The rules
also stipulate far-reaching rating requirements. Following the introduction
of US agencies in 2001, however, there have been no changes in the
Riksbank’s strategic long-term credit holding.
Summary and conclusions
The long-term direction of the Riksbank’s financial asset management is
decided by the Executive Board and reviewed once a year. The decision is
to ensure that the management is conducted in a way that is in line with
the Riksbank’s statutory assignment and also leads to a good return. In
the event of a conflict between these two objectives, the statutory assign-
ments invariably have priority.
In order to safeguard the statutory objectives, the Riksbank is to hold
highly liquid assets in the probable intervention currencies, i.e. govern-
ment bonds in US dollars and euro. In other respects, the Executive Board
limits currency risk by choosing a currency composition that minimises
fluctuations in the value of the foreign reserve measured in Swedish kro-
na. This is expected to reduce the fluctuations in the Riksbank’s annual
profit and thereby also the risk of equity capital being eroded. This focus
on equity capital follows from the importance of equity capital in the
arrangements for the Riksbank’s independence as a central bank. These
arrangements require sufficient equity capital for the Riksbank to be in a
position to cope with losses and finance its current operations without
being directly dependent on the state.
The other objective – a good return – can be fulfilled by taking inter-
est rate and credit risks and by using diversification to reduce the potential
negative impact of those risks. The level of interest rate risk has been
decided by the Executive Board so that a high long-term return has pref-
erence over small negative effects on annual results. This is the implication
of the relatively high duration, 4, the Executive Board has chosen for the
fixed-income investments. The Board accepts this risk because it does not
have the same dignity as currency risk and is therefore not such a direct
threat to equity capital as the foreign currency exposure.
The Riksbank can increase the risk-adjusted return on its investments
E C O N O M I C R E V I E W 1 / 2 0 0 6 21
39 Corporate debt securities other than those referred to in footnotes 35–38.

by holding categories of asset with credit risk, i.e. fixed-income securities
other than government bonds. This is because the actual return from
assets with a credit risk can be higher and the returns on assets of two
types normally do not co-vary perfectly. However, a larger element of
credit risk in the portfolio does increase the demands on risk manage-
ment, analysis and capital compared with a portfolio consisting entirely of
government bonds. As the Riksbank, as a central bank, may need to sell
securities at relatively short notice for the purpose of intervention, the
proportion of credit securities must be limited.
E C O N O M I C R E V I E W 1 / 2 0 0 622
References
Danmarks Nationalbank, (2004), Financial Management at DanmarksNationalbank.
Dimson, E., Marsh, P. & Staunton, M., (2005), Global Investment ReturnsYearbook 2005, ABN-AMRO/London Business School.
Dimson, E., Marsh, P. & Staunton, M., (2002), Triumph of the Optimists,1st Edition, Princeton University Press.
Ernhagen, T., Vesterlund, M. & Viotti, S., (2002), “Central bank’s equityneeds”, Economic Review, 2, Sveriges Riksbank.
Fabozzi, F., (2000), Bond Markets, Analysis and Strategies, 4th Edition,Prentice Hall.
Golub, B. W. & Tilman, L. M., (2000), Risk Management: Approaches forFixed Income Markets, John Wiley & Sons.
Heikensten, L. & Borg, A., (2002),“The Riksbank’s foreign exchange inter-ventions – preparations, decision and communication”, EconomicReview, 1, Sveriges Riksbank.
Henriksson, A., (2002), “The role of the gold reserves and the rate ofreturn on gold”, Economic Review, 1, Sveriges Riksbank.
Ilmanen, A., (1996), “Does duration extension enhance long-termexpected returns?”, Journal of Fixed Income.
Jorion, P., (2001), Value at Risk: The New Benchmark for ManagingFinancial Risk, McGraw-Hill.
Otz, A., (2005), “The Riksbank’s management of interest rates – mone-tary policy in practice”, Economic Review, 2, Sveriges Riksbank.
Ragnartz, C., (1999), “Interest rate risk in the foreign exchange reserve –duration intervals for the investment portfolio, Quarterly Review, 3,Sveriges Riksbank.
The Royal Bank of Scotland, (2003), How Countries Manage ReserveAssets, Central Banking Publications.
The Royal Bank of Scotland, (2006), RBS Reserve Mangement Trends2006, Central Banking Publications.
E C O N O M I C R E V I E W 1 / 2 0 0 6 23

■ Controlling legal risks infinancial assetmanagement
BY MAGNUS GEORGSSONMagnus Georgsson works at the Legal Secretariat
Legal risks are prevalent in financial asset management but seldom fea-
ture in overall risk calculations, where the emphasis is rather on financial
risk. One reason for this is probably that legal risks seldom materialise,
besides being difficult to measure and evaluate. But if they do materi-
alise, the damage can be considerable because these risks reside in the
legal conditions for limiting credit risk. There is therefore every reason to
take legal risk seriously. This is done by creating the best possible condi-
tions for controlling risk. Just as in the case of other types of risk, con-
trolling it aims to provide predictability and thereby a possibility of tak-
ing calculated risks.
Besides being common in an activity that manages financial assets,1 sel-
dom materialising and thereby difficult to measure and evaluate, legal risk
is a concept that is difficult to define. Still, this article will first try to con-
struct a picture of the legal risks that can occur in financial asset manage-
ment. In the light of that picture, the aim is to describe some basic condi-
tions for achieving sound control of the legal risk. Control in this context
stands for the identification, analysis and limitation of the legal risks.
A discussion of the concept of legal risk is followed an account of the
principal conditions for controlling the legal risks in asset management
and, finally, of the practical conditions for such control.
Legal risk in financial asset management
In the management of financial assets, legal risk occurs primarily in the
legal conditions for limiting credit risk. Some examples of arrangements
for limiting credit risk that have a particularly clear foundation in impor-
tant legal conditions are asset protection through right of reclamation and
E C O N O M I C R E V I E W 1 / 2 0 0 624
1 In the following, the phrase activity that manages financial assets is abbreviated in most cases to variousforms of the word activity.
Legal risk in financialasset management
occurs primarily in thelegal conditions forlimiting credit risk.
transfer of title, netting of outstanding transactions (i.e. settlement), and
guarantees.
The terms may require some clarification. Right of reclamation means
that instead of being included in the insolvent estate, the assets are held
separately from the counterparty’s own assets in favour of the owners.
Netting, or settlement, is similar to but not the same as offsetting. The
main rule for offsetting is that payment shall be due for an offsettable
claim, whereas settlement concerns claims that are not due for payment
and is usually arranged by agreement. A case in point is standard agree-
ments for derivative transactions, e.g. ISDA.2 Simplifying somewhat, in
settlement under ISDA, the transactions of a defaulting party cease to
exist and the market values of outstanding transactions are netted out.
Thus, the residual claim on or liability to the counterparty consists in the
net value of all outstanding transactions. Given that this can be presumed
to function, the day-to-day calculation of credit risk can use the same set-
tlement arrangement – as if a counterparty has defaulted – and result in a
lower exposure to that counterparty.3 With an arrangement for transfer of
title, credit risk can be further reduced by, in principle, transferring securi-
ties to match the net value of those with a positive value. Guarantees are
used, for example, when a counterparty or instrument (strictly speaking,
the issuer) does not meet the solvency standard that the activity has set,
often by specifying the level of a counterparty’s external credit rating. This
can be resolved by requiring a guarantee from a more solvent associate –
usually the parent company – or a sovereign.
A feature that arrangements for limiting credit risk have in common is
that they will not function as intended if the legal conditions are not in
place. In other words, they involve a large element of potential legal risk:
perhaps a country’s insolvency rules do not support the expected asset
protection, for instance right of reclamation, or the agreed form of netting
of outstanding transactions and perhaps the guarantee is either ruled out
by the guarantor’s statutes or national law or has other deficiencies that
prevent it from working as intended.
Another approach to controlling legal risk involves reviewing the divi-
sion of responsibility between the parties and ensuring that it is sufficient-
ly clear to as far as possible avoid unnecessary and costly legal disputes
and that it represents what the activity allows for and can accept respon-
sibility for in reality.
E C O N O M I C R E V I E W 1 / 2 0 0 6 25
2 International Swaps and Derivatives Association, Inc.3 In corresponding repo agreements published by ICMA (International Capital Market Association), netting is
closer to offsetting in that the buy-back is accelerated, i.e. the transaction still exists but is concluded –allowed to mature, as it were – in advance, whereupon the market values of the transactions are calculatedand netted out. All these arrangements for securing credit involve a large element of potential legal riskbecause they do not work as intended if the legal conditions are lacking.
A feature arrangementsfor limiting credit riskhave in common is thatthey will not functionas intended if the legalconditions are not inplace.

Then there is, of course, an operational risk in the actual execution of
the control of legal risks. There is an operational legal risk if, for example,
documents are faulty due to ignorance, carelessness or omission, or if the
conditions have not been examined carefully enough.
In the light of these examples, the following definition or summary
and subsequent description can help to indicate where legal risks are to
be found in financial asset management:
Legal risk is a risk of loss being occasioned primarily by assets being
unprotected due to uncertainty about or shortcomings in the legal condi-
tions for protecting these assets, and to inadequate control of these legal
conditions.
THE CRITERION OF LOSS
The first part of the definition can be called “the criterion of loss”. It stip-
ulates that a risk of loss exists because assets are unprotected. Some ways
in which loss can arise are as follows:
Assets can be lost because registration, reclamation, etc. lack support
in an agreement or in current legal rules or because the assets are not
otherwise properly protected.
Assets in the form of claims that are secured by agreement may be
lost if the agreement is not enforceable or invalid (e.g. the counterparty’s
guaranteed commitments).
Agreed settlement, offsetting, etc. do not function either due to an
imperfect agreement or because the relevant jurisdiction does not support
bilaterally agreed settlement or offsetting.
The division of responsibility between the contracting parties is either
not commensurate with the responsibility the activity has deemed accept-
able or is unclear, with an increased risk of costly and time-consuming
legal disputes.
THE CRITERION OF CAUSE
The other part of the definition can be called “the criterion of cause”
because it specifies the causes of loss which make the risk of loss one that
is deemed to have a legal origin. This is made up of three partial defini-
tions:
Uncertainty about the conditions
The first of these partial definitions – uncertainty about the legal condi-
tions – implies that control has been exercised as well as possible, or at
E C O N O M I C R E V I E W 1 / 2 0 0 626

least in keeping with the activity’s objective, but that legal risk of an
unknown or uncertain nature still exists. Such risk naturally tends to be
difficult to calculate but, provided the activity has opted for the appropri-
ate level of control, in many cases the risk should be something the activi-
ty is prepared to take or at least consider. If the activity has no idea about
the risk and this turns out to be substantial, either the level of control is at
fault or it is a matter of legal risk that overlaps some other category of risk
(see below).
Shortcomings of conditions
The second partial definition concerns cases where the level of control is
adequate (as in the previous partial definition) but where the risk is recog-
nised and the probability of loss can be calculated and included in the
overall estimation of risks and earnings.
Inadequate control of conditions
The third partial definition states that control is inadequate due e.g. to
ignorance, carelessness or performance errors, i.e. an operational legal
risk.
Briefly, then, there are risks that are either accepted or not, depend-
ing on the activity’s aversion to risk; in such cases, control has been exer-
cised, at least up to the level set by the activity, and under these condi-
tions there is nothing more to do. Then there are risks inside the bounds
of control, i.e. operational risks in the control function as such. The latter
originate inside the activity and are easier to limit – at least in theory –
with internal measures. The following can serve as an illustrative example
of the former risks, those that can be either accepted or not:
It is not unusual to require a counterparty to present documentary
evidence of internal authority to be a party to a particular agreement and
type of transaction. However hard one tries, the point may be reached
where such documentation is simply not procurable. Perhaps the coun-
terparty’s structure or the national rules under which it operates does not
require such documentation. There is then no operational risk as defined
in this article – control has been exercised to the full. But there is still a
legal risk to consider.
Another example of doing everything possible or complying with
control requirements and still being left with legal uncertainty is when an
external legal opinion has been obtained and turns out to be incomplete
or too vague.
As regards the first – and perhaps to some extent the second – partial
definition, there is a notion that any matters beyond the influence of indi-
E C O N O M I C R E V I E W 1 / 2 0 0 6 27
First, there are risksthat remain aftercontrol has beenexercised and that areeither accepted or not,then there areoperational risks in theexercise of control.
vidual market participants, e.g. unexpected changes in the law or legal
decisions, do not constitute legal risks. It can no doubt be argued that it is
possible to avoid countries with a reputation for uncertainty in these
respects. That ought to reduce the risk of being caught by such surprises.
Moreover, as the risk has a legal origin, it ought to be included in the con-
cept whether it is a question of legal uncertainty or a perceived legal risk.
But it can also be argued that as the risk lies in the unpredictability of the
legislative power of a foreign state, it borders on political risk. Another
borderline case – verging on operational risk – can be said to lie in a coun-
terparty’s operational risk, i.e. handling errors on the part of a counterpar-
ty’s personnel, etc. In most cases, however, such risks no doubt belong to
counterparty risk, which in turn can be seen as subordinate to credit risk.
In the absence of a legal origin, it can be argued that such risk does not
belong, any more than ordinary own operational risk, to legal risk. At the
same time, the effect of a counterparty’s operational risk can be limited by
a judicious division of responsibility in the agreement.
The above attempt at a definition is intended to be a guide or test
matrix for obtaining a clearer picture of the legal risks in the activity. Once
again, however, the dividing lines from other risk categories are diffuse
and in striving for a definition it is all too easy to get lost in a line of rea-
soning that is rather academic and thereby equally difficult to turn to
practical account.
Even so, this picture of risk can serve a purpose in the work of pro-
viding the activity with good conditions for controlling legal risk. This
issue will be considered in principle and then more practically in the fol-
lowing sections. But first some words about the difficulties in measuring
and evaluating legal risk.
MEASURING AND EVALUATING LEGAL RISK
As indicated, legal risk is difficult to measure separately from other risk
categories. Methods are often available for calculating credit risk, for
example, in addition to the credit ratings from competent institutions.
Such methods are seldom directly applicable to legal risk, with the possi-
ble exception of assessments of judicial systems.4 Moreover, legal risk is
characterised, as mentioned, by low probability but a high degree of
damage if the risk were to materialise. Furthermore, the probability of a
legal risk materialising is often dependent on the probability of other risks,
primarily credit risk. If a counterparty does become insolvent, the proba-
E C O N O M I C R E V I E W 1 / 2 0 0 628
4 For an attempt by Carolyn Jackson at a regression model with 14 critical variables, see Risk.net, September2002/Vol. 15/No. 9.
Legal risk is difficult tomeasure separately
from other riskcategories.

bility of a legal risk coming to light and materialising grows with the risk
that the arrangement for limiting credit risk (e.g. a guarantee) will be
utilised. The result of the work on limiting legal risk will then show up. But
not until then. The effect or some confirmation of the quality of the con-
trol of legal risk is often not evident until it is too late. All one can try to
obtain in advance is a measure of the loss to the activity if a guarantee,
agreement, right of reclamation, offsetting, settlement, etc. were not to
function. It is not hard to understand that such a loss could be substantial.
Control conditions in principle
PRINCIPLES FOR CONTROL
Legal risks were described above as belonging to one of two categories:
(i) risks that, after control (identification, analysis and limitation), remain
as an element in a decision to either take or refrain from a business
opportunity, for instance, and (ii) risks in the performance of control that
have to do with ignorance, carelessness or omission, i.e. legal operational
risks. The level of adequate control should be set for each activity so that
when control has been carried out, only risks in category (i) above remain
(or, to be realistic, these risks plus some degree of operational risk – as
defined in this article – that can be expected to remain despite good
intentions). The management of risks in this category then depends on
the activity’s level of risk aversion. I shall enlarge on this in the following
and then devote the rest of the article to how an activity can achieve ade-
quate control of the legal risks.
Identification
The control of legal risks starts from an understanding of the legal struc-
tures (the national legal system as well as foreign legal systems and agree-
ments) that affect the activity’s assets, claims and obligations. When this
has been achieved, it is possible to obtain a good picture of the implica-
tions of acting or of refraining from action in accordance with these legal
structures. That picture is then assessed in relation to the activity’s admin-
istrative conditions, level of risk and other requirements. Legal risks in the
activity have then been identified.
Analysis and limitation
When these legal risks have been analysed, a decision can be made on
the extent to which limiting them is justifiable in terms of strategic and
business considerations. The third step is to limit risks in so far as this is
E C O N O M I C R E V I E W 1 / 2 0 0 6 29
required by the activity, is commercially justifiable or actually feasible. The
remaining legal risks (category i above) are either those the activity has
decided to take or, if limitation is judged to be too costly or unfeasible,
those that contribute to decisions to refrain from business opportunities,
etc.
The purpose of control
A proper understanding of what control of legal risk is intended to
achieve can start from the activity’s objective: to manage financial assets
with a view to maintaining and if possible increasing their value. Seen
from this angle, legal risk is on a par with other risks in asset manage-
ment. Control, moreover, serves the same purpose, namely to ensure that
the basic premises for a decision on, for example, a business transaction
hold and that each transaction proceeds and is concluded in accordance
with the initial assumptions.
If it materialises, a legal risk can lead to costs, missed profits and loss
of assets that were not allowed for and which can make the transaction,
for example, unprofitable. This is precisely what control of legal risk – as
of most other risks – is about: creating predictability and possibilities of
taking calculated risks with a limited amount of uncertainty.
As indicated, the ambition need not be to render the activity com-
pletely free from legal risk (apart from operational risk). The effort to min-
imise risk is not meant to go so far that the activity misses business oppor-
tunities unnecessarily or incurs unnecessary costs. Obtaining the agree-
ment that is most risk-free can take time and meanwhile business may be
lost. It is a matter of achieving an expedite negotiation without this entail-
ing a division of risk that is unacceptable for the activity. Risks are a nor-
mal feature of most activities and in certain cases the probability of a
feared outcome actually happening is so small that, provided the activity’s
risk profile is met, the risk is worth taking, assuming that this is calculated
to improve earnings. In other words, the level of protection should be
weighed against the probability of loss and potential profit (see the exam-
ple below). This task is usually beyond the legal function on its own and
therefore calls for close cooperation with other functions in asset manage-
ment. This brings us to the division of the performance of and responsibil-
ity for control of legal risk, which is considered in the next section.
THE LEGAL FUNCTION AND RESPONSIBILITY FOR LEGAL RISK
The activity’s legal support is central to the task of controlling legal risk.
The value of legal support in financial asset management lies in the scruti-
E C O N O M I C R E V I E W 1 / 2 0 0 630
The ambition need notbe to render the activity
completely free fromlegal risk.

ny of legal conditions for the activity. This work should therefore be done
by a legal function together with other parts of the activity but the legal
function should direct it. Given a sufficiently competent and properly
dimensioned legal function (see below), the most suitable summary
description of a legal function’s task concerning legal risk therefore seems
to be the following: legal risks are those risks that a legal function is most
suited to help to control.5 Here there is a natural limitation both in the
levels of training and experience normally to be found in a legal function
and in the expression “help to” – the legal function is not ultimately
accountable for the legal risk as such. Product responsibility naturally rests
with the producer but the formal responsibility is often located outside the
legal function. In most cases this is also the most appropriate arrange-
ment: the legal risks have to be considered together with other risks in
relation to expected costs and earnings.
Consider the following example:
A new counterparty is to be used for a particular type of transaction
in which the credit risk is customarily limited by means of the combina-
tion of a netting agreement, let us say an ISDA agreement, and title
transfers equivalent to the exposure after all outstanding transactions
have been netted out. The legal function points out that it is uncertain
whether or not the counterparty’s national legal system supports the
intended transfer of title. In the light of that information, the risk control
function can adjust its calculations of risk exposure and the limits on the
counterparty in question. The new picture of risk results in an increased
risk exposure to just this counterparty, so that a larger part of the limit is
utilised. The business function then has to calculate the benefit of carry-
ing out the planned transactions even so. Perhaps the decision is to go
through with the transactions but with maturities that are shorter than
planned initially in order to reduce risk exposure over time.
A legal function can certainly be of assistance by making its contribu-
tion to this estimate of a business opportunity but is not best suited to
make the overall assessment. That task and the attendant responsibility
should lie with the part of the activity that undertakes the object of legal
risk control, for example a transaction, the procurement of a depositary,
etc.6 At the same time, cases may arise where the legal risk applies to the
activity as a whole, not just to an estimated profit. The legal risk can be so
large that doing anything along the planned lines is perceived as haz-
E C O N O M I C R E V I E W 1 / 2 0 0 6 31
5 See Whittaker, A. M., (2003), Lawyers as risk managers, Journal of International Banking and FinancialLaw, Vol. 18, No. 1, January.
6 At the Riksbank, the Market Operations Department is accountable for investment, while responsibility forthe procurement of depositaries and other intermediaries is shared with the Administration Department,which includes the Financial Administration Division (the Riksbank’s back office).
Directing and, togetherwith the rest of theactivity, performingcontrol of legal risk isthe task of the legalfunction.
A legal function canassist in the calculationof a businessopportunity but is notbest suited to make theoverall assessment.

ardous, for example because that would considerably damage the activi-
ty’s reputation. In such cases it is important that the general counsel has a
right of escalation, that is, a possibility of referring matters directly to the
executive management.
Practical conditions for control
FUNCTION OF THE ACTIVITY
We turn now to the control of legal risk in the activity as a whole and the
role of the lawyers in this respect. To make control of legal risk as effective
as possible, all relevant branches of the activity should participate in the
entire process. It is also important that everything is properly documented
for the collective memory and that procurers have – and take – the over-
riding responsibility throughout the process. This applies not least to the
negotiation of agreements and other “project-like” items of control.
Likening the negotiation of a agreement to the construction of a vehicle,
for example, it is more suitable for the parts to be assembled into a fin-
ished product by a single team than to have an assembly line. The team
typically consists of the procurer (usually the dealer or front office func-
tion when a transaction agreement is being negotiated, or the administra-
tive or back office function if the agreement has more to do with adminis-
trative matters),7 the back office function, the risk-control support func-
tion8 and the legal function. The optimal situation is for all functions to
have a proper picture of each other’s fields of responsibility and a clear
understanding of the purpose of the agreement. It is likewise important
that, instead of being confined to the legal function, knowledge of the
agreement’s content is acquired to a relevant extent by every function.
That also serves to limit the operational risks when the agreement is used
(see below).
An example of how administrative routines can facilitate such an
approach is the formalisation of cooperation, both to assemble the basis
for a business decision to ensure that every aspect has been considered
and to preserve the basis as an aid for the collective memory. The
Riksbank, for example, applies a standard model for cooperation – an
“application procedure” – with respect to a counterparty, a market or an
instrument that is new to the activity. The competent department distrib-
utes an application to use the counterparty, market or instrument and this
is annotated by each department and signed by the department head (the
E C O N O M I C R E V I E W 1 / 2 0 0 632
7 For example, agreements on depositories, correspondent banks and clearing.8 The risk control function is sometimes referred to as middle office; strictly speaking, however, a middle
office monitors results, while the risk control function focuses on levels of risk.
departments note the conditions the object of the application should ful-
fil, seen from their perspectives, the risks involved, the measures and
steps they recommend, etc.). The information in the application then
serves as a basis for the applicant department head’s decision as to
whether or not the counterparty, for example, is to be accepted and
under what conditions. Once a counterparty, instrument or market has
been “approved”, a new – perhaps less exhaustive – application has to be
made as soon as a change of some weight occurs, for instance a new
agreement or type of transaction with an approved counterparty, addi-
tional activity in an approved market, etc.
AWARENESS OF LEGAL RISKS
It may happen that other functions in an activity see an agreement as an
out-and-out legal product which therefore does not concern them. Such
an attitude is deleterious not only for a proper negotiation of the agree-
ment but also for its future use. For the lawyers, control of the legal risks
presupposes sound knowledge of the activity in general and in particular,
of course, of what the agreement is about. It is equally important that
those who are to act under or administer a completed agreement really
understand how the agreement works. In the final analysis, an agreement
documents what has been agreed with a counterparty, that is, what one
wants from the counterparty, what one has promised to do for the coun-
terparty and, not least, how the risks are to be shared. For the day-to-day
business activity it is therefore highly important that each function in an
activity is continuously clear about relevant aspects of the content. This is
necessary, for instance, in order to evaluate information from the market
in the light of what the agreement has to say about the rights and possi-
bilities of limiting risks (insolvency rules, etc.). The legal function seldom
follows the daily management of financial assets and seldom has the mar-
ket contacts that are needed for a reaction to improprieties and distur-
bances. Moreover, transactions and confirmation of them need to be car-
ried out in accordance with the agreement in order to be covered by this.
To promote uniformity, another good idea is to use standard agreements
as far as possible and to try to limit the number of standards as well as the
number of judicial systems involved. Such an attitude facilitates the
E C O N O M I C R E V I E W 1 / 2 0 0 6 33
The Riksbank applies astandardised model forcooperation withrespect to a newcounterparty, a newmarket or a newinstrument.
Those who act under oradminister a completedagreement mustunderstand how theagreement works.

organisation’s understanding of and ability to react to counterparty failure
(see below), besides contributing to the aim of restraining costs and the
possibilities of limiting risks.9
If the activity is aware of the agreement and thereby of the division
of risks between the parties, credit exposure can be adjusted accordingly.
Given a sound comparison of costs and receipts, in which the former
include legal risks (i.e. calculated risks) and the collective is continuously
aware of the risks that have been taken, there is as mentioned nothing
wrong about taking a risk, even of a legal nature. But continuous aware-
ness of these risks is a precondition for a calculation that holds.
READINESS
It is not sufficient, however, for the activity’s entire organisation to be
aware of agreed relationships, divisions of risk and rules for responsibility,
though this is indeed a precondition for the organisation’s readiness to
cope with crises, e.g. counterparty failure. The activity should also per-
form exercises, as in all other crisis readiness, be prepared to trigger the
available protective mechanisms, for instance in agreements, rearrange
transactions, cancel payments, notify counterparties and so on. Here, too,
the nature of legal risk can be an obstacle: as legal risks seldom materi-
alise, a readiness exercise concerning counterparty failure, for example, is
liable to have less priority relative to day-to-day activities. Such an atti-
tude is about as logical as refraining from fire-drill because fires are so
infrequent. Much of the work on limiting legal risk is about providing the
activity with a tool-kit to use in the event of a crisis. Once a crisis, e.g. a
counterparty failure, is at hand, there is often no time to spare. If, for
example, the front office has to get hold of a lawyer who in turn has to
peruse the agreement before informing the back office that it must notify
the counterparty that a time limit is being set and the formulation of such
a notification then has to be worked out, time will be lost unnecessarily
and this may well lead to losses. In this respect, too, it can be advanta-
E C O N O M I C R E V I E W 1 / 2 0 0 634
9 It is better to build up internal competence in English law, for example, and strive to write agreements onthis basis than to give counterparties a free choice. The activity is then in a better position to cope internallybecause it is easier to focus on acquiring internal experience of and competence in one judicial system. If itthen proves impossible to gain acceptance for the chosen judicial system in a particular case, greater usecan be made of external specialist competence but there is no reason why this should be a common occur-rence. Most international banks can consider using English as well as New York law because they are oftenrepresented in both London and New York, with the possible exception of parent company guarantees,which are preferably drawn up for the judicial system in which the parent company is domiciled. For mat-ters to do with insolvency, on the other hand, the judicial system is dependent on the choice of counterpar-ty. In the case, for example, of netting claims under a standardised transaction agreement, e.g. ISDA orICMA, the organisation in question publishes legal opinions for particular judicial systems. In other cases itis advisable to request such an opinion.
Awareness of theagreement and the
division of risksbetween the parties
also means that creditexposure can be
adjusted accordingly.
As legal risks seldommaterialise, a readiness
exercise is liable tohave less priority
relative to day-to-dayactivities.

geous for the legal function to initiate training, organisational structures
for crisis management and exercises.
LEGAL SUPPORT
The dimension and competence of legal support for an organisation
depend on the nature of the latter’s activities and conditions. Bearing that
in mind, one can still point to some issues to consider when an activity
reviews its legal support with a view to providing optimal conditions for
good control of the legal risks.
The lawyers should work closely with other support functions as well
as with procurement functions. That does not mean that the lawyers
should belong to the same department as the procurers. On the contrary,
it is important that lawyers can express an opinion without being influ-
enced by the procurer (the person responsible for the business or process)
also being their superior. Another important reason is that a separate
assembly of lawyers facilitates advice and discussion between them,
which in turn enhances the reliability and quality of their opinions.10
It need hardly be said that legal consultants should be used as cost-
effectively as possible. Financial asset management frequently involves
foreign judicial systems and the questions that arise tend to require such a
variety of specialist knowledge that it is not sufficiently cost-effective to
dimension internal legal support so that it could cope with every imagina-
ble issue. Expert specialist assistance is almost invariably needed.
Regardless of the extent to which external consultants are used, it is
important that the internal legal support is at least dimensioned so that it
has procurement competence for every occasion and can handle the
internal coordination of different parts of the activity for the control of
legal risks. But such a dimension is to be seen as a minimum requirement
because the more one out-sources to consultants, the more difficult it
becomes to maintain the collective memory of different agreements when
it comes to the future use of agreements and future negotiations on
agreements. For each activity there is no doubt an optimal balance
between internal and external inputs that it is advisable to identify and
uphold. A solution in the normal case would be to restrict the use of con-
sultants to ensuring quality, providing a dialogue and meeting the need of
specialist competence in foreign law, with the proviso that the internal
E C O N O M I C R E V I E W 1 / 2 0 0 6 35
10 In a sizeable organisation, a legal function can, of course, be created where a number of lawyers areresponsible for financial asset management only, while the more general legal function is as a rule a func-tion at a central administrative level. The more specialised function for financial asset management canthen be headed by a general counsel equal in rank to the head of the business side, which upholds theintegrity of the legal function. The right to refer matters to the executive management is, of course, no lessimportant with such a division of the legal resources.
The internal legalsupport needs to bedimensioned so that ithas procurementcompetence for everyoccasion and canhandle internalcoordination.

legal support directs the work and undertakes the main contacts and
negotiations with the counterparty. Such a solution helps to maintain the
collective awareness in a long-term supportive way at the same time as
the activity itself receives further training, which contributes to cost-effec-
tiveness in the longer run.
E C O N O M I C R E V I E W 1 / 2 0 0 636

E C O N O M I C R E V I E W 1 / 2 0 0 6 37
■ How do large current-account surpluses co-existwith a weak internationalinvestment position?
BY GUNNAR BLOMBERG AND MARIA FALKGunnar Blomberg and Maria Falk work at the Monetary Policy Department.
In the past ten years the current account for Sweden has shown large sur-
pluses without this leading to a corresponding improvement in the inter-
national investment position. A major explanation lies in valuation
changes to external financial assets and liabilities. The gross stocks that
make up the international investment position have grown dramatically
in the past fifteen years and currently total SEK 13,400 billion. The parts
played by exchange rate fluctuations, equity price movements in Sweden
and abroad and the market value of direct investment entities are factors
that we discuss in this article. We also consider the extent to which the
statistics on Sweden’s international investment position are reliable.
What is the problem?
The net of surpluses and deficits on Sweden’s current and capital accounts
represents saving abroad (see the box “Balance of payments – some con-
cepts”) in terms of the real transactions. The accumulated net surplus for
the period since 1989 is SEK 995 billion, while the reduction of external
liabilities at market values amounts to around SEK 50 billion – very much
less than the improvement one might expect in the light of the current-
account surpluses.
Figure 1 presents accumulated saving abroad (the current and capital
account balances) since 1989 together with the accumulated changes in
the international investment position at market values. In an ideal case
where the net outcome of the financial transactions matches saving
abroad in terms of the current and capital account balances and the inter-
national investment position is unaffected by valuation changes, the two
curves would not diverge from one another. For some years in the early
and mid 1990s there was relatively little difference between the current-
The development ofaccumulated savingabroad is becomingincreasinglyindependent of thechanges in theinternationalinvestment position.

account surpluses and the reduction of external liabilities. The late 1990s
and early 2000s, on the other hand, are characterised by a notably weak-
er correspondence. In the last three years, the statistics give a relationship
that is actually negative (see Figure 1).
So why has saving abroad apparently become increasingly independent of
the changes in Sweden’s international investment position in recent years?
We approach this question by describing the real and financial flows
in the balance of payments and the factors that affect the investment
position. The period described is 1989–2005. The reason for starting with
1989 is that the abolition of exchange controls in that year fundamentally
altered the conditions for financial flows to and from Sweden. Cross-bor-
der financial transactions were no longer restricted.
Record current-account surpluses
Sweden’s current account for 2005 shows a surplus of SEK 163 billion,
equivalent to about 6 per cent of GDP. A long series of years with cur-
rent-account deficits came to an end in the mid 1990s. For the period
since 1989 the current account shows an accumulated surplus of SEK
1,065 billion. Never before in the modern era has Sweden had such large
surpluses for so many years.
The current-account surpluses come mainly from a strong balance of
trade (the net of exports less imports). Net exports have developed very
favourably since the beginning of the 1990s. The surplus on trade in
E C O N O M I C R E V I E W 1 / 2 0 0 638
Accumulated current and capital account balances
Accumulated change in market value of external position
–800
–600
–400
–200
0
200
400
600
800
1,000
1,200
20052004200320022001200019991998199719961995199419931992199119901989
Figure 1. Accumulated current and capital account balances and accumulated change in market value of international investment position; 1989–2005SEK billion
Source: The Riksbank.
The surpluses comemainly from a strong
balance of trade.
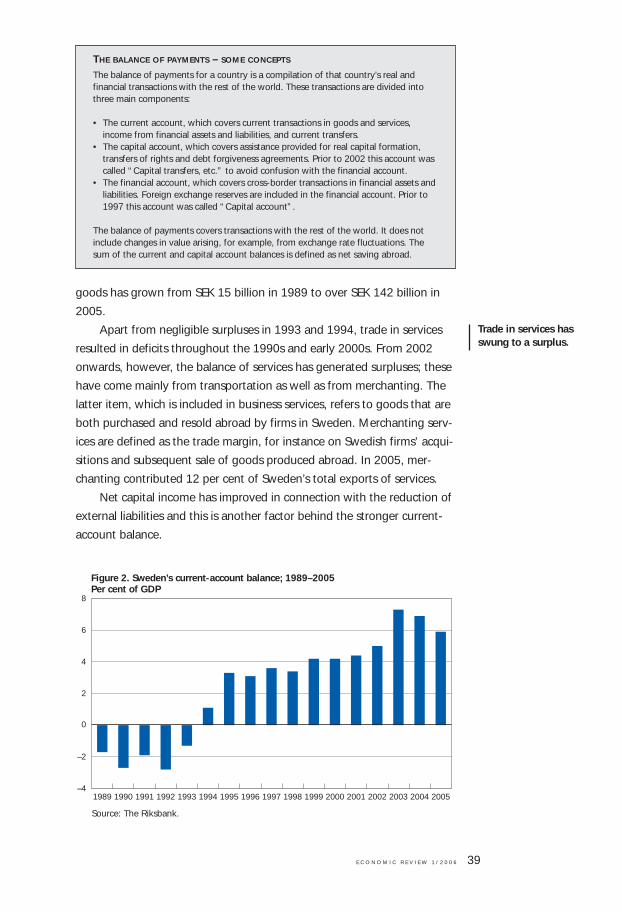
goods has grown from SEK 15 billion in 1989 to over SEK 142 billion in
2005.
Apart from negligible surpluses in 1993 and 1994, trade in services
resulted in deficits throughout the 1990s and early 2000s. From 2002
onwards, however, the balance of services has generated surpluses; these
have come mainly from transportation as well as from merchanting. The
latter item, which is included in business services, refers to goods that are
both purchased and resold abroad by firms in Sweden. Merchanting serv-
ices are defined as the trade margin, for instance on Swedish firms’ acqui-
sitions and subsequent sale of goods produced abroad. In 2005, mer-
chanting contributed 12 per cent of Sweden’s total exports of services.
Net capital income has improved in connection with the reduction of
external liabilities and this is another factor behind the stronger current-
account balance.
E C O N O M I C R E V I E W 1 / 2 0 0 6 39
THE BALANCE OF PAYMENTS – SOME CONCEPTS
The balance of payments for a country is a compilation of that country’s real andfinancial transactions with the rest of the world. These transactions are divided intothree main components:
• The current account, which covers current transactions in goods and services,income from financial assets and liabilities, and current transfers.
• The capital account, which covers assistance provided for real capital formation,transfers of rights and debt forgiveness agreements. Prior to 2002 this account wascalled “Capital transfers, etc.” to avoid confusion with the financial account.
• The financial account, which covers cross-border transactions in financial assets andliabilities. Foreign exchange reserves are included in the financial account. Prior to1997 this account was called “Capital account”.
The balance of payments covers transactions with the rest of the world. It does notinclude changes in value arising, for example, from exchange rate fluctuations. Thesum of the current and capital account balances is defined as net saving abroad.
Trade in services hasswung to a surplus.
–4
–2
0
2
4
6
8
20052004200320022001200019991998199719961995199419931992199119901989
Figure 2. Sweden’s current-account balance; 1989–2005Per cent of GDP
Source: The Riksbank.

The capital account is in deficit as a rule
A complete picture of the real exchange between Sweden and the rest of
the world also includes the capital account. This is a minor item that cov-
ers immaterial rights such as licences and patents, debt forgiveness, etc.,
and it normally shows a deficit. It should not be confused with the finan-
cial account, which covers the financial flows between Sweden and the
rest of the world. For the period 1989–2005 the capital account shows an
accumulated net deficit of SEK 70 billion.
Factors that affected financial integration
The abolition of exchange control in 1989 altered the conditions for cross-
border financial transactions. The earlier bans on buying/selling various
financial instruments were lifted, as were the restrictions on cross-border
lending and direct investment, and capital was free to move into and out
of Sweden.
Investment in foreign assets has also been facilitated by changes to
guidelines and regulations in the 1990s. For example, the successive
relaxation of investment rules for insurance companies in the 1990s has
made foreign assets eligible for a larger share of investment. The intro-
duction of the premium pension system (PPM) in 2000 and more liberal
investment rules for some national supplementary pension funds (AP
funds) has also led to increased investment in foreign assets.
Changes of this kind were not confined to Sweden. Similar moves
had already been made in many other countries. Some aspects of the
changes in Sweden were a consequence of EU membership in 1995 and
the common rules adopted by the Union.
The liberalisation accordingly paved the way for increased outward as
well as inward investment. Together with the introduction of new finan-
cial instruments and technical infrastructures that facilitated cross-border
trading, this resulted in rapidly growing financial flows between Sweden
and the rest of the world. Sweden became increasingly integrated with
the European and global financial markets.
Saving surplus and capital outflow – two sides ofthe same coin
Since 1989 the combined balance on the current and capital accounts –
the real flows – has given an accumulated inflow of SEK 995 billion. This
represents Sweden’s financial saving surplus for this period.
The other side of this real surplus is the outflow or export of capital.
E C O N O M I C R E V I E W 1 / 2 0 0 640
Deregulations inSweden since 1989 …
… have contributed tointernational financial
integration.
The technicalinfrastructure and new
financial instrumentshave also contributed.

The surplus has been used for, for example, Swedish financial investment
abroad. The statistics show that in this period Sweden has, for instance,
repaid foreign loans and purchased bonds, equity and foreign enterprises
to a greater extent than entities abroad have done in Sweden.
There has been a lively discussion about causal connections between
the current-account surplus and these capital outflows. However, the
question of whether the large export surplus has driven the capital out-
flow or whether it is high saving in Sweden that has restrained domestic
consumption and provided scope for high net exports (e.g. via the
exchange rate) is not considered in this article.
According to the balance of payments, in the period 1989–2005 the
accumulated deficit on the financial account was only around SEK 557 bil-
lion. In principle, the net of the financial flows should equal the net bal-
ance on the current and capital accounts and both these results should
represent Sweden’s net saving abroad, measured with different methods.
A discrepancy is not uncommon and as a general rule, the sum of the bal-
ances on the current and capital accounts – saving measured from the real
side – is then defined as net financial saving abroad.
The reasons why the financial balance so seldom agrees with the
combined balance on the current and capital accounts lie in the statistical
bases, mainly because of difficulties in measuring the financial flows cor-
rectly. The discrepancy is booked as a residual item for net errors and
omissions.
TABLE 1. THE BALANCE OF PAYMENTS, ACCUMULATED VALUES 1989–2005SEK billion
Balance on current account (a) 1 065
Balance on capital account (b) –70
Net financial saving (a + b) 995
Balance on financial account (c + d + e + f) –557
Direct investment (c) –214
Portfolio investment (d) –1 040
Other financial flows (e) 780
Foreign exchange reserve (f) –84
Net errors and omissions* –438
* The discrepancy between net financial saving and the balance on the financial account.
As shown in Table 1, the accumulated residual for the period 1989–2005
implies an unexplained outflow of around SEK 438 billion. This has a
bearing on the international investment position and is considered further
on.
E C O N O M I C R E V I E W 1 / 2 0 0 6 41
The disagreementbetween financial flowsand net saving is due tostatistical deficiencies.

Portfolio investment has resulted in large netoutflows
Portfolio investment has generated considerable capital outflows ever
since exchange controls were removed. In Figure 3, the gap between the
two curves indicates that the accumulated net outflow in the period
1989–2005 is SEK 1,040 billion.
In the early years after the deregulation, foreign investment in
Swedish securities predominated and portfolio investment resulted in a
net capital inflow. The inflow reflected portfolio rearrangements by for-
eign investors to include Swedish securities when exchange controls were
lifted in the summer of 1989. Meanwhile, Swedish investment abroad
was slack on account of the economic slowdown and low saving in those
years. This has changed since the mid 1990s, when Swedish portfolio
investment took off and foreign investment in Sweden remained at a
much lower level.
The largest item in the outflow is investment in foreign equity securi-
ties, which has risen very rapidly.
Small net outflows from direct investment
Direct investment differs from portfolio investment in that it concerns a
more lasting interest in and greater control of enterprises in other coun-
tries. A direct investment is defined as financial transactions with an
enterprise in which the investor holds at least 10 per cent of the voting
rights or equity; it includes, for example, contributions to the establish-
E C O N O M I C R E V I E W 1 / 2 0 0 642
Swedish portfolioinvestment took off in
the mid 1990s.
Swedish net acquisition of foreign securities
Foreign net acquisition of Swedish securities
0
200
400
600
800
1,000
1,200
1,400
1,600
1,800
20052004200320022001200019991998199719961995199419931992199119901989
Figure 3. Portfolio investment, accumulated net flow; 1989–2005SEK billion
Source: The Riksbank.
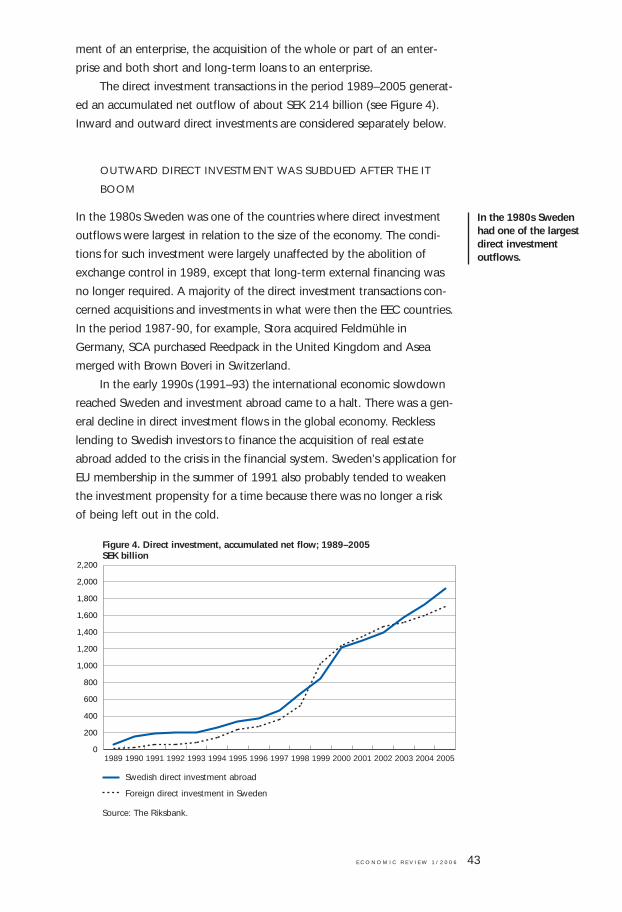
ment of an enterprise, the acquisition of the whole or part of an enter-
prise and both short and long-term loans to an enterprise.
The direct investment transactions in the period 1989–2005 generat-
ed an accumulated net outflow of about SEK 214 billion (see Figure 4).
Inward and outward direct investments are considered separately below.
OUTWARD DIRECT INVESTMENT WAS SUBDUED AFTER THE IT
BOOM
In the 1980s Sweden was one of the countries where direct investment
outflows were largest in relation to the size of the economy. The condi-
tions for such investment were largely unaffected by the abolition of
exchange control in 1989, except that long-term external financing was
no longer required. A majority of the direct investment transactions con-
cerned acquisitions and investments in what were then the EEC countries.
In the period 1987-90, for example, Stora acquired Feldmühle in
Germany, SCA purchased Reedpack in the United Kingdom and Asea
merged with Brown Boveri in Switzerland.
In the early 1990s (1991–93) the international economic slowdown
reached Sweden and investment abroad came to a halt. There was a gen-
eral decline in direct investment flows in the global economy. Reckless
lending to Swedish investors to finance the acquisition of real estate
abroad added to the crisis in the financial system. Sweden’s application for
EU membership in the summer of 1991 also probably tended to weaken
the investment propensity for a time because there was no longer a risk
of being left out in the cold.
E C O N O M I C R E V I E W 1 / 2 0 0 6 43
Swedish direct investment abroad
Foreign direct investment in Sweden
0
200
400
600
800
1,000
1,200
1,400
1,600
1,800
2,000
2,200
20052004200320022001200019991998199719961995199419931992199119901989
Figure 4. Direct investment, accumulated net flow; 1989–2005SEK billion
Source: The Riksbank.
In the 1980s Swedenhad one of the largestdirect investmentoutflows.

Swedish investment abroad picked up again during 1994. In the lat-
ter part of the 1990s, the economic recovery and high corporate liquidity
then contributed to a strong increase in outward direct investment.
Moreover, direct investment transactions were inflated by high equity
prices during the IT boom.
When the global slowdown early in 2001 led to lower profits, falling
equity prices, above all in IT companies, and rationalisation, outward
direct investment decreased in the following years. In the past two years
there has been an increase.
DEREGULATION AFFECTED INWARD DIRECT INVESTMENT
In the 1980s the inflow of direct investment to Sweden was modest com-
pared with the outflow. A number of rule changes then facilitated inward
investment. The abolition of exchange control in 1989 was followed by
amendments to the law on corporate acquisitions, making it more possi-
ble for nonresidents to make sizeable purchases of Swedish enterprises
without requiring government approval.
In the late 1980s and early 1990s inward direct investment picked up
and 1993 was the first year ever in which the level exceeded outward
direct investment. The statistics were greatly affected by a few major
transactions, such as Tetra Pak’s acquisition of Alfa-Laval, the Volvo-
Renault business, Akzo’s purchase of Nobel, and Al Amoudi’s of OK
Petroleum.
In the late 1990s inward direct investment rose strongly. Factors
behind the interest from abroad included a weak exchange rate, high eco-
nomic activity and the IT boom. In 1999, moreover, Zeneca purchased
Astra, the largest merger ever in Sweden; together with a number of oth-
er foreign acquisitions of large listed companies, this raised that year’s
inflow of direct investment capital to a record level.
HIGH LEVEL OF INWARD DIRECT INVESTMENT
Since 2001 the inflow of direct investment to Sweden has stabilised at a
lower level.
The decreased direct investment inflow is partly a structural phenom-
enon. The value of nonresidents’ assets in the form of direct investments
in Sweden is now high in both a Nordic and a European perspective.
Relative to GDP, the level of direct investment assets in Sweden is about
47 per cent, which is considerably higher than in other Nordic countries
(see Figure 5).
At the same time, a growing global share of direct investment is
E C O N O M I C R E V I E W 1 / 2 0 0 644
In the latter part of the1990s, the economic
recovery contributed toa strong increase in
outward directinvestment.
The late 1990s saw asharp increase in
inward directinvestment.

flowing to emerging market countries. The OECD area’s share of interna-
tional direct investment has been falling since 2000, with a particularly
marked decline to EU countries. Direct investment in global terms has
tended to flow instead to regions such as Southeast Asia.1
This suggests that the portfolio imbalances created by the earlier reg-
ulations and the need for adjustments in favour of increased foreign own-
ership in Sweden’s corporate sector should largely belong to the past.
Together with the growing tendency to channel direct investment to
emerging market countries, this points to the conclusion that inward
direct investment’s lower level in recent years is a trend that will continue.
Large inflows from other financial items
Other financial flows comprise loans, deposits, trade credits, derivatives,
etc. In the period 1989–2005 the total item generated an accumulated
net inflow of about SEK 780 billion, thereby partly offsetting the outflows
for direct and portfolio investment. The dominant component is borrow-
ing and lending abroad by MFIs (monetary financial institutions). One
explanation for the occasionally large inflows is that the MFI sector bor-
rows abroad to finance lending in Sweden. Swap agreements are used to
convert the foreign currency loans into SEK holdings that can then be
used to finance SEK loans to enterprises and households in Sweden.
E C O N O M I C R E V I E W 1 / 2 0 0 6 45
1 Source: Invest in Sweden Agency, ISA.
0
10
20
30
40
50
60
70
FinlandDenmarkNorwayEU 15Sweden
Figure 5. Direct investment; 2004 Stocks, per cent of GDP
Source: World Investment Report 2005 (WIR), Unctad
Inward direct investment Outward direct investment
A growing global shareof direct investment isflowing to emergingmarket countries.
The MFI sector’sborrowing abroad hasbeen used to financelending in Sweden.

Sweden’s external assets and liabilities
The next question is how Sweden’s assets and liabilities, which make up
the international investment position, have developed in the period from
1989 to 2005. We have chosen to describe this in terms of the interna-
tional investment position at market values (see the box “Two ways of
presenting the international investment positions”).
The market-values version of the international investment position fluctu-
ates markedly from year to year. In the period 1999–2001 the position
was actually positive but in recent years it has weakened appreciably
again. The position at the end of 2005 was negative, representing a net
liability with the rest of the world (see Figure 7).
E C O N O M I C R E V I E W 1 / 2 0 0 646
Other investment lending from Sweden
Other investment borrowing from abroad
0
200
400
600
800
1,000
1,200
1,400
1,600
1,800
20052004200320022001200019991998199719961995199419931992199119901989
Figure 6. Other investment, loans, etcetera, accumulated net flow; 1989–2005SEK billion
Source: The Riksbank.
TWO WAYS OF PRESENTING THE INTERNATIONAL INVESTMENT POSITION
The international investment position is a compilation of the value of a country’s totalexternal assets and liabilities. In accordance with international recommendations (theIMF’s Balance of Payments Manual, Fifth edition), the Riksbank presents two versionsof the international investment position: the traditional position and the position atmarket values.
In the traditional version, some items (e.g. direct investment, loans, deposits andmiscellaneous) are included at book or nominal values, while market values are usedfor other items (e.g. portfolio investment and derivatives). Valuations are invariablymade at current exchange rates and include accrued interest.
For the position at market values, the direct investment item is also valued by theRiksbank at market values (see the box on p.54) and the other items are valued as inthe traditional version.
The internationalinvestment position has
weakened.

An international investment position in which market values are also used
for direct investment gives a fairer picture of national wealth or net worth
and has therefore been chosen here.
How is the international investment positionconnected to saving abroad?
As mentioned initially, in the period since 1989 the combined balance on
the current and capital accounts has accumulated to a surplus of over SEK
995 billion, whereas the international investment position has not im-
proved nearly as much. In December 2005 Sweden’s net external liabilities
at market values totalled SEK 225 billion, a reduction of around SEK 50
billion since 1989, which is far less than one might expect from the sur-
plus on saving abroad.
Basically, the discordance between the combined current and capital
account balance and the change in the international investment position
stems from factors of two kinds:
• Valuation changes are the primary reason for the discrepancies (see
Figure 1). These changes now have such a marked impact on the
investment position because in this period the gross stocks have
become much larger.
• Measurement errors, e.g. in the international investment position,
due to a systematic underestimation of certain assets abroad. This
applies mainly to assets abroad that are owned by households and
other economic agents and are not covered by the statistics on the
E C O N O M I C R E V I E W 1 / 2 0 0 6 47
–800
–600
–400
–200
0
200
400
600
20052004200320022001200019991998199719961995199419931992199119901989
Figure 7. Sweden’s net international investment position at market values; 1989–2005SEK billion
Source: The Riksbank.

international investment position. Another factor is measurement
errors in the current account. The importance of measurement errors
is considered below.
Much larger stocks in the international investmentposition
The expansion of cross-border capital flows has led to much larger stocks
of assets and liabilities in the international investment position (see Figure
8).
In 2005 these stocks were six times larger than in 1989 and at the year-
end they totalled around SEK 13,400 billion, which is equivalent to
around five times Sweden’s GDP. For comparison it can be mentioned
that in this period GDP doubled and the value of foreign trade in goods
and services virtually trebled, all calculated in nominal figures.
The very marked increases in external assets and liabilities are the
main reason why fluctuations in market values now have a considerably
greater impact on the international investment position.
We shall now take a closer look at three kinds of change in value:
exchange rate movements (changes in the value of the Swedish krona),
equity price movements, and changes in the value of direct investment
enterprises.
E C O N O M I C R E V I E W 1 / 2 0 0 648
0
2,000
4,000
6,000
8,000
10,000
12,000
14,000
20052004200320022001200019991998199719961995199419931992199119901989
Figure 8. Sweden’s international investment position at market values, gross figures; 1989–2005SEK billion
Source: The Riksbank.
The marked expansionis the main reason why
fluctuations now have agreater impact on the
internationalinvestment position.

EXCHANGE RATE MOVEMENTS HAVE A LARGE IMPACT
Since the abolition of exchange control, the aggregated foreign currency
position of Swedish residents in the international investment position has
become very much larger (see Figure 9). This foreign currency position is
shown here as the net foreign currency assets of all Swedish residents.
Net foreign currency assets are defined as total foreign currency assets
minus total foreign currency liabilities.
An important cause of the growing foreign currency exposure is the
larger stocks in the international exchange position. Assets abroad are
denominated as a rule in a foreign currency, just as Swedish assets are
usually denominated in Swedish kronor. A growing foreign currency
exposure as a result of the larger stocks is then to be expected, in that
Swedish assets held by nonresidents are predominantly in Swedish kronor
and foreign assets held by residents are mainly in foreign currency.
In 1989, foreign currency liabilities outweighed assets, mainly
because exchange controls had previously permitted extensive private
borrowing in foreign currency. This borrowing exceeded the value of
Swedish foreign currency assets, which at that time mostly consisted of
direct investment abroad.
The Swedish krona’s marked depreciation at the end of 1992 and
during 1993 no doubt had a limited net effect on the overall wealth of
Swedish residents because foreign currency assets were more or less bal-
anced by liabilities.2
E C O N O M I C R E V I E W 1 / 2 0 0 6 49
2 The Riksbank’s extensive interventions in the forward market meant that debt exposure in foreign currencywas transferred to the Riksbank but the interventions did not alter the total exposure of Swedish partici-pants.
Exposure in foreign currency of Swedish entities (left scale)
TCW index (right scale)
–500
0
500
1,000
1,500
2,000
2,500
3,000
200520042003200220012000199919981997199619951994199319921991199019890
20
40
60
80
100
120
140
160
Figure 9. Exposure in foreign currency of Swedish entities; 1989–2005SEK billion and TCW index
Source: The Riksbank.

Since then, the foreign currency position has become much larger; at
the end of 2005 the net value of Swedish residents’ foreign currency
assets and liabilities was over SEK 2,600 billion. Exchange rate fluctuations
accordingly have a considerable effect on wealth and hence on the inter-
national investment position. A 5 per cent weakening of the krona’s
exchange rate means that the value of the foreign currency assets of
Swedish investors rises by about SEK 130 billion.
At the same time, nonresidents invest in SEK assets, which represent
SEK liabilities for residents. In this respect, SEK exchange rate fluctuations
have no direct effect on the international investment position. So the loss
that foreign investors incur on these SEK assets in the example above
does not affect Sweden’s international investment position.
From Figure 9 it will be seen that in the period 2001–04 the Swedish
krona’s TCW index fell (the krona’s average annual TCW value declined).
This represented an appreciation of the krona by almost 12 per cent and a
corresponding loss for Swedish investors in the region of roughly SEK 200
billion (12 per cent of the average foreign currency exposure in these
years). During 2005 the exchange rate swung and weakened 6 per cent,
which in turn should have had a positive effect on the international
investment position.
It must be underscored that this estimate is very approximate. The
balance of payments statistics do not provide information about the for-
eign currency composition of external assets. The extent to which
Swedish assets and liabilities abroad are affected by exchange rate fluctu-
ations in a particular year depends on the mutual relationships between
foreign currencies together with the currency composition of net foreign
currency assets. The calculated impact of exchange rate fluctuations on
foreign currency assets and liabilities is therefore bound to be approxi-
mate.
It will also be seen from Figure 9 that there were lengthy periods
before 2001 when the krona weakened. This wholly or partly offsets the
wealth effects of the krona’s appreciation 2001–04, which probably limits
the total wealth effects that fluctuations in the krona’s exchange rate
have had since 1992.
EXCHANGE COVER AFFECTS RESIDENTS’ FOREIGN CURRENCY
POSITIONS
The distribution of foreign currency exposures between residents and
nonresidents is affected by forward cover in Swedish kronor. At present
the Riksbank does not have comprehensive information about Swedish
entities’ forward cover in kronor with the rest of the world. Foreign cur-
E C O N O M I C R E V I E W 1 / 2 0 0 650
At the end of 2005 thenet value of Swedish
residents’ foreigncurrency assets and
liabilities was over SEK2,600 billion.
A depreciation in thekrona usually has an
effect on theinternational
investment position.

rency positions are affected by straight forward transactions in the foreign
exchange market as well as by swaps involving the krona and foreign cur-
rencies. Forward cover for foreign currency assets such as export claims,
holdings in subsidiaries abroad and portfolio investment abroad reduced
the foreign currency asset position of Swedish residents. On the other
hand, banks and mortgage institutions are known to obtain extensive for-
eign currency loans that they swap into krona liabilities. Such swaps add
to residents’ net foreign currency positions because a proportion of the
foreign currency liabilities is converted into a krona liability and thereby
increases net foreign currency assets.
Swaps and forward exchange cover can thus involve foreign currency
assets as well as liabilities, so that they partly cancel out. In the absence of
comprehensive information, however, such cover cannot be allowed for in
an account of residents’ foreign currency position.
EQUITY PRICES ARE ONE EXPLANATION FOR THE WEAK
INTERNATIONAL INVESTMENT POSITION
Another factor with a marked effect on the value of Sweden’s internation-
al investment position is changes in equity prices in Sweden and abroad.
Such price movements affect the item Portfolio equity.
The magnitude of the equity price gains/losses incurred by Swedish
and foreign investors is partly dependent on the distribution of cross-bor-
der equity investments over the period since 1989.
After the krona’s depreciation in 1992, when Swedish equity was
cheap and profit expectations were high, foreign investors were active net
purchasers. In 1993 and 1994 foreign investors purchased Swedish equity
for a net total of around SEK 90 billion, which was more than the accu-
mulated net figure in the following five years, 1995–99 (see Figure 10).
The pattern of Swedish investment in foreign equity was different.
The level rose in the mid 1990s and then took off around the turn of the
millennium, when equity prices reached a high. In these years, Swedish
investment abroad was appreciably higher than the equivalent foreign
investment in Sweden.
So how have equity prices developed in Sweden and abroad?
Developments in the 1990s favoured foreign investors who purchased
Swedish equity. In every year except 1997 in the period 1992–99, the
Swedish stock market, represented by the general index, was stronger
than a weighted index for global stock markets (MSCI).
The differences in equity price developments between Sweden and
abroad have affected price gains/losses on cross-border portfolio holdings
of equity. A calculation of how the stock market fluctuations affected the
E C O N O M I C R E V I E W 1 / 2 0 0 6 51
Such exchange covercannot be allowed forin an account ofresidents’ foreigncurrency position.

value of such portfolio equity holdings is presented in Figure 11. This
shows the accumulated calculated annual effects of equity prices and thus
provides a picture of the total price gains that foreign and Swedish
investors made in this period.
Throughout the period, the price gains made by foreign investors on
Swedish equity have been appreciably larger than the gains made by
Swedish investors on foreign equity. One explanation is that foreign hold-
ers of Swedish equity benefited from the Swedish stock market’s very
E C O N O M I C R E V I E W 1 / 2 0 0 652
Swedish net acquisition of foreign portfolio equity
Foreign net acquisition of Swedish portfolio equity
–100
0
100
200
300
400
500
600
700
800
900
20052004200320022001200019991998199719961995199419931992199119901989
Figure 10. Portfolio equity, accumulated net flow; 1989–2005SEK billion
Source: The Riksbank.
Foreign investors’ holdings of Swedish equity, accumulated price gains
Swedish investors’ holdings of foreign equity, accumulated price gains
–200
0
200
400
600
800
1,000
2005200420032002200120001999199819971996199519941993199219911990
Figure 11. Portfolio equity, accumulated price gains/losses in the international investment position; 1990–2005SEK billion
Source: The Riksbank.

favourable development compared with stock markets elsewhere.
Another explanation is that Swedish investors did not increase their for-
eign equity holdings markedly until the mid 1990s, when equity prices
were at a high. According to this estimate, total price gains to foreign
investors have been about SEK 500 billion larger than Swedish price gains
on foreign equity.
It must be underscored that this calculation is very approximate. The
extent to which annual equity price fluctuations affect the international
investment position cannot be computed exactly because information is
lacking about the size of holdings in particular equities. All calculations are
based on a global price index and the Swedish general index. The actual
compositions of foreign and Swedish holdings do not necessarily agree
with these indices.
As a result of all this, equity price changes are an important factor
behind the weak development of Sweden’ international investment posi-
tion in the past fifteen years.
It should be noted that the increase in net liabilities that is due to the
different development of equity prices in Sweden compared with abroad
does not say anything about how successful Swedish equity investors
have been. The more positive equity price trend in Sweden leads in itself
to a negative effect on Sweden’s international investment position. At the
same time, Swedish residents have made large equity investments in their
domestic market and benefited from the favourable equity price trend
there.
In addition to the profits on portfolio equity, foreign investors pre-
sumably made price gains on Swedish fixed-income securities in the
1990s. The sharp drop in the long-term interest rate from 1992 onwards
generated considerable price increases on long-term fixed-income SEK
securities. As the interest rate fell more in Sweden than elsewhere, it is
reasonable to suppose that foreign investors gained more in Sweden than
Swedish investors did abroad. However, no attempt has been made to
estimate these effects.
Large fluctuations in the market value of directinvestments
In the case of direct investment, the market value of the stocks of assets
and liabilities is calculated by the Riksbank. For portfolio equity, for exam-
ple, market values can be derived from stock-market prices but for direct
investment this is usually not possible. Most of the enterprises that are
owned or acquired by nonresidents are not listed on the stock exchange.
E C O N O M I C R E V I E W 1 / 2 0 0 6 53
Foreign investors’ pricegains on Swedishequity have exceededthose made by Swedishinvestors on foreignequity.
Foreign investorspresumably also madeprice gains on Swedishfixed-income securitiesin the 1990s.

Neither can information about the market value of subsidiaries be
obtained from the enterprise.
The market value of direct investments is therefore calculated with a
model. In the absence of international recommendations on the methods
for such calculations, the Riksbank has developed a method internally.
Direct investment stocks are also calculated at the book value of the equi-
ty in the subsidiary and included in this form in the traditional account of
the international investment position.
The method developed by the Riksbank for calculating direct invest-
ment at market values uses stock-market data on P/E ratios, that is, the
market values of listed companies divided by their trend-adjusted earn-
ings (see the box “P/E method for market valuation of direct invest-
ments”). A capital valuation based on P/E ratios cannot measure market
value exactly but compared with book values it does give a sounder pic-
ture of direct investment and thereby of the “proper economic value” of
Sweden’s international investment position.
The effect on the international investment position of a market valuation
of direct investment is shown in Figure 12. The gap between the two
curves represents the effect of the Riksbank’s calculation of direct invest-
ments at market values.
In the late 1990s the market value became notably higher than the
book value on account of a global increase in equity prices and the high
P/E ratios associated with peak expectations of future earnings. The sub-
sequent fall in equity prices then led to a decline in the market value. This
decline has been most marked for Swedish direct investment abroad.
Between 2000 and 2002 the market value of outward direct investment
dropped SEK 1,000 billion compared with a fall of SEK 650 billion for
direct investment in Sweden.
So in recent years the market valuation of direct investment has giv-
en a loss of value for direct investment abroad that is greater than for for-
eign direct investment in Sweden. This is another reason why, despite
E C O N O M I C R E V I E W 1 / 2 0 0 654
The Riksbank calculatesthe market value of
direct investments withits own model.
P/E METHOD FOR MARKET VALUATION OF DIRECT INVESTMENTS
The calculation of market value starts from the assumption that the relationship be-tween historical price and historical profits in direct investment enterprises is the sameas the price/earnings ratio in listed companies. For the valuation of Swedish directinvestment assets abroad, P/E ratios for a number of countries are weighted togetherin proportion to the book value of the direct investment assets. Market value is thencalculated as the product of the weighted P/E ratio and the direct investment enter-prises’ combined earnings abroad, subject to the assumption that the market valuecannot be less than the book value of the capital in the enterprises (the break-upvalue). As the long-term profit trend is, on average, a better approximation of themarket’s profit expectations than the most recent result, the P/E ratios used in thesecalculations are partly based on trend-adjusted earnings.
The increase in marketvalue in the late 1990shad to do with a globalincrease in equity pries
and high P/E ratios.
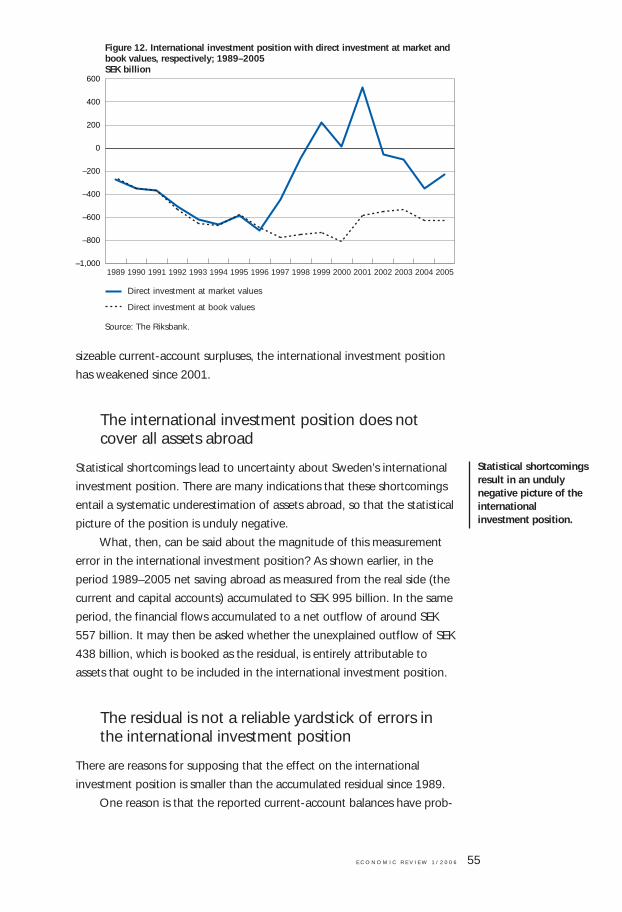
sizeable current-account surpluses, the international investment position
has weakened since 2001.
The international investment position does notcover all assets abroad
Statistical shortcomings lead to uncertainty about Sweden’s international
investment position. There are many indications that these shortcomings
entail a systematic underestimation of assets abroad, so that the statistical
picture of the position is unduly negative.
What, then, can be said about the magnitude of this measurement
error in the international investment position? As shown earlier, in the
period 1989–2005 net saving abroad as measured from the real side (the
current and capital accounts) accumulated to SEK 995 billion. In the same
period, the financial flows accumulated to a net outflow of around SEK
557 billion. It may then be asked whether the unexplained outflow of SEK
438 billion, which is booked as the residual, is entirely attributable to
assets that ought to be included in the international investment position.
The residual is not a reliable yardstick of errors inthe international investment position
There are reasons for supposing that the effect on the international
investment position is smaller than the accumulated residual since 1989.
One reason is that the reported current-account balances have prob-
E C O N O M I C R E V I E W 1 / 2 0 0 6 55
Direct investment at market values
Direct investment at book values
–1,000
–800
–600
–400
–200
0
200
400
600
20052004200320022001200019991998199719961995199419931992199119901989
Figure 12. International investment position with direct investment at market and book values, respectively; 1989–2005SEK billion
Source: The Riksbank.
Statistical shortcomingsresult in an undulynegative picture of theinternationalinvestment position.

ably been on the high side. Bilateral statistical comparisons of trade in
goods show unduly low values for imports and hence a systematic over-
estimation of net exports. These comparisons indicate that the overesti-
mations could add up to about SEK 50 billion, in which case the accumu-
lated current-account surplus for the period 1989–2005 may have been
overestimated by the same amount. This overestimation of the current-
account balance would help to explain the period’s negative accumulated
residual.
When this effect from the balance of trade has been subtracted from
the residual, we are left with an unexplained outflow of around SEK 390
billion. This represents an underestimation of financial outflows (invest-
ment abroad) in this period.
The next question is whether this underestimation of financial out-
flows is a good measure of the asset stocks that do not show up in the
international investment position.
The data for the international investment position are based to a
large extent on bank and other corporate balance sheets. This makes it
possible to compare the statistical foundation for external positions with
the balance sheet data in corporate annual accounts. Checking and con-
firming statistics on transactions is considerably more difficult. Assuring
their quality is complicated by the large volume of the transactions and
the influence from fluctuating market prices and exchange rates. In the
case of certain items such as equity and direct investment, it is also diffi-
cult to confirm transactions through comparisons with stocks and changes
in value.
This leads to the conclusion that the data on the international invest-
ment position are more reliable than those on the financial transactions.
The size of the accumulated residual for the period 1989–2005 is a very
uncertain yardstick of the assets that are not covered by the international
investment position.
In some respects it is difficult or even impossible to measure assets
abroad correctly. A case in point is direct personal investment abroad in
shares, mutual funds, bank accounts, etc., where the holdings are
deposited abroad. It is difficult to identify these assets in statistical studies.
To sum up, there are measurement errors in the international invest-
ment position and the balance on current account that work in the same
direction. The overestimation of the current-account balance and the
underestimation of Swedish assets abroad both contribute to the discrep-
ancy shown in Figure 1 between the changes in the international invest-
ment position and the accumulated current-account balance.
E C O N O M I C R E V I E W 1 / 2 0 0 656
Comparisons of EUstatistics show that net
exports aresystematically
overestimated.
Direct personal savingabroad is difficult to
catch.

Value changes are the chief cause of thefluctuations in the international investment position
Prior to the early 1990s the balance on Sweden’s current account
matched the change in the international investment position relatively
closely. The current-account balance used to be the main determinant of
the investment position but this is no longer the case. The growth of
cross-border financial flows has greatly increased the gross stocks that
make up Sweden’s international investment position. These stocks cur-
rently total SEK 13,400 billion, which is more than five times the size of
Sweden’s GDP.
As a result, since the mid 1990s fluctuations in market values have
been increasingly important for changes in the international investment
position. Today, changes in value arising from the fluctuations in market
values have become the chief determinant of how the international
investment position develops. The position is still affected by the current-
account balance, which together with the capital account reflects financial
saving abroad, but its relative importance has declined appreciably since
the early 1990s.
The market values with the largest consequences for the international
investment position are the Swedish krona’s exchange rate, equity prices
in Sweden and abroad and the market value of direct investment enter-
prises.
E C O N O M I C R E V I E W 1 / 2 0 0 6 57
The krona exchangerate, equity prices andthe value of directinvestment companieshave the mostsignificance.
■ Effective exchange rates –theory and practice
BY JAN ALSTERLINDJan Alsterlind works at the Monetary Policy Department.
The Swedish economy is affected by movements in the krona’s exchange
rates with a large assortment of currencies. The value of the krona in
terms of another currency is known as a bilateral exchange rate. A com-
mon way of measuring the krona’s value is to use an index that includes
a number of currencies. Information from bilateral exchange rates is
extracted to construct an index of the effective exchange rate. This re-
quires decisions about the bilateral exchange rates that are to be includ-
ed, the weight each currency is to have and how the bilateral exchange
rates are to be weighted together. These decisions naturally depend on
what the exchange rate index is to be used for and what it is intended to
measure. Such an index is usually constructed to measure the impact of
exchange rate movements on trade in goods and services – an index of
competitiveness. This article describes what an effective exchange rate
index is and alternative ways of calculating it. I conclude that at present
there are no sizeable differences between a conventional TCW index, a
TCW index with updated weights and an index with weights derived by
the Swedish National Institute of Economic Research (NIER).
What is an effective exchange rate index?
Economic development in Sweden is heavily dependent on global eco-
nomic activity. Sweden is an open economy in which foreign trade
(exports plus imports) is equivalent to almost 85 per cent of GDP. It fol-
lows that the economy is affected by changes in the krona’s value in
terms of other currencies. The value of the krona in relation to another
currency is defined as the bilateral exchange rate. The information in a
number of bilateral exchange rates can be combined into a single indica-
tor by calculating a weighted average. Such a weighted average is usually
called an effective exchange rate index. The construction of such an index
varies with what it is intended to analyse. In most cases, the purpose is to
measure the exchange rate’s impact on total trade in goods and services.
The weights are then set to mirror the relative importance of other coun-
E C O N O M I C R E V I E W 1 / 2 0 0 658
An effective exchangerate index is a weighted
average of bilateralexchange rates, that is,of the krona’s value in
terms of othercurrencies.
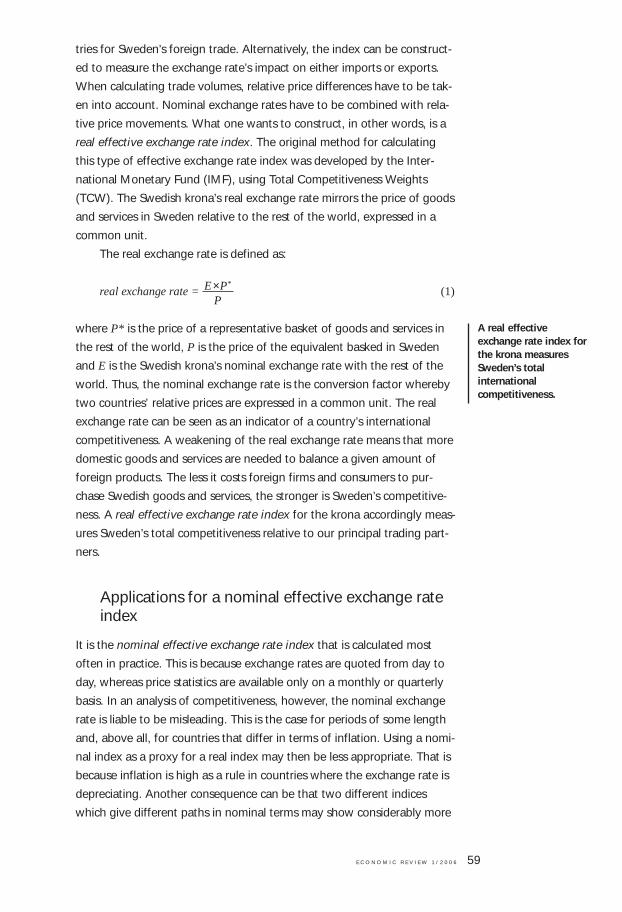
tries for Sweden’s foreign trade. Alternatively, the index can be construct-
ed to measure the exchange rate’s impact on either imports or exports.
When calculating trade volumes, relative price differences have to be tak-
en into account. Nominal exchange rates have to be combined with rela-
tive price movements. What one wants to construct, in other words, is a
real effective exchange rate index. The original method for calculating
this type of effective exchange rate index was developed by the Inter-
national Monetary Fund (IMF), using Total Competitiveness Weights
(TCW). The Swedish krona’s real exchange rate mirrors the price of goods
and services in Sweden relative to the rest of the world, expressed in a
common unit.
The real exchange rate is defined as:
real exchange rate = (1)
where P* is the price of a representative basket of goods and services in
the rest of the world, P is the price of the equivalent basked in Sweden
and E is the Swedish krona’s nominal exchange rate with the rest of the
world. Thus, the nominal exchange rate is the conversion factor whereby
two countries’ relative prices are expressed in a common unit. The real
exchange rate can be seen as an indicator of a country’s international
competitiveness. A weakening of the real exchange rate means that more
domestic goods and services are needed to balance a given amount of
foreign products. The less it costs foreign firms and consumers to pur-
chase Swedish goods and services, the stronger is Sweden’s competitive-
ness. A real effective exchange rate index for the krona accordingly meas-
ures Sweden’s total competitiveness relative to our principal trading part-
ners.
Applications for a nominal effective exchange rateindex
It is the nominal effective exchange rate index that is calculated most
often in practice. This is because exchange rates are quoted from day to
day, whereas price statistics are available only on a monthly or quarterly
basis. In an analysis of competitiveness, however, the nominal exchange
rate is liable to be misleading. This is the case for periods of some length
and, above all, for countries that differ in terms of inflation. Using a nomi-
nal index as a proxy for a real index may then be less appropriate. That is
because inflation is high as a rule in countries where the exchange rate is
depreciating. Another consequence can be that two different indices
which give different paths in nominal terms may show considerably more
E C O N O M I C R E V I E W 1 / 2 0 0 6 59
E×P*
P
A real effectiveexchange rate index forthe krona measuresSweden’s totalinternationalcompetitiveness.

similar developments in real terms. Countries with a currency that is
depreciating/appreciating markedly and where inflation is high/low are
sometimes excluded from an effective exchange rate index because they
may dominate the outcome of the nominal index. A “narrower” index of
this kind can be derived from a “broader” index in order to confine the
calculation to countries with a similar development of inflation. That facili-
tates the analysis of a nominal exchange rate index.
How many and which currencies?
The number of countries to include in an effective exchange rate index is
an open question. Every currency that in some sense is “relevant” should
be included. This applies, of course, to an index for measuring competi-
tiveness with the rest of the world. An extreme case would be to include
as many currencies as possible but such an approach is not self-evidently
optimal. As exchange rate movements are often correlated, including
additional currencies will not necessarily improve the analysis at all sub-
stantially. Sometimes, in fact, a large number of currencies may compli-
cate the analysis. So in practice, there are no clear criteria for the number
of currencies to include in an exchange rate index; this is rather a matter
of “enough” but not “too many”. The choice is also limited by the avail-
ability of data. For some countries it may be difficult to find the statistics
that are needed to calculate the currency’s weight in the index.
The choice of currencies for an effective exchange rate index is
sometimes based on arbitrary rules. An example is the criterion that a
country’s share of exports or imports must be more than, say, 0.5 per
cent. One problem with this approach, which is used by the US Federal
Reserve, the ECB and others, is that the shares may change over time, so
that a country which was an important trading partner some years ago
may be of no consequence today. Another complication is that a country
with a small share of the bilateral trade may be a major competitor in the
world market. An alternative used by the Bank of England is to assess the
situation annually and include or exclude countries in accordance with the
rule. The set of countries will then vary over time. Another approach is to
start from geographical areas or economic groupings. The OECD calcu-
lates an exchange rate index that is limited to its member countries and
the Federal Reserve prefers one of the narrower indices, limited to curren-
cies that are considered to be important. The (TCW) exchange rate index
calculated by the IMF simply includes those currencies for which statistics
are available for the computation of weights. Still, there is clearly no
entirely acceptable way of selecting the currencies for inclusion in an
index.
E C O N O M I C R E V I E W 1 / 2 0 0 660
The number ofcurrencies in an
exchange rate index isa matter of “enough”but not “too many”.

Which types of goods and services?
An effective exchange rate index is used almost exclusively to measure
the exchange rate’s impact on trade in goods and services. The weights
with which bilateral exchange rates are combined into an effective index
are therefore based as a rule on trade statistics. The need for (real) effec-
tive exchange rate indices arose in the aftermath of the Bretton Woods
system. These indices were designed for the simultaneous analysis of the
impacts of a number of bilateral exchange rates (and relative prices) that
were now free to fluctuate against each other. One of the earliest indices,
the multilateral exchange rate model (MERM), was developed by the IMF
and was subsequently replaced by the TCW system. The method was first
described and presented in McGuirk (1987); updated versions have
appeared in Zanello & Desruelle (1997) and, recently, in Bayoumi, Lee &
Jayanthi (2005). In practice, the IMF’s method is about constructing the
weights that are used to calculate a weighted average of bilateral
exchange rates.1 Real effective exchange rate indices for many countries
are calculated simultaneously in this system. Originally, a more disaggre-
gated calculation was also made for some 20 countries, broken down into
real exchange rates between different sectors of manufacturing. A majori-
ty of the exchange rate indices that exist today stem directly from this tra-
dition. The method is reported in, for example, Zanello & Desruelle
(1997) and in Bayoumi, Lee & Jayanthi (2005). As the latter authors, for
instance, show, the method for calculating weights varies with the type of
goods or services for which competitiveness is to be measured.
Simplifying somewhat, foreign trade can be decomposed into three
main categories: commodities, manufactured goods and services. A com-
mon assumption is that commodities are homogeneous and are traded in
a global market. Commodity competition between countries then occurs
in a single market and a country’s importance as a trading partner is
determined by its share of the total market for that product. This makes
the calculation of weights for homogeneous commodity groups relatively
simple, as described, for example, in Zanello & Desruelle (1997).
Unlike primary products, manufactured goods and services are het-
erogeneous. Different makes of car from different countries, for example,
are seldom perfect substitutes. Manufactured goods and services pro-
duced in Sweden for sale abroad compete in different, segmented, mar-
kets, not in a single global market. Seen from this angle, the German and
the American markets are two separate markets. So in contrast to com-
modities, a number of markets have to be considered in the case of het-
E C O N O M I C R E V I E W 1 / 2 0 0 6 61
1 In an analysis in real terms, the same weights are used for prices as well.
The method forcalculating weightsvaries with the type ofgoods or services forwhich competitivenessis to be measured.
In the case ofcommodities, countriesoften compete in asingle global market.
Manufactured goodsand services that aresold abroad compete indifferent, segmented,markets, not in a singleglobal market.

erogeneous goods and services. Countries accordingly compete in many
different markets and a country’s importance as Sweden’s trading partner
therefore depends on its relative shares of these markets.
As countries compete in many different markets, it follows that the
calculation of weights for an effective exchange rate index requires a
large amount of data. Besides figures for each country’s exports (or
imports), data are needed that indicate a country’s degree of openness.2
Due to deficiencies in the availability and quality of statistics on services,
weights for effective exchange rate indices are usually calculated exclud-
ing services. An exception, however, is the Bank of England’s new
exchange rate index, which does include trade in services.3 While statistics
on trade in services have had numerous deficiencies in the past, improve-
ments are being made continuously, for example in far-reaching work by
the OECD. As trade in services grows, so will the importance of taking
this component into account.
Calculating weights
The calculation of weights for manufactured goods and services is
described below because these are the major items in Sweden’s foreign
trade. The starting point is that heterogeneous products compete in a
number of different markets. A reasonably acceptable indicator of com-
petitiveness therefore needs to cover all the geographical areas in which
the products compete. Take, for example, the competition between
Sweden and Japan. For one thing, Swedish products compete with
Japanese direct imports to Sweden – import competition. Similarly,
Swedish products compete with Japanese in the latter’s domestic market –
direct export competition in Japan. Lastly, Swedish and Japanese products
compete in other markets – third-market competition. The weights need
to reflect both the bilateral trade and the competition in other markets.
The weight for country j as regards a heterogeneous product group, for
example manufactured goods, can then be written:
Wj = λM MWj + λBX BXWj + λTX TXWj . (2)
E C O N O M I C R E V I E W 1 / 2 0 0 662
2 Given an accurate valuation of all flows, imports to a country are the sum of all other countries’ exports tothat country. So in theory it makes no difference which flow is measured. In practice, however, measure-ment errors from a variety of sources lead to a discrepancy between total exports and total imports. Inorder to obtain consistent results, the calculation of weights is usually based on only one of the flows; theusual choice is exports, on the common assumption that export flows are easiest to measure and value cor-rectly.
3 See Lynch & Whitaker (2004).

In this version, a country’s total weight is made up of three components.
The calculation of these component weights and the way in which they
are weighted together are relatively complex, so further details are pro-
vided in an appendix. But an outline of the intuitive reasoning behind the
formula may be of interest.
Swedish producers of manufactured goods compete in their domestic
market with imports from other countries. The first weight, MWj, meas-
ures the share for a country’s producers of total sales in the Swedish mar-
ket. This weight then represents a country’s share of Sweden’s total
imports of manufactured goods.
The weight BXWj is intended to measure a country’s importance in
terms of the competition Swedish producers encounter in that country’s
domestic market. Besides the share of Swedish exports that goes to that
country, this importance has to do with the country’s own producers’
share of their domestic market. The importance for competitiveness of
countries whose producers have a large domestic market share is greater
than a weight based solely on export shares would indicate.
The last weight, TXWj, is intended to measure a country’s importance
in terms of the competition Swedish producers encounter in markets
abroad. This component is measured as the sum of a country’s shares of
total sales in these third-country markets. The weight aims to represent
the importance of, for example, a country that takes a small share of
direct exports from Sweden but has large exports to countries where
exports from Sweden are substantial. A case in point is Japan: direct com-
petition between Swedish exporters and Japanese producers is small in
Japan’s domestic market compared with the competition between
Swedish and Japanese producers in third-country markets.
A country’s relative importance as a competitor in Sweden’s domestic
market, the importance of the competition Swedish exporters encounter
in that country’s domestic market, and the importance of the country as a
competitor in all other markets are determined by the weights λM, λBX and
λTX. The competition Swedish producers encounter in their domestic mar-
ket from foreign producers, MWj, is weighted with λM, which represents
the domestic market’s share of Swedish output. The two different types of
export competition, BXWj and TXWj, are weighted with λBX and λTX, which
represent the shares of Swedish out put that go to markets abroad. Thus,
as mentioned above, the calculation of weights is relatively complicated.
E C O N O M I C R E V I E W 1 / 2 0 0 6 63
A country’s total weightis made up of threecomponents.
The first weightmeasures a country’srelative share ofSweden’s total importsof manufactured goods.
The second weightmeasures a country’simportance in terms ofthe competitionSwedish producersencounter in thatcountry’s domesticmarket.
The third weightmeasures a country’simportance in terms ofthe competitionSwedish producersencounter in third-country markets.

An analysis ofcompetitiveness can
use relative exportprices as well as
relative costs in termsof unit labour costs.
Choosing relative prices
A real effective exchange rate index commonly serves, as noted earlier, as
a summary indicator of a country’s international competitiveness. How-
ever, real is a somewhat ambiguous term and there are different relative
prices that may be relevant in different contexts. One form of relative
prices that can be used to analyse competitiveness is relative export
prices. They provide information about how Swedish exporters price their
products relative to exporters in other countries. There is, however, a risk
of obtaining too limited a picture of a country’s relative price level. The
measurements concern prices of products that are actually exported,
while products that, for example, are potentially tradable but not compet-
itive are ignored. This measure of competitiveness is also affected by pric-
ing behaviour, such as pricing to market.4 An alternative way of measur-
ing competitiveness is to compare costs. This is commonly done by meas-
uring relative costs in terms of unit labour costs. It may be worth men-
tioning that the IMF’s original method for calculating real effective
exchange rate indices was designed to measure the relative level of costs
in terms of unit labour costs for different sectors on manufacturing.5
A comparatively common approach to constructing a real exchange
rate index is, however, to use relative consumer prices expressed in a
common currency. The reason is that consumer prices are based on a bas-
ket that is representative of the country’s pattern of consumption. The
real exchange rate deflated with consumer prices therefore gives a broad
measure of the relative level of prices for a representative basket of con-
sumption. However, consumer prices include a large element of items that
are not exposed to competition. Weights calculated for competitiveness
are therefore usually constructed from statistics that cover as broad an
aggregate of goods and services as possible.6
E C O N O M I C R E V I E W 1 / 2 0 0 664
4 Briefly, this theory implies that exporters actively restrain profit margins in order to gain market share.5 See McGuirk (1987).6 See Zanello & Desruelle (1997).
A comparativelycommon approach is to
use relative consumerprices expressed in a
common currency.

E C O N O M I C R E V I E W 1 / 2 0 0 6 65
7 An arithmetic index poses the problem that the size of a percentage change varies with the base. Take, forexample, an index for two currencies that each have a weight of 50 per cent; an increase of one unit inboth these currencies, from 5 to 6, raises the index 20 per cent, while a one-unit increase from 6 to 7 raisesthe index just over 18 per cent.
8 Buldorini, Makrydakis & Thiman (2002).
Choosing the index’s form
One of the more fundamental issues when constructing an effec-
tive exchange rate index is what type of index to use. One of the
most usual ways of constructing an index is to calculate a geomet-
rically weighted average:7
IGt = Π
N
n=1
Wn(3)
ΣN
n=1Wn = 1, ∀ Wn ≥ 0
The geometric form has a number of advantages, for instance that
the percentage change in this form of index is independent of the
particular base. The geometric form is also attractive for theory
because the weights can be treated as elasticities; for a discussion,
see e.g. McGuirk (1987). This is by far the most common form and
is used by most central banks as well as other participants. The
ECB, for instance, uses the geometric form but adjusts the weights
at five-year intervals to catch any changes in competitiveness.8
Time-varying weights can therefore be used to prevent the index
from becoming increasingly out-dated. The index can then be writ-
ten:
IGt = Π
N
n=1
Wnt(4)
ΣN
n=1Wnt = 1, ∀ Wnt ≥ 0
where the weights (Wtn) are now allowed to vary over time.
However, this method introduces some complications. One compli-
cation with geometric weighting with variable weights concerns
aggregation from daily quotations to, for example, monthly or
quarterly data. Weighting the index geometrically on daily quota-
tions and then aggregating to monthly data gives a result that dif-
fers from an index that is constructed directly on monthly averages
for the bilateral exchange rates. The discrepancy, however, is usual-
ly very small. Another complication is that the value of the index
may change even in the absence of a change in the ingoing
Ent
En 0( (
Ent
En0( (
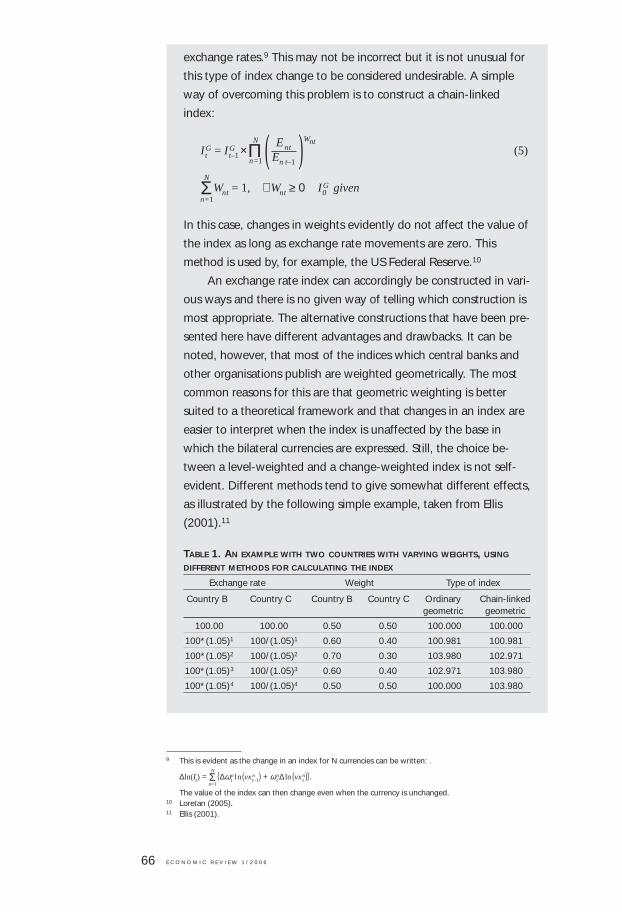
E C O N O M I C R E V I E W 1 / 2 0 0 666
9 This is evident as the change in an index for N currencies can be written: .
∆ln(It) = ΣN
n=1{∆ωn
t ln (vxnt–1) + ωn
t ∆ ln (vxnt )}.
The value of the index can then change even when the currency is unchanged.10 Loretan (2005).11 Ellis (2001).
exchange rates.9 This may not be incorrect but it is not unusual for
this type of index change to be considered undesirable. A simple
way of overcoming this problem is to construct a chain-linked
index:
IGt = IG
t–1 ×ΠN
n=1
Wnt(5)
ΣN
n=1Wnt = 1, ∀ Wnt ≥ 0 IG
0 given
In this case, changes in weights evidently do not affect the value of
the index as long as exchange rate movements are zero. This
method is used by, for example, the US Federal Reserve.10
An exchange rate index can accordingly be constructed in vari-
ous ways and there is no given way of telling which construction is
most appropriate. The alternative constructions that have been pre-
sented here have different advantages and drawbacks. It can be
noted, however, that most of the indices which central banks and
other organisations publish are weighted geometrically. The most
common reasons for this are that geometric weighting is better
suited to a theoretical framework and that changes in an index are
easier to interpret when the index is unaffected by the base in
which the bilateral currencies are expressed. Still, the choice be-
tween a level-weighted and a change-weighted index is not self-
evident. Different methods tend to give somewhat different effects,
as illustrated by the following simple example, taken from Ellis
(2001).11
TABLE 1. AN EXAMPLE WITH TWO COUNTRIES WITH VARYING WEIGHTS, USING
DIFFERENT METHODS FOR CALCULATING THE INDEX
Exchange rate Weight Type of index
Country B Country C Country B Country C Ordinary Chain-linkedgeometric geometric
100.00 100.00 0.50 0.50 100.000 100.000
100*(1.05)1 100/(1.05)1 0.60 0.40 100.981 100.981
100*(1.05)2 100/(1.05)2 0.70 0.30 103.980 102.971
100*(1.05)3 100/(1.05)3 0.60 0.40 102.971 103.980
100*(1.05)4 100/(1.05)4 0.50 0.50 100.000 103.980
Ent
En t–1( (

Current indices and their purposes
As shown in Table 2, most central banks have an index that is based in
some way on weights calculated internally. Moreover, time-varying
weights are becoming increasingly common. The weights that most cen-
tral banks calculate are akin to the IMF’s principle of weighting for com-
petitiveness but the calculations are usually simplified in certain respects.
Effective exchange rate indices for the Swedish krona are available in
a number of forms and are provided by many participants, including the
Riksbank. The earlier monetary policy regime with a fixed exchange rate
required an official benchmark for the krona’s external value. With a vari-
able exchange rate, no such official index is needed. Under this regime,
an effective exchange rate index for the krona simply serves as an instru-
ment for economic analysis. A look at different types of index may be of
interest in this context (see Table 3).
Krona indices tend to be competitiveness weighted. Weights are cal-
culated internally by many participants, which leads to differences in how
E C O N O M I C R E V I E W 1 / 2 0 0 6 67
12 Changes in a chain index mean that the change in an index for N currencies can be written:
∆ln(It) = ΣN
n=1{ωn
t ∆ ln(vxnt )} when a correction is made for the effect on the base of adjusting the weights.
Table 1 presents a simple arithmetical example for an effective
exchange rate index for country A, with countries B and C includ-
ed in the index. Country A’s exchange rate with county B is
assumed to undergo a 5 per cent trendwise depreciation, accom-
panied by a corresponding appreciation of the exchange rate with
country C. The weights are equal initially. The index weight for
country B increases to begin with and then returns to the initial
level. As shown in the table, the alternative methods for calculat-
ing the index give different pictures of how the effective exchange
rate index develops. In this example, a chain-linked index leads to
the weighted sum of the changes in the exchange rates cancelling
out in the final period. The change in the value of the index in the
final period is therefore zero.12 The conventional geometric index
does not have this characteristic. In the final period, the changes in
weights cause the value of the index to fall back to the initial level.
The example shows that the different methods give different pic-
tures of how the index develops but says nothing about which
construction is closest to the mark. It is noteworthy, however, that
as a rule, central banks and other participants use a form of chain-
linked index when constructing an index with variable weights.
Krona indices tend tobe competitivenessweighted.

many countries are included and in whether or not the weights are time-
variable. A relevant question here is whether different indices point to dif-
ferent conclusions about the krona’s external value. As mentioned earlier,
it is real effective exchange rates that are of primary interest. For a com-
parison of two different indices, however, it may suffice to analyse the
E C O N O M I C R E V I E W 1 / 2 0 0 668
TABLE 2. SELECTED CENTRAL BANK’S EFFECTIVE EXCHANGE RATE INDICES
Central bank Name Type of weighting No. of Calculation Other commentscurrencies of weights
US Federal BROAD* Weighted for 26** Internal Sub-groupsReserve competition, time- calculated
varying
Bank of England ERI Weighted for Varies Internal Weights alsocompetition, time- calculated forvarying services trade
Norges Bank TWI Trade-weighted, 25 OECD An import-weightedtime-varying index is also
calculated
Bank of Canada C-6*** Trade-weighted, 6 Internal The USD’s weight isconstant weights over 80 per cent
Reserve Bank of TWI Trade-weighted, 24 Internal Import- and export-Australia time-varying weighted indices are
also calculated
Reserve Bank of TWI*** Trade-weighted, 5** Internal The weights alsoNew Zealand time-varying mirror the countries’
GDP
ECB EER Weighted for 12 Internal Broader indices (23competition, updated and 42 countries)every fifth year are also used
Riksbank TCW Weighted for 20 IMFcompetition, constant weights
* Two other indices (major currency index and other important trading partner (OITP) index) are also calculated.** Here the euro is treated as one currency.*** An index based on total competitiveness weights is also calculated.
TABLE 3. EFFECTIVE EXCHANGE RATE INDICES FOR THE SWEDISH KRONA
Constructed Name Type of weighting No. of Other commentsby system currencies
Goldman TWI Weighted for 24 The euro area isSachs competition, time-varying treated as one
weights currency
NIER (KI) KIX Weighted for 29–32 Includes primarycompetition, time-varying commoditiesweights
NIER (KI) Trade- Weighted for trade, 14–28 Covers exports,weighted time-varying weights imports and third-
country effects
OECD Weighted for 28competition, time-varyingweights
BIS BIS index Weighted for trade, 26time-varying weights
IMF TCW Weighted for competition, 20–163 Updated weightsalso include commo-dities and services

path of the nominal index if both indices cover the same number of cur-
rencies/countries. The weights for the TCW index in accordance with the
original definition are included in Table 4. The updated weights for the
countries in the original TCW calculation and for an extended country set
are from Bayoumi, Lee & Jayanthi (2005). The latest (preliminary) weights
calculated by the Swedish National Institute of Economic Research (NIER)
are also included for comparison.13
E C O N O M I C R E V I E W 1 / 2 0 0 6 69
13 See Erlandsson & Markowski (2006). The preliminary calculations cover a total of 32 countries. The currentKIX published by NIER includes 29 countries.
TABLE 4. WEIGHTS
Country Original Updated Updated and NIER’s latest TCW TCW extended TCW KIX weights
Germany 22.28 17.56 15.43 16.97
France 7.15 8.29 7.29 6.85
Netherlands 4.24 5.44 4.78 5.24
Italy 6.05 5.90 5.19 4.74
Finland 6.69 5.16 4.54 4.71
Belgium-Luxembourg 3.55 3.81 3.35 5.24
Spain 2.48 3.25 2.85 2.93
Ireland 0.77 1.69 1.49 1.35
Austria 1.71 1.39 1.22 1.29
Portugal 0.93 0.81 0.71 0.64
Greece 0.27 0.72 0.64 0.39
UK 11.56 10.34 9.09 7.52
Denmark 5.60 5.42 4.77 4.87
Poland 1.54 2.06
Czech Republic 0.57 0.81
Hungary 0.44 0.66
Slovakia 0.18 0.29
Norway 5.58 5.36 4.71 5.11
Switzerland 2.74 2.10 1.85 1.71
Turkey 0.91 0.54
Iceland 0.12 0.09
Russia 0.88 1.66
Canada 1.16 1.70 1.49 1.86
Mexico 0.97 0.93
Brazil 1.06 0.77
Japan 5.20 6.07 5.33 3.49
China 3.52 3.35
South Korea 1.31 1.27
India 0.59 0.81
Australia 0.27 1.11 0.98 0.90
New Zeeland 0.14 0.21 0.18 0.16
USA 11.63 13.67 12.02 10.81
Total 100 100 100 100
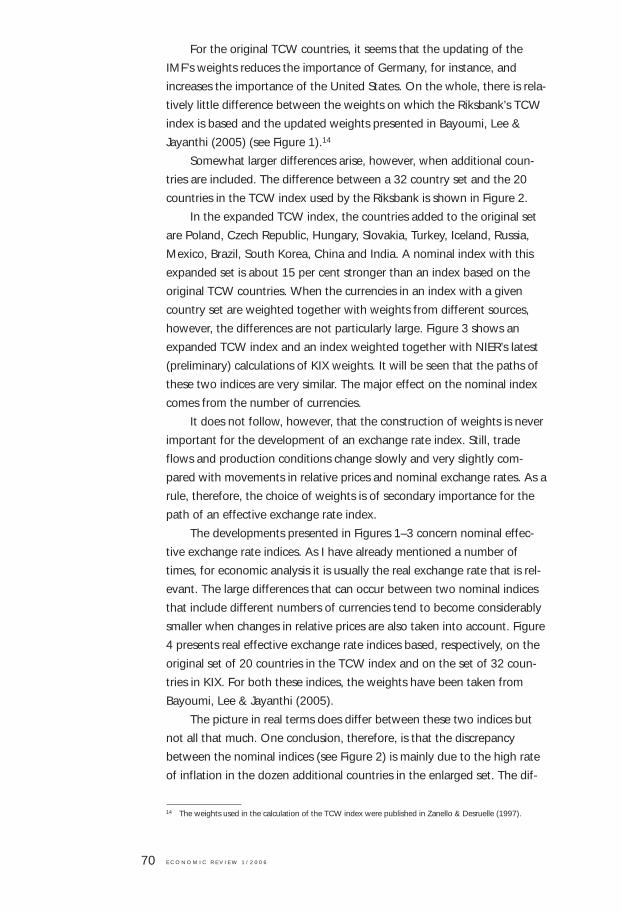
For the original TCW countries, it seems that the updating of the
IMF’s weights reduces the importance of Germany, for instance, and
increases the importance of the United States. On the whole, there is rela-
tively little difference between the weights on which the Riksbank’s TCW
index is based and the updated weights presented in Bayoumi, Lee &
Jayanthi (2005) (see Figure 1).14
Somewhat larger differences arise, however, when additional coun-
tries are included. The difference between a 32 country set and the 20
countries in the TCW index used by the Riksbank is shown in Figure 2.
In the expanded TCW index, the countries added to the original set
are Poland, Czech Republic, Hungary, Slovakia, Turkey, Iceland, Russia,
Mexico, Brazil, South Korea, China and India. A nominal index with this
expanded set is about 15 per cent stronger than an index based on the
original TCW countries. When the currencies in an index with a given
country set are weighted together with weights from different sources,
however, the differences are not particularly large. Figure 3 shows an
expanded TCW index and an index weighted together with NIER’s latest
(preliminary) calculations of KIX weights. It will be seen that the paths of
these two indices are very similar. The major effect on the nominal index
comes from the number of currencies.
It does not follow, however, that the construction of weights is never
important for the development of an exchange rate index. Still, trade
flows and production conditions change slowly and very slightly com-
pared with movements in relative prices and nominal exchange rates. As a
rule, therefore, the choice of weights is of secondary importance for the
path of an effective exchange rate index.
The developments presented in Figures 1–3 concern nominal effec-
tive exchange rate indices. As I have already mentioned a number of
times, for economic analysis it is usually the real exchange rate that is rel-
evant. The large differences that can occur between two nominal indices
that include different numbers of currencies tend to become considerably
smaller when changes in relative prices are also taken into account. Figure
4 presents real effective exchange rate indices based, respectively, on the
original set of 20 countries in the TCW index and on the set of 32 coun-
tries in KIX. For both these indices, the weights have been taken from
Bayoumi, Lee & Jayanthi (2005).
The picture in real terms does differ between these two indices but
not all that much. One conclusion, therefore, is that the discrepancy
between the nominal indices (see Figure 2) is mainly due to the high rate
of inflation in the dozen additional countries in the enlarged set. The dif-
E C O N O M I C R E V I E W 1 / 2 0 0 670
14 The weights used in the calculation of the TCW index were published in Zanello & Desruelle (1997).

ference in real terms is therefore considerably less pronounced. It is then
doubtful whether an enlarged country set in an effective index for the
Swedish krona would lead to decisively different conclusions about the
krona’s external value.
E C O N O M I C R E V I E W 1 / 2 0 0 6 71
1992 1993 1994 1995 1996 1997 1998 1999 2000 2001 2002 2003 2004 200590
100
110
120
130
140
150
TCW TCW, updated weights
Figure 1. Nominal effective SEK index based on initial and updated TCW weightsIndex: 1992-11-18=100
Note. The underlying bilateral SEK exchange rates are calculated with the cross rates with USD.Sources: Reuters, IMF and the Riksbank.
1992 1993 1994 1995 1996 1997 1998 1999 2000 2001 2002 2003 2004 2005
TCW TCW, additional countries
90
100
110
120
130
140
150
Figure 2. Nominal effective SEK index based on updated TCW weights and different numbers of countriesIndex: 1992-11-18=100
Note. The underlying bilateral SEK exchange rates are calculated with the cross rates with USD.Sources: Reuters, IMF and the Riksbank.

E C O N O M I C R E V I E W 1 / 2 0 0 672
TCW, additional countries Index calculated with NIER’s weights
90
100
110
120
130
95
105
115
125
1992 1993 1994 1995 1996 1997 1998 1999 2000 2001 2002 2003 2004 2005
Figure 3. Nominal effective SEK index based on updated TCW weights and on NIER’s (preliminary) weights Index: 1992-11-18=100
Note. The underlying bilateral SEK exchange rates are calculated with the cross rates with USD. For the index based on NIER’s weights the latest calculation has been used over thewhole period. Sources: Reuters, IMF, NIER (Swedish National Institute of Economic Research) and the Riksbank.
Real TCW Real TCW, additional countries
90
100
110
120
130
140
150
Figure 4. Real effective SEK index based on updated TCW weights and different numbers of countriesIndex: 1992-11-18=100
1992 1993 1994 1995 1996 1997 1998 1999 2000 2001 2002 2003 2004 2005
Note. The underlying bilateral SEK exchange rates are calculated with the cross rates with USD.Sources: Reuters, IMF, OECD and the Riksbank.

Conclusion
Real effective exchange rate indices are calculated as a rule to obtain
information about a country’s international competitiveness. Bilateral
exchange rates are therefore weighted together so that they mirror the
importance of other countries as trading partners. It turns out that dis-
crepancies can arise mainly in connection with the number of countries
that are included in such an index. This seems to be due, above all, to dif-
ferences in rates of inflation. The differences between real indices are
therefore usually considerably smaller, regardless of how many countries
are included. It can be of interest to work with a variety of indices, partic-
ularly in the event of large exchange rate movements for countries that
are not currently included in the existing TCW index. At present, how-
ever, the picture of the krona’s external value is not decisively affected b y
the choice of index for the analysis.
E C O N O M I C R E V I E W 1 / 2 0 0 6 73
The picture of thekrona’s external valueis not decisivelyaffected by the choiceof index for theanalysis.
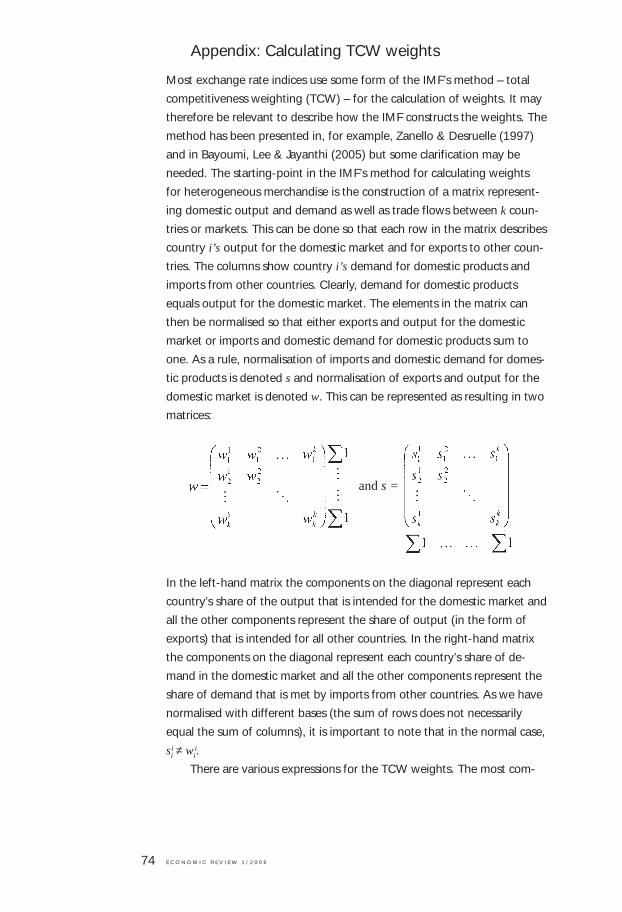
Appendix: Calculating TCW weights
Most exchange rate indices use some form of the IMF’s method – total
competitiveness weighting (TCW) – for the calculation of weights. It may
therefore be relevant to describe how the IMF constructs the weights. The
method has been presented in, for example, Zanello & Desruelle (1997)
and in Bayoumi, Lee & Jayanthi (2005) but some clarification may be
needed. The starting-point in the IMF’s method for calculating weights
for heterogeneous merchandise is the construction of a matrix represent-
ing domestic output and demand as well as trade flows between k coun-
tries or markets. This can be done so that each row in the matrix describes
country i’s output for the domestic market and for exports to other coun-
tries. The columns show country i’s demand for domestic products and
imports from other countries. Clearly, demand for domestic products
equals output for the domestic market. The elements in the matrix can
then be normalised so that either exports and output for the domestic
market or imports and domestic demand for domestic products sum to
one. As a rule, normalisation of imports and domestic demand for domes-
tic products is denoted s and normalisation of exports and output for the
domestic market is denoted w. This can be represented as resulting in two
matrices:
In the left-hand matrix the components on the diagonal represent each
country’s share of the output that is intended for the domestic market and
all the other components represent the share of output (in the form of
exports) that is intended for all other countries. In the right-hand matrix
the components on the diagonal represent each country’s share of de-
mand in the domestic market and all the other components represent the
share of demand that is met by imports from other countries. As we have
normalised with different bases (the sum of rows does not necessarily
equal the sum of columns), it is important to note that in the normal case,
sii ≠ wi
i.
There are various expressions for the TCW weights. The most com-
E C O N O M I C R E V I E W 1 / 2 0 0 674
and s =

mon approach is to calculate each weight, for example country j’s weight
for country i, as follows:15
Wij = λMi MWij + λBX
i BXWij + λTXi TXWij
where
MWij =
BXWij =
TXWij = .
To construct the weights, we can define ski , which denotes country i’s
share of market k, and wki , which denotes country i’s share of the supply
in market k. These definitions can be used to define the component MWij
as:
MWij = .
This weight is country j’s share of market i. Country i’s share of output
for market i (its share of output for its domestic market) is excluded, so
that these weights (for j to k countries) sum to one. MWij is then this
country j’s share of total imports to market i. Thus, this weight is
designed to measure the competition domestic producers encounter in
their domestic market in the form of imports.
The component BXWij is the share of output in country i that is sold
in country j, taking into account country j’s relative share of sales in its
domestic market.
BXWij = .
As previously, country i’s own output and own market shares are exclud-
ed from the calculations, so that the weights (for j to k countries) sum to
one. Countries with a share of their domestic market sales that is small
relative to other countries can be regarded as relatively more open, which
makes them less important than a calculation based solely on export
E C O N O M I C R E V I E W 1 / 2 0 0 6 75
15 See Zanello & Desruelle (1997), p. 29.
sij
Σk≠i sik
w ji s j
j
Σk≠i wki sk
k
Σk≠i,j wki sk
j
Σk≠i wki (1–sk
i –skk)
sij
Σk≠i sik
w ji s j
j
Σk≠i wki sk
k

shares would indicate. If all countries have the same degree of openness,
this weight is the same as the simple export share.
The last component, TWXij, represents what is known as the third-
country effect (or the double-export weight) and is defined as follows:
TXWij= .
This component measures the importance of the competition country i
encounters in the form of exports from country j in all other markets, for
example the competition Swedish exporters face from Japan in the
German and American markets. The component is calculated as the sum
of country i’s output that is exported to all other countries (except coun-
try j), taking into account country j’s share of the total output (in the
form of imports from country j) that meets total demand in each country.
The component is normalised by subtracting the share of demand that is
met by a country’s domestic output plus imports from country i.
These components then have to be weighted together with weights
that are calculated as follows:
λMi =
λBXi =
λTXi = .
These three expressions have the same denominator, which represents the
sum of country i’s shares of output in each country, taking into account
the demand in a country that is not met by country i.
The numerator in λMi can be read as the share of country i’s output
that is sold in its domestic market, taking into account the share of
demand that is covered by imports. In this way, the share is closely related
to the proportion of total output that is sold in the domestic market. The
numerator in λBXi is the sum of the shares of output in country i that are
sold to other countries, taking into account each country’s total demand
for its domestic products. It is then closely related to the exported share of
country i’s total output. The numerator in λTXi resembles that in λBX
i . Both
these terms include the sum of the shares of output in country i that are
sold in other countries. They differ in that λTXi takes into account each
country’s share of the total demand that is not covered by either domestic
products or by imports from country i.
E C O N O M I C R E V I E W 1 / 2 0 0 676
Σk≠i wki (1–sk
i –skk)
Σk wki (1–sk
i )
Σk≠i,j wki sk
j
Σk≠i wki (1–sk
i –skk)
wii (1–si
i)
Σk wki (1–sk
i )
Σk≠i wki sk
k
Σk wki (1–sk
i )

References
Bayoumi, N., Lee, N. & Jayanthi, N., (2005), “New Rates from NewWeights”, IMF Working Paper, 2005/99.
Buldorini, N., Makrydakis, N. & Thiman, N., (2002),“The EffectiveExchange Rate of the Euro”, ECB Occasional Paper Series, No. 2.
Ellis, L., (2001), “Measuring the Real Exchange Rate: Pitfalls andPracticalities”, Research Discussion Paper, Reserve Bank of Australia.
Erlandsson, M., Markowski, A, (2006), “The effective exchange rateindex KIX”, Konjunkturinstitutet, Working Paper, (forthcoming).
Goldman Sachs, (2004), “Updating the GS Trade-Weighted Indices”,Global Markets Viewpoint, No. 04/45.
Loretan, M., (2005), “Indexes of the Foreign Exchange Value of theDollar”, Federal Reserve Bulletin, winter.
Lynch, B. & Whitaker, S., (2004), “The new sterling ERI”, Bank ofEngland Bulletin, winter.
McGuirk, N., (1987), “Measuring Price Competitiveness for IndustrialCountry Trade in Manufactures”, IMF Working Paper, 1987/34.
Zanello, A. & Desruelle, D., (1997), “A Primer on the IMF’s InformationNotice System”, IMF Working Paper, 1997/71.
E C O N O M I C R E V I E W 1 / 2 0 0 6 77
■ Notices
Riksbank initiates cooperation with external researchers onexchange rate determinants
The Riksbank has initiated cooperation with a number of external re-searchers as a complement to the bank’s regular research to make abroader, more in-depth analysis of the development of the Swedish kronaand its determinants.
The results of the project will be reported during the second half of2006. The external researchers recruited to the projects so far are: NicolasCoeurdacier and Philippe Martin, Université Paris-I-Panthéon-Sorbonne;Richard Friberg and Fredrik Wilander, Stockholm School of Economics;Galina Hale, Yale University; Ethan Kaplan, UC Berkeley and the Institutefor International Economic Studies at Stockholm University; Philip Lane,University of Dublin; and Dagfinn Rime, Norges Bank.
Commemorative coin issue in 2006
At its meeting on 24 November 2005 the Executive Board of the Riksbankdecided to issue a commemorative coin in 2006 to celebrate the 150thanniversary of the Swedish railway. The coin will be issued in silver withthe denomination SEK 200 and in gold with the denomination SEK 2,000.
The design of the commemorative coin will be determined by the Gen-eral Council. The number of editions, the sales price and the issuetimetable for the coin will be set by the Executive Board of the Riksbank.
Riksbank exchanges EU payment
Sweden’s EU membership entails monthly contributions to the EU’s budg-et. These payments are made in Swedish kronor by the Swedish govern-ment and exchanged into euro in the foreign exchange market by a recip-ient central bank within the EU. Around the end of the year, the EUamount tends to be unusually large, at the same time as market turnoveris often low. For market reasons, therefore, the Riksbank has previouslyexchanged the EU flow around the end of the year. The payment at theend of 2005/beginning of 2006 amounted to SEK 3,369 billion. The Riks-bank again exchanged the krona amount for euro. The transaction has nomonetary policy significance. The Riksbank neutralised the effect of theexchange on liquidity in the banking system through an FX-swap.
E C O N O M I C R E V I E W 1 / 2 0 0 678

Report on housing finance in the global financial market
Various factors, such as an increase in the supply of financing opportuni-ties and deregulation of loan markets, have contributed to a decline incosts for both lenders and borrowers in the global housing finance mar-kets over the past ten years. This is revealed in a new report, "Housingfinance in the global financial market”. The report contains analyses ofcommon development trends and driving forces over the past ten years inthe housing finance market for owner-occupied housing in 17 countries,including Sweden.
The report was produced by a working group with participants from 17central banks and headed by Lars Nyberg, Deputy Governor of the Riks-bank. This work has taken place within the framework of the Committeeon the Global Financial System, which is a sub-committee of the BIS(Bank for International Settlements). The report is available on the BISwebsite (www.bis.org).
Decision on distribution of work within the Executive Board
The Executive Board of the Riksbank made a decision on 2 February 2006regarding the division of work between the members of the Board. Fol-lowing the decision, the division is:
• Stefan Ingves is Governor of the Riksbank.• Eva Srejber is First Deputy Governor and the Governor’s alternate. She
is responsible for presenting proposals for regulations regarding assetmanagement.
• Lars Nyberg is Deputy Governor and responsible for presenting propos-als for Financial Stability Reports and proposals on measures aimed atensuring the stability and efficiency of the payment system.
• Kristina Persson is Deputy Governor and responsible for presenting pro-posals regarding strategic information and communication issues.
• Irma Rosenberg is Deputy Governor and responsible for presenting pro-posals for Inflation Reports and for decisions concerning monetary andexchange rate policy measures.
• Svante Öberg is Deputy Governor and responsible for presenting pro-posals regarding fundamentally important opinions and for makingdecisions in other matters relating to consultation documents.
As before, the Executive Board has collective responsibility for the Bank’sactivities.
The Riksbank’s Annual Report 2005
The Riksbank presented its Annual Report for 2005 to the Riksdag, theSwedish parliament, on 13 February 2006. The Riksbank reported a profitof SEK 3.3 billion. The profit is primarily attributable to interest incomefrom the foreign currency reserve’s bond holdings.
E C O N O M I C R E V I E W 1 / 2 0 0 6 79

The Annual Report describes the changes that have occurred regardingthe Riksbank’s role in the cash management process during the period1998-2005. The view of the Riksbank is that this restructuring process hascost just over SEK 500 million more than if the activities during the period1999-2004 had continued to be managed in the same way as before andsubsequently wound up. The change has led to a new, more rationalstructure for cash management seen from an economic perspective.
General Council’s decision on allocation of net income
The General Council of the Riksbank has, in accordance with the SverigesRiksbank Act, presented a proposal to the Riksdag (the Swedish parlia-ment) regarding the allocation of the Riksbank’s net income for the finan-cial year 2005. The General Council has proposed that SEK 5.3 billion betransferred to the Treasury.
According to the current guidelines, 80 per cent of the average income– after certain adjustments but before appropriations – over the past fiveyears shall be transferred to the Treasury. A detailed account regardingthe calculation of the allocation of profits is given in the written reportcontaining the proposal for the allocation of the Riksbank’s profits for thefinancial year 2005 and the General Council’s account of activities for2005 (2005/06:RB2).
Pernilla Meyersson new Director of Communications
At its meeting on 17 February 2006, the Executive Board of the Riksbankappointed Pernilla Meyersson new Director of Communications. PernillaMeyersson succeeds Leif Jacobsson, who will take up a post as adviser inthe Secretariat of the Executive Board at the Riksbank.
Pernilla Meyersson first came to the Riksbank in 1996 and has mostrecently held a post as head of division in the Monetary Policy Depart-ment. She has previously worked as a journalist at Swedish Radio, on theEko news programme, and at the business newspaper Affärsvärlden.Pernilla Meyersson takes up her new post on 13 March.
Riksrevision’s scrutiny of the Riksbank’s Annual Report 2005
Riksrevisionen (the State Audit Institution) examines the Riksbank’s annu-al accounts and annual report every year. The Riksbank has received Riks-revisionen’s audit report of the bank’s Annual Report 2005. The auditreport was in the standard format, which means that Riksrevisionen hasfound that the Annual Report essentially provided a true and fair pictureof the bank’s activities. Riksrevisionen has also recommended that themanagement of the Riksbank be discharged from liability. The report canbe downloaded in full (in Swedish) from Riksrevisionen’s website(www.riksrevisionen.se).
E C O N O M I C R E V I E W 1 / 2 0 0 680

Decision on three Inflation Reports a year
At its meeting on 9 March 2006, the Executive Board of the Riksbankdecided that in future three Inflation Reports would be published a yearinstead of the current four. The number of monetary policy meetingswould not be affected; there would normally be seven or eight of theseper year.
Besides providing a basis for monetary policy decisions, the InflationReport aims to spread awareness of the Riksbank’s assessments to a widerpublic, so that monetary policy is easier for outsiders to follow and under-stand. The reports are also intended to encourage a discussion on mone-tary policy issues.
Riksbank introduces new, more secure 50-krona and 1,000-kronabanknotes
On 15 March 2006, the Riksbank introduced new, more secure 50-kronaand 1,000-krona banknotes. The new banknotes have largely the sameappearance as the older versions, but are equipped with several newsecurity features making them more difficult to counterfeit. The older ver-sions of these banknotes will continue to be legal tender.
The new 1,000-krona banknote contains a security feature known as“motion”. When the banknote is tilted, the picture in the striped bandappears to move. In addition, both the 50-krona and 1,000-krona ban-knote have been equipped with a foil strip and see-through picture. Fur-ther information can be found on the Riksbank’s web site (www.riks-bank.se).
E C O N O M I C R E V I E W 1 / 2 0 0 6 81

■ Monetary policy calender
2002-03-18 The repo rate is increased by the Riksbank from 3.75 percent to 4.0 per cent as of 20 March 2002. The deposit rateis accordingly adjusted to 3.25 per cent and the lendingrate to 4.75 per cent.
04-25 The repo rate is increased by the Riksbank from 4.0 percent to 4.25 per cent as of 2 May 2002. The deposit rate isaccordingly adjusted to 3.5 per cent and the lending rateto 5.0 per cent.
06-28 The reference rate is confirmed by the Riksbank at 4,5 percent for the period 1 July 2002 to 31 December 2002.
11-15 The repo rate is lowered by the Riksbank from 4.25 percent to 4.0 per cent as of 20 November 2002. The depositrate is accordingly set at 3.25 per cent and the lending rateto 4.75 per cent.
12-05 The repo rate is lowered by the Riksbank from 4.0 per centto 3.75 per cent as of 11 December 2002. The deposit rateis accordingly set at 3.0 per cent and the lending rate to4.5 per cent.
2003-01-01 The reference rate is confirmed by the Riksbank at 4.0 percent for the period 1 January 2003 to 30 June 2003.
03-17 The Riksbank decides to lower the repo rate from 3.75 percent to 3.50 per cent, to apply from 19 March 2003.Furthermore, the Riksbank decides that the deposit andlending rates shall be adjusted to 2.75 per cent and4.25 per cent respectively.
06-05 The Riksbank decides to lower the repo rate from 3.50 percent to 3.00 per cent, to apply from 11 June 2003.Furthermore, the Riksbank decides that the deposit andlending rates shall be adjusted to 2.25 per cent and3.75 per cent respectively.
06-30 The reference rate is confirmed by the Riksbank at 3.0 percent for the period 1 July 2003 to 31 December 2003.
07-04 The Riksbank decides to lower the repo rate from 3.0 percent to 2.75 per cent, to apply from 9 July 2003.Furthermore, the Riksbank decides that the deposit andlending rates shall be adjusted to 2.00 per cent and3.50 per cent respectively.
E C O N O M I C R E V I E W 1 / 2 0 0 682

2004-01-01 The reference rate is confirmed by the Riksbank at 3.0 percent for the period 1 January 2004 to 30 June 2004.
02-06 The Riksbank decides to lower the repo rate from 2.75 percent to 2.50 per cent, to apply from 11 February 2004.Furthermore, the Riksbank decides that the deposit andlending rates shall be adjusted to 1.75 per cent and 3.25per cent respectively.
03-31 The Riksbank decides to lower the repo rate from 2.50 percent to 2.00 per cent, to apply from 7 April 2004.Furthermore, the Riksbank decides that the deposit andlending rates shall be adjusted to 1.25 per cent and 2.75per cent respectively.
06-30 The reference rate is confirmed by the Riksbank at 2.0 percent for the period 1 July 2004 to 31 December 2004.
2005-01-01 The reference rate is confirmed by the Riksbank at 2.00 percent for the period 1 January 2005 to 30 June 2005.
06-20 The Riksbank decides to lower the repo rate from 2.00 percent to 1.50 per cent, to apply from 22 June 2005.Furthermore, the Riksbank decides that the deposit andlending rates shall be adjusted to 0.75 per cent and 2.25per cent respectively.
06-30 The reference rate is confirmed by the Riksbank at 1.50 percent for the period 1 July 2005 to 31 December 2005.
2006-01-01 The reference rate is confirmed by the Riksbank at 1.50 percent for the period 1 January 2006 to 30 June 2006.
01-19 The Riksbank decides to increase the repo rate from 1.50per cent to 1.75 per cent, to apply from 25 January 2006.Furthermore, the Riksbank decides that the deposit andlending rates shall be adjusted to 1.00 per cent and 2.50per cent respectively.
02-22 The Riksbank decides to increase the repo rate from 1.75per cent to 2.00 per cent, to apply from 1 March 2006.Furthermore, the Riksbank decides that the deposit andlending rates shall be adjusted to 1.25 per cent and 2.75per cent respectively.
E C O N O M I C R E V I E W 1 / 2 0 0 6 83


■ Statistical appendix
1 Riksbank’s assets and liabilities 87
2 Money supply 88
3 Interest rates set by the Riksbank 89
4 Capital market interest rates 89
5 Overnight and money market interest rates 90
6 Treasury bill and selected international rates 91
7 Krona exchage rate: TCW index and selected exchange rates 92
8 Nominal effective TCW exchange rate 93
E C O N O M I C R E V I E W 1 / 2 0 0 6 85
Statistics from Sveriges Riksbank are to be found on the Internet (www.riksbank.se). Dates of publication ofstatistics regarding the Riksbank’s assets and liabilities including foreign exchange reserves plus financial marketand the balance of payments statistics are available on the website of the International Monetary Fund (IMF)(dsbb.imf.org). Dates of publication are also available on www.riksbank.se.


Riksbank’s assets and liabilities
ASSETS. PERIOD-END STOCK FIGURES. SEK MILLION
Gold Lending Fixed Other Totalto banks assets
2004 July 17 718 10 635 153 528 2 897 184 778Aug 17 718 10 801 150 035 2 800 181 354Sept 18 095 10 269 150 885 2 718 181 967Oct 18 095 10 405 147 908 2 807 179 215Nov 18 095 11 063 150 093 2 706 181 957Dec 17 392 17 002 145 256 5 935 185 585
2005 Jan 16 436 11 101 145 391 5 725 178 653Feb 15 952 10 210 147 097 5 575 178 834March 16 558 12 016 148 366 5 503 182 443April 16 558 11 042 155 500 5 858 188 958May 16 558 11 286 152 090 5 966 185 900June 18 730 4 955 165 709 3 158 192 552July 18 730 5 346 166 846 3 370 194 292Aug 18 730 4 781 167 749 3 107 194 367Sept 19 845 4 937 162 401 3 245 190 428Oct 19 729 5 194 163 605 3 359 191 887Nov 19 642 5 440 164 246 3 317 192 645Dec 22 235 9 601 173 158 3 594 208 588
2006 Jan 22 090 4 101 164 472 3 415 194 078Feb 21 916 3 521 168 897 3 256 197 590
LIABILITIES. PERIOD-END STOCK FIGURES. SEK MILLION
Notes and Capital Debts to Debts in Other Totalcoins in liabilities monetary foreign
circulation policy currencycounterparties
2004 July 102 747 65 317 37 10 883 5 794 184 778Aug 102 979 65 317 280 6 821 5 957 181 354Sept 102 670 65 317 79 8 900 5 001 181 967Oct 102 821 65 317 25 5 326 5 726 179 215Nov 103 297 65 317 101 6 557 6 685 181 957Dec 108 894 65 317 613 7 448 3 313 185 585
2005 Jan 104 438 65 317 36 5 817 3 045 178 653Feb 103 557 65 317 94 6 453 3 413 178 834March 104 269 65 317 640 3 021 9 196 182 443April 103 876 65 317 31 10 138 9 596 188 958May 103 760 65 317 378 6 490 9 955 185 900June 105 489 55 813 153 5 421 25 676 192 552July 106 024 55 813 205 6 730 25 520 194 292Aug 105 600 55 813 117 6 864 25 973 194 367Sept 105 884 55 813 43 5 490 23 198 190 428Oct 106 063 55 813 17 6 367 23 627 191 887Nov 106 631 55 813 37 6 398 23 766 192 645Dec 111 075 55 813 250 12 956 28 494 208 588
2006 Jan 105 864 55 813 772 2 797 28 832 194 078Feb 105 083 55 813 47 6 785 29 862 197 590
E C O N O M I C R E V I E W 1 / 2 0 0 6 87
1

Money supply
END-OF-MONTH STOCK
SEK million Percentage 12-month change
M0 M3 MO M3
2003 Jan 90 122 1 085 994 Jan 0.4 5.3Feb 90 505 1 072 732 Feb 2.9 5.7March 91 966 1 092 435 March 2.2 5.8April 92 334 1 095 256 April 4.1 4.4May 92 346 1 097 622 May 4.0 7.0June 92 296 1 106 661 June 3.3 5.0July 91 608 1 090 284 July 3.4 5.1Aug 93 324 1 109 725 Aug 3.8 5.5Sept 92 451 1 113 021 Sept 3.2 4.9Oct 92 364 1 114 967 Oct 3.2 6.0Nov 93 070 1 107 251 Nov 2.9 3.6Dec 98 481 1 119 288 Dec 2.7 3.1
2004 Jan 93 087 1 109 798 Jan 3.3 2.2Feb 92 465 1 117 521 Feb 1.0 4.2March 92 399 1 116 429 March 0.5 2.2April 92 653 1 130 152 April 0.3 3.2May 93 032 1 132 356 May 0.7 3.2June 94 732 1 115 315 June 2.6 0.8July 92 962 1 115 774 July 1.5 2.3Aug 94 355 1 126 201 Aug 1.1 1.5Sept 93 992 1 147 965 Sept 1.7 3.1Oct 93 657 1 149 198 Oct 1.4 3.1Nov 95 163 1 161 091 Nov 2.2 4.9Dec 98 239 1 171 218 Dec –0.2 4.6
2005 Jan 95 017 1 159 637 Jan 2.1 4.5Feb 94 810 1 165 401 Feb 2.5 4.3March 95 494 1 156 486 March 3.3 3.6April 94 646 1 171 692 April 2.2 3.7May 95 314 1 185 822 May 2.5 4.7June 96 426 1 220 530 June 1.8 9.4July 96 316 1 205 762 July 3.6 8.1Aug 96 670 1 196 390 Aug 2.5 6.2Sept 96 655 1 212 644 Sept 2.8 5.6Oct 97 446 1 246 357 Oct 4.0 8.5Nov 97 778 1 244 371 Nov 2.7 7.2Dec 100 479 1 286 682 Dec 2.3 9.9
E C O N O M I C R E V I E W 1 / 2 0 0 688
2

Interest rates set by the Riksbank
PER CENT
Date of Effective Repo Deposit Lending Period Referenceannouncement from rate rate rate rate1
2003 03-18 03-19 3.50 2.75 4.25 2003:1hå 4.0006-05 06-11 3.00 2.25 3.75 2003:2hå 3.0007-04 07-09 2.75 2.00 3.50 2004:1hå 3.00
2004 02-06 02-11 2.50 1.75 3.25 2004:2hå 2.0003-31 04-07 2.00 1.25 2.75 2005:1hå 2.00
2005 06-21 06-22 1.50 0.75 2.25 2005:2hå 1.502006 01-20 01-25 1.75 1.00 2.50 2006:1hå 1.50
02-23 03-01 2.00 1.25 2.751 1 July 2002 the official discount rate was replaced by a reference rate. which is set by the Riksbank at the end of June
and the end of December.
Capital market interest rates
EFFECTIVE ANNUALIZED RATES FOR ASKED PRICE. MONTHLY AVERAGE. PER CENT
Bond issued by:
Central Government Housing institutions
2 years 5 years 7 years 10 years 2 years 5 years
2005 Jan 2.62 3.16 3.58 3.84 2.79 3.20Feb 2.53 3.10 3.51 3.76 2.70 3.12March 2.55 3.20 3.61 3.86 2.73 3.22April 2.43 2.97 3.35 3.58 2.61 3.31May 2.20 2.72 3.10 3.34 2.35 3.05June 1.93 2.44 2.85 3.11 2.06 2.76July 1.88 2.40 2.81 3.06 2.01 2.71Aug 2.06 2.57 2.93 3.14 2.20 2.87Sept 2.06 2.50 2.82 2.98 2.21 2.76Oct 2.40 2.87 3.01 3.17 2.33 2.98Nov 2.60 3.08 3.22 3.39 2.51 3.20Dec 2.76 3.16 3.26 3.37 2.70 3.33
2006 Jan 2.76 3.12 3.21 3.33 2.68 3.30Feb 2.74 3.17 3.27 3.42 2.65 3.33
E C O N O M I C R E V I E W 1 / 2 0 0 6 89
3
4

Overnight and money market interest rates
MONTHLY AVERAGE. PER CENT
Interbank Treasury bills Company certificates
Repo rate rate 3-month 6-month 12-month 3-month 6-month
2003 Jan 3.75 3.85 3.65 3.64 3.65 3.90 3.88Feb 3.75 3.85 3.61 3.53 3.50 3.85 3.79March 3.64 3.74 3.40 3.36 3.35 3.64 3.57April 3.50 3.60 3.42 3.39 3.40 3.62 3.59May 3.50 3.60 3.26 3.14 3.13 3.43 3.37June 3.16 3.26 2.80 2.71 2.70 3.03 2.94July 2.82 2.92 2.70 2.63 2.68 2.87 2.82Aug 2.75 2.85 2.70 2.77 2.86 2.88 2.90Sept 2.75 2.85 2.71 2.73 2.91 2.88 2.92Oct 2.75 2.85 2.73 2.74 2.92 2.89 2.93Nov 2.75 2.85 2.73 2.80 2.93 2.88 2.93Dec 2.75 2.85 2.69 2.69 2.84 2.86 2.87
2004 Jan 2.75 2.85 2.60 2.57 2.64 2.77 2.74Feb 2.59 2.69 2.46 2.45 2.48 2.59 2.59March 2.50 2.60 2.27 2.23 2.28 2.43 2.40April 2.10 2.20 2.02 2.05 2.19 2.15 2.18May 2.00 2.10 2.00 2.11 2.24 2.15 2.23June 2.00 2.10 1.98 2.07 2.38 2.15 2.24July 2.00 2.10 1.99 2.03 2.31 2.15 2.24Aug 2.00 2.10 2.02 2.13 2.25 2.15 2.25Sept 2.00 2.10 2.00 2.13 2.27 2.15 2.26Oct 2.00 2.10 1.99 2.10 2.38 2.16 2.27Nov 2.00 2.10 1.99 2.06 2.29 2.14 2.25Dec 2.00 2.10 1.99 2.05 2.18 2.12 2.16
2005 Jan 2.00 2.10 2.00 2.02 2.10 2.10 2.12Feb 2.00 2.10 1.97 1.98 2.04 2.06 2.08March 2.00 2.10 1.97 1.99 2.08 2.06 2.07April 2.00 2.10 1.99 2.00 2.03 2.06 2.08May 2.00 2.10 1.90 1.86 1.86 2.02 2.01June 1.85 1.95 1.65 1.62 1.64 1.80 1.78July 1.50 1.60 1.48 1.49 1.56 1.60 1.60Aug 1.50 1.60 1.48 1.49 1.65 1.61 1.65Sept 1.50 1.60 1.47 1.52 1.71 1.62 1.67Oct 1.50 1.60 1.49 1.57 1.83 1.68 1.78Nov 1.50 1.60 1.51 1.57 1.92 1.68 1.78Dec 1.50 1.60 1.69 1.93 2.24 1.68 1.78
2006 Jan 1.56 1.66 1.83 1.96 2.24 1.68 1.78Feb 1.75 1.85 1.93 1.97 2.17 1.68 1.78
E C O N O M I C R E V I E W 1 / 2 0 0 690
5

Treasury bill and selected international rates
MONTHLY AVERAGE. PER CENT
3-month deposits 6-month deposits
USD EUR GBP SSVX1 USD EUR GBP SSVX1
2003 Jan 1.27 2.76 3.88 3.65 1.29 2.69 3.87 3.64Feb 1.25 2.63 3.65 3.61 1.25 2.51 3.59 3.53March 1.19 2.47 3.56 3.40 1.17 2.39 3.50 3.36April 1.22 2.48 3.54 3.42 1.20 2.41 3.48 3.39May 1.20 2.35 3.53 3.26 1.16 2.25 3.49 3.14June 1.03 2.09 3.55 2.80 1.00 2.02 3.48 2.71July 1.04 2.08 3.38 2.70 1.05 2.04 3.37 2.63Aug 1.05 2.09 3.43 2.70 1.11 2.12 3.52 2.77Sept 1.06 2.09 3.60 2.71 1.10 2.12 3.70 2.73Oct 1.08 2.09 3.72 2.73 1.12 2.12 3.87 2.74Nov 1.08 2.10 3.88 2.73 1.17 2.17 4.07 2.80Dec 1.08 2.09 3.93 2.69 1.15 2.13 4.08 2.69
2004 Jan 1.04 2.03 3.96 2.60 1.10 2.06 4.11 2.57Feb 1.03 2.02 4.08 2.46 1.09 2.03 4.19 2.45March 1.02 1.97 4.21 2.27 1.07 1.95 4.34 2.23April 1.06 1.99 4.30 2.02 1.19 2.01 4.45 2.05May 1.16 2.03 4.44 2.00 1.44 2.08 4.63 2.11June 1.41 2.06 4.69 1.98 1.72 2.13 4.91 2.07July 1.54 2.06 4.77 1.99 1.80 2.13 4.93 2.03Aug 1.66 2.06 4.86 2.02 1.87 2.11 4.98 2.13Sept 1.85 2.06 4.84 2.00 2.01 2.14 4.93 2.13Oct 2.01 2.10 4.80 1.99 2.15 2.13 4.85 2.10Nov 2.24 2.12 4.77 1.99 2.42 2.16 4.81 2.06Dec 2.44 2.12 4.76 1.99 2.65 2.16 4.78 2.05
2005 Jan 2.60 2.10 4.75 2.00 2.85 2.15 4.77 2.02Feb 2.76 2.09 4.79 1.97 2.98 2.13 4.84 1.98March 2.95 2.09 4.87 1.97 3.21 2.14 4.95 1.99April 3.07 2.08 4.83 1.99 3.31 2.11 4.88 2.00May 3.19 2.07 4.78 1.90 3.42 2.08 4.78 1.86June 3.36 2.05 4.72 1.65 3.54 2.05 4.69 1.62July 3.56 2.08 4.56 1.48 3.78 2.09 4.47 1.49Aug 3.74 2.09 4.50 1.50 3.96 2.10 4.49 1.49Sept 3.84 2.09 4.50 1.47 3.98 2.11 4.47 1.52Oct 4.11 2.14 4.49 1.49 4.29 2.21 4.48 1.57Nov 4.29 2.31 4.53 1.51 4.49 2.44 4.54 1.57Dec 4.43 2.42 4.56 1.69 4.61 2.54 4.53 1.93
2006 Jan 4.57 2.45 4.50 1.83 4.69 2.60 4.49 1.96Feb 4.69 2.54 4.49 1.93 4.86 2.67 4.48 1.97
1 Treasury bills.
E C O N O M I C R E V I E W 1 / 2 0 0 6 91
6

Krona exchange rate: TCW index and selected exchange rates
MONTHLY AVERAGE
SEK
TCW index EUR GBP USD JPY CHF
2003 Jan 130.9609 9.1775 13.9590 8.6386 0.0727 6.2767Feb 129.7272 9.1499 13.6813 8.4930 0.0711 6.2358March 130.3167 9.2221 13.5031 8.5298 0.0720 6.2777April 128.9566 9.1585 13.2756 8.4370 0.0704 6.1248May 127.1076 9.1541 12.8520 7.9229 0.0676 6.0426June 126.3154 9.1149 12.9638 7.8108 0.0660 5.9211July 127.6987 9.1945 13.1295 8.0807 0.0681 5.9417Aug 128.9600 9.2350 13.2074 8.2825 0.0697 5.9957Sept 126.7679 9.0693 13.0143 8.0861 0.0703 5.8616Oct 125.3358 9.0099 12.9077 7.6966 0.0703 5.8195Nov 125.2370 8.9908 12.9783 7.6831 0.0703 5.7642Dec 124.3958 9.0169 12.8514 7.3632 0.0682 5.8001
2004 Jan 125.3707 9.1373 13.1985 7.2493 0.0681 5.8343Feb 125.9654 9.1814 13.5574 7.2599 0.0682 5.8367March 127.6783 9.2305 13.7500 7.5243 0.0694 5.8922April 127.6519 9.1711 13.7941 7.6501 0.0711 5.9008May 126.7383 9.1312 13.5751 7.6061 0.0679 5.9248June 127.0144 9.1422 13.7711 7.5332 0.0688 6.0193July 127.3590 9.1954 13.8041 7.4931 0.0685 6.0222Aug 127.3415 9.1912 13.7313 7.5444 0.0683 5.9753Sept 125.7140 9.0954 13.3500 7.4484 0.0677 5.8943Oct 124.8272 9.0610 13.1085 7.2557 0.0666 5.8730Nov 123.3656 9.0036 12.8863 6.9390 0.0662 5.9155Dec 122.4392 8.9786 12.9405 6.7030 0.0646 5.8495
2005 Jan 123.7464 9.0538 12.9620 6.8996 0.0668 5.8527Feb 124.4271 9.0839 13.1666 6.9778 0.0665 5.8614March 124.2160 9.0860 13.1189 6.8755 0.0654 5.8669April 125.8007 9.1650 13.4189 7.0796 0.0660 5.9230May 126.6878 9.1942 13.4357 7.2482 0.0679 5.9511June 129.1463 9.2585 13.8466 7.6079 0.0700 6.0170July 130.9115 9.4284 13.7113 7.8281 0.0699 6.0507Aug 129.3670 9.3426 13.6266 7.6002 0.0687 6.0158Sept 129.6486 9.3367 13.7798 7.6215 0.0686 6.0279Oct 131.0017 9.4231 13.8250 7.8368 0.0683 6.0845Nov 133.2427 9.5663 14.0761 8.1082 0.0685 6.1906Dec 131.1811 9.4372 13.8967 7.9524 0.0671 6.0984
2006 Jan 128.9783 9.3180 13.5773 7.6951 0.0667 6.0131Feb 129.6175 9.3405 13.6678 7.8190 0.0664 5.9948
Note. The base for the TCW index is 18 November 1992. TCW (Total Competitiveness Weights) is a way of measuring the value of the krona againsta basket of other currencies. TCW is based on average aggregate flows of processed goods for 21 countries. The weights include exports, importsand ”third country” effects.
E C O N O M I C R E V I E W 1 / 2 0 0 692
7

Nominal effective TCW exchange rateINDEX: 18 NOVEMBER 1992=100
E C O N O M I C R E V I E W 1 / 2 0 0 6 93
112
116
124
120
132
140
1999 2000 2001 2002 2003 2004 2005 2006
Note: TCW (Total Competitiveness Weights) is a way of measuring the value of the Swedish krona against a basket of other currencies. TCW is based on average aggregate flows of processed goods for 21 countries. The weights include imports, exports and “third country” effects.
136
128
144
8

■ Articles in earlier issues
Swedish krona loans on international markets Loulou Wallman 1990:1
Foreign exchange markets in April 1989 – a global study Robert Bergqvist 1990:1
The balance of payments Gunnar Blomberg 1990:2
Reinvested earnings and direct investment assets Fredrika Röckert 1990:2
Foreign ownership – the law and current proposals Per Arne Ström 1990:2
The international foreign exchange market in 1989 and 1990 Robert Bergqvist 1990:3
Exchange deregulation – short and long-run effects Christina Lindenius 1990:3
The Swedish credit market, January through September 1990
Marianne Biljer and Per Arne Ström 1990:4
Fewer loans and larger mortgage payments – the Riksbank’s household survey,
January–June 1990 Anna Thoursie 1990:4
New data on outflow of travel allowance Fredrika Röckert 1990:4
Competition and regulation: trends in financial systems David T. Llewellyn 1990:4
Foreign bank branches and Riksbank loan facilities Loulou Wallman 1991:1
The EMU process in 1990 – a résumé Gustaf Adlercreutz 1991:1
The Norwegian krone to Ecu Christina Lindenius 1991:1
The 1990 balance of payments Fredrika Röckert 1991:2
Swedish holdings of foreign portfolio shares Martin Falk 1991:2
Profits in commercial banking Bo Dalheim, Peter Lagerlöf and Per Arne Ström 1991:2
International capital adequacy rules – the work continues
Göran Lind and Åke Törnqvist 1991:2
Safeguard the monetary role of the IMF Margareta Kylberg 1991:2
Finance companies – structural changes Marianne Biljer 1991:3
The Swedish krona pegged to the Ecu Hans Lindberg and Christina Lindenius 1991:3
The private Ecu – characteristics and tendencies Jonny Nilsson 1991:3
The international foreign exchange market in 1990 and 1991 – expanding EMS
block Robert Bergqvist and Leif Johansson 1991:4
The EEA agreement and the Riksbank Jan Nipstad 1991:4
Household borrowing in 1991:1 Siw Stjernborg 1991:4
The Riksbank and primary dealers
Robert Bergqvist and Ann Westman Mårtensson 1992:1
Economic and monetary union – Maastricht points the way Gustaf Adlercreutz 1992:1
European monetary union – convergence criteria and adjustment
Christian Nilsson 1992:1
Bank results in Sweden and other Nordic countries
Bo Dalheim, Göran Lind and Anna-Karin Nedersjö 1992:2
Market deregulation for krona certificates and bonds Loulou Wallman 1992:2
Foreign acquisitions of shares in Swedish companies Rolf Skog 1992:2
The EEA agreement and financial markets Jan Nipstad 1992:2
The budget deficit and fiscal policy Krister Andersson 1992:3
Foreign investment in Swedish interest-bearing securities
Martin Falk and Tomas Niemelä 1992:3
E C O N O M I C R E V I E W 1 / 2 0 0 694

The performance of banks in the UK and Scandinavia: a case study in competition
and deregulation David T. Llewellyn 1992:3
The foreign exchange market in April 1992 Robert Bergqvist 1992:4
The interest rate scale Ann Westman Mårtensson 1992:4
The local government economy Maude Svensson 1992:4
Monetary policy indicators Yngve Lindh 1993:1
Payment systems in transition Hans Bäckström 1993:1
Annus horribilis for EMU Gustaf Adlercreutz 1993:1
The 1992 balance of payments Martin Falk and Anders Lindström 1993:2
The Swedish credit market in 1992 Marianne Biljer and Johanna Jonsson 1993:2
The banking sector in 1992 Bo Dalheim, Göran Lind and Anna-Karin Nedersjö 1993:2
Structural saving deficiency – a long-standing problem
Annika Alexius and Gunnar Blomberg 1993:2
Capital cover for market risk Robert Berqvist and Mats Ericsson 1993:3
Securitisation on the Swedish credit market Willem van der Hoeven 1993:3
Government indexed bonds Kerstin Hallsten 1993:3
Estimating forward interest rates Lars E.O. Svensson 1993:3
Debt consolidation in progress Daniel Barr and Kurt Gustavsson 1993:4
Will Sweden follow Finland’s path? Maria Landell 1993:4
Monetary policy instruments in EMU Kari Lotsberg and Ann Westman 1993:4
Monetary policy effects on interest rate formation Annika Alexius 1994:1
The economic role of asset prices Claes Berg and Mats Galvenius 1994:1
Stage two in the EMU process Louise Lundberg 1994:1
The 1993 balance of payments with a flexible exchange rate
Anders Lindström and Tomas Lundberg 1994:2
Nonresident holdings of Swedish securities
Mattias Croneborg and Johan Östberg 1994:2
The Swedish credit market in 1993 Johanna Jonsson 1994:2
The banking sector in 1993 Göran Lind and Anna-Karin Nedersjö 1994:2
The Riksbank sets reserve requirements to zero Kari Lotsberg 1994:2
The Riksbank’s new interest rate management system Lars Hörngren 1994:2
The 1993 household survey Eeva Seppälä 1994:2
Central government debt, interest rates and the behaviour of foreign investors
Thomas Franzén 1994:3
Monetary conditions index – a monetary policy indicator
Bengt Hansson and Hans Lindberg 1994:3
Sweden’s net external debt Robert Bergqvist and Anders Lindström 1994:3
The Riksbank, the RIX system and systemic risks Daniel Barr 1994:3
RIX – the Riksbank’s system for clearing and settlement Bertil Persson 1994:3
The international foreign exchange market in 1994
Martin Edlund and Kerstin Mitlid 1994:4
The yield curve and investment behaviour Lars Hörngren and Fredrika Lindsjö 1994:4
Direct investment – interpretations and implications Johan Östberg 1994:4
Price stability and monetary policy Urban Bäckström 1995:1
The coordination of economic policy in the European Union
Christina Lindenius 1995:1
The bank’s deposit monopoly and competition for savings
Daniel Barr and Lars Hörngren 1995:1
E C O N O M I C R E V I E W 1 / 2 0 0 6 95
The Riksbank and primary dealers in the currency market
Robert Bergqvist and Ann Westman 1995:1
The 1994 balance of payments – capital flows and exchange rate
Robert Bergquist and Mattias Croneborg 1995:2
Output gap and inflation in a historical perspective Mikael Apel 1995:2
The Swedish credit market in 1994 – continued consolidation Felice Marlor 1995:2
Banks and housing institutions in 1994
Björn Hasselgren and Anna-Karin Nedersjö 1995:2
The 1994 household survey – increased financial saving Hans Dillén 1995:2
Monetary policy in theory and practice Lars Hörngren 1995:3
Estimating forward interest rates with the extended Nelson and Siegel method
Lars E.O. Svensson 1995:3
Household saving in private bonds Lotte Schou and Marianne Wolfbrandt 1995:3
Tourism dominates the travel item Fredrika Röckert 1995:3
The Riksbank and european monetary cooperation Urban Bäckström 1995:4
Strategy and instruments in EMU’s third stage Claes Berg 1995:4
EMU and employment Krister Andersson and Anatoli Annenkov 1995:4
EMU’s final objective – a single currency Stefan Ingves and Agneta Brandimarti 1995:4
EU, EMU and the payment system Hans Bäckström 1995:4
The management of the bank crisis – in retrospect
Stefan Ingves and Göran Lind 1996:1
The krona’s equilibrium real exchange rate Annika Alexius and Hans Lindberg 1996:1
Sharp swings in international capital flows Fredrika Röckert and Karin Stillerud 1996:1
Swedish derivatives market dominated by a few agents
Antti Koivisto and Marianne Wolfbrandt 1996:1
“Herstatt risk” and the international banking system Hans Bäckström 1996:1
Monetary policy strategies for the European Central Bank Claes Berg 1996:2
Producer and import prices and the CPI – weak aggregated relationship
Hans Dellmo 1996:2
The 1995 household survey Peter Lundkvist 1996:2
Monetary policy, inflation and unemployment
Mikael Apel and Lars Heikensten 1996:3
Potential output and output gap Mikael Apel, Jan Hansen and Hans Lindberg 1996:3
Government’s altered role in financial markets
Martin Blåvarg and Stefan Ingves 1996:3
Aspects of Sweden’s external debt Robert Bergqvist and Tomas Lundberg 1996:4
The Riksbank’s management of short-term interest rates Karolina Holmberg 1996:4
Government’s finance in a structural perspective Johan Fall 1996:4
Monetary policy and unemployment Urban Bäckström 1997:1
Macroeconomic indicators of system risk Felice Marlor 1997:1
Structural change and price formation Tor Borg and Mattias Croneborg 1997:1
Electronic money – risk, questions, potential
Hans Bäckström and Peter Stenkula 1997:1
Has the inflation process changed? Claes Berg and Peter Lundqvist 1997:2
EMU expectations and interest rates Hans Dillén and Martin Edlund 1997:2
EMU 1999 – the current situation Jonas Eriksson and Loulou Wallman 1997:2
The 1996 household survey – renewed upswing in new borrowing
Peter Lundqvist 1997:2
The Swedish repo market Christian Ragnartz and Johan Östberg 1997:3/4
E C O N O M I C R E V I E W 1 / 2 0 0 696

Payment system float Johanna Lybeck 1997:3/4
Lessons of the Dutch model Jonas A. Eriksson and Eva Uddén-Jondal 1997:3/4
The krona’s role outside the EMU Kerstin Mitlid 1998:1
EMU soon a reality – how is monetary policy affected?
Lars Heikensten and Fredrika Lindsjö 1998:1
Five years with the price stability target Urban Bäckström 1998:1
Co-ordination for financial stability Göran Lind 1998:1
Why is an independent central bank a good idea?
Mikael Apel and Staffan Viotti 1998:2
Should Sveriges Riksbank concern itself with share prices?
Ossian Ekdahl, Jonas A. Eriksson and Felice Marlor 1998:2
Exchange rates and currency options as EMU indicators
Javiera Aguilar and Peter Hördahl 1998:2
Value at Risk Lina El Jahel, William Perraudin and Peter Sellin 1998:2
Efficiency in the payment system – a network perspective Gabriela Guibourg 1998:3
Securitisation – a future form of financing? Martin Blåvarg and Per Lilja 1998:3
Links between competition and inflation Marcus Asplund and Richard Friberg 1998:3
Inflation targeting and Swedish monetary policy – experience and problems
Lars Heikensten and Anders Vredin 1998:4
Can we create a global payments network? Hans Bäckström and Stefan Ingves 1998:4
Why use bond indexes? Christian Ragnartz 1998:4
Development and financial structure of the International Monetary Fund
Maria Götherström 1998:4
The Riksbank’s inflation target – clarifications and evaluation Lars Heikensten 1999:1
Hedge funds – trouble-makers? Per Walter and Pär Krause 1999:1
Option prices and market expectations Javiera Aguilar and Peter Hördahl 1999:1
Managing and preventing financial crises Martin Andersson and Staffan Viotti 1999:1
The current situation for monetary policy Urban Bäckström 1999:2
Inflation forecasts with uncertainty intervals Mårten Blix and Peter Sellin 1999:2
Market valuation of external position Gunnar Blomberg and Johan Östberg 1999:2
Why Sweden has changed its stabilisation policy regime Villy Bergström 1999:2
Towards new national and international banking regulations
Göran Lind and Johan Molin 1999:3
Interest rate risk in the foreign exchange reserve Christian Ragnartz 1999:3
Inflation forecast targeting Claes Berg 1999:3
The current situation for monetary policy Urban Bäckström 1999:4
Different ways of conducting inflation targeting – theory and practice
Mikael Apel, Marianne Nessén, Ulf Söderström and Anders Vredin 1999:4
Structural changes in the banking sector – driving forces and consequences
Per Lilja 1999:4
Economic policy coordination in the EU/euro area
Lars Heikensten and Tomas Ernhagen 2000:1
Is there a “new economy” and is it coming to Europe?
Jonas A. Eriksson and Martin Ådahl 2000:1
Macroeconomic indicators of credit risk in business lending Lena Lindhe 2000:1
International portfolio investments Roger Josefsson 2000:1
Current monetary policy Urban Bäckström 2000:2
Macroeconomic dependence on demographics: a key to better forecasting
Thomas Lindh 2000:2
E C O N O M I C R E V I E W 1 / 2 0 0 6 97

Swedish housing finance and the euro Margareta Kettis and Lars Nyberg 2000:2
Conducting monetary policy with a collegial board: the new Swedish legislation
one year on Claes Berg and Hans Lindberg 2000:2
The conquest of inflation – An introduction to Sargent’s analysis
Ulf Söderström and Anders Vredin 2000:3
The conquest of American inflation: A summary
Thomas J. Sargent and Ulf Söderström 2000:3
Dealing with banking crisis – the proposed new regulatory framework
Staffan Viotti 2000:3
The banking Law Committee’s main and final reports 2000:3
The current situation for monetary policy Urban Bäckström 2000:4
Credit rating and the business cycle: can bankruptcies be forecast?
Tor Jacobson and Jesper Lindé 2000:4
Accession countries’ choice of exchange rate system in preparation for EMU
Martin Ådahl 2000:4
The wage spread between different sectors in Sweden Sara Tägtström 2000:4
Trends in Swedish Public Finances – Past and Future
Yngve Lindh and Henry Ohlsson 2000:4
Independent central banks in democracies? Villy Bergström 2001:1
Steering interest rates in monetary policy – how does it work?
Kerstin Mitlid and Magnus Vesterlund 2001:1
Changed wage formation in a changing world?
Kent Friberg and Eva Uddén Sonnegård 2001:1
The Riksbank’s opinion on the report “Public administration of banks in distress”
SOU 2000:66 2001:1
How can central banks promote financial stability?
Tor Jacobson, Johan Molin and Anders Vredin 2001:2
Regulation and banks’ incentives to control risk Arnoud W.A. Boot 2001:2
Maintaining financial stability: Possible policy options Philip Lowe 2001:2
Dealing with financial instability: The central bank’s tool kit Arturo Estrella 2001:2
Challenges for tax policy in Sweden Robert Boije 2001:2
The role of the property tax in the tax system Peter Englund 2001:2
The Riksbank’s oversight of the financial infrastructure
Martin Andersson, Gabriela Guibourg and Björn Segendorff 2001:3
The International Monetary Fund’s quotas – their function and influence
Anna-Karin Nedersjö 2001:3
How good is the forecasting performance of major institutions?
Mårten Blix, Joachim Wadefjord, Ulrika Wienecke and Martin Ådahl 2001:3
Share-index options as forward-looking indicators Magnus Lomakka 2001:3
A financial measure of inflation expectations
Malin Andersson and Henrik Degrér 2001:3
Price stability and financial stability Sonja Daltung 2001:4
The use of cash in the Swedish economy
Martin Andersson and Gabriela Guibourg 2001:4
Explaining wage trends Lars Calmfors and Eva Uddén Sonnegård 2001:4
Households, stock markets and the financial system Urban Bäckström 2002:1
The Riksbank’s foreign exchange interventions – preparations, decision
and communication Lars Heikensten and Anders Borg 2002:1
The real interest rate and monetary policy Magnus Jonsson 2002:1
E C O N O M I C R E V I E W 1 / 2 0 0 698

The role of the gold reserves and the rate of return on gold
Annette Henriksson 2002:1
Central banks’ equity needs
Tomas Ernhagen, Magnus Vesterlund and Staffan Viotti 2002:2
Inter-bank exposures and systemic risk Martin Blåvarg 2002:2
Rixmod – the Riksbank’s macroeconomic model for monetary policy analysis
Christian Nilsson 2002:2
Should tax deviations be integrated into the budget process? Robert Boije 2002:2
The yield curve and the Riksbank’s signalling
Malin Andersson, Hans Dillén and Peter Sellin 2002:3
Consolidation in the Swedish banking sector: a central bank perspective
Lars Frisell and Martin Noréus 2002:3
An evaluation of forecasts for the Swedish economy
Mårten Blix, Kent Friberg and Fredrik Åkerlind 2002:3
The art of targeting inflation Lars Heikensten och Anders Vredin 2002:4
The IRB approach in the Basel Committee’s proposal for new capital adequacy
rules: some simulation-based illustrations
Tor Jacobson, Jesper Lindé and Kasper Roszbach 2002:4
Reformed management of international financial crises Ola Melander 2002:4
The Riksbank’s statement regarding the report ”Stabilisation policy in the
monetary union” SOU 2002:16 2002:4
Should we welcome globalisation? Villy Bergström 2003:1
National stabilisation policy in the event of Swedish Eurosystem membership
Robert Boije and Hovick Shahnazarian 2003:1
How is the economy affected by the inflation target?
Malin Adolfson and Ulf Söderström 2003:1
The use of market indicators in financial stability analyses
Mattias Persson and Martin Blåvarg 2003:2
Card payments in Sweden Lars Nyberg and Gabriela Guibourg 2003:2
Errors and omissions in the balance of payments statistics – symptoms and
causes Gunnar Blomberg, Lars Forss and Ingvar Karlsson 2003:2
Special Drawing Rights – a lubricant Anna-Karin Nedersjö 2003:2
The Riksbank’s submission on the final report Future financial supervision
SOU 2003:22 2003:2
The road to price stability in the 1990s Urban Bäckström 2003:3
Behind the Riksbank’s massive walls – establishing the inflation targeting
policy 1995–2003 Lars Heikensten 2003:3
On central bank efficiency Mårten Blix, Sonja Daltung and Lars Heikensten 2003:3
An Inflation Reports report Eric M. Leeper 2003:3
Financial bubbles and monetary policy Hans Dillén and Peter Sellin 2003:3
IMF – development, criticisms and future tasks David Farelius 2003:3
Crisis exercises make for crisis readiness Göran Lind 2003:4
Payment system efficiency and pro-competitive regulation Mats A. Bergman 2003:4
Is “wage drift” a problem? Eva Uddén Sonnegård 2003:4
The general government structural budget balance Robert Boije 2004:1
The peaks and troughs of the Stability and Growth Pact Jonas Fischer 2004:1
Lessons from the past: What can we learn from the history of centralized
wage bargaining? Michelle Alexopoulos and Jon Cohen 2004:1
E C O N O M I C R E V I E W 1 / 2 0 0 6 99

Can we be best again? The role of capital formation in long-term growth
Villy Bergström 2004:2
The financial accelerator and corporate investment
Claes Berg, Jan Hansen and Peter Sellin 2004:2
Swedish monetary policy Staffan Viotti 2004:2
Assessment of the Riksbank’s work on financial stability issues
Franklin Allen, Lennart Francke and Mark W. Swinburne 2004:3
Cash-supply efficiency Sonja Daltung and Mithra Ericson 2004:3
Inflation and relative-price changes in the Swedish economy
Bengt Assarsson 2004:3
A decade of inflation targeting Lars Heikensten 2004:4
Households’ inflation opinions – a tale of two surveys
Stefan Palmqvist and Lena Strömberg 2004:4
Price-setting behaviour in Swedish firms
Mikael Apel, Richard Friberg and Kerstin Hallsten 2004:4
Employment and the Riksbank
Villy Bergström, Annika Svensson and Martin Ådahl 2005:1
Experience of inflation-targeting in 20 countries Claes Berg 2005:1
The “new economy” and productivity in Sweden in the 2000s
Björn Andersson and Martin Ådahl 2005:1
On the need to focus more on the asymmetry problem within the
EU Fiscal Policy Framework Robert Boije 2005:1
Thoughts on how to develop the Riksbank’s monetary policy work
Lars Heikensten 2005:2
Basel II – the new framework for bank capital Göran Lind 2005:2
Monetary policy expectations and forward premia
Jan Alsterlind and Hans Dillèn 2005:2
The Riksbank’s management of interest rates – monetary policy in practice
Annika Otz 2005:2
Dag Hammarskjöld as economist and government official Assar Lindbeck 2005:3
Time for choosing. Dag Hammarskjöld and the Riksbank in the Thirties
Hans Landberg 2005:3
Civil servant or politician? Dag Hammarskjöld’s role in Swedish government
policy in the Forties Örjan Appelqvist 2005:3
Hammarskjöld, Sweden and Bretton Woods
Göran Ahlström and Benny Carlsson 2005:3
Dag Hammarskjöld: The Economist Börje Kragh 2005:3
The past ten years – experiences and conclusions Lars Heikensten 2005:4
Monetary policy and unemployment Villy Bergström and Robert Boije 2005:4
The future relationship between financial stability and supervision in
the EU Eva Srejber and Martin Noreus 2005:4
The Swedish market for balancing liquidity Pia Kronestedt Metz 2005:4
E C O N O M I C R E V I E W 1 / 2 0 0 6100


