ä^Sft /^^\ United states kiAJj) Department of ^^^^ Agriculture Economic Research Service Agricultural Economic Report Number 551 ai Swampbusting: Wetland Conversion and Farm Programs Ralph E. Heimlich Linda L. Langner i CD CO -<
Transcript
■ ä^Sft /^^\ United states kiAJj) Department of ^^^^ Agriculture
Economic Research Service
Agricultural Economic Report Number 551
ai Swampbusting: Wetland Conversion and Farm Programs Ralph E. Heimlich Linda L. Langner
i ■ ■■ ■
CD
CO
-<
Swampbusting: Wetland Conversion and Farm Programs, by Ralph E. Heimlich and Linda L. Langner. Natural Resource Economics Division, Economic Research Service, U.S. Department of Agriculture. Agricultural Economic Report No. 551.
Abstract
Farmers who grow annual crops on converted wetlands, a practice pop- ularly known as swampbusting, will be denied all farm program benefits under the Food Security Act of 1985. Denying price supports to operators converting wetlands can be an effective sanction in some situations, but may be less effective where tax breaks are the main motive for conversion. Although remaining wetlands may be productive if converted, high conver- sion costs probably make most wetlands unprofitable to convert. Further, the high social value of existing wetlands may outweigh the value of in- creased agricultural production through conversion, particularly in wetland areas critical for wildlife habitat.
Additional copies of this report can be purchased from the Superintendent of Documents, U.S. Government Printing Office, Washington, D.C. 20402. For the price of extra copies, write to the above address or call GPO's order desk at (202) 783-3238. You can also charge your purchase by telephone to your VISA, MasterCard, Choice, or GPO deposit account. Discounts are available for bulk quantities.
Microfiche copies ($5.95 each) can be purchased from the National Technical Information Service, 5285 Port Royal Road, Springfield, VA 22161. Enclose a check or money order payable to NTIS; add $3 handling charge for each order. Call NTIS at (703) 487-4650 and charge your pur- chase to your VISA, MasterCard, American Express, or NTIS deposit ac- count. NTIS will ship a RUSH order within 24 hours for an extra $10; call (800) 336-4700.
The Economic Research Service has no copies for free mailing.
Washington, D.C. 20005 August 1986
Contents Page
Summary ii
Introduction 1
Extent and Location of Wetland Conversion 2 Long-term Trends 2 Location of Wetland Change 4 Wetland Conversion for Agriculture 4
Remaining Wetlands 5 Characteristics of Remaining Wetlands 5 Farm Potential of Remaining Wetlands 6
Economics of Wetland Conversion for Agriculture 7 Farm Programs, Income Taxes, and Wetland Conversion 7 Conversion Potential of Private Palustrine Wetlands 9 Economics of Conversion for Hypothetical Farms 13 Indirect Motivations for Conversion 16
Wetland Values Foregone From Conversion 16 Fish and Wildhfe Values 17 Ecological Values 17 Socioeconomic Values 17 Estimation of Economic Values 18
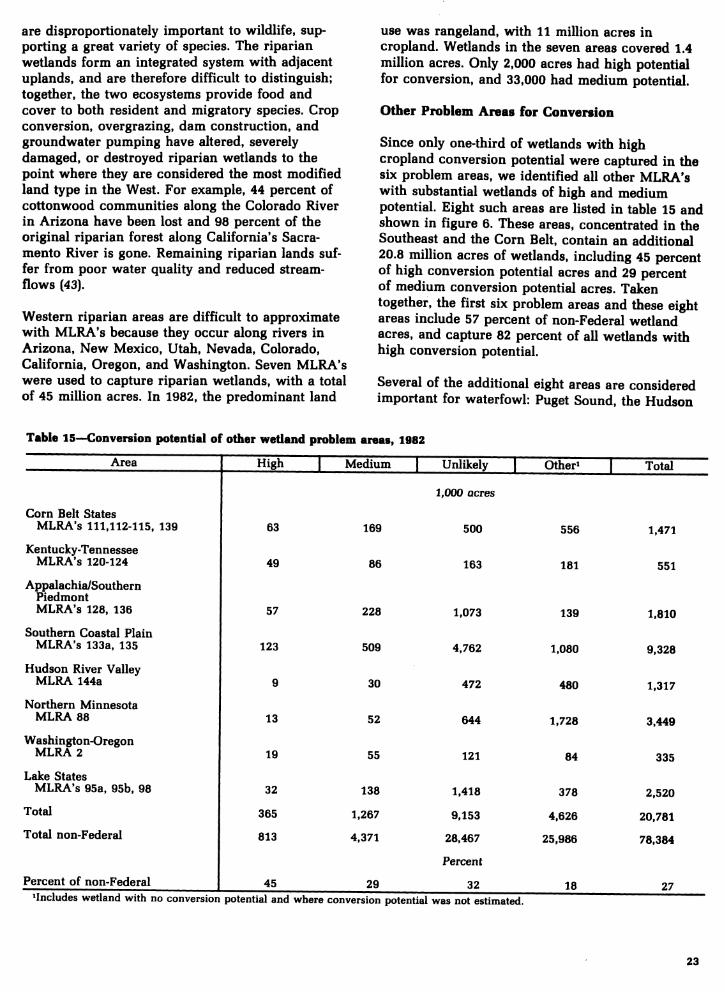
Critical Wildlife Wetland Areas 19 South Florida's Palustrine Wetlands 19 Prairie Pothole Emergent Wetlands 21 Nebraska's Sandhills and Rainwater Basin 22 Forested Wetlands of the Lower Mississippi Alluvial Plain 22 North Carolina's Pocosins 22 Western Riparian Wetlands 22 Other Problem Areas for Conversion 23
Conclusions and Policy Implications 24
References 25
Appendix 1—Wetland Data 28
Appendix 2—Two Hypothetical Farms 30
Summary
Farmers who grow annual crops on converted wet- lands, a practice popularly known as swampbust- ing, will be denied all farm program benefits under the Food Security Act of 1985. Denying price sup- ports to operators converting wetlands can be an effective sanction in some situations, but may be less effective where tax breaks are the main motive for conversion. Although remaining wetlands may be productive if converted, high conversion costs probably make most wetlands unprofitable to con- vert. Further, the high social value of existing wet- lands may outweigh the value of increased agri- cultural production through conversion, particularly in wetland areas critical for wildlife habitat.
Extent of the problem. Agricultural conversion was responsible for the loss of 12 million acres of wetlands between the mid-1950's and mid-1970's. In 1982, some 78.4 million acres of non-Federal wetlands remained. Privately owned wetlands available for conversion totaled 59.5 million acres.
Farm programs and wetlands. Of private wetlands suited to conversion, 72 percent (42.9 million acres) would be productive if converted to cropland. Defi- ciency payments would help offset high clearing and drainage costs that are the principal obstacles to converting these wetlands, but may not be suffi- cient to ensure longrun profitability. Only 5.1 million acres of remaining wetlands were judged to have high or medium potential for conversion to cropland in 1982.
Income taxes. Denying price-support payments to representative farms converting wetlands reduced after-tax income 26 to 144 percent. Income tax breaks on land improvements for extensive, high- cost conversions can offset loss of price support payments, especially where the owner has large
nonfarm income to shelter from taxes. Denying price supports will discourage wetland conversions when deficiency payments are a large part of net farm income and either conversion costs or non- farm incomes are low.
Conversion costs. The physical process of convert- ing wetlands for crop production differs across regions and results in widely varying conversion costs. Annual conversion costs can range from less than $20 per acre in the prairie pothole region of Minnesota to almost $200 per acre for North Carolina pocosin wetlands. The importance of farm program subsidies falls as conversion costs in- crease, while the size of income tax subsidies rises along with conversion costs.
Wetland values. Wetlands provide habitat for fish and wildlife, reduce floods and improve water quality, and provide recreational and renewable resources. Benefits from existing wetlands may outweigh the social value of additional production of surplus crops through conversion, at least in critical wetland areas.
Prospects. The drop in farm prices since 1981 may discourage all conversions to cropland, including wetland conversions. Nevertheless, prohibiting pay- ment of farm program subsidies to operators of converted wetlands will ensure greater consistency between USDA resource programs and commodity support programs. Eliminating income tax deduc- tions for land clearing and for soil and water con- servation activities related to wetland conversion would also remove incentives for conversion. However, indirect motivations for conversion- associated with timber harvest, removing nuisance wetlands in existing fields, and lowering water tables through irrigation pumping and flood-control channels—will continue despite sanctions in farm and tax legislation.
Swampbustîng Wetland Conversion and Farm Programs
Ralph E. Heimlich and Linda L. Langner*
Introduction
Public concern with the environment has forced a réévaluation of our attitudes toward wetlands, those frontiers between land and water where so much wildlife finds a home and fisheries are nurtured. Utilitarian views of wetlands—as latent resources awaiting reclamation for "useful" purposes- conflict with environmental concerns about loss of wetland habitat. Agriculture has been an important element in wetland conversion: about 87 percent of recent wetland losses involved draining and clear- ing wetlands for farming [28].^
Development of farmland in response to higher commodity prices in the 1970's was responsible for faster conversion of wetlands. Inconsistency be- tween agricultural production goals and conserva- tion goals was a persistent theme in public meetings and in a public opinion poll conducted in conjunction with the 1980 Resource Conservation Assessment {12). Even though official USDA policy seeks to "minimize the destruction, loss or degrada- tion of wetlands..." (Executive Order 11990), Government price-support and credit programs are presumed to be an important incentive in private decisions to convert land for farming. Provisions in the 1985 farm act deny farm program benefits both to operators who plow up highly erodible land, a practice termed "sodbusting," and operators who grow annual crops on converted wetlands, called "swampbusting" [17]. Critics argue that farm pro- grams should not support cropland converted from wetlands when the Water Bank Program and other Federal wildlife habitat programs seek to preserve wetlands.
Laws directly and indirectly regulating wetland conversions exist at the Federal level and in 30
*The authors are agricultural economists with the U.S. Depart- ment of Agriculture, Economic Research Service, Natural Resource Economics Division, Washington, D.C.
Mtalicized numbers in parentheses refer to sources cited in the References section.
States. Under Section 404 of the Clean Water Act. the Army Corps of Engineers regulates the discharge of dredged or filled material onto wetlands. However, excavation, drainage, clearing, and flooding of wetlands are not explicitly covered, so many inland conversions do not require a 404 permit. The Office of Technology Assessment (OTA) found that of the 300,000 acres of wetlands converted annually, more than 80 percent were unregulated. Corps estimates for 1980-81 indicate that of all permits filed, about half the acreage was approved for conversion with no significant modification. The 404 program and State regulatory programs are most effective at preventing coastal wetland conversion, while inland wetlands most vulnerable to agricultural conversion are not effec- tively regulated [28).
To address this problem, legislation was introduced in the 99th Congress to deny farm program benefits to operators who convert wetlands for crop produc- tion. The wetland conservation provision (Title XII C.) of the Food Security Act of 1985 (P.L. 99-198) makes an operator ineligible for price-support payments, farm storage facility loans, crop in- surance, disaster payments, and insured or guaranteed loans for any year in which an annual crop was produced on converted wetlands. An operator would retain eligibility if the land were converted before enactment of the legislation, or if crop production were possible in the wetland's natural state or due to natural conditions such as drought. Wetlands are defined as "land that has a predominance of hydric soils and that is inundated or saturated by surface or ground water at a fre- quency and duration sufficient to support... a prevalence of hydrophytic vegetation typically adapted for life in saturated soil conditions" (P.L. 99-198).
This report investigates the implications of the swampbuster provision by presenting data on re- maining wetlands and analyzing their potential for conversion to farmland. Background on past losses
of wetlands is presented, and trends from recent data are examined. Salient characteristics of re- maining wetlands are described and their physical potential for agricultural conversion assessed. The economics of converting wetlands for farm program crop production are analyzed with and without farm program benefits. The effects of incentives for conversion provided by the Federal income tax code are discussed. A description of wetland values foregone by conversion to cropland is followed by an analysis of farming potential in critical wetland problem areas. The report ends with conclusions and implications for policy.
Extent and Location of Wetland Conversion
Estimates of historical wetland acreage in the United States range from 127 million acres [45] to 185 million acres [28]. Comparing these estimates to the best current estimate of 99 million acres of re- maining wetlands (13) reveals a loss of 22 to 46 per- cent of the original wetland acreage that European settlers found on arriving here. There are a variety of data estimating wetland acreage at various times,
none of it uniform in scope or definition (see app. 1). Despite the flawed nature of these data for assess- ing trends, a review of the different estimates pro- vides useful background to the problem of wetland conversion.
Long-term Trends
The U.S. Congress gave 64.9 million acres of wetlands to 15 States in the Swamp Land Acts of 1849, 1850, and 1860. Comparison of recent estimates of wetland acreage in these States in- dicates that 19 percent of this acreage was lost by the mid-1970's (table 1). Six of the 15 States ap- peared to have added 8.9 million acres of wetlands between 1849 and the mid-1970's, but this probably reflects incomplete accounting for all wetlands under the acts. The remaining nine States lost 21.3 million acres, or 40 percent of their wetlands.
The first national wetlands inventory, conducted in 1954, estimated 74.4 million acres of wetlands, classified according to 20 types (38). In 1979, a more comprehensive analysis using aerial photographs estimated that there had been 108.2 million acres of wetlands in the 1950*s [13],
Wetland Terms
• Hydric soil: A soil ''.. .that in its undrained condition is saturated, flooded, or ponded long enough during the growing season to develop anaerobic conditions that favor the growth and regeneration of hydrophytic vegetation" [48],
• Wetland systems: Wetlands and deepwater habitats that share the influence of similar hydrologie, géomorphologie, chemical, or biological factors. Five major systems are recognized (see [8] for details):
MMríne—Open ocean overlying the continen- tal shelf and its associated high-energy coastline.
fsluATfiie—Deepwater tidal habitats and adja- cent tidal wetlands that are usuaUy partly enclosed by land but have open, partly obstructed, or sporadic access to the open ocean, and in which ocean water is at least occasionally diluted by freshwater runoff from the land.
Riverine—AH wetlands and deepwater habitats contained within a channel, except for wetlands dominated by trees, shrubs, per- sistent emergent plants, mosses, or lichens, and habitats containing ocean-derived salts above 0.5 o/oo (parts per thousand).
Lacuslrliie—Wetlands and deepwater habitats with all of the foUowing features: 1) situated in a topographic depression or a dammed river channel; 2) lacking trees, shrubs, and persistent emergent plants, mosses, or lichens covering more than 30 percent of the area; and 3) with a total area exceeding 20 acres.
PaiusCrina—All nontidal wetlands dominated by trees, shrubs, and persistent emergent plants, mosses, or lichens, and all such wetlands that occur in tidal areas where salinity due to ocean-derived salts is below 0.5 o/oo (parts per thousand).
• Pocosin wetland (the name is derived from an Algonquin word meaning "swamp on a hiU'*): These wetlands are unique to the southeastern coastal plain from Virginia to northern Florida. They lie in broad, flat upland areas away from large streams and are covered by evergreen forest and scnib-shnib vegetation (32, 43).
• Prairie pothole wetland: These wetlands were formed from melting ice fragments in glacial times. They are widespread shallow depres- sions, mostly less than 2 feet deep and varying from less than one to several hundred acres [43). Many potholes are only seasonally wet and can resemble dry land in periods of drought.
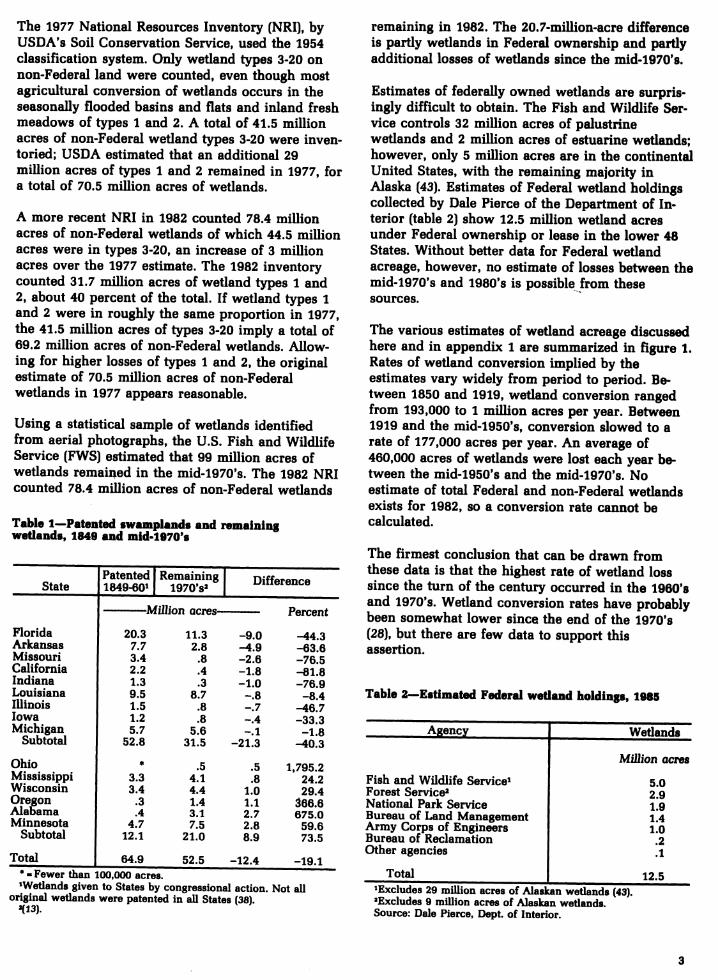
The 1977 National Resources Inventory (NRI), by USDA's Soil Conservation Service, used the 1954 classification system. Only wetland types 3-20 on non-Federal land were counted, even though most agricultural conversion of wetlands occurs in the seasonally flooded basins and flats and inland fresh meadows of types 1 and 2. A total of 41.5 million acres of non-Federal wetland types 3-20 were inven- toried; USDA estimated that an additional 29 million acres of types 1 and 2 remained in 1977, for a total of 70.5 million acres of wetlands.
A more recent NRI in 1982 counted 78.4 million acres of non-Federal wetlands of which 44.5 million acres were in types 3-20, an increase of 3 million acres over the 1977 estimate. The 1982 inventory counted 31.7 million acres of wetland types 1 and 2, about 40 percent of the total. If wetland types 1 and 2 were in roughly the same proportion in 1977, the 41.5 million acres of types 3-20 imply a total of 69.2 million acres of non-Federal wetlands. Allow- ing for higher losses of types 1 and 2, the original estimate of 70.5 million acres of non-Federal wetlands in 1977 appears reasonable.
Using a statistical sample of wetlands identified from aerial photographs, the U.S. Fish and Wildlife Service (FWS) estimated that 99 million acres of wetlands remained in the mid-1970's. The 1982 NRI counted 78.4 million acres of non-Federal wetlands
Table 1—Patented swamplands and remaining wetlands, 1849 and mid-1970'8
remaining in 1982. The 20.7-million-acre difference is partly wetlands in Federal ownership and partly additional losses of wetlands since the mid-1970's.
Estimates of federally owned wetlands are surpris- ingly difficult to obtain. The Fish and Wildlife Ser- vice controls 32 million acres of palustrine wetlands and 2 million acres of estuarine wetlands; however, only 5 million acres are in the continental United States, with the remaining majority in Alaska (43). Estimates of Federal wetland holdings collected by Dale Pierce of the Department of In- terior (table 2) show 12.5 million wetland acres under Federal ownership or lease in the lower 48 States. Without better data for Federal wetland acreage, however, no estimate of losses between the mid-1970's and 1980's is possible from these sources.
The various estimates of wetland acreage discussed here and in appendix 1 are summarized in figure 1. Rates of wetland conversion implied by the estimates vary widely from period to period. Be- tween 1850 and 1919, wetland conversion ranged from 193,000 to 1 million acres per year. Between 1919 and the mid-1950's, conversion slowed to a rate of 177,000 acres per year. An average of 460,000 acres of wetlands were lost each year be- tween the mid-1950's and the mid-1970's. No estimate of total Federal and non-Federal wetlands exists for 1982, so a conversion rate cannot be calculated.
The firmest conclusion that can be drawn from these data is that the highest rate of wetland loss since the turn of the century occurred in the 1960*8 and 1970's. Wetland conversion rates have probably been somewhat lower since the end of the 1970'8 [2Q), but there are few data to support this assertion.
Table 2—Estimated Federal wetland holdings, 1985
Agency
' Fewer than 100,000 acres. ^Wetlands given to States by congressional action. Not all
original wetlands were patented in all States Í38). »(13).
Fish and Wildlife Service^ Forest Service* National Park Service Bureau of Land Management Army Corps of Engineers Bureau of Reclamation Other agencies
Total
Wetlands
MiUion acres
5.0 2.9 1.9 1.4 1.0
.2
.1
excludes 29 million acres of Alaskan wetlands (43). excludes 9 million acres of Alaskan wetlands. Source: Dale Pierce, Dept. of Interior.
12.5
Location of Wetland Change Wetland Conversion for Agriculture
Loss of wetlands between the mid-1950's and mid-1970's was concentrated in the Southeast and Lower Mississippi (fig. 2). Louisiana and Missis- sippi lost more than 1.7 million acres of wetland each, Arkansas lost more than 1.5 million acres, and Florida lost more than 1.4 million acres of wetlands.
Wetland losses in the North Carolina pocosin area and in Minnesota's prairie pothole region were also substantial, with more than 500,000 acres lost in each. Wetland loss in these six States was primarily due to agricultural conversion.
Given the exploitive attitude toward natural resources that prevailed in the late 19th and early 20th centuries, it is not surprising that most interest in wetlands centered on their potential for conver- sion to "useful" purposes, mainly agriculture. Six surveys were conducted between 1906 and 1982 to assess, among other things, the agricultural poten- tial of remaining wetlands across the Nation (see app. 1). There was little attempt to use consistent wetland defintions or comprehensiveness of coverage in these inventories. Consequently, they provide little information for assessing long-term trends in wetland loss. They do, however, reflect changes in the perception of wetlands as a resource for potential conversion to farming.
Historical data on drainage have been developed for analysis of investments in natural resource capital [30). While drainage is often installed on land that is merely wet, not wetland, these data in- clude information on wetlands that have been converted.
Figure 3 shows the results of the six conversion potential assessments and Pavelis' data on installed drainage. These data allow comparison of conver- sion potentials perceived by Government officials and by farmers actually investing in drainage. Drainage potential is based on the six inventories and interpolated hnearly for 5-year intervals be- tween inventories, so it is comparable with the data on drainage installation.
Drained land increased dramatically during the first 20 years of the 20th century, leveled off during the
Figure 3
Inatallad and potantlal dralnaga, Unitad Stataa, 1905-80 Million acres
160
120
BO
40
V»^^ X^ Installed drainage
^T^ *S»^ Potential drainage^
*4
1900 1920 1940 1960 1980
Source: K13).
1/ InlorpolatMJ from 1907. 1919. 1946. 1958. 1967. 1977. and 1982 d«ta. Source- K2. f4. SO. Sr. 52. S3. S7\
agricultural depression and World War II, and then increased at a slowly declining rate in the postwar period. Estimates of remaining potential for agricultural drainage declined steadily as drainage was actually accomplished. Government assessments of drainage potential remained low in the 1960*s and early 1970's, reflecting USDA policy denying technical and financial assistance for drainage (9). However, drainage installation during this period increased, partly because of more op- timistic private assessments of drainage potential and partly because of drainage improvements on existing cropland.
More expansive assessments of drainage potential on new cropland in the mid-1970's were tempered by environmental activism, which gradually forced an awareness of the importance of wetlands for wildlife and fisheries. Low official estimates of wetlands suitable for drainage exclude all but the most favorable candidates. Even with the economic prospects faced by farmers today, private wetland owners may see potential profit in converting wetlands for farming. There are few barriers to pre- vent such conversion.
According to the National Wetlands Status and Trends Analysis (table 3), 87 percent of the 13.8 million acres of wetlands lost in the 1950's and 1960*s were converted to farmland (13). Virtually all of these were classed vegetated palustrine in the most recent Fish and Wildlife Service system (8). While some may have been converted directly to farmland, about half were originally forested and thus may have entered agricultural use after being cut for timber.
Table a^Sources and uses of converted wetlands, United SUtes, mid-1950's to mid-1970'8
Wetland system Use of land converted converted Agriculture |Urban| AU other 1 Total
Million acres
Palustrine: Vegetated-
Forested Emergent Scrub/shrub Subtotal
Nonvegetated Total
6.2 4.6 1.0
11.7 .1
11.8
0.4 0.2 .4 .3 .1 * .9 .6
.1 1.0 .7
6.8 5.3 1.1
13.3 .2
13.5
Lacustrine Estuarine Marine
.1 * 0
.2 * * *
.2
.2 *
Totals 12.0 1.1 .7 13.8
Remaining Wetlands
Several key characteristics of remaining non- Federal wetlands inventoried in the 1982 NRI (USDA Soil Conservation Service), put wetlands subject to agricultural conversion into perspective.
Characteristics of Remaining Wetlands
Most non-Federal wetlands are privately owned (table 4). States own about 13 percent of non- Federal wetlands. Almost all palustrine wetlands, those most likely to be farmed, are owned privately.
Remaining wetlands were classified by their land cover in the 1982 NRL Slightly more than half of all non-Federal wetlands inventoried are forested. Of these 42.7 million acres, about a third are in the oak-gum-cypress forest typical of southeastern wet hardwood forests, and about 15 percent each are in the oak-hickory and spruce-fir types of more north- ern wet woodlands. The swampbuster provision in the 1985 farm act applies to "converted wetlands" (Sec. 1201(4)(A). P.L. 99-198), implying that forested wetlands drained to permit timber harvest would be ineligible for farm programs if brought into crop production after removal of the timber. Hence, this sanction would apply to all wetlands converted in the history of agricultural development, regardless of past ownership or uses between conversion and crop production—an interpretation that would be hard to enforce. (For this analysis, the farm operator is assumed to clear the land for crop production.)
The second largest land cover category (20.9 per- cent) in which wetlands were classed in the 1982 NRI is "other lands," a residual category. About 17 percent of wetlands are in pasture and range. Only 5.6 percent of wetlands is in crops and all of this is palustrine wetlands.
Table 4—Ownership of non-Federal wetlands, 1982
Wetiand system^ Owner Palustrine 1 Other ¡Total non-Federal
Million acres
Private Government
State Local
Indian tribes
59.9
8.3 1.7
.8
5.4
2.1 .1 *
65.3
10.4 1.8
.8
Total 70.7 7,7 78.4
= Fewer than 100,000 acres. ^Detail may not add to total due to rounding. Source: National Wetland Status and Trends Analysis (13).
Fewer than 100.000. «Defined in (8). Source: 1982 National Resources Inventory. USDA Soil Conser-
vation Service.
The use of inventoried wetlands differs from their land cover (table 5). About 50 percent of wetlands are used for wood production, while 20 percent are used for agriculture. Seven percent of wetlands are designated for wild uses such as refuges and parks. More than 20 percent of wetlands are idle or could not be assigned a use, again indicating the residual nature of much wetland. Palustrine wetlands make up almost all the agricultural uses as well as all forest used for wood production (''wood produc- tion" means that no other specific use is designated for a forested wetland).
Farm Potential of Remaining Wetiands
Since the vast majority of wetlands converted to farming from the mid-1950's to the mid-1970's were palustrine, assessment of wetland conversion poten- tial can be restricted to that class. Almost all
Table 5—Use of non-Federal wetlands, 1982
Weüand system» Land use Palustrine | Other | Total
Million acres
Agriculture Crop production Grazing
14.4 4.1
10.3
0.5 0
.5
14.9 4.1
10.8
Wood production Designated wild« Urban uses' None of the above
40.3 4.2
.4 11.4
0 1.3
.1 5.8
40.3 5.5
.5 17.2
Total 70.7 IJ 78.4 »Deñned in (8). 'Includes areas designated wilderness, wildlife, recreation,
nature study, and research and experimentation. 'Includes commercial, industrial, institutional, transmission,
waste disposal, military, and transportation uses. Source: 1^2 National Resources Inventory, USDA Soil Conser-
vation Service.
wetlands (96 percent) inventoried in 1982 were palustrine (table 6). USDA restricts technical assistance for agricultural drainage to seasonally flooded basins or flats and inland fresh meadows, which are wetland types 1 and 2 in the classifica- tion of Circular 39 {5tí\, In 1982 about 44 percent of palustrine wetlands were wetland types 1 and 2. Thus, a total of 70.7 million acres of non-Federal wetlands could be converted to farmland, and 31.4 million acres would be eligible for USDA technical assistance for drainage.
Soil Conservation Service technicians conducting the 1982 NRI rated inventoried land on its potential for conversion to cropland and the type of effort re- quired for conversion, and listed reasons preventing conversion \^4\, Of 70.7 million acres of non- Federal palustrine wetlands, only 5.1 million acres were rated as having high or medium potential for conversion to cropland in 1982 (table 7). A quarter of all palustrine wetlands were either already cropland or in an irreversible use. Another quarter were rated as having no potential for conversion, and 40 percent were considered unlikely to be con- verted soon.
Almost 85 percent of high- and medium-potential palustrine wetlands (4.3 million acres) could be brought into crop production with no effort or with minor work on the farm. Slightly more than 3 million of the 4.3 million acres would require drainage. Some 470,000 wetland acres have other soil condi- tions, such as low fertility, high erosion potential, alkalinity or salinity, or restrictive root zones, in addition to wetness, that restrict their conversion potential.
Many areas that had large losses of wetlands due to agricultural conversion between the mid-1950's and
Table 6—Non-Federal wetlands cross-classified by system and type, 1082
Wetland type«
Not typed
Inland Coastal
Wetland Fresh Saline 9-10
Fresh 12-14
Saline 15-20 system^ 1-2 3-8 Total
Palustrine Lacustrine Riverine Estuarine Marine
Total non-Federal*
2.0 *
.1
.1 *
2.2
31.4 .2 .1 * *
31.7
35.7 .6 * .1
0
35.7
waUàoii acres
1.2 .6
0 .1
0
1.9
0.2 *
0 1.3 0
1.6
0.2 * *
4.4 *
4.6
70.7 1.5
.1 6.0
*
78.4
* « Fewer than 100,000 acres. «Defined in (8). «Defined in (38). «Detail may not add to totals due to rounding. Source: 1082 National Resources Inventory, USDA Soil Conservation Service.
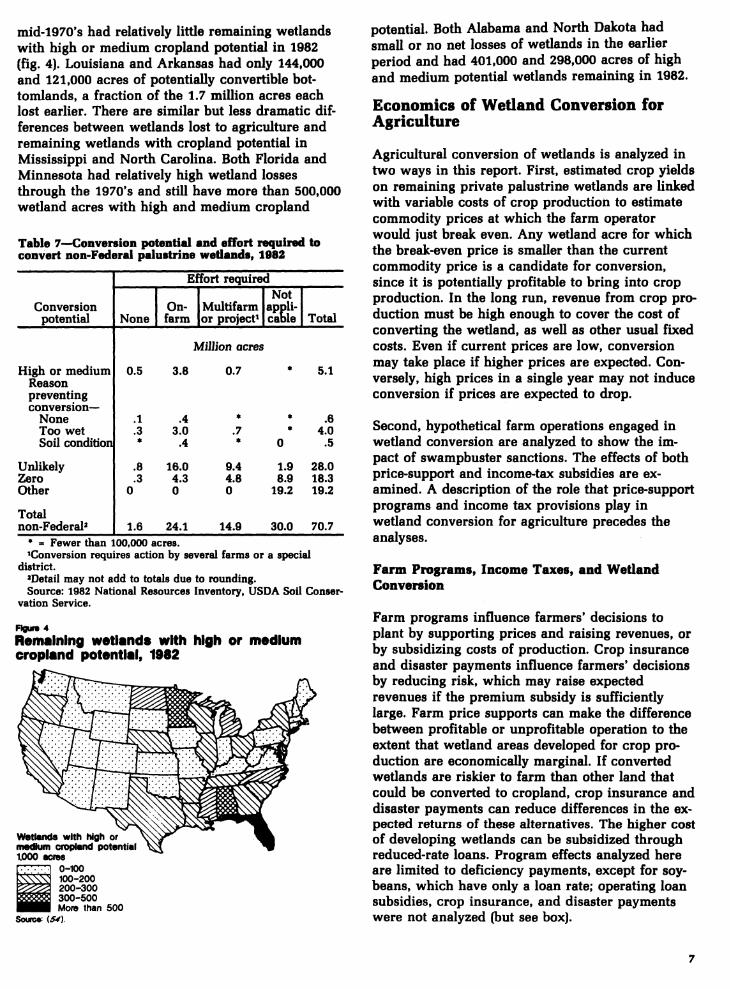
mid-1970's had relatively little remaining wetlands with high or medium cropland potential in 1982 (fig. 4). Louisiana and Arkansas had only 144,000 and 121,000 acres of potentially convertible bot- tomlands, a fraction of the 1.7 million acres each lost earlier. There are similar but less dramatic dif- ferences between wetlands lost to agriculture and remaining wetlands with cropland potential in Mississippi and North Carolina. Both Florida and Minnesota had relatively high wetland losses through the 1970's and still have more than 500,000 wetland acres with high and medium cropland
Table 7--Gonver8Íon potential and effort required to convert non-Federal palustrine wetlands, 1982
Effort required
Conversion potential None
On- farm
Multifarm or project*
Not
caole Total
Million acres
High or medium Reason preventing conversion—
None Too wet Soil condition
0.5
.1
.3 *
3.8
.4 3.0
.4
0.7
* .7 *
*
* *
0
5.1
.6 4.0
.5
Unlikely Zero Other
.8
.3 0
16.0 4.3 0
9.4 4.8 0
1.9 8.9
19.2
28.0 18.3 19.2
Total non-Federal' 1.6 24.1 14.9 30.0 70.7
* » Fewer than 100,000 acres. ^Conversion requires action by several farms or a special
district. 'Detail may not add to totals due to rounding. Source: 1982 National Resources Inventory, USDA Soil Conser-
vation Service.
Figuro 4
Remaining wetlands with high or medium cropland potential, 1982
Wetlands with Ngh or medluin cropland potential 1.000 acms
0-100 100-200 200-300
^^^ 300-500 ■■■ More than 500 Source: (^).
1 S
potential. Both Alabama and North Dakota had small or no net losses of wetlands in the earlier period and had 401,000 and 298,000 acres of high and medium potential wetlands remaining in 1982.
Economics of Wetland Conversion for Agriculture
Agricultural conversion of wetlands is analyzed in two ways in this report. First, estimated crop yields on remaining private palustrine wetlands are linked with variable costs of crop production to estimate commodity prices at which the farm operator would just break even. Any wetland acre for which the break-even price is smaller than the current commodity price is a candidate for conversion, since it is potentially profitable to bring into crop production. In the long run, revenue from crop pro- duction must be high enough to cover the cost of converting the wetland, as weU as other usual fixed costs. Even if current prices are low, conversion may take place if higher prices are expected. Con- versely, high prices in a single year may not induce conversion if prices are expected to drop.
Second, hypothetical farm operations engaged in wetland conversion are analyzed to show the im- pact of swampbuster sanctions. The effects of both price-support and income-tax subsidies are ex- amined. A description of the role that price-support programs and income tax provisions play in wetland conversion for agriculture precedes the analyses.
Farm Programs, Income Taxes, and Wetland Conversion
Farm programs influence farmers' decisions to plant by supporting prices and raising revenues, or by subsidizing costs of production. Crop insurance and disaster payments influence farmers* decisions by reducing risk, which may raise expected revenues if the premium subsidy is sufficiently large. Farm price supports can make the difference between profitable or unprofitable operation to the extent that wetland areas developed for crop pro- duction are economically marginal. If converted wetlands are riskier to farm than other land that could be converted to cropland, crop insurance and disaster payments can reduce differences in the ex- pected returns of these alternatives. The higher cost of developing wetlands can be subsidized through reduced-rate loans. Program effects analyzed here are limited to deficiency payments, except for soy- beans, which have only a loan rate; operating loan subsidies, crop insurance, and disaster payments were not analyzed (but see box).
Denying farm program benefits to operators con- verting wetlands would not be effective when market prices are high. Farm program benefits are more important to operators when commodity prices are low. Only 23 percent of total cropland was enrolled in farm programs in 1982, before com- modity prices dropped, but 56 percent of cropland was enrolled in 1984 [47),
Farm programs may not be important to many of the farmers who could convert wetlands. Only 27 percent of eUgible farms enrolled in the programs in 1984. Participation varies by crop, ranging from a low of 14.5 percent of eligible oat acreage to 87.5 percent of eligible rice acreage. Wheat and corn accounted for more than 75 percent of enrolled acreage. The extent of farm program participation by operators who have converted wetlands in the past, or who currently own wetlands that could be converted, is not known. Soybeans, one of the major crops for which wetlands have been con- verted, have no deficiency payment program, and recent loan rates have been well below market prices.
Other Farm Programs
Several farm programs do not directly support prices, but reduce costs or risks of crop produc- tion. Among these programs are subsidized in- terest rates on loans from the Farmers Home Administration (FmHA), crop insurance under the Federal Crop Insurance Corporation or its rein- surance programs, and Agricultural Stabilization and Conservation Service disaster payments.
Subsidized interest rates for FmHA operating loans in 1982 were 2.4 percentage points lower than unsubsidized rates, resulting in operating loan subsidies ranging from $0.16 to $3.57 per acre, depending on differences in operating capital between crops and regions. Farm ownership and storage facility loans, when available, affect the entire farm operation and cannot readily be iden- tifíed with newly converted cropland. Likewise, emergency loans, available only in designated disaster areas, cannot be directly associated with new cropland.
Although crop insurance is gradually replacing disaster payments, substantial payments were still being made in recent years. Disaster payments for cotton were as high as $16 per acre in Georgia and were $11 per acre in Texas (29), These pro- grams reduce risks associated with crop produc- tion, thereby raising the expected revenue from farming and providing an incentive to bring land into production.
It is not just farm program benefits, but also Federal income tax treatment of land development, that subsidize clearing and draining land for agriculture (see box). Other researchers have ana- lyzed tax subsidies for farmland development. Analysis of restrictions on use of cropland deduc- tions in the Internal Revenue Code shows that benefits are disproportionately available to larger operators (39). Thus, profitable farms, with suffi- cient net farm income to write off the maximum land-clearing expense and to deduct soil and water conservation expenses in fewer years, have greater incentives to convert land.
Watts, Bender, and Johnson (56) calculated the value of tax incentives for converting rangeland to cropland in Montana. They estimated that capital gains treatment and investment tax credits reduced the break-even resale price of plowed rangeland $27 to $85 per acre from the break-even price without such tax treatment. At low tax rates, investment credits were more valuable incentives than capital gains provisions, but at high tax rates capital gains treatment was worth three times as much as the in- vestment credit.
Leitch and Kerestes (21) studied land drainage costs and after-tax returns in Minnesota. Assuming a 40-percent tax bracket, tax savings on ditch drainage were estimated at $57 per acre, while credits and depreciation on tile drainage saved be- tween $68 and $93 per acre. These tax savings amounted to 18 percent for tile drainage and 40 percent for ditch drainage. The effect of capital gains was not estimated, and the tile was depreciated using straight-line methods over 8 years ratiier than accelerated cost recovery in 5 years; therefore, estimated tax incentives are probably low.
Barrows, Henneberry, and Schwartz (5) simulated wetland conversions for representative dairy and vegetable farms in southeastern Wisconsin. The 1981 tax returns for families with farm incomes of $6,000, $12,000, and $20,000 were calculated for least favorable, most favorable, and average condi- tions for drainage. Calculating after-tax net income for the first 3 years of the drainage investment, they showed that tax subsidies rise with increasing income, ranging from zero for the $6,000-income farmer to $23 per acre for the $20,000-income farmer. Tax incentives for drainage increased net income for unfavorable and average conditions more than for favorable situations, since higher taxes on incremental income from draining good land overshadowed benefits of the special provi- sions applying to wetland drainage. Capital gains were not considered and no attempt was made to
compute net present values of tax incentives; only year-by-year changes in tax liabilities were calculated.
Shabman {36) estimated tax savings of about 30 per- cent on conversion of Mississippi bottomland hard- woods. Reductions of 44 percent in annual cash flow requirements were estimated for a hypothetical operator in the 30-percent tax bracket. Since these calculations were based on tax law before the Tax Reform Act of 1981, they are probably conservative compared to treatment of property now handled under the accelerated cost recovery system.
According to an Internal Revenue Service (1RS) sample of 1982 returns, 2.5 percent of Schedule F filers claimed land clearing deductions averaging $1,060, and 3.9 percent claimed soil and water con- servation expenses averaging $1,065. It is not known how much of these amounts were for clear- ing and draining wetlands. More than half (53.5 per- cent) of the deductions were claimed by low-tax- bracket operators with less than $11,900 of taxable income. Only 5.1 percent of the deductions were claimed by operators with more than $500,000 of farm business receipts. Even less is known of non- farm taxpayers who might become involved in wetland conversion for farming. In 1982 about one- third of total deductions for land clearing and for soil and water conservation was claimed by Schedule F filers with more than $50,000 of off- farm income.
Tax reform may eliminate some tax breaks for land conversion. A tax reform bill passed by the House Ways and Means Committee in late 1985 repealed deductions for land clearing expenditures, tightened eligibility for soil and water conservation deduc- tions, and denied exclusion of capital gains from sales of converted wetland (6). However, these changes may not be included in final tax reform legislation.
Conversion Potential of Private Palustrine Wetlands
We derived estimated crop yields on privately owned palustrine wetlands identified in the 1982 NRI by linking Soil Conservation Service (SCS) soil interpretations with the NRI wetland points [49], SCS collects and analyzes data from research plots, field trials, and farmer's fields for use in soil inter- pretations. Estimated yields are established for benchmark soils based on review of yield data from all available sources, and are reviewed by all States in which the soil occurs. SCS records predicted crop yields approximating those obtained by
Income Taxes and Agricultural Land Use
Farmers who convert land for farming can reduce their income tax liability through deductions, credits, and capital gains. Some of these are limited to maximum amounts or percentages of in- come and also are subject to other restrictions. Specific provisions are:
• Deduction of land clearing costs up to $5,000 or 25 percent of net farm income (Section 182 of the Internal Revenue Code);
• Deduction of drainage and land shaping, con- strued as soil and water conservation activities, up to 25 percent of gross farm in- come, with amounts that exceed this limit in 1 year carried forward (Section 175);
• Deduction of depreciation under the ac- celerated cost recovery system (Section 168);
• Deduction of interest payments on debt financing of clearing and drainage (Section 163);
• Investment tax credit equal to 10 percent of depreciable investments associated with clear- ing and drainage (Section 46);
• Exclusion of 60 percent of long-term capital gains from sale of improved farmland (Section 1202).
Deductions for land clearing and for soil and water conservation reduce taxes in the current year in lieu of capitalizing those expenses, which would increase the taxable basis of the improved land. This deduction also has the effect of increas- ing the amount of long-term capital gain that will be realized on sale of the property; long-term capital gains are taxed at a lower rate than or- dinary income. Land clearing deductions cannot be claimed after the land is in production, and soil and water conservation deductions cannot be claimed for land that is not used for farming. In fact, the interpretation of these deductions is suffi- ciently broad that almost any activity that involves clearing vegetation, moving earth, or ditching can qualify for either one or the other section {55, Chapter 6).
The investment tax credit effectively reduces the cost of qualifying investments by one-tenth, if tax liabilities are higher than the credit allowed. Accelerated cost recovery allows the investment to be written off faster, increasing after-tax income in earlier years over true economic depreciation. Deducting interest effectively reduces the cost of financing land conversion investments by a percentage equal to the marginal tax rate, which can be as high as 50 percent.
leading commercial farmers at the level of manage- ment that tends to produce the highest economic returns per acre. This level of management involves using the best varieties; balancing plant populations and fertilizers to the potential of the soil; control- ling erosion, weeds, insects, and diseases; and
^ïâintaining optimum soil tilth and adequate drainage (49). Some soils have no estimated yields, or no yields estimated for certain crops, because crop production was not judged feasible on these soils given existing technology and economics. Costs of production by crop and by State are estimated in crop budgets developed by Economic Research Service (ERS) as part of the firm enter- prise data system (FEDS). FEDS budgets are based on data from periodic farm production expenditure surveys and are processed using a version of the Oklahoma State University budget generator [20). Variable costs include annual costs of seed, fer- tilizer, and chemicals, interest on operating capital, and costs of machinery fuel, repairs, and labor needed to plant and harvest a crop. They exclude fixed costs such as capital replacement, taxes, in- terest, and insurance on machinery and buildings, land charges, and general farm overhead. Budgets for nonirrigated and irrigated production of eight farm program crops (corn, soybeans, wheat, cotton, oats, barley, sorghum, and rice) at the technology and price levels of 1982 are used in this analysis.
We divided variable production costs by estimated yields to get the cost per unit of production. This cost represents the minimum price at which pro- ducing the particular crop just covers variable costs of the enterprise in the short run. Our analysis was limited to privately owned palustrine wetlands since these are the principal remaining wetlands vulnerable to farm conversion.
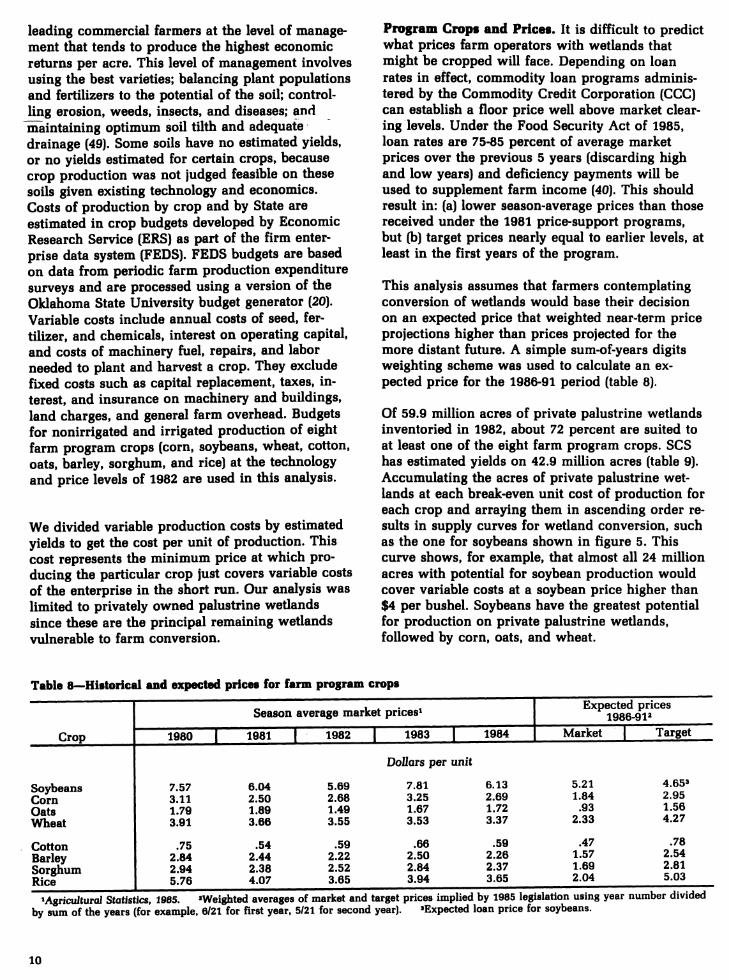
Program Crops and Prices. It is difficult to predict what prices farm operators with wetlands that might be cropped will face. Depending on loan rates in effect, commodity loan programs adminis- tered by the Commodity Credit Corporation (CCC) can establish a floor price well above market clear- ing levels. Under the Food Security Act of 1985, loan rates are 75-85 percent of average market prices over the previous 5 years (discarding high and low years) and deficiency payments will be used to supplement farm income (40), This should result in: (a) lower season-average prices than those received under the 1981 price-support programs, but (b) target prices nearly equal to earlier levels, at least in the first years of the program.
This analysis assumes that farmers contemplating conversion of wetlands would base their decision on an expected price that weighted near-term price projections higher than prices projected for the more distant future. A simple sum-of-years digits weighting scheme was used to calculate an ex- pected price for the 1986-91 period (table 8).
Of 59.9 million acres of private palustrine wetlands inventoried in 1982, about 72 percent are suited to at least one of the eight farm program crops. SCS has estimated yields on 42.9 million acres (table 9). Accumulating the acres of private palustrine wet- lands at each break-even unit cost of production for each crop and arraying them in ascending order re- sults in supply curves for wetland conversion, such as the one for soybeans shown in figure 5. This curve shows, for example, that almost all 24 million acres with potential for soybean production would cover variable costs at a soybean price higher than $4 per bushel. Soybeans have the greatest potential for production on private palustrine wetlands, followed by corn, oats, and wheat.
Table 8—Historical and expected prices for farm program crops
^AgricuJturai Statistics, 1985. ..».»u..»«. ..W.^QW» W. .-.-.. —o— r r « by sum of the years (for example, 6/21 for first year, 5/21 for second year). »Expected loan price for soybeans.
10
At 1982 season-average prices, almost all private palustrine wetlands for which estimated yields are available would have returned sufficient revenue to cover variable costs of production. About 4.4 million acres of these wetlands were used as cropland in 1982, while retaining their status as palustrine wetlands. Thus, 38 million acres could have been converted to cropland, depending on clearing and drainage costs and the availability of equally or more attractive potential cropland from nonwetland sources. This estimate is far larger than the 5.1 million acres of high- and medium-potential cropland inventoried by SCS and reported in table 6. However, the difference is not surprising since field assessments of cropland potential included in- formation on size, accessibility, and ownership fac- tors affecting conversion as well as drainage feasibility and expected yield. The effect of regulatory programs administered by State and Federal agencies can also reduce the economic feasibility of some wetland conversions. Some 21.6 million acres of wetlands in unfavorable land capability classes' VII and VIII were not rated for conversion potential, although more than 2.8 million acres of existing cropland are in these classes, and drainage would undoubtedly improve this land's agricultural capability. Also, lower assessments of wetland crop potential may, con- sciously or unconsciously, reflect USDA's policy restricting financial and technical assistance for drainage to palustrine wetlands in types 1 and 2.
At expected season-average prices, returns would cover variable costs of production for acreages of
'The land capability class system rates land's suitability for agricultural production.
Table 9—Remaining private palustrine wetlands feasible for production of program crops under expected prices, 1986-91
1982 wetlands Positive returns to variable with estimated
wetlands 59.9 na na na = Not available since some acres have estimated yields for
more than one crop. 'Detail does not add to total because some acres have estimated yields for more than one crop.
Source: 1982 National Resources Inventory, ÜSDA Soil Conser- vation Service.
each of the eight crops shown in the second col- umn of table 9. If all producers were to receive deficiency payments, from 25 to 115 percent more acreage would have returns exceeding variable costs. The exception is soybeans, for which defi- ciency payments are not available. Since the ex- pected loan price of $4.65 per bushel is lower than the expected season-average price, slightly fewer acres of soybeans could earn shortrun returns above variable costs at the loan price. Corn and oats would have the largest increases in acreage under price supports compared with season-average prices. For corn, the 7.2 million-acre increase is 62 percent of corn acreage that would earn shortrun returns above variable costs without price supports.
Price supports provide an incentive to bring wetlands into production. Feasible acreage without price supports ranges from 46 to 80 percent of acreage that could earn shortrun profits without price supports. However, the costs of conversion and the fixed costs which must be covered for longrun profitability are ignored. The additional revenue provided by deficiency payments is not likely to be sufficient to offset these costs. For soy- beans, probably the most important crop produced on converted wetlands, price supports under CCC loan operations are not likely to rise above market prices, providing no incentive for wetland conver- sion beyond their role in reducing producer risk.
Conversion Costs. The preceding analysis is both short run and applies at the margin. That is, we made no attempt to take account of the costs of
Rgura 6
Supply response curve on wetisnds for soybesns, 1982 Dollars per bushel 10
8 -
6 -
4 ^_J 2
. _ ._l 1 1 1 1 1
0 4
Source: K54).
8 12 16 Million acres
20 24 28
11
converting the wetland, or the costs of starting a farm by converting large tracts of wetland as the principal cropland in the enterprise. These factors are less important in an area such as the prairie pothole region, where isolated wetlands surrounded by existing cropland are relatively inexpensive to convert. Where large tracts are converted or where the costs of conversion are high, the short-term economic feasibility of cropping the marginal wetland acre matters less than the costs of conversion.
High costs of converting land to crop production are probably the principal barrier to conversion of most remaining wetlands. In a Minnesota survey of potential cropland owners, high cost was the most important obstacle to conversion listed by respond- ents [34). Conversion costs affect the financial feasibility of wetland conversion because they can be relatively large and are incurred at the begin- ning of land development, before offsetting revenues begin. Such costs are large enough to affect the economic feasibility of conversion if the sum of after-tax annualized conversion cost and acquisition cost exceeds the margin between variable production costs and gross revenues from crops (34).
Despite the importance of conversion costs, relatively little systematic information exists on a nationwide basis. The 1983 farm production expend- iture survey (FPES) gathered data on new con- struction expenses for land clearing, surface and subsurface drainage, leveling, and other land im- provements from a national sample of farm operators (10). Clearing expenses averaged $80 per acre, ranging from $42 in the Southern Plains to $267 in the Northeast. Drainage expenditures averaged $101 per acre, ranging from $21 in the Delta to $295 in the Southeast. However, since it is not possible to separate wetland conversions from clearing and drainage on nonwetland, these data probably understate the costs of clearing and drain- ing wetlands. Follow-on surveys to the 1978 USDA landownership survey gathered data on clearing and drainage investments undertaken between 1975 and 1977 [23, 24). Average clearing and drainage costs were $175 and $95 per acre, respectively, but these suffer from the same flaw as the FPES data.
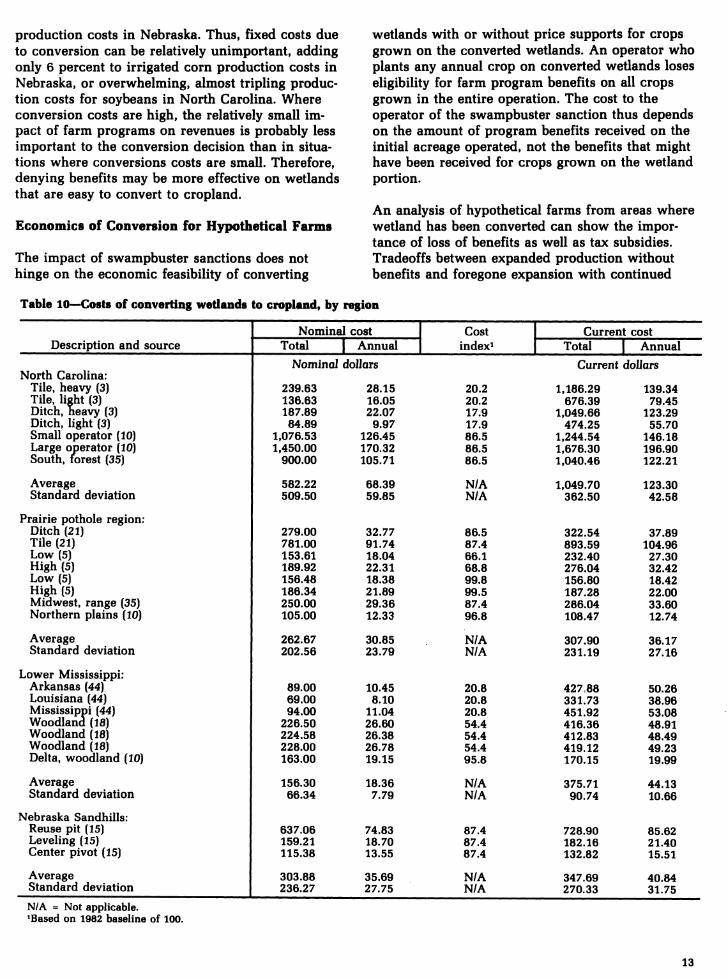
Economic studies of wetland conversion in several farming areas where loss of wetlands has been a concern are summarized in table 10. These studies are useful chiefly for revealing the wide variation in activities necessary to convert wetlands in dif- ferent areas, resulting in widely varying conversion costs. Conversion of pocosin wetlands in North
Carolina requires constructing drainage canals and pumping stations for outlets, as well as V-ditches to drain the fields. Clearing the forest and scrub vegetation requires heavy bulldozing, and removing roots and fallen logs takes several passes with custom-built root rakes. Newly cleared and drained pocosin land is organic and acid, requiring heavy liming and fertilizing to balance pH and restore trace minerals, and must be worked to condition the soil. Such conversions cost $1,000 to $1,500 per acre, even for large operations that can fully realize economies of scale.
In contrast, converting prairie pothole wetlands usually requires only drainage ditches. Costs are estimated at only $150 to $800 per acre, and can be as low as $14 per acre where operators do most of the work with their own machinery [22). Conver- sion of bottomland hardwood swamps in the Lower Mississippi superficially resembles conversion in the North Carolina pocosins. However, drainage outlets usually have been provided by public invest- ment in channelization and flood-control projects, eliminating the largest part of drainage expense (44). Clearing and root removal operations are either not as extensive or not done to the degree seen in North Carolina, resulting in lower land development costs. Soil amendment, apart from ordinary fertilization and liming included in crop production costs, is apparently not required [18). Consequently, conversion costs in this area are only $150 to $225 per acre, about 10 to 20 percent as high as in North Carolina and less expensive than some drainage in the prairie pothole area.
Converting land for crop production in the Rain- water basin and Sandhill areas of Nebraska is primarily a byproduct of irrigation development, which incidentally drains wetlands into reuse pits or lowers groundwater levels through pumping (15). Constructing reuse pits or dugouts and leveling for center pivot irrigation systems costs between $120 and $600 per acre, but no clearing or other ex- penses are incurred.
Amortized over 20 years at 10-percent interest, these conversion investments imply annual costs ranging from less than $20 per acre for ditch drainage of prairie pothole wetlands to $170 per acre for complete conversion of North Carolina pocosins (table 10). As a percentage of variable pro- duction costs, these annualized costs range from 75 to 186 percent of corn and soybean costs in North Carolina; from 15 to 150 percent of corn, soybean, and wheat costs in Minnesota; from 25 to 35 per- cent of soybean and wheat costs in Arkansas; and from 6 to 69 percent of irrigated corn and soybean
12
production costs in Nebraska. Thus, fixed costs due to conversion can be relatively unimportant, adding only 6 percent to irrigated corn production costs in Nebraska, or overwhelming, almost tripling produc- tion costs for soybeans in North Carolina. Where conversion costs are high, the relatively small im- pact of farm programs on revenues is probably less important to the conversion decision than in situa- tions where conversions costs are small. Therefore, denying benefits may be more effective on wetlands that are easy to convert to cropland.
Economics of Conversion for Hypothetical Farms
The impact of swampbuster sanctions does not hinge on the economic feasibility of converting
wetlands with or without price supports for crops grown on the converted wetlands. An operator who plants any annual crop on converted wetlands loses eligibility for farm program benefits on all crops grown in the entire operation. The cost to the operator of the swampbuster sanction thus depends on the amount of program benefits received on the initial acreage operated, not the benefits that might have been received for crops grown on the wetland portion.
An analysis of hypothetical farms from areas where wetland has been converted can show the impor- tance of loss of benefits as well as tax subsidies. Tradeoffs between expanded production without benefits and foregone expansion with continued
Table 10—Costs of converting wetlands to cropland, by region
Nominal cost Cost index^
Current cost Description and source Total 1 Annual Total 1 Annual
Nominal dollars Current dollars North Carolina:
Tile, heavy (3) 239.63 28.15 20.2 1.186.29 139.34 Tile, lifiht (3) Ditch, heavy (3)
Average 303.88 35.69 N/A 347.69 40.84 Standard deviation 236.27 27.75 N/A 270.33 31.75
N/A = Not applicable. ^Based on 1982 baseline of 100.
13
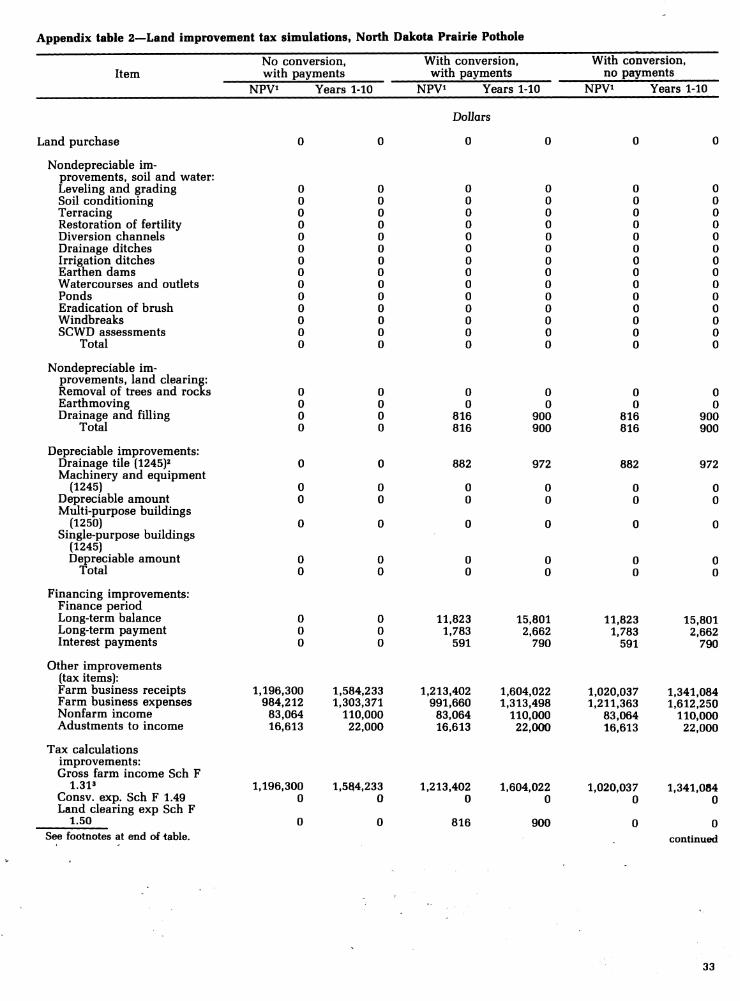
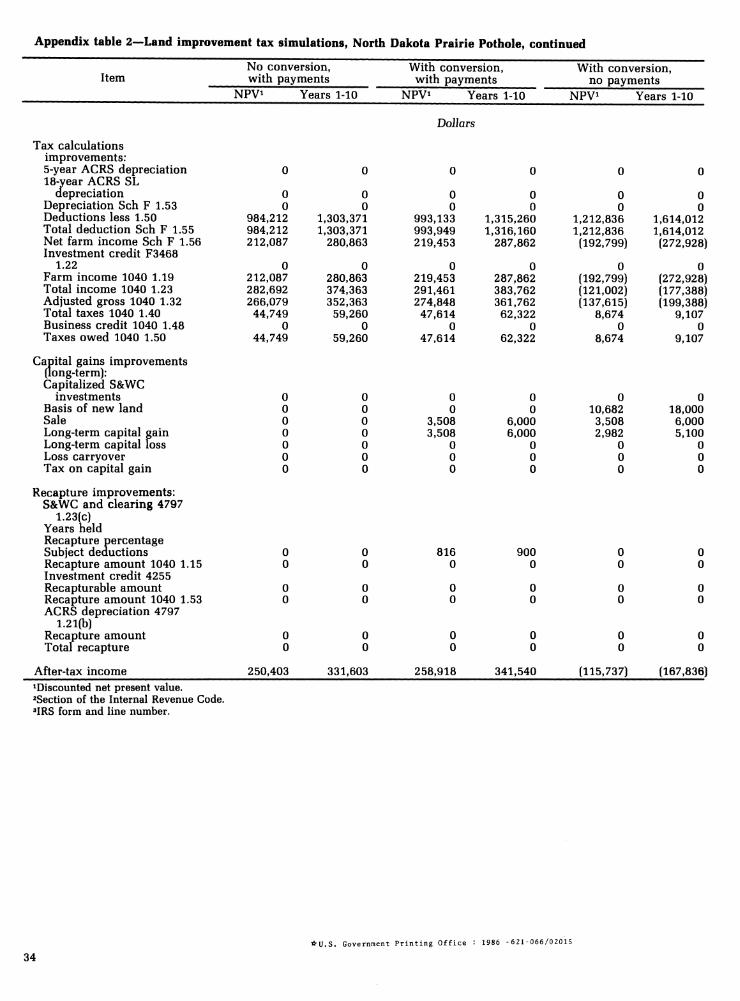
benefits and tax subsidies can also be analyzed. Two extremes are analyzed: a large-scale, expensive conversion of pocosin wetlands in North Carolina and a small, inexpensive conversion of prairie pothole wetlands in North Dakota.
Convertíng Pocosin Wetlands in North Carolina. Wetland conversion in this area is typified by large operations developed through previous wetland conversion (7). Expansion is continuing, with con- version in half-section or whole-section blocks in- volving costly excavation for V-ditches and canals and expensive pumping stations to remove drainage water. Much of the conversion has been done by corporate subsidiaries of large, nonfarm corpora- tions or foreign consortiums (32). Farm program participation in this area is low, with only 7.5 per- cent of North Carolina corn farmers and 20 percent of corn acreage base enrolled in 1984.
The farm analyzed here assumes a 1,000-acre cash grain operation growing corn and a soybean-wheat double-crop rotation. An individual tax return with substantial off-farm income ($100,000) is assumed. Revenue from the rotation, including deficiency payments, is $410 per acre; variable and fixed costs of production total $288 per acre.
A 320-acre wetland conversion is planned, with conversion costs of $1,979 per acre, partly financed out of nonfarm income, and production costs similar to those for existing cropland. Revenues on the newly drained land are $234 per acre in the first year of production and approach revenues from existing acreage in the third year as drainage becomes ^Uy effective. The conversion is assumed sold after 10 years, so that capital gains from ap-
preciation are included in the analysis. Details are presented in appendix 2.
Prospects for the conversion are considered in terms of the present value of projected revenue, cost, and taxes over the lO-year planning period, discounted at an assumed 5-percent real interest rate. Three situations are shown in table 11: the current situation without the conversion but with deficiency payments; with the conversion and defi- ciency payments; and with the conversion but with price supports denied to the whole operation under swampbuster sanctions.
Converting an additional 320 acres of wetland with deficiency payments increases the present value of farm cash income by 5.5 percent. Taxable net farm income drops because conversion costs are written off as land clearing and soil and water conservation investments, and because of interest on debt in- curred to undertake the conversion. Therefore, ad- justed gross taxable income drops by 35 percent and taxes decrease by the same percentage.
After-tax income is the sum of farm and nonfarm cash income, less taxes paid, and capital gains realized from sale of the conversion, less any debt remaining from the investment. After-tax income with the conversion and with deficiency payments is just equal to after-tax income before conversion if the 320 converted acres can be sold for $2,315 per acre at the end of 10 years.
The cost of swampbuster sanctions against wetland conversion can be estimated by comparing (a) the present value of the operation (with the conversion) with deficiency payments and (b) the value of the
Table 11—Discounted present value of wetland conversion with and without deficiency payments, North Carolina poGOsins*
Before conversion,
with payments
After conversion.
with payments
After conversion.
without payments
Change
Item From
conversion From loss
of payments
. 1 nnn /fnlf/rrr.» - Percent-
Farm receipts Farm expenses Cash income Nonfarm income
2,963 2.158
805 831
3,668 2.819
849 831
3.556 3,084
472 831
23.8 30.6
5.5 0
-3.0 9.4
-44.4 0
Adjusted gross Taxes owed Capital gain
1.386 538
0
895 346 309
520 252 309
-35.4 -35.7
N/A
-41.9 -27.2
0
After-tax income' 1.097 1.097 814 0 -25.8 N/A ' Not applicable. Conversion of 320 wetland acres on a 1.000 acre corn-soybean-wheat operation with deficiency payments, sold after 10 years and dis-
counted at 5 percent real interest rate. See text and appendix 2. 'Farm cash income plus nonfarm income plus capital gains less taxes owed and debt service on the conversion.
14
operation without deficiency payments. Without deficiency payments, farm receipts drop 3 percent, partly due to loss of the maximum $50,000 in payments. This loss is partly offset by revenue from planting 10 percent of total corn acres and 20 per- cent of total wheat acres set aside as a requirement for receipt of deficiency payments. Farm expenses increase by the cost of this extra planting, resulting in a 44-percent drop in farm cash income. The pre- sent value of net farm income for tax purposes is negative, so adjusted gross income falls 42 percent and taxes are reduced 27 percent. Overall, the pre- sent value of after-tax income is 26 percent lower without deficiency payments. Thus, the net present cost of the swampbuster sanction is $884 per acre converted, an amount likely to outweigh increased net returns at any conceivable yield level. The operation would be subject to increased risk without price supports and crop insurance, and possibly higher finance costs without subsidized loans, but those program benefits are not quantified in the analysis.
With up to $100,000 in annual nonfarm income in- vested in the conversion, reduced income taxes are worth $600 in net present value per acre converted, about one-third of the cost of acquisition and con- version. Tax reductions may well play a decisive role in turning economically unjustifiable wedand conversions into financially feasible propositions. For example, on North Carolina's Albermarle- Pamlico peninsula, three corporate farms acquired more than 400,000 acres and have been developing cropland since the mid-1970's (7, 32), These large operations are corporate subsidiaries with substan- tial nonfarm income from transportion, insurance, and foreign sources, so tax sheltering may be their primary motivation. The fact that much of the con- verted acreage is leased or sold to smaller, noncor- porate owners suggests that obtaining tax benefits from conversion, rather than income from farming, is their objective. Converted land is cash-leased for about $75 per acre or share-leased for fixed rates of 25 bushels of corn or 8 bushels of soybeans (equivalent to between $45 and $75 per acre). Capitalized at 10-percent interest, these lease rates imply land values of $450 to $750 per acre, less than half of the $1,579 acquisition and conversion cost. Hence, sheltering nonfarm income from taxes, with the expectation of long-term capital apprecia- tion, can subsidize wetland conversions for large corporate landowners. They can then pass the operation of converted land on to tenants at rates that are economically feasible for farming.
Converting Prairie Pothole Wetlands in North Dakota. Wetland conversion in North Dakota is
typified by small drainage projects to improve isolated, seasonally wet areas for more intensive crop use. Conversion costs are generally lower than for wooded wetlands such as the North Carolina pocosins, because the pothole area does not have to be cleared and requires less drainage. Farm pro- gram participation in this area is high, with 81 per- cent of wheat acreage base enrolled in 1984 by 73 percent of wheat farmers.
The farm analyzed here has 1,170 acres in wheat production, with variable and fixed production costs totaling $126.59 per acre. Wheat yields 35 bushels per acre when the area is drained. A 10-acre pothole area is drained at a cost of $187.20 per acre. To assess the effect of appreciation, we assume that the 10-acre conversion is sold after 10 years for $600 per acre. Details are shown in ap- pendix 2.
The discounted present value of 10 years' gross farm receipts from sale of wheat, with set-asides under the farm program, is about $1.2 million, and the conversion adds only $17,102 (table 12). The present value of farm cash income is increased only $9,654 and capital gains from sale of the conversion are worth $3,508. The present value of after-tax in- come increases $8,515 or $851 per acre converted. All of the increase is from deficiency payments on the converted acres and the increase is somewhat offset by a tax increase of $2,865.
Deficiency payments for wheat have been higher than for other crops. The expected season-average price for wheat assumed in this analysis is $2.87 per bushel, while the target price is $4.38 per bushel. If eligibility for deficiency payments on the entire 1,180 acres were lost under the swampbuster provisions, the present value of gross farm receipts would fall $193,365, or 16 percent. Annual net farm income would become negative and the present value of adjusted taxable gross income would drop 150 percent. After-tax income would fall $374,655, a loss that amounts to a penalty of almost $37,500 per wetland acre converted.
Comparing these two analyses shows that swamp- buster sanctions are likely to be more effective in the prairie pothole region than in the pocosin area for several reasons. First, the rate of farm program participation is higher on wheat farms in the prairie than on corn and soybean farms in eastern North Carolina. For program participants, defi- ciency payments on wheat farms are a larger percentage of net farm income than on corn and soybean farms. Wetlands in the prairie pothole area are small relative to total cropland acreage, so that
15
income gains from conversion are dwarfed by potential loss of benefits on nonwetland cropland. Finally, opportunities to shelter nonfarm income through tax breaks for conversion costs are small in the prairie pothole area, compared with potential tax breaks from the high clearing and drainage costs in the pocosins.
Indirect Motivations for Conversion
Conversion of wetlands for farming can be ex- pected if operators think conversion will be profit- able. However, conversion to crop production can occur indirectly, even though it may not be profitable.
Forestry and agriculture are often linked in wetland conversion. Timber harvest of wooded swamps may be the primary reason for some wetland destruc- tion, with agriculture a residual user of the newly cleared land. More than half of palustrine wetlands converted to agriculture between the 1950's and 1970*s were forested, but there is no information on how much of these wet forests were directly cleared for agriculture and how much went into agriculture after these wetlands had been cleared for timber. About 60 percent (42.6 million acres) of palustrine wetlands were forested in 1982.
Other wetlands are converted to remove obstacles to large-scale agriculture. The prairie pothole wetlands of the Dakotas and Minnesota are the primary example of this kind of conversion. Here, the value of the converted wetland for crop produc- tion is less important than removing an obstacle to straight-row farming or center-pivot irrigation
systems. Isolated wetlands within fields require more turns for machinery and form point rows and dead rows that cannot be planted or harvested; wetlands within fields also can restrict machinery choices to smaller, less economical sizes.
Many activities lower water tables, destroying wetlands and making agricultural conversion more attractive. Stream channelization for flood control, as occurred in the Central and Southern Florida Flood Control Project [42] and in the Lower Mississippi Alluvium [44), can increase flow rates and lead to lower water levels in nearby wetlands. Irrigation can lower water levels through pumping and through construction of dugouts as catchments for irrigation water.
These indirect modes of conversion will not be af- fected by swampbuster sanctions, since they may destroy wetlands well before the land is farmed.
Wetland Values Foregone From Conversion
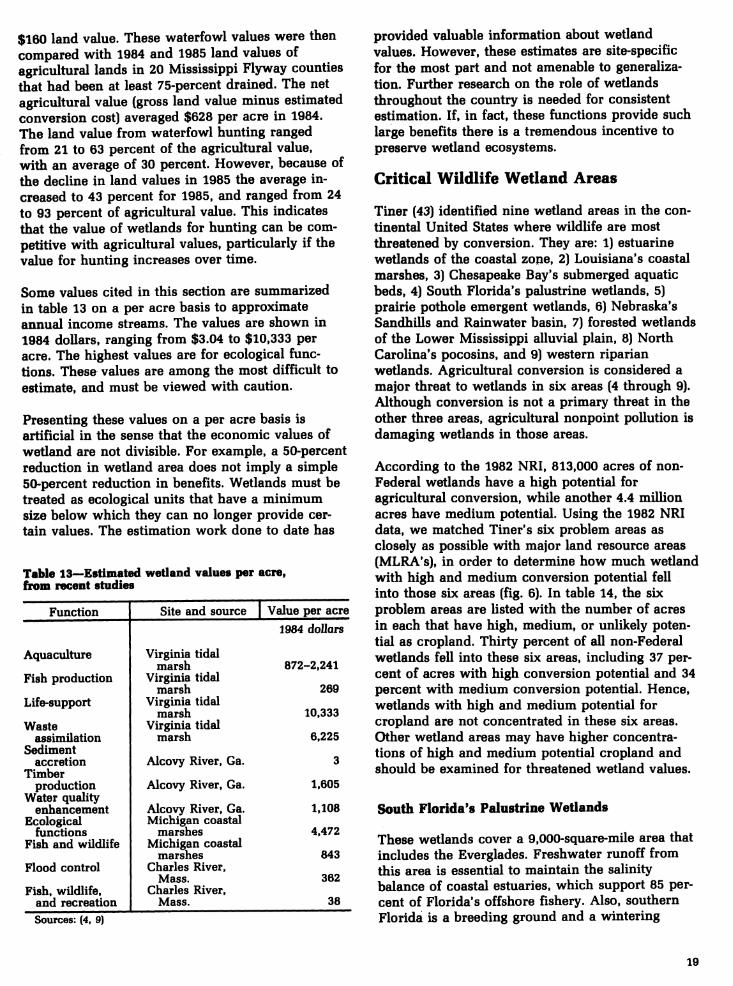
A variety of private and public benefits are lost when wetlands are drained. These highly produc- tive ecosystems are essential habitat for a variety of fish and wildlife species. They provide many ecological services and recreational opportunities, as well as producing renewable resources. For the most part, these benefits have not been measured in monetary terms because they are hard to estimate. Nevertheless, the values of wetlands are real and need to be recognized when conversion is possible. This section reviews values of wetlands and gives examples of monetary estimates.
Table 12—Discounted present value of wetland conversion with and without deficiency payments, North Dakota prairie potholes'
Item
Farm receipts Farm expenses Cash income Nonfarm income
Adjusted gross Taxes owed Capital gain
After-tax income*
Before conversion,
with payments
1.196,300 984,212 212,088
83,064
266,079 44,749
0
250,403
After conversion,
with payments
-DoUars-
1,213,402 991,660 221.742
83.064
274.848 47.614
3.508
258.918
After conversion.
without payments
Change From
conversion From loss
of payments
- Percent-
1.020.037 1,211.363 -191,326
83.064
-137.615 8.674 2.982
-115.737
1.4 .8
4.6 0
3.3 6.4
N/A
3.4
-15.9 23.9
-186.3 0
-150.1 -81.8 -15.0
-144.7 N/A = Not applicable. »Conversion of 10 wetland acres on a 1.170-acre wheat operation with deficiency payments, sold after 10 years and discounted at
5-percent real interest. See text and appendix 2. «Farm cash income plus nonfarm income plus capital gains less taxes owed and remaining debt on the conversion.
16
Fish and Wildlife Values
Estuarine wetlands play an important role in the life cycle of many fish species. Approximately two- thirds of the major U.S. commercial fish species spawn in estuaries and salt marshes [43], Fifty- seven percent of the 10 most important recreational marine fish species landed in 1979 also depended on estuaries [28). Inland freshwater wetlands are critical feeding, spawning, and nursery areas for several freshwater fish species. For example, marshes along Lake Michigan are used as spawning grounds by northern pike, yellow perch, and carp. Warmwater bass species use the southern bottom- land hardwood forests as nursery and feeding grounds [43).
The species most closely associated with wetlands are waterfowl. Waterfowl depend on wetlands in the north for breeding areas, with the prairie pothole region the most important breeding area in the lower 48 States. It has been estimated that 20 percent of the annual continental production of waterfowl occurs in wetlands in the lower 48 States (38). Wetlands of the Chesapeake Bay, the Gulf Coast, the Central Valley of California, and the Mississippi River are major wintering areas for waterfowl. Various wetlands are also used as stopovers on migration routes [28),
The 1985 census of duck populations indicates a potentially bleak future for waterfowl. The mallard population was at an all-time low of 5.5 million, a 47-percent decline from the first census figures in 1955. The sharpest decline occurred in the pintail population, which was down 69 percent from 1955. A variety of factors are blamed for these declines, including hunting pressure, disease, and biological stress. There is no debate, however, over the critical role of habitat loss, especially in the prairie pothole areas of Canada and the United States (33).
At least 50 fur-bearing and other game species, in addition to waterfowl species, depend on wetlands for food, cover, or water. Most fur bearers, such as muskrat, nutria, and mink, are wetland species. Hundreds of nongame species also depend on wetlands for feeding, breeding sites, and wintering sites. Herons, egrets, cranes, storks, and ibises are all wetland inhabitants. At least 35 endangered species in the United States are wetland species, mostly in California and the Southeast.
Only about 10 million acres of wetlands in the lower 48 States are protected through Federal ownership, easement, or lease. Four million of
those acres are in the National Wildlife Refuge System (28).
Ecological Values
Wetlands perform a variety of ecological services. For example, wetlands store flood waters and retard flood peaks. The ability of a wetland to reduce flooding depends on the size, topography, and location of the wetland relative to downstream areas, as well as the magnitude of the flooding. Evidence indicates that wetlands are more effective than terrestrial environments for storing flood waters. Comparisons of watersheds with wetlands and watersheds where wetlands have been drained show that wetlands are important for delaying the simultaneous arrival of flood peaks from tributary streams to main stem channels (1).
Wetlands improve water quality by trapping sus- pended sediments and remove nutrients, pesticides, and other toxic substances. Nutrient removal can control eutrophication, the explosive growth and decay cycle of algae, in adjacent waterbodies. Because of these capabilities, freshwater wetlands have been used to treat sewage effluent in some urban areas. However, the ability to remove sediments and adsorbed substances depends on the density of vegetation in the wetland. Wetlands do have a limited capacity to absorb such substances, and can be overloaded (43).
Wetlands have also been credited with both ground- water recharge and discharge. Except in certain regions (for example, cypress swamps and prairie potholes), wetlands seem to have no inherent char- acteristics for better recharge. However, data sug- gest that wetlands are more important as water dis- charge areas, and some can augment low flows (1).
A variety of other services have been attributed to wetlands. Wetland vegetation controls shoreline erosion. This is particularly important along coasts, where erosion can destroy public and private prop- erty, clog navigable waters, and degrade fish and wildlife habitat. Wetland plants are also efficient converters of solar energy, and provide food for a variety of species. Finally, it has been postulated that wetlands moderate local temperatures, and maintain regional precipitation and global at- mospheric stability (1).
Socioeconomic Values
In addition to the values described above, wetlands also yield other market and nonmarket benefits.
17
Marketable commodities other than fish, shellfish, and fur bearers include timber, grazing for livestock, cranberries, blueberries, wild rice, and peat. Besides their use for livestock grazing, wetlands can be used to grow hay for winter feed. However, the harvest of peat is not compatible with wetland preservation because it destroys the wetland.
Nonmarket values from wetlands are also numerous. Wetlands are popular sites for recreation activities such as birdwatching, water sports, hik- ing, picnicking, and photography. Wetland areas often have high aesthetic appeal. As scientific research areas, wetlands can be an important resource for learning about these unique ecosystems and their associated species. The diver- sity and uniqueness of some of these wetlands may make them important reservoirs of genetic diver- sity. Finally, wetlands have an option value for people who are willing to pay to preserve them for future use, and an existence value for people who are willing to pay simply for their continued presence.
Estimation of Economic Values
A number of studies have attempted to estimate the value of wetlands for various purposes. Although economic measurement techniques are well developed, a lack of data, as well as scanty informa- tion on the physical and ecological processes of wetlands, plague most studies. In a recent review of wetland valuation studies, Shabman and Batie {37) concluded that few studies have used conceptually valid techniques or considered key linkages be- tween weUand services provided and the wetland area studied. Therefore, the values reported here should be considered indicators, not exact estimates.
Wetlands are a critical factor in commercial fisheries. For the 15 most important commercial species of fish and shellfish harvested in 1980, 61 percent of dockside value was attributed to estuarine-dependent species, for a total value of more than $1 billion [28). A 1973 study of Virginia wetlands estimated that the annual potential benefits of the State's tidal marshes for fish produc- tion were $108 per acre, while the potential value for aquaculture ranged from $350 to $900 per acre (4). The total harvest value of unfinished mam- malian pelts in the 1979-80 season was $295 million; 32 percent of that value was from mink, muskrat, and nutria, three wetland species. In Loui- siana, 16,000 alligators were harvested in 1979 for a
total value of approximately $1.7 million [28], Pelts and skins acquire further value as they are used to make retail products such as coats and shoes. A final renewable resource of wetlands is timber. The estimated standing value of southern wetland forests alone is $8 billion [43], The value of the timber on the 2,300-acre wetland ecosystem of Georgia's Alcovy River was estimated at more than $1.5 million, or $686 per acre (9).
Ecological values also have been estimated in several studies. The value of the Alcovy River ecosystem for sediment accretion was estimated at $3,000 per year, and for water quality improvement at $1 million per year. Virginia tidal marshes were estimated to have a value of $2,500 per acre for waste assimilation and $4,150 per acre for total life support, which encompasses a variety of ecological functions (4). The Army Corps of Engineers estimated the flood control benefits of the Charles River Basin wetlands at more than $1.2 million per year (9). Finally, Michigan's coastal marshes were estimated to have a value of $2,600 per acre for ecological functions (4).
The benefits of wetlands for fish and wildlife and recreation were also estimated in two of the above studies. In the Charles River Basin, recreation and fish and wildlife benefits from the wetlands were estimated to be $124,800 per year (9). The Michigan coastal marshes were estimated to provide $490 per acre in recreation benefits and commercial fishing and trapping (4).
Two additional studies focused on the value of wetlands for waterfowl. Hammack and Brown [16] combined a population dynamics model with a recreation valuation study of waterfowl hunters in the Pacific flyway. They estimated a marginal value of $3.10 to $3.29 per bagged waterfowl. Miller and Hay {26) studied the relationship between habitat availability, hunter success, and hunting participa- tion in the Mississippi flyway. Using a consumer surplus value of $29 per day of waterfowl hunting, they estimated that the loss of 10 percent of water- fowl habitat in the flyway would result in an annual loss of recreation benefits of $17 million per year.
S wader and Pavelis {41) used the values from the two waterfowl studies to compare land values for agriculture to those for duck hunting. Using a 7.75-percent discount rate and a bag rate of 1.6 birds per acre, Hammack and Brown's marginal rate was translated into a capitalized land value of $220 per acre in 1984 dollars. The habitat value from Miller and Hay's study was capitalized into a
18
$160 land value. These waterfowl values were then compared with 1984 and 1985 land values of agricultural lands in 20 Mississippi Flyway counties that had been at least 75-percent drained. The net agricultural value (gross land value minus estimated conversion cost) averaged $628 per acre in 1984. The land value from waterfowl hunting ranged from 21 to 63 percent of the agricultural value, with an average of 30 percent. However, because of the decline in land values in 1985 the average in- creased to 43 percent for 1985, and ranged from 24 to 93 percent of agricultural value. This indicates that the value of wetlands for hunting can be com- petitive with agricultural values, particularly if the value for hunting increases over time.
Some values cited in this section are summarized in table 13 on a per acre basis to approximate annual income streams. The values are shown in 1984 dollars, ranging from $3.04 to $10,333 per acre. The highest values are for ecological func- tions. These values are among the most difficult to estimate, and must be viewed with caution.
Presenting these values on a per acre basis is artificial in the sense that the economic values of wetland are not divisible. For example, a 50-percent reduction in wetland area does not imply a simple 50-percent reduction in benefits. Wetlands must be treated as ecological units that have a minimum size below which they can no longer provide cer- tain values. The estimation work done to date has
Table 13—Estimated wetland values per acre, from recent studies
Function Site and source 1 Value per acre 1984 dollars
Fish, wüdlife, Charles River, and recreation Mass. 38 Sources: (4, 9)
provided valuable information about wetland values. However, these estimates are site-specific for the most part and not amenable to generaliza- tion. Further research on the role of wetlands throughout the country is needed for consistent estimation. If, in fact, these functions provide such large benefits there is a tremendous incentive to preserve wetland ecosystems.
Critical Wildlife Wetland Areas
Tiner [43) identified nine wetland areas in the con- tinental United States where wildlife are most threatened by conversion. They are: 1) estuarine wetlands of the coastal zone, 2) Louisiana's coastal marshes, 3) Chesapeake Bay's submerged aquatic beds, 4) South Florida's palustrine wetlands, 5) prairie pothole emergent wetlands, 6) Nebraska's Sandhills and Rainwater basin, 7) forested wetlands of the Lower Mississippi alluvial plain, 8) North Carolina's pocosins, and 9) western riparian wetlands. Agricultural conversion is considered a major threat to wetlands in six areas (4 through 9). Although conversion is not a primary threat in the other three areas, agricultural nonpoint pollution is damaging wetlands in those areas.
According to the 1982 NRI, 813,000 acres of non- Federal wetlands have a high potential for agricultural conversion, while another 4.4 million acres have medium potential. Using the 1982 NRI data, we matched Tiner's six problem areas as closely as possible with major land resource areas (MLRA's), in order to determine how much wetland with high and medium conversion potential fell into those six areas (fig. 6). In table 14, the six problem areas are listed with the number of acres in each that have high, medium, or unlikely poten- tial as cropland. Thirty percent of all non-Federal wetlands fell into these six areas, including 37 per- cent of acres with high conversion potential and 34 percent with medium conversion potential. Hence, wetlands with high and medium potential for cropland are not concentrated in these six areas. Other wetland areas may have higher concentra- tions of high and medium potential cropland and should be examined for threatened wetland values.
South Florida's Palustrine Wetlands
These wetlands cover a 9,000-square-mile area that includes the Everglades. Freshwater runoff from this area is essential to maintain the salinity balance of coastal estuaries, which support 85 per- cent of Florida's offshore fishery. Also, southern Florida is a breeding ground and a wintering
19
o Figure 6
Location of Critical Wetiand Areas
1. South Florida Palustrine Wetlands 2. Prairie Pothole Emergent Wetlands 3. Nebraska Sandhills and Rainwater Basin 4. Lower Mississippi Alluvial Plain 5. Coastal Pocosins 6. Western Riparian 7. Corn Belt States 8. Kentucky • Tennessee 9. Appalachia - Southern Piedmont
10. Southern Coastal Plain 11. Hudson River Valley 12. Northern Minnesota 13. Washington - Oregon 14. Lake States
ground for many species of birds, and provides habitat to several endangered species. Drainage of wetlands for farming and flood control were the major factors in past wetland conversions in the area. Extensive drainage created various ecological problems. Saltwater intrusion into pubUc drinking water supplies is a constant threat. The hydrologie regime of the Everglades has been disrupted, which threatens the biological integrity of the Everglades National Park.
Colonial bird breeding populations have dropped precipitously and fish nursery grounds have been disrupted. Scientists have also suggested that drain- ing wetlands for channelization of the Kissimmee River may have been responsible for a change in local rainfall, which has created droughts in recent years. These problems, combined with recognition of the natural values of the area, have led Florida to undertake restoration of the Kissimmee River and the Everglades to their natural state (43).
The total area in the two MLRA's used to approx- imate the south Florida area is almost 15 million acres, 1.5 million of which were cropped in 1982. The predominant land use was divided among pasture, range, and forest. A total of 4.5 million
acres of wetlands were on non-Federal land in these two areas. Only 62,000 of the wetland acres had high conversion potential, while 321,000 had medium potential.
Prairie Pothole Emergent Wetlands
The prairie pothole region is North America's most valuable waterfowl breeding ground. This 227,000-square-mile area of Canada and the United States produces between one-half and two-thirds of the ducks raised in North America, even though it comprises only 10 percent of all available duck nesting habitat. About one-quarter of the area lies in North Dakota (2.7 million acres). South Dakota (1.3 million acres), and Minnesota (1.5 million acres) [27). It has been estimated that half of the original wetlands are gone, mostly to farmland. Most ducks now breed on farm fields, not in isolated wilderness areas. In drought years, water- fowl are severely affected. Breeding habitat is lost when wetlands dry out; further, farmers can cultivate wetlands and can plow closer to remain- ing wetlands, removing valuable cover that water- fowl use as cover from predators [33], As more wetlands are drained, waterfowl are forced onto fewer and fewer remaining areas, which may lead
Table 14—Conversion potential of wetlands in critical problem areas, 1982
Western riparian MLRA's 11.17.28a,31,35.37.51 2 33 166 1.125 1.441
Total 302 1.504 8.053 9.454 23,676
Total non-Federal 813 4.371 28.467
Percent
25.986 78,384
Percent of non-Federal 37 34 28 36 30 includes wetland with no conversion potential and where conversion potential was not estimated
21
to decreased reproduction and increased likelihood of disease [43], Although the Federal Government has an acquisition and easement program in the area, approximately 90 percent of the wetlands are privately owned [27),
There are 93 million acres in the 10 MLRA's used to approximate the pothole region, including North Dakota, South Dakota, Minnesota, and parts of Montana and Iowa. The predominant use was cropland, which covered 63 million acres. There were 4.9 milhon acres of non-Federal wetlands in the 10 areas. Only 62,000 acres had high potential for conversion, but 2.5 million acres had medium conversion potential.
Nebraska's Sandhills and Rainwater Basin
These two areas in Nebraska are a critical migratory stopover for waterfowl in the central flyway and for sandhill cranes. Eighty percent of the Nation's sandhill cranes use the Sandhill region of the Platte and North Platte Rivers during spring migration, and the endangered whooping crane also migrates through the area. The Rainwater basin is a spring stopping ground for approximately 2.5 million ducks and geese. Drainage for agricultural production, filling for pivot irrigation, and lowered groundwater levels from irrigation pumping all have affected wetlands in this area. Upstream diver- sions of the Platte River have changed the vegeta- tion of the area and reduced the number of suitable roosting areas for sandhill cranes. The remaining roosting sites are more crowded, which increases the chance of disaster from weather or disease. There have already been outbreaks of avian cholera in the Rainwater basin area because of the water- fowl crowding on remaining wetlands (43). An estimated 1 million acres of wetland remain in the Sandhills, while only 14,000 to 24,000 acres remain in the Rainwater basin (15).
Three MLRA's totaling 26.5 million acres were used to approximate the Sandhill and Rainwater basin areas. Although 9.5 million acres were cropped in 1982, the predominant use was rangeland. Only 859,000 acres of non-Federal wetlands are found in the three areas; of that, 26,000 had high potential for conversion and 105,000 had medium potential.
Forested Wetlands of the Lower Mississippi Alluvial Plain
The wetlands of the Lower Mississippi are prime overwintering habitat for waterfowl, and provide
fish spawning and nursery grounds, flood storage, and water quality maintenance. About 80 percent of the original 24 million acres of wetlands are gone, leaving about 5.2 million acres. Agricultural conver- sion has been the predominant cause of conversion, with Federal flood control and small watershed pro- grams accelerating cropland conversion. Conver- sion threatens wildlife populations and also in- creases the frequency of damaging floods [43).
Two MLRA's were used to approximate the area, with a total acreage of 41 million acres. More than one-half (22 million acres) was in cropland in 1982, with the remainder largely in forest. Non-Federal wetlands in the two areas covered more than 4 million acres. Only 96,000 acres (2.4 percent) had high potenticd for conversion, while 302,000 had medium potential.
North Carolina's Pocosins
Conversion of North Carolina's pocosin wetlands through farming and forestry is a serious threat in the coastal plain. About 70 percent of the Nation's pocosins occur in North Carolina. They provide habitats for a variety of species, stabilize water quality, and balance salinity in coastal waters. Ap- proximately 1 million acres of pocosins remain. Major timber companies own about 44 percent of the State's pocosins, but large tracts are being transferred to agricultural corporations. Conversion of pocosins is generally limited to large-scale agriculture because of the large investments re- quired. The converted land creates runoff problems for adjacent estuaries. A more recent threat to the pocosins is peat mining [43).
It was not possible to isolate the North Carolina pocosins by MLRA. Therefore, we used coastal wetlands in two MLRA's that encompass the North Carolina pocosins as well as wetlands in South Carolina and Georgia, not all of which are pocosins. These two MLRA's cover almost 25 million acres in the three States. Only 4.7 million acres were in crops at the time of the 1982 inven- tory, with a majority still in forest. A total of 7.7 million acres of non-Federal wetlands were in these two areas, with 18,000 acres having high potenticd for conversion and 271,000 acres having medium potential.
Western Riparian Wetlands
Riparian wetlands are lands along the floodplains and the margins of ponds and lakes in arid and semiarid regions. These narrow strips of vegetation
22
are disproportionately important to wildlife, sup- porting a great variety of species. The riparian wetlands form an integrated system with adjacent uplands, and are therefore difficult to distinguish; together, the two ecosystems provide food and cover to both resident and migratory species. Crop conversion, overgrazing, dam construction, and groundwater pumping have altered, severely damaged, or destroyed riparian wetlands to the point where they are considered the most modified land type in the West. For example, 44 percent of cottonwood communities along the Colorado River in Arizona have been lost and 98 percent of the original riparian forest along California's Sacra- mento River is gone. Remaining riparian lands suf- fer from poor water quality and reduced stream- flows (43).
Western riparian areas are difficult to approximate with MLRA's because they occur along rivers in Arizona, New Mexico, Utah, Nevada, Colorado, California, Oregon, and Washington. Seven MLRA*s were used to capture riparian wetlands, with a total of 45 million acres. In 1982, the predominant land
use was rangeland, with 11 miUion acres in cropland. Wetlands in the seven areas covered 1.4 million acres. Only 2,000 acres had high potential for conversion, and 33,000 had medium potential.
Other Problem Areas for Conversion
Since only one-third of wetlands with high cropland conversion potential were captured in the six problem areas, we identified all other MLRA's with substantial wetlands of high and medium potential. Eight such areas are listed in table 15 and shown in figure 6. These areas, concentrated in the Southeast and the Corn Beh, contain an additional 20.8 million acres of wetlands, including 45 percent of high conversion potential acres and 29 percent of medium conversion potential acres. Taken together, the first six problem areas and these eight areas include 57 percent of non-Federal wetland acres, and capture 82 percent of all wetlands with high conversion potential.
Several of the additional eight areas are considered important for waterfowl: Puget Sound, the Hudson
Table IS^Conversion potential of other wetland problem areas, 1982
Area
Corn Belt States MLRA's 111,112-115, 139
Kentucky-Tennessee MLRA's 120-124
High I Medium | Unlikely | Qther^ | Total
63
49
Appalachia/Southern Piedmont MLRA's 128, 136 57
Southern Coastal Plain MLRA's 133a, 135 123
Hudson River Valley MLRA 144a 9
Northern Minnesota MLRA 88 13
Washington-Oregon MLRA 2 19
Lake States MLRA's 95a, 95b. 98 32
Total 365
Total non-Federal 813
Percent of non-Federal 45
1,000 acres
169 500 556 1,471
86 163 181 551
228 1,073 139 1.810
509 4,762 1,080 9.328
30 472 480 1,317
52 644 1.728 3.449
55 121 84 335
138 1.418 378 2,520
1.267 9,153 4,626 20,781
4,371 28,467
Percent
25,986 78.384
29 32 18 27 »Includes wetland with no conversion potential and where conversion potential was not estimated.
23
River Valley, and the Lake States of Michigan and Wisconsin. The area in Northern Minnesota is next to the prairie pothole region. In the Corn Belt States and the Kentucky-Tennessee area, wetlands comprise only about 2 percent of all land. These remnant areas may be critically important for re- maining wetland-dependent wildlife. Cropland was the predominant land use only in the Corn Belt States and the Lake States in 1982. In the Kentucky- Tennessee area, a combination of forest, pasture, and range dominated; in the other areas, the major land use was forest.
Conclusions and Policy Implications
The analyses in this report support three major conclusions about agricultural conversion of wetlands. First, conversion to farmland was the leading cause of wetland loss between the 1950's and 1970's, responsible for 87 percent of a 13.8-million-acre net loss in wetlands. Of 78.4 million non-Federal wetland acres remaining in 1982, 59.9 million were privately owned and subject to agricultural conversion. Of that, some 42.9 million acres could probably be farmed if con- verted. However, high conversion costs and other obstacles limit the number of wetland acres with high and medium cropland potential to only 5.1 million.
Second, wetlands are sufficiently productive, if cleared and drained, to make an operating profit under expected season-average market prices for Government program crops. However, relatively few additional acres would be profitable to crop with deficiency payments from price support pro- grams. The Internal Revenue Code provides income tax subsidies for wetland conversion in amounts that vary with the tax bracket of the operator. Together, price supports and tax subsidies help off- set high clearing and drainage costs, which are the principal obstacles to wetland conversion.
Third, although agricultural conversion is economically feasible for some wetlands, analysis of wetland values suggests that, in many cases, the social benefits from intact wetlands exceed the potential private returns. Further, the social benefits of draining wetlands to expand cropland are likely to be zero or negative if current crop surpluses con- tinue. Despite that, agricultural conversion for private benefit is a major threat to wetlands in six of nine nationally recognized critical wetland prob- lem areas. The six areas, and eight other wetland problem areas, accounted for 57 percent of wetlands in 1982. These 14 problem areas had 82
percent of the wetlands judged to have high poten- tial for conversion to cropland, and 63 percent of the medium-potential wetlands. Since 85 percent of these areas could be converted without major effort, Federal and State regulatory programs are not likely to prevent their conversion.
Denying farm program benefits to operators grow- ing program crops on converted wetlands will discourage conversion to the extent that benefits offset fixed costs of clearing and draining. However, important conversion incentives will re- main in the form of tax deductions for clearing and drainage investments. Tax subsidies may be more important for high-bracket operators, who may be less concerned with price supports. Nonetheless, regardless of swampbuster sanctions or income tax reforms, some kinds of wetland conversion will probably continue. These include harvesting timber, removing nuisance wetlands in existing fields, and lowering water tables through irrigation pumping and flood-control channelization.
Enforcement of swampbuster sanctions will be dif- ficult for a number of reasons. For example, identi- fying wetlands has been a rather subjective under- taking on which even experts have disagreed. The hydric soils definition of wetlands, jointly arrived at by the U.S. Fish and Wildlife Service and USDA, does remove much of the arbitrary character of wetland determination. However, the exact list of hydric soils and hydrophytic vegetation to include in the definition must still be refined.
The 1985 legislation defines "converted wetland" as land converted from wetland at any time in the past. Hence operators who had not cropped con- verted wetland between 1981 and 1985 would lose farm program eligibility, even if they had not car- ried out the conversion themselves. Conceivably, lands mapped as hydric soils that had been cleared and drained long before for timber production or other purposes would, if cropped by a subsequent owner, be denied farm program benefits.
An operator subject to the swampbuster sanctions loses eligibility for farm programs on all land farmed, not just converted wetland. This feature creates a more powerful sanction than if eligibility were denied for converted wetland alone, but also sets up incentives for evasion. Small operators con- templating a conversion that will marginally in- crease their cropland, as is typical of conversions in the prairie pothole region, probably would be deterred by threatened loss of all program benefits on their remaining acreage. However, larger cor-
24
porate operations based predominately on con- verted wetland have the means and incentive to divide their holdings into two parts: a "white-hat" operation, with previously converted and cropped land eligible for farm programs, and a "black-hat" operation, which would continue to convert and farm wetlands outside the price-support programs. Such legal evasions may blunt the effectiveness of the swampbuster provisions, and they may be prac- ticed by precisely the operators who convert the most wetland.
Finally, the essential weakness of any provisions linked to denial of farm program benefits is that relatively few operators currently participate in farm programs. Data for 1978 show that only 35 percent of farms participated in farm programs, and they accounted for only 53 percent of normal crop acreage (19). In 1982, only 23 percent of total cropland was enrolled in commodity programs (31). Participation in 1984 was higher, at 56 percent of base acreage [47), Participation by wetland con- verters is not known, but may be lower than average since crop histories may not yet have been established on converted land.
Despite these problems, denying farm program benefits for converted wetlands may well reduce the economic incentive to clear and drain such land. The swampbuster provision should at least en- sure greater consistency between USDA resource protection and commodity support programs.
References
1. Adamus, P. R., and L. T. Stockwell. A Method for Wetland Functional Assessment: Volume I. U.S. Dept. Trans., Fed. Highway Adm., 1983.
2. American Society of Agricultural Engineers, Drainage Committee. Problems and Needs in Agricultural Drainage, Report... 1945-1946. St. Joseph, MI, 1946.
3. Anderson, J. R., and H. W. Dill, Jr. Land Clear- ing and Drainage in Eastern North Carolina. ARS 43-127. U.S. Dept. Agr., Agr. Res. Serv., Jan. 1961.
4. Bardecki, M. J. "What Value Wetíands?," Journal of Soil and Water Conservation, Vol. 39, No. 3, (May-June 1984), pp. 166-169.
5. Barrows, R., D. Henneberry, and S. Schwartz. "Individual Economic Incentives, the Tax System and Wetland Protection Policy: A
Study of Returns to Wetland Drainage in Southeastern Wisconsin." Paper No. 82-2074, presented at American Society of Agricultural Engineers summer meetings, Univ. of Wisconsin-Madison, June 27-30, 1982.
6. Bureau of National Affairs. Daily Tax Report. No. 208, (Oct. 28, 1985), p. G-8.
7. Carter, L. J. "Agriculture: A New Frontier in Coastal North Carolina," Science, Vol. 189 Quly 25, 1975), pp. 271-5.
8. Cowardin, L. M., and others. Classi/ication of Wetlands and Deepwater Habitats of the United States. FWS/OBS-79/31. U.S. Fish and Wildlife Serv., Dec. 1979.
9. Council on Environmental Quality. Our Nation's Wetlands—An Interagency Task Force Report. U.S. Government Printing Office, 1978.
10. Daugherty, A. B., personal communication, Nov. 30, 1984.
11. Dideriksen, R. I., A. R. Hidlebaugh, and K. O. Schmude. Potential Cropland Study. SB-578. U.S. Dept. Agr.. Soil Cons. Serv., Oct. 1977.
12. Fischer, V., and others. A Survey of the Public's Attitudes Toward Soil, Water, and Renewable Resources Conservation Policy. Study No. 792802. New York: Louis Harris and Associates, 1980.
13. Frayer, W. E., and others. Status and Trends of Wetlands and Deepwater Habitats in the Coter- minous United States, Í950's to 1970's. Col- orado State Univ., Dept. of Forest and Wood Sciences, Apr. 1983.
14. Gray, L. C, and others. "Utilization of Our Lands for Crops, Pasture, and Forests." Agriculture Yearbook 1923. U.S. Dept. Agr., 1924, pp. 415-506.
15. Great Plains Office of Policy Analysis. Wetland Trends and Protection Programs in Nebraska. Univ. of Nebraska, Sept. 1982.
16. Hammack, J., and G. M. Brown, Waterfowl and Wetlands; Towards Bioeconomic Analysis. Baltimore: Johns Hopkins Univ. Press, 1974.
17. Heimlich, R. E. Sodbusting: Land Use and Farm Programs. AER-536. U.S. Dept. Agr., Econ. Res. Serv., June 1985.
25
18. Herrington. B. E. and R. N. Shulstad. "Conver- sion of Delta Woodland and Pasture to Cropland: Economic Feasibility and Implica- tions." Agr. Exp. Sta. Bull. 858. Univ. of Arkansas-Fayetteville, Dept. of Agr. Econ., Mar. 1982.
19. Johnson J. D., and S. D. Short. "Commodity Programs: Who Has Received the Benefits?" Presented at American Agricultural Economics Association annual meeting, West Lafayette, IN. Aug. 1983.
20. Krenz, R. D. "The USDA-ERS Firm Enterprise Data System: Capabilities and Applications." Southern Journal of Agricuituroi Economics. Vol. 7. No. 1 (1975). pp. 33-38.
21. Leitch. |. A., and D. Kerestes. "Agricultural Land Drainage Costs and Returns in Min- nesota." Staff Paper P81-15. Univ. of Minnesota-St. Paul. Dept. of Agr. and Applied Econ.. Sept. 1981.
22. Leitch. J. A., and D. F. Scott. "Economic Im- pact of Flooding on Agricultural Production in Northeast Central North Dakota." Agr. Econ. Rpt. No. 120. North Dakota State Univ. Fargo. Dept. of Agr. Econ.. 1977.
23. Lewis. D. "Land Drainage Investment Survey. 1975-77—A Report on a Landownership Follow-on Survey." Staff Report AGES820525. U.S. Dept. Agr.. Econ. Res. Serv.. June 1982.
24. Lewis. D. "Land Clearing Investment Survey. 1975-77—A Report on a Landownership Follow-on Survey." Staff Report AGES820728. U.S. Dept. Agr.. Econ. Res. Serv.. Aug. 1982.
25. Martin. A. C. and others. Classification of Wetlands of the United States. Spec. Sei. Rep.- Wildlife 20. U.S. Fish and Wildlife Serv., 1953.
26. Miller, J. R.. and M. J. Hay. "Determinants of Hunter Participation: Duck Hunting in the Mississippi Flyway." American Journal of Agricultural Economics, Vol. 63. No. 4. Nov. 1981, pp. 677-684.
27. Nelson, W. C, and others. Wetlands in the Prairie Pothole Region of Minnesota, North Dakota, and South Dakota: Trends and Issues. North Dakota State Univ., Aug. 1982.
28. Office of Technology Assessment. Wetlands: Their Use and Regulation. OTA-O-206. U.S. Congress, Mar. 1984.
29. Ogg. C. W. "Cross-compliance Proposals and Fragile Croplands." Presented at American Agricultural Economics Association annual meetings. West Lafayette. IN, Aug. 1983.
30. Pavelis. G. A. "Natural Resource Formation in American Agriculture: Irrigation, Drainage, and Conservation. 1855-1980." Staff Report AGES850725. U.S. Dept. Agr., Econ. Res. Serv., Sept. 1985.
31. Reichelderfer, K. H. Do USDA Farm Program Participants Contribute to Soil Erosion? AER-532. U.S. Dept. Agr., Econ. Res. Serv.. Apr. 1985.
32. Richardson. C. }.. and }. P. Royer. Wetland Trends and PoUcies in North Carolina and South Carolina. OTA Case Study 233-4550. Duke Univ.. School of Forestry and En- vironmental Studtes. Durham, N.C. Augi 1082.
33. Robertson. P. "The Truth About Ducks." Sport- ing Classics. Vol. 4, No. 4, (Aug. 1985), pp. 68-77.
34. Russell, C. R.. and W. B. Sundquist. "Land- owner Factors in Developing New Cropland in Minnesota." Minnesota Agricultural Economist No. 646. Qune 1984).
35. Schenarts. T. N. "Dynamics of Agricultural Land Use Change." Agricultural Land Availability: Papers on the Supply and Demand for Agricultural Lands in the United States. Prepared for the Committee on Agriculture. Nutrition, and Forestry, U.S. Senate. July 1981.
36. Shabman. L. A. "Economic Incentives for Bot- tomland Conversion: The Role of Public Policy and Programs." Transactions of Forty-Fifth North American Wildlife and Natural Resources Conference, 1980.
37. Shabman. L. A., and S. S. Batie. "Socioeconomic Functions and Values of Wetlands: A State-of-the-Art Review." U.S. Army Corps of Engineers, Vicksburg, MS, Nov. 1985 (working draft).
38. Shaw, S. P., and C. G. Fredine. Wetlands of the United States: Their Extent and Their Value to Waterfowl and Other Wüdlife. Circular 39. U.S. Fish and Wildlife Serv., U.S. Dept. Int., 1956.
39. Student Note. "Taxation Affecting AgricuUural Land Use," Iowa Law Review. Vol. 50 (1965). pp. 600-618.
26
40.
41.
42.
43.
44.
45.
46.
47.
Stucker, B. C, and K. }. Collins. The Food Security Ad of 1985; Major Pro visions Affecting Commodities. AIB-497. U.S. Dept. Agr., Econ. Res. Serv., Jan. 1986.
Swader, F., and G. A. Pavelis. "Drainage Challenges and Opportunities," in Farm Drainage in the United States: History, Status, and Prospects. U.S. Dept. of Agr., Econ. Res. Serv. (in process).
Thompson, R. ''America's Disappearing Wetlands," Congressional Quarterly Editorial Research Reports, Aug. 19, 1983, pp. 615-631.
Tiner, R. W., Jr. Wetlands of the United States: Current Status and Recent Trends. National Wetlands Inventory, U.S. Fish and Wildlife Serv., Mar. 1984.
Toon, T. G. "Factors Affecting Land Use Change in the Lower Mississippi Alluvium." Unpublished manuscript. U.S. Dept. Agr., Econ. Res. Serv., 1976.
U.S. Department of Agriculture. Soil and Water Resources Conservation Act, 1980 Appraisal. Parts I and II, 1980.
, Econ. Res. Serv. Agricultural Outlook.
49.
50.
51.
52.
53.
54.
National Soils Handbook. Part 603,
June 1985.
, Office of Information. "Final Acreage Reduction Report Shows 57 Million Acres Wheat Signed Up." News Release 519-84. May 15, 1984.
Application of Soil Information, pp. 603-i—603-222. July 1983.
. "Conservation Memorandum-15," May 5, 1975.
Basic Statistics of the National Inven- tory of Soil and Water Conservation Needs. SB-317. Aug. 1962.
Basic Statistics—National Inventory of Soil and Water Conservation Needs, 1967. SB-461, Jan. 1971.
. Basic Statistics, 1977 National Resources Inventory. SB-686. Dec. 1982.
, and Iowa State University Statistical Laboratory "National Resources Inventory—A Guide for Users of 1982 NRI Data Files." Un- published manuscript. Oct. 1984.
55. U.S. Dept. of the Treasury, Internal Revenue Service. Farmer's Tax Guide. Pub. No. 225, 1984.
56. Watts, M. J., L. D. Bender, and J. B. Johnson. "Economic Incentives for Converting Rangeland to Cropland." Bull. 1302. Montana State Univ.-Bozeman, Coop. Ext. Serv., Nov. 1983.
48. , Soil Conservation Service. Soils-Hydric Soils of the United States. National Bulletin No. 430-6-3. Nov. 12, 1985.
57. Wright, J. O. Swamp and Over/lowed Land in the United States. Circular 76. U.S. Dept. Agr., 1907.
27
Appendix 1—Wetland Data
Early wetland inventories treated all wetlands the same, describing the object of their investigations with such terms as ''swamp and overflowed lands" [57). Scientific inventories by the U.S. Fish and Wildlife Service used two similar but distinct wetland classification systems based on charac- teristics of the land, water, and formation of wetlands. A third definition of wetlands, developed by an interagency committee, is based on the com- bination of soil properties and vegetation.
Classification
The classification used in the first Fish and Wildlife survey (1954), commonly called the Circular 39 classification, distinguished between coastal and in- land areas of fresh and saline wetlands. Within these four broad categories, 20 wetland types were classified on the basis of water depth and vegeta- tion [25],
For the National Wetland Status and Trends Analysis [13)^ a new classification system was designed to rectify problems with the older system. In particular, the Circular 39 system ignored ecologically important differences in wetlands and grouped together dissimilar wildlife habitats that are geographically separated. Also, the system was inadequately defined, leading to inconsistencies in application. The NWSTA classification includes both wetlands and deepwater habitats, grouping them in a hierarchical structure on the basis of hydrologie, géomorphologie, chemical, and biological factors. Five major systems form the first level in the hierarchy. These are further subdivided into subsystems based on degree of inundation, classes, subclasses, and dominance types (8).
The National Technical Committee for Hydric Soils, made up of representatives from the Soil Conserva- tion Service, the Fish and Wildlife Service, Army Corps of Engineers, and universities, developed a soils definition (49), A list of soils meeting the hydric soils definition was identified, although some phases of these soils may be excluded.
Inventories
Analyses in this report are based on a variety of data available on wetlands and their potential for agricultural conversion. Each source is briefly de- scribed here; for further details, consult the list of references.
1906 USDA Drainage Inventory (57), Successive at- tempts have been made at the national level to in- ventory the agricultural potential of remaining wetlands and the need for drainage to develop those lands. This first modern attempt surveyed knowledgeable people in each county in the humid eastern part of the country. A total of 79 million acres of swampland were thought to have farm potential. One-third of this acreage was in intermit- tent crop use or wet pasture suited to improved drainage, while the remaining two-thirds was not fit for cultivation unless cleared and drained.
1919 USDA Drainage Inventory fl4j. This was a more comprehensive inventory based on drainage investigations and soil surveys. The inventory showed 91.5 million acres of land unfit for crops without drainage, with two-thirds in the South and half of the rest in the Lake States. The study estimated that only 75 million of the 91.5 million acres could ever be developed for agriculture, with the remainder in very deep peat or in coastal marshes unsuitable for crops. Further, 68 percent of these 75 million acres would have also required clearing of brush or trees, and some land would have had unfavorable fertility or texture if drained.
1946-48 American Society of Agricultural Engineers Drainage Survery (2). This effort identified 97 million acres of wet, swampy, and overflow lands, 20 million acres of which could be drained for farming at a reasonable cost. Of the land adaptable to farming, one-third was in cultivation and needed drainage improvements, and the remaining two- thirds was undeveloped land. A related 1948 estimate by the Soil Conservation Service showed 20.7 million acres physically feasible to drain and develop for agriculture.
1954 Wetlands Inventory (Circular 39J (38J. The Fish and WildUfe Service (FWS) and State fish and game departments cooperated to inventory wetlands used by waterfowl. The inventory counted 74.4 million acres of wetlands, classified according to the 20 types of the older FWS classification.
1958 Conservation Needs Inventory fCNIj (51J. This USDA inventory identified land needing drainage and small watershed projects needed for water management through farm drainage. A total of 73.5 million acres were judged to need treatment for ex- cess water, more than 80 percent of which was cropland. Pasture and rangeland with excess water that needed treatment totaled 13.6 million acres. Some 172.5 million acres had drainage problems, of which 45.5 million acres needed small watershed projects.
28
1975 Potential Cropland Survey fil). This Soil Con- servation Service (SCS) survey recorded 21.4 million acres of high and medium potential cropland that suffered from wetness. Of these, 16.5 million acres had seasonal high water table, 4.6 million had problems with drainage outlets, and 181,300 were identified as wetland types 3-20.
1977 National Resources Inventory (NRIJ (53). This SCS inventory identified 41.5 million acres in wetland types 3-20, but none was rated as having high or medium potential for conversion to cropland.
1979-83 National Wetlands Status and Trends Analysis (NWSTA) (13). Conducted by FWS be- tween 1979 and 1983, this study developed statistical estimates of acreage in wetland and deep- water habitat for the lower 48 States during the 1950's and the 1970's, and the change in that period. A stratified random sample of 3,635 4-square mile units was constructed. Black and white aerial photography from the 1950's and 1970's, selected for each sample unit, was inter- preted for wetlands, changes in wetlands, and the cause of change. The sample universe included all private and public wetlands in the lower 48 States, including coastal intertidal areas and inland water bodies. The sample was designed to achieve a
90-percent probability that estimates are within a 10-percent range in each category.
1982 National Resources Inventory fNRI) f54j. Con- ducted by SCS, this study inventoried soil and related water resources in the lower 48 States, Hawaii, and U.S. Caribbean territories. A two-stage stratified random sample was used to collect data from field observations at 841,860 sample points in nearly 350,000 primary sampling units of approx- imately 160 acres each. The sample universe in- cluded non-Federal rural land classified by both the 20 wetland types of FWS Circular 39 and the five major wetland systems used in the NWSTA. The NRI wetland acreage reported for 1982 is smaller than that reported in the NWSTA for three reasons: exclusion of Federal wetlands, possible undercount- ing of intermittently wetlands, and losses of wetlands since the mid-1970's. Advantages of the NRI data over the NWSTA are: assessment of cropland conversion potential; inclusion of soil, vegetation, and wildlife habitat measures; and cross-identification to the SCS Soil Interpretation Data (SOILS Form 5), which includes estimated potential crop yields for wetland soils. The NRI sample was designed to achieve a 95-percent con- fidence interval around estimates of acreages com- prising at least 10 percent of the land area within particular major land resource areas (MLRA's).
29
Appendix 2—Two Hypothetical Farms
North Carolina Pocosins. This farm is based primarily on conversion costs and operating data collected by Arthur Daugherty and Doug Lewis (Econ. Res. Serv., U.S. Dept. Agr.) in interviews with farm operators and drainage contractors in North Carolina. Supplemental 1982 agricultural cen- sus data and average 1982 crop budgets from the Federal Enterprise Data System (FEDS) were also used. A tax simulation model representing in- dividual returns was used as an analytical framework, but many larger operations, for which taxes may be an important consideration in wetiand conversion, are corporations.
Assumptions: 1,000-acre cash-grain farm converting 320 acres of pocosins.
The 320-acre conversion is assumed sold in the 10th year. The current dry cropland price of $1,350 per acre is almost $1,000 less than the break-even liquidation price of $2,315 needed to achieve the same after-tax income as before conversion.
Details of the net present value (NPV) and total year 1-10 columns of the tax model are shown in appendix table 1.
North Dakota Prairie Pothole. This farm is based on descriptions of farming in the region in Nelson, and others {27) and on representative farms in Bar- rows, and others (5). Supplemental data from 1982 agricultural census and average 1982 FEDS crop budgets were also used.
Production costs per acre:
Variable costs Fixed costs
(excluding conversion)
Total rotation
Prices ond yields:
Season-average per bushel
Target (loan for soybeans)
1st year bushels per acre
2nd year 3rd and subsequent
years
Conversion costs per ocre:
Acquisition Drainage^
Surveying Pump station Canals and V-
ditches Culverts and
roads Clearing Land development Soil amendment Total
Com Soybeans/wheat Rotation (double cropped) average
$168.24 $186.35 $179.11
Assumptions: 1,170-acre wheat farm converting a 10-acre pothole wetland.
87.49 255.73
.40
$2.50
3.03
100 125
150
123.13 309.48
.60
$5.84/$2.57
5.02/ 4.38
25/30 30/35
35/40
$200.00
11.30 131.92
156.26
30.69 744.99 157.02 147.00
1,579.18
108.87 287.98
1.00
Production costs per acre:
Variable costs Fixed costs (excluding
conversion) Total
Prices and yiMs:
Season-average per bushel
Target
1st and subsequent years bushels per acre
Conversion coêts per acre:
Acquisition
Drainage- ditching
Total
Wheat
$51.78
74.81 126.59
$2.87 4.38
35
$0.00 assumed owned
187.20 187.20
The 10-acre conversion is assumed sold in the tenth year for $600 per acre.
Details of the net present value (NPV) and total year 1-10 columns of the tax simulation model are shown in appendix table 2.
30
Appendix table 1—Land improvement tax timuletion. North Carolina Pocotin-
No conversion. With conversion. With conversion. Item ^ with payments with payments no payments
depreciation Depreciation Sch F 1.53 Deductions less 1.50 Total deduction Sch F 1.55 Net farm income Sch F 1.56 Investment credit F3468
1.22 Farm income 1040 1.19 Other deductions 1040 1. Total income 1040 1.23 Adjusted gross 1040 1.32 Total taxes 1040 1.40 Business credit 1040 1.48 Taxes owed 1040 1.50
Capital gains improvements (long-term): Capitalized S&WC
investments Basis of new land Sale Long-term capital gain Long-term capital loss Loss carryover Tax on capital gain
1,096,709 1,452,348 1,097,043 1,428,372 814,464 1,059,610 ^Discounted net present value. 'Section of the Internal Revenue Code. *IRS form and hne number follow each entry where applicable.
32
Appendix table 2—Land improvement tax simulations, North Dakota Prairie Pothole
No conversion, With conversion, With conversion, Item with payments with payments no payments
(115,737) (167,836) ^Discounted net present value. ^Section of the Internal Revenue Code. ^IRS form and line number.
34 li-U.S. Government Printing Office : 1986 -621-066/02015
Readings On
Soil Conservation and Farmland
Assessing Erosion on U.S. Cropland: Land Management and Physical Features, by Nelson L. Bills and Ralph E. Heimlich. AER- 513. July 1984. 24 pp. $1.50. Order SN: 001- 019-00341-3 from GPO.
Erosion from rainfall causes nearly 100 million acres of U.S. cropland to erode by more than 5 tons per acre per year. One-third of this land is so highly erosive that annual soil loss can be reduced to tolerable levels only under the most restrictive land management practices. More than one-third of U.S. cropland is inherently nonerosive under all management regimes, about half requires conservation management to keep soil loss within tolerable limits, and the remaining 8 percent is so erosive that acceptable soil loss rates cannot be achieved under intensive cultivation.
Do USDA Farm Program Participants Contribute to Soil Erosion? by Katherine H. Reichelderfer. AER-532. April 1985. 84 pp. $3.00. Order SN: 001-019-00383-9 from GPO.
Finds that only about one-third of U.S. cropland with excessive soil erosion rates is operated by farmers who might be influenced to reduce erosion if changes were made in USDA's commodity and soil conservation programs. Present commodity programs may conflict with conservation programs by encouraging cultivation of erosive crops. Efforts to increase the consistency of USDA commodity and conservation programs would contribute little to overcoming the Nation's total erosion problem.
Cropland Rental and Soil Conservation in the United States, by Nelson L. Bills. AER-529. March 1985. 20 pp. $1.50. Order SN: 001- 019-00387-1 from GPO.
Data from USDA's Resource Economics Survey challenge the common but not well- substantiated view that farmers are less concerned with erosion on land they rent than on land they own. At the national level, farmers' conservation effoits on rented cropland compare favorably with those on owner-operated cropland.
TO ORDER, WRITE TO:
Superintendent of Documents U.S. Government Printing Office Washington, D.C. 20402.
Telephone (202) 783-3238.
Make check payable to SuDerintendent of Documents and be sure to include the stock number of each publication ordered.
Bulk discount of 25% for 100 or more copies sent to one ad- dress. For foreign orders, please add P*^"- *^' n^^ctano
Agriculture's Links With U.S. and World Economies, by Alden C. Manchester. AIB-496. September 1985. 60 pp. $1.50. Order SN: 001- 019-00409-6 from GPO. Describes the linkages between farming and the supplying industries and those manufacturing and distributing farm products. Within the last 30 years, the food and fiber system has found itself increasingly reliant on nonfarm industries and increasingly affected by general economic developments, not only within the Nation but from overseas as well.
ImproTing U.S. Farmland, by Douglas Lewis and Thomas A. McDonald. AIB-482. November 1984. 12 pp. $1.00. Order SN: 001-019-00362-6 from GPO. A clear, concise account of recent farmland improve- ments. Farmers invested more than $6.5 billion in improving their land in a recent 3-year period. Those investments, while often made on existing cropland, expanded total U.S. cropland by 9.1 million acres.
Mfgor Uses of Land in the United States: 1982, by H. Thomas Frey and Roger W. Hexem. AER-535. June 1985. 36 pp. $1.25. Order SN: 001-019-00398-7 from GPO. Discusses the major uses of the Nation's 2,265 million acres of land in 1982: cropland, 469 million acres; grassland pasture and range, 597 million acres; forest land (exclusive of areas in special-purpose uses), 655 million acres; special uses, 270 million acres; and miscellaneous other land, 274 million acres. Changes in cropland and pasture acreages were barely perceptible during 1978-82; forest land (except special use areas) and miscellaneous other land decreased sharply as large acreages in these categories were reclassified as parks, wilderness, and related uses.