252
McKinsey Global Institute Sweden’s Economic Performance: Recent Development, Current Priorities May 2006

McKinsey Global Institute
Sweden’s Economic Performance: Recent Development, Current Priorities
May 2006

2
McKinsey & Company
McKinsey & Company is a management consulting firm that helps many of
the world’s leading corporations and organizations address their strategic
challenges, from reorganizing for long-term growth to improving business
performance and maximizing revenue. With consultants deployed in more than
40 countries across the globe, McKinsey advises companies on strategic,
operational, organizational and technological issues. For eight decades, our
primary objective has been to serve as an organization’s most trusted external
advisor on critical issues facing senior management. McKinsey has had a
permanent office in Sweden since 1979 and today has offices in Stockholm
and Gothenburg.
McKinsey Global Institute
The McKinsey Global Institute (MGI) was established in 1990 as an independent
economics think tank within McKinsey & Company to conduct original research
on important global issues. Its primary purpose is to provide insights into
the workings of the global economy and a fact base for decision-making for
the benefit of business leaders and policymakers. MGI’s staff members are
drawn primarily from McKinsey’s consultants. MGI also commissions leading
academics to participate in its research.

Sweden’s Economic Performance: Recent Development, Current Priorities
Diana FarrellClaes EkströmKarl BengtssonMartin HjerpeFabio PedrazziPetter HallmanNiklas Bengtsson
May 2006
This report is solely for the use of client personnel. No part of it may be circulated, quoted, or reproduced for distribution outside the client organization without prior written approval from McKinsey & Company.
�

4

Table of ContentsPreface 7
Executive summary 9
Synthesis: 17
Development from 1992 until today 21
Challenges – present and future 59
Recommendations 67
Sector Studies:
Automotive 79
Retail 107
Retail Banking 1�9
Processed Food 179
Construction 21�
Methodology 247
5

6

PrefaceTen years ago, McKinsey & Company in Sweden, together with the McKinsey
Global Institute, studied the Swedish economic performance. In that work,
several industry sectors were analyzed and actions to improve the economic
performance were identified. With the exception of one leading sector (heavy
truck manufacturing), we found that Sweden trailed both world class and
average European performance in productivity and job creation.
This report, Sweden’s Economic Performance, seeks to assess Sweden’s
economic performance over the past decade, using a similar sector-based
approach to understand the drivers and inhibitors of productivity, the current
economic challenges facing the country, and their implications for policy
makers, business leaders, and labor unions. The research draws on MGI’s
analyses of more than 15 countries and over �0 sectors.
During the study we have benefited immensely from the help of numerous
persons in the global network of industry experts within McKinsey and from
the wide knowledge and experience that McKinsey Global Institute has
created during its studies of different countries and industries. We have
also had the privilege to get invaluable support from our academic advisors,
Martin Baily, a Senior Fellow at the Institute for International Economics
and formerly Chairman of the Council of Economic Advisors under President
Clinton, and Lars Calmfors, Professor of International Economics at the
Institute for International Economic Studies, Stockholm University. The team
driving the work has included Karl Bengtsson, Martin Hjerpe, Petter Hallman,
Fabio Pedrazzi, and Niklas Bengtsson, and we have also been helped by the
great enthusiasm, support, and knowledge contributed by our colleagues in
Sweden.
7

�
We also want to acknowledge the many representatives of companies, industry
associations, government organizations, labor unions, and other organizations
that have contributed with valuable input and discussions over the course of this
project.
In line with our tradition to actively contribute to society, this is, just like in 1995,
an independent work, initiated, entirely financed, and conducted by McKinsey.
It is our wish that this study and its conclusions will contribute to improved
understanding and agreement around necessary actions for improving Sweden’s
economic growth.
Stockholm, May 2006
Claes Ekström
Director, McKinsey & Company
Diana Farrell
Director, McKinsey Global Institute

Executive SummaryIn 1995, McKinsey & Company Sweden, in cooperation with McKinsey Global
Institute (MGI), published a report on the Swedish economy. To understand
how the economy has developed since then, and the driving forces behind that
development, we have undertaken a second study of the Swedish economy. As
in 1995, the study has been conducted in cooperation with MGI.
The study has three purposes. Firstly, we aim to analyze Swedish economic
development from 1992 until the present, focusing on productivity and employment,
using detailed analyses of selected sectors. Secondly, we aim to understand the
challenges Sweden is facing, given the economy’s recent development path and
expected future changes. Thirdly, we set out priorities going forward that will
improve conditions for future economic growth and development.
Sweden’s relative decline in GDP per capita has been reversed by improving
productivity in the private sector
From the 1960s and 1970s to the late 1990s Swedish GDP per capita fell
relative to other countries. The McKinsey study published in 19951 showed that
between 19�0 and 1992, Sweden’s GDP per capita fell from 115 percent of the
OECD average and seventh place among OECD countries to only 106 percent
and fourteenth place. Low competitive intensity and heavily regulated product
markets were identified as the main causes of lower productivity and weaker job
growth in several Swedish sectors, compared with the leading countries at that
time. In a number of sectors, Swedish productivity was more than 20 percent
lower than in the leading country. The result was lower prosperity, and lower
economic growth overall.
1 “Sweden’s Economic Performance” by McKinsey & Company Sweden and the McKinsey Global Institute, September 1995, at www.mckinsey.com/mgi/publications
9

10
From 1992 to 2004, however, GDP growth in Sweden has been at par with the
OECD average. With GDP per capita at 112 percent of the OECD average, and
lying in thirteenth place among OECD countries, Sweden has halted the relative
decline in its GDP per capita. Sweden’s GDP per capita continued to fall during
the first part of this period, albeit slowly, to reach 104 percent of the OECD
average, its lowest point, in 199�. Between 199� and 2004, however, Sweden’s
GDP per capita growth was stronger than in other countries.
Strong productivity growth in the private sector explains this positive development.
Productivity growth in Sweden’s private sector, which employs about 70 percent
of the workforce, has been the fourth strongest in the OECD. The sector’s
productivity has grown by �.� percent per year over the past decade, 1.5 times
more than the OECD average. Total productivity growth in Sweden (including the
public sector) was 2.4 percent per year between 1992 and 2004, in line with the
OECD average, and considerably stronger than the average of the other countries
in EU15 of 1.9 percent per year.
Strong aggregate improvement in private sector productivity has been matched
by strong performance at the sector level in four of the five sectors we studied in
detail. Automotive manufacturing, retail, retail banking, and processed food have
all shown marked productivity improvements, both absolutely and in comparison
with the same sectors in other countries. For instance, in 1995, productivity in
Sweden’s retail sector was 16 percent lower than the leading country (of the
compared countries), in retail banking it was 20 percent lower, and in processed
food it was 42 percent lower. Since then, however, productivity in Sweden’s retail
industry has increased at 4.6 percent a year, a similar annual rate as in the
United States, the retail banking sector productivity has improved faster than in
any of the countries we compared it with, and Sweden’s processed food industry,
with productivity growth of �.1 percent a year, also takes first place just above
Denmark in our productivity growth comparison.
The only sector we studied that did not show improvement was construction, where
productivity has been growing by just 0.7 percent a year. Other countries’ rates
of productivity growth in construction were also low, but Sweden’s sector came
from a very poor starting point. In 1995, productivity in Sweden’s construction

11
industry was 25 percent lower than in the United States, and its relative position
has barely improved since then.
Deregulation has spurred more competition between private sector players
Extensive deregulation and regulatory reform over the past 10-15 years, both in
the country as a whole and in individual sectors, explains the strong productivity
improvements among Sweden’s private sector companies. More appropriate
regulation has intensified competition within each industry and enhanced
companies’ ability to respond, lifting productivity in the private sector generally.
This finding is consistent with MGI’s studies of other economies around the
world2.
Three regulatory changes have been critical. The first was Sweden’s entry into
the European Union in 1995. The resulting lowering of trade barriers between
Sweden and other EU countries increased competition from abroad, prompting
Swedish companies to boost their efficiency. For instance, imports of processed
food into Sweden increased by � percent a year from 199� to 2002, stimulating
Swedish food processors to respond: food exports from Sweden rose at 15
percent a year over the same period. Second were stricter laws promoting fair
competition. Earlier competition laws had been fairly toothless, for instance,
allowing whole industries to adopt common pricing. Such practices are no longer
permitted. Thirdly, there has been significant deregulation and regulatory reform
at the sector level. Changes in zoning laws have introduced more competition in
the retail sector, for example: in 1992, the law was changed to force local policy
makers to consider effects on local competition when granting retail licenses to
new entrants. Deregulation in retail banking has also led to new entrants being
granted banking licenses, resulting in greater competition in the industry.
The automotive sector provides a good example of how the absence of regulatory
product market barriers drives competition and therefore productivity growth.
Competition between global players in the automotive sector is intense. With
no regulatory barriers protecting them from overseas competitors, Swedish
automakers constantly need to improve their productivity to stay ahead. The
2 See, for instance, Diana Farrell, “The Real New Economy”, Harvard Business Review October 200�; and Martin Baily and Diana Farrell, “A road map for European economic reform,” The McKinsey Quarterly, September 2005.

12
Swedish automotive sector has been remarkably successful in this regard. By
200�, it was jointly with the Japanese the most productive of all the automotive
sectors we compared. It also had the highest productivity growth rate, and was
creating the most new jobs.
In contrast, the example of Sweden’s construction sector shows how inappropriate
regulation holds back productivity improvements. The construction sector was
the only one of the five we analyzed to remain comprehensively regulated, with
few changes to its rules occurring during the period of our study. Rigid zoning
laws, a bureaucratic planning process, and over-detailed construction codes
continue to limit innovation in the industry and make it inefficient. There has been
no significant improvement in productivity in construction in recent years, and
employment in the sector has been falling. This is important not only because
Sweden’s construction industry employs �.5 percent of the labor force and
accounts for 4.4 percent of GDP, but also because inefficiencies in construction
have ripple effects in other sectors, raising the cost of offices, factories, housing,
and hospital buildings alike.
Productivity growth in the public sector has most likely been less impressive
Sweden has a large public sector, employing �0 percent of the country’s workforce.
Productivity in the public sector is therefore critical to the prosperity of the
economy as a whole. However, productivity in the public sector is not measured
in the national accounts because of difficulties in quantifying its many outputs,
like national defense, environmental protection, healthcare and education. As
a replacement, the value added is measured based on the cost. This leads to
Sweden’s annual increase in overall productivity over the past ten years, at 2.4
percent, being almost 1 percent lower than the increase in its private sector
productivity.
However, since productivity improvement in public as in other sectors is closely
linked to competitive intensity and the regulatory framework�, and government
services in Sweden face little competition and are heavily regulated, it is
reasonable to assume that productivity in Sweden’s public sector has improved
much more slowly than in the private sector. Earlier academic attempts to
� See Thomas Dohrmann and Lenny Mendonca, “Boosting government productivity”, The McKinsey Quarterly, 2004 Number 4, available online at www.mckinseyquarterly.com.

1�
measure Sweden’s public sector productivity support this assumption.
Sweden has failed to create new jobs, especially in the private service sector
Despite its recent improvements in productivity and income growth, Sweden’s
economy is significantly worse than others at creating new jobs. From 1992 to
200� the share of people of working age (15-64 years) in employment declined
by �.1 percent. In contrast, the same measure of employment in Great Britain,
France and Norway increased by approximately 4 percent during the same
period. The difference in Sweden’s employment performance is equal to between
400,000 and 500,000 jobs.
Sweden’s failure to create jobs is most apparent in the private service sector,
where Sweden has been the worst at creating jobs of the 11 countries we chose
for comparison. From 1992 to 200�, the Swedish private service sector created
new jobs equal to only 4 percent of the working age population, compared
with 5.7 percent in Japan, �.1 percent in Germany and 1�.5 percent in the
Netherlands. Sweden’s weakness in creating new private service jobs has added
to the problem of high de facto-unemployment. This failing is especially grave
given the long term trend in all industrialized countries for employment to shift
from manufacturing industry to services, and the fact that about 40 percent of
Sweden’s workforce is already employed in the private service sector.
High taxes and counterproductive regulations explain the private service
sector’s failure to create new jobs
High taxes on employment raise the cost of labor for all employers and potential
customers. They also make low value-add services, like food preparation, retail
services, or household services, very expensive. For instance, someone on a
salary of 26,000 SEK per month (around one third of all full-time employees in
Sweden have a salary at this level or higher) would need to work for six hours
to afford just one hour of labor on this kind of service. As a consequence, many
Swedish consumers choose either to do these services themselves, or purchase
them on the informal labor market. Indeed, formal employment in such services
is low in Sweden compared with other countries.
In addition, sector-specific regulations limit the creation of new jobs in individual
sectors. For example, high statutory overtime payments in the retail sector make
it much more expensive for stores to be open at the times most convenient to

14
customers. Costs for retail labor rise by 70 percent on late weekday evenings,
and 100 percent at weekends. These cost hikes result in shorter opening hours,
reducing both the service provided to consumers, and retail employment. Overall
employment in retail is much lower than in the United Kingdom, for example,
where retail overtime rates are less costly. The difference in employment rates in
retail between the two countries corresponds to 1�0,000 jobs in Sweden.
Likewise, rigid labor market regulations in the construction sector contribute to
lower productivity, which drives up costs. This reduces demand, leading to lower
employment in the industry. Examples of these barriers include the complex and
inefficient piecework system for calculating wages, and the rigid division of tasks
between different categories of construction workers.
Certain employment practices in Sweden also make employees reluctant to
move to a new job, even one with a more productive company with better growth
prospects. The resulting inertia in the labor market puts a brake on overall
productivity improvement in the economy, which also, ultimately, means that
fewer new jobs are created.
Sweden’s economy has reached a pivotal point
Strong productivity improvement in the private sector has driven Sweden’s
economic growth over the past decade. However, Sweden cannot rely on this
factor alone to drive future growth and employment, for three reasons.
First, private sector productivity improvements since the early 1990s have been
generated to a large extent by deregulation, which has enabled some sectors
to catch up with more productive foreign peers. Impressive as this performance
has been, however, it represents a “one time only” change. It is unlikely that
productivity will continue to improve at the same rapid pace without further
deregulation in the private sector.
Second, demographic change will put Sweden’s public sector under intolerable
pressure unless its productivity improves rapidly. The aging population will
require more welfare services, paid for by taxes levied on a declining share of
people of working age. Technical developments in healthcare mean that demand
for healthcare is constantly increasing. If nothing else changes, the resulting
increase in welfare costs will become too large to finance through the current

15
tax system in only 10-20 years time. Even our base case scenario indicates that
the combined state and municipality income tax rate would need to increase to
roughly 50 percent over the coming 20-�0 years, from about �0 percent today.
Taxpayers are unlikely to accept such an increase: the quality of public welfare
and healthcare services is more likely to decline.
Thirdly, Sweden’s de facto unemployment is serious in itself, but is even more
troubling in the light of accelerating globalization. As it becomes increasingly
feasible for companies to produce goods and services in lower-cost countries,
and pressures grow on Swedish companies to improve their productivity, we
estimate that they will move between 100,000 and 200,000 jobs offshore in
the coming 10 years. That makes it imperative for Sweden’s economy to become
more dynamic and create new jobs to replace those that go abroad. Then the
economy as a whole will benefit from offshoring, rather than just the firms that
move jobs offshore.
At present, because of Sweden’s low rate of re-employment, there is a net loss
to the economy each time a service job is moved to another country. In contrast,
the US economy makes a net gain from each such move, largely because it
re-employs the displaced workers much faster. Denmark also has a higher re-
employment rate than Sweden, which is why the negative effect on Denmark’s
economy when a service job is moved offshore is much less severe than the
corresponding effect on Sweden’s economy..
Sweden must act now to sustain economic improvement
Sweden’s macroeconomic situation and the findings from our sector studies
point to three priorities for increasing GDP growth and employment in Sweden by
accelerating productivity growth.
Firstly, the government should remove remaining barriers to competition and
productivity improvement throughout the private sector. Strong growth in labor
productivity over the past 10 years has resulted partly from the deregulation of
sectors that were very highly regulated at the outset, the effects of which will
lessen over time. In order to maintain its positive growth trajectory, Sweden
needs to remove any remaining barriers to productivity growth and strive to
continue intensifying competition in every sector.

16
Secondly, productivity in the public sector must improve rapidly. Demographic
development and the tendency for public sector labor costs to rise in line with
labor costs in the overall economy, with no proportionate increase in public
sector output, mean that Sweden will soon struggle to finance its current level of
welfare services. At that point, either their quantity and/or their quality will have
to be reduced. To avoid that risk, productivity growth in the public sector must
match the pace of private sector productivity growth. Increasing competition and
measuring productivity improvement have proved effective means accelerating
productivity growth in the private sector. They should therefore be applied to the
public sector as well, as far as possible.
Thirdly, the rate of job creation must increase, especially in the private service
sector. Given that services provide a growing proportion of all employment
in developed economies and that the private service sector already employs
40 percent of Sweden’s workforce, the failure to generate more jobs here is
worrying. To tackle this problem, total labor costs must be lowered, for example,
by reducing direct and indirect taxes on labor. Furthermore, other regulations
that limit the creation of new jobs or create inertia in the labor market should
be reconsidered and revised. Despite their good intentions, such regulations are
often counterproductive for the overall economy.
Success in these three areas would significantly improve prosperity in Sweden.
If private sector productivity continues to improve at 1 percent above the OECD
average and the economy creates 500,000 new jobs, Sweden will reach the same
level of GDP per head as Switzerland, adjusted for purchasing power. Switzerland
today lies in fifth place in the OECD welfare ranking, the position that Sweden
held in 1970. With a simultaneous increase in productivity growth in the public
sector, Sweden will be able to make the improvements in public services that
it needs, and the outlook for the Swedish economy will be significantly stronger
than it is today.
Policy makers, companies and labor unions all need to contribute to making
the necessary changes. Given the challenges the Swedish economy faces, all
three should communicate the need for change to their respective constituents,
and create realistic expectations. The experience of Sweden’s automotive
industry demonstrates that effective change comes about when all three parties
understand what is required from them, and contribute the best they can.

IntroDuCtIon
In 1995, the McKinsey Global Institute (MGI) conducted a study, which aimed to
understand Sweden’s economic development. It analyzed how Sweden compared
with other countries in terms of productivity and the number of available
employment opportunities. At the time of the study, Sweden had underperformed
other OECD countries in its GDP per capita for several decades and had just
experienced a very deep economic crisis.
The 1995 study found that productivity in a number of industries was significantly
lower in Sweden than in other comparable countries (Exhibit 1). The main reason
was a lack of competition as a result of high product market barriers. For example,
there was very weak competition in retail because municipalities, armed with
zoning laws, tended to prevent new actors from establishing themselves in the
area. In the processed food industry, competition was restricted by import and
other trade barriers. In the retail banking industry, competition was weak because
no new banking licenses were distributed either to new domestic players or to
foreign companies looking to enter the Swedish market. Competition laws in
beginning of the 1990s were also toothless – for instance, common prices across
entire industries were allowed – and this contributed to a lack of competition in
many sectors.
Synthesis
17

1�
A new study of Sweden
Since the early 1990s, the Swedish economy has seen many changes.
Deregulation and increased competition has contributed to a strong improvement
in productivity. At the same time, the restoration of the nation’s public finances
—including the introduction of a cap on spending—and a restrictive monetary
policy has created macroeconomic stability, which has been a bedrock of the
economy’s development. In view of these changes since the study that was
conducted a decade ago, McKinsey Sweden, in cooperation with McKinsey Global
Institute, has carried out a new study of the Swedish economy, diving deeply into
five different sectors of the Swedish economy. The study has three main aims:
To analyze Sweden’s economic development over the past 10 to 15 years with
a particular focus on productivity and employment, and based on detailed
sector studies identify the driving forces behind the development
To clarify the challenges Sweden now faces given these recent economic
developments and future demographic and structural changes, including
job outsourcing to low-cost countries, and to describe where the Swedish
economy needs to improve going forward
1.
2.
Exhibit 1
In the 1995 study, Swedish labor productivity performance varied by industryLabor productivity*, index Sweden = 100
* Automotive 1992/1993, retail banking 1995, retail 1990, processed food 1990, construction 1990** Swedish data is from 1993, German data has been adjusted upwards and based on later data and MGI studies
Source: Groningen productivity database, October 2005; McKinsey analysis
75
94
100
127
127
Sweden
France
Germany
Japan*
Automotive**
US
Mid-pack
n/a
80
90
100
125
Retail banking
Sweden
UK
US
Germany
France
Above average
119
106
104
87
100
Retail
Spain
US
France
Sweden
Germany
Below average
Processed food
55
100
121
134
172US
Japan
Germany
Sweden
Denmark
Below average
130
121
118
100
86
Construction
Sweden
US
Germany
France
Japan
Below average

19
To discuss what priorities Sweden should adopt for the economy’s future
growth and development.
Methodology
To achieve these three main aims, we have employed a proven methodology that
analyzes productivity and employment as its key pillars.
Productivity and employment creates economic prosperity. Economic
prosperity can be measured in different ways. We use GDP per capita because
it is the most common yardstick. GDP per capita is equal to the number of
worked hours per capita, multiplied by productivity. Economic prosperity can
be improved either by increasing the number of hours worked, or by raising
productivity.
Productivity growth can be achieved both by increased production value and
by decreased input volume. Productivity (value added per worked hours) can
be affected both by cost efficiency (equal output value with reduced input
volume) and by increased production (more output value with the same input
volume). So, a country or a company can increase productivity either through
lowering the number of hours worked per unit or service produced, or through
producing more, or better (more expensive), products or services with a
constant number of hours worked.
There is no conflicting relationship between productivity and employment. There
is no conflict between productivity and employment. In the long-term, Sweden
has experienced significant improvements in productivity, while at the same
time creating ever higher employment levels. On the other hand, there is a very
clear correlation between a country’s economic prosperity and its productivity.
By analyzing prerequisites in different sectors it is possible to understand
how better growth can be achieved. Our method is based both on studying
the economy in general, using traditional macroeconomic data, and at a more
detailed, microeconomic level, undertaking detailed analyses of developments
in a number of different sectors. We have in this study analyzed productivity
and employment in five different sectors (automotive, retail, processed food,
retail banking, and construction) and identified which contributory factors
exist in each sector. Using this information, we then make suggestions as to
which factors are important for welfare development and what actions would
improve that development.
3.

20

21
Development from 1992 until todayrElAtIvE GDP DEvEloPMEnt HAS IMProvED
Sweden has stopped the relative fall in GDP per capita…
From the 1960s and 1970s to the end of the 1990s, Sweden’s GDP per capita
fell compared with other countries. In 1970, Sweden was the fifth richest of all
OECD countries, posting a GDP per capita of 124 percent of the OECD average.
By 199�, it had fallen to its lowest position until that point – to 104 percent of
the OECD average. At this point in time, 15 other countries had a higher GDP
per capita than Sweden. Since then, however, Sweden’s economic performance
has been somewhat stronger. GDP growth has been healthier than in many other
countries and, with a GDP per capita 112 percent of the OECD average, Sweden
has risen to 1�th place and sits in a cluster of European countries, all with a
similar GDP per capita (Exhibit 2). Nevertheless, the gap with the United States
Exhibit 2
OECD GDP per capita ranking, current prices and Purchasing Power Parity (PPP)Index OECD = 100
1970 1980 1990 1998
1.2.3.3.5.6.7.8.9.
10.10.12.13.14.15.15.17.18.19.20.21.22.23.24.25.26.
SwitzerlandUnited StatesDenmark LuxembourgSwedenCanadaAustraliaNetherlandsNew Zealand FranceGermanyAustriaBelgiumUKIcelandItalyFinlandJapanNorwaySpainGreeceIrelandPortugal MexicoTurkeyKorea Czech Rep.HungaryPolandSlovak Rep.
175139127127124119118116114107105104103101979795928976726452442822
2004
1.2.3.4.5.6.7.7.9.
10.11.12.12.14.15.15.17.18.19.20.21.22.23.24.25.26.
SwitzerlandUSIcelandCanadaLuxembourgDenmarkAustriaSwedenNetherlandsBelgiumAustraliaFranceGermanyNorwayItalyFinlandJapanNew ZealandUKGreeceSpainIrelandPortugalMexicoKoreaTurkeyCzech Rep.HungaryPolandSlovak Rep.
153136127123121117115115112111110108108107104104100969581776959483026
1.2.3.4.5.6.7.7.9.
10.11.11.11.11.15.16.17.18.19.20.21.22.23.24.25.26.27.28.
LuxembourgSwitzerlandUSIcelandCanadaAustriaJapanSwedenDenmarkFinlandGermanyBelgiumNorwayNetherlandsFranceItalyAustraliaUKNew ZealandSpain IrelandCzech Rep.GreecePortugalKoreaMexicoPolandTurkeyHungarySlovak Rep.
1501441371201151141121111101081071071071071061041009884807771666449383628
1.2.3.4.5.6.6.8.9.
10.11.11.13.13.13.16.17.17.17.20.20.22.23.24.24.26.27.28.29.30.
LuxembourgUSSwitzerlandNorwayIcelandAustriaDenmarkCanadaNetherlandsJapanAustraliaIrelandGermany FranceBelgiumSwedenItaly FinlandUKSpain New ZealandPortugalGreeceCzech Rep.KoreaHungary Slovak Rep.PolandMexicoTurkey
1741391271211161131131111091081061061051051051041031031038282686560604743413629
1.2.2.4.5.6.7.7.7.7.
11.12.13.14.15.16.17.18.19.20.21.22.23.24.25.26.27.28.29.30.
LuxembourgNorwayUSIrelandSwitzerlandNetherlandsAustriaIcelandAustraliaDenmarkCanadaBelgiumSwedenUKFinlandJapanFranceGermanyItalySpainNew ZealandGreeceKorea PortugalCzech Rep.Hungary Slovak Rep.PolandMexicoTurkey
217147143131125119117117117117115113112111108107105104999489787468675750453627
Source:OECD Annual National Accounts; McKinsey analysis
Sweden has fallen in GDP per capita relative other countries

22
has not noticeably narrowed and remains substantial. Sweden lags the United
States in both productivity and number of hours worked. In 200�, Sweden’s
productivity was 15 percent lower than the Unites States and its inhabitants
worked 10 percent less hours per head than the United States.
… through strong productivity development …
Between 1992 and 2004, Sweden achieved annual productivity growth of 2.4
percent, in line with the average of OECD countries and considerably stronger than
the average in EU15 excluding Sweden (1.9 percent per year). Disaggregating the
two components of GDP growth – productivity growth (changes in the output value
per hour worked), and adjustments in labor input (change of total number of hours
worked), it is clear that the Swedish recovery since the beginning of the 1990s
has, overwhelmingly, come about through a strong increase of productivity.
… in the private sector
By any international comparison, private sector productivity between 1992 and
2004 was very strong with �.� percent in annual growth. Among OECD countries,
this put Sweden tied in fourth place with Finland. Only Korea, Poland and Ireland
had higher productivity growth in the private sector. During this period, the OECD
average was 2.2 percent per year (Exhibit �). This productivity performance
was evident in the sector analyses conducted in this study, with the automotive
Exhibit 3
Labor productivity growth has been strong in Sweden, especially within the private sectorLabor productivity* growth, 1992–2004CAGR; percentSlovak Republic***
4.6Korea4.3Poland***
4.2Ireland3.7Czech Republic***
2.9Hungary2.6Finland
2.5Norway2.4Iceland2.4Sweden
2.3United Kingdom2.2Greece
2.2United States2.1Japan2.1France2.0Australia
1.9Germany1.9Luxembourg
1.7Belgium1.7Canada1.7Austria***
5.3
Denmark1.6Portugal
1.3New Zealand 1.2
1.6
1.2Spain1.2Italy1.1Netherlands
Switzerland
Business sector labor productivity** growth, 1992–2004CAGR; percent
0.91.11.11.1
1.31.31.3
1.51.61.61.71.8
2.12.32.32.32.42.42.42.52.62.7
2.83.33.3
4.04.2
4.5KoreaPolandIrelandFinlandSwedenSlovak RepublicNorwayDenmarkUnited KingdomIcelandGreeceUnited StatesAustraliaAustriaHungaryCzech RepublicCanadaPortugalFranceBelgiumGermanyNew ZealandItalyJapanLuxembourgNetherlandsSpainSwitzerland
OECD average = 2.3% OECD average = 2.2%
* Labor labor productivity: GDP in constant prices (local currency) per hours worked in economy. OECD countries excluding Mexico (MX) and Turkey (TU)** Labor labor productivity: value-added at constant prices (local currency) per hour worked, excluding public sector. OECD-countries excluding Mexico and Turkey
*** 1995–2004 for Austria, Slovak Republic and Czech Republic. 2000–2004 for PolandSource:OECD productivity database, July 2005

2�
industry being the most compelling example. This sector achieved annual
productivity growth of � percent, compared to just over 2 percent in Germany and
about 5 percent in Japan, France and the United States.
However, productivity development in the public sector is most likely low…
Both productivity and productivity growth is most likely low in the public sector.
However, there are no measurements that make it possible to study actual
productivity development in the public sector in a meaningful way. In the national
accounts, the output value of the services in the public sector is not measured
– instead, its value added is defined as the value of its factors of production. Since
output is not included, productivity changes in the public sector are meaningless
when trying to compare over time and with different countries. What is clear,
though, is that competition in the public sector is low. Given the correlation
between competition and productivity that is evident in the private sector, one is
justified in assuming that productivity in the public sector is low. Earlier attempts
to measure the real productivity development confirm this hypothesis.
The productivity of Sweden’s public sector is particularly important because of
its overall importance to GDP. Some �0 percent of employees work in the public
sector, which means that the measurability issue becomes relatively larger in
Sweden than in other countries where the public sector employs fewer people.
As a comparison, the size of the public sector (as share of total employed) is only
about 22 percent in Finland, 15 percent in the United Stated, and 10 percent in
Germany. The average of the EU15 countries (unweighted, excluding Sweden) is
about 15 percent.
… and the ability to create jobs has been limited…
Sweden’s ability to create new jobs has been the worst among the compared
countries. It has lagged far behind the majority of OECD countries in this regard
since 1992. As an illustration, if Sweden had increased employment among the
working-age population (as defined by the OECD) between 1992 and 200� by
the same amount as Great Britain, France or Norway, it would have meant the
creation of between 400,000 and 500,000 new jobs in Sweden (Exhibit 4).
… especially in the private service sector
In a comparison of 11 countries, Sweden has the worst record of creating new
jobs in the business service sector (services are broadly defined and include,
for example, retail banking, retail, transportation, and consultancy). From 1992
to 200� the Swedish private service sector created jobs equal to 4.0 percent of

24
the working-age population. During the same period, Japan created 5.7 percent,
Germany �.1 percent, and the Netherlands 1�.5 percent. If Sweden had attained
the average percentage of the countries compared, it would have created some
250,000 new jobs during the period.
This underperformance is especially alarming because the new jobs being created
in developed economies have tended to come from outside manufacturing
sectors. For a long period, in common with other developing countries, Sweden
has seen a gradual structural shift away from manufacturing employment, which
has been falling, and towards increased service sector jobs. Today, as many as
70 percent of employees in Sweden work in the service sector – �0 percent of
these in the public sector and 40 percent in the private sector. It is therefore
one of Sweden’s greatest challenges to improve its effectiveness in creating new
jobs in the private service sector. (Exhibit 5).
the inability to create new jobs has resulted in growing unemployment
Overall, Sweden’s inability to create new jobs has a negative effect on the
economic development and creates a growing de facto-unemployment. Today,
more than 15 percent of the able working population is without full employment.
Exhibit 4
* 1992–2002 ** Average working age population in Sweden 1992–2003 was 5.67 million
Note: CAGR = Compound Annual Growth Rate Source:OECD Labor Force Statistics, Indicators, July 2004; McKinsey analysis
Finland
0.3Austria
0.2Italy
-0.1US
-0.1Denmark
-0.2Germany
-0.4Sweden
2.1Ireland
1.4Netherlands*
0.7Canada
0.7Australia
0.5UK
0.5France
0.5Norway
0.3
Sample average = 0.5%
Corresponding to 400,000–500,000 jobs in Sweden**
Employment development from 1992 to 2003 has been poor
Share of working age population (15–64) which is employedCAGR, percent

25
Exhibit 5
* 1992–2002Note: Excluding activities included in Swedish Public sector, e.g., public administration, defense, health care, education, and children's care
Source: Groningen productivity Database, Oct 2005; McKinsey analysis
The service sectorThe manufacturing sector
Net job creation in the private sectorPercent of total employed, 1992–2003
4.0
5.7
6.5
6.9
8.1
9.2
10.1
10.6
11.9
13.5
13.9
-2.6
-7.8
-3.5
-2.3
-8.7
-3.5
-3.5
0
3.2
-1.2
2.4Canada
Netherlands
Spain
US
UK
France
Germany
Finland
Denmark
Japan*
Sweden
Swedish service job creation lags other countries
Exhibit 6
A larger number of people don’t work, even though they should be able to Population between 16–64 years, able to work; thousands, 2004
239
Official unemployment
Government programs
Latent jobcandidates*
485
Underemployed** Excluded from labor force with ability to work
Totalunemployment
~10
~17
% of labor force
5.4
~215
132
~832
106
140
* Persons that are included in “not in labor force” but that want to work and can start within 14 days, including full time students who have applied for work
** Persons with employment but working less than they would like to. Approximately 264,000 would like to work more. Assuming 0.5employment wanted per person i.e., 132,000 new jobs
Source: AMS; SCB (AKU); press clippings; McKinsey analysis
ESTIMATE
This includes students who want to work but remain at university since they
cannot get a job, part-time employees looking to work more, and people who are
on sick-leave or early retirement above and beyond the levels seen in around
1970 (Exhibit 6).

26
Productivity Growth is not in opposition to Employment
Productivity growth can sometimes be perceived as negative, based on
the view that, when it takes the form of improved efficiency, it then leads
to job reductions and increased unemployment. While this correlation may
sometimes be valid in the short-term in certain industries, it is not true for the
overall economy in the long-term. Research shows that a rise in productivity
does not influence employment in the long run. The relationship between
higher productivity growth and employment is complex and depends, among
other things, on what causes the rise. If the underlying cause is industrial
restructuring, it is likely that frictional unemployment will increase. However,
faster productivity growth at the same time boosts companies’ propensity to
invest in new employees, since future returns on investment in employment
also rise (the effect corresponds to a lowering of the real interest rate).
Furthermore, employees are given a greater incentive to be modest when
demanding salary increases because through continued employment they can
expect to share a portion of increasing productivity in the form of higher real
salaries down the line.
It is also critical to understand that increased productivity does not necessarily
mean reduced input (and a lower number of working hours). Productivity
can also be increased through higher output (more products/services or,
alternatively, higher value added per product/service) with unchanged inputs.
The fact that the goals of productivity improvement and employment are not
in conflict can be proven on a macroeconomic level. GDP per capita has a
very strong correlation to productivity (Exhibit 7). This would not be the case
if there had been a strong negative correlation between productivity gains
and employment. In the case of Sweden, as in all other developed countries,
productivity and employment gains have gone hand-in-hand for a long period
(Exhibit �). Even in specific industries, productivity increases can lead to new
jobs, as amply illustrated by Sweden’s automotive industry, where annual
productivity improvements have gone hand in hand with job creation.

27
Exhibit 7
0102030405060708090
100110
0 20 40 60 80 100 120
Indexed; US=100; 2002 figures at PPP
* Defined as GDP per employeeSource: OECD; McKinsey analysis
GDP per capita
Labor productivity*
USSwedenNOR
IRL
FRAITA
DNK
DEU
CAN
AUTISLJPN
CHE
ESPGRC
NZL
PRT
KORHUN
CZE
SVK
POLMEX
TKY
AUSFIN
GDP per capita is strongly correlated with high productivity
Exhibit 8
0
50
100
150
200
250
300
350
400
450
1950 1953 1956 1959 1962 1965 1968 1971 1974 1977 1980 1983 1986 1989 1992 1994 1997 2000
Employment and labor productivity* growth in Sweden for total economy Index 1950 = 100
Note: Time series break in GDP values in 1993* Aggregated labor labor productivity at constant prices by 2000, SEK per worked hour
Source: Statistics Sweden (SCB)
GDPLabor productivity Employment
Productivity growth brings prosperity, and there is no negative correlation between productivity and employment

2�
the development can be explained by studying specific industry sectors
Productivity growth and job creation together create macroeconomic growth,
and the clearest clues as to what should be done to improve overall economic
prospects come from studying individual companies and sectors. This is what
we did in 1995 and what has been repeated in this study. In order to be able
to compare results, the same industries have been analyzed in both studies.
These are: retail (including stores, but not wholesalers), construction (including
new buildings and renovation, but not infrastructure construction), automotive
(including manufacturers of light and heavy vehicles, and suppliers, but not car
retailers), retail banking (including banking services for private customers and
small and medium enterprises), and processed food (including all food products
that have been processed).
BEttEr funCtIonInG ProDuCt MArKEtS HAvE DrIvEn CoMPEtItIon
AnD ProDuCtIvIty
Since the 1995 MGI report, most sectors have exhibited significant productivity
growth, both compared to 1995 and with other benchmark countries (Exhibit
9). The driver has been increased competition, due to a number of actions
implemented in Sweden since the beginning of the 1990s.
Exhibit 9
Automotive** Retail banking Retail*** Processed food Construction
Swedish productivity growth has been very strong comparedto other countries Percent CAGR, 1990–2003*
Best-in-class
2.3
4.4
5.1
5.1
8.0
US
Germany
France
Sweden
Japan**
* 1993–2003 for Swedish automotive industry. 1995–2002 for retail banking. 1990-2003 for Processed food , Construction and Retail** The most recent data for Japan is from 2002
*** The US has the highest productivity growth if the wholesale industry is included Source: Groningen productivity database; McKinsey analysis
Best-in-class
-0.1
0.2
1.5
2.8
3.1
Denmark
US
Germany
Sweden
Japan**
Good, but very low
-2.3
-0.6
-0.1
0.7
0.8
US
Germany
Sweden
France
Japan**
Best-in-class
-0.2
1.1
2.3
4.2
4.6
Spain
Sweden
Germany
France
US
Best-in-class
2.2
2.8
3.2
3.4
4.6
UK
Germany
US
Sweden
France

29
Firstly, a large number of industries – including banking and finance, retail,
telecom, airlines and the taxi business – have been deregulated and opened up
to new players, both foreign and domestic, leading to previous monopolies and
oligopolies being broken up.
Secondly, the Swedish Competition Agency was created in 1992 and more
stringent competition legislation came into effect the next year. Backed by this
new legislation, the agency was able to be significantly more effective than
its predecessor, the Price and Cartel Agency, which only had a remit to tackle
abuses.
Thirdly, once Sweden joined the EU, most of the remaining trade restrictions with
other European countries disappeared and several sectors were deregulated
and harmonized with the other countries. Swedish companies gained improved
access to the large Internal Market, while foreign actors were free to operate in
Sweden and increase competitive pressure there.
All the changes seen in Swedish product markets have increased competition in
many industries. Our sector analyses show that, between 1992 and 200�, there
has been a strong correlation between deregulation, enhanced competition, and
increased productivity. The impact has varied, of course, depending on different
starting points and industry dynamics, but three main correlations can be
observed:
In sectors already exposed to strong competition, the largest gains have been
made. The automotive sector has seen strong competition throughout the
entire period and has posted the most substantial productivity growth – an �.0
percent annual improvement – of all the sectors studied. This has contributed
to giving Sweden a leading position among the benchmark countries in the
sector, at the same level as Japan, and with a lead of some 5 percent on the
United States.
Sectors subjected to deregulation – including retail, processed food, and retail
banking – have seen both increased competition and productivity growth.
Productivity growth has accelerated to 4.6 percent per year in retail and retail
banking, and to �.1 percent per year in processed food. In retail banking,
that leaves Sweden in a leading position compared to benchmark countries,
1.
2.

�0
a few percent ahead of the United States, and almost 20 percent ahead of
France and Great Britain. In retail, Sweden is still a few percent behind the
United States but ahead of most European countries and 20 percent ahead
of Germany. In the processed food sector, Denmark is still �0 percent ahead
of Sweden and the United States 15 percent.
Sectors that labor under vast product market barriers and have experienced
limited regulatory change, have had limited productivity development. The
construction sector has heavy product market barriers and is subject to
weaker competition than other sectors, which has led to limited pressure to
improve. As a result, productivity has been virtually static during the period
with only a 0.7 percent annual improvement.
the automotive sector shows intense competition delivers strong improvement
The performance of Sweden’s automotive industry has been very strong over
the past decade. Not only has productivity improved by �.0 percent annually
between 199� and 200�, but the sector has also been able to increase the
total number of employees by 1.2 per 1,000 working age population. New
jobs have been created because strong productivity growth has made Swedish
companies competitive and increase the volume of sales. In comparison, Japan
3.
Deregulation and Competition Boosts Productivity
Productivity improvements are driven by increased competitive intensity, which
can be achieved in two ways: either through enhancing competition among
existing market participants, or by encouraging new entrants by lowering entry
barriers. Dismantling entry barriers is preferable since this delivers a long-term
boost to competition. The impact of simply raising the competitive intensity
between existing players risks being lost over time as market participants drop
out (Blanchard-Giavazzi 200�).
Strong competitive pressure creates strong incentives to improve productivity.
The entry of new players increases productivity by importing innovative business
models and products, new technology or the ability to use existing technology
more efficiently. There is empirical evidence showing that more competition
has the greatest positive effect on productivity in sectors in one country that
lag far behind the same sector in other countries in terms of technology usage,
because it enables the employment of concepts from others that are well tested
and this can increase productivity quickly (Nicoletti & Scarpetta 200�).

�1
and France saw annual growth of 5.1 percent while job creation was slightly
negative (Exhibit 10). The automotive sector was already highly competitive at
the start of the time period analyzed, and its performance illustrates the fact that
intense competition is compatible with—and indeed enhances—the creation of
economic growth through both increasing productivity and the number of hours
worked. Lying behind this record is the fact that the sector has achieved both a
reduction in the number of hours worked per unit and an increase in the value
added per vehicle. The sector’s striking productivity growth has helped Sweden
become a leader among the benchmark countries—standing on a par with Japan
and a few percent ahead of the United States. By contrast, Germany and France
lag some 40 percent behind.
Intense competition was already a hallmark of Sweden’s automotive manufacturing
industry, particularly the production of heavy vehicles, when the last McKinsey
survey was conducted. In 1995, Sweden’s heavy vehicle manufacturing industry was
the most productive of the benchmark countries. The light vehicle manufacturing
industry had a little way to go to match Japanese and American productivity levels,
with productivity some 20 percent behind. One explanation for this was relatively
Exhibit 10
Automotive – overall development in Sweden has been very strong
* Jobs created in the total automotive sector ** Swedish labor productivity data are from 1993 to 2003. labor productivity and net job creation for Japan are based on 1992–2002
Source: Groningen productivity database, Oct 2005; McKinsey analysis
Size in percent of 2003 value added
50-5 10
US
UK
Germany
Sweden
NetherlandsIreland
Labor productivity growthPercent CAGR, 1992/93–2003**
0
15
Japan
France
0.15
0.10
0.05
-0.0559
France 61
US 95
Japan 100
Sweden
Germany
100
Net jobs created 1992/93–2003*Percent of working age population, 15–64
Labor productivity, 2003Index Sweden = 100

�2
low competitive pressure as Japanese auto makers were rather late to compete in
the premium segment in which Saab and Volvo operated. From the early 1990s,
competition increased as Japanese manufacturers moved increasingly towards
premium vehicles, and this boosted Swedish productivity development.
Another key reason for the robust development of Sweden’s automotive
industry—and its strong current position—has been the cooperation and
mutual understanding existing between employers and labor unions. Both have
understood the importance of continual development and therefore efforts to
enhance production methods have been much more effective than in certain
other industries such as construction.
So, strong competition has been good for productivity. Many other key Swedish
industries enjoy similar conditions as the automotive industry—global competition,
low product market barriers, and strong competitive pressure—and therefore
they have the basis for being leaders in productivity as well.
retail, retail banking, and processed food see improved productivity due to
increasing competition
Deregulation and competition promotion have been implemented over the past
10 to 15 years in three of the industries we studied closely – retail, retail banking,
and processed food. To varying degrees, all three had weak starting points in the
1995 study. Productivity in the retail sector was 16 percent lower than in the
leading benchmark country; 20 percent lower in retail banking; and 42 percent
lower in processed food. However, the measures implemented since then have
increased competition and therefore productivity; all three industries have seen
the best productivity gains of all the benchmark countries.
Retail productivity has matched the annual increases scored by the American retail
industry of 4.6 percent per year. Sweden’s retail banking sector has had the highest
annual increase in productivity of all comparison countries, also 4.6 percent. The
productivity of processed food in Sweden has (together with Denmark) also out-
grown the benchmark countries with annual growth of �.1 percent.
In the case of the retail banking industry, strong productivity growth has allowed
Sweden to overtake the United States, the productivity leader in the 1995
study. However, Sweden still lags, in absolute productivity, in both retail and
processed food. The retail industry’s productivity is approximately 10 percent

��
lower than in the United States, although it compares well with other European
countries. Sweden’s processed food industry lags behind both Denmark and the
United States, but is ahead of, for example, Germany. Positive developments in
processed food production and retail have worked together and contributed to
Swedish food prices closing the gap with the rest of the EU – from 60 percent
above the EU average at the beginning of 1990s, to about 15 percent today (9
percent, once differences in VAT rates are stripped out).
The reasons for these strong developments vary to a degree in the three different
industries, but they all have in common the key factor of increasing competitive
pressure due to deregulation of product markets:
Retail banking
The European – and therefore the Swedish – retail banking sector saw gradual
deregulation during the 19�0s and 1990s, which led to strong productivity growth
(Exhibit 11). At the start of the 1990s, a number of regulatory changes made it
possible for both domestic and foreign players to establish new banks and credit
institutions in Sweden. The market share of these new players has increased
significantly, and this has led to higher competitive pressure (Exhibit 12).
Internal industry efforts to enhance efficiency, as well as consolidations
following the bank crises at the beginning of the 1990s, have also contributed
to improving productivity. For example, the number of bank branches has
fallen dramatically (Exhibit 1�).
Many customers have moved to internet banking, which has improved
efficiency. This has been enabled by rapid technology development, which has
also boosted productivity by automating many banking support functions.
Finally, customer behavior has also changed in other ways. Historically, bank
customers were very loyal to their bank and seldom switched, but this has
begun to change. Many customers now have relationships with several banks.
This increased mobility has given new players an opportunity, and increased
competitive intensity (Exhibit 14).

�4
Exhibit 11
Labor productivity, 2003Index Sweden = 100
Net jobs created 1992/93–2003*Percent of working age population, 15–64
Retail banking – Sweden has seen high labor productivity growthbut failed to create jobs
* Entire financial intermediation sectorSource: Groningen productivity database, Oct 2005; McKinsey analysis
1
20 3 5
US
UK
France Germany
Sweden
Labor productivity growthPercent, CAGR, 1995–2002
2
0
1 4
3
-16
100Sweden
98US
82UK
82France
65Germany
Size in percent of 2003 value added
Exhibit 12
* Excluding residential mortgages** Danske bank, SkandiaBanken, Länsförsäkringar Bank, IKANO, ICA-banken
*** SEB, FSB, Handelsbanken, NordeaSource: EFIC; Swedish Bank Association; McKinsey analysis
Market share of total lending volume*
82 79 76 73 72 71 69
13 13 15 17 16 17 18
5 7 9 10 12 12 13
1998 2000 2004
100% = SEK
Big 4 banks***
New banks**
1999 2001 2002 2003
650 806 935718 915 925 905
Other banks
billion
In retail banking, deregulation has led foreign and new banks to establish themselves in Sweden, which has increased competition
Growth 1998–2004
23.2
11.6
3.4
New banks**
Other banks
Big 4 banks***
Market average = 6.2%
Percent

�5
Exhibit 13
Rationalization and increased usage of IT have significantly reduced number of bank branches in large parts of Europe
Source: McKinsey
-4.1
-8.3
-8.9
-2.1
-1.8
0.3
0.4
1.5
3.0
1998–2003Percent CAGR
Development of number of branches
R2 = 71%
0.00.51.0
1.52.02.5
0 200 400 600 800 1,000 1,200
Branch density, 2003Number of branches per million population
BELPRTITA
ESP
DEUFRAGBR
SwedenNLD
Fragmentation, 2003Banks per million population
Belgium
Germany
Spain
France
UK
Portugal
Italy
Netherlands
Sweden
Low branch density and few branch visits in Sweden
R2 = 66%
0.0
1.0
2.0
3.0
4.0
5.0
0 200 400 600 800 1,000 1,200
ESP
BEL
PRT
ITA
DEU
FRA
Branch usage, 2003Average number of branch visits per customer and month
GBRNLD
Sweden
Exhibit 14
Compared to other Nordic countries, Swedish customers are less loyal and more often use several banks
Source: McKinsey Scandinavian Retail Banking Survey, 2003
Active
Super active 2
24
29
23Never shops
Not so active
Swedish customer’s tendency to shop for bank products Share of respondents, percent
51
35
14
81 7862
29
1918
1 3 9More than two banks
Two banks
One bank
Denmark Finland Sweden Norway
Number of bank relations per customers, 2002Percent

�6
Retail
The robust development in retail (Exhibit 15) has been caused by several
factors. Firstly, zoning laws were changed in 1992 so that municipalities were
required to consider competition issues when retail permits were awarded.
Previously, municipalities tended to bar new retailers from entering the market
in an attempt to protect established players. The new laws have made it
significantly easier to establish new retail establishments in the municipalities
– especially for large stores outside city centers.
Secondly, productivity has been driven by a shift in format mix – more
productive formats such as supermarkets and specialized chains have, to an
extent, replaced less productive ones. For example, the average size of newly
established food outlets has increased greatly from about 500 square meters
at the end of the 19�0s to approximately 2,500 square meters in the early
years of the new century. This has partly been driven by the internationalization
of the sector as more foreign companies have established themselves in
Sweden (Exhibit 16).
Exhibit 15
Retail – Sweden has not managed to create new jobs but has had strong productivity growth
* Jobs created in total retail sector ** Canada 1990–2002
Source: Groninge productivity database, Oct 2005; McKinsey analysis
-1.50
-1.00
-0.50
0.00
0.50
1.00
1.50
2.00
2.50
3.00
3.50
-1.0 1.0 3.0 5.0
US
Ireland
Canada**
GermanyDenmark
FranceUK
Sweden
Spain
Nether-lands
113US
100Sweden
79Germany
67France
47Spain Labor productivity growth
Percent CAGR, 1992/93–2003**
Net jobs created 1992/93–2003*Percent of working age population, 15–64
Size in percent of 2003 value added Labor productivity, 2003Index Sweden = 100

�7
Thirdly, the increased role of IT has catalyzed significant improvement in
distribution, supply chain and inventory management. Efficient management
and smarter cooperation with suppliers has contributed to increased productivity,
which has partly been passed onto customers through lower prices.
Processed food
Processed food was a highly protected and regulated sector in the early
1990s but, since then, productivity growth has been strong (Exhibit 17). Three
somewhat interlinked reasons explain this development.
Firstly, Sweden joined the EU in 1995, an event that meant adjusting and
harmonizing its rules with other EU countries. Remaining import restrictions
against other EU member states in the processed food sector were removed
although, admittedly, barriers actually increased against the goods and
services of many non-EU economies. That said, because the majority of
Sweden’s foreign trade in processed food is with EU countries, both imports
and exports increased and this led to increased competition (Exhibit 1�).
Exhibit 16
Size of new established food retail outlets has increasedsteadily, partly due to the easing of zoning laws
0
50
100
150
200
250
1975 1980 1985 1990 1995 20000
500
1,000
1,500
2,000
2,500
3,000
Note: In 2003–2004 the average size dropped due to Lidl and Netto establishing several small hard discount stores (30 and 48 respectively)Source: Supermarket 2005
Number of new retail outlets#
Average size of new establishments in food retailm2
2004

��
Exhibit 17
* Jobs created in total sector** Japan 1990–2002
Source: Groningen productivity database, Oct 2005; McKinsey analysis
Labor productivity growthPercent CAGR, 1990–2003
-4.0
-1 6
US
UKSpain Netherlands
Ireland
4.0
-8.0
0
-6.0
40
2.0
-2.0
Denmark
Sweden
2
Germany
France
1 53
Japan**
Processed food – structural changes has boosted labor productivity while employment has declined
130Denmark
115US
100Sweden
84Germany
45Japan**
Size in percent of 2003 value addedNet jobs created 1990–2003*Percent of working age population, 15–64
Labor productivity, 2003Index Sweden = 100
Exhibit 18
0
10
20
30
40
50
60
1993 1995 1997 1999 2001
Food and beverages foreign trade volumes SEK billions
Source: SCB; McKinsey analysis
Exports
Imports
18 billion
27 billionCAGR 8.3%
CAGR 14.8%
Reduced trade barriers within the EU has increased competition and dramatically increased foreign trade

�9
Secondly, retail has become significantly more efficient in running its
operations. Its increased use of private labels and more efficient procurement
processes have put pressure on processed food producers to raise their
game. This is, broadly, a good example of how deregulation in one sector
(in this case, retail) can spill over into others (in this case, processed food),
causing a chain-reaction of productivity improvement.
Thirdly, it has again been the increasing participation of foreign players
that has proved a driving force for significant consolidation and efficiency
improvements in this sector. This effect has been significant, and provides
a lesson that should be learned and applied by other industries, such as
construction (Exhibit 19). Productivity improvements in the processed food
sector has, together with those in retail, led to a far better deal for Swedish
consumers. Between 1990 and 2005, grocery prices increased by a mere 4
percent compared with a �5 percent jump in the consumer prices index.
Several other sectors that had been laboring under significant product market
barriers have seen similar deregulations as the three sectors mentioned above;
they too have become better equipped to create productivity growth.
Exhibit 19
* Contribution to the labor productivity growth from labor shift from domestic to more productive foreign companies** Contribution to the labor productivity growth from foreign companies due to internal productivity improvements
Note: Labor productivity improvement based on food, including drink and tobaccoSource: OECD “The contribution of foreign affiliates to labor productivity growth” (2005); McKinsey analysis
Foreign contribution to the labor productivity growth in the food processing sector, 1995–2001Index foreign subsidiary contribution = 100
Average annual labor productivity growth, 1995–2001Index total productivity improvement = 100
228Foreignsubsidiaries
50Domesticcompanies
Foreign companies contribution
100
31
Shift effect*
69
Internal effect**
Foreign companies in Sweden have played an important role in labor productivity gains

40
the construction industry illustrates how product market barriers inhibit
development
Sweden’s construction sector is weighed down by far-ranging product market
regulation and that, as a result, has seen weak productivity development (Exhibit
20). At the start of the 1990s, its productivity was significantly lower than in many
other countries—and more than 25 percent below that of the United States.
Since then, productivity growth has been insignificant both in Sweden—at only
0.7 percent—and elsewhere because product market regulations have not been
eased to any great extent.
Rigid zoning laws and a bureaucratic planning process have hindered development
and imposed inflexibility when changes are needed. Overly detailed construction
codes have prevented innovation. Although an attempt to ease restrictions was
made through the introduction of functional construction codes, their effect has
been limited. A lack of common EU rules for building materials, for instance,
hinders the development of competition upstream in the industry’s value chain,
and leads to higher prices for end-consumers.
Exhibit 20
Construction – Sweden has had low labor productivity growth and negative employment growth
* Jobs created in the total construction industry ** Japan 1990–2002
Source: Groningen productivity database Oct 2005; McKinsey analysis
123France
118US
100Germany
100Sweden
58Japan*
2
1
-2 2-4
US
UK
Canada
GermanySweden
Netherlands
Ireland
0
3
4
6
-20 4
-1
6
FranceJapan**
5
Labor productivity growthPercent CAGR, 1990–2003
Size in percent of 2003 value addedNet jobs created 1990–2003*Percent of working age population, 15–64
Labor productivity, 2003Index Sweden = 100

41
As a consequence, the entire sector is inefficient and there isn’t enough
incentive to force industry players to make the investments necessary to secure
operational improvement. Detailed analysis shows that close to �0 percent of
building costs arise directly from inefficiency in operations (Exhibit 21). The highly
fragmented industry structure is another cause of this inefficiency, since small
companies have less incentives and capabilities to improve productivity. The
often rigid division of tasks in the construction sector has also been an inhibitor
to productivity. Unions and companies have, over time, built up a structure in
which different construction elements are implemented by different types of
worker. Specialization can often help productivity, but in this case, the detailed
division of different tasks has led to a significant administrative burden and
losses in time and efficiency (Exhibit 22).
The final impediment to productivity in the construction industry is its significant
informal component. As well as reducing the government’s tax revenues, the
informal sector conserves the industry’s fragmentation by discouraging small-
scale players from expanding. As companies grow larger, they find it more difficult
to operate parts of their company informally without being discovered. Informal
companies also have low incentives to make operational improvements because
they can make bigger gains from avoiding taxes and fees.
Exhibit 21
20–30% of construction costs are due to inefficiency in operations
Source: FoU väst 0507, “Slöseri i byggprojekt. Behov av förändrat synsätt”
20–30 Waste
Errors Theft Labor timewaste
Salariedtimewaste
Machineusagewaste
Materialwaste
Total
3
71.72.5
8.51.5
3.5
8.5 5.41.8
30.0
20.0
ESTIMATE
20–30% of construction cost is waste, showing that improvements in operations can increase significantly
Construction costPercent

42
PuBlIC SECtor ProDuCtIvIty IS AlSo lIKEly to BE wEAK
As we have already noted, the method of compiling national accounts makes
it impossible to measure productivity in the public sector. Instead of output
value, cost is used as a proxy for value added. The result is that total Swedish
productivity growth between 1995 and 200� was held back by almost one-third
(Exhibit 2�). Total productivity in that period grew by 2.4 percent a year when the
public sector is included, but by �.� percent when the public sector is taken out.
Beyond that observation, it is difficult to be certain what is happening with public
sector productivity.
However, there are many reasons why it is likely that productivity improvement
in the public sector is low. Firstly, the public sector is protected – as is the
construction industry – by strong product market regulations. As we have already
established a clear connection between deregulation and competition in the
private sector, it is safe to assume that the lack of either in the public sector has
hindered productivity and productivity growth. Secondly, we can draw on some
earlier productivity studies of the public sector. A sub-committee of the Ministry
of Finance, the so-called Expert Group on Public Finance, has conducted a series
Exhibit 22
In Sweden, many handovers and several different types of workers are required for building a bathroom
* In small houses, the same worker could do concrete, wood, tiles and painting** Can be the same Inspector
Source: Interviews
• Minimum of 5 different workers needed to build a bathroom– Project leader– H&P worker– Electrician– Worker*– Inspector
• Time-consuming because several handovers, at least 10, create coordination problems
Construction designWork plan/coordinationInsert heating and plumbing pipesConcrete formFirst half inner wallVentilationElectrical installationInside heating and plumbingSecond half inner wallPaint/paper boardFramesWater proof layerTilesHeating and plumbingInteriorElectrical installationCleaningInspection H&PInspection VentilationInspection ElectricityInspection Building
0123456789
1011121314151617181920
• Contractor/consultants• Project leader• H&P worker and electrician• Concrete worker*• Wood worker*• Ventilation worker• Electrician• H&P worker• Wood worker*• Painter*• Wood worker*• Tile worker• Tile worker• H&P worker• Wood worker*• Electrician• Cleaner• H&P inspector**• Ventilation inspector**• Electrical inspector• Building inspector
1st building phase (frame)
2nd building phase (installation)
3rd building phase (inner walls)
4th building phase (installation)
Finalizing phase
Performing worker in SwedenTasks
EXAMPLE

4�
of studies1 that have shown weak productivity growth in the public sector. All
of the five-year periods between 1960 and 1990 showed declining productivity,
ranging from -4.� percent between 1965 and 1970 and -1.1 percent between
19�5 and 1990. The only exception was the period from 19�0 to 19�5, which
saw unchanged productivity. There has, of course, been a great deal of change
since then but it remains the case that the competitive pressure that has been
a major driver of productivity improvement in other sectors is still missing in the
public sector. Thirdly, incentives to drive productivity improvements are limited
in large parts of the public sector. Performance based on budget results is a
weaker spur to seeking higher productivity than performance based on profit:
cost savings leading to an entity ending the year under budget often means
that the budget is lowered the next year. It should be noted, at this point, that
productivity gains do not necessarily depend on rationalizations – they can be
secured through increasing the output value, either by increasing volumes or
by improving quality – becoming more efficient at the expense of quality can, in
many cases, lead to lower productivity.
1 Ministry of Finance, 1997, Public Sector Productivity in Sweden
Exhibit 23
Note: Electrical machinery exclude High-tech and Telecommunication equipment. In 2001–2002, High-tech and telecom equipment had negative value added, which is treated here as zero value added
Source: Groningen productivity Database Oct 2005; OECD; McKinsey analysis
Sweden’s public sector inhibits aggregated labor productivity growth
Contribution to aggregated labor productivity growth 1995–2002Percent
0
20
40
60
80
100
120
140
0 10 20 30 40 50 60 70 80 90 100Average size of sector 1995–2002
Percent of total value added
FuelsTextiles
Mining
Renting and leasing
High-tech and components
Other transportMineral products
Other manufacturingWood
Electricalmachinery
Wholesale and retail
Transport services
Construction
Legal, tech., and advertising services Finance and insurance
Utilities
Chemicals, plastics, and fuels
Automotive
Communication services
Mechanical engineering
Agriculture
Hotels and restaurantsAuto-related retail
Pulp and paper
Food and drink
Printing and publishing
Other business services
Public admin and education
Health care
Metal products
Telecommunication equipment
Real estate
IT services
Private householdsOther non-business services

44
All in all, it appears highly likely that there is a significant improvement potential
for public sector productivity. Boosting productivity growth here would have a
huge impact on the overall economy in Sweden. Low productivity growth in the
public sector is a serious problem for Sweden, not least because �0 percent of
employment is in the public sector. In addition, it will not be possible to finance
future demand on public sector services if productivity does not increase.
Demographic developments, combined with technological advances and
increased demand for quality in health care, will result in significant increases in
public expenditure. Our base scenario finds that municipality and county income
taxes would need to be increased 1.5 times from the current range of �0 to �4
percent to more than 50 percent over the next 20 to �0 years (Exhibit 24). It
seems unreasonable to expect that today’s welfare system would survive such a
dramatic increase in taxes. If welfare were to continue to be fully financed from
taxation, the burden on companies and individuals would be so substantial that
a large number of businesses would suffer badly. Productivity increases in the
private sector will be insufficient to finance the increase in resources needed by
the public sector. This is because productivity improvements and higher wages
in the private sector will lead to higher public sector wages, and increase the
relative costs of public services, an effect called Baumol’s disease.
Exhibit 24
Increasing demand for health care will consume a significant share of future GDP growth and may have a significant impact on financing
* Individual public consumption remain at today’s service level** Individual public consumption increases at the same rate as private consumption
Note: Assuming zero public sector labor productivity growthSource: SOU 2004; 19 Långtidsutredningen 2003/2004; Ministry of Finance; McKinsey analysis
Increasing health care costs will consume a significant share of GDP growth … … and will have a large effect on tax level
0
10
20
30
40
50
60
1980 2000 2020 2040
Percent; Municipal tax level(“kommunalskatt + landstingsskatt”)
1.7 1.8
0.5*–0.9**
GDP growth 1970–2004
GDP growth prognosis2002–2020
Health care spend growth as share of GDP 2005–2030
Base case
Percent

45
If Sweden is to finance its public sector in the future, it must raise public sector
productivity. If the objective is to have the best public sector in the world,
productivity must be world-class as well. If higher productivity is not achieved,
there is no alternative than to cut benefits and/or the public services on offer, or
to find alternative financing schemes. Co financing, in which individuals pay part
of the cost of the welfare service out of their own pockets, is likely to become a
more common method of funding. However, in Sweden, this notion has no broad
political support. That leaves productivity improvements as the only genuine option
if Sweden is to finance, and preserve the quality of, the public sector in future.
Baumol’s Disease
The way that public services become relatively more expensive over time
is called Baumol’s disease, after the economist William Baumol who first
described the phenomenon. It means, inter alia, that tax-financed welfare
services require either a constantly higher tax rate or lower relative service
level. In Sweden, welfare services such as health care, child care, elderly
care, and schools are financed through taxes and are largely run by the public
sector. Since these activities are personnel-intensive, salaries account for
a significant amount of overall costs; in health care, for instance, salaries
account for three-quarters of total costs.
When productivity increases in the private sector, room for real wage increases
is created. This then raises wage demands in the public sector, leading to
higher public sector costs. Tax revenues, particularly when proportional taxes
as those levied by local and regional governments are used, increase as
wages rise, and are thereby sufficient to pay for the increased cost of public
salaries. However, because welfare services post lower productivity gains than
does the private sector, the price of publicly-produced services will increase
relative to the price level in the rest of the economy.
If the contribution of public sector workers remains unchanged (which means a
constant service level), tax rates can be kept constant. However, expectations
of welfare services tend to increase at the same pace as real incomes, leading
to expectations of volume increases. Due to the increasing relative price of
welfare services, these higher demands cannot be met without increased
taxes or alternative financing.
A cure for Baumol’s disease—and thereby for avoiding tax increases—is
either to increase public sector productivity, or to increase employment in the
private sector.

46
lABor MArKEt BArrIErS HInDEr joB CrEAtIon
It has largely been political decisions to deregulate certain industries that have
created the conditions allowing companies to deliver strong productivity growth in
the private sector. However, as mentioned above, job creation has failed to keep
pace with these gains, a trend particularly apparent in the private service sector,
which provides jobs for some 40 percent of those working in the economy. It is
possible to identify several factors in various industries that inhibit job creation
and whose reform must therefore be a high priority.
Sweden has a problem creating private sector service jobs
There are three main explanations for Sweden’s weak ability to create new jobs
in the private service sector. Firstly, the high total cost of labor inhibits demand
for labor-intensive services. Secondly, there is a lack of flexibility in some sectors,
where agreements between, for instance, employers’ and employees’ organizations,
create further costs as well as barriers against operational improvements. Finally,
there is a lack of flexibility in the overall labor market, which leads to slower
structural change in the economy. Of these, the high cost of labor is the largest
barrier.
A comparison between Sweden and Great Britain shows that, if the private service
sector in Sweden employed the same proportion of its population as in Britain,
there would be over 500,000 more people working in Sweden than there are today
(all other things being equal) (Exhibit 25).
The sector studies confirm the fact Sweden is the worst of all compared countries
at creating jobs in business services. In the study of the retail sector, it is clear
that concepts that originated in Sweden (H&M, IKEA), or are succeeding (Netto,
Lidl), are based on a low number of employees and low service levels. For this
reason, Sweden has the highest revenue per employee in retail of all the compared
countries (Exhibit 26). Hypothetically, if Sweden had as great a percentage of its
population employed in retail as Great Britain has; there would be 1�0,000 more
jobs in Sweden (all other things being equal) (Exhibit 27). Analyzing the restaurant
industry in Sweden also finds weak demand for labor-intensive services. Low
service concepts, such as McDonalds, have been successful, while businesses
with higher service levels, such as Pizza Hut, have not fared as well. Swedes spend
a lower proportion of their disposable income at restaurants than the inhabitants
in all other OECD countries – approximately half of the EU15 average and almost
as low as in the former Yugoslavian republic of Macedonia (Exhibit 2�).

47
Exhibit 25
Sweden has lower employment levels in the service sector than the UK
Characteristics in sectors that are most affected by tax wedges
• End consumers pay directly to producers (B2C)
• Labor content is very high
• The industry is dominated by small scale formats, leading to high risk of informality
• Labor productivity differences between the professional service providers and own work are limited, leading to substitution for own work
• The service is “optional” and, consequently, has high price elasticity
Private service sector
182
160Leisure and hospitality
154Professional services
73Financial intermediationand auxiliary services
Retail & Wholesale
15Insurance services
2Real estate services
3Other services
4Motor vehicle trade & repair
5Communications
24IT services
28Transportation
523Grand total
Employment gap vis-à-vis, UKThousands of people
Source: Groningen productivity database, Oct 2005; OECD; McKinsey analysis
Exhibit 26
In retailing, Sweden has the highest revenue per employee
1.5
1.5
1.8
US
Portugal
Denmark
0.9
1.1
Norway
UK
Germany
Sweden
0.6
1.0
Source: Kampen om köpkraften – handeln i framtiden, Fredrik Bergström och Stefan Fölster (red), 2005
SEK Million per employee

4�
Exhibit 27
Sweden has dramatically lower employment in retail than comparable countries
* Canada and Japan 2002 and 1990-2002 respectivelySource: Groningen productivity Database, Oct 2005; OECD; McKinsey analysis
Country
Retail employment, 2003*Percent of working age population, 15–64
Change, 1990–2003* Percent of working age population, 15–64
4.3
4.5
4.6
5.4
5.5
6.1
6.4
6.7
6.7
7.5
8.5
9.0Japan
UK
US
Canada
Netherlands
Ireland
Germany
Denmark
Spain
France
Sweden
Finland -0.80
-0.53
0.24
1.21
0.53
0.73
2.75
1.58
0.81
0.93
0.88
0.97
If Sweden moved to the UK level, as many as 180,000 new jobs would be created (including wholesale)
Exhibit 28
3.3Sweden 3.5Denmark 3.8Germany 3.8Belgium 4.1Netherlands 4.4Finland 4.9US 5.5Slovenia 5.6France 6.1Canada 6.1Slovak Republic
13.817.117.5
Macedonia
UK
Italy
Ireland
8.3
7.0
10.0
Greece
Portugal
Luxembourg
Austria
Spain
8.2
6.5
9.4
Swedes spend a very low share of private consumption on restaurants and hotels Percent of individual consumption that is spent on restaurants and hotels
Source: OECD
EU15 average = 7.5

49
High labor costs lead to weak job creation
Sweden has high labor costs in several industries. This does not reflect high
disposable incomes, but rather high tax wedges on labor (Exhibit 29). Since
services tend to be labor intensive, they are more affected by high tax wedges
than products are. Therefore, in comparison with other countries, services in
Sweden are expensive—some 15 to 20 percent higher than GDP justifies. In
fact, Sweden is the fourth most expensive country for services in the OECD
(Exhibit �0).
Sweden has exceptionally high taxation on labor. Take, as illustration, a consumer
on a salary of 26,000 SEK per month (around one-third of all full-time employees
in Sweden receive at least this remuneration) who would like to buy the service
of a producer on the average salary in Sweden. This might be to prepare a meal
(the restaurant industry); buy goods at a store (the retail industry); or renovate
a house (the construction industry). The Swedish consumer would have to work
over 6 hours to be able to buy 1 hour of that kind of service. As a consequence,
the service provider needs to have at least 600 percent higher productivity than
the consumer for it to be economically rational to create this work opportunity
(Exhibit �1).
Exhibit 29
Turkey41Hungary
40Slovakia40Austria40Denmark
39Finland37France37Netherlands
36EU-15
Mexico 12Korea 12Ireland 16New Zealand 18Iceland
26UK26Japan
24Australia23
Czech Rep.
47Belgium46Germany
44Sweden42Switzerland
41Poland41Italy41
34Greece33Norway
32Spain29Portugal
27Luxembourg27Canada27US
26
Sweden has among the highest tax wedges on labor
* Measured as the difference between total labor cost paid by the employer and the net income of employees, as a ratio of total labor compensation. It therefore includes both employer’s and employee’s social security contribution but not VAT. Based on 87% of average worker earnings of a single person with no children
Source: Going for growth, 2005, OECD
Average tax wedge on laborPercent of total labor compensation*

50
There are certain studies pointing out that high tax wedges do not increase the
total labor force cost; instead, they produce lower net salaries. This may be true
for groups with relatively high wages. However, unemployment benefits acts like
a floor for net wages. This means that there is hardly any room for high taxes to
be transferred onto the worker in the form of lower net salaries in sectors with
Exhibit 30Relative price of services and GDP per capita
0.3
0.5
0.7
0.9
1.1
1.3
1.5
10,000 15,000 20,000 25,000 30,000 35,000 40,000
Price ratioRatio of the price level of consumer services to that of consumer goods
GDP per capita, 2002
* Consumer services are a proxy for non-tradable products and goods (semi-durable and durables) are a proxy for tradable productsSource: OECD, Going for Growth, 2005
CHE
USA
NORIRL
JPN
SWE
CAN
ISL
DNKAUT
AUSNLD
FRAFIN
DEU
GBR
ITABEL
NZL
ESP
GRC
PRT
KOR
CZEHUN
SVK
POL
Exhibit 31
SEK
Note: Income tax (municipality tax) national average: 31.82%; employer contribution: 32.46%; VAT: 25%* Average wage for construction worker and marginal tax assuming customer earn between SEK 313,000 and 465,000 per year
** Income tax assumes average construction wage SEK 274,000 and tax deduction of SEK 13,700Source: Swedish Tax Authority; McKinsey analysis
Tax wedges
Tax wedges explain a large share of the high cost of services
Gross income required
VAT Invoice of work
Employer contribution
Employer contribution
Income taxNet wage
27,493
2,000 10,000
10,756
1,9601,826
4,214
X6.5
Cost of labor
Income tax
6,737
Producer Consumer

51
relatively low wages such as retail, hotels and restaurants. The effect is higher
costs and a narrower wage structure.
The impact of high labor costs is most significant in industries characterized by
factors like large labor content; small-scale industry structures with elements of
informal labor; services that are sold directly to consumers; limited productivity
differences between the service provider and the consumer; and services
with a high degree of price-sensitivity. Sectors such as refurbishing within the
construction industry, and restaurant, cleaning and personal services (including
advice or consulting services) fulfill several of the above criteria.
The result is fewer jobs created, at least in the formal sector. Many workers who
are not able to be 6 times as productive as their potential customers end up
outside the workforce. Often this negatively affects young people, individuals
without an education, or un-integrated immigrants. Another consequence of this
is that the individuals already employed will perform more work on their own
behalf than what is optimal for the economy as a whole. All in all, high tax wedges
distort the distribution of work in society.
The second-tier consequence is that many jobs are instead created in the informal
economy. This is especially evident in industries such as construction, restaurants,
and cleaning. As discussed above, this does not only result in lost tax revenues and
lower productivity but also in a number of undesirable social side-effects such as
injustice, morale-depletion, and the creation of unwanted dependency. To analyze
these effects in detail falls outside the scope of this report but they underline how
important it is that Sweden works to reverse this development.
Microeconomic inflexibility restrains development
In the various sectors examined in this study, there are many examples of how lack
of flexibility hinders both productivity and job creation. In retail, employers and labor
unions have agreed that work at certain times will be considerably more expensive
than at other times – much more costly than during comparable working hours in, for
example, the restaurant sector. The effect is that it becomes much more expensive
for stores to be open when it may be most convenient for customers. In retail, the
cost of labor increases by 70 percent on weekdays in the late evening. On weekends,
it shoots up by 100 percent. These large wage differentials result in shorter, less
customer-friendly opening hours, contributing to low employment in the industry. Great

52
Britain, for one, does not have these large differences in labor costs (Exhibit �2).
The construction industry is also characterized by a lack of flexibility in several
respects. Firstly, there is an excessive grouping into “guilds”. The rigid division of
tasks between different categories of workers is often unproductive. This, as we have
outlined above, leads to inefficiency, wasted resources, low productivity, higher costs
and lower total demand. Specialization often leads to increased productivity, but too
many handovers and inefficient coordination creates waste. An illustration is that
the construction of a bathroom in Sweden may require as many as 20 handovers
between different workers. Secondly, unproductive piece wage systems exist in
the industry. Normally, performance-based salaries increase productivity and lower
costs. The model used in the construction industry, however, with rigid compensation
schemes and complicated calculations used to arrive at piece wages, often has the
opposite effect, leading to lower flexibility, less innovation, and cementing old ways
of working. Surveys show that piece wages drive up labor costs by around 11 SEK
per hour – equivalent to 7 to � percent of total labor costs. Piece wages discourage
innovation unless it reduces working time. For instance, workers on piece wages are
actually incentivized to hire an additional crane if it could lower working time, even if
it meant the total building project came in more expensive.
Exhibit 32
170100 111
18*–20
20–24
08–12
12–18
All day
100 100 100 100
200
100 100 100
200
100147
100
100–106
High cost of labor on evenings and weekends is a barrier againstemployment in retailing
* 18.15 for Sweden, 18.30 for Sainsbury's (UK)** Provincial UK, shop assistant with base salary GBP 5.39/hour
Source: När handlar vi?, HUI; Kalenderkorrigeringsgruppen; 2003 Annual Specialty Store Compensation & Benefit Survey, US National Retail Federation; UK Income Data Services; Handelsanställdas förbund, McKinsey analysis
Cost of retail labor by day and time, Index 100 = Mon–Fri 08–18
Mon-Fri 08–18*
Saturday
Sunday
Distribution of sales by day and time
9–12 12–16 16–20
Monday
Tuesday
Wednesday
Thursday
Friday
Saturday
Sunday
Sum
Sum
1 3 5
2 3 5
2 4 7
3 5 10
4 8 10
4 9 4
2 6 3
18 37 45
10
10
12
18
22
17
11
100
<4%
4–6%
>6%
Example: ICA Maxi (Large format grocery store)Percent of weekly sales
150100 111
100 100 100 100Sweden UK (ASDA)
UK(Sainsbury’s)** US
100–106

5�
tHE vAXHolM ConflICt
In May 2004, Laval un Partneri Ltd, a Latvian company, sent workers to
Sweden to build a school in Vaxholm. Compensation to the workers was SEK
14,000 ($1,740) per month or SEK �0 ($10) per hour, plus room and board.
Altogether, this was a bit more than double their normal wage.
That June, the Swedish labor union Byggnads contacted the Latvian company
to negotiate a collective bargaining agreement. Byggnads demanded that the
workers should be paid a salary of SEK 145 an hour (even though the lowest-
allowed salary applicable under the collective bargaining pact was SEK 109 an
hour). Rather than signing Byggnads’ agreement, Laval un Partneri chose to
sign a collective bargaining agreement with the Latvian construction workers
labor union in September. In October, Byggnads announced that industrial
action would be initiated if the company did not sign the Swedish agreement.
In November, a blockade of the Vaxholm building site began.
Normally, Sweden prohibits industrial action against a company in order to
eliminate, or change, another collective bargaining agreement applicable to
a particular workplace. There is, however, an exception, based on a 1991
amendment called Lex Britannia, which stipulates that industrial action can
be taken against a company that does not have a connection to the Swedish
labor market under the Swedish Co-Determination in the Workplace Act
(medbestämmandelagen). This connection is normally not considered to exist
when a foreign company engages in temporary work in Sweden.
In December, Laval un Partneri initiated legal proceedings against Byggnads
before the Swedish Labor Court. According to the Court’s interim ruling,
the blockade was legal. However, since the Court found also found that the
legislation was unclear, it decided to send the case to the European Court
of Justice (ECJ) for a preliminary ruling before giving the final judgment. The
question under consideration in the ECJ is whether Lex Britannia implies
unlawful discrimination against foreign companies and thereby hinders free
movement of services, which would be against EU law. The ECJ is expected
to pronounce on this case during 2007 but Laval un Partneri could not afford
to wait until then, and brought its workers home. The company’s Swedish
subsidiary went bankrupt in February 2005.

54
Inflexible labor markets hinder structural transformation and entrepreneurship
A modern economy is constantly transforming itself, with new, more productive
concepts replacing the old. From society’s perspective, this dynamic is desirable
since it makes inhabitants richer and offers opportunities for private, as well as
public, consumption.
Sweden’s employment protection laws are more flexible than in many other
European countries and, in general, it is not especially difficult for a company
to reduce its personnel. However, a “last in, first out” principle – which holds
that the last employee hired is the first laid-off if the company needs to reduce
its work force – still holds sway and decreases the incentive for an individual to
switch jobs. When moving to a new company, the individual loses the position
in the line, and thereby risk being the “first out” at the new place of work. This
is negative for an economy with a poor ability to create new jobs as it reduces
mobility and therefore the speed at which the economy can restructure itself
and become more productive. This cultural phenomenon may be a contributing
factor to why Sweden has a low proportion of entrepreneurs compared with other
countries (Exhibit ��).
Exhibit 33Entrepreneurship is relatively weak in Sweden
14
30Greece 25Italy
21Poland 21Portugal
20Cyprus17Spain 16Ireland 16Czech Rep.
16Lithuania14Hungary 14Malta
13Belgium 12UK
12Slovak Rep. 12Finland
11Austria 11Netherlands
11Germany 10Slovenia10Latvia
EU 15
Sweden9France 9Estonia
10
Denmark 8Luxembourg
7Norway
8-14
Sweden
17
Germany
Share of entrepreneurs* in the EU and Norway, 2004Percent
Change 1995–2004Percent
* Share of engaged out of working age population (15–64) that are working in own companySource: Nutek, årsbok 2006

55
It is most likely that low mobility could be changed without threatening the Swedish
model with its extensive security for individuals. The case of Denmark shows that
labor market mobility can be successfully combined with a Scandinavian welfare
model. Adopting the Danish model would change the meaning of job security
from “secure in your present job” to secure in more general terms because of
the existence of a safety net and more plentiful jobs available in the economy for
people who find themselves laid-off.
“flEXICurIty”– tHE DAnISH MoDEl
Denmark’s system aims to combine a flexible labor market with a well-functioning
social security net. The hope is that flexibility makes it easier and less risky for
a company to adjust its workforce to market conditions, both when hiring and
laying-off employees, which would reduce the reluctance of companies to hire.
At the same time, Denmark wants to preserve a Scandinavian model in which
the individual has access to a strong security net. The solution has become
“flexicurity”, a hybrid combination of flexibility and security.
Flexibility in this system is achieved by employment security being lower in
Denmark. The “last in, first out” principle does not apply in the same way as in
Sweden and it is not as expensive for an employer to lay-off personnel. The OECD
compiles factors such as rules for giving notice, including notice periods and
compensation amounts, into a work protection index. While Sweden has an index
of 2.9, Denmark’s is 1.5, much closer to the Anglo-Saxon level; Great Britain, for
example, scores 1.1. Flexibility is also reflected in labor market turnover. Around
�0 percent of the Danish labor force changes jobs each year. The average time a
Dane works at the same place is eight years, the third lowest in the OECD. Only
the United States and Great Britain have lower average periods.
Security, on the other hand, is created through good unemployment benefits
and very active unemployment support. The average compensation level in
Denmark (calculated as the average over 60 months of unemployment for four
different types of families and two different income levels) is the same as in
Sweden. In addition, Denmark spends considerably more on active support
for the unemployed than Sweden – 1.7 percent of 200� GDP in Denmark,
compared with 1.� percent in Sweden. Active unemployment measures include
individual action plans, training, competence development, and various other
activities to improve employment prospects. At the same time, high demands
are placed on the unemployed to actively apply for jobs. There is also a limit
of four years on the provision of unemployment security.

56
It is difficult to say unequivocally what effect the Danish “flexicurity” system
has had on unemployment. Many observers argue that it has contributed to
Denmark halving its unemployment rate since the early 1990s (from 12.4
percent in 199� to 5.7 percent in 2005). Others are more skeptical. For
instance, Andersen and Svarer stated (2006) that this drop in unemployment
had more to do with the tightening of the compensation system in the 1990s
and strong economic growth (partly because earlier consolidation of the
public finances had created the ability to stimulate the economy through fiscal
policy). Our citation of the “flexicurity” system should not be seen as a direct
recommendation to adopt it in Sweden; but it is helpful as an illustration of
the fact that alternative labor market models exist.

57

5�

59
Despite the strong development of the last 10 years, Sweden is facing several
challenges that are set to become even more severe due to an ageing population
and the offshoring of jobs to low-cost countries. To create strong economic
growth in the future, these challenges need to be addressed. As we have outlined
above, economic growth has been driven by strong productivity improvement in
the private sector. This has, to a certain extent, been the result of deregulation
and increasing competition, enabling sectors to catch up with their counterparts
in other countries, but it will be difficult to sustain such strong productivity growth
going forward. Another problem is that the productivity growth in the private
sector has not been matched by what, on the available evidence, appears to
be weaker productivity in Sweden’s large public sector, and poor job creation
in private sector services. This situation is unsustainable in the long-term,
given anticipated demographic changes and the fact that more jobs are being
rationalized or moved to low-cost countries, a key feature of ongoing globalization.
To ensure that the robust development seen thus far is not temporary, and that
Sweden enjoys further sustained progress, it is necessary to act now.
PrIvAtE SECtor ProDuCtIvIty GrowtH MuSt ContInuE, But CAnnot
BE tHE only DrIvEr
Because some of the productivity improvements in the private sector have been
the result of one-off effects such as deregulation, one cannot rely on future
productivity gains continuing at the same strong rate as achieved since the early
1990s without further action. The initial level of productivity was low in several
industries (as illustrated by the 1995 MGI report). Deregulation and increased
competition have boosted productivity growth to the point that many Swedish
sectors have caught up with those in comparable countries. However, it is
Challenges – present and future

60
Exhibit 34
Source: SCB “Sveriges framtida befolkning 2005–2050”; McKinsey analysis
100% = million
>65
20–64
0–19
9.9
22
55
23
2025
Sweden’s population is ageing and its share of working age individuals is decreasing
9.4
20
58
22
2015
9.0
17
59
24
2005
10.1
23
54
23
2035
Percent
easier to catch up with the competition than to pull ahead of it. If the positive
developments of recent years have any chance of being sustained, Sweden must
address enduring weak spots – such as the construction industry.
wItHout InCrEASInG ProDuCtIvIty, DEMoGrAPHICS tHrEAtEn lonG
tErM PuBlIC SECtor funDInG
Changing demographics will impose heavy strains on the public sector in the
coming decades. The working share of the population is decreasing, while
the number of elderly in the population is increasing sharply (Exhibit �4). This
combination risks leading to very large increases in public expenditure. As
outlined above, in our base scenario, everything else being equal, municipality
and county income tax rates may need to be increased to more than 50 percent
over the next 20 to �0 years. It seems very unlikely that today’s welfare system
would survive such a dramatic increase in taxes. The result is more likely reduced
quality and/or quantity of services.

61
Several factors are interacting with each other and their overall effect is
significant. Firstly, Sweden has an aging population. In the next �0 years, the
number of people over �0 years old will increase by 60 percent and, with average
health care costs rising as people get older; this implies a dramatic increase in
the cost of health care and care for the elderly.
Secondly, technical advances mean that it is possible to treat and cure more
ailments, further adding to health care costs. For public health, this is positive,
of course; but for the economy, it is an extra burden. New medicines and medical
equipment increase costs. As an illustration, the cost of medicines increased by
9.1 percent per year between 19�5 and 2000, significantly more than the annual
increase in business consumption of 5.6 percent, or the consumer price index
—�.1 percent—over the same period.
Thirdly, demand for welfare services increases as our expectations rise along
with our prosperity. Income elasticity is high in the health care sector – for each
1 percent increase in an individual’s income, that individual is prepared to raise
the sum paid for health care by more than 1 percent. Because health care in
Sweden is largely publicly financed, this means higher public spending if this
demand is to be met.
wEAK joB CrEAtIon IS ACCEntuAtED By GloBAlIzAtIon
Globalization is driving a quicker pace of industrial restructuring in many countries.
This increases the need of swift reinvention of industries and innovation to replace
jobs that have moved to low-income countries. It is likely that between 100,000
and 200,000 Swedish jobs will disappear over the next decade, corresponding to
2-4 percent of all employed in Sweden. These jobs will have to be replaced. The
production capacity of, and exports from, low-cost countries in Asia and Eastern
Europe have increased rapidly in recent years. For example, exports from China
have nearly tripled in only four years between 2001 and 2005 from $266 billion
to $762 billion. Simultaneously, India has more than doubled its exports from
$45 to $95 billion.
These developments have been driven by two major factors. Firstly, wages in
low-cost countries are only a fraction of those in the western world. The average
wage of an Indian or Chinese manufacturing worker is one twentieth of the

62
Exhibit 35
5
100
15
60–65
5–1045–55 6–10*
5–72–33–5
30–35
Offshoring generates significant cost savings through lower labor cost and operational improvementsCost savings in offshored operations
Note: Offshoring = moving production of products and services abroadImprovement savings depend on the current status of the process (i.e., current level of automation, centralization, economies of scale, and scope for re-engineering)
Source: McKinsey – Changing the Game Through Global Operations
Original cost base
Factor cost savings
Additional telecomcosts
Additional management cost
Off-shore location cost
Consoli-dation & standardi-zation
Skills and training
Task reengin-eering
Economies of scale
New cost base
Process reengin-eering
Task migration Task level improvement Task aggregation and process level
improvement
45–55% savings attributable to labor 30–40% savings because of operational improvements
average Swedish manufacturing worker; $0.� and $0.7 per hour compared to
$20 per hour. Even with the cost of transporting the goods back to the west, this
still means very large savings. Secondly, the domestic markets in these rapidly
industrializing economies are growing very quickly as customers’ purchasing
power increases. Many western companies see a substantial selling opportunity
here, making offshoring doubly attractive. As an illustration, China’s private
consumption tripled from 1990 to 2004, from $192 to $595 billion in fixed
prices—an annual increase of more than � percent.
Manufacturing offshoring is well established and has been ongoing for many
years, but now services production has started to move offshore as well. Again,
the cost differences are enormous—when services production is offshored,
lower wage costs usually cut total costs by half. However, the cost savings do
not only come from labor; it is also possible to improve processes when they
are established from scratch in a new country. These operational improvements
often generate further cost savings of �0 to 40 percent (Exhibit �5).

6�
Given these developments—and the need to replace the jobs moved offshore
—Sweden’s poor record of job creation in the service sector becomes serious. For
every $1 equivalent of a job moved from the US to a low-cost country, $1.14 to
$1.17 is created in the United States. The value created comes from profits that
are repatriated, American consumers that experience cost savings, and a dynamic
labor market that manages to reemploy the person that has been laid off. So the net
effect of offshoring of services on the United States economy is positive. In addition,
up to another $0.�0 value is created in the receiving economy. All in all, for every
service dollar that is offshored from the United States, around 45 cents additional
value is created for the world economy; everyone wins.
When a similar service job is offshored from Sweden, the outcome is somewhat
different. Because Swedish companies most often offshore to eastern Europe
(which is more expensive than China and India, the favorite offshore locations of
American companies), and because of Sweden’s weak ability to create replacement
jobs, only SEK 0.�5 in value is created for each SEK 1 that is offshored. Thanks
to the positive effect in the receiving country, the impact on the world economy
is still positive, but at present Sweden is a net loser (Exhibit �6). This problem
is not unique to Sweden—France, Germany, and Denmark all create less than
one unit of domestic value every unit service value that is exported offshore.
Exhibit 36
Offshoring can be good for both countries, but it is currently negative for Sweden due to weak reemployment rates
Note: Offshoring = moving production and services abroadSource: McKinsey analysis
Return to the country’s economy from offshoring USD/EUR/SEK 1 of corporate services
0.36
Value of labor reemployed
Direct benefits
Cost savings for customers and investors
1.14–1.17
0.57
0.07–0.09
0.50–0.530.36
0.44
0.86
0.03–0.09
0.34
0.74–0.80
US France Germany
1.00
0.05
0.33
0.46
~0.84
Sweden
0.05
0.30
0.58
~0.93
Denmark
0.05

64
However, Denmark, for instance, achieves DKK 0.9� for every DKK 1 offshored,
significantly closer to making the offshoring equation positive. The key reason is
that Denmark has achieved a higher reemployment level.
It is vital, as globalization and global competition continues to increase, that
Sweden improves its ability to create new jobs.
there is scope for action, but time is short
As the pressure grows on Sweden’s economy, it is clear that major changes
are needed to improve and sustain the country’s economic growth; to maintain
and improve economic welfare; and to ensure financing and quality in the public
sector. Because economic growth has been strong over the past decade, a
window of opportunity to implement the necessary measures has been created.
It will, of course, take several years for the necessary reforms to have a full
effect, but each year that passes will make it harder for Sweden to achieve its
goals. Indeed, there is a risk that Sweden will find itself in a vicious circle in
which higher taxes inhibit job creation even more than now, and this weakness
in the labor market necessitates ever higher taxes. Sweden must not wait before
implementing the correct measures, but take action now.

65

66

67
RecommendationsHIGH AMBItIonS for tHE SwEDISH EConoMy rEquIrE SIGnIfICAnt
IMProvEMEntS
Sweden must act promptly to get progress started on the areas of the economy
that have not been functioning very well over the last decade. It must generate
more employment opportunities and increase productivity in the public sector at
the same pace as in the private sector; and it must act to ensure that productivity
in the private sector continues to develop at, or beyond, the pace achieved over
the last 10 years.
If Sweden is to create sufficiently high, sustained growth to increase economic
prosperity overall, and over time bring Sweden back to the 1970 level compared
to other countries, the country must set its ambitious targets for what needs
to be achieved in several areas. First of all, the aim for each sector should be
to become the most productive in the world. This includes the public sector, if
Sweden is to be able to deliver world class social services. Second, the target
should be to create at least half a million net new jobs over the next decade.
Given that between 100,000 and 200,000 jobs will be rationalized or moved to
low-cost countries over the same time period, between 600,000 and 700,000
new jobs need to be created – gross. The example of Great Britain demonstrates
that this is not unrealistic; it is, moreover, essential given the challenges Sweden
faces.
tHrEE PrIorIty ArEAS for ACtIon
Looking at the messages from our detailed analysis of certain industrial sectors
and the macroeconomic picture, it can be concluded that Sweden should focus
on three key priorities for creating higher growth.

6�
Firstly, competition in the private sector needs to be increased even further so
that its strong productivity growth can continue. Over the last 10 years, the
private sector has achieved strong growth in labor productivity and this has been
decisive for the economy as a whole. However, since it has rested partly on one-
offs such as the deregulation of industries with weak productivity to start with,
it is not certain that productivity growth can match the pace of the last decade
without further action to remove remaining barriers and boost competition.
Sectors such as construction should be prioritized.
Secondly, public sector productivity growth must be accelerated given that forecast
demographics and Baumol’s disease threaten to bring Sweden to a position in
which it will be very hard to finance its current level of welfare provision. If that
happens, it is likely that the quantity and/or quality of publicly provided services
must be lowered. To avoid this, productivity growth in the public sector must be
increased to a similar pace as in the private sector.
Thirdly, Sweden must improve job creation in the service sector in view of its
importance to overall employment in the economy and an ongoing migration of
jobs from manufacturing to service sectors. Sweden’s low ability to create jobs in
the private service sector has been outlined above. For example, between 1992
and 200�, the Netherlands created over three times as many service jobs in the
private sector (as a share of the working age population) as Sweden did (1�.5
versus 4.0 percent). Solving this problem is of great importance to the national
economy.
If Sweden can successfully tackle these areas, it will significantly improve its
economic prosperity. If private sector productivity growth can be sustained at 1
percent above the OECD average, and an extra 500,000 new jobs are created,
Sweden would come close to the level of Switzerland in terms of GDP per
capita (adjusted for purchasing power). In the OECD’s GDP per capita ranking,
Switzerland currently stands in fifth place – the position Sweden held in 1970.
No single economic stakeholder can achieve the necessary change in these
three areas acting alone. Policy makers, businesses, and labor unions all need
to contribute. When all three stakeholders understand what is required to drive
the development, the best results are achieved, as can be exemplified by the
strong development in the automotive sector.

PolICy MAKErS SHoulD IMProvE ConDItIonS for ProDuCtIvIty
GrowtH AnD DECrEASE tHE totAl CoSt of lABor
Given the three prioritized areas of change, policy makers have a very important
role to play. They cannot, however, make all the necessary changes since the
employers’ organizations and the unions have a strong role in creating the
conditions of the Swedish labor market.
Stimulate continued private sector competition
Sweden needs to build on those fronts that have been shown to contribute to
increased productivity through increasing competition – deregulation, building on
its EU membership, and competition laws.
A great deal has already been achieved at a sector level but more remains
to be done. The list of “must dos” in the construction industry, for instance,
is long. Sweden needs to simplify zoning laws and improve the use of its
functional construction code; adopt common EU material standards; and take
action to reduce the informal sector. In retail banking, it needs to look again at
competition-inhibiting volume discounts in payment systems. In retail, it needs
to place further emphasis on opening up possibilities for new participants in
the market, mainly within food retailing. All these measures should increase
competition and therefore productivity and economic prosperity. A more detailed
discussion of those measures necessary at a sectoral level can be found in the
full report that describes in detail the sector analyses carried out in this study.
Sweden’s accession to the EU has already had large, positive effects in the
sectors we have studied, including, for example, the food processing industry.
Sweden could potentially leverage its EU membership further by, for instance,
pushing for an expanded services directive. However, the Vaxholm conflict
demonstrates the tensions that may come from exposing previously shielded
sectors to international competition. It is nevertheless important for the overall
economy to do so. Profits and high wages should be generated by high productivity,
not by entry barriers against new market participants.
The role of the Swedish Competition Agency has already been strengthened and
its work should be further entrenched. There are many examples of areas where
it should pay attention to the industry structure, including the value chain in
69

70
dairy and meat production, construction materials, and food distribution. Similar
examples can be found in a number of industries outside the scope of this
study.
Given strong evidence of how important competition in product markets is for
the broader economy, Sweden should consider what additional measures it could
take to promote competition. One aim in some sectors could be to increase
customers’ willingness to switch provider – competition only works effectively
when customers will systematically change to better or cheaper products and
services on offer. More customer mobility can be achieved by helping consumers
to evaluate quality and pricing in areas where it is difficult or time-consuming to do
it alone. A number of tools are already available; there is, for instance, Råd&Rön,
a newspaper published by the Swedish Consumer Agency; Telepriskollen, an
Internet service provided by the Swedish Postal and Telephony Board; and food
price comparisons compiled by the National Pensioners Organization. It is likely
that all of these can be enhanced and strengthened. It would also be useful to
improve rules governing the movement of capital in the finance sector; which
today impose a “switching tax” on several financial products, discouraging
consumer mobility.
Increase public sector productivity
In the light of forecast demographic developments, Baumol’s disease, and the
fact that �0 percent of employees work in the public sector, healthy productivity
in this sector is central for the economy as a whole. Without strong productivity
growth in the public sector, it will be impossible to finance today’s levels of
publicly funded services in the future.
Politicians have a high degree of influence over the public sector. It will therefore
be largely up to them to stimulate the kind of productivity improvements in the
public sector that have proved possible in the private sector – even in service-
intense industries such as retail and retail banking. They must learn from the
private sector experience and create similar productivity improving mechanisms
in the public sector.
A number of key conditions need to be in place. Firstly, it is vital that productivity
in the public sector can be measured. Since output from the public sector is not
measured, it is not possible to measure growth of productivity either. This must

be changed to create the transparency required and to make it possible to drive
improvements.
Secondly, productivity targets need to be formulated and performance against
those targets tracked. Owners that set clear and ambitious targets for improving
quality and cost efficiency contribute to productivity improvements. Managerial
responsibility for meeting these targets need to be established at all levels and
a system of continuous follow-ups instituted. Since productivity can be boosted
through increased output, focusing on productivity instead of costs can transform
the discussion about the public sector.
Thirdly, competition must be intensified. As the private sector has shown,
increasing competition produces productivity gains in itself. At this point, it
is important to state that increased competition does not necessarily mean
privatization; it can be introduced even if production remains publicly-owned. A
patient may, for instance, be given increased rights to choose a hospital for his
or her treatment.
As Sweden attempts to improve labor productivity in the public sector, it must ensure
that measures are tailored to existing conditions so that quality is preserved.
Increase demand for labor
The high total cost of labor hinders demand and thereby the number of jobs
created in Sweden. Demand is not lacking per se – in principle, demand for labor is
unlimited in any country; the problem is that, at current prices, supply and demand
for labor are not matched. Sweden’s failure to create enough jobs is especially
clear, as we have seen, in service industries. Policy makers therefore need to
prioritize removing barriers, which are acting against job creation in this sector.
The goal should be to lower the total cost of labor so that demand and supply
can be better matched. An obvious way to achieve this is through lower tax
wedges. This will, of course, have an impact on the public finances but, given
the challenges facing Sweden, the consequences of doing nothing will be
even greater. To limit the effects on the public finances, action could focus on
those sectors where tax wedges have the greatest effect – sectors, as we have
outlined above, that are labor- intensive; small-scale with a significant degree of
informality; with services that are sold directly to consumers; where there is a
71

72
Different ways of Addressing tax wedges for labor
It is beyond the scope of this study to describe in detail how to reduce tax
wedges for labor but there are several ways of doing it. Measures can be
classified according to where they are located in the value chain. One category
would include action that cuts costs for producers – for instance, lower
employers’ social contributions, or higher employee tax deductions that give
employees an unchanged net salary, while reducing the gross salary. Another
category of measures would cut costs for consumers – for example, lower
value-added tax (VAT); or the right to tax deductions for services.
Especially when it comes to the first category, policy makers, employers’
organizations, and unions, must all work together to ensure that lower costs
for producers are passed onto consumers in the form of less expensive
products; otherwise, the desired impact on demand will not materialize. In
an intensely competitive environment, this is likely to happen in any case,
but it still up to politicians, the media, and interest groups to keep an eye
on developments and sound alarm bells if producers fail to pass on these
savings to their customers.
It is unlikely that employee tax reductions can be focused on any particular
sector, meaning it must most likely be introduced economy-wide, and hence be
more expensive. Collective bargaining agreements must be reworked at the
same time as employee tax reductions are introduced to avoid all the savings
made going directly into salaries rather than lower prices of services.
limited productivity difference between contractor and customer; and in areas
of high price sensitivity. One measure already attempted has been the ROT-
deductions (tax deductions for refurbishment) in the construction sector.
Another way to lower the total cost of labor is to reduce relative net wages, either
by lowering nominal wages or by lowering real wages over time. The latter is more
likely to be acceptable to employees and therefore more feasible to achieve.
Since the benefit levels in the welfare systems act as a lower limit for wages,
creating a de facto minimum wage, the relative cost for low wage labor can be
lowered over time by reducing the benefit levels. This would have the advantage
of being self-financing but the disadvantage that, during a period of low inflation,
it takes a long time to adjust real wages. If this measure is chosen, it may have
to be combined with a higher inflation target.

Create the flexibility needed for rapid economic restructuring
Apart from the three priority areas outlined above, Sweden should also improve
its ability to sustain swift economic restructuring. As discussed earlier, Sweden’s
labor market is characterized by a certain degree of inflexibility. This does not
only limit the pace of structural change in the economy, but also contributes to
low entrepreneurship levels in Sweden. By changing the model from security
in the job one already has, to security in knowing that a new job can be found
should the old disappear, the inflexibility should decrease. The Danish example of
“flexicurity” demonstrates that it is possible to combine Anglo-Saxon flexibility in
the labor markets with Scandinavian-style unemployment support and benefits.
The Danish model may not be something Sweden can, and should copy in its
precise form, but it is a powerful illustration that other models are possible.
CoMPAnIES MuSt ContInuE to IMProvE
A company’s role in the society is to deliver value to its share holder. This, coupled
with well-functioning markets, is closely correlated with a country’s economic
improvement, as productivity improvements that increase the economic prosperity
also lead to higher profits.
The development of the private sector has been of decisive importance to
Sweden’s relative economic success over the past decade, and it is important that
businesses continue to deliver productivity improvements. The broad spectrum
of strategies and operational improvements that are possible lie outside the
scope of this report; nevertheless, it is worth drawing out some of the lessons
from the sectors we have studied.
Firstly, large productivity improvements are almost always possible – the
construction sector could, with the right conditions in place, do just as well as the
automotive sector. The automotive industry is probably the most advanced industry
of all industries in the economy and has still had a productivity improvement of
around � percent annually in Sweden, and around 5 percent in Japan and France.
Many sectors with low productivity improvement, e.g., construction, would most
likely be able to achieve higher productivity improvement, and the companies
that are leading the development would be more successful.
Secondly, taking advantage of protectionism in a sector is not an excuse for low
productivity. Individual companies like IKEA and H&M in retailing show that it is
7�

74
possible to develop highly productive and internationally competitive companies
even in markets that have traditionally been protected from intense competition
by product market barriers.
Thirdly, again as illustrated by IKEA and H&M, securing high productivity at home
creates opportunities for international expansion, and thereby increase value
for shareholders. Companies in those sectors with higher productivity than
their international counterparts are most likely to benefit from more ambitious
international expansion.
A final lesson is that barriers will not hold forever. For a while, companies
(and employees) in protected sectors can achieve good returns on capital and
labor. However, when the sectors are opened to international competition, as
happened in Swedish retailing and processed food over the past decade, low
labor productivity becomes apparent and restructuring is quick and painful.
lABor unIonS SHoulD StEP uP EffortS to BooSt ProDuCtIvIty
Labor unions have a strong position and play an important role in the Swedish
economy. Over the past 10 to 15 years, they have, on the whole, been a positive
force, accepting the need for restructuring, and contributing to responsible wage
development. That said, the labor unions’ mission – to act in the interest of their
members – is not always in the interest of the overall economy. Having said that,
different unions face different challenges and commenting on how labor unions
should act is therefore a complex issue.
In those sectors that are already under pressure from increasing international
competition (or are about to be), labor union members can reap the benefits
of productivity improvements that make their companies more competitive and
therefore create better conditions for keeping their jobs and winning real wage
increases. In many industries, labor unions have recognized this causal chain
and have, for some time, worked in cooperation with employers to increase
productivity. The automotive industry is a good example – close cooperation
between the labor union and the automotive industry has been a key reason for
the strong development in the sector.
Labor unions in sectors exposed to global competition should therefore demand
that employers act to increase productivity. They should also urge product market
barriers and trade barriers to be removed. Furthermore, they should promote

increased productivity in those sectors that are currently relatively shielded from
global competition. Labor unions representing members in such sectors may feel
it is rational in the short-term to oppose productivity improvements that involve
industry rationalization. However, since a large proportion of an individual’s
consumption takes place in Sweden, lower productivity in sectors such as
retailing and construction has a negative effect on the purchasing power of a
worker from a productive sector such as automotive. It is in the interests of the
labor unions to see productivity rise throughout the economy. For example, other
labor unions should demand that the construction industry and the construction
workers’ union should allow more international companies to enter the market
and increase competition. Labor unions have definite scope to play an even more
constructive role in modernizing those sectors of Sweden’s economy that have
been held back by protection and rigidity.
Labor unions in sectors that are domestic (and not exposed to global competition)
often have a more indecisive role in productivity development. Without competitive
pressure it can sometimes be rational in the short term for these labor unions
to oppose productivity improvements that leads to rationalizations. This is only
valid if looking only at the own members. If the objective function is widened to
include, for example, the members of other labor unions or even all employees,
the picture changes. The productivity improvements that take place in one sector
result in positive effects that spread to employees in other sectors and lead to
higher real wages. Even individuals that are not working benefit from productivity
improvements, since they are consumers. In this way productivity improvements
are a way of being equitable to all groups in the society.
Historically, many labor unions have been good at understanding and acting on
these wider consequences, but there are examples of unions that can improve.
In the individual sectors that have been analyzed in this study, there are two
examples in particular. The retail workers’ labor union Handels, whose higher
wages during evenings and weekends shorten opening hours and shift them to
hours not optimal for the customers, and the construction workers’ labor union
Byggnads, whose rigid division of tasks increases cost for construction, leading
to inefficiencies that limit demand and employment.
It should thus be in all labor unions’ interest to work together with employers to
significantly increase productivity. Only through strong productivity development
75

76
can jobs in the long run be sustained and created. Since increased productivity
in the economy leads to improved real wages for employees (through salary
increases and/or price decreases) the incentive for labor unions to actively work
for improved productivity should be even stronger.
* * *
Sweden has experienced a period of strong economic development over the past
decade but there have been weak spots – notably, its ability to create new jobs
and its failure to promote higher productivity in the public sector. Sweden is now
entering a particularly challenging period with difficult demographic developments
on the horizon and globalization forcing industrial restructuring. It needs to act now
to improve the performance of the economy, and secure the financing and quality
publicly provided services. Therefore, all the key stakeholders – policy makers,
labor unions and companies – must collaborate to improve productivity in both the
private and public sector, and improve job creation in the service sector.

77

7�

The Swedish Automotive IndustryEXECutIvE SuMMAry
In 1995 the McKinsey Global Institute (MGI) identified Swedish heavy vehicle
manufacturing as leading in labor productivity (value added per hour worked)
improvement, of the compared countries, and Swedish light vehicle manufacturers
as trailing the US and Japan. Since then, overall labor productivity in the Swedish
automotive industry has made a remarkable improvement, taking the entire
Swedish automotive industry to a shared top position among the compared
countries in labor productivity. In addition, Swedish employment levels in the
industry have grown.
In the 1995 MGI study, Swedish heavy vehicle manufacturing was identified as
the labor productivity benchmark country, approximately 7 percent ahead of tier-
two countries. The main factor behind the high Swedish labor productivity in
the early 1990s was that Scania and Volvo Trucks had been exposed to high
competition due to a significant presence in foreign markets, many dominated
by local companies. In light vehicles, Sweden was about 2� percent behind the
US and Japan. The reason for this was that the segment within which Saab
and Volvo were competing had not, until a few years before, become seriously
exposed to competitive pressure from Japanese car manufacturers.
Since then, labor productivity in the Swedish automotive industry (light and heavy
vehicles plus suppliers) has improved remarkably. At the same time, employment
creation has been slightly positive, showing that it is possible to have a strong
starting point and still increase both labor productivity and employment at the
same time.
79

The key driver of the strong development in Sweden since the early 1990s
has been improved operational performance, resulting from implementation
of lean manufacturing principles and improved sourcing of components. In the
heavy vehicle industry, commonality in parts and price premiums on Swedish
products have also contributed to the strong development. Within light vehicles,
innovation and the commercial success of Volvo Cars can also explain some
of the strong development. Volvo Cars has grown significantly since the early
1990s, and has been able to become more of a premium product with higher
revenue per vehicle. Among suppliers, development has been driven by internal
company efficiency and the elimination of less productive companies. Finally,
strong cooperation between labor unions and companies has been an important
contributor to development.
This remarkable development has taken the Swedish automotive industry to
a shared top position among the compared countries in labor productivity.
Sweden’s labor productivity is at level with Japan’s and 5 percent better than
the US.
In the future, the entire industry will continue to face an intense price-cost
squeeze. In light vehicles, the price-cost squeeze is created chiefly by fierce
competitive intensity and high overcapacity in the industry. In heavy vehicles,
stricter regulations (e.g., environmental regulations) and cyclicality are the
key drivers of the price-cost squeeze. Outsourcing will most likely continue
to increase, especially to suppliers in low-cost countries. Innovation and
operational performance will continue to be crucial factors for automotive
companies.
To be successful in this challenging industry, labor productivity has to be
continuously improved. Further operational improvements, innovation and
product development are forecast to be the major areas driving future labor
productivity improvements.
�0

�1
PErforMAnCE In tHE SwEDISH AutoMotIvE InDuStry
Introduction
This study provides an assessment of the Swedish automotive industry at a
national industry level, considering both light and heavy vehicle manufacturers
as well as their suppliers. Since the sector is studied at a national level the
result is not one to one comparable to company performance. The lack of
comparability can be explained by several factors. For example, most companies
have significant foreign operations that are not included at the national industry
level. Furthermore, company performance include financial transactions which
are excluded at the national automotive industry value added (instead included
in the financial sector), and the national industry level includes suppliers which
are not included in company performance. The industry is studied from a national
perspective, rather than at a company level, since we want to understand what
effect the automotive industry has had on the national economic development
and how further improvement of the Swedish automotive industry can be
facilitated in Sweden.
McKinsey Global Institute (MGI) did a similar study of the Swedish automotive
industry in the early 1990s. The study and the development since then
can provide insight into what can be done to further improve the Swedish
automotive industry.
To assess the progress of the Swedish automotive industry, the improvement
in labor productivity (value added per hour worked) and employment creation
are studied and compared to other countries. Because of the small numbers of
original equipment manufacturers (OEMs) in the Swedish market, those individual
companies will be examined in more detail later in the report. We believe that
the automotive case study provides an important contribution to the overall
discussion of labor productivity and employment creation, for several reasons:
The automotive industry is one of Sweden’s largest sectors. Even though
it is highly automated and only four OEMs have manufacturing operations
in Sweden, the sector supports a vast network of sub-suppliers, employs
a relatively high percentage of Swedish employees, and accounts for a
large portion of major Swedish research and development investments
and exports.

�2
The automotive industry has been one of the more successful Swedish
sectors since the early 1990s, and it offers important insights regarding
factors driving labor productivity and employment creation.
The continued increase in international trade and globalization strongly
influences this already global industry. The overall effects of global
demand, outsourcing, and, in particular, sourcing from low-cost countries
can be better understood by looking at the development of the automotive
industry.
tHE AutoMotIvE InDuStry In SwEDEn
Automotive manufacturing represents as much as 2.� percent of Sweden’s
GDP. The industry is cyclical, and overall demand is largely driven by economic
development. In Sweden the industry consists of a large number of suppliers
and four dominant OEM companies, Saab Automobile, Volvo Cars, Volvo Trucks,
and Scania. The four Swedish OEMs together produce around 500,000 light
vehicles (equal to about 0.1 percent of global production), and around 200,000
heavy vehicles (equal to about � percent of global production).
The four OEMs employ nearly 110,000 persons, of whom 45,�00 are employed
in Sweden. Looking at the entire automotive industry, including suppliers
categorized as part of the automotive sector, the number of employees in
Sweden reaches approximately 76,000, which is the number used in this report.
The number of employees is based on a segmentation of companies and sub-
segments of companies that are categorized as belonging to the automotive
industry according to national accounts. When looking outside of the defined
automotive industry, an additional, 64,000 employees are estimated to directly
depend on the automotive industry (e.g., as sub suppliers to the industry that are
not included in the definition of the automotive industry), resulting in a total of
around 140,000 employees in Sweden who directly depend on the automotive
industry. When studying the automotive industry in this broader context,
the total revenues for the industry are estimated to be 450 billion SEK per
year. In addition, the industry accounts for approximately 20 percent of the
total research and development investments in Sweden and 15 percent of
Swedish exports.

��
Automotive OEMs participate in two segments:
Light vehicles include Volvo Cars, which has been owned by Ford Motor Company
since 1999, and Saab Automobile, which was acquired by General Motors
Corporation in 2000. Ford and GM are two of the largest car manufacturers
in the world.
Heavy vehicles include Volvo Trucks and Scania. Volvo Trucks acquired Renault
and Mack in 2001 after having sold the car division to Ford in 1999.
InDuStry PErforMAnCE
the starting point of the sector as defined in the 1995 study
In the 1995 MGI study, Swedish labor productivity in light vehicle manufacturing
trailed the US and Japan by 2� percent while labor productivity in heavy vehicle
manufacturing was leading (Exhibit 1). Combining labor productivity for light and
heavy vehicles into a weighted average put Sweden 19 percent behind Japan
and 21 percent behind the US (Exhibit 2). Job creation for the entire Swedish
automotive industry also lagged Japan, which created 2.6 more jobs per thousand
working age population than Sweden and the US, which created 1.2 more jobs
per thousand than Sweden.
Light vehicle manufacturing had lower labor productivity than the compared
countries due to (historically) less competition and the complicated structure of
labor unions, resulting in less developed operational performance. Less tangible
but nonetheless important are perceptions about manufacturing difficulties and
supplier relationships which also influenced labor productivity outcomes:
Less competition in the Swedish light vehicle industry inhibited competitive
pressure until the early 1990s. Japanese companies had a large share
of the Swedish market, but the Japanese were not yet fully competing in
Volvo and Saab’s major market segment. However, by the early 1990s, the
Japanese luxury models were putting pressure on Volvo and Saab in both the
European and US markets. The appreciation of the Krona in the second half
of the 19�0s intensified the pressure from foreign competition. Volvo and
Saab’s earnings came under serious pressure in 1990, and the companies
responded by reducing employment by �0 percent and starting in earnest to
implement Japanese best practice operational excellence.

�4
Exhibit 1
61
79
103
103Japan
US
Sweden
76***Germany
France
Productivity in light vehicles Productivity in heavy vehicles
* Data for Sweden is from 1993** With new methodology and data, national levels are calculated instead of company-specific levels (as was done in the 1995 report)
*** Adjusted in accordance with later MGI studies of the German automotive marketSource: OECD National accounts; national construction surveys; national statistics; annual reports; census of manufacturers; McKinsey analysis
Value added/hour worked at industry PPP Value added/hour worked**
32
53
73
75
79Sweden
Germany
US
Japan
France
1992/93*, index US productivity for overall motor vehicles = 100
In a 1995 MGI study, Sweden’s labor productivity lagged in light vehicles but led in heavy vehicles
Exhibit 1
Exhibit 2
Japan
US
Sweden
Germany
France
Productivity for light vehicles
Japan
US
Sweden
Germany
France
Productivity for heavy vehicles
Japan
US
Sweden
Germany
France
Productivity for motor vehicles
* Data for Sweden is from 1993Source: Global insight, October 2005; McKinsey analysis
1992/1993*, index US productivity for overall motor vehicles = 100
61
76
79
103
103
32
75
79
73
5360
76
79
100
98
Productivity for light and heavy vehicles can be aggregated into an overall motor vehicle productivity index
Exhibit 2

�5
Complicated structure of unions. Unions in the Swedish automotive industry
were structured along craft lines: different unions represented different types
of workers. Rigid job classifications and work rules can pose barriers to
productivity in any situation, but they can present even greater barriers if
different unions represent workers whose job classifications are to be merged.
Since the 1990 to 199� recession, however, the unions have become more
flexible about accommodating the changes required for company survival
Less developed operational performance was the consequence of limited
competition and the complicated structure of unions. Volvo Cars allowed
teams of workers to set their own production pace as long as they met a
quota. In contrast, plants with lean production teams aggressively drive to
continuously improve performance by eliminating unnecessary work.
Another important factor was the misperception that Volvo and Saab had
products that were among the most difficult to manufacture and that they had
difficulties developing close and productive relationships with their suppliers.
Heavy vehicle, on the other hand, had the highest labor productivity of the
compared countries due to high competitive exposure and the use of modular
components, which make flexible production possible:
High competitive exposure domestically promoted labor productivity, as did
exposure to competitors in other markets. Scania and Volvo have a small
home market and approximately 90 percent of European sales were in either
competitive markets or in other players’ home markets.
Modular components also promoted productivity. Swedish manufacturers,
especially Scania, developed modular components that enabled them to
produce a wide range of vehicle varieties while still achieving scale economies
in parts production, design, and procurement.
Employment creation in the Swedish automotive sector was low, as indicated in
the 1995 report, due to low domestic demand and increased competition from
new entrants:
Low domestic demand affected employment in Sweden. Contributing factors
to the lower domestic demand were steep increases in gasoline taxes, slow
growth in household consumption during the 19�0s, and decreased spending

�6
on cars and other consumer durables after the economic crisis in the first
years of the 1990s.
Increasing domestic competition due to new entrants putting pressure on
prices. The need to reduce costs to competitive levels limited employment,
led to layoffs in the industry, and resulted in negative employment creation.
labor Productivity and Employment Development since the Early 1990s
The increase in labor productivity in the Swedish automotive industry was
remarkably strong between 199� and 200�. Labor productivity has increased
by nearly � percent and simultaneously employment creation has been positive
(Exhibit �).
Using the 1995 MGI study as a point of reference, it may be seen that the
improvement in the Swedish automotive sector between 199� and 200� has
taken Sweden to a top position in labor productivity, compared to the studied
countries, while resulting in new jobs (Exhibit 4). Of the OEMs, Scania has been
the main contributor to employment growth, representing nearly �0 percent of
the total OEM job creation (Exhibit 5).
Exhibit 3
1992/1993–2002/2003* percent
* Swedish productivity data is from 1993 to 2003. For Japan, productivity and net job creation are from 1992 to 2002. Other countries are from 1992–2003
** Total number of people engaged in sectorSource: Groningen 60-industry Productivity database Oct 2005; McKinsey analysis
Size in percent of 2003 value add (current prices)
50-5 10
US
UK
Germany
Sweden
NetherlandsIreland
Net job creation** (% of population 15–64)
Labor productivity change, CAGR
0
15
Japan
France
0.15
0.10
0.05
-0.05
Labor productivity and employment in the Swedish automotive industry have improved significantly
Exhibit 3

�7
Exhibit 4
Productivity in motor vehicles, 2003Index US 1992 =100
Automotive industry employment developmentChange in people engaged per 1,000 working age population, 1992–2003
-0.3
0.5
1.2
0.6
-0.1
Japan
US
Sweden
Germany
France
Source: Groningen 60-industry Productivity database Oct 2005; McKinsey analysis
169
161
169
101
104
Japan
US
Sweden
Germany
France
Sweden has improved its position in labor productivity and has simultaneously created jobs
Exhibit 4
Exhibit 5
Thousand employees
* Including Mack and Renault, acquired in 2001Source: Annual reports; Volvo trucks fact sheet Q4 2003; company webpages; interview; McKinsey analysis
Volvo Cars Saab
28.2
2003
26.8
1993
7.9
1993
7.0
2003
Volvo trucks Scania
1993
17.8
19.3
2003
46.9*
1993 2003
18.6
29.1
Light vehicles Heavy vehicles
Scania has contributed to ~80% of the employment growth among the Swedish OEMs
Exhibit 5

��
Developments have been different in the other countries examined:
The US had strong labor productivity improvement of 4-5 percent annually
between 1992 and 200�. The root of this improvement has been intensifying
competition in the American market, mainly caused by Japanese entrants.
Instead of focusing primarily on operational efficiency to increase labor
productivity, product development has been the key driver for the American
progress. Light trucks, especially sports utility vehicles (SUVs), which
have higher value-added than average cars without being much harder to
manufacture, have powered the improvement. Other factors driving the US
labor productivity growth are reduced product variety and complexity, as well as
lean manufacturing and overhead reductions. However, despite strong labor
productivity increases, US car manufacturers have experienced significant
challenges from foreign competition. To counter the competition, prices have
declined significantly, and the American players are now in financial crisis.
The outcome of this crisis is still unclear.
Japan has also had strong labor productivity improvement of approximately 5
percent annually between 1992 and 2002. The labor productivity improvement
in the Japanese automotive industry has been limited by their focus on small
cars, which add less value than average cars. It is noteworthy that Japanese
companies are not facing strong competition in their home market. Only 5
percent of sold cars are imported, which could indicate that competition is not
necessary for labor productivity improvements. However, Japanese companies
have been heavily export-oriented and faced competition overseas, which has
stimulated labor productivity improvement.
France has also had strong labor productivity improvement of approximately 5
percent between 1992 and 200�. The improvement has been driven by better
product quality, stronger operational efficiency, and reduced intermediate
input prices. Product quality improvement is partially due to French car
manufacturers catching up with OEMs in other countries. Stronger operational
efficiency is mainly due to implementation of lean manufacturing, which has
decreased labor time per car by 6.6 percent. This can be compared to an
increase of 4.� percent in Germany. Additionally, reduced input prices have
been achieved by improved purchasing and design simplifications. The French
automotive industry went through a truly fundamental improvement wave in
the mid 1990s, which is reflected in the strong labor productivity growth.

�9
Germany has had 2.6 percent labor productivity growth between 1992 and
200�, which is the weakest of the five compared countries. There are several
reasons for the weak development. First, vehicle programs in Germany show
higher variation and product complexity than in other countries according to
MGI studies. This creates inefficiencies in production which leads to lower
labor productivity. Second, Germany struggles with a high overcapacity in the
domestic automotive industry, which affects labor productivity negatively.
Third, the German automotive industry has not been able to fully capitalize on
increased outsourcing. Between 1996 and 1999, increased outsourcing led
to a fall of 1� percentage points in vehicle value-added as a percentage of
sales, while labor cost fell by only 6 percent.
factors Explaining the Swedish Development
The Swedish automotive industry has been a success story since the early
1990s, with strong sales growth in all four Swedish companies (Exhibit 6). The
substantial labor productivity improvement has been driven by both the largest
decrease in working hours per vehicle of the compared countries, and strong value-
added development per vehicle, which included both OEMs and suppliers (Exhibit
7). Despite different drivers and development in the different sub-segments, all
segments enjoyed operational improvement and increased outsourcing, as well
as good cooperation between the labor unions and the companies:
Operational improvement and increased outsourcing have resulted in a large
decline in hours worked per vehicle (Exhibit �). The Swedish improvement
can be explained by the increased implementation of lean manufacturing
principles. The Swedish automotive industry has also increased outsourcing
and created stronger relationships with suppliers, both of which have
facilitated labor productivity improvements.
Cooperation between labor unions and companies has been good and enabled
the strong labor productivity improvement. Both labor unions and companies
have understood that labor productivity improvement is essential to making a
company competitive, thereby securing jobs in the long run.

90
Exhibit 6
Number of vehicles sold, thousands
Light vehicles
Heavy vehicles
Volvo cars
Volvo trucks
Saab
Scania
* Including Mack and Renault, acquired in 2001Source: Annual reports; Volvo trucks fact sheet Q4 2003; company web pages; interview; McKinsey analysis
312
1993
416
2003
132
2003
74
1993
7551
1993
156*
2003
26
1993
50
2003
CAGR+2.9%
CAGR+6%
CAGR+3.9%
CAGR+6.8%
Swedish companies have all increased sales volumes from 1993 to 2003ESTIMATE
Exhibit 7
Exhibit 7
Percent; CAGR 1992/93–2002/03*
* Data for Sweden is 1993–2003, for Japan 1992–2002, and for the rest 1992–2003** Includes both heavy and light vehicles produced. Value added and hours are for the entire automotive industry
*** Adjusted from 0.9 to 2.3 using MGI analysis. Value added per vehicle has been adjusted from CAGR -0.1% per vehicle to 1.3%Source: Groningen 60-industry Productivity database Oct 2005; Global insight, Oct. 2005; McKinsey analysis
Labor productivity change
Japan
US
Sweden
Germany
France
÷
Increase in value added/vehicle**
Reduction in hours worked/vehicle**
5.1
8.0
4.4
5.1
2.3***
2.7
1.3
4.8
3.4
5.4Japan
US
Sweden
Germany*
France
-0.3
1.0
3.1
1.0
2.3
Japan
US
Sweden
Germany
France
Sweden has been very successful at both increasing value added per vehicle and decreasing hours worked per vehicle
Exhibit 8

91
Light vehicle manufacturers accounted for approximately �5 percent of the
employment in the Swedish automotive sector. The improved operational
performance from 199� to 200� can be explained by the success of Volvo Cars,
favorable exchange rates, and strong innovation:
Volvo Cars has experienced successes since the early 1990s, with increasing
revenue per vehicle. Strong development in the American market and favorable
exchange rates have contributed to the success. Volvo Cars has also been
able to achieve a sales improvement of �� percent while employment has
increased only 5.2 percent (Exhibit 9). Saab Automobile has also had strong
sales growth but has not been able to achieve a similar increase in revenue
per vehicle. One explanation is that during the 1990s, Volvo made major
investments in product development, which enabled it to launch numerous
successful models during the last several years. Saab, on the other hand,
has not made the same kinds of investments and consequently has not been
able to launch models with the same success as Volvo.
Innovation and the use of platforms and modular components have enabled
significant efficiency gains. The number of platforms has been consolidated
significantly, reducing cost and enabling improved operational performance in
Exhibit 8
* Includes both heavy and light vehicles produced in each country** Data for Sweden is from 1993 to 2003, data for Japan is from 1992 to 2002, and other countries are from 1992 to 2003
Source: Groningen 60-industry Productivity database Oct 2005; Global Insight, Oct 2005; McKinsey analysis
2002/2003**
+0.3%
-1.0%
-3.1%
-1.0%
-2.3%
CAGR
Hours worked per vehicle*, index 1992/93 = 100
Japan
US
Sweden
Germany
77France
103
90
73
90
Index 100 = 1992/1993
Sweden has been able to achieve a very significant reduction in total hours worked per vehicle
Exhibit 9

92
the industry. For example, Volvo Cars has reduced its number of platforms to
one third of the number used in the peak year of 1991 (Exhibit 10).
Exhibit 9
050
100150200250300350400450
1993 1998 2003
Revenue and profit growth*SEK billions at 1993 prices
Car salesThousand units
EmployeesThousands, percent
1993 2003
RoW
Sweden
Total 26.8
+33%
* Revenue and operating profit for year 1999 to 2003 is not public information and is based on press clippings, 1999 estimatedSource: Annual reports; Volvo Cars web page; press clippings; McKinsey analysis
31 29
69 71
+5.2%
020406080
100120140160
1993 1998 20030
2
4
6
8
10
Revenue Operating profit
28.2
Volvo cars achieved strong sales growth with only a slight increase in employees 1993–2003 ESTIMATE
Exhibit 10
Exhibit 10
Number of platforms or unique models
Source: Company webpage; interviews; McKinsey analysis
0
1
2
3
4
5
6
7
1980 1985 1990 1995 2000 2005
Unique models• 200-serie• 300-serie• 400-serie
Platforms• Large platform “P2” (XC90, S60,
S80 and V70/V70XC)• Small platform (S40, C70 and V50)
ESTIMATEVolvo cars decreased the number of its platforms by 2/3 from its peak in 1991
• 700-serie• 800-serie• 900-serie
Exhibit 11

9�
Change in ownership should also, to some extent, have contributed to the
development of Saab and Volvo. The larger size of Ford and GM provides
scale advantages that could not have been achieved earlier. However, the full
potential of this effect is still to be realized.
Heavy vehicles manufacturers accounts for nearly 26 percent of the employment
in the Swedish automotive sector. The improvement has been driven by strong
commonality of parts in the production process:
Commonality level in the Swedish truck companies is high, especially within
Scania, which has been very successful with modular design and has been
able to establish a global engine platform. As stated in the 1995 report, the
modular design in Scania was one of their success factors and they have
since been able to keep a commonality level that is significantly higher than
that of most other companies
Price premium on trucks from Scania and Volvo allows Swedish companies
to charge higher prices than typical in the industry. The higher prices help the
Swedish truck companies realize higher value added per hour worked than
that achieved by competitors.
Suppliers within the automotive industry account for approximately �9 percent
of the employment in the sector. The number of employees is based on a
segmentation of companies and sub-segments of companies that are part of the
automotive industry according to national accounts. Suppliers have had a strong
positive impact on labor productivity increases in the sector through both internal
efficiency improvements and that less productive companies exit the sector:
Internal company efficiency has improved and, when looking at the largest
suppliers, labor productivity has improved by nearly 7 percent. Increased
outsourcing from OEMs has enabled suppliers to further decrease cost.
Company exits also contribute to the effect. The competitive environment
has forced less productive companies to exit the industry. The resulting
more productive industry now consists of fewer companies with low labor
productivity. As a final remark, it is essential to point out that corporate
governance plays an important role in the development of the industry
because the industry is so highly dependent on a small number of OEMs.

94
The very different performance of the struggling Saab Automobile and the
successful Volvo Cars clearly shows that even if the prerequisites are in
place, the actions and performance of the individual companies are crucial
for the sector’s overall success.
KEy CHAllEnGES for tHE futurE
Due to the global characteristics of the automotive industry, the presence of
Swedish companies in a large number of foreign markets, and the low domestic
barriers, the Swedish automotive industry must be understood in the larger
industry context rather than in a purely Swedish perspective. In the future, the
global automotive industry will continue to face significant price-cost pressure,
increased outsourcing to low-cost countries (LCC), and the drive for continuous
operational improvement. The ability to balance brand distinctiveness with scale
economies will be another key challenge for OEMs. Furthermore, poor financial
performance creates uncertainty regarding future development, predominantly in
the American industry, but also among many global suppliers.
Light vehicles are facing challenging industry trends. The many consolidations
in the past still affect the industry and may continue. The industry struggles
with excessive overcapacity and a movement towards more flexible plants is
expected. Intensified competition is expected in Volvo Cars and Saab Automobiles
segments while growth will most likely be in entry-level cars. At the same time,
better production processes are expected to enable operational improvements
and increase outsourcing, especially from LCC. Finally, the poor performance of
the owners of Volvo Cars and Saab Automobiles can have significant effects on
the Swedish automotive industry:
Consolidation has been frequent in the automotive industry. Of the 52
independent light manufacturers that existed in 1964, only 12 remain
independent today and only 25 percent of manufacturers have retained their
economic independence since 1964. The trend may continue, but the pace
will likely slow due to the shortage of suitable acquisition targets.
Overcapacity has been excessive in the light vehicle industry. New capacity
keeps being added, especially in China and Eastern Europe, while existing
plants continuously make process improvements that increase capacity. In
theory, the capacity in Western Europe could increase to 27 million vehicles by
2015, creating an overcapacity of 10 million vehicles if no countermeasures

95
are initiated by OEMs (Exhibit 11). The high overcapacity results in a price-cost
pressure that has been extremely strong for a long time in the car industry.
The overcapacity puts pressure on prices, and the decreasing prices lead to
cost pressure and a need for efficiency improvements, which finally may lead
to further overcapacity (Exhibit 12). The increasing overcapacity has serious
effects on profitability for OEMs and it is important for OEMs to reduce
overcapacity, decrease fixed cost, and/or increase flexibility in manufacturing
to make them less vulnerable to low utilization in the future (Exhibit 1�).
Intensified competition in Volvo Cars and Saab Automobiles segment can be
expected. Even though several companies historically have shown that it is
difficult to move into the upper-middle-class car segment, where Volvo Cars
and Saab Automobile are participating, intensified competition is expected
since more OEMs are entering this segment. However, the future growth in
the industry will be mostly in small-class cars due to the motorization of
LCC and increasing environmental concerns. To stay ahead in the segment,
product innovation and development will be important.
Flexibility in manufacturing plants can limit the impact of overcapacity and
increase economies of scale. Increased flexibility can be reached in three
areas; succession flexibility, volume flexibility and product mix flexibility.
Succession flexibility is the ability to produce new models in the same line
as previous models. Volume flexibility is the potential to quickly alter the
scale of production. Product mix flexibility is the ability to produce different
cars in the same production line. Improved product mix flexibility can move
manufacturing further towards multi-brand, multi-model, and multi-platform
plants. This enables companies that have multiple brands to further integrate
production of their different models to gain better economies of scale.
Increased flexibility, in all dimensions, also contributes to better utilization
of production capacity, at least in the long run, making the company less
vulnerable to overcapacity (Exhibit 14). The possibility of producing multi-brand
cars in the same production line enables lower cost. However, the trade-off
between brand distinctiveness and scale economies should be weighed in
the balance. Brand uniqueness should be preserved, while the advantages of
using a multi-brand platform are necessary to enable efficient production. For
example, currently Mazda, Ford and Volvo are on their way to use cross-brand
platforms for their models. This obviously helps to drive down costs but can
also lead to dilution of the brands, thus diminishing future sales.

96
Exhibit 12
Source: PWC; McKinsey analysis
• Currently capacity is being added (e.g., China, Eastern Europe) rather than transferred or reduced (plant closures, bankruptcies)
• Overcapacity leads to increased price and cost pressure• Cost pressure drives productivity development
57.6
81.7
Produced2003
Capacity 2003
~30% overcapacity
Effect of overcapacityGlobal number of light vehiclesin million units
Productivitygains
Pricepressure
Costpressure
Over-capacity
Global overcapacity is one of the drivers of productivity improvement Exhibit 13
Exhibit 11
21.0
7.5
4.5 6.0
27.0
1716
105
21
2002
27
2015
Demand
16.0 1.5 1.0* 1.5 17.0
Capacity
Million vehicles, 2015 Theoretical overcapacity without action by OEMs
* Increase 2002–2009Source: Tomorrow’s Automotive Production, McKinsey
Overcapacity in 2015 is estimated to be ~60% of forecasted demand
2002 2015Newprocesstechno-logies
Conti-nuousimprove-mentprocess
Naturalfluctua-tion/divest-ment
2002 2015MarketgrowthWesternEurope
Exportincrease
Marketshareloss inWesternEurope
In Western Europe, overcapacity could reach 10 million vehicles by 2015 if no countermeasures are taken by OEMs
In addition, new plants can be built as well
Exhibit 12

97
Exhibit 13
Operating margin
-10
-8
-6
-4
-2
0
2
4
6
8
Capacity utilization
DCX
BMW
PSA
Ford Europe
Fiat
GME
VW
Renault
R2 = 0.4913
60 65 70 75 85 90 9580
Breakeven capacity utilization of the average OEM
Capacity utilization and profitability – Western European OEMs
Source: PwC; Tomorrow’s Automotive Production, McKinsey; Deutsche Bank
PercentSerious cost penalties are associated with overcapacity Exhibit 14
Exhibit 14
Flexibility can be reached in several dimensions…
Flexible* plant
…and leads to higher utilization
42
8076
9083
939599100
Company A Company B Company C Company D Company E
• Product mix flexibility**– Multiple variants– Multiple models– Multiple platforms
• Succession flexibility
• Volume flexibility
Capacity utilization; %
EXAMPLES
+3%+10%
+25% +16%
+98%
* Flexible plants are defined by the ability to vary production between multiple vehicles on a single production line** Ability to produce multiple variants, models and/or platforms at the same production line
Source: Prudential Securities; McKinsey analysis
Normal plant
Flexible plants achieve higher capacity utilization Exhibit 15

9�
Outsourcing is expected to increase in the future, decreasing both value-
added and labor input in OEMs (Exhibit 15). With increased outsourcing,
OEMs can focus on core competencies and source other parts from specialist
suppliers. However, some of the deliveries to the final assembly are done by
just-in-sequence deliveries (JIS) where the sequence of the products delivered
by the supplier needs to be in the same order as the cars that are being
produced. Today, JIS suppliers receive the actual sequence of the cars at the
start of final assembly due to limited sequence stability in production. Due to
the limited time to deliver the products to the OEM, most JIS suppliers have
to be located relatively near the assembly site, limiting sourcing from LCC
(Exhibit 16). In the future, improved sequence stability will permit working with
suppliers located at greater distances from OEMs, thus enabling increased
outsourcing to LCC (Exhibit 17).
Operational improvements have been and are likely to remain key challenges
for the future. Establishing efficiency both in the entire value chain and between
merged/acquired companies will continue to be crucial for a company to
remain competitive. Efficiency in the entire value chain includes making sure
that every step, from suppliers to after-market sales entities, is performed in
the most efficient way possible. This can significantly increase outsourcing to
LCC from both OEMs and suppliers. The question is, how this will affect the
Swedish automotive industry and its sub suppliers?
Poor performance in parent companies can have a negative influence. So far,
Volvo has been able to deliver strong profitability while Saab has not been as
successful. However, both Ford and GM are struggling with profitability, and
this can have serious consequences on Volvo Cars and Saab Automobile. Few
things are certain, but many questions arise. Will Volvo and Saab survive? Will
the two companies be allowed to make sufficient investments in development
to be competitive in the future? Will Volvo or Saab be sold to save their parent
companies? Will the companies become more integrated into their parent
companies and finally live on only as brands? There are many questions
regarding the future of Swedish light vehicle manufacturers. The answers
to those questions can dramatically change the entire Swedish automotive
industry and affect thousand of employees

99
Exhibit 15
* Model forecast** Interface management, assembly, inspection, and warranty
Source: Interviews; McKinsey/PTW HAWK Survey
SegmentOEMs’ share of value addedPortion of manufacturer’s cost, %
Examples of modules outsourced by OEMs
• System integration** of interior• Integration** of inside door system• Development and integration** of
air conditioning system• Development and integration** of
in-board network
• Engine assembly• Engine development
(on cross-OEM platform)• Manufacture of prefab engine block• Manufacture of prefab cylinder head
• Integration** of steering system, springs/shock absorbers and axle/wheel suspension
• Axle manufacture
• Integration** of front end• Manufacture of aluminum
and plastic add-on pieces
Increasing outsourcing of:• Work to integrate total
systems and modules• Development of
systems with specific know-how requirements
OEMs’ share of value addedPercent
3525
29%
31
24
17
13
9
12Interior
Engine
Chassis
66
72Body
Outsourcing from OEMs are projected to continue 20022015*
Exhibit 16
Exhibit 16
• JIS* suppliers receive the actual sequence at the start of finalassembly due to limited sequence stability in the paint shop
• Due to the limited time to installation, most JIS deliveries come from supplier parks and nearby consolidation centers
* JIS; Just In Sequence deliverySource: Tomorrows automotive production; McKinsey
Buffer Buffer
Supplier plant
Delivery timePartscall
JISdelivery
Body shop Paint shop Final assembly
Today, sequence information is transmitted to the supplier at the start of final assembly, requiring co-location of suppliers
Exhibit 17

100
Heavy vehicles is an industry that struggles with high cyclicality. Part of the
cyclicality can be explained by regulations that have a discontinuous effect on
demand. Stricter environmental regulations increase cost and put pressure on
innovation. To cope with future cost pressure, operational performance continues
to be important:
This inherently cyclical industry has had large fluctuations, significantly
higher than in the car market due to the nature of their customers, which
are companies that purchase products when their market is strong (Exhibit
1�). The wide fluctuations put pressure on companies, forcing them to adopt
strategies that decrease the impact of fluctuations in sales. Companies
can decrease sales fluctuations either by balancing different markets (e.g.,
different regional markets or aftermarket-sales) or by increasing flexibility
(e.g., more flexible cost structure or sourcing production capacity at peaks):
Regulations strongly affect the heavy vehicle industry. Changing regulations
enhance the cyclicality of the market. At the same time, stricter emission
regulations drive up costs for the power train (Exhibit 19). The increase in cost
results in tremendous pressure to create more innovative and less expensive
power trains:
Exhibit 17
% of survey respondents expecting sequence stability
Survey participants expect sequence stability to shift from start of final assembly to start of body shop… …enabling longer delivery time
Source: TAP Online Survey, n=14
1 day2 days
3 days
4 days
…and increasing the sourcing radius
Final assembly
Bodyshop
67
38
0
44
Today 2015
Buffer Buffer
Supplier plant
Delivery timeParts call
JIS delivery
Body shop
Paint shop
Final assembly
With increasing sequence stability, longer delivery windows enable sourcing from low-cost countries
Exhibit 18

101
Exhibit 18
60
80
100
120
140
160
180
200
1992 1996 2000 2004
Total salesUnits sold globally, index 1992 = 100
Source: Global Insight, October 2005; McKinsey analysis
Heavy vehicles
Light vehicles
Heavy vehicle sales fluctuate more than light vehicles sales
Standard deviation: 10.7
Standard deviation: 3.2
Exhibit 19
Cyclicality is further aggravated by changing regulations. The regulatory
discontinuities intensify the cyclicality of the market because customers
try to buy new trucks before the new regulations are enforced (Exhibit 20).
Thereafter, it leads to price wars during the downturn.
Innovation will be important for the future. New and more environmentally
friendly power trains and/or fuels need to be developed to reduce the
cost of emission regulations. Projections say that future power train
standards will be more fragmented (e.g., hybrid power trains and fuels
such as compressed natural gas and hydrogen). However, there are great
technological risks involved in the development of new power trains. Future
standards are uncertain and predictability of overall return on investments
for new technologies is low. The higher fixed cost, due to development of
future power trains, might enforce higher production volumes per engine
family. This might put pressure on companies, like Scania, to partner with
other OEMs, or lead to further industry consolidation.
—
—

102
Exhibit 19
0
1
2
3
4
5
6
7
8
0 0.05 0.1 0.15 0.2 0.25
* Including after-treatmentSource: McKinsey DRIVE study; China environment standard; Umweltbundesamt; Federal environment agency; McKinsey
g/KWh
China (2012)
EPA (2004)
EURO III (2000)
China (2003)
EPA (2007/10)
EURO VI (~2010)
0.60
NOx
Particulate matter
Emission regulations are tightening
21
Baseengine EURO 3 (2000)
EURO 4/5(2005/08)
EURO 6 (~2010)
EURO 7(TBD)
Engineincl. new compo-nents
Additional cost to meet regulations + 8–10
EUR thousand/vehicle
…increasing power train cost*
Stricter emission regulations are driving up costESTIMATE
Exhibit 20
5-62-3
1 29-31
Exhibit 20
Source: Global Insight (January 2006); Tomorrows Automotive Production, McKinsey
200
250
300
350
2003 2004 2005E 2006E 2007E 2008E 2009E 2010E
-7%
Western Europe
Japan
70
80
90
100
110
120
2003 2004 2005E 2006E 2007E 2008E 2009E 2010E
-17%
NAFTA
250
350
450
550
650
2003 2004 2005E 2006E 2007E 2008E 2009E 2010E
-16%-6%
Total (including Brazil)
700
800
900
1,000
1,100
1,200
2003 2004 2005E 2006E 2007E 2008E 2009E 2010E
-11% -1%
Sales thousand units, Trucks >6 tons
Macro-economic trends and environmental regulations will continue to drive market cyclicality
Exhibit 21
Expected 2007 downturn due to end of pre-buying phase before new environmental regul-ations will become effective (e.g., EURO V, EPA 07)
Expected 2010 downturn before new environmental regulations become effective in the US and Canada (EPA 10)

10�
The cyclicality of the heavy vehicle industry results in price wars during downturns.
The demanding emission requirements, which increase cost without enabling
price increases, create a price-cost squeeze in the industry. In the future, the
possibility of keeping higher prices through quality differences will also become
limited. A trouble-free product is a must for all companies. The development of new
technology (e.g., new, more environmentally-friendly power trains) also leads to
increased cost pressure. This emerging price-cost challenge has to be addressed
by companies, and this can be done through improved operational performance
and/or an increase in merger/partnering:
Operational performance will be important to cope with the increasing cost
pressure. With increasing competence in LCC, the number of suppliers in
LCC that perform at levels of EU suppliers grows, and sourcing from LCC
is likely to increase. The industry is also moving towards higher speed and
flexibility in the development and manufacturing of products. A good example
of a company that has come far in operational performance is Scania with its
modularization.
Mergers and/or partnering are expected to become more common because
they enable the development of standardized global platforms, systems,
and modules with lower cost and risk for the individual company. In this way
companies can decrease the intense price-cost squeeze through sharing the
cost and risk with other companies. New alliances will especially emerge
between companies in LCC and HCC; these could consist of two OEMs (e.g.,
China National Heavy Trucks and Ford), an OEM and a supplier (e.g., Cummins
(US) with Tata Motors (India), or two suppliers (e.g., Bharat-Forge (India) with
Peddinghaus (GE).
The Swedish heavy vehicle companies, Volvo and Scania, demonstrate positive
aspirations for the future. According to Ny Teknik, Volvo has stated a productivity
goal of 6 percent per year while Scania’s goal is to double productivity within
ten years. Scania’s productivity goal is equal to a little more than 7 percent,
which is in line with the development that the entire Swedish automotive
industry has experienced during the studied period. Scania believes that internal
improvement will drive the development. These developments will include process
improvements (e.g., increased machine utilization, better production techniques,
and improved production systems), company structure (e.g., consolidation of sites

104
and improved cross-functional cooperation), and developing products that are
easier to manufacture. For Volvo, the levers are probably similar, together with
the integration of Volvo, Renault and Mack, e.g., the introduction of the common
engine platform in 2006, etc.
SuMMAry AnD IMPlICAtIonS
The automotive industry has been one of Sweden’s most successful sectors since
the early 1990s, with exceptionally strong labor productivity growth coupled with
employment creation. In the early 1990s, Sweden already had a strong position
within the industry, especially for heavy vehicles; due to faster growth than any of
the other compared countries, Swedish labor productivity is today together with
Japan sharing the top position among the compared countries.
The growth of both labor productivity and employment in the sector show that
the two are not mutually exclusive, especially in global industries where labor
productivity enables improved competitiveness, which can drive sales and thereby
increase employment creation. Existing barriers for further labor productivity
improvements are low, so keeping the industry competitive in Sweden is much
more a company/union-specific question than an issue depending on policy
maker decisions:
The light vehicles industry has so far shown positive development. In the
future it is important that companies continue to push for operational
improvements and are cost-cautious to remain competitive. Improved
product development is also important to make products that are easy
to manufacture and to achieve shorter product life. However, the conflict
between the Saab manufacturing plant in Trollhättan, Sweden, and the Opel
plant in Rüsselsheim, Germany, which was triggered by GM, has shown that
assembly plants may be consolidated away from Sweden, even to other high-
cost locations. More flexible plants that can produce multi-brand cars will
most likely strengthen the competitive pressure between plants. Therefore,
the importance of driving labor productivity improvements cannot be stressed
enough because it makes plants more competitive. It is also important for
policy makers to make sure that Sweden has the required resources (good
infrastructure, high educational level, etc.) so that the industry can continue
to develop in Sweden.

105
The heavy vehicle industry has experienced strong development so far, taking
Scania and Volvo to top labor productivity within heavy vehicles. Scania, with
its focus on the profitable heavy-duty truck segment, has been very successful,
while Volvo’s acquisition strategy has made them one of the world’s largest truck
companies. The goal in Swedish heavy vehicle companies of between 6 and
7 percent productivity improvement per year is in line with likely requirements
for competitiveness in the industry. Further operational improvements are
important for both companies. For Volvo, which has become one of the larger
companies through the acquisition of Renault and MACK, scale is also a
lever that can enable improved labor productivity. The smaller scale of Scania
makes it more feasible to continue to use stringent commonality as a source
of further labor productivity development. Scania may also need to evaluate
different cooperation alternatives to achieve higher volumes in areas where
scale is critical.
—

106

The Swedish Retail SectorEXECutIvE SuMMAry
The Swedish retail sector has experienced very strong productivity growth since
the early 1990s. The productivity gains are due to decreased labor input rather
than increased value-added. Product market conditions have improved and today
it is barriers to job creation that need attention.
In 1990, Swedish retail productivity was 16 percent lower than the US benchmark
and slightly behind European peers. The main reasons for the low productivity
were identified as product market barriers – e.g. low competitive intensity due to
price co-operation, zoning policies, and strong position of less efficient voluntary
chains – rather than labor market barriers.
Since 1990, labor productivity has increased 4.6 percent annually, which is on
par with the US and higher than European peers. In absolute productivity levels,
Sweden has passed France and Germany but is still significantly behind the US.
Several factors combine to explain the positive labor productivity development.
The factors include: eased application of zoning laws, increased competition
from category killers and new entrants, growth of integrated chains on behalf
of less productive voluntary chains, and growth of large highly efficient store
formats.
Job reduction, rather than job creation, accompanied the strong productivity
growth since 1990. In relation to peers, Swedish retail is worst-in-class in
job creation with a net job loss of 0.5 percent of working age population. The
main factors behind the weak performance are low labor flexibility, high cost of
107

labor and weak demand. Together these factors inhibit growth, innovation and
employment in service-intensive retail concepts. Since 1990, few actions have
been taken to improve the situation, with the notable exception of setting the
probationary employment period to 6 months.
In the future, three key trends will shape the retail sector. First, the industry
restructuring will continue with the growth of integrated chains and large, highly
efficient store formats as well as increased polarization due to parallel growth in
both premium and low-price segments. Second, the importance of private labels
will increase especially in premium/niche products. Third, the international
influence will increase in Swedish retail as additional international chains enter
either organically or through acquisition.
The most important actions for policy makers are to further ensure availability
of retail premises and, even more importantly, remove barriers to job creation
by addressing the labor market and demand conditions. Companies need to
consider their strategic position and improve their operations to meet the
increasing competition. The unions should actively support job creation in retail
by allowing labor flexibility to increase.
10�

109
PErforMAnCE In tHE rEtAIl SECtor
The retail sector1 is one of the largest sectors in developed economies, typically
representing �-6 percent of a country’s GDP and employing 5-10 percent of all
employees. However, in relation to other countries, the Swedish retail sector is
small, both in terms of share of employment (5.9 percent) and share of GDP (�.5
percent) (Exhibit 1).
The retail sector is important to study for several reasons:
Potential driver of economic growth. The retail sector is important to a
country’s economy not only because of its size, but also as it represents a
significant portion of private consumption and thus affects the daily lives of
all persons in the country. As evidenced by the US retail phenomenon of the
last two decades, it can also be the driving force in economic development by
promoting productivity in wholesale and manufacturing sectors, such as food
1 Defined in this study as excluding cars, gas, alcohol and pharmaceutical/medical products unless otherwise stated. Occasionally and always explicitly stated, retail sale of alcohol and pharmaceutical goods are included in the macroeconomic data to permit cross-country comparisons
Exhibit 1
The retail sector is smaller in Sweden than in peer countries, both as share of employment and contribution to GDPPercent, 2003
* Value add at current price** Canada and Japan 2002
Source: Groningen Productivity Database, February 2005; McKinsey analysis
Sweden 5.9
Finland 6.3
France 7.2
Denmark
9.7
11.4
11.8
Canada**
Germany
US
9.2
8.8
9.3
UK
Spain
Netherlands
Ireland
Japan**
8.8
7.3
9.2
3.5
3.2
4.3
5.1
5.1
5.3
5.2
3.5
4.7
4.5
3.8
3.5
Share of employment Share of GDP*
Exhibit 1

110
processing. The increased productivity comes from both increased pressure
on suppliers as well as more sophisticated integration and use of information
and communication technology. In retail, value is added either by creating an
efficient business model for the goods sold, or by adding value with services.
Potential source of significant job creation. As Sweden loses jobs in
manufacturing, it will be important to replace the lost jobs with service sector
jobs. Retail is a large sector that in many other countries employs significantly
more people per capita than in Sweden. If Sweden can accomplish the
manufacturing-to-service-sector transition, many new jobs will be created.
Dynamic sector directly affected by policy decisions. Sweden, together
with most other developed economies, has experienced a shift in the retail
industry structure during the last decades. The overall trend, driven by scale
advantages, is towards increased competition with the growth of integrated
chains and large store formats, which often take over market shares from
smaller independent stores. Policy makers play a very important role in this
development. Some countries, like France, have chosen to try to counteract
the development while others, like the US, have chosen to embrace it.
tHE rEtAIl SECtor In SwEDEn
Annual retail sales are almost SEK 400 billion in Sweden, representing one third
of private consumption, of which 52 percent is grocery sales and 4� percent
is general merchandise retail (Exhibits 2-�). Internationally, retail trade typically
decreases its share of household consumption as income rises. This trend is also
true for Sweden. In 1970 the average Swede spent almost 50 percent of his/her
purchasing power on retail. Today the share is little more than one third. Instead,
people spend their money on other services such as travel and restaurants.
Another reason for the decreasing share is that real prices are declining in many
retail categories as a result of productivity increases throughout the full value
chain.
By its nature, retail is typically a local market with customers coming by foot, public
transportation or car. In many retail categories a few large players dominate with
many stores and a large share of sales. One example is grocery retail, in which
the “Big Three” (ICA, Coop and Axfood) together have more than 70 percent of
all food retail.

111
Exhibit 3
The Swedish retail market is almost SEK 400 billion, with food and apparel being the largest segments % of Swedish household consumption on retail*; 2004
* Excluding alcohol, cars, gas, and drugsSource: Supermarket 2005; Statistics Sweden (SCB); McKinsey analysis
Retail*100% = SEK 382 billion
“Grocery” 52%
Food
Home/chemical products
Tobacco and newspapers
Other, including flower
Apparel
Leisure-related
Home-related
“Do-it-yourself”
Generalmerchandise 48%
5.4
5.9
38.0
3.2
9.1
14.7
16.3
7.4
Exhibit 3
Exhibit 2
Retail* represents one third of Swedish private consumption
* Excluding cars, drugs, and alcoholSource: Groningen Productivity database; supermarket/SCB; McKinsey analysis
24
28 16
15
17Food, etc.
Generalmerchandiseretail
Transportation/communication
Housing
Other
Percent of total private consumption, 2004, 100% = SEK 1,224 billion
Exhibit 2

112
InDuStry PErforMAnCE
the Starting Point for the Sector
In 1990, McKinsey Global Institute (MGI) found Swedish general merchandise
retail productivity to be 16 percent lower than the US benchmark. Swedish
retail was also experiencing net job losses while the US had created new
jobs representing 0.5 percent of the working age population. The productivity
comparison was based on the share of highly productive store formats in each
country respectively. Sweden’s low performance was largely explained by product
market barriers inhibiting competition and growth of productive formats:
Restrictive zoning laws. During the 19�0s, municipalities actively used Plan
och Bygglagen (PBL) to protect existing retail businesses by restricting access
to land for large-format stores. The effect was high barriers to entry as the
established players already had most good locations and few new outlets
were built. It may be noted that this also became an artificial inhibitor to the
growth of highly productive formats.
Price recommendations. Industry associations were allowed to issue price
lists and openly discuss how industry profitability should be maintained,
which drastically decreased the competitive intensity in selected categories.
Supplier boycotts. Large chains used their bargaining strength to make
suppliers boycott low-price competitors to avoid price pressure.
Voluntary chains. Many independent retailers cooperated in large voluntary
chains, reducing the competitive intensity and thereby decreasing the
opportunity for the development of large integrated chains.
Market conditions. The low population density in large areas of Sweden also
partially explained the relatively low growth of large format stores.
Also, capital access was a slight problem during the 19�0s as banks discriminated
against service companies in favor of manufacturing companies. However, this
barrier was found to be of minor importance for overall development.

11�
There were two main reasons for the low job creation between 19�0 and 1990:
Low output. Sweden had lower output growth compared to the benchmark
United States in the period studied. Both countries experienced evolution
from small independent stores to large-format stores and specialized
integrated chains. However, the US stores more often focused on increased
service levels while the Swedish ones focused on high efficiency and lowered
employment.
High labor costs. Sweden’s high labor costs in combination with low disposable
incomes were found to be a major reason for the low job creation compared
to the US. Swedish retailers sought to minimize labor costs, while the US
retailers experienced innovation and growth in service-intensive concepts.
Productivity and Employment Development Since the Early 1990s
Since 1990, Swedish retail labor productivity growth has been strong. Labor
productivity increased 4.6 percent annually, on par with the US and ahead of
European peers. Combining the labor productivity growth with the absolute
productivity levels of 1990 that were measured based on store format mix,
Sweden is today more productive in absolute terms than Germany and France
but still lagging the US (Exhibit 4).
However, the very strong Swedish labor productivity growth since 1992 has been
driven by decreased employment in retail. While the US has been able to increase
its output and value added in the sector, the Swedish retail has had much lower
growth in value added and instead decreased the number of employees (Exhibit
5). In terms of employment development, Sweden is worst in class with net
job destruction while most countries display strong job creation. The economic
downturn started the drop in employment in the early 1990s. In 1997, there
were approximately 1� percent fewer jobs in retail than at the beginning of the
decade. Between 1990 and 200�, the number of people engaged in the Swedish
retail sector decreased by 10 percent. However, due to increased use of part-
time employees, the total amount of work in the sector decreased by almost 16
percent. The UK and the US, on the other hand, managed to combine strong
productivity development with net job creation.

114
Exhibit 5
4.2
US
4.6
Sweden
Labor productivity growth USD/hour
Change in value addedFixed 1995 prices
Change in worked hours
Source: Groningen Productivity Database, October 2005; McKinsey analysis
Percent; CAGR, 1990–2003;
0.9
US-1.3
Sweden
Sweden
3.2
US
5.2
4.0
SwedenUS
5.3
-0.1Sweden
-0.8US
-0.8US
0.9
Sweden
0
US-0.5
Sweden
Change in value addedCurrent prices
Price effect
Change in people engaged
Change in hours per engaged
÷
Unlike the US, Swedish retail productivity growth is driven by reduced labor input
Exhibit 5
Exhibit 4
Swedish retail sector is worst-in-class in job creation while at par with the US in productivity growth
* Total people engaged in retail sector** Canada 1990-2002
Source: Groningen 60-industry Productivity database, Oct 2005; McKinsey analysis
Size in percent of 2003 value add (current prices)
Net job creation* 1990-2003 Percent of population 15–65
Labor productivity change1990-2003 CAGR
Percent
-1.50
-1.00
-0.50
0.00
0.50
1.00
1.50
2.00
2.50
3.00
3.50
-1.00 1.00 3.00 5.00
US
Ireland
Canada**
Germany
DenmarkFrance
UK
Sweden
Spain
Nether-lands
113US
100Sweden
79Germany
67France
47Spain
Employment and productivity development, percent Productivity, 2003Index Sweden=100
Exhibit 4
4.2
US
4.6
Sweden
Labor productivity growth USD/hour
Change in value addedFixed 1995 prices
Change in worked hours
Source: Groningen Productivity Database, October 2005; McKinsey analysis
Percent; CAGR, 1990–2003
0.9
US-1.3
Sweden
Sweden
3.2
US
5.2
4.0
SwedenUS
5.3
-0.1Sweden
-0.8US
-0.8US
0.9
Sweden
0
US-0.5
Sweden
Change in value addedCurrent prices
Price effect
Change in people engaged
Change in hours per engaged
÷
Unlike the US, Swedish retail productivity growth is driven by reduced labor input
Exhibit 5
x
x

115
Productivity of the trade value chain
Retail is the last step in the distributive trade value chain. However, there
is a trend towards increased vertical integration as supply chain efficiency
has become one of the main differentiators of competitiveness. Today,
large retailers often control their distribution network and purchase goods
directly from the producers. The links between producers and retailers have
been strengthened to the disadvantage of the wholesaler. In the US this
trend has been very strong, driven by the aggressive growth of retailers
such as Wal-Mart and the increased leverage of scale advantages that
technology advancements like IT and barcodes/scanners make possible.
US wholesalers are increasingly acting as either commodity and goods
brokers, or providers of distribution and logistics services. The result has
been very strong productivity growth in US wholesale which to a large
extent can be explained by the retailers’ increased scale and the use of
new technology. While Sweden has been able to increase productivity in
retail, the pressure to transform wholesale has been lower there and scale
advantages have not been as significant as in the US (Exhibit 6).
As retailers are vertically integrating, it becomes more and more difficult
to accurately measure and make cross-country comparisons of retail
productivity in isolation from wholesale. By comparing the Swedish
development with US for both wholesale and retail, i.e. the distributive
trade sector, it is clear that Sweden is lagging in both productivity and
employment growth (Exhibit 7). Looking at retail alone, Sweden is slightly
ahead of the US in productivity growth. One contributing factor may be that
some efficiency gains in distribution have been attributed to retailers in
Sweden but attributed to wholesalers in the US. Though Sweden has had
a strong development in retail, there is still a significant disparity between
Sweden’s retail development and that of the US where the distributive trade
sector has been a main contributor to the economic growth of the entire
nation since 1995 (The Conference Board 2005).

116
Exhibit 7
4.8
US
3.4
Sweden
Total
Retail
Wholesale
4.2
US
4.6
Sweden
5.7
US
2.1
Sweden
Total
Retail
Wholesale 1.1
US-0.1
Sweden
0.9
US-0.5
Sweden
0.2
US
0.4
Sweden
Productivity growth (CAGR) Employment growth*
* Net job creation as percent of working age populationSource: Groningen Productivity Database, October 2005; OECD LFS; McKinsey analysis
Percent, 1990–2003
Although Swedish retail productivity growth was higher than in the US, Sweden had lower overall productivity growth for wholesale and retail combined
Exhibit 7
Exhibit 6
Driven by retailers’ pressure and increased IT usage, US wholesale productivity has grown dramatically
Source: Groningen Productivity Database, October 2005
Retail productivity growth, 1990–2003 Wholesale productivity growth, 1990–2003
SwedenUS
100
110
120
130
140
150
160
170
60
90
1990 2003 1990 2003
Sweden
US
100
110
120
130
140
150
160
170
60
90
Labor productivity, index 1995 = 100 Labor productivity, index 1995 = 100
Exhibit 6

117
factors Explaining the Productivity Development since 1990
Some of the barriers identified in 1990 have since been addressed, contributing
to the high productivity growth in Swedish retail. Between 1990 and 200�,
Swedish retail productivity increased by 4.6 percent, compared to 2.7 percent
in the preceding decade. However, there is no single action explaining this
development. Instead, it is the combination of several contributing factors:
Eased zoning laws. Since 1990, Sweden has experienced significant growth
in the number of new shopping centers and large-scale store formats (Exhibit
�). This growth was made possible to some extent by changed legislation,
but primarily by the municipalities’ changed behavior and application of the
zoning laws:
Legislative changes. In 1992, PBL was changed to reduce the influence
of the municipality and remove the possibility of discriminating among
different types of trade. This change reflected a public discussion during
the 1990s regarding the development of large-format retail stores and
shopping centers. Many feared a development that would make traditional
—
Exhibit 8
Size of new established food retail outlets has increased steadily, partly thanks to eased zoning laws
Average size of new establishments in food retailm2
0
50
100
150
200
250
1975 1980 1985 1990 1995 20000
500
1,000
1,500
2,000
2,500
3,000
Note: In 2003–2004 the average size dropped due to Lidl and Netto small hard discount stores (30 and 48 respectively) Source: Supermarket 2005
Number of newly established retail outlets#
2004
Exhibit 8

11�
small-scale shops unprofitable and ultimately close because of the new
and increased competition. Due to the fear of local unemployment, and
in some cases close bonds between local store owners and municipal
government representatives, there was significant resistance in many
municipalities to the industry shift. The 1992 change of the PBL led to
a significant change in behavior in the municipalities, and allowed for the
creation of more productive retail formats. In 1997, PBL was changed
back to again allow municipalities to more closely control where and what
types of retail stores to be constructed.
Behavior changes. The legislative reversal had less impact than might have
been expected, as municipalities had started to see that the development
was not necessarily bad. One positive effect of large-format stores was
decreasing food prices, and some positive effects of large shopping malls
were employment and improved service. Also, municipalities often risked
that a neighboring community would promote the construction of a large
shopping center, which could negatively impact the traditional stores of
both communities while leaving most of the benefits to the municipality
allowing the new establishment.
Shifting industry structure. The retail industry has continued its structural
evolution through the 1990s until today. The development has primarily
been driven by market conditions, but was also facilitated by the decreased
resistance in many municipal governments. For Sweden, the most significant
shift has been from small independent stores to larger and more productive
store formats, shopping centers, and integrated specialized chains:
Growth of large-scale formats. The development of highly efficient large
format stores has been driven by the significant scale advantages in
store operations. As an illustration, the average size of new established
grocery stores was 400 m2 in 19�0, 950 m2 in 1990, and peaked at 2550
m2 in 2000. The trend is the same for both general merchandise retail
and grocery, while the latter have also experienced growth of hard
discounters whose business model is to operate highly efficient stores of
typically �00 m2
Growth of shopping centers. Sweden has experienced a significant growth
in shopping centers during the 1990s. In 1990 approximately 20 percent
—
—
—

119
of all retail activity took place in a shopping center; today the figure
is closer to �� percent. This development is driven by the convenience
for the consumers of doing their shopping in one place, scale advantages
in marketing, and the need for increased retail space as volumes
have increased.
Increased integration. In all categories, there has been a strong
movement towards greater integration, on behalf of the voluntary chain
and independent small stores. The overall driver is the search for scale
advantages in purchasing, supply chain, store management and marketing.
Fundamentally, the increased integration has come through growth of
integrated chains or increased integration of voluntary chains. Often the
competitive forces have ensured that both exist in most categories:
Growth of integrated specialized chains. In many categories integrated
specialized chains have taken significant market shares from the less
efficient voluntary chains. An example of this is the Do-It-Yourself
category where the eight largest integrated chains in 1990 had only 6
percent of sales. By 2004, these integrated chains accounted for 55
percent of sales. Another example is IKEA, the global integrated home
furnishing company, which grew its sales in Sweden by 170 percent in
the years 1990-2004, compared to the 1� percent growth of voluntary
furniture chains in the same period. IKEA, together with H&M, is an
exceptionally good example of how Swedish integrated retailers have
also succeeded in the international arena.
Increased integration of voluntary chains. Often as a response to the
integrated competitors, voluntary chains have increased their integration
to reap scale advantages not only in purchasing but also in branding/
marketing, assortment management and financing, etc. Examples are
Hemtex (home textiles), ICA (grocery), and many clothing chains.
Increased competition. In 1990, there were several barriers to competition.
Since 1990, the competitive pressure has increased in several, if not all, retail
categories. Sweden has entered the European Union, and a new Competition
Authority has been established. However, the increased competition in retail
should not be attributed primarily to these changes except in one important
aspect. Beginning in the late 1990s and accelerating in the early 2000s, the
—

120
Swedish Competition Authority has actively promoted the positive effects of
increased competition in retail and been an important factor in changing the
mindset of many (but far from all) policy makers and politicians. The mindset
change has allowed the construction of new shopping areas and large format
stores, which, in turn, have increased the competition significantly by reducing
the barriers to entry. The increased competitive pressure in Swedish retail
can be explained by four drivers:
Continued growth of category killers. The growth of category killers
increases the pressure on existing stores through their scale advantages
in purchasing, supply chain, assortment management and marketing. The
growth of these specialized chains is facilitated by the growth of shopping
centers making retail space available, as one of the main barriers to
growth typically is the lack of prime locations (Exhibit 9).
Increased share of highly productive store formats and business models.
The growth of highly productive store formats increases the competitive
pressure on traditional stores. Examples of this can be seen in grocery, where
large format stores like ICA Maxi take market shares from more traditional
supermarket formats. Also in grocery, the hard discounters with their very
efficient operating model increase the price pressure (Exhibit 10).
—
—
Exhibit 9
The growth of category killers has increased the pressure on existing shops
ILLUSTRATIVE
Books Home
* Market defined as Swedish consumption of furniture, carpets, lamps, home textile and household utensilsSource: MedieSverige 2004; Svensk Bokhandel; Supermarket 1991 & 2005; Dagens Industri November 5, 2005; McKinsey analysis
2722
3850
6
19 20
6 93
1995 2004
InternetSpecialty/Educational
Independent
Buying groups
Akademibokhandeln
Market shares in Sweden Market shares in Sweden*
E.g., Pocketshop
Akademibokhandelnhas 2–3 times higher EBIT than independent bookstores or buying groups
2715
30.6
1990
37.7
2004
Others
IKEA
100% = SEK billion
IKEA plans to double its global sales in 5 years
– Dagens industri
Percent of sales
Exhibit 9

121
New market entrants. Competition is generally higher if there are few
barriers to entry. In retail the key barrier to entry is typically access to
prime store locations. Partly due to eased zoning laws, and/or their
application, and many new entrants in Swedish retail. In grocery, this is
seen in the establishments of the hard discounters Netto and Lidl. In DIY,
the market structure has totally changed with the new entrants in the
1990s (Exhibit 11). The immediate effect of new entrants is increased
competitive pressure, but they also often operate either with an innovative
or a well-proven and efficient business model, further increasing overall
retail productivity.
New channels. New channels typically increase competition as they
grow their share of the consumers’ purchasing power. In Swedish retail,
internet shopping has gone from a concept in 2000 to an established
retail channel with annual overall growth of �5-40 percent and a potential
to fundamentally influence consumers’ shopping behavior (Exhibit 12).
—
—
Exhibit 10
Growth of highly productive formats has increased the pressure on existing shops
Source: EHI; Supermarket 2004 and 2005; McKinsey analysis
Comparison between average supermarket and hard discounter
Sales per Stock Keeping UnitEUR per year and store
Sales densityEUR per m2
Gross marginPercent of sales
Total other costPercent of sales
2010
Hard discounter
Average supermarket
2217
500
3,900
4,000
8,50018
56
134
2251,055
3,255
20032002 2004
20032002 2004
Number of stores in Sweden
Sales SEK millions
GERMAN EXAMPLE
Hard discounters have, when successful, a very efficient operating model…
…and discounters are growing aggressively in Sweden –Netto and Lidl
• From 0% to 13% share of low-price market in 3 years
• Still only ~1% of total grocery market
Exhibit 10

122
Exhibit 11
2002 2003 2004 2005
Grocery
Do-it-yourself (DIY)
ILLUSTRATIVE
1996–19971993 2003 2005
ICA announces heavy price cuts: “ICA promises continued price war”
Netto and Lidl have 134 stores and SEK 3.3 billion in sales
Lidl start-upNetto start-up
Byggmaxstart-up
Bauhaus entersSwedishmarket
K-RautaentersSwedishmarket
SilvanentersSwedishmarket
HornbachentersSwedishmarket
New entrants have total of >50 stores and sales of SEK >5 billion, i.e., ~20–25% market share
Source: Branschfakta 2004, HUI; Supermarket 2005; websites; press clippings; McKinsey analysis
New entrants increase pressure on existing companiesExhibit 11
Exhibit 12
Growth of new channels increases competitive intensity
Books
Homeelectronics
* Estimate based on NetOnNet’s Swedish sales of SEK 700 million and market size of “Home electronics” in Sweden is SEK 32 billion based on VAT filings and SEK 27 billion based on NetOnNet information
Source: Supermarket 2004; Branschfakta 2004, HUI; Svensk Bokhandel; annual reports; McKinsey analysis
Non-grocery
CategoryCompany
All Swedish retail internet
Position of Internet shopping in Swedish retail, excluding foreign websites
2–3
2–3*
9
35–40
65–70
~40
Market share, 2004
Percent
CAGR, 2002–2004
ILLUSTRATIVE
BokusAlibris.se
Net-on-net
Exhibit 12

12�
Growth of private label. Private label products have been driven by lower food
prices, but have also increased margins to some extent as retailers capture
a larger part of the value chain. The retailer gains bargaining power on the
expense of the manufacturers as the retailer ”owns” both the sales channel
and the brand. Additional savings come from the elimination of unproductive
steps in the value chain, such as the manufacturers’ field sales force. If
the competitive intensity is high enough, the increased margin is typically
passed on to the customer. Since the 1990s, the share of private label has
increased in both food and general merchandise retailing. According to AC
Nielsen data private label products accounted for 14 percent of total grocery
sales in Sweden, with an average of �6 percent lower price levels compared
to branded products.
Advanced IT usage. Supply chain optimization and assortment control has
advanced significantly in the past 15 years due to developments in the ways in
which retailers use information and communication technology (ICT). The use
of barcodes and scanners coupled with the implementation of ICT systems
have enabled vast improvements in supply chain efficiencies of retail firms
and have also driven the vertical integration of retailers as in the US. The
advantages of technology are seen in areas such as:
Assortment management. Retailers get better sell-out data and can
use it to precisely tailor their product offerings to meet consumer
demand patterns. Also, by integrating systems and exchanging data
vertically, manufacturers have access to the same data, improving their
responsiveness to consumer demands.
Inventory management. Retailers can get real-time control over their
inventory, eliminating the labor-intensive manual inventor checks. Using
this data, orders become more accurate thus reducing inventories as the
supplier gets better data on both inventory levels and sales.
The use of technology is costly and therefore dependent on sufficient scale of
operations. Following the larger scale of operations, the US retail sector has
come far in leveraging the technological advances. Growth of integrated retail
chains and big box formats in Sweden is increasing the scale of operations
and thus enabling the firms to better leverage ICT systems and more efficient
—
—

124
management techniques. In itself, technology development favors larger scale
of operations and is consequently a driver in the ongoing industry structure shift
towards larger stores and players as well as more tightly integrated chains.
factors Explaining the Employment Development
The strong productivity growth has not been accompanied by job creation. Between
1990-200�, Sweden experienced a net job loss of �0,000 jobs, representing 0.5
percent of the working age population. This means that the productivity gains
have resulted from the downsizing of personnel, not from increased output. The
main reason for this is mainly the labor market barriers. Since 1990, the only
labor market barrier that has been at least partly addressed is labor flexibility:
The risk of hiring was reduced when the probationary employment period was
set to 6 months in 1994/1995
The use of time-constrained employment arrangements has increased during
the 1990s, partly due to increased flexibility (Exhibit 1�).
Exhibit 13
96
13
14
22
36Called for at demand
Substitute
Trialemployment
Vacation work
Projectemployment
Other, e.g., seasonal
Retail industry is increasingly using time-limited employment arrangements
Source: HUI, Handelns arbetsmarknad, page 16–18
Time-limited employment
Usage of time-limited employment arrangements in retail, 2000Percent, 100% = 44,000
0
5
10
15
20
25
1990 91 92 93 94 95 96 97 98 99 2000
Retail
Industry average
Percent
Exhibit 13

125
the Current Barriers in the retail Sector
Since 1995, many product market barriers have been removed or are less
restrictive. Today, the most significant remaining product barrier to positive
productivity development in Swedish retail is the application of zoning laws.
There has been a change in many municipalities during the last years as a result
of a changed mindset; however, the zoning laws are still a major barrier to entry
for new retailers and for the growth of highly productive store formats:
Speed of process. Today, it can take several years to change the local building
plan (detailed plan) including process of appeal. The time to get a definitive
decision is in itself a barrier for retailers that want to grow organically rather
than to purchase locations (which can be close to impossible as the existing
chains own the first right to all of their store locations). The time-consuming
process increases the risk, and discriminates against less capital-intensive
players, attempting to establish new stores.
Variations in policy. Today, the decision to build a new shopping center or a
new large retail store depends on the political majority of each municipality.
Although there is a mindset change regarding the positive effects of increased
competition, the opinion of many stakeholders is that Swedish municipalities
still vary greatly in their judgments regarding new retail establishments. These
variations make it riskier to establish new stores and thus limit competition.
Looking at employment, the Swedish retail industry employs significantly fewer
people per capita than other countries. If Sweden went from today’s 4.5 percent
of working-age population to the German level of 6.1 percent, it would mean
90,000 new jobs, one third of the open unemployment in Sweden as of November
2005 (Exhibit 14).
The explanation behind Sweden’s weak job creation is partly the existing labor
market barriers, and partly a weaker demand situation, particularly for service-
intensive retail concepts. As many product market barriers have been removed or
are less damaging today than in 1995, the following labor market barriers have
become more important:
Labor cost. The effect of having a high retail labor cost is two-fold: first,
productivity gains are more likely to be used to reduce employment instead

126
of increasing output, and second, only a few consumers with high purchasing
power can afford service-intensive retail concepts, thus drastically reducing
the demand for service jobs. Sweden has very high retail labor costs:
High cost compared to other countries. Comparing the PPP-adjusted cost
to employ a female shop assistant in capitals over the world, Sweden has
the fourth highest cost (Exhibit 15). Sweden also has very few “low-cost”
jobs compared to the UK and US. It is difficult to create jobs with lower
qualifications since there is no demand at the price at which the services
are offered (Exhibit 16).
High relative cost compared to goods. The way taxes are designed in
Sweden, services are discriminated on behalf of goods. In the US or the
UK, the consumer gets 70-100 percent more services for the price of the
same product compared to Sweden (Exhibit 17). The result is that the
Swedish consumer more often chooses to buy a product rather than to
pay for service.
Labor flexibility. Sweden’s labor laws and the retail collective agreements have
not changed significantly since 1990. The flexibility is today limited when
—
—
Exhibit 14
* Canada and Japan 2002 and 1990–2002 respectivelySource: Groningen Productivity Database, February 2005; OECD Labor Market Statistics Database; McKinsey analysis
Country Retail employment, 2003* Change, 1990–2003*
4.3
4.5
4.6
5.4
5.5
6.1
6.4
6.7
6.7
7.5
8.5
9.0Japan
UK
US
Canada
Netherlands
Ireland
Germany
Denmark
Spain
France
Sweden
Finland -0.80
-0.50
0.20
2.20
0.50
0.70
2.80
1.60
0.80
0.90
0.90
1.00
• If Sweden went to the same employment rate as Germany, 90,000 new jobs would be created
• Moving to the UK level, as many as 180,000 new jobs would be created (including wholesale)
Swedish retail has a dramatically lower employment level than other countries and has experienced negative job creation % of population 15–64
Exhibit 14

127
Exhibit 16
Comparing wage distributions across several countries clearly shows the high labor cost in Swedish retail
Source: Bureau of Labor statistics, US Department of Labor; UK Department of Labor; SCB Lönestrukturdata; McKinsey analysis
Retail wage distribution% of employees
Total cost of laborUSD 50 brackets, PPP adjusted
0.0
0.5
1.0
1.5
2.0
2.5
3.0
3.5
4.0
4.5
5.0
0 1,000 2,000 3,000 4,000 5,000 6,000 7,000 8,000
Sweden
UK
US hourly
US full-time
Exhibit 16
Exhibit 15
High total cost for shop assistants in Sweden compared to other countries
Source: Prices and earnings 2003, UBS; Watson Wyatt Global Remuneration Report; McKinsey analysis
12,228
Athens 21,744
Toronto 22,650
London 25,315
Brussels 29,911
Paris 31,172
Oslo 31,184
Amsterdam
34,145
Lisbon
38,292
33,424
31,771
Berlin
Copenhagen
Dublin
34,083
New York
32,681
31,411
Stockholm
Zurich
Rome
Helsinki 31,410
34,403
Gross cost for female sales assistant 2003 adjusted for actual hours worked and price levels in the cities City
USD per year
Exhibit 15

12�
compared with countries like the US and UK. The main barriers to job creation
that are functions of low labor flexibility are:
High supplements for evening and week-end hours. In Sweden, there is no
opening hours legislation, apart from the law that the safety and working
conditions of the employees is the responsibility of the employer. In Sweden
the opening hours are instead restricted due to the high cost of labor
during week-ends and evenings. The Swedish retail employees’ union has
been successful in maintaining retail wages and especially the unsocial
working hours’ supplements at high levels. The effect of the supplements
is that stores pay up to 100% more for labor at the times when many
consumers prefer to shop, e.g. Sundays (Exhibit 1�). Shop owners find
this to be problematic as expanded hours of operations would attract
more consumers but the higher wages often make it counter-productive.
From an employment perspective, it is likely that should the supplement
be reduced, retail owners would find it more profitable to increase hours
of operation and employ more people than today.
—
Exhibit 17
Compared to the US and UK, services in Sweden are much more expensive than goods, keeping overall retail employment down
3060 50
Source: US department of labor statistics; Statistics Sweden (SCB); UK department of labor; UK income data services; Apple; IKEA; Barnes & Nobles; Akademibokhandeln; McKinsey analysis
Product
1,040
1,730 1,720
60
100120
For the price of one product…
Sweden UK US
…customers in UK and US can buy significantly more services than in Sweden
Minutes of service at lower-end retail labor cost
Sweden UK US
Sweden UK US
Exhibit 17

129
Employer’s perceived risk of hiring. The Confederation of Swedish
Enterprises notes that Swedish employers are reluctant to employ people
due to inflexible labor legislation and collective agreements. Employers
also find it troublesome that they cannot lay off unproductive employees.
It should be noted that this risk is perceived to be much more significant
for small-to-medium sized companies. Large companies have the scale
to absorb the consequences of employment problems. The actual impact
of the employee protection laws has not been further analyzed, but it
seems that the risks to the employer may be overstated in the public
debate. However, a negative effect of strict employee protection laws is
the increased barrier to enter employment by those not currently in the
labor market.
Demand conditions. Compared to the US and the UK, Sweden has a
significantly lower share of service concepts and thus lower demand for retail
labor. This is driven not only by the high cost of labor as described above, but
also by a lower demand for services. There are three primary reasons for the
weak demand:
—
Exhibit 18
170100 111
18*–20
20–24
08–12
12–18
All day
100 100 100 100
200
100 100 100
200
100147
100
100–106
High cost of labor on evenings and week-ends is a barrier for retail
* 18.15 for Sweden, 18.30 for Sainsbury’s (UK)** Provincial UK, shop assistant with base salary GBP 5.39/hour
Source: När handlar vi?, HUI; Kalenderkorrigeringsgruppen; 2003 Annual Specialty Store Compensation & Benefit Survey, US National Retail Federation; UK Income Data Services; Hanselsanställdas förbund; McKinsey analysis
Cost of retail labor by day and time, Index 100 = Mon–Fri 08–18
Mon-Fri 08–18*
Saturday
Sunday
Distribution of sales by day and time
9–12 12–16 16–20
Monday
Tuesday
Wednesday
Thursday
Friday
Saturday
Sunday
Sum
Sum
1 3 5
2 3 5
2 4 7
3 5 10
4 8 10
4 9 4
2 6 3
18 37 45
10
10
12
18
22
17
11
100
<4%
4–6%
>6%
ICA Maxi example (Large format grocery store)% of weekly sales
150100 111
100 100 100 100
Sweden UK (ASDA) UK (Sainsbury’s)**
US
100–106
Exhibit 18

1�0
Historical ideals and behavior. There is no tradition in Sweden to pay for
especially lower value-added services, and it is sometimes considered as
something only the upper class would do.
Low disposable income. Sweden has a narrow income distribution and
experienced only modest increase in wealth during the period, leaving only
a relatively small share of the population with enough disposable income
to pay for high-service concepts.
Low innovation. Partly as a result of low demand for services and high
cost, innovation in service-intensive retail concepts has been very low.
A second reason is that entrepreneurship in Sweden has not been very
attractive due to the perceived administrative burden and high risk. Capital
for entrepreneurs has not been abundant, but neither has it been scarce.
Today, the perception in the industry is that capital exists and should thus
not be seen as a significant barrier.
Labor supply. The labor supply needs to match the demand for labor in order
to allow job creation. There is no reason to believe this has not been true for
Sweden’s retail sector from 1990 until today (Exhibit 19):
Low educational requirement. To work in retail there are few requirements
for formal education. Only 19 percent of retail employees have more
than 12 years of education (Gymnasium), and a large share of those are
probably university students working part time or temporarily until they find
jobs fitting their qualifications.
High overall unemployment. Due to the economic downturn in the beginning
of the 1990s there has been high unemployment in the country during the
time period in question. In interviews, most store managers report that
the problem is too many applicants rather than too few.
Many unemployed retail workers. The unemployment rates are even higher
in retail than in the overall economy, further strengthening the conclusion
that labor supply has not been an inhibitor to job creation.
—
—
—
—
—
—

1�1
KEy CHAllEnGES for tHE futurE
Going forward, the challenge will be to adopt to trends such as a continued
shift in the industry structure, increasing use of private labels, and probably a
continued internationalization:
Continued shift in industry structure. The industry structure shift will continue
to evolve in the Swedish retail sector. This shift will probably include a more
pronounced polarization of the market, where both premium and low-price
concepts grow to the detriment of the “middle-market” stores:
Growth of both hard and soft discount. Hard discount stores have been
largely successful in Germany, while there is a more mixed picture in other
countries. It is uncertain whether the German hard discount model will
work in Sweden, but the entry of Lidl was an important occurrence as it
introduced a new business model to the Swedish grocery market. (Exhibit
20). Discounters, whether they are “hard” or “soft”, are likely to continue to
grow as they currently account for only approximately 1 percent of Swedish
grocery sales and the Swedish population is rather price conscious.
—
Exhibit 19
* “Handelsanställdas förbund”, the Swedish retail workers’ unionSource: Svensk Handel; AMS; McKinsey analysis
Lack of qualified labor does not explain Sweden’s low retail employment
Low education requirements in retail Generally higher unemployment in retail than overall
Percent of retail employees (including part-time) Unemployment or in labor market programPercent of members
19
58
23
Primary/secondary school (9 years)Higher education
Gymnasium (12 years)
4.37.0
4.06.0
2.5
3.0
2.3
3.3
9.3
“Handels*”
6.3
Others
10.0
“Handels*”
6.8
Others
Unemployment
September 2000 September 2005
Labor marketprograms
Exhibit 19

1�2
Continued expansion of shopping centers. Today, Swedish shopping
centers account for approximately one third of Swedish retail. As retail
volumes grow further, it is likely that the shopping centers will capture
most of this growth and also increase shares in the existing retail markets.
Centrumutveckling estimates that 750,000 m2 of new retail area is needed
until 2010. However, it is important not to overestimate the growth of
shopping centers. Given living patterns, it is not likely that Sweden ever
will come close to the US levels where approximately 75 percent of all
retail activities takes place in shopping centers.
Growth of large productive store formats. It is most probable that there is
still room for continued growth of large, productive store formats. This is
also a result of the low-price trend that favors large efficient store formats.
However, the population density in Sweden is not as high as in continental
Europe, UK and the US, which will probably keep the development to levels
lower than in those countries.
Growth of service-intensive and premium concepts. In parallel with the
development of low-price and value concepts, there will be an increasing
—
—
—
Exhibit 20
Hard discounters have become immensely successful in Germany, less so in other countries
* 2002 figures ** 2002–2004
Source: AC Nielsen
Percent
27.2Germany
16.4Austria
12.8Belgium
9.6France
9.3Netherlands
4.6Spain
3.7Denmark
3.6UK
2.9Finland
2.2Italy
0.4Europe*
7.4
14.0
8.0
11.8
10.3
22.9
4.5
8.4
88.6**
14.0
10.0
Market share, 2003 Sales CAGR, 1999–2004
Aldi and Lidl
Exhibit 20

1��
market for premium concepts with high value-added. The innovation and
growth of those will depend largely on the labor market conditions and
reduced barriers to entry for new players.
Increased importance of private label. Private label offers attractive margins
for retailers, and since it currently claims a relatively low market share in
Sweden, continued expansion is likely. In relative terms, it will likely be the
premium/niche private label products that will increase the most, due to
their high gross margin contribution and today’s low penetration relative to
international benchmarks (Exhibit 21-22).
Increased international competition. In Sweden, the importance of the
foreign-owned retailers has increased significantly since 1990 when Swedish
retail was essentially a local market. Today, almost 5 times more people are
employed in foreign-owned retail companies than in 1990 (Exhibit 2�). In a
market characterized by such large scale advantages as retail, it is most likely
that the ongoing trend of cross-border consolidation will continue.
Exhibit 21
Note: Europe is here defined as UK, Germany, France, Italy, Spain, Holland, Belgium* In Holland 2002
** Number for Morrison as a whole. Safeway bought by Morrison in 2004 Source: Planet Retail; annual reports; press clippings; Taylor Nelson for UK player
Average top 15: 40% PL
Estimated PL penetration, valuePercent, 2004
“We want to make the Casino brand become the reference in private label in France, and we are aiming for 50% share of private label in volume in our stores, versus 30% today“
“We want to increase the range of private-label products offered by Carrefour. Currently, 30% to 32% of Carrefour's products are private label. We aim to raise that to about 43% to 45%”
Largest European retailers will continue to drive private label share further up
Morrisons 16.2
Asda/Wal-Mart 17.1
Leclerc 18.0
Sainsbury 18.3
26.8Edeka
26.5Aldi
25.7Intermarché
Auchan
Casino 21.5
21.4
Ahold
Metro Group 23.9
22.0
28.4
30.6Rewe
Schwarz (Lidl)
Carrefour
34.3Tesco
54.7
49*
52
24
50
8
95
34
30
20
10
50*
80
21
49
30
Western Europe grocery salesEUR billions, 2004
Top 15 retailers account for 37% of total European food sales…
…but 60% of total European private label sales
– Chief executive, Carrefour
– Managing Director, Casino
Average market: 26% PL
Exhibit 21

1�4
Exhibit 23
Swedish retail industry has seen an increase in foreign-owned companies, a trend that is likely to continue
Source: ITPS, Foreign-owned companies
Number of foreign-owned retail companies Employees in foreign-owned retail companiesPercent of total retail employment
348
71
20041990
17
2
20041990
Exhibit 23
Exhibit 22
Source: McKinsey analysis
Private label has higher margin than branded goods…
DISGUISED EXAMPLE
…and it is higher the more premium it gets
Premium private label has higher gross margins than lower-PL
Attractiveness
Entry price point PL
Brandequivalent PL
Grossmargin, % Same Higher Much
higher
Premium/niche PL
Absolute grosscontribution
Lower Slightly higher Higher
Gross margin relative to branded goods
Attractive margins on private label vs. branded goods drive increase in private labelIndexed
12 (17%)
9
28 (28%)
3
100
35
13
Consumer price
72
Retailer gross margin
Selling price to retailer
Manufacturer EBITDA
Advertising and promotion
R&D
Selling/overhead
COGS
75
37
2
29 (39%)
1
46
5 (11%)
1
Branded goodsPrivate label –brand equivalent
Con
sum
er g
oods
sup
plie
r
Exhibit 22

1�5
SuMMAry AnD IMPlICAtIonS
With retail being such an important sector and having such a high potential for
job creation, it is important that policy makers, unions and companies work
together. The objective should be to further increase productivity by addressing
the remaining product market barriers, while actively improving labor market
conditions to ensure a net job creation in the years to come.
Further increase competitive pressure by addressing zoning laws. The most
important barrier to productivity growth and increased competition in Swedish
retail is the access to retail premises:
Uniform application of zoning laws. Policy makers should actively
promote the ongoing industry evolution. The positive effects of increased
competition should be clearly addressed in response to local concerns
about marginalization of existing retail.
Shortened process time. Policy makers should revise the PBL process to
shorten the time to a final decision. It is important to do so in order to
facilitate for the industry evolution with increased productivity and lowered
barriers to entry for new players.
Improve labor market conditions to facilitate job creation. Policy makers and
unions must together support the retail sector’s growth and facilitate job
creation. The main objective for the union, in addition to the essential function
of protecting the interests of people currently employed in the retail sector,
could be to assume a proactive role by actively working to allow unemployed
colleagues and all potential new retail workers to find jobs. In order to turn the
productivity gains into job creation, policy makers and unions must together
find ways to make the following changes:
Increase flexibility. To increase job creation, it must be possible to employ
people in a way that matches the needs of the companies. The recent
proposal from the Commission of Inquiry on part-time employment (“Rätt
till heltid”) is regressive in terms of job growth as it will be riskier to
employ part-time personnel, especially for small-to-mid-sized companies.
The union and policy makers should actively work in the opposite direction
and consider alternatives to increase flexibility rather than erect additional
barriers.
—
—
—

1�6
Decrease labor cost differential of unsocial working hours. The unsocial
working hours supplement is today keeping down retail employment.
By reducing the supplement, more people could be employed during
evenings and weekends, and the retail industry might lose less ground
in the competition for the consumer’s purchasing power. The supplement
reduction could be compensated through increased salary based on
average supplement bore by full-time employees, or by an increased
performance/profit based pay.
Reduce labor cost. To make service-intensive retail attract a larger share
of the population, the cost of labor need to decrease. This should probably
be done in a way that minimizes the price impact for the individual worker,
e.g. by revising today’s tax wedges.
Embrace internationalization of retail. In the future, Swedish retailers need
to fundamentally enhance their own strategic position to meet increased
competitive pressure in the home market. This change is positive as the
increased competition, the introduction of successful formats and the
increased scale of operations will drive productivity growth. To facilitate this
change, both policy makers and individual companies have an important role
to play:
Increased competition. Competitive pressure will continue to increase
as foreign established concepts enter the Swedish market. To meet this
competition, many of today’s companies need to significantly improve
both back- and front-end operations. They should strive for global best-
practice rather than being content with excellence by Swedish standards.
Both entries and exits are natural for a well functioning market and will
ultimately drive productivity. Policy makers should not be tempted or
persuaded to inhibit this structural change, as ultimately it will be the
Swedish consumers will benefit from the increased competition.
Cross-border consolidation. The scale advantages will further drive cross-
border consolidation. While less significant to the overall economy, many
individual companies need to grow internationally, either organically or in
partnerships, or face the risk of being acquired. Their larger scale will
make them more competitive in the Swedish market and thus contribute
to increased productivity in Sweden.
—
—
—
—

1�7
In addition to the above, it will be increasingly important for the retail companies
to deliberately select a strategic position. The future retail market will probably
be significantly more polarized than today. Following an ongoing evolution, the
low-price/value segment will further increase in importance with large productive
stores and chains and efficient discounters. In like manner, the high-end/premium
segment of the market will also show strong growth with increasing shares of
the consumer’s purchasing power. Several of today’s retailers seem to miss the
opportunities this development brings, and instead they risk being caught in the
middle.

1��

The Swedish Retail Banking IndustryEXECutIvE SuMMAry
In the early 1990s, the McKinsey Global Institute reported that Sweden’s
retail banking sector was 20 percent below the benchmark country, the US, in
productivity and �0 percent below in net job creation. At the time, product market
barriers and market conditions were the largest inhibitors to productivity growth.
Sweden’s ban on foreign banks and its low consumer mobility were two primary
inhibitors. Today, only a few product market barriers remain. Instead, the greatest
inhibitors to productivity growth exist at the corporate level.
The Swedish banking sector has gone through a significant structural change
over the past years. During the period from 1995 to 2002, Swedish retail banking
showed strong productivity growth while losing only a limited number of jobs.
Bank productivity grew by 4.6 percent annually, and job creation resulted in a
loss of 0.4 jobs per thousand working age population1. Today, Sweden has one of
the most productive banking sectors in the world, favored by its highly productive
payment and distribution mix.
The domestic mergers that followed the financial crisis in the early nineties were
the first step toward reshaping the industry. Since then, a series of changes has
led to the removal of product market barriers and to strong productivity growth.
First, deregulations and harmonization with EU have led to increased cross-border
activity. Sweden gave new players permission to perform retail banking. Niche
players and foreign banks entered the Swedish market, significantly increasing
competitive intensity.
1 Job creation indicates development in the period 1992-200�, and is calculated as jobs lost divided by the working age population
1�9

140
Second, the development of bank technology has contributed to improved
operations. Back-office automation and communication among banks have
improved considerably. Mergers and increased product complexity necessitated
investments in system integration and customer relations management (CRM)
tools. In fact, IT-costs, as a share of the total cost base, doubled between 1995
and 2002. Niche players offering innovative concepts such as telephony and
internet banking, coupled with a rapidly increasing internet penetration in the
society as a whole, drove large banks to adapt to the new technology.
Third, as the increase in competitive intensity resulted in more product offerings,
and as banking products became more accessible (mainly through on-line
banking), Swedish customers have become more demanding and less loyal than
they were in the early nineties. As Swedish consumers increasingly shop around
for the best offerings, customer mobility has increased.
As a result, Swedish banks have emphasized their restructuring of operations.
One clear indicator of structural change has been the closing of branches. Cost
cutting and the increased importance of non-branch channels have resulted in
the reduction of a third of the Swedish bank branches. Today, branch density in
Sweden is among the lowest in Europe.
When comparing Sweden to the US, the main differences are lower demand in
Sweden and a different payment mix. The inherently lower demand for Swedish
retail banking products diminishes the overall performance of Swedish bank
productivity, while the payment mix favors productivity in the Swedish bank
system as there are fewer paper-based transactions than in the US. An increased
penetration of retail banking products would further drive productivity and job
creation.
In addition, Sweden as a country has made the “system choice” to have a
larger share of the life cycle spend handled by the government. However, this
particular fact does not necessarily affect the productivity level of the Swedish
retail banks negatively. It does contribute to lower output per capita, and leads
to a correspondingly lower employment level in the Swedish sector.
The sector is not likely to add jobs in the near future. On the contrary, employment
in the sector could decrease. So far, banks have not laid off branch employees
in their restructuring programs, but have reallocated staff from one function to

141
another. Total branch capacity has barely changed as remaining branches have
become larger. Furthermore, the continued shift to non-branch channels, and the
increased back-office efficiency from technology development and off-shoring,
could potentially result in the loss of even more jobs.
The task for Swedish policy makers will be to continue to ensure competitive
intensity, which will drive productivity further. For example, introducing the right to
switch fund managers without being charged immediate capital gains tax would
increase the competitive intensity by eliminating the lock-in effect that inhibits
Swedish consumers from shifting their accumulated wealth (e.g., pensions) to a
more efficient fund provider.
The task for Swedish banks will be to promote expanded access to banking
products — mainly through improved segmentation and bundling and also through
increased innovation around non-branch channel concepts. Furthermore, Swedish
banks should strive for scale in back-office functions and increasingly consider
offshoring as a viable option for reducing costs in IT-services and back-office
operations. Moreover, Swedish banks should make sure to actually realize the
cost efficiencies gained from the low branch density and reduce labor overcapacity.
In the future, the industry is likely to see even more consolidation as it changes
into a more pan-European game. Due to their limited size, Scandinavian banks
will probably be challenged to win in this new environment. However, they should
also be able to leverage their high efficiency to gain an advantage and potentially
become very successful.
PErforMAnCE In tHE rEtAIl BAnKInG InDuStry
This report looks at the banking industry in general, and at retail banking in
particular. It covers universal banks, such as SEB, Nordea, Handelsbanken and
Föreningssparbanken (FSB), as well as specialized firms and niche banks. We
believe the banking study contributes to the discussion of the Swedish economy
in three ways:
First, the banking industry is significant in all economies. Banks and securities
firms provide payment settlement and financial intermediation services that
are indispensable to the rest of the economy.

142
Second, there are large differences between countries in the creation of
new employment in the banking industry. Previous work by McKinsey Global
Institute (MGI) showed that the United States was able to do away with a
number of traditional jobs through innovation and competition between
19�2 and 1992, but that the increased demand for new business systems
increased employment in mortgages and securities more than in the European
countries. This development was different for Sweden in the same period,
which added the most employment in traditional product segments. Today,
technology has changed the Swedish banking structure significantly, and a
decrease in employment in the retail banking sector appears inevitable.
Third, this study shows how removing product market barriers, for example,
allowing foreign affiliates and niche players to enter the market has increased
the competitive intensity and contributed to increased productivity in the sector.
tHE rEtAIl BAnKInG InDuStry In SwEDEn
The Swedish retail banking sector generated about EUR 5.4 billion in revenues
in 2004, of which consumer credits and deposits were the largest segments
(Exhibit 1). Although there were 126 banks in Sweden in 2004 (of which 7� were
savings banks and 4� commercial banks), it is still a highly concentrated industry.
A handful of large banks, i.e., SEB, Nordea, FSB and Handelsbanken, dominate
the market with offerings that cover the whole range of retail banking products.
In 2004, the four largest banks accounted for approximately 7� percent of the
total deposit and lending volumes and employed more than half of the financial
intermediation sector (Exhibit 2). However, the established banks are becoming
increasingly challenged by foreign entrants, e.g., Danske Bank, and niche players,
e.g., Skandiabanken, IKANO Banken and ICA Banken. Niche banks and foreign
entrants have contributed to price pressure and increasingly taken market share
in segments such as lending.
The financial crisis of the early 1990s affected the Swedish banking industry
significantly. Several of the banks were on the verge of falling below capital
requirements, and two major players received capital infusions from the state.
The state restored confidence and secured funding for the banks by issuing
a general guarantee. The situation was primarily a consequence of excessive
lending for real estate speculations. Credit losses ran high and customer

14�
Exhibit 1Exhibit 1
The Swedish banking sector – Products, revenues and margins
Source: McKinsey
Percent
100% = EUR 5.4
20
14
Consumer credits• Overdrafts• Personal loans• Credit card loans
Payments/debit card
15
2004
26
Professional loans
10
Deposits• Current accounts• Term deposits • Savings deposits
Mortgages
15
Investment products• Securities• Mutual funds
billion
69
31
5.4
2004
100% = EUR
Interest revenues
Fee revenues
billion
Revenue by source Revenue by product Average margin 1998–2004Revenue growthCAGR 1998–2004
2.3
2.6
Overdrafts
Saving deposits
Credit card loans
Professional loans
Current accounts
2.5
Securities 0.7
Mutual funds 0.9
Mortgages
2.8
4.7
9.2
1.8
0.9
Personal loans
Termdeposits
3.4%
7.8%
5.7%
0.9%
4.6%
-9.1%
4.9%
7.8%
2.7%
5.8%
Exhibit 2Exhibit 2
More than half of all employees in the sector work for the four large banks
* Mortgage institutes, financial advisors, investment banking, smaller banks and all operations not included in mother company activities** Financial intermediation sector excludes insurance and pension funding. 2004 total figure estimated based on 1995–2003 development
Source: Swedish Bank Association; Groningen Productivity Database, Oct 2005; Statistics Sweden; McKinsey analysis
56
1995
57
96
55
97
56
98
56
99
59
2000
58
01
58
02
57
03
57
04
Employment development
Thousands
Number of employees in the Swedish financial intermediation sector, 2004
Employees outside Sweden
Total for company
Nordea
7
SHB
23
Others*
57**
Total
10
FSB
9
SEB
8
7
17
10
19
23
31
2
9
N/a
N/a

144
satisfaction decreased. However, Swedish banks recovered quickly, partly due
to the bankcleanup initiated by the government, and are now showing good
profitability and improved customer satisfaction (Exhibit �).
Low output levels and low employment levels characterize the Swedish banking
sector. This structural difference could be explained by the fact that Sweden as
a country has made the “system choice” to have a larger share of the life cycle
spend (e.g., pensions and university tuitions) handled by the government. In
200�, the banking sector accounted for 1 percent of the Swedish working age
population (Exhibit 4). If the Swedish banking sector had the relative employment
levels of the US, it would correspond to 1�,000 new jobs. However, the fact that
the Swedish banking sector employs relatively few people is not necessarily a
failure of the sector. On the contrary, it reflects the system choice mentioned
above and is an indication of efficient operations stemming from a highly
productive payment mix, and low branch density.
Exhibit 3Exhibit 3
The recovery of the Swedish financial sector after the crisis in the early 1990s
* Credit losses as share of average lending to public** Survey conducted by SIQ (Institute for Quality Development), SCB (Statistics Sweden), and the two institutions SSE (Stockholm School of
Economics) and CTF (Center for service research at University of Karlstad). Interviews with 5,000 people answering 30 questions ranking performance between 0 and 10. A difference of 2 points is statistically significant
Source: SIQ; Statistics Sweden; McKinsey analysis
1992 1994 1996 1998 1999 2001 20022000199719951993
2.8
2.0
1.3
1.0
0.5 0.40.3
0.0 0.1 0.1 0.1
Bank customer satisfaction index**
58
60
62
64
66
68
70
72
1989 1991 1993 1995 1997 1999 2001 2003
Retail
TotalWholesale
Average credit losses, public lending*Percent

145
Measuring productivity in retail banking
Measuring labor productivity in retail banking and comparing the levels across
countries is difficult since there is a lack of high quality price deflators. Using a
physical output indicator allows an examination of the technical efficiency of the
industry, i.e., performance excluding price effects. This study uses retail banking
productivity indices that have been calculated by dividing an aggregate output
index by a corresponding input index.
The retail banking output measure includes several major financial services
offered to households and individual professionals. It is a quantity index based on
the number of cashless payment transactions, the real volume of retail deposits,
the real volume of personal and mortgage loans and the number of investment
product transactions (Exhibit 5). The output is aggregated by weighting each
category with the average unit labor input from 1995 to 2002. Labor input
is adjusted by the retail banking share of the financial intermediation sector;
employees performing non-retail activities inside the selected institutions are
subtracted, and outsourced employment/external services are added. Finally,
the employment levels are adjusted for the average working time. A more
detailed description of the methodology used in this report is found in Appendix
A: Methodology.
Exhibit 4Exhibit 4
The Swedish banking sector has a relatively small share of employment
* Canada and Japan 2002 and 1992–2002 respectivelySource: Groningen Productivity Database, Oct 2005; OECD Labor Market Statistics Database; McKinsey analysis
Country Banking employment, 2003*Percent of population 15–64
Change, 1992–2003* Net job creation per thousand of population 15–64
0.8
0.9
1.0
1.2
1.3
1.4
1.5
1.6
1.6
1.7
1.8
2.5Canada
UK
Ireland
Denmark
Netherlands
Japan
Germany
US
France
Sweden
Spain
Finland -5.3
-0.9
-0.4
-0.2
2.0
-0.1
-0.9
2.0
-0.7
1.0
-0.4
3.9

146
InDuStry PErforMAnCE
the starting point of the sector
The Swedish retail banking sector in the early 1990s had just come out of the
tightly regulated conditions of the mid-eighties (when interest rates were capped,
bond issuance regulated and lending volumes limited) (Exhibit 6). The initial
effects of the deregulation were seen on the volume and the sales side, causing
an explosion of credits. However, the risk control systems to handle the new
demand were not in place, causing the Swedish bank system to almost collapse.
The crisis forced banks to restructure and improve the operating results. This
development led to the bank system of today, described in more detail below.
The main reasons for the low productivity in the early nineties were that the
competitive pressure was low, labor was still organized much as it was in the
1970s, and Swedish customers were being relatively undemanding:
Low competitive pressure. Sweden had a very concentrated banking industry,
and foreign competitors were not allowed to have Swedish subsidiaries
until 19�5. Furthermore, the foreign players were not allowed to open their
Exhibit 5Exhibit 5
A number of products and services are considered in the physicalproductivity measure
* Electronic financial transactions at point of sale** Includes wholesale payments
Source: McKinsey
Wholesale activities
Banking
Retail banking
Included in the measure+ Sum, not weighted
Sum, weighted by unit labor input
Corporate banking
Investment banking
Fund management
Private Equity/VC
Other
Deposits
Payment transactions**
Loans
Investmentproducts
Information inquiries
Equity (retail)
Bond (retail)
Time deposits
Savings accounts
Mortgages
Consumer loans
Mutual funds (retail)
Cash withdrawals
EFTPOS*
Transfers
Checks
+
+
+
+

147
own banks in Sweden until 1991-1992. As a consequence, the competitive
intensity was lower than would be expected, and less pressure to reorganize
tasks and production processes was exercised, leading to lower productivity.
Labor organization. In 1992, Swedish banks were decentralized and branches
conducted business as they chose. The advantages of the model were
the ability to use local customer knowledge and to motivate the staff. The
disadvantage was that few scale advantages could be leveraged in tasks
where central units could have handled the processes better. During that same
period, the United States was largely using regional and national processing
centers, where most of the activities were automated (including clearing of
checks, using image processing technology, reviewing loan applications, etc.).
In Sweden, the pressure to reorganize was low until the crisis, and potential
new entrants were blocked out. Also, between deregulation and the financial
crisis, the focus was on volume, and costs were not a key priority for most
banks.
Exhibit 6Exhibit 6
The Swedish retail sector experienced significant deregulation in the 1980s
• Regulation of the banks’depositinterest rates abolished
• Regulation of the interest on bonds issued bycompaniesabolished
• Bankspermitted to issuecertificates
• Someliberalizationof the currencyregulations
• Liquidity quotas abolished
• Volume of lending regulated by recommendations
• Ceilings for the lending from banks, mortgage institutions, and finance houses abolished
• No recommenda-tions regarding interest rates
• Liberalized currencyregulations
• Subsidiaries of foreign banks may be established
• Further currency liberalization
• Placement requirements abolished for insurance companies
• Majorcurrencyliberalization
• Rules for issues by mortgage institutions liberalized
• Further currencyliberalization
• Swedish bankspermitted to establishsubsidiariesabroad
• Regulation on the insurancecompaniesloan rates abolished
• Treasurydiscount notesintroduced
1978 1980 1981 1982 1983 1984 1985
1986 1988 1989 1990–19931987
• Most remainingcurrencyregulationsabolished
• EEA agreement, issue rules liberalized,remaininginterest rate regulationsabolished
• New players given permission to perform retail banking
1979
Source: MGI 1995; press clippings

14�
Limited IT-usage. Information technology use was applied unevenly in Sweden;
some areas were highly automated while other areas lacked automation
completely:
Highly automated areas were transactions such as payments and deposits.
There was significant ATM penetration compared to other European
countries (although not at the level of the United States). The two Giro
systems were automated processes in use for decades. Furthermore,
many Swedish banks handled deposit accounts in simple ways. Accounts
were opened by the teller, directly through the banks’ computer systems.
Credit decisions were not automated.. These had to be manually processed
and reviewed by several hierarchical levels before a decision was made.
Scoring systems were seldom used at all, and credit approval processes
took days, if not weeks. By contrast, the United States, among others,
could make country-wide, high quality loan decisions within 90 minutes.
Customer behavior and external factors. Swedish customers were
unsophisticated for several reasons, the most important being the
undifferentiated service offerings of existing banks during the regulated period.
Another key factor was that people in Sweden had low levels of accumulated
wealth, and consequently low demand for advanced banking services beyond
transactions.
Sweden had the lowest employment level of the countries examined in the 1995
study. The relatively slow employment growth between 19�2 and 1992 (2.4
percent per year) was chiefly explained by the fact that the output growth in
volume was only modest in innovative products such as money market accounts.
The large universal banks, which already had a stable modus operandi, dominated
the market. They had limited incentive to enhance the value proposition to the
majority of their customers. Development in the United States in the same period
was more aggressive. New institutions with new products and business systems
forced banks to reduce costs and cut staff in the traditional departments.
However, the new products offered quickly became widely accepted and caused
increased demand. Since the products often had high labor contribution as well,
employment in both mortgages and securities grew much faster in the United
States than in Sweden.
—
—

149
Productivity and employment development since the early 1990s
Since the early nineties, Swedish productivity has shown strong growth while
employment levels have decreased moderately. Compared to the US, Swedish
productivity is characterized by low output levels and low employment levels
(Exhibit 7). As mentioned above, this structural difference could be explained by
the fact that Sweden as a country has made the “system choice” to have a larger
share of the life cycle spend handled by the government.
Sweden’s annual productivity increase of 4.6 percent between 1995 and 2002
was higher than for the other countries. Since 1995, Swedish productivity has
risen to US levels, mainly driven by strong performance in payment productivity
and investment products (Exhibit �). This places Sweden as the benchmark for
productivity in retail banking in 2002, significantly above the other European
players (Exhibit 9).
However, over the period 1992-200�, the US was better than Sweden at creating
jobs, resulting in 2.0 new jobs per thousand working age population in the US
compared to a loss of 0.4 jobs per thousand working age population in Sweden.
Exhibit 7Exhibit 7
Productivity, output and labor input
Source: McKinsey; Groningen Productivity Database, Oct 2005
Index US 2002=100, PPP adjusted
30
40
50
60
70
80
90
100
110
120
1995 1996 1997 1998 1999 2000 2001 2002
Productivity development CAGR
SEUS
FRUK
DE
4.6%3.4%
2.2%2.8%
3.2%
30405060708090
100110120
1995 1996 1997 1998 1999 2000 2001 2002
Output per capita index CAGR
US
UKSEFRDE
6.0%
4.2%4.0%2.0%2.2%
30405060708090
100110120
1995 1996 1997 1998 1999 2000 2001 2002
Labor input per capita index CAGR
US
DEUKFRSE
2.5%
-0.9%1.3%-0.2%-0.6%
SE US FR UK DE

150
Exhibit 8Exhibit 8
5982708278 6510791100120
Sweden’s high productivity is driven by its relatively strong performance in payments and investment products
Note: Overall productivity numbers rounded to integers * Per capita output productivity (Fisher indexed) based on average EU and US unit labor inputs
** Defined as the ratio between the country’s domestic unit labor input and the US 2002 levels for the specific product categorySource: McKinsey
Index US 2002 = 100
6.3% 2.9% 3.8% 3.9% 1.4%
Payment productivity** 1995–2002
CAGR
SE US UK FR DE
37%
19952002
%Share of retail banking FTEs in Sweden, 2002
443587116
67 56367910073
1.2% -2.1% -1.4% 0.4% 3.5%
Loan productivity**
CAGR
SE US UK FR DE
27%
981161038251155162179
10056
1.3% 2.9% 8.2% 4.9% 6.8%
Deposit productivity**
CAGR
SE US UK FR DE
20%
2473
163097
414522100138
5.2% 18.8% 4.7% -6.7% 8.0%
Investment productivity**
CAGR
SE US UK FR DE
16%
5372697975 66
8484100102
4.6% 3.4% 2.8% 2.2% 3.2%
Overall productivity development*
CAGR
SE US UK FR DE
Exhibit 9Exhibit 9
Today, Swedish retail banking is more productive than its peer countries, though employment lags the US
* Including financial intermediation except insurance and pension funding.Source: Groningen Productivity Database, Oct 2005; McKinsey analysis
Labor productivity in retail banking, 2002 Employment performance, 1992–2003*
Index Sweden 2002 = 100 Net job creation per thousand of working age population
US
Sweden
82
98
100
France
Germany
UK
65
82
Sweden
US
-0.4
-0.4
2.0
France
Germany
UK
-0.1
-0.2

151
factors explaining the development
The banking sector has gone through a significant structural change over the
past fifteen years. First, product market deregulation has led to intensified
competition. Internationalization and cross-border mergers have increased, and
new players have the opportunity to challenge the large incumbents. Second,
technology development has contributed to improved operations, such as back-
office automation and communication among banks. Furthermore, allowing
the entry of niche players has introduced innovative concepts to the market,
such as telephony and Internet banking, and their presence, together with a
rapidly increasing Internet penetration in the society, has forced the large
banks to further enhance these high-productivity concepts. Third, increasing
the competitive intensity and making banking products more accessible to the
Swedish customer has contributed to a change in customer behavior. Because of
these factors, Swedish banks have emphasized their restructuring of operations,
driven by intensified competition, and the sales channel shift accelerated by the
technological development:
Diminished product market barriers. Remaining regulations from the eighties
were abolished in the early nineties. The EEA agreement (European Economic
Area) contributed to harmonization of laws and practices for bank activities in
the European bank sector, such as rules for equity levels and standards for
monitoring bank financials. Hence, as intended, the effect of the deregulation
was increased competition, both through an increased foreign presence as
well as the rise of new challengers and niche players (Exhibit 10):
Foreign entry. Since 19�5, foreign players were allowed to have subsidiaries
in Sweden, but were not allowed to put up their own banks on Swedish soil
until 1991-92 (1991:9�1, § 1992:160). This has since led to an influx
of foreign players. Danske Bank acquired Östgöta Enskilda Bank in 1997,
and has since then been very successful, today enjoying the position as
the fifth largest bank in Sweden. EEA also meant that Swedish banks
started to seek growth opportunities in the Nordic region (Exhibit 11).
Entry of niche players. Retail banking opportunities opened to new players.
Niche players evolved, mainly offering their financial services through the
internet and telephony, and cooperative banks were allowed to conduct
business (§1995:1570). Players such as IKANO Banken, ICA Banken,
—
—

152
Exhibit 10Exhibit 10
New entrants in the Swedish lending market have challenged the incumbents
Note: Swedish lending volumes for Danske Bank only available from 2001. The market shares for Danske Bank 1998–2000 have been estimated based the Östgöta Enskilda Bank’s market share before the acquisition in 1997
* Excluding mortgages institutes** SEB, FSB, Handelsbanken and Nordea
Source: EFIC; Swedish Bank Association; McKinsey analysis
New banks
3.4
11.6
23.2
Largest 4 banks
Other banks
69717273767982
1817161715131313121210985
650
Largest 4 banks**
New banks*
Other banks
2004
935
2003
905
2002
925
2001
915100% = SEK 806718
20001998 1999
billion
Lending volumes market share developmentPercent
Market average: 6.2%
Lending volume growth, 1998–2004CAGR, percent
Exhibit 11Exhibit 11
Deregulations led to increased internationalization
* According to the Swedish Consumer Agency 2000 (20 out of 124 bank activities were foreign affiliates)Source: ECA Financial Services Subgroup; Swedish Bank Association; Swedish Consumer Agency; McKinsey analysis
NOT EXHAUSTIVE
20
1
1991–20011980–1990
Foreign entries in Swedish market
1980–1990 1991–2001
5
25
Swedish entries in foreign markets
…as the internationalization took off in the mid 1990s
Many Nordic banks did at some point enter the Swedish market…
Finland• Okobanken• Merita
Norway• DnB• Kreditkassen
Denmark• Danske bank• Unibank
Iceland• Kaupthing Bank
• Internationalization on both sides of the Baltic Sea has increased remarkably over the past 10–15 years
• Danske Bank is the most successful entrant on the Swedish market
• Swedish incumbents aimed for growth through expansion in the Baltic region

15�
Skandiabanken and Länsförsäkringar Bank have a fundamentally different
branch structure compared to the incumbents (Exhibit 12), allowing them
to compete with the large banks through aggressive pricing (Exhibit 1�).
Exhibit 12Exhibit 12
* Bank’s share of total deposit- and lending volumesSource: Swedish Bank Association
Niche banks operate with a fundamentally different branch structure compared to the incumbents
492
1
493
19.3%
1.9%
21.2%
FSB
Skandiabanken
# of branches, 2004 Market share*, 2004
IKANO Banken, ICA-banken, and Skandiabanken operated with only one branch respectively in 2004
0.04
FSB
1.93
Skandiabanken
Market share per branch, 2004Percent
Exhibit 13Exhibit 13
Skandiabanken’s aggressive pricing in both savings and lending has proven successful
Skandiabanken uses competitive rates in both current accounts and mortgages The strategy has led to a strong market position
Skandiabanken and others have contributed to increased pressure on industry margins
Share of deposit volumes, SwedenInterest rate Total Revenue / Total volume*
* Revenue margin on term depositsSource: McKinsey; Swedish Bank Association
0
0
0
Nordea
4.15SEB
3.60
1.23
2.00
FSB
4.15SHB
Skandiabanken
4.15
4.15
Percent
1.61.51.5
2.1
20032000 2002
2.4
2.0
1999
2.4
2004200119980.0
0.5
1.0
1.5
2.0
2.5
3.0
1998 1999 2000 2001 2002 2003
CAGR = 8.2%
Current account interest rate (2004)Quote on variable mortgage rate (2004)

154
Technology development. As niche players brought innovative concepts to
the market and forced the large banks to adapt to these standards (which
they did in a very effective way), customer behavior changed. However, the
development of bank technology has also contributed to more efficient
back-office operations and has offered the ability to serve customers
through more efficient sales channels. Previous MGI reports2 raised
the issue that although IT is a major driver of productivity, a direct link
between IT spending and productivity cannot be drawn. The report pointed
out three factors that in particular influenced IT-related labor productivity.
First, the key to making the best use of IT lies in achieving sufficient scale,
mainly through consolidation, but also by achieving higher overall output.
Second, a higher degree of process and software standardization improves
efficiency. Finally, some IT initiatives were not necessarily targeted at
productivity improvements, such as investments that were required in order
to conform to Y2K standards or upgrading systems that are not combined
with process redesign. In Sweden, IT investments have been made in three
main areas; CRM-tools with the attempt to create a single customer interface
and improve customer retention through up- and cross-selling; integration of
systems as the number of bank mergers grew; and multi-channel approaches,
such as internet banking. The enhancement of back-office IT solutions has
driven efficiency considerably. The down side is that the IT costs as share
of the total cost base of the banks have doubled between 1995 and 2005.
Although IT could reduce labor for general administrative functions, IT staffing
levels have increased due to the growing complexity of IT systems:
Back-office automation. The significant improvement of existing
technologies and the arrival of new technologies enabled the enhanced
automation of back-office functions. European averages show that this
automation reduced labor input per unit of output by 15 to 25 percent
from 1994 to 2000 (Exhibit 14). Payment transactions and investment
products achieved the most significant impact. Sweden was already
relatively productive due to its automated Giro-systems. However, the
implementation of scanning and image-processing systems for the
automated input of check and paper-based transfer data further reduced
2 Productivity growth 1995-2000, Understanding the contribution of information technology relative to other factors, McKinsey Global Institute 2001.
—

155
labor for manual data input. Banks have advanced towards straight-through
processing, and manual interfaces have been replaced by direct electronic
connections, especially the branch to back-office interface.
Improved credit decision process. Today, credit decision processes are
shorter than they were in the nineties. Enhancement of credit scoring
systems, automated underwriting and standardization have caused
reduced labor input and increased efficiency in handling loans. The
Internet has facilitated the process. Today, applications for mortgages
can easily be processed online (Exhibit 15).
Platform usage. The introduction and increased use of platforms has
made banks more efficient in the way they operate. SWIFT, a system that
enables banks to communicate electronically, has become increasingly
common (Exhibit 16). For example, Nordea is one of the top 20 users of
the system in the world. Productivity growth has been further supported
by the increased use of electronic trading systems (SAXESS in Sweden,
XETRA in Germany, and RELIT/RGV in France).
Exhibit 14Exhibit 14
Impact of IT on back-office and administrative functions – European example
ESTIMATE
* Front-office represents 55% of total labor, back-office 35% and administration 10%** Average 1994 labor share of US, France and Germany
Source: MGI 2002
Back-office (incl. middle-office)• Payments• Loans• Deposits• Investments products
Administration (incl. IT)
Laborshare**
Laborreduction
IT-driven labor reduction in back-office (excluding output increase)
Payments
Deposits
Loans
Investments
Examples of IT-driven efficiency improvements in back-office
• Automation of data input with scanning and image processing of payment forms
• Change towards EFTPOS, more efficient than checks and handling cash
• Only minor changes, e.g., introduction of “Sparcard”
• Many tasks still have to be performed manually
• Enhancement of credit scoring systems, automated underwriting
• IT-forced standardization lowering labor input
• Improved integration of branches and back-office functions
• Introduction of electronic trading systems (e.g., ZETRA, RELIT/RGV)
35%48%24%17%11%
10%
15–25%25–35%8–12%±0%10–30%
±0 %
Function*

156
Exhibit 15Exhibit 15
Example of mortgage processing in a Swedish bank 2005
Source: Interviews; McKinsey analysis
Credit forms filled in
First customer contact: • In branch• Remote
channel
Credit judgments
Credit committee decision
Preliminary promissory note sent to customer
Second customer contact:Possible gathering of further Information
Tailoring of loan and negotiation
Promissory notewritten
Customer signs promissory note
Promissory note returned
Customer obtains legal admission to real estate object
Scanning of file and storage in vault
Final control
• “Do-it-yourself” facilitated by remote channels, e.g. internet and telephony
• Back office efficiency — customer information stored on central database
Duration 1 hr
Key development since 1992
• Empowerment allows quicker and less hierarchical process
Duration 1 day
If:• Large amounts• Issues with
credit history
Total duration: 2–3 daysDuration in 1992: 1 week
• More efficient handling and filing process of promissory note
Duration 1 day
Exhibit 16Exhibit 16
SWIFT has made it easier and more cost efficient for banks to handle transactions
0.0
0.2
0.4
0.6
0.8
1.0
1.2
1.4
1.6
1.8
2.0
1991 1993 1995 1997 1999 2001
Global SWIFT usageMessages, billions
• In 2005, 90% of Nordea’scross-border payment transactions were derived electronically from customer, either on the internet or on proprietary systems, 100% were sent out via SWIFT
• Nordea among top 20 users on SWIFT
61
31
8
Payments
Securities Settlement
Treasury,trade finance and other
100%= 1.8 billion messages
2002
Source: SWIFT; Press clippings
Message splitPercent
SWIFT is an integral and crucial component for future developments of our products and services
– Vinsand, SVPNordea, 2005
Think of SWIFT as a members-only global Internet, to which only banks meeting strict security standards can join
– Bank Systems and Technology, 2003

157
Changed payment mix. Bank technology has also contributed to a changed
payment mix, which has resulted in productivity growth. In general, Sweden
has a favorable payment mix, characterized by a high portion of electronic
payments (Exhibit 17). The overall payment output in Swedish banks grew
in line with the US, while becoming increasingly more efficient than US
banks on payments (Exhibit 1�):
Increased electronic payments. Electronic payments (e.g., on-line
payments, and debit and credit cards) have increased significantly in
all countries studied (Exhibit 19). In Sweden, this has been facilitated
by the increasing number of EFTPOS, and the fact that the large banks
were quick to enhance on-line banking in order to stay competitive.
Fewer checks and paper-based Giros. Sweden and Germany drastically
reduced their output of checks (Exhibit 20). Furthermore, Sweden
reduced its paper-based Giro payments by � percent annually between
1995-2004. This contributed positively to productivity, as both check
processing and paper-based Giro payments are labor intensive. Although
checks are still common in the US, a previous MGI study showed that
US banks managed to reduce labor and storage costs by as much as
40 percent and check retrieval time by as much as 75 percent in the
late nineties by replacing microfilm with check-imaging technology.
—
Exhibit 17Exhibit 17
Differences in payment mix
100
100
60
30
12
Direct debit
Card payment
Paperless transfer
Paper-basedtransfer
Check
Labor input per transaction type***Index Check processing=100
* 2002** 80% of the transfers in Sweden were paperless, only 20% were paper-based Giro
*** Estimate from 2002 based on US, France and Germany labor inputsSource: National central banks; ECB; MGI 2002; McKinsey analysis
1019
916 20
47
1 27 160
4
3418
15
34
1430
36
5
3216 17
8
26**
46
Withdrawals
US* Germany France UK
100 100 100 100
Sweden
100
Payment transaction mix 2003Percent
Checks
Transfers
Direct debits
Cards
Payments represent 40–50% of total labor in retail banking
Exhibit 0
Differences in payment mix
100
100
60
30
12Direct debit
Card payment
Paperless transfer
Paper-basedtransfer
Check
Labor input per transaction type***Index Check processing=100
* 2002** 80% of the transfers in Sweden were paperless, only 20% were paper-based Giro
*** Estimate from 2002 based on US, France and Germany labor inputsSource: National central banks; ECB; MGI 2002; McKinsey analysis
1019
916 20
47
1 27 160
4
3418
15
34
1430
36
5
3216 17
8
26**
46
Withdrawals
US* Germany France UK
100 100 100 100
Sweden
100
Payment transaction mix 2003Percent
Checks
Transfers
Direct debits
Cards
Payments represent 40–50% of total labor in retail banking

15�
Exhibit 18Exhibit 18
Sweden’s high efficiency in payments is driven by an increase in electronic transactions
Source: McKinsey
CAGR19952002
• Cards and debits strong growth in both US and Sweden
• Sweden has abandoned checks completely: -42% CAGR in 1995–2002, however growing in the US
• Rapid consumer preference shift toward internet banking
• Swedish banks have many branches
Payment productivityIndex 100= US 2002
82 78100
120
US SE
2.9% 6.3%
Payments outputNumber of payments, millions
1,098 1,467
US SE
5.7% 4.2%
73,677108,680
Payments inputFTE equivalents, thousands
14.1 12.3
US SE
2.8% -1.9%
903
1,093
Sweden’s output growth not far from the US…
…while dependency on manuallabor has decreased
Exhibit 19Exhibit 19
* Credit- and debit cardsSource: National central banks; ECB
Electronic payments have increased significantly in most countries
Growth in number of payment transactions, 1995–2002CAGR, percent
9
13
35
UK
France
-1
8
Sweden
Germany
US
Direct debits Cards*
14
26
29
US
UK
12
12
Germany
France
Sweden

159
Changed customer behavior. As increased competitive intensity in the
industry contributed to more market choice, and as banking products became
more accessible for the average Swedish customer through on-line banking,
Swedish customers became more demanding and less loyal than they were
in the early nineties:
Customers shop around more. The Internet has helped increase the
transparency in the market, and while the main reasons to choose a
bank used to be level of trust and family history, there has been a clear
preference shift towards “harder” factors. Today, the main reasons for a
customer to switch banks are interest rates on loans, level of service,
and interest rates on deposits. In a recent survey, almost 40 percent of
Swedish customers stated that they have two or more banks as providers
of services, which, for example, is significantly more than in Denmark and
Finland, but less than in Norway (Exhibit 21).
—
Exhibit 20Exhibit 20
Sweden and Germany have rapidly abandoned checks19952002
Source: ECB; MGI 1999; McKinsey analysis
84
56
105
69
39
2
176166
US
~0
Sweden Germany UK France
Is Europe checking out for good?Number of check payments per capita
US productivity would have increased by 1.8 percentage points annually in 1995-1999 if one third of the checks would have been replaced by electronic payment transactions
CAGR: 1% -43% -21% -4% -3%
– MGI, 1999

160
Internet banking replacing branch visits. Sweden has been relatively good at
adapting new technology and has one of the highest Internet penetrations in
the world. Internet banking has grown rapidly in Sweden and today more than
50 percent of the bank customers have an internet banking account. This
has led to fewer visits to the branches, which has caused banks to close their
branches and increase their productivity (Exhibit 22). There are also examples
of several niche banks operating completely without branch networks.
As a result of these dynamics, Swedish banks started to restructure their
operations. One of the most definitive structural changes has been the closing of
branches. While many niche banks operate entirely without a branch network, the
traditional banks reduced their number of branches by a third between 1995 and
2004. Many of the European banks have done the same. While customer habits
between countries vary, there seems to be a correlation between the degree of
fragmentation and how often an average customer visits a branch (Exhibit 2�).
In fragmented markets it becomes more important to have a high branch density
in order to capture market shares, which could partially explain why southern
European banks are building branches while northern European banks are doing
—
Exhibit 21Exhibit 21
Compared to the Nordic countries, Swedish customers are less loyal and shop around for the best offering
Source: McKinsey Scandinavian Retail Banking Survey, 2003
51
35
14
81 7862
29
1918
1 3 9More than two banks
Two banks
One bank
Denmark Finland Sweden Norway
Moderate active(3–5 quotes)
Super active(5+ quotes) 2
24
29
23No shopping
Low active(1–2 quotes)
Bank relations per customer in Nordic countries, 2002Swedish customer shopping activitiesShare of respondents
Percent

161
the opposite (Exhibit 24). Today, Sweden has among the lowest branch density
per million inhabitants in Europe (Exhibit 25). A relatively consolidated market
and the increased use of non-branch channels indicate that there is generally
little need for having many branches in Sweden.
Exhibit 23Exhibit 23
Source: McKinsey
Inhabitants in highly fragmented markets visit branches more often
R2 = 71%
0.0
0.5
1.0
1.5
2.0
2.5
0 200 400 600 800 1,000 1,200
Branch densityBranches per million inhabitants
BelgiumPortugalItaly
Spain
GermanyFranceUK
SwedenNL
Spain
Belgium
Portugal
Italy
Germany
FranceUK
NL
Sweden
R2 = 66%
0.0
1.0
2.0
3.0
4.0
5.0
0 200 400 600 800 1,000 1,200
FragmentationBanks per million inhabitants
Branch usageAverage customer branch visits per month
Branch densityBranches per million inhabitants
2003
Exhibit 22Exhibit 22
Internet banking has contributed to a reduced need for branches
Source: Swedish Bank Association; Retail Banking Research (RBR); Swedish Riksbank
Internet banking is becoming increasingly important… …reducing the need for branches
00.1
0.2
0.9
1.4
2.5
3.2
3.7
0.0
0.5
1.0
1.5
2.0
2.5
3.0
3.5
4.0
1995 1996 1997 1998 1999 2000 2001 20020
10
20
30
40
50
Total internet banking accountsMillions
Share of Swedish bank customers with internet banking accounts
PercentBank branch development Number of branches
0
1,000
2,000
3,000
4,000
1990 1994 1998 2002
CAGR 1992–2002: -3.9%

162
Exhibit 24Exhibit 24
Fierce rationalization and cost cutting has led to closure of branches in Northern Europe
Source: National banking association; Central Banks; McKinsey analysis
Players in highly fragmented markets have a larger need to keep or build branches in order to gain market shares
Netherlands
0.4
1.5
3.0
-8.9
-4.1
Spain
Sweden
Germany
0.3
Portugal
-2.1
-8.3
France
Italy
UK
Belgium
-1.8
Development of number of branches
1998–2003
CAGR, percent
0.4
4.5
3.6
-8.3
-2.1
0.4
-2.5
-5.4
-3.4
0.4
-0.5
2.7
-9.2
-5.5
0.2
-1.3
-10.1
-1.3
1998–2000 2000–2003
Rationale
• National expansion of regional banks
• Growth of small banks, BES, CGD• Some consolidation
• Expansion of Cajas• BBVA, SCH consolidate
• Expansion of small regional banks
• Consolidation• Cost cutting
• Mostly consolidation• Cost cutting
• Cost cutting
• Large-scale consolidation and rationalization
• Large-scale rationalization
Exhibit 25Exhibit 25
Because of branch closure Swedish retail banks have fewer but larger branches than most of their European peers
* Physical outlets of banks, such as traditional bank branches, supermarket branches, post bank branches. In Finland service points are included (located in shops) and insurance companies with limited banking products. Post offices that offer financial services are not included, e.g. Svensk Kassaservice
Source: National banking associations; Central Banks; McKinsey analysis
Netherlands 175
Sweden 217
UK 231
Norway 295
Finland
546
887
960
Denmark
331
Portugal
432
528
Belgium
444
France
Italy
Spain
Germany
374
522
Austria
Sweden has a low branch density…
Branches per million inhabitants*, 2003
3,550
2,921
4,018
3,164
6,158
5,186
4,543
3,138
4,711
4,388
5,608
5,360
4,196
…but many employees per branchBranch employees per million inhabitants, 2003
Average branch employees per branch
5
6
11
8
8
13
11
14
10
N/a
17
14
20

16�
the current barriers in the sector
Sweden is the new benchmark country in retail banking. Most product market
barriers identified in the 1995 study have been removed. However, a few barriers
involving the nature of the industry, market conditions and corporate level
performance still exist. Removing those would further increase productivity:
Low demand. A higher GDP per capita and limited public provisions for
pensions and social security may account for the higher demand in the US
for banking products. Together, this drives US private households into greater
direct holdings of financial assets – about one third of the assets are held in
private pension plans. The relatively low disposable income of the average
Swede and the fact that a large share of the personal life cycle spend is
handled by the government (e.g., pensions, university tuitions) lead to a low
demand for retail banking services. In 2004, US banks benefited from a
much higher demand output per capita: personal financial assets and loans
(PFA&L) were about 2-� times higher than in European countries (Exhibit 26).
Furthermore, the average retail banking revenues per capita are significantly
lower in Sweden than in other European countries (Exhibit 27). This makes
the Swedish retail banking market even smaller than the limited population
would suggest, which consequently works as a barrier against new entrants.
Exhibit 26Exhibit 26
Sweden has a low penetration of banking assets and liabilities, and a large share of assets captured in life insurance and pensions
* 2003** Includes Sweden, Belgium, France, Germany, Italy, Netherlands, Portugal, Spain, UK and Switzerland
*** Cash, Life Insurance, PensionsSource: McKinsey
Retail banking Personal Financial Assets and Liabilities (PFA&L)EUR thousands per capita, 2004
Split of PFA&LPercent, 2004
52
49
55
US*
Netherlands
Norway
UK
Switzerland
51
45
54
Portugal 20
Spain 30
France 31
Sweden 34
Italy 41
Europe**
59
98
135
Denmark
Belgium
Germany
54
364544
3227
30
412422
29
23
1623
31343950
Germany
61
Norway
64
Europe**
65100% = EUR 4656110
Retailbanking PFA
Retailbanking PFL
UK
Other PFA***
FranceSweden
thousand

164
Corporate level improvement actions. There is still significant improvement
potential in individual companies in the Swedish retail banking sector:
Labor overcapacity. The reduction of branches has not led to a corresponding
reduction of employees; each branch has actually become larger and the
net effect is that almost the same number of people work in branches
today as a decade ago (Exhibit 2�). There are indications that some of
this is driven purely by a corporate level reluctance to realize the improved
efficiency through staff reductions. This limits productivity growth and,
over time makes the Swedish banks less competitive, allowing European
banks to catch up.
Customer inertia. Although customers have demonstrated their readiness
to switch providers, banks need to attract new customers through more
innovation. Customer mobility is further slowed by the effective bundling of
products and services offered by the banks. Offering rebated packages of
products and services has a positive effect on customer loyalty, while also
making it difficult for customers to compare price offerings across banks.
Bundling has traditionally been more common in large banks, which has
—
—
Exhibit 27Exhibit 27
Sweden has weaker demand than Europe, leading to a relatively smaller banking sector
* Financial intermediation, not including insurance and pension funding** Consists of BE, FR, DE, IT, PT, NL, ES, SWE, CH, UK
*** Only including ES, SWE, FR, DE, DK, NL, UK, IRSource: Groningen Productivity Database, Oct 2005; McKinsey analysis
CAGR1998–2002
558
758
Sweden Europe 10**
2.2 2.2
+36%
Banking sector revenues per capitaEUR/capita, 2002
1.04
1.43
Sweden Europe 8***
+38%
Banking sector employees*Percent of working age population, 2002

165
led to a lock-in effect of the customer, making it harder for more efficient
niche banks with only a few offerings to gain new customers. Furthermore,
there are indications that consumer mobility and the competitive intensity
of the industry would benefit from more transparent pricing in the lending
and deposit market.
High taxation on capital gain. According to the Swedish Competition Authority,
high taxation on individual capital income has an inhibiting effect on
competition. The fact that consumers become reluctant to sell their assets
in order to switch brokers or fund managers creates a lock-in effect. Sweden
has a flat tax of �0 percent on individual capital income, independent of the
length of possession. This is four times higher than the European average.
Unfavorable access to payment infrastructure. Sharing infrastructure is usually
a good way to leverage scale advantages in a sector. Access to infrastructure
such as payments services is important in order for new entrants to establish
themselves. In order to ensure competitive intensity in the sector, the Swedish
Competition Authority (KKV) has taken a number of actions concerning
infrastructure cooperation in the financial market, e.g., in the CEKAB case in
Exhibit 28Exhibit 28
R2 = 0.8362
-8
-6
-4
-2
0
2
4
6
-10 -5 0 5 10
The significant reduction in branches has been accompanied by an increase in employees per branch, leaving the branch capacity almost intact
Source: National banking associations; National central banks; McKinsey analysis
Branches per million inhabitants
Employees per branch
PT
IT
ES
FR
AUSDK
DE
UK
CHSE
FI
NL
BE
CAGR 1993–2004Percent
Branch capacity developmentCAGR 1993–2003, percent
FI -4.8
NL -4.7
DK -2.3
PT -1.3
SE
-0.4
-0.3
0.2
CH
-1.1
FR
BE
-0.8
-0.5
UK
-0.7
IT
ES
AUS
DE
-1.0
-0.6
• Sweden has decreased its branch density but maintained branch capacity
• branch positions replaced with new types of jobs– Call centers– IT support– Processing
• Only Finland and Netherlands have realigned capacity to new network structure

166
1997. The KKV found that the discount scheme offered to high volume users
of EFTPOS and ATM services was discriminatory because the large banks
almost entirely own CEKAB. However, the Swedish Market Court overturned
KKV’s decision as they did not agree that the fee structures put small players
at a disadvantage. The CEKAB case was an example of remaining market
barriers that could inhibit competitive intensity. The Swedish Competition
Authority was commissioned by the government to reinvestigate the case in
2005-2006.
KEy CHAllEnGES for tHE futurE
A key trend that will affect the industry is that banking is increasingly becoming
a pan-European game. Cross-border mergers and consolidations are likely to
continue as the European integration process proceeds:
Limited domestic growth opportunities. Overall limited future growth is
expected in mature European banking markets. This growth outlook, along
with largely consolidated domestic markets, is creating increased drive for
cross-border mergers.
Pan-European harmonization. Adhering to new regulatory frameworks will
release capital, promote harmonization and increase the potential advantages
of going cross-border:
Basel II benefits large players. A consequence of Basel II, the regulatory
framework that seeks to improve the existing rules by aligning regulatory
capital requirements more closely to the underlying risks that banks face,
could be that banks will have larger incentives to charge for the credit
risks. Small- and medium-sized companies that earlier had their lending
applications overruled now have the ability to lend money, but at a higher
premium than less exposed businesses. According to a recent McKinsey
survey, including �� out of the 44 largest banks in Europe and 71 small and
medium-sized banks, most industry players see Basel II as an opportunity
to address hitherto untapped sources of value in the credit business. Large
banks especially expect their competitive position to improve. This is likely
justified since the size of the investment necessary to comply with the
Basel II represents a significant entry hurdle for smaller banks, particularly
those not organized as part of a group with joint infrastructure.
—

167
Increased transparency. There will also be increased consistency of
accounting standards through International Accounting Standards (IAS)
2005, leading to an increased comparability and transparency of financial
results.
European Monetary Union (EMU). The potential future Swedish entry into the
EMU could have long-term effects, such as increased trade and intensified
competition for Swedish banks. This could accelerate structural change even
further and lead to lower margins. Moreover, price transparency is likely to
increase while transaction costs would decrease. Both these effects would
be beneficial for Swedish bank customers.
SuMMAry AnD IMPlICAtIonS
Swedish banks have had the advantage of automating early on, while operating in
a market with high acceptance for remote channels (phone banks, internet, etc.).
This led to very strong productivity. Having the most efficient operations in Europe,
Swedish banks appear to have had an opportunity to expand internationally when
the markets opened. However, as focus was initially on cost cutting and high
returns after the bank crisis in the early 1990s, expansion only appeared on the
agenda after the environment had become more competitive. Hence, a potential
opportunity was lost.
As mentioned above, the major differences between the US and Sweden are
lower demand and different payment mix. The payment mix operates in favor
of the Swedish bank system, as Swedish transactions are less paper based
than the American. However, the inherently lower demand for retail banking
products impairs the performance of the Swedish bank productivity. Furthermore,
previous MGI studies showed that US banks had an advantage over European
banks because they leverage platform standards better, thereby driving labor
productivity. As an example, US banks were better at using packaged software
instead of in-house solutions (Exhibit 29). This is analogous to what this study
has illustrated, i.e., that Swedish banks would benefit from maximizing scale,
thereby increasing standardization to reduce complexity.
—

16�
These factors, together with a set of key challenges, identify implications for
individual companies as well as for policy makers. First, banks must acknowledge
the fact that customers shop around more due to the IT-development, and
become more innovative in capturing the value from this mobility. Second,
additional back-office improvements will be important to increase productivity.
Third, high taxes on capital gains on investment products create lock-in effects
of capital that otherwise could flow more freely and fuel productivity. Fourth,
there are indications that current fee structures of the payment system put small
players at a disadvantage, which, if true, inhibits competition. The implications
for company leaders and policy makers will be to:
Focus on driving product penetration and innovation. Retail banks should
consider creating more distinct and differentiated value propositions as
customers become increasingly price aware and more willing to shop around.
Emphasis should be on cross-selling to increase product penetration (Sweden
is still below European penetration levels for many products). Swedish banks
should consider three ways to add value to their business:
Customer segmentation focus. Customer segmentation focus will be
increasingly important in order to withstand competition and penetrate the
fastgrowing segments. The Small and Medium sized Enterprises (SME)
—
Exhibit 29Exhibit 29
European banks are lagging US in implementation of standard IT solutions
Source: IDC; MGI 2002
Europe US
• Front-end applications and headquarters systems available but software for core IT functions, e.g., account keeping, still missing
• Without a standard for the core business, a standard for any other application is difficult
• Many proprietary systems
• Front-end headquarters and back-end systems available
• Wide usage of standard software
European banks – IT spending on packaged software1999, percent
85
15
In-housesolution
Packaged software
Top 100 US banks – Example deposits/current account applications1997, percent
20
80
In-house solution
Packaged software

169
segment, together with sub-segments created by the shifting demographics
in the society, are high-growth segments. Danske Bank is an example of a
player that has managed to leverage an SME-based concept that has worked
across borders.
Product focus and bundling. Product focus and bundling will be increasingly
important as bank customers are becoming more willing to shop around.
The increased acceptance of consumer finance products, as well as the
increased need for individual long-term savings (as the pension system is
opening up) will make these two areas important to serve well.
Service focus. A service focus, i.e., focus on distribution of easy access
products and advisory, will continue to be key. Swedish banks should
continue to drive for an even more productive distribution channel mix.
Sales through non-branch channels (e.g., Internet) are likely to continue to
grow. However, customers still value service, counseling, and relationships
for more complex products (e.g., pensions). Branches are likely to become
centers for sales and relationships when transaction visits decrease,
changing the requirements of the personnel profile of a teller. Tellers
are increasingly becoming advisors with sales responsibility rather than
transaction clerks.
Drive for excellence in back-office operations. Back-office improvements have
had a significant effect on labor productivity, as discussed above. However,
the lack of scale and lower degree of standardization create disadvantages
when compared to the US. Swedish banks should continue to strive for back-
office excellence, including:
Optimize scale in back-office operations. Increasing scale would further
improve the efficiency of the current banking system. Swedish banks
should strive for scale in back-office operations and make sure to actually
realize the cost efficiencies gained from the low branch density and
reduce labor overcapacity. In addition to the reduced branch structure and
the domestic bank consolidation of the 1990s, consolidation with other
financial companies, and cross-border mergers are likely to be increasingly
important to optimize scale:
—
—
—

170
Consolidate with financial companies. Consolidation across businesses
in the financial services sector is nothing new. For instance, Swedish
banks are becoming increasingly integrated with insurance companies.
If banks decide to remain independent, they could still choose to pool
operations and centralize or outsource functions and tasks in order to
capture the productivity benefits of larger-scale operations. Examples
are payment and securities operations, or the credit businesses.
Consider cross-border merger opportunities. Cross-border mergers
are another way of building scale. However, although banks benefit
from larger scale, it is important not to offset the possible synergistic
effects by excess complexity. Diversity of international products, coping
with a range of processes, languages, and differences in legal and tax
requirements could contribute to such excess complexity.
Invest in sustainable platforms. Building sustainable IT platforms will
be important as the industry evolves. For instance, Basel II will increase
the requirement for efficient IT departments and most likely benefit large
players who can accommodate such investments. Further challenges for
IT departments are arising as the Pan-European activities of banks add
complexity to the system.
Consider off-shoring of services. In a 2005 study, MGI indicated that
although 70 percent of the world’s high-wage countries have all their
operations in local markets, off-shoring is becoming increasingly common
in the banking industry. On a global average, the functions most amenable
to global resourcing are call centers (with a maximum global resourcing
potential of 90 percent), IT services (54 percent), back-office functions
(50 percent) and general and administrative (40 percent). Swedish banks
should investigate opportunities to offshore back-office and IT functions in
order to further reduce costs and become more efficient.
Introduce right to change fund provider. Policy makers should allow Swedish
consumers to transfer their accumulated pensions to a different fund provider
without incurring capital gain taxes. This system would be similar to the way
real estate transactions are treated, where capital gain taxes are postponed
and charged only if there is a net capital gain after the last transaction (i.e.,
—
—

171
a redemption that does not result in the acquisition of another real estate
asset). This would lower the barrier for consumers to shift their accumulated
personal wealth to a more efficient provider.
Ensure competitive intensity. Policy makers should continue to ensure
competitive intensity. By commissioning the Swedish Competition Authority
to reinvestigate if the entry conditions of the payment systems favour the
large banks, the government has sent clear signals to the industry that
ensuring competition is a high priority. Another recent example was when the
bank monopoly of deposits disappeared in 2004, allowing credit institutions
to obtain deposits from their customers (§2004:297). By appointing an
independent association to gather and update price information on the lending
and deposit market, policy makers could help increase the transparency for
the benefit of the consumer. Furthermore, policy makers should continue to
promote the European process of harmonization of banking systems and
legislation, such as the coordination of accounting standards and Basel II, in
order to increase competitive intensity.
Finally, Swedish retail banking has the potential to remain the benchmark country
in the future. However, the sector is not likely to add jobs in the near future. On
the contrary, employment in the sector could decrease. This is due to the fact
that, so far, banks largely have not laid off branch employees in their restructuring
programs, but rather reallocated their staff from one function to another. Total
branch capacity has barely changed; instead, the remaining branches have
become larger. Furthermore, the continued shift towards non-branch channels,
and the increased back-office efficiency from technology development and off-
shoring, could potentially free up even more employees.
Although the game is likely to become increasingly pan-European, the Swedish
market is likely to be relatively protected by entry barriers (such as a high market
concentration, highly efficient operations, low branch density and a relatively
small domestic market). The intriguing question is whether a global or European
player will enter the market through an acquisition of one of the larger Swedish
banks. From a Swedish bank’s perspective, cross-border growth in more remote
areas, e.g., Ukraine, could be the most viable choice as the big European players
already have entered countries like Poland and the Baltics.

172
APPEnDIX A: MEtHoDoloGy
This appendix describes the data sources and methodology used to calculate
the labor productivity series for retail banking.
Productivity index
In the absence of a consistent retail banking productivity measurement across
countries, and without a readily available accurate price deflator, the MGI has
favored a productivity measure based on physical output.
The MGI productivity indices used for retail banking are computed by dividing
the aggregate output index by the corresponding labor input index as described
below. For all indices, US levels in 2002 serve as the reference values.
output index
Products and services measured. MGI’s retail banking output measure
includes several major financial services offered to households and individual
professionals. It is a quantity index based on the number of cashless payment
transactions, the real volume of personal and mortgage loans and the number of
investment product transactions (Exhibit �0):
Exhibit 30Exhibit 30
Products and services considered
Source: McKinsey
Retailbanking
Deposits
Paymenttransactions
Loans
Investmentproducts
• Payment transactions include cash withdrawals, electronic financial transactions at point of sale (EFTPOS), credit/debit card transactions, transfers, direct debits and checks.
• Wholesale transactions are included• Sources: National central banks, Bank of International Settlements,
professional associations, The Nilson Report, and McKinsey Research
• Outstanding amount of retail savings accounts and time deposits converted into 1995 EUR
• Nominal values are deflated by domestic CPIs and converted usingconsumption PPP exchange rates provided by the OECD
• Deposits output relates only to households and individual professionals• Source: National central banks
• Loans measured as the sum of outstanding amount of personal loans, including consumer loans and overdrafts, and mortgages (converted into 1995 EUR)
• Personal loans: Nominal values are deflated by domestic CPIs andconverted using consumption PPP exchange rates provided by the OECD
• Mortgages: Deflated by real estate prices and converted using housing PPP exchange rates
• Loan output relates only to households and individual professionals• Source: Domestic central banks
• Transactions on equities, bonds and mutual funds ordered by individual investors
• Sources: National stock market volumes, domestic central banks, fund associations
METHODOLOGY

17�
Payment transactions. Payment transactions include cash withdrawals,
electronic financial transactions at point of sale (EFTPOS), credit/debit card
transactions, transfers, and checks. Wholesale transactions are included.
The data comes from several sources, including domestic central banks, the
Bank for International Settlements, professional associations, the Nilson
report and McKinsey research.
Deposits. Retail deposits are measured as the outstanding amount of retail
savings accounts and time deposits converted into 1995 Euros. Nominal
values are deflated by domestic CPIs and converted using consumption
PPP exchange rates provided by the OECD. Deposit output relates only to
households and individual professionals. The figures are provided by domestic
central banks.
Personal loans and mortgages. Loans output is measured as the sum of
the outstanding amount of personal loans including consumer loans and
overdrafts, and the outstanding amount of retail mortgages – all measured in
1995 Euros. Nominal values for personal loans are deflated by domestic CPIs
and converted using consumption PPP exchange rates provided by the OECD.
Mortgages are deflated by real-estate prices and converted using housing
PPP exchange rates. Loan output relates only to households and individual
professionals. The figures are provided by domestic central banks.
Investment products. Investment products’ output is measured as the number
of transactions on equities, bonds, mutual fund shares, and life insurance.
This includes all transactions ordered by individual investors through the
banks and financial institutions studied in this report. Figures are based on
several sources, including domestic stock market volume, domestic central
bank surveys, and McKinsey research.
Aggregation. As the physical outputs are measured both in number of transactions
and monetary volumes, the four different output categories are turned into the
same unit before being aggregated. The MGI built a total output growth index
by aggregating the four physical output categories with the average labor input
required in 1995 and in 2002 for each unit of physical output. This output is made
comparable to the US 2002 level by using a Fisher aggregation (Exhibit �1).

174
For each product category, the average labor input per output unit is the average
of the labor required in 1995 and in 2002 per output unit. The labor inputs
are provided by the Federal Reserve Function Cost Analysis report and the BLS
for the US, by the Statistics Sweden and the Swedish Bank Association as
well as interviews for Sweden, and by proprietary banking surveys for France
and Germany. Based on this data, European and US unit labor input averages
were developed and used for all countries in order to calculate their respective
aggregated output.�
� This aggregation method is similar to an aggregation based on 1995 to 2002 average domestic unit prices per product category. Domestic average unit prices are replaced here by the average EU and US unit labor input. Weighting by labor input is preferred because of the practical issues raised when using unit prices as a measure of consumer’s utility. In fact, it can be argued that cross-subsidies between non-substitutable products are very frequent in banking, especially within European universal banks. Such cross-subsidies cause product-specific demand not to react fully to changes in product unit price. Therefore, individual product price changes would not properly reflect any change in utility. Evidence – at least in the short term – is clear for deposits and payment transactions where prices are linked with volatile interest rates (opportunity cost) and demand is very rigid. MGI assumes here that allocation of resources (labor) by banks is rational and thus symmetrical to consumer utility.
Exhibit 31Exhibit 31
The physical outputs are aggregated using unit labor input weights
* Transactions in millions** In 1995 EUR billions
*** Millions of transactions or 1995 EUR billions in loans/deposits. FTEs are European and US averages of unit labor input.Source: MGI 2002; Federal Reserve; BLS; McKinsey analysis
Output in each product category
1995–2002 average unit labor inputAverage FTEs per output unit***
Number of payments*
1995 2002
1,098 1,46713
Value of deposits output**
1995 2002
40 4280
Value of loans output**
1995 2002
61 70119
Number* of investment products*
1995 2002
21 32443
1995 2002
3951
Sweden aggregate outputIndex US 2002=100
1995 2002
33,680 44,822
Sweden
Aggregate output (Total product output)
2002
2,873,871
US
Fisherindexing
CAGR4.0%
Method is similar to an aggregation based
on unit prices
METHODOLOGY

175
labor index
Total labor in retail banking includes the number of hours worked in all financial
institutions associated with retail financial services as defined above. Depending
on the country, this typically includes commercial banks, savings institutions,
cooperative banks (credit unions), and securities brokerages (Exhibit �2).
The employment levels in the banks are adjusted by the share of retail banking.
Workers performing non-retail activities inside the selected institutions are
subtracted, and outsourced employment/external services are added. Finally,
the employment figure is adjusted for the average working time (Exhibit ��).
The sources of adjustments were the following:
Employees/hours worked. The numbers of employees in commercial and
cooperative banks, savings institutions, and securities brokerage were
obtained from the BLS, AFB and Bundesverband deutscher Banken. The
annual working hours for these employees were obtained from the BLS, INSEE
and the Statistisches Bundesamt. The working time for Swedish banking
employees were obtained from the Groningen 60 Industry Database.
Exhibit 32Exhibit 32
Retail banking employment definition
* Employees working with Post- and Bankgiro transactionsSource: BLS; Arbeitgeberverbund des privaten Bankengewerbes; Association Française des Banques; CECEI; Banque de France; Swedish
Bank Association; Statistics Sweden; Svensk Kassaservice
France
• Banking networks– Commercial
banks– Savings banks
• Cooperative and mutual banks– Other credit
institutions– Financial
companies– Specialized
financial institutions
• Post Office’s financial activities
• Credit institutions– Commercial
banks– Savings banks– Landesbank
banks– Cooperative
banks– Other
• Post Office’s financial activities
Germany
• Depository institutions– Commercial
banks– Savings banks– Credit unions
• Non-depository institutions– Personal credit
• Mortgage bankers and brokers
• Securities and commodity brokers
US
• Banking networks– Commercial
banks– Savings banks– Cooperative
banks
• Mortgage bankers and brokers
• Securities and fund brokers
• Post Office’s financial activities*
Sweden
METHODOLOGY
Adjusted to exclude business services

176
Adjustment for external labor inputs. Outsourced and intermediate labor
inputs employees in call centers, transaction processing, IT services, and
external services (e.g. cleaning, security). Adjustments were estimated by
experts and are based on a conservative approach.
Workers with non-retail activities. The number of workers who perform non-
retail activities (e.g., wholesale banking, commercial loans or commercial real
estate loans, bancassurance) was derived from the Federal Reserve Function
Cost Analysis report for the US, from the AFB 2000 employment survey for
France, and from the proprietary banking survey, and the external and internal
expert interviews for Germany. Sweden’s retail banking level from the former
MGI report (1995), derived from interviews with experts, was assumed to be
constant throughout the period, and the accuracy has been confirmed through
interviews.
Exhibit 33Exhibit 33
Example of how to calculate labor input in the MGI/EFIC model
Employees in banks
Share of retail banking
Employees in retail banking
Total employment
Average working time as share of a 1800-hour annual FTE
Total labor input 2002
1,936
2,207
99%
2,185
733
67%
491
545
84%
458
424
65%
276
315
87%
274
Thousand employees (FTE), 2002
58
64%
37
40
83%
33
Outsourcing and external services 14%11%14% 8%
2,017
96%
Source: MGI 2002; McKinsey
METHODOLOGY
Labor input used for productivity calculation
France Germany US Sweden

177
limitations
MGI’s productivity calculations are subject to limitations and any future work
should try to enhance the methodology of ouput measurement and increase the
accuracy of input figures. MGI output estimates are not adjusted for quality, and
output per product category can be subject to measurement challenges. Figures
on labor inputs suffer from a lack of official sources focused on retail banking
and have to be based on estimates:
Quality adjustments. Due to the lack of accepted methodologies on quality
adjustments and in order to limit the subjectivity of the productivity calculation,
quality of output is not taken into account. Therefore, we assume quality to be
constant over time and similar across countries.
Deposits and loans. Using PPP exchange rates instead of market exchange
rates remains subject to methodological debate, as long as the difference in
domestic prices may simply reflect the difference in utility benefit.
Investment products. Accurate figures of investment transactions are not
readily available, and MGI output is based on assumptions that annual retail
investors’ turnover follows the domestic stock market’s volume. Transactions
are also the only visible part of investor services provided by banks; in fact,
personal financial advisory is part of the value added that is paid for by
annual fees on assets under management but cannot be included in an
output measure. Due to a lack of availability of mutual fund data, the Swedish
mutual funds transactions had to be estimated by combining information
from sources such as the Swedish Investment Fund Association, Swedish
Statistics, and interviews with industry experts.
Retail banking employment. The lack of official figures focused specifically
on retail banking in all countries means that MGI productivity figures had to
be based on estimates from industry surveys and interviews. These were
held on a very conservative level for Sweden, which, if anything, potentially
penalized Sweden’s relative performance slightly.

17�

The Swedish Processed Food IndustryEXECutIvE SuMMAry
In the past fifteen years, the Swedish processed food industry has evolved from
a sheltered domestic industry to an industry open to international competition.
Consequently, the sector has gone through a major structural change, resulting in
significantly improved labor productivity, and reduced employment. The increased
competition and productivity gain in the processed food sector, together with
strong development in food retailing, have resulted in significant consumer
surplus. Consumer Price Index (CPI) for food increased by only 4 percent between
1990 and 2005, compared to the overall CPI that increased �5 percent in the
same period. Despite these improvements, however, Swedish food prices are
still about 9 percent above average EU price levels.
The Swedish processed food sector experienced an annual productivity growth of
�.1 percent from 1990 to 200�. This was the highest growth, for the sector, in
all the countries compared in this study, taking Sweden to third place in absolute
productivity, 1� percent below the US and 2� percent below the benchmark
country, Denmark. During the same period, the number of Swedish jobs in the
sector declined by three per thousand working age population.
In a 1995 report, The McKinsey Global Institute had shown that the Swedish
processed food sector had 42 percent lower productivity in 1990 than the
benchmark country at that time, the United States. Sweden was experiencing
negative job creation of 2.� jobs per thousand working age population at that
time, while the US was seeing net job creation of 0.� jobs per thousand working
age population. The lower productivity was due to the low competitive intensity
179

1�0
in the Swedish sector at that time, which was caused by trade barriers that
sheltered the sector from foreign competition and a less sophisticated retail
landscape compared to other countries, as well as corporate-level factors
(including less efficient plant operations in several sub-sectors and less efficient
logistics). Since then, many of these barriers have been removed, reshaping the
landscape of the entire sector. The main factors explaining the change are:
Reduction of product market barriers. Since the early 1990s, Sweden has
seen considerable market integration in processed food. Entry into the EU
led to a dramatic increase in foreign trade, due to lower trade barriers, which
had a positive effect on competitive intensity. Swedish food producers and
wholesalers were able to source more effectively and sell to larger markets
and were also subjected to increased international competition. Imports went
up by 60 percent, and exports by 100 percent between 1995-2002.
Increased foreign presence. Increased competitive intensity stimulated both
domestic and cross-border mergers, leading to industry consolidation. The
growth of more productive foreign affiliates, partly at the expense of domestic
players, contributed significantly to sector productivity growth. In addition, the
remaining domestic plants have been forced to operate more efficiently in
order to stay competitive.
More sophisticated retailers. The shift toward larger retail formats and
increasingly sophisticated procurement and distribution processes has
increased the negotiating power of retailers. Retailers can also more easily
source from other countries. Furthermore, food producers have been forced
to act on the increased competition for shelf space and the increased
penetration of private label.
Since the market has become significantly better functioning, the key
opportunities for the processed food sector to improve productivity and increase
competitiveness will now be at the company level. Food producers will have to
continue focusing on cost improvements, but also find the right way of dealing
with the growing private label trend:
First of all, cost efficiency will continue to come from sourcing more intelligently,
trimming overhead and sales costs, and optimizing manufacturing setup. For

1�1
example, additional pressure will be put on the meat sector, which today is
relatively inefficient. Increasing imports and vertical integration of retailers is
likely to drive greater consolidation in the meat sector. In other sub-sectors,
such as frozen foods, outsourcing labor-intensive tasks to low-wage countries
has already started and will most likely continue. This trend will probably lead
to fewer manufacturing jobs in the Swedish processed food sector.
Second, food processors must find ways to deal with the increased movement
in the market place toward strong, well-known consumer brands (i.e., A-
brands) on one hand, and private label on the other, will continue to squeeze
the middle segment. The following may be useful tactics:
Partner with retailers to produce private label. One way to respond to the
increased pressure could be to collaborate with retailers on innovative
approaches to private label. Although this could mean lower margins for
the producer, and sometimes direct competition with the producer’s own
brands, private label can be a huge opportunity for players who have strong
control over costs and a strong drive for productivity.
Invest in strong A-brands. Investing to maintain strong A-brands or to create
new ones would be another option. This would allow the food producer to
maintain control of the manufacturing value chain, but would likely also
be accompanied by increased price pressure from the “premium” private
label segment.
Invest in niche products. Yet another option could be to invest in niche
products e.g., health and functional foods (whole foods and fortified,
enriched, or enhanced foods). While still relatively small, health and
functional foods are two growing product segments where Sweden is
considered to be on the front line. High-quality design and packaging will
also play an important role in adding value to the products.
The implication for policymakers is to continue to ensure competitive intensity
in the industry. A long-term objective should be to work to lower the common
agriculture policy (CAP) subsidies and trade barriers to third party countries
outside the EU.
—
—
—

1�2
The processed food sector has a high probability of increasing productivity
by addressing these barriers. As increasing cost control will be inevitable in
order to survive, many of the large sub-sectors should gain further productivity
by becoming more efficient. Moreover, there is still room for improvement by
increasing output, mainly from the shift toward higher-value-added products,
and by increasing exports. Hence, sufficient product innovation in the sector
would create further value added. However, it is also possible that private label
may lower value added in the food processing sector, as it shifts margins from
manufacturing to retailing. Also, further price deflation would affect the food
producers’ margins negatively.
Most likely, the processed food sector will not be a net job creator in the
future. However, this does not mean that the sector will be unimportant.
While restructurings are often inevitable when a sheltered sector opens up for
competition, policy makers should not establish barriers that artificially protect
jobs. Instead, policy makers should continue to work for increased competition to
drive productivity, while simultaneously creating good conditions for the creation
of new jobs in growing sub-sectors.
PErforMAnCE In tHE ProCESSED fooD InDuStry
The general food value chain consists of three main segments. First, farmers
and agribusiness supply raw material to food producers. Second, food producers
process the raw material and deliver the products to food distributors, wholesalers
or directly to retailers. Third, retailers sell to the consumer. This study focuses
on the middle segment.
The food processing sector is a large manufacturing employer in all countries
studied.1 The sector is also one of the most heterogeneous of the industries
covered in this overall study. The regulatory environment, exposure to trade, and
the nature of the processing work varies significantly by product group (meat,
dairy, etc.). Generalizing across the entire industry can be helpful in drawing
conclusions, but the differences of the sub-sectors must be kept in mind.
1 Processed food is defined as all food products that do not go directly from farm to market, but instead are modified in a manufacturing plant. Productivity growth rates and employment performance have been measured for ISIC codes 15.16 (food, beverages and tobacco).

1��
The Swedish industry structure has historically been a highly integrated value
chain, where food producers in many sub-sectors have controlled supply through
farmers’ cooperatives. Food producers have traditionally also had a strong
position relative to retailers.
For a number of reasons, food processing has traditionally been a domestic
industry. However, due to diminishing market barriers during the past fifteen
years, it has become increasingly international.
The previous McKinsey Global Institute (MGI) study conducted in 1995 contrasted
(among others) Sweden and Denmark and showed how Sweden’s isolation from
international trade and its low domestic competition led to lower productivity.
This report shows how exposing the previously sheltered sector to international
trade has led to intensified competition and high productivity growth.
tHE ProCESSED fooD InDuStry In SwEDEn
Processed food dominates the food, beverage and tobacco industry (Exhibit 1).
The Swedish processed food sector accounted for 1.7 percent of total value
added in Sweden 200�, a slight decrease from the early 1990s, and employed
6�,000 persons (Exhibit 2). Employment in the Swedish processed food sector
is about 1.1 percent of the working age population, which is relatively small
compared to other countries (Exhibit �). Due to EU regulations, the majority of
trade – approximately 70 percent of the imports and 60 percent of the exports
– is with other EU countries.
The industry consists of numerous sub-sectors. The largest sub-sectors are
meats, dairy, and fruits and vegetables. The five largest players (Arla Foods,
Swedish Meats, Findus, Procordia Foods, and Unilever Bestfoods) account for
approximately �0 percent of food retail sales. Typically, gross operating margins
vary a lot depending on the product category, from around 10 to 60 percent
(Exhibit 4).

1�4
Exhibit 1Exhibit 1
Note: Other includes condiments, coffee and tea, animal food and juice concentrate* Including ice cream
** Including sugar production*** Including cereals and pasta
Source: Statistics Sweden (SCB); Groningen Productivity Database, Oct 2005; McKinsey analysis
The food, beverages and tobacco sector is dominated by food processing
5
15
80Food
Beverages
Tobacco
Sweden 2003Share of value added, percent
Total value added100%= SEK 38 billions
Largest food categories by value addedShare of sector value added, percent
2
8
80
4
4
6
13
8
Bakery
Dairy*
Confectionary**
Fruit and vegetables
Oils and fats
Starch and grain***
Fish and seafood
Other
17
Total food
18Meat
Exhibit 2Exhibit 2
Note: Data includes entire Food, beverages and tobacco sectorSource: Groningen Productivity Database Oct 2005; McKinsey analysis
In the last decade, the food industry has decreased its number of employees while largely maintaining its share of total value added
Share of total value addedPercent
Employees in SwedenThousands
1.8
20031990
1.7
63
1990 2003
79
CAGR: -1.8%

1�5
Exhibit 3Exhibit 3
The Swedish processed food sector is a relatively small share of total employment as compared to other countries
* Number of people engaged in Food, beverages and tobacco as share of the Swedish working age population. Canada and Japan 200Source: Groningen Productivity Database, Feb 2005; McKinsey analysis
Country Processed food employment, 2003*Percent of population 15–64
1.0
1.1
1.2
1.3
1.4
1.5
1.5
1.8
1.8
2.2
2.3
US
France
Netherlands
UK
Sweden
Canada
Spain
Denmark
Ireland
Japan
Germany
Exhibit 4Exhibit 4
The largest segments in food retailing are dairy, meats, and fruit & vegetables
1 Sales from grocery shops and gas stations. Excluding beverages and tobacco2 Including condiments, species, and coffee and tea3 Including ice cream 4 Including starch and grain products (e.g., cereals and pasta products)5 Cooperative ownership structure may distort picture
Source: Swedish Ministry of Agriculture (Yearbook 2005); Statistics Sweden (SCB); Euromonitor 2005; McKinsey analysis
Food retail sales, current prices, 20031
Percent
19
18
18
16
12
6
8
Meats
Confectionary3
135
Fish and seafoodOils and fatsOther2
Bakery4
Dairy
Fruit & vegetables
2003
3
Examples of companies Key segment Key brand
Sector gross margin, 2003Percent
39
51
57
30
Arla
Marabou, Estrella, O’boy, Philadelphia
Findus
10
35
GB glace, Milda, Knorr, Lipton
19
Scan
Cloetta, Fazer
Kit Kat, Zoega, Nescafe
Various
Various
Various
Confectionary
Fish (frozen)
Dairy
Meats
Nestlé
Unilever
Kraft Foods
Cloetta, Fazer
Findus
Arla Foods5
Swedish Meats5
100% = SEK billion

1�6
InDuStry PErforMAnCE
the starting point of the sector
Labor productivity in the Swedish processed food sector was considerably lower
than the United States, Germany, and Denmark in 1990, as reported in a 1995
MGI study. Sweden’s productivity was 5� percent of benchmark US productivity,
while Germany and Denmark’s stood at 70 percent and 7� percent of US levels,
respectively. Sweden’s relatively low productivity was a function of two major
factors:
Low competitive intensity. The competitive intensity was lower in the Swedish
food processing sector than in other countries for three reasons:
Lack of international exposure. The Swedish processed food sector had
historically been sheltered from international competition by tariff and non-
tariff barriers. It was significantly less exposed to international trade than
both Germany and Denmark. Trade had also been highly concentrated in
certain sub-sectors such as confectionery and seafood products. Virtually
no foreign trade was conducted in sub-sectors such as meat products,
dairy and bakery goods, which, at the time, accounted for about half of the
employees in the industry.
High subsidies. Generous subsidies had left the Swedish food suppliers
with too few incentives to become more efficient. The subsidies had even
lead to a slight overcapacity.
Cooperatives inhibiting competitive. Many industry sub-sectors (notably
dairy, grain, and cereal) were dominated by farmers’ and producers’
cooperatives that divided the market geographically among themselves,
further limiting competitive intensity.
Unsophisticated retailers. Food retailers did not exert the same pressure
on food producers as did retailers in other countries. In the United States
and Germany, supermarket chains aggressively switched between suppliers
in search of the highest quality for the lowest cost. Unlike Sweden, they
had two compelling reasons to do so: first, their independence from the
logistics services of the manufacturer allowed them to switch; and second,
they were virtually forced to do so due to the competitive intensity in the
retail sector.
—
—
—
—

1�7
Company inefficiency. The organization of functions and tasks within companies
in the sector was found to be less efficient than in the other countries. For
example, it was found that Swedish frozen food processing plants worked
under unusually high product proliferation. This increased the complexity of
production and affected productivity negatively. In addition, food distributor
performance imposed an extra logistical burden on Swedish plants. Despite
the high concentration within the food distribution sector (the three main
chains ICA, Konsum and Dagab had more than 70 percent of the market),
Swedish food distributors did not perform as well as their counterparts in
the United States and Germany. Instead, many of the food producers were
forced to handle their own deliveries to individual retail stores rather than to
a central distribution center, which inhibited overall productivity.
As a result of the low competition and the company inefficiencies, Swedish food
companies and retailers passed the higher prices on to the consumer, thus
allowing both cooperatives and non-cooperatives to earn satisfactory returns at
the expense of the Swedish consumer.
Productivity and employment development since the early 1990s
As Sweden adapted to the GATT rules, and subsequently joined the EU in the mid
1990s, product market barriers to international exposure have been removed,
exposing the Swedish sector to higher competitive intensity in several forms:
increased imports, additional foreign presence, and increased pressure from
retailers. At the same time, Swedish food producers invested in automation in
order to increase their plant efficiency.
Overall, the result was a high productivity growth rate of �.1 percent per year
between 1990 and 200� and a simultaneous decline in employment of � jobs
per thousand working age population. Only Denmark phased out more jobs,
with a reduction of 5.4 jobs per thousand working age population (Exhibit 5).
In absolute terms, the strong growth has enabled Sweden to close half of the
productivity gap versus the US (Exhibit 6).

1��
Exhibit 5Exhibit 5
* 1990–2002Source: Groningen Productivity database Oct 2005; McKinsey analysis
Size in percent of 2003 value add (current prices)
-4.0
-1 6
US
UKSpain Netherlands
Ireland
Productivity change, CAGRPercent
4.0
-8.0
0
-6.0
40
2.0
-2.0
Denmark
Sweden
Net job creation per thousand working age population (15–64)
2
Germany
France
1 53
Japan*
The structural change in the Swedish processed food industry resulted in strong productivity growth and declining employmentPercent, 1990–2003
Exhibit 6Exhibit 6
Sweden has closed much of the productivity gap with the US
32
70
58
100
78
39
72
86
99
112Denmark
US
Sweden
Japan**
Germany
Labor productivity in processed food, 2003*
Value added per hour workedIndex US 1990 = 100
0.0
-0.3
-0.4
-3.0
-5.4
Net job creation per thousand working age population (15–64)
Employment performance in processed food, 1990–2003
US
Japan**
Sweden
Denmark
Germany
* Estimated figures (extrapolated with Groningen productivity growth CAGR)** 1990–2002
Source: Groningen 60-industry Productivity database; MGI 1995; McKinsey analysis
1990 2003
CAGR
2.8%
-0.1%
3.1%
0.2%
1.5%

1�9
Unlike in agriculture, employment levels in food processing do not inevitably
decrease as GDP per capita increases. The introduction of new, higher-value-
added products (e.g., boneless chicken breasts or ready-to-eat meals) allows the
industry to increase its value added while total food consumption remains more
or less constant. High productivity can contribute to output growth by reducing the
“price” of processed food value added. While demand for total food consumption
is fairly price inelastic, the demand for food processing is more responsive to
its price.
Despite slow growth in total food consumption, output growth measured in value
added was significant. Approximately half of Sweden’s productivity development
came from output growth (value added), while the other half came from reduced
hours worked, a similar development as in the benchmark country, Denmark
(Exhibit 7). Productivity improved in all sub-sectors of the Swedish processed
food sector between 1995 and 2002 (Exhibit �). The overall effect of the strong
productivity performance in the processed food sector (together with increased
retail activities) has been a consumer surplus, thus lowering Swedish consumer
food prices significantly (Exhibit 9).
Exhibit 7
-1.1 -1.5
Sweden’s productivity development in processed food has been very similar to Denmark’s
2.8 3.1
Labor productivity growth Value added/hour
Change in value added, fixed 1995 prices
Change in hours worked, total
* Includes both employees and self-employedSource: Groningen Productivity Database, Oct 2005; McKinsey analysis
CAGR, 1990–2003; percent
1.7 1.6
2.63.6
0.92.0
-1.7 -1.8
0.6 0.4
Change in value added, current prices
Price development effect
Change in employed* people in sector
Hours per employee* development
÷÷Denmark Sweden
Denmark Sweden
Denmark Sweden
Denmark Sweden
Denmark Sweden
Denmark Sweden
Denmark Sweden
• Industry increased efficiency
• Growth in value added from shift to high value added products and increased exports

190
Exhibit 8Exhibit 8
All sub-sectors have increased productivity since 1995
* Including ice creamSource: Swedish Ministry of Agriculture; McKinsey analysis
1995
678
417
957
767
580
509
526
418
2002
Meats
Fish and seafood
Fruit and vegetables
Oils and fats
Dairy*
Starch and grain
CAGR 1995–2002Percent
5.0
2.3
6.1
5.9
7.6
4.5
12.8
5.3
292
291
680
655
382
341
314
308
Bakery
Confectionary
Value added per employee; SEK thousands
Exhibit 9Exhibit 9
Swedish food prices decreased over the past decade, but are still higher than in other EU countries
* Including non-alcoholic beverages** Not including beverages
Source: Statistics Sweden (SCB); Swedish Food Federation; Swedish Competition Authority; Swedish Tax Authority; McKinsey analysis
Consumer price development 1990–2005* Percent
80
90
100
110
120
130
140
150
160
170
180
190
200
1990 1995 2000
Swedish Food Prices vs. EU15**, including VATIndex EU-15 = 100
100Sweden
100Denmark
98France
95Finland
94UK
91Germany
91Netherlands
Comparative price levels 2003, excluding VAT**Index Sweden = 100
35.1
Food CPI Sweden 4.1
Total CPI Sweden

191
The increase in value added originated partly in a shift toward consumption of
more high-value-added products. As disposable income of households has grown,
there has been a slight increase in food consumption, especially for high-value-
added and indulgence products such as confectionery, meat and bakery products
(Exhibit 10). Food services is increasing in importance as a distribution channel
as Swedish households over time are increasing their out-of-home consumption
(Exhibit 11). As private label is putting pressure on food processors in the battle
for shelf space, some food processors have chosen to increasingly focus on
delivering high-value-added food products (i.e., prefabricated and preprocessed
food) to the restaurant and food outlet segment. Exports have also increased,
which increases the value added of the sector.
The reduction of hours worked was mainly the result of the structural shift
followed by rationalizations and consolidations. Employment growth between
1990 and 2002 was negative for most sub-sectors (Exhibit 12). The overall
employment level in the food and beverage sector was essentially unchanged
between 2002 and 200�. In total, sector employment decreased from 79,000 in
1990 to 6�,000 in 200�, a 20 percent reduction.
Exhibit 10Exhibit 10
96
With economic growth comes a slight increase in food consumption
* Excluding tobacco or alcoholic beverages** Bakery includes starch and grain products. Other includes Alcoholic beverages (15%), Non-alcoholic beverages (9%) and condiments (4%)
*** Dairy excluding cheese and eggs. Fish and seafood excluding shrimps, mussels and crayfishSource: Swedish Competition Authority; Euromonitor 2005; Swedish Ministry of Agriculture; McKinsey analysis
Food share of total private consumption*Percent
Food consumption***Kilograms respectively liters per capita CAGR
1990 2002
28
58
13
14
15
15
2
Meat
Fruit &Veg
Dairy
BakeryConfectionary
Fish
Oilsand fats
Other
Private consumption of different foodstuffs and beverages, 2004**Percent
0
5
10
15
20
0
20
40
60
80
100
120
140
Real food expenditure
Index 1993 = 100
2002931990 99
11
38
54
83
119
176
11
17
26
78
102
135
166Dairy
Fruit & vegetables
Bakery
Meats
Oils and fats
Confectionary
9.4Fish and seafood
-0.5%
1.1%
1.7%
3.1%
-3.1%
3.7%
1.3%

192
Exhibit 11Exhibit 11
Food services is increasing its importance as a distribution channel, although food retail has a comparative price advantage
* Food and beverages (including alcohol)Source: OECD; HOTREC; Statistics Sweden (SCB); McKinsey analysis
Comparative price levels in sample OECD countries
High
LowLow High
Restaurant price level
Food
reta
il pr
ice
leve
l
Restaurants comparatively cheaper
Retail food comparatively cheaper
Sweden
UK
Netherlands
ItalyUS
France
Germany
Spain
1993 1995 1997 1999 2001 2003
20.8 20.519.3 18.9 19.0
3.93.8 4.1 4.3 4.5
19.1
4.4
Share of food spending as part of total household spending*, 1993–2003
Percent Out-of-home consumption
Exhibit 12Exhibit 12
* Includes ice cream, alcoholic beverages, starch and grain, soft drinks and sugar. Employees not included in the statistics of the Swedish Food Federation. Total employees provided by the Groningen Database
Source: Groningen Productivity Database Oct 2005; Swedish Food Federation; McKinsey analysis
Thousand FTEs
Most sub-sectors experienced negative employment improvement since 1990
20.2
Starch and grain 0.7
Oils and fats 1.2
Fish and seafood
9.4
16.8
17.5
Fruit & vegetables
Confectionary
Dairy
5.1
2.2
5.9
Bakery
Total
Other*
Meats
79.0
13.8
15.8
7.2
4.1
3.2
2.1
1.6
1.3
63.0
13.9
1990 2002Net job creation, 1990–2002Percent
-21
-6
-20
-31
86
-23
-37
-31
-5
33

19�
factors explaining the developments
Three main factors explain the developments in the sector: elimination of market
barriers, increased foreign presence, and the growing sophistication of retailers.
Each of these is described in detail below:
Elimination or reduction of product market barriers with Sweden’s entry into
the EU. Before the EU entry, the free trade agreement from 197� (EFTA)
covered only a subset of food products such as confectionery, sweet bakery,
ice cream and soft drinks. Meat and dairy products were not included. Hence,
Swedish involvement in foreign trade was limited to a relatively small share
of the whole food industry. Furthermore, tariff barriers protected Swedish
agriculture, which left Swedish food processors little choice but to source
domestically. Entry into the EU removed tariff barriers previously imposed
to protect the domestic interests. Product requirements were standardized
within the EU, and the whole food sector’s increasing exposure to the rest
of the EU meant increased sourcing opportunities for both food processors
(i.e., input from European agribusiness) and retailers (food products from
European producers). In fact, imports of food products went up by 60 percent
between 1995 and 2002, while exports went up by 100 percent.
In contrast to Denmark, which has long been a net exporter of food, Sweden
has historically been a net importer of food. Since Sweden already had a
large trade deficit in processed food before its entry into the EU in 1995, its
trade deficit increased in absolute terms despite strong growth of exports
relative to imports during the period under study (Exhibit 1�), Even so, the
entry into the EU has led to Sweden surpass Denmark in trade intensity , with
a trade intensity2 in 200� of 1.� compared to Denmark’s 0.�.
While some of the high-value-added food processors already had been
exposed to international trade (e.g., confectionery and sweet bakery), sub-
sectors that were more domestic by nature, such as the meat and dairy
cooperatives, were affected substantially by the increased imports (Exhibit
14). The increased competitive pressure forced both meat and dairy to
rationalize. Over the whole period of 1990 to 2002, meats and dairy reduced
its workforce by approximately 20-25 percent:
2 Trade intensity is defined as food imports plus food exports as share of total production of the food, beverages and tobacco sector.

194
Exhibit 13Exhibit 13
Reduced trade barriers within the EU opened for competition and led to a dramatic increase of foreign trade
Food and beverages foreign tradeSEK billions
0
10
20
30
40
50
60
1993 1995 1997 1999 2001
Source: Statistics Sweden; McKinsey analysis
Exports
Imports
18 billion
27 billion
CAGR8.3%
CAGR14.8%
Exhibit 14Exhibit 14
Consolidation in meat and dairy while maintaining a stable output
Source: Swedish Ministry of Agriculture; Press clippings; McKinsey analysis
100
20041995
100 100
20041995
99
Output of slaughtered animalsIndex 1995 = 100
Output of dairy productsIndex 1995 = 100
Thousand tons 542 543 3,304 3,275
Meat Dairy
204
20021995
182
57
20041995
39
Number of butcheries Number of dairies

195
Dairy improved its efficiency by maintaining the same total output while
eliminating a third of the dairy production plants (from 57 in 1995 to �9 in
2004). The increased competition contributed to the cross-border merger
between Swedish Arla and Danish MD foods in 2000. Since then, synergies
have been realized in the organization (employing 5,000 people in Sweden).
Recently, Arla Foods laid off 600 employees, mainly from indirect functions.
In the first part of the value chain, the increased competition reduced the
number of milk suppliers from 25,000 to 10,000 between 1990 and 2002,
in part because of EU milk reforms and lowered subsidies to farmers.
In processed meat, which is a relatively labor-intensive business, 11
percent of Swedish butcheries closed between 1995 and 2002 (from 204
to 1�2). Consumers have increasingly chosen low-priced imported meat, a
shift that has helped push down margins and increase overcapacity in the
sector. From 1995 to 200�, the imported share of domestic consumption
increased from 9 to 21 percent for pork, and from 15 to 41 percent for beef.
In 200�, the imported meat accounted for 29 percent of total domestic meat
consumption (Exhibit 15). The Swedish meat industry, being highly integrated
with agribusiness, also saw a dramatic decline in the number of farms with
pork and beef, reduced by 70 percent and �0 percent respectively.
—
—
Exhibit 15Exhibit 15
Swedish consumers have increasingly chosen imported meat, while a relatively small share of Swedish meats is being exported
Share of national sales Share of domestic production
Source: Swedish Meats; Statistics Sweden (SCB)
Imports of meat Exports of meat
1995 2003
11
29
Imports and exports of meat; percent
1995
9
6
2003

196
Increased foreign presence. Cross-border mergers have led to an increased
foreign presence in Sweden. Previous studies show that foreign entry
commonly leads to improved overall productivity in a sector, as these foreign
entrants are more adaptable to change and often bring new operational
know-how that diffuses into domestic businesses over time. The Swedish
processed food sector has seen a considerable increase in the presence of
foreign players. Kraft, Unilever, Diplom Is, Fazer, Orkla, Atria, and Carlsberg
are just a few examples of players having entered the Swedish market as
producers over the past fifteen years. The foreign players went from employing
21 percent of the total workforce in 1995 to employing �1 percent in 2001.
Foreign affiliates contributed significantly to sector productivity growth since
they were operating with higher productivity than Swedish players. Switching
labor resources from domestic to more productive foreign affiliates accounted
for most of the positive effect. Notable, but less important, was the effect
stemming from productivity growth within the group of foreign affiliates (Exhibit
16). In addition, the remaining domestic plants have been forced to operate
more efficiently in order to stay competitive.
Exhibit 16Exhibit 16
Foreign affiliates have contributed significantly to sector productivity growth
Note: Productivity growth accounts for whole food, beverages and tobacco sector* Contribution effects to productivity growth that derives from switching labor resources from domestic to foreign affiliates
** Contribution effects deriving from productivity growth within the group of foreign affiliatesSource: OECD “The contribution of foreign affiliates to productivity growth” (2005); McKinsey analysis
Foreign contribution to labor productivity, 1995–2001Index Total foreign contribution = 100
Average labor productivity annual growth, 1995–2001Index sector average growth = 100
228Foreign affiliates
50Domestic firms31
100
Total foreign contribution to productivity growth
“Between” effects*
69
“Within” effects**

197
More sophisticated retailers. Though the Swedish retail landscape is relatively
concentrated (Exhibit 17), it has experienced increased competitive intensity
over the past years. Increased competitiveness, in turn, has translated into
increased pressure on Swedish food producers. The pressures come in
several forms:
Centralized retail shelf space management, which causes food processors
to compete to get their products on the shelves. Although the average
size of retail stores is growing, competition for shelf space has become
tougher for producers. Most retailers are part of large chains that control
the assortment in the shops and require food producers to supply all
stores in the chain. The food products are divided into different assortment
and marketing categories, and certain categories must be represented on
every shop’s shelves. Producers operating with small production volumes
and capacity could have difficulty meeting retailers’ volume requirements.
Allocated shelf space, which often favors the market leader, strongly affects
sales volumes. A joint study from the Nordic Competition Authorities
suggests that the second to fifth largest producers in most markets have
lost market shares in the last five years due to the intensified shelf space
management by the retailers.
—
Exhibit 17Exhibit 17
Sweden has a relatively highly concentrated grocery retail sector
Note: Herfindahl-Hirschman index (HHI) measures market concentration. Calculated by squaring the market share of each firm competing in the market and then summing the result. A value above 1,800 indicates a concentrated market; between 1,000 and 1,800 a moderately concentrated market
Source: "Nordic food markets“, Nordisk Ministerråd
Concentration in the grocery retail sector 2002–2003HHI index
2,800
2,900
3,200
Finland
Germany
Denmark
1,600
1,500
2,600
Netherlands
France
UK
Iceland
Sweden
1,600
2,600

19�
Improved retailer logistics systems, which increase their negotiating
power. Retailers’ distribution systems have become more sophisticated
in order to source more effectively and leverage scale advantages (Exhibit
1�). Fewer direct deliveries have positively affected the sector productivity.
However, it has also increased the negotiating power of retailers and put
increased pressure on the producers to provide a full range of products
(thereby driving producer consolidations). Some direct deliveries are still
common, such as dairy and brewery, but ICA, for example, has announced
that they will continue to improve their distribution system with the goal of
including dairy products by 200�.
Increased competition from private labels. Large retail chains develop
private labels for differentiation and to counter the growing presence
of hard discounters. Enhancing their own brands allows retailers to cut
costs, improve profitability and control the entire supply chain, from
product planning to the end consumer. Private label could benefit the
consumer if the retailer manages to provide a full range of price points
for a given product segment. One example is Coop, which has launched
—
—
Exhibit 18Exhibit 18
Food distributors have become more efficient over time
* Distribution centersSource: Gothenburg School of Economics; Press clippings; Interviews
Further improvements are likely to be seen in the future
• ICA is planning to operate 6 DCs* by 2008– 5 closures– 2 new
• Cost per case likely to decrease as a result of– Larger warehouses and
increased operational efficiencies
– Higher volumes from fewer direct distributions (investments to include dairy products have been made)
– Increased in-bound ordering and joint facilities across borders
ICA’s centralization has lessened the logistical burden on food producers
ICA EXAMPLE
9
20
20051990
Number of DCs*
1990 2005
~4,000
2,200
People employed in DCs* and warehouses
Changed network structure
Improvedoperations

199
its own private labels that encompass several price points across product
categories (e.g, Blåvitt and X-tra that compete in the low-end segment for
pasta and rice, while Coop and Signum compete with A brands). According
to industry experts, one reason that private label is gaining acceptance
with Swedish consumers could be that the average share-of-mind or loyalty
and recognition for retail food brands has decreased over time. Private
label has increasingly pushed B-brands (i.e., second-tier brands) off the
retail shelves and pressured food producers to use their capacity for large-
scale, low-margin orders (Exhibit 19). In 2004, private label accounted for
about 14 percent of Swedish grocery sales, while in meats, private label
grew from 1� to 25 percent in the same year.
Price pressure. Retailers have seen entry of aggressive hard discounters
and other competitors in the past years (Exhibit 20). The effect has been
increased price pressure for retailers, which transfers into increased
pressure on the food producers’ margins.
—
Exhibit 19Exhibit 19
30
35
9
3
13
10
70
100
Source: McKinsey analysis
DISGUISED CLIENT EXAMPLE
Premium private label has higher gross margins than lower-PL
Attractiveness
Price entry point PL
“Standard”PL
Grossmargin, % Same Higher Much
higher
Premium/niche PL
Absolute grosscontribution
Lower Same Higher
Gross margin relative to branded goods
Attractive margins on private label vs. branded goods drive increase in private label, putting an increased pressure on food producers
Private label has higher retail margins than branded goods… …and it is higher the more premium it gets
ManufacturerEBITDA
Selling/overhead
R&D
A&P
COGS
Retailer gross margin
Consumer price
Branded goods
6
2
1
Selling price to retailer
(30%) (35%)
37
79
49
3
30
(14%) (12%)
Con
sum
er g
oods
sup
plie
r
Private label (std)

200
As a result of these dynamics, Swedish food processors have improved their
plant level efficiencies. A large share of investments was allocated to improve
IT use and automation (Exhibit 21). This has increased productivity in two ways;
through greater flexibility and efficiency in production allowing increased output,
and by enabling the reduction in the number of employees. Capital intensity
has increased by �.� percent on a yearly basis in 1994-2002, compared to 1.7
percent for the aggregate Swedish manufacturing sector (Exhibit 22).
Exhibit 20Exhibit 20
Growth of highly productive formats increases pressure on existing food retailers
Shift towards larger formats Discounters are growing aggressively
Source: EHI; Supermarket 2004 and 2005; McKinsey analysis
Number of stores in Sweden
SalesSEK millions
+
134
5618
20042002 2003
2002 2004
200
1,920
2003
970
• From 0% to 13% share of low-price market in 3 years
• Still only ~1% of total grocery market
0
500
1,000
1,500
2,000
2,500
3,000
0
50
100
150
200
250
Average size of new establishments in food retail m2
Number of newly established
retail outlets
1975 20041985 1995

201
Exhibit 21Exhibit 21
IT investments were large in the food sector compared to industry average and other process industries
5
9
13
19
37
69
1717
39
Processed food
Pulp & Paper Chemicals Textiles Mining
IT investments as share of total investmentsPercent
1993
2002
Manufacturing average 2002 = 28%
Source: “Svensk industri i globaliseringens tid” (2005), Industrins Ekonomiska Råd; McKinsey analysis
Exhibit 22Exhibit 22
Over the years, the food sector has invested in enhancement of productivityPercent
* Measured in hours workedSource: “Svensk industri i globaliseringens tid” (2005), Industrins Ekonomiska Råd; Groningen Productivity Database, Oct 2005; McKinsey analysis
Investments in automation… …has led to higher capital intensity
Average investments as share of value add Capital volume per hours worked
0.39Mining
0.22Processed food
0.22Pulp & Paper
0.18Chemicals
0.10Textiles
0.18All manufacturing
3.3Processed food
3.2Chemicals
2.4Mining
2.1Pulp & Paper
0.9Textiles
1.7All manufacturing
CAGR 1994–20021993–2004
Labor input* fell by 1.3% (CAGR) 1994–2002

202
the current barriers in the sector
Many barriers to productivity have been removed during the last 15 years, yet
Sweden still lags Denmark by about �0 percent. Several more barriers remain:
Cooperatives controlling supply. The Swedish competition authority has
pointed out cooperative formats, particularly in dairy and meats, as inhibitors
to competition. Food production, in many sub-sectors, is concentrated in
agricultural cooperatives. Historically, these cooperatives had divided the
market geographically and did not compete in each other’s territory. Although
this has started to change, the cooperatives still control certain segments,
especially in dairy. However, this has been challenged lately as Lidl has started
to import consumer milk from Germany. Furthermore, ICA has announced that
they soon will be importing private label milk from the Czech Republic.
The cooperative structure exists in both Denmark and Sweden. However,
Danish cooperatives have historically been more efficient than the Swedish
ones. Part of the explanation stems from the fact that the Danish government
has put more pressure on the cooperatives to improve than has the Swedish
government. Furthermore, the entry of soft discounters into the Danish market,
as well as the higher trade intensity due to early EU entry and proximity to
Germany, had forced Danish cooperatives to operate more efficiently. The
Swedish government, on the other hand, tolerated the cooperatives’ high
market shares without exerting the same kind of pressure as their Danish
counterparts, in the belief that the resulting scale economies would promote
efficiency. Although scale, (defined as employment levels per plant), was
similar in Swedish, Danish and US plants, the lack of competitive pressure
had allowed the Swedish cooperatives to operate less efficiently.
Concentration, low competitive intensity, and overcapacity in certain sub-
sectors. Highly concentrated domestic sub-sectors could inhibit productivity if
they constitute barriers to entry and if there is little competition from imports.
Sugar is an example of an extremely concentrated sector with limited imports,
where one single producer dominates the market. Other sub-sectors show
high concentration as well. However, a highly concentrated sub-sector is
not negative per se. It could be the result of consolidation in order to reap
scale advantages, but often enough, high concentration only leads to low
competitive intensity (Exhibit 2�).
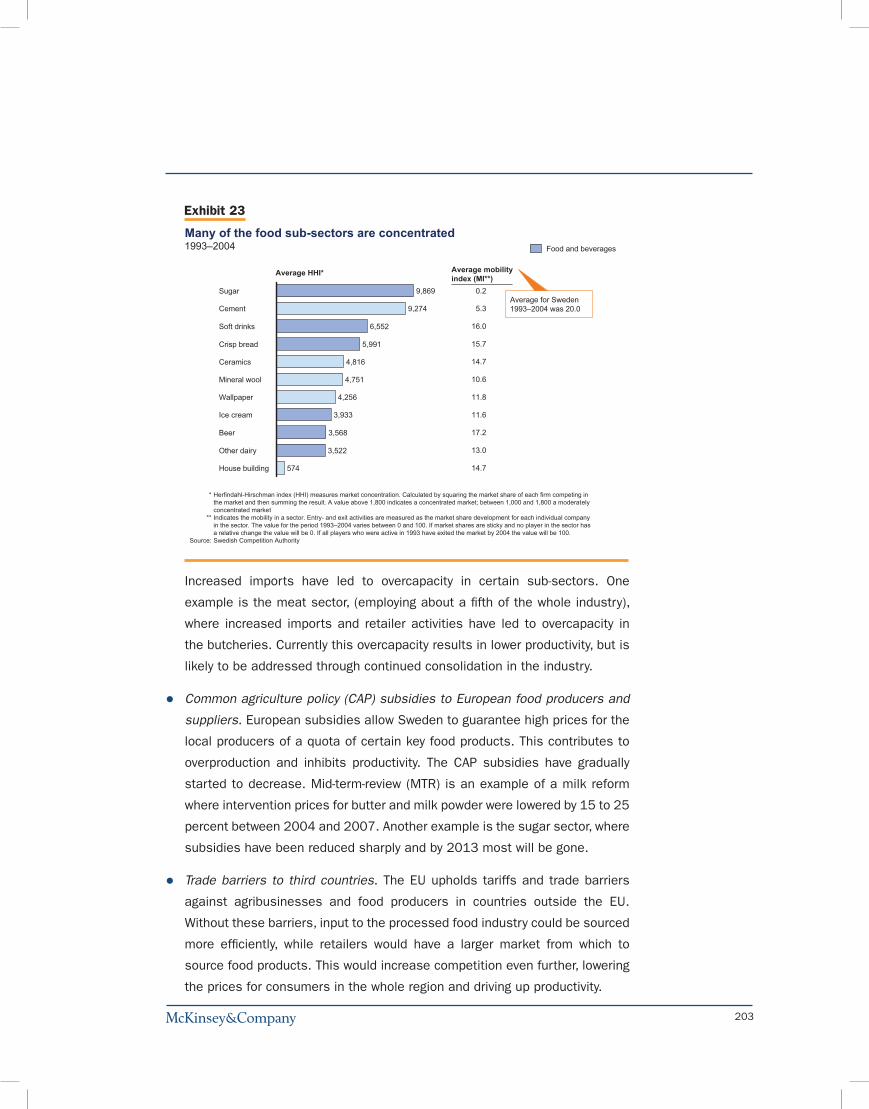
20�
Increased imports have led to overcapacity in certain sub-sectors. One
example is the meat sector, (employing about a fifth of the whole industry),
where increased imports and retailer activities have led to overcapacity in
the butcheries. Currently this overcapacity results in lower productivity, but is
likely to be addressed through continued consolidation in the industry.
Common agriculture policy (CAP) subsidies to European food producers and
suppliers. European subsidies allow Sweden to guarantee high prices for the
local producers of a quota of certain key food products. This contributes to
overproduction and inhibits productivity. The CAP subsidies have gradually
started to decrease. Mid-term-review (MTR) is an example of a milk reform
where intervention prices for butter and milk powder were lowered by 15 to 25
percent between 2004 and 2007. Another example is the sugar sector, where
subsidies have been reduced sharply and by 201� most will be gone.
Trade barriers to third countries. The EU upholds tariffs and trade barriers
against agribusinesses and food producers in countries outside the EU.
Without these barriers, input to the processed food industry could be sourced
more efficiently, while retailers would have a larger market from which to
source food products. This would increase competition even further, lowering
the prices for consumers in the whole region and driving up productivity.
Exhibit 23Exhibit 23
Many of the food sub-sectors are concentrated
* Herfindahl-Hirschman index (HHI) measures market concentration. Calculated by squaring the market share of each firm competing in the market and then summing the result. A value above 1,800 indicates a concentrated market; between 1,000 and 1,800 a moderately concentrated market
** Indicates the mobility in a sector. Entry- and exit activities are measured as the market share development for each individual company in the sector. The value for the period 1993–2004 varies between 0 and 100. If market shares are sticky and no player in the sector has a relative change the value will be 0. If all players who were active in 1993 have exited the market by 2004 the value will be 100.
Source: Swedish Competition Authority
Food and beverages
House building 574
Other dairy 3,522
Beer
6,552
9,274
9,869
3,933
3,568
Soft drinks
Ice cream
Mineral wool
5,991
Cement
Ceramics
4,256
Crisp bread
Sugar
4,751
Wallpaper
4,816
Average HHI* Average mobility index (MI**)
1993–2004
0.2
5.3
16.0
15.7
14.7
10.6
11.8
11.6
17.2
13.0
14.7
Average for Sweden 1993–2004 was 20.0

204
Company-level inefficiencies. Industry experts recommend trimming overhead
and support functions in order to cut costs, especially in organizations with
cooperative structures. Furthermore, the need for a fragmented sales forces
is likely to be reduced driven by two factors; first, retailers are centralizing
their purchases which will lead to a more centralized customer interface-
model; second, retailers are becoming more effective in handling local
ordering and merchandising, which will decrease the need for field sales and
merchandising. While some sub-sectors, e.g., dairy, already have relatively
efficient plant operations, many Swedish processed food plants still have
room for operational improvements. Since the industry was shielded against
competition for so long, there are examples of players who are significantly
behind their European competitors in operational excellence (Exhibit 24).
KEy CHAllEnGES for tHE futurE
Key challenges to Swedish food processors in the future stem from retailer
activities which are intended to protect their own volume and profits but which will
at the same time create pressure on the food producers’ volume and margins:
Exhibit 24Exhibit 24
Operational efficiency example – Analysis of conversion cost differences between a Swedish and a European player
Note: Conversion cost equals total production cost (including direct and indirect costs) excluding raw materials * Data from 2002, including 5% for overhead costs and profit margins
Source: Company data; Co-packer quote; McKinsey analysis
0.58Product A
0.41Product B
0.52
Product F
0.60
Product D
Product E
0.40
Product C
0.60
0.25
0.28
0.43
0.45
0.33
0.30
ProductsSwedish processor EUR/kg
European co-packer*(including margins)EUR/kg Cost gaps difference*
Estimate of weighted average conversion cost position at 15–25% below co-packer benchmarks. Total cost gap estimated to 10–20%
ILLUSTRATIVE
Conversion costs 2004
-26%
-39%
-46%
13%
-50%
-46%

205
Growing imports. Imports are likely to grow as a share of total consumption
due to improved opportunities to source from new EU member states and
thereby reap the benefits of the large factor cost differences. Current European
manufacturing trends could accentuate this development and give European
food processors a comparative advantage over Swedish ones if not acted
upon (Exhibit 25).
Increasing emphasis on private label. Attractive retailer margins and a
relatively low penetration will increase emphasis on private label (Exhibit
26). While private label penetration was approximately 14 percent in 2004,
Swedish retailers are claiming to aim for higher penetration (e.g., ICA’s short-
term goal is 25 percent).
Vertical integration. Vertical integration could have further implications for
meat processors. In recent years, the Swedish retailer ICA has successfully
cut significant labor hours from their in-store meat departments by integrating
vertically and centralizing the cutting and packaging of meat. If the trend
toward highly automated meat-cutting and pre-packaging continues, it will
have three consequences for Swedish meat producers in the future; the first
being a slight increase in overcapacity as retailers start to integrate upstream
in the value chain; the second being increased pressure on processed food
Exhibit 25Exhibit 25
Current European industry manufacturing trends will accentuate the need to continuously improve efficiency and control costs
Source: Interviews; press clippings; McKinsey analysis
• In-house production no longer considered driver of competitive advantage– Increased outsourcing to reduce cost and capital– Increased use of co-packers for basic, low value
add products• Major players exit low value add segments due to
uncompetitive cost level• Lean manufacturing principles increasingly being
implemented also for high value add products
• Production shifts to low cost countries, e.g., Central and Eastern Europe
• Further shift of sourcing to low cost countries in Asia
• Unilever divested 2 body care units in 2000 to Dutch Contract manufacturer Budelpack with outsourcing contracts
• Unilever exiting Grimsby plant for frozen products, expected 2005
• Nestlé always considering co-packing as possible option
• Frosta expanded with production in Bygdosz, Poland in 1999 (factory acquired from Unilever)
• Heinz is considering moving more production to Pudliszki, Poland
• Findus increasingly sourcing from SE Asia
Impact on industry manufacturing trends Examples
Changing value chain focus
Geographicalshift in production

206
companies to become the primary supplier to a retailer (since the volumes
become increasingly centralized); the third being an increased necessity to
differentiate (quality, strong brand, etc.).
As a consequence, increased polarization of the market and further consolidation
of the industry is likely to follow:
Polarization of success. Strong A-brands and private label are likely to jointly
capture a larger share of the profit pool while squeezing the middle segment.
The most difficult challenge will be for small and medium sized processed
food companies, who are disadvantaged by the increased importance of scale
requirements, and, in most cases, do not have a must-carry brand.
Increased consolidation. It is likely that the consolidation of the industry will
continue. First, the increasing market power of the retailers continues to put
consolidation pressure on smaller processors who have trouble finding outlets
for their products. Second, the choice to become a private label producer
usually requires large production capacity. Third, building a strong A-brand
usually requires substantial R&D and marketing investments. In addition,
pursuing growth opportunities abroad is often easier for the large producers.
Exhibit 26Exhibit 26
Source: “Konkurrensen i Sverige 2004” Swedish Competition Authority; Euromonitior 2005; press clippings; McKinsey analysis
Sweden still has a low private label penetration compared to Europe
Arla Foods, Skånemejerier and Swedish meats have realized that private labels are here to stay and have accepted to produce despite lower margins
The increased pressure from retailers and their private labels have resulted in a large marginalization of meat producers
Despite the poor deals, you just have to learn to live with it
We want to increase the range of private label products offered by Carrefour. Currently, 30–32% of Carrefour’s products are private label. We aim to raise that to ~43–45%
– ICA Nyheter
– Chief executive, Carrefour
– Chief executive, Swedish Meats
Private label penetrationShare of total, 2004, percent
Private label penetrationPercentage, 2004
Total
~14~11
ICA
~20
CoopNorden
12–15
Axfood
40
26
14
Average Top 15 European players
Average European market
Sweden

207
SuMMAry AnD IMPlICAtIonS
To close the gap with the benchmark country, actions will be required by company
management, labor unions and Swedish policy makers.
recommendations on firm level:
Embrace further consolidations. Increased imports have led to overcapacity in
certain sub-sectors, and there are many examples of Swedish processed food
plants that operate at low utilization. Moreover, it is likely that consolidation will
continue as a result of increasing market power of the retailers. Companies
should embrace further consolidations in order to realize labor and scale
synergies. For instance, meat industry consolidation is likely to continue in 2006
as industry experts estimate that Swedish butcheries have an overcapacity of
�0 to 40 percent. Out of 20 large butcheries, no more than 4 to 5 are likely to
be needed in the future, and for a meat producer who wants to be successful
over time, it is important to come out on top of this trend.
Avoid the middle lane. As polarization of the market is likely to continue, food
processors should avoid the middle ground of 2nd tier labels and instead
navigate between three potentially successful strategies.
One strategy would be to invest in product development, R&D and
marketing to build strong A-brands. This would allow the food producer to
maintain control of the manufacturing value chain, but with an increased
price pressure from the “premium” private label segment.
A second strategy could be to focus on niche segments. The battle for
shelf space and private label will increase the need for strong niche
products (as discussed above). Functional design, e.g., collaboration with
packaging companies to create value added, is likely to become increasingly
important. An example is Gothenburg based MicVac whose technique for
microwave cooking of raw materials in pre-sealed packages is used by
Nestlé. Moreover, health and functional foods are examples of product
segments with a large growth potential where Sweden is considered to be
in the frontline.
A third strategy would be to find innovative ways to partner with retailers
and leverage private label opportunities. Strong emphasis on productivity
and cost will be necessary to succeed if this venue is pursued.
—
—
—

20�
Continue to pursue growth opportunities from exports and food service
outlets. Swedish companies have been good at expanding their markets, as
exports have more than doubled in the past fifteen years. Large companies
account for 90 percent of all exports (Exhibit 27). Swedish products mostly
go to markets with strong purchasing power. Approximately 10 percent of
all exports go to Norway, while 60 percent of the exports go to the EU15
countries. While EU15 still offer opportunities for export growth, the new EU
countries are likely to become an important market for food producers. Early
positioning will be key, as the game is yet to begin. Barriers to entry in this
area are typically low purchasing power and high investments. Furthermore, as
Swedish consumers are increasing their spending on out-of-home-channels,
finding the right distribution mix will be important in the search for growth,
and could also be a viable response strategy to the increased private label
penetration in food retailing.
Trim indirect- and sales functions. Industry experts expect overhead and
support functions to be trimmed in order to cut costs. Some of the Swedish
companies have inherited an inefficient cooperative company structure that
Exhibit 27Exhibit 27
Large companies account for 90% of all exports in the food sectorPercent
Note: Includes exports from the whole food, beverages and tobacco sector* Companies with more than SEK 250 million in yearly turnover
Source: Swedish trade council; Statistics Sweden (SCB)
The large companies are few… …but important when it comes to exportsNumber of companies split by size Share of food exports
92
3.022
2003
100% = firms
91919189898888878784
77799999911
20022001 2003
22 2
1994
4
1995
4
1996
3
1997 1998
35 2
1999
2
2000
Small
MediumLarge*
62

209
could become more efficient by reducing overhead and support functions
costs. Arla Foods is an example of an organization that recently reduced
their administration staff by almost 12 percent in Sweden alone. As retailers
are centralizing purchases and becoming more efficient in handling their
local ordering and merchandizing, food producers should be able to realize
efficiency gains by reducing their sales force accordingly.
Increase plant efficiency and pursue off-shoring opportunities. Besides
addressing plant inefficiency through methods such as lean transformation
programs, companies should pursue off-shoring opportunities where possible.
Findus is an example of a food processor that has successfully lowered its
costs and increased its productivity by relocating parts of labor intensive
processes for one of its frozen fish products. Fish is transported from Norway
to Asia to be filleted, thereafter to France to be breaded, and finally sold in
Scandinavia. Other players benefit from the factor cost differences in Eastern
Europe (Exhibit 2�). Further evidence of the internationalization of food
processing is the fact that European players are increasingly off-shoring back-
office functions and shared services in addition to manufacturing. There are
also examples of European players that have chosen to centralize their brand
development, and therefore moved toward a more global business model.
Exhibit 28Exhibit 28
100
Old setup
60
New setup
>90
<10Old setup
~50
~50
New setup
100%
Approach
Network optimizationNumber of plants, Index Old setup*= 100
Western Europe
Eastern Europe
Background
• Cost reduction of over 30% of conversion cost
• Payback of less than 2 years
• Significant impact on shareholder value
European players are taking action: Network refocusing towards Eastern European countries
* Old setup indicates manufacturing network before the optimizationSource: McKinsey
Shift towards Eastern EuropePercent of volume
• Leading European food manufacturer(sales EUR >1 billion)
• Main business in Western Europe (>95%)
• Capacity utilization of manufacturing net-work <50%
• Most production located in Western Europe (>90%)
DISGUISED CLIENT EXAMPLE

210
recommendations regarding product market barriers
While tariffs between European countries have been removed, some market
barriers still exist. Policy makers should continue to work to reduce these barriers
and further increase the competitive intensity of the industry:
Reduce the structural barriers to competitiveness inherent in the cooperative
system. The Swedish competition authority has pointed out the cooperative
format in dairy as an inhibitor to competitive intensity. The implication for
policy makers should therefore be to continue to encourage and promote
competition through the Swedish Competition Authority.
Consider reductions in the common agriculture policy (CAP) subsidies to
European food producers and suppliers. As mentioned above, a recent
example of how reducing CAP subsidies affects the industry is the reduction of
subsidies to sugar beet cultivation. This reduction is aligned with the ambition
of reducing the current overproduction of sugar, with an expected effect of a
�0-40 percent price decline within four years. As a consequence, Danisco
announced that one of the two sugar plants in Sweden will be closed during
2006. Swedish policy makers could work to further remove subsidies and
direct compensations, as this would likely increase the competitive intensity.
However, this could also have major implications for many of the Swedish
farmers supplying the industry, since they are sensitive to changes in subsidy
policies. Over the years, direct compensations to Swedish agriculture as
share of income has increased significantly.
Work to reduce EU trade barriers to third countries. The EU upholds tariffs
and trade barriers against food producers in other countries. Without these
barriers, competition would increase even further, lowering the prices for
consumers in the whole region and driving up productivity, fueling competition,
and most likely leading to benefits for Swedish consumers through price
pressure. For the Swedish food sector, this would most likely have a positive
impact on productivity, while reducing the number of jobs in the sector and
leading to the elimination of less productive players.
* * *

211
The processed food sector has good chances of increasing productivity by
addressing remaining market and corporate level barriers. As increasing cost
control will be inevitable in order to survive, many of the large sub-sectors
should gain further productivity from becoming more efficient. Moreover, there
is still room for improvement by increasing output, mainly from the shift toward
higher-value-added products and by increasing exports. Hence, sufficient product
innovation in the sector would create further value added. However, it is also
possible that private label may lower value added in the food processing sector,
as it shifts margins from manufacturing to retailing. Also, further price deflation
would affect the food producers’ margins negatively.
Increased productivity in the processed food sector, together with increased
competitive intensity among food retailers, would create further consumer
surplus and result in lower food prices. While restructurings are often inevitable
when a sheltered sector opens up for competition, policy makers should not
yield to the temptation to artificially protect the jobs that could disappear as
a consequence. Instead, policy makers should continue to work for increased
competition to drive productivity, while simultaneously creating good conditions
for the creation of new jobs. Most likely, the processed food sector will not be
a net job creator in the future. Products with high labor content are likely to be
increasingly sourced from countries with lower factor costs. As the industry is
becoming increasingly international, back-office functions and shared services
are also likely to be off-shored. Moreover, sub-sectors that are already highly
automated are not likely to add any jobs unless significant capacity will be built.
This does not mean that the processed food sector will be unimportant in the
future, and all the stakeholders need to continue creating improved product
markets and aim for further productivity growth to create value to shareholders
and the overall economy.

212

The Swedish Construction IndustryEXECutIvE SuMMAry
In its 1995 report of the Swedish economy, McKinsey Global Institute (MGI) found
the Swedish construction industry to be a sector with low productivity compared
to other countries (at 77 percent of the benchmark US sector). Employment
performance was also poor, with a 0.4 percent annual decline in the number
of employees over the time period from 19�0 to 1992. Low labor productivity
led to higher construction prices, inhibited demand, and stifled job creation.
The report identified the main drivers of poor performance as low competitive
intensity and product regulations (including zoning laws, construction codes, and
rent control).
Since 1995, few important changes have been made to improve market conditions
and most barriers are still in place. Additionally, the size of the informal sector
has inhibited labor productivity growth, which remains low. Between 1990 and
200�, labor productivity grew by a mere 0.7 percent per year. Because of very
slow growth in other countries, however, Sweden’s current labor productivity in
the construction industry is �5 percent of the US labor productivity level. Over
the same period, as many as �.6 jobs per 1000 working age population were lost
in construction in Sweden.
Today, there are many barriers to improvements in the Swedish construction
sector. The two major barriers that inhibit both labor productivity and employment
development in the sector are the high cost of labor (e.g. tax wedges and labor
union fees) and the large informal sector. Labor productivity growth is also
inhibited by a lack of competition, highly regulated hiring and firing practices,
21�

214
weak operational practices, construction codes, lack of EU-wide regulations, and
low labor flexibility in the division of tasks. Besides high labor cost and a large
informal sector, employment is also limited by zoning laws, rent control and an
emerging labor shortage.
The industry is likely to face significant change in the coming years. Construction
companies are taking steps to improve operational performance. The increased
influx of construction workers from other EU countries will challenge the industry
dynamics. Cross-country EU regulations on construction material can cause
upstream supplier segments to reduce costs of input materials. More practical
functional construction codes, including more tested and pre-approved building
methods, will increase the flexibility for contractors.
All stakeholders will be affected by these changes and have the possibility to
create a better functioning industry from which everyone (workers, customers,
companies, and policymakers) will benefit. Stakeholders need to consider
what actions they will take. Policy makers have an opportunity to improve the
performance in the industry by removing barriers, especially product market
barriers. To reduce labor market barriers and remove operational inefficiencies,
parties will need to work more cooperatively. Companies and labor unions
need to work together to achieve a higher level of operational efficiency. Labor
unions will need to decide how to act in the changing world, and preferably
create advantages by improving processes and productivity to become more
competitive when facing new competition rather than raising barriers against
foreign competition. Barriers ultimately affect the whole construction industry
and the people in Sweden negatively.
Working together, policymakers, companies, and labor unions have the opportunity
and essential components to significantly improve the current situation.
These improvement steps are important to the health and performance of the
industry.

215
PErforMAnCE In tHE ConStruCtIon InDuStry
The construction industry is one of the largest sectors in developed economies,
representing between 4 and 6 percent of total GDP and total employment. It is
a highly cyclical sector, with large variations in demand and volumes over the
course of a full business cycle. Furthermore, it is a sector that directly influences
almost all other sectors as well as all residents in a country. This makes the
construction sector a subject for discussion of social as well as purely market-
driven issues.
This report looks at the construction industry in general and the building sector in
particular. This study provides an important contribution to the overall discussion
of productivity and employment creation for several reasons:
Sizable and low performing. The sector is large, labor-intensive, and in
many ways relatively low-performing. Low competitive intensity, increasingly
expensive input goods and slow operational improvements, have made
dwellings relatively more expensive to construct in Sweden than in countries
with higher-performing construction sectors.
Heavily regulated. Construction may very well be the most regulated private
sector industry left in Sweden. Significant product market and labor market
barriers have inhibited the development of the sector for a long time, which
provides clear motivation for change.
Low operational efficiency. The sector is suffering from high levels of waste,
lack of standardization, and sub-optimal procurement processes. Together
these factors create low operational efficiency on the company level. It should
be possible to achieve significant improvements by adopting best practice
principles from other industries.
Facing significant change. Several of the large companies are claiming to
be stepping up their work through operational improvements. At the same
time, the entry of 10 new countries into the European Union is increasing
the potential supply of low-cost labor to the construction industry. The
consequences of these developments are not yet clear, but it is highly likely
that the future will see significant change throughout the industry.

216
tHE ConStruCtIon InDuStry In SwEDEn
In 2004, construction in Sweden was a USD 25 billion industry, of which 70
percent was in the building sector and �0 percent was in the infrastructure sector.
The building sector accounted for approximately �.5 percent of all employees
in the country. It is largely a local market with limited international trade and
competition.
The industry structure is highly fragmented with only a handful of large companies
and countless smaller companies and self-employed construction workers.
However, certain sub-sectors such as suppliers, are highly concentrated, in effect
limiting the competition (Exhibit 1).
The Swedish construction sector was hit very hard in the financial crisis of the
early 1990s. Demand plummeted, and between 1990 and 1995 revenues in the
building sector diminished by half and approximately a quarter of all construction
workers lost their jobs (Exhibit 2). Since the decline, the sector has stabilized
and demand has started to increase again. Together with the stronger economic
development, this has led to a slight recovery both in revenues and employment.
Exhibit 1

217
There are even signs of an emerging lack of labor supply in the construction
sector. Even so, the current levels of employment in the building industry are far
behind what they were before 1991.
InDuStry PErforMAnCE
the starting point for the sector
The Swedish building industry in the early 1990s was heavily regulated and
had several product market and labor market barriers. Construction prices were
high compared to international benchmarks: in the US, houses of similar quality
were built at a �0 percent lower cost. In addition, productivity was only about 77
percent of the American benchmark, and the employment declined (Exhibit �).
There were several drivers behind the low productivity improvement:
Production processes. Production processes in Sweden in the early 1990s
were characterized by a fragmented structure with little coordination among the
different steps in the value chain. Insufficient consideration of manufacturability
in the design process, as well as uncoordinated construction, led to low
productivity. Many subcontractors performed their work with low coordination
with other functions, causing delays that carried through to other functions.
Exhibit 2

21�
In the benchmark country, the United States, the construction process was
better coordinated, resulting in higher overall productivity.
Low competitive intensity upstream and in large projects. The competitive
intensity was found to be very low in the upstream part of the value chain in the
early 1990s. Material suppliers frequently had a very strong market position,
leading to high input prices. In some cases, there were even examples of
outright price cooperation between competitors. In addition, there were often
oligopoly bidding situations on larger construction projects, further limiting
the competitive intensity.
Fragmented downstream industry sector. There were literally thousands
of small and midsized contractors, making this part of the sector highly
fragmented. This structure was partly driven by the highly variable demand
in the construction sector combined with barriers against flexible hiring/firing
processes and high labor costs. The fragmented industry limited productivity
growth since the incentives and capabilities to innovate were lower.
Product market regulations. Significant subsidies in the 19�0s limited the
cost for consumers, and provided little incentive to improve productivity. The
key success factor became not how to improve more than the competitors,
Exhibit 3

219
but rather how to circumvent the system and maximize the subsidies in
the process. Regulations also affected the supply side, where zoning laws
and strict building codes inhibited productivity development by making the
building process longer and more costly. Detailed building codes also limited
the potential for improvements and innovation, further inhibiting productivity
growth.
Low labor flexibility. The division of tasks among different construction
workers was rigorously enforced, which resulted in inefficient use of labor. In
combination with inefficient coordination between sub-contractors, this low
flexibility added much waste to the system.
Concurrent with the weak productivity, Swedish employment creation was slow
in the construction sector during the 19�0-1990 period observed in the 1995
study. The main causes were similar to the inhibitors of labor productivity
improvement. Low productivity caused a situation where subsidies were required
to drive construction (and thereby employment). As subsidies were removed in
the late 19�0s and early 1990s, the high cost of construction then resulted in a
significant drop in activities, accompanied by a drop in employment levels.
Productivity and employment development since the early 1990s
Despite the opportunity to improve (because of a low starting point and the
identification of several surmountable obstacles to productivity improvements),
Sweden has experienced very slow labor productivity growth since the last MGI
analysis. Most of the barriers identified then are still in place. Labor productivity
has grown a mere 0.7 percent per year (which is higher than in most of the other
compared countries, but still very low), and employment declined by as many as
�.6 jobs per 1000 working age population (Exhibit 4). Most of the employment
decline resulted from a sharp drop in construction volumes from 1990 to 1995;
since then there has actually been a slight recovery of jobs. Nevertheless,
compared to other countries, the Swedish construction sector still employs very
few people as a share of the total economy (Exhibit 5).

220
Exhibit 4
Exhibit 5

221
Since the labor productivity improvement has been so slow, the construction
industry in Sweden is still significantly less productive than the benchmark US.
The effects can also be seen in indicators such as the average production cost for
dwellings. The cost of construction has increased twice as fast in Sweden as in
the US (Exhibit 6). As a result, the US building industry shows signs of overheating
with very high spending on residential new construction and refurbishment. In
contrast, the Swedish building sector has built relatively few dwellings during the
last decades. Compared to other European countries, Sweden has built the third
fewest new dwellings since the 19�0s (Exhibit 7).
factors explaining the development
Some attempts have been made in the last decade to improve construction sector
performance (Exhibit �). However, due to conflicting actions and developments,
the overall effect has been very limited, and the Swedish construction sector still
experiences significant barriers to labor productivity development.
Exhibit 6

222
Exhibit 7
Exhibit 8

22�
Changes have been made in three major areas of the Swedish construction industry,
but all have had limited effect on overall labor productivity improvement:
Construction codes. In 1994 the construction codes were transformed from
specific codes to more functional codes (e.g., specifying a function such
as fire resistance, energy savings, or ventilation instead of specifying exact
dimensions and materials). Unfortunately, the benefits of the functional codes
have so far been low. Many contractors apply the “better safe than sorry”
principle and continue to use recommended methods that are based in the
old specific codes, SNB�0, because they are responsible for testing, proving,
and documenting the functionality of any new methods and are liable for the
construction functionality during the entire economic lifetime of the building.
So far, little net effect of the change has been realized in Sweden.
Competition authority. The founding of the Swedish competition authority
in 1992 and the new anti-trust laws introduced the following year has
limited many of the anti-competitive behaviors that formerly existed in many
industries. Upstream supplier segments on the infrastructure side of the
construction sector have seen several actions to improve competition (e.g.
the break-up of the so-called asphalt cartel). However, in the building sector
many material provider segments are still highly concentrated and have yet to
see any significant improvements in competition.
Demand development. Low interest rates and a generally stronger economy
have increased demand in the construction sector over the last couple of
years. An apparent disparity between latent demand (based on demographic
changes and age distribution of the buildings) and actual construction indicates
that demand may further increase (Exhibit 9). However, a significant shift in
public expenditures away from the private building sector (with decreasing
subsidies and increasing taxes), caused the underlying demand growth to be
somewhat reduced. In 1991, the building industry was net subsidized with
SEK 7 billions per year. A series of political decisions changed this, and today
the government gains over SEK �7 billions every year from the building sector
(including taxation on existing houses) (Exhibit 10).

224
Exhibit 9
Exhibit 10

225
the current barriers in the sector
Despite efforts to remove some product market barriers, the Swedish construction
industry is still a highly regulated market with significant barriers inhibiting labor
productivity improvement and job creation. Market barriers include zoning laws,
construction codes, lack of EU-wide regulations, and rent control, while labor
market barriers include labor flexibility, (i.e., hiring and firing practices, and strict
division of tasks), labor supply, labor cost, and inconsistent labor cost subsidies).
Limited competition in part of the industry has resulted in low operational
performance. These factors influence productivity and size of the sector (i.e.,
employment level). Labor cost and informal sector affect both labor productivity
improvement and job creation in the sector. Limited competition in parts of the
industry, hiring and firing practices that contribute to small scale companies and
weak operational practices in companies, predominantly inhibit labor productivity
improvement. Other factors that contribute to low labor productivity improvements
are construction codes, lack of EU-wide regulations, and low labor flexibility. Other
barriers directly limit the demand development (and employment) in the Swedish
construction sector; these include most notably political decisions, economic
development, zoning laws, and rent control. A final, currently less important,
factor that can inhibit demand development is labor supply.
Barriers limiting both labor productivity improvement and job creation in the
Swedish construction sector are high labor cost and a large informal sector:
Labor cost is driven by high tax wedges on labor and to some extent by the
fees that labor unions charge for controlling and measuring labor performance.
At ~2 percent of gross wages, this fee totals SEK 250-�00 million per year.
Moreover, the powerful labor union which represent �5 percent of construction
workers has been able to gain annual wage increases that are higher than
in manufacturing sectors, creating a wage gap between construction workers
and industrial workers (Exhibit 11). The high labor cost result in higher
construction prices which affect demand and thereby employment. Labor cost
in Sweden is especially high when compared with the new member states in
the EU. An influx of construction workers from Eastern Europe has created
tension in the current system, and conflicts over minimum wages have led
unions to put companies under blockade. See the text about Vaxholm for a
detailed example of this issue.

the vaxholm conflict
In May 2004, Laval un Partneri Ltd, a Latvian company, sent workers to
Sweden to build a school in Vaxholm. Compensation to the workers was
SEK 14,000 ($1,740) per month or SEK �0 ($10) per hour, plus room and
board. Altogether, this was a bit more than double their normal wage.
That June, the Swedish trade union Byggnads contacted the Latvian company
to negotiate a collective bargaining agreement. Byggnads demanded that
the workers should be paid a salary of SEK 145 an hour (even though the
lowest-allowed salary applicable under the collective bargaining pact was
SEK 109 an hour). Rather than signing Byggnads’ agreement, Laval un
Partneri chose to sign a collective bargaining agreement with the Latvian
construction workers trade union in September. In October, Byggnads
announced that industrial action would be initiated if the company did
not sign the Swedish agreement. In November, a blockade of the Vaxholm
building site began.
Normally, Sweden prohibits industrial action against a company in order to
eliminate, or change, another collective bargaining agreement applicable to
a particular workplace. There is, however, an exception, based on a 1991
amendment called Lex Britannia, which stipulates that industrial action can
be taken against a company that does not have a connection to the Swedish
labor market under the Swedish Co-Determination in the Workplace Act
(medbestämmandelagen). This connection is normally not considered to
exist when a foreign company engages in temporary work in Sweden.
In December, Laval un Partneri initiated legal proceedings against Byggnads
before the Swedish Labor Court. According to the Court’s interim ruling, the
blockade was legal. However, since the Court found also found that the
legislation was unclear; it decided to send the case to the European Court
of Justice (ECJ) for a preliminary ruling before giving the final judgment. The
question under consideration in the ECJ is whether Lex Britannia implies
unlawful discrimination against foreign companies and thereby hinders free
movement of services, which would be against EU law. The ECJ is expected
to pronounce on this case during 2007 but Laval un Partneri could not
afford to wait until then, and brought its workers home. The company’s
Swedish subsidiary went bankrupt in February, 2005.
226

227
The informal sector. The construction sector is probably the largest contributor
to the informal sector in Sweden. It has been estimated that the informal
sector represents 12 percent of the entire building sector. The main drivers
creating an informal sector are high tax wedges on labor, the inherent variability
in demand, and the large share of self-employed construction workers. High
marginal taxes on both workers and customer income raise both the price
of construction and the income a customer needs to earn in order to pay it
(Exhibit 12). Depending on income level, for both worker and customer, the
marginal tax can vary significantly and drive the required gross income for the
customer who purchases a construction service to between 4.7 and 11.�
times the net wage of the worker (Exhibit 1�). As always, an informal sector
by definition does not create any visible jobs. Labor productivity improvement
is also inhibited by the informal sector through sub-scale formats, the lack
of protection from the legal system and inhibited growth of companies. Most
companies that are active in the informal sector are small, which inhibits
economies of scale. Informal companies also stand outside the legal system,
which reduces their ability to protect property rights, solve conflicts and borrow
from formal credit institutions. Their limited ability to invest in operational
improvements and growth inhibits labor productivity improvements. Finally,
Exhibit 11

22�
Exhibit 12
Exhibit 13

229
the informal sector, which can compete on unfair terms, limits growth
opportunities for more productive companies. Decreasing the informal sector
may improve the supply situation, since the high unemployment in the sector
seems inconsistent with the lack of supply (Exhibit 14). Furthermore, an
informal sector increases the hidden transaction costs, e.g., increasing risk
due to lack of guarantees, lack of consumer rights, and lack of insurance
coverage for both supplier and buyer. It also leaves employees without social-
security benefits and labor protection rules.
Barriers that predominantly affect labor productivity improvements are low
competition upstream in the sector, hiring and firing practices, and weak
operational practices in many companies. Other factors that contribute to the
low labor productivity improvement are construction codes, lack of EU-wide
regulations, and low labor flexibility:
Limited competition in parts of the industry. Some segments, especially
upstream in the value chain, are highly consolidated. Several material
manufacturers and distributors of input material have all but a monopoly
Exhibit 14

2�0
in their segment, and others act as oligopolies. This has contributed
to continuous price increases on input material, which results in higher
construction prices. Swedish material price levels have increased more than
in other countries and prices are currently at a lower level in many other
countries (Exhibit 15-16). Among contractors and sub-contractors, the picture
is different. On smaller projects, the competition is intense due to industry
fragmentation. However, since there are only a handful of large companies in
the market, the competition is limited when it comes to larger projects. The
lack of internationally coherent construction codes and regulations regarding
input material also acts as a barrier against foreign entries into the Swedish
market, further shielding the industry from competition.
Exhibit 15

2�1
Highly regulated hiring and firing practices. Hiring and firing practices do not
directly affect employment growth, since the industry structure is so fragmented
that demand variations are handled largely by self-employed workers. However,
as mentioned above, the policies regulating how companies can adjust the
labor force based on the demand situation may have contributed to the high
fragmentation of the industry. Fragmentation, in turn, inhibits labor productivity
growth by forcing many companies to operate below efficient scale.
Weak operational practices. One of the major inhibitors of labor productivity
growth is a lack of operational excellence. This is driven, in part, by the lack
of competition, the existing regulatory restrictions, and labor market barriers.
Due to the project-based characteristics of the industry and the highly
fragmented value chain, operational improvements have been slow, and
process innovation has largely been absent. The effect is that construction
generates large amounts of waste in all steps of the process. It has been
estimated that 20-�0 percent of the total production cost is pure operational
waste which could be eliminated by better execution in the actual construction
phase. Waste results from production errors, lost time, low machine usage,
Exhibit 16

material waste, and theft (Exhibit 17). A construction worker spends less than
one fifth of his/her time on directly value-adding activities, while about one
third is pure waste (Exhibit 1�). In addition, the observed 20-�0 percent of
the cost being waste does not include potential improvements from design
changes to improve the manufacturability. In other industries such design
changes often have an even greater effect than removing operational waste.
The scale of projects has a significant effect on operational performance
since scale enables a higher degree of standardization, repetition of tasks
and lower total building cost (Exhibit 19). The US has a significant share
of larger building programs, which enables lower cost and to some extent
explain the productivity difference versus Sweden (Exhibit 20). However, it is
important to remember that even if projects are of smaller scale it is possible
for companies to increase their institutional learning to improve processes
that are repeated in future projects and thereby increase productivity.
Exhibit 17
2�2

Exhibit 18
2��
Exhibit 19

Construction codes. Earlier codes contained very specific details as to how
a building must be constructed. The new regulations stress the functionality
that must be achieved. Functional codes allow more innovative solutions,
thereby enabling productivity growth. However, with today’s functional codes,
if the contractor is not following the building method advised in the functional
codes, he has to be able to prove that the required functionality will be upheld
during the economic life span of the building. Many smaller companies in
the sector do not have the ability and resources to develop, test and verify
new building methods, so many contractors stick to the old, more rigid
system so as not to risk any liability concerns with the customer. Early in
2006, additional alternative building methods will be added as examples in
the functional code, increasing the flexibility. The Netherlands shows that
changes in construction methods can have significant impact on productivity.
In the Netherlands, higher productivity is reached through simpler designs
that are quicker to build, examples include standardized ways of connecting
houses to the shared public utility infrastructure, installation of central heating
systems under the roof rather than in the basement, (thus radically reducing
chimney requirements), and Dutch window and door frames extending all the
way up to the ceiling, which means that the space between the frame and
Exhibit 20
2�4

the ceiling does not need to be filled. Improved functional codes in Sweden,
cause movement towards simpler designs that can be built more quickly,
which should increase labor productivity.
Lack of EU-wide regulations on construction codes and building materials.
Different standards in different countries inhibit cross-border trade and
protect national markets from new entrants. This has limited the ability of
foreign players to enter Sweden as well as the opportunity to import input
material. The effect is lower competitive pressure and lower price pressure
on these materials, leading to lower productivity. The EU has initiated the
process of developing a common set of rules and regulations. As of 2004,
about 1�0 of the 500 products that are supposed to be standardized by
2007 have European-wide regulations (CE branded). Thus, the effect of the
EU regulations is still limited, but is expected to rise.
Low flexibility in the division of tasks. In Sweden, the division of tasks
among different types of construction workers is very strict. The different
labor unions have agreed on a division of tasks among their members. This
division of tasks causes waste and limits efficient operations. For example,
at least five Swedish workers are required to build a bathroom, while one
single multi-skilled American worker can do all the required tasks. Even if
the specialization somewhat facilitates better efficiency, excessive division
of tasks necessitates many interfaces between different crafts and creates
waste in the interactions (Exhibit 21). The large number of handovers and
waiting times between the end of one task and the beginning of the next
creates significant inefficiencies that in many cases exceed the positive
effects of specialization.
Barriers that predominantly inhibit employment development or job creation are
political decisions, economic development, zoning laws, and rent control. Labor
supply can also be a problem limiting the demand development:
Political decisions and economic development trends have a significant
impact on the size of the sector. Historically, political decisions have created
both ups and downs in demand especially in the residential sector. During
the 1960s and 1970s the “million program” (building of a million dwellings)
created a sharp peak in residential new construction. In the early 1990s a new
peak occurred with the “real estate bubble,” which was followed by the “real
2�5

2�6
estate crises”. Both were caused by economic development and changes in
subsidies to the construction sector. There have also been several periods of
refurbishment subsidies that have affected the size of the sector.
Zoning laws regulate the use of land. Most often a general plan for the land in
a municipality exists, designating residential, industrial and commercial areas
and so on. Before any building licenses are granted, a detailed plan has to
be developed. A detailed plan defines a certain area of land and describes
where certain types of buildings can be constructed, height, facades, where
infrastructure and green areas are needed, etc. The process of developing
or changing a detailed plan can be very long and tedious. Neighbors have
the right to appeal, and often do so. The process of appeal can take up to
2 years for a detailed plan. Once the detailed plan is in place, a building
license has to be granted to the company or individual that plans to construct
a building. Building licenses are not appealed as often as detailed plans, but
when they are, the appeal process can take another 1.5 years. This makes
the process very slow, and the market cannot quickly adapt to increased
demand (Exhibit 22).
Exhibit 21

Rent control is still prevalent in Sweden, limiting the rent a landlord is allowed
to charge to the level of comparable dwellings. This limits the incentives to
build new apartment buildings for rental and puts a downward pressure on
overall demand.
Labor supply was not an issue during most of the 1990s since so many
construction workers were unemployed after the large decline during the real
estate crisis. Today, certain crafts and geographical areas are starting to
experience a shortage of skilled workers, as may be seen in the Stockholm
region. In addition, there is the perception that shortages in some areas will
worsen before they get better.
All in all, the construction sector still suffers from significant barriers across
several dimensions, limiting both labor productivity improvement and job creation.
Because of limited productivity, Swedish customers experience higher prices for
buildings. Consequently, the barriers against labor productivity development
indirectly also affect the demand in the sector, which obviously limits the creation
of new jobs. Several labor market barriers limit the overall development of the
construction sector, and little has been done during the last decade to remove
2�7
Exhibit 22
Current system of appealing a building process consists of three to five steps and can be very time consuming

2��
them. The entry of 10 new members into EU and the EU service directive will
most likely have impact here, but so far the effect has been limited. A final factor,
which does not have a direct impact on either productivity or employment but,
which has had a negative impact on the overall industry, is the inconsistent use
of subsidies, e.g. labor cost subsidies:
Inconsistent labor cost subsidies have created suboptimal behavior in
the sector. This most directly affects the refurbishment sector, where tax
deduction for individuals consuming refurbishment services have been
repeatedly introduced and then removed for the last several years. Many
voices claim that when the subsidy is in place, a significant share of the
informal sector becomes formal; enough to actually over-finance the subsidy.
However, since the subsidy is in place for short but recurring periods, the
market has started to expect the reintroduction of the deduction shortly after
it is removed. This inconsistency creates cyclicality, market imperfections,
and suboptimal behavior, and should consequently be addressed.
KEy DrIvErS GoInG forwArD
The construction industry is likely to face significant change in the future. The
change will be driven by three key trends:
Construction companies are initiating improvement actions that can lead to
higher productivity, thereby reducing prices and boosting both demand and
employment in the sector. Increasingly industrialized building with standardized
modules and prefabrication is an example of an emerging trend that has the
potential to significantly increase productivity in the sector. Another trend
is that construction companies, especially large ones, are taking greater
control of the entire value chain to be able to achieve better control of input
material prices. There are already some examples of construction companies
that integrate vertically upstream in the value chain (e.g., Peab is engaged
in basic materials through Swerock, and Vägverket is engaged in bitumen
trading). Better control does not have to mean vertical integration, but can
be achieved through improved sourcing practices. It is expected that in the
future, construction companies will have an even greater role in segments of
the value chain where competition is poor and prices high.

Changing labor supply conditions. As mentioned above, there are already
certain sub-segments and geographical areas that experience a shortage of
labor. This trend may worsen significantly within a few years since almost a
third of Swedish construction workers are over 50 years old, with 7 percent of
the workers being more than 60 years old. Consequently many workers have
few years left until retirement (Exhibit 2�). A labor shortage may inhibit the
growth of the industry. In addition, and partly driven by the lack of domestic
supply, the influx of construction workers from countries having lower wages
(in particular the 10 new EU members) is likely to increase. As already seen
in the Vaxholm conflict, the magnitude of this influx is yet to be decided.
The Vaxholm conflict is not likely to be resolved before 2007, but the key
question is whether collective agreements will become the standard for
minimum wages. The floor in the agreements is SEK 109 per hour, which is
significantly lower than the current average wage of SEK 1�� for a Swedish
construction worker. Much of the future development will depend on how the
industry and the unions adapt to this – with confrontations or cooperation,
with protectionism or innovation.
2�9
Exhibit 23

240
EU opening the markets. The EU is working on creating common, pan-
European construction codes and building material rules. The current time
table anticipates that the new system will be in place in 2007. This is likely
to make it significantly easier for foreign companies, small and large, to
enter the Swedish market, while also enabling Swedish players to operate
internationally. An example of growing competition from foreign players is
the import of small prefabricated houses, which is already growing at an
extremely high rate, albeit beginning from a very low starting point (Exhibit
24). Combine this with the planned introduction of the new service directive,
and it is likely that the competitive pressure in the construction industry will
increase significantly.
Together these trends will put significant pressure on the different players in the
industry. However, as the low operational performance in the industry shows,
there is significant improvement potential for current players. Such improvements
could be used to counter the upcoming challenges, and should be a top priority
for all incumbents.
Exhibit 24

241
SuMMAry AnD IMPlICAtIonS
Because of its size and importance for the whole country, it is imperative that the
construction industry function more effectively. A well functioning industry would
benefit everybody. Customers would get lower prices, and higher productivity would
make workers more competitive versus labor from countries paying lower wages.
Higher productivity among the workers in Sweden would potentially justify even
higher wages. Companies would benefit from higher demand, and policymakers
would facilitate the building of more dwellings (especially in areas with dwelling
scarcity) and the sector would potentially experience higher employment due to
the increase in demand.
All stakeholders must act
To achieve a well functioning industry and with significant change imminent, all
stakeholders (companies, unions and policymakers) should work on improving
the sector, both through removing existing barriers, and improving internal
operations.
While most other industries have seen the lowering of product market barriers and
increased labor productivity growth, the construction industry is still an industry
with significant barriers and slow productivity development. As mentioned before
several product market barriers in the construction sector inhibit development,
including zoning laws, construction codes, a lack of EU wide regulations, and rent
control. Policy makers can address most of these product market barriers and
enable better productivity development by reducing the regulatory burden and
improving the product markets. Potential actions include simplifying construction
codes, and creating quicker and less cumbersome zoning laws and appeals
processes.
There are also a number of labor market barriers that inhibit labor productivity
improvement and job creation in the Swedish construction sector, such as high
labor cost caused by high tax wedges on labor, low labor flexibility and to some
extent, a lack of labor supply. Policy makers can address most of these barriers,
but some of them require good cooperation between companies and labor unions
to be successfully removed.

242
Besides product and labor market barriers, low operational performance is a
significant productivity barrier. Companies can do some of the improvement but
to really have impact and create operational excellence, both companies and
labor unions have to cooperate to achieve best practice.
Unions may face the largest challenge of the different stakeholders. The
increasing pressure from countries with low wages has already created tensions
and conflicts, and a choice has to be made at the crossroads the union has
reached. One potential way forward is to defend the current position by limiting
the opportunity for foreign workers to enter the Swedish construction industry.
This is the way that seemingly was chosen in Vaxholm, where the union demanded
that the Latvian company signed a collective agreement with wages significantly
higher than the minimum wage, and even higher than the average wage in the
overall Swedish construction sector. The other potential way forward is to work
together with the employers to create operational excellence in the Swedish
construction industry and by doing so significantly increase the value added a
Swedish construction worker can contribute, thereby making Swedish workers
more competitive compared to foreign workers. This would probably require
significant changes in the division of tasks, and in the way wage systems and
incentives are setup. This is a large challenge, but also an opportunity to create
a sustainable competitive advantage for the union’s members where the skills of
the workers become unique and even more valuable for the company. This would
defend the high labor cost differences while simultaneously lowering costs for
customers and promoting demand.
the priority should be to remove the five most important barriers
Among the large number of barriers in the sector, there are obviously those
that are more important and have a larger impact on development than others.
Policymakers can remove the first four barriers but the fifth barrier must be
removed by cooperation between companies and labor unions. The five most
important steps are:
1. reduce the regulatory burden
Current construction codes, zoning laws and appeals processes all add to
the regulatory burden and inhibit productivity and job creation. More simple
construction codes can be created by continuing the transformation from

24�
specific to functional construction codes and by helping companies to
understand how functionality can be achieved. In addition, it is important for
policy makers to create quicker and less cumbersome zoning laws and appeals
processes that can substantially reduce the development time. Therefore,
it is important that policy makers work for easier and shorter bureaucratic
processes. The current proposal to reduce the process of appeal from five to
four steps is a move in the right direction.
2. reduce labor cost
Labor cost in the Swedish construction industry is high. This is driven by
several factors: high tax wedges, high pre-tax wages compared to other blue-
collar workers and union “measurement fees,” where the unions charge fees
for controlling wages and measuring performance, (around 2 percent of gross
wage). High labor cost would be justified if the productivity was correspondingly
high, but as we have seen that is not the case. The same applies to the
measurement fees, which would be justified if they led to improved productivity.
However, there are signs that the fee structure actually limits productivity by
cementing old ways of working. The high labor cost limits demand through
high prices and makes the informal sector flourish. Tax wedges can only be
addressed by policy makers, either by reducing taxes on construction labor in
general or by permanently reinstating the ROT-deduction. As mentioned above
the informal sector is inhibiting the development of more productive formal
companies. By reducing the cost of labor, the incentive for the informal sector
will be reduced and size of the informal sector will decrease. Increased control
and tax audits would also help reduce the informality. A smaller informal
sector increases the possibilities for more productive formal companies to
succeed and increases labor supply by transferring labor from the informal to
the formal sector.
3. reduce material cost by facilitating competition upstream
Several MGI studies have shown that competition and labor productivity
improvement are correlated. In Sweden, the lack of competition in many
upstream sub-segments inhibits the development of the total construction
sector. It should be in the interest of policymakers to increase competition to
improve productivity development in the sector. Swedish policy makers can
facilitate competition in the construction industry by being a driving force in

244
the European effort to remove remaining border barriers for the construction
industry, e.g., facilitating the entry of foreign players, and introducing cross-
European input material regulations. In addition, Sweden could investigate
what existing methods other countries have used to improve competition in
upstream segments and create competition and transparency between different
stages in the value chain and potentially adopt these, alternatively create new
ones. Some countries have tried developing efficient procurement systems
for the construction industry, e.g. Canada, France and Australia. France has a
“two letter system,” applicable in both private and public procurement, where
bidders for a project are required to provide two envelopes, one with technical
descriptions of the project and one with the cost. Based on the technical
descriptions, the customer chooses which offers have a satisfactory technical
solution for the project. For those that have a good technical solution, the
cost envelopes are opened and the offer with the lowest cost gets the job.
This solution may not be the best for Sweden, but is an example of a tool that
has helped increase competition.
4. reduce restrictions in hiring and firing practices
Low labor flexibility contributes to a fragmented industry structure with many
sub-contractors since it is easier to adjust the labor force by hiring and
removing sub-contractors than individual employees. The fragmented industry
structure inhibits scale advantages for companies and thereby inhibits labor
productivity improvement. Policy makers have the opportunity to create less
restrictive hiring and firing rules, which would increase the ability of companies
to adjust the labor force according to demand fluctuations and thereby create
the prerequisites for an improved industry structure. The opportunity for
companies to grow and benefit from better scale economies would thereby
be improved.
5. Improve operational performance
The Swedish construction industry has low levels of operational performances
with large amounts of waste in production. Increasing competition will most
likely force companies to improve operational efficiency. With the industry’s
large potential for operational improvement, companies should be able to
make significant improvements in operational excellence to reduce waste
and increase productivity. Companies should improve co-operation with labor

245
unions to significantly change the way the work is performed. Priorities are
likely to be the organization of tasks (allowing greater flexibility of worker tasks
and creating more multi-skilled workers), improved purchasing strategies
(breaking up oligopolies and leveraging European suppliers), and improved
design to manufacturing (optimizing cost-benefit of materials, increasing
modular design, and using design-to-assembly). The wage system should
also be modernized to move away from today’s accord wage with its periodic
renegotiations which create inflexibility in operations and limit productivity
without adding any real value.
Improved operational performance can also be created by increasing the
scale of projects. The Swedish construction sector significantly lags the US
construction industry in project scale, which inhibits productivity development.
If building companies are not working to increase the scale of projects,
policymakers have the opportunity to do so, e.g. by incorporating scale of the
building projects in the development of detailed plans, increasing competition
and/or subsidizing large scale projects. The US and the Netherlands are
examples of countries where large scale projects are used successfully. In
the Netherlands this is mainly a result of governmental support. Large-scale
plans are developed for expanding urban areas and the construction in these
areas is connected to a subsidy that the local government receives when
construction has begun. Again, this particular solution may not be the way for
Sweden, but is an example of how to create productivity gains by promoting
large-scale construction projects.

246

Technical Notes: MethodologyThe purpose of these technical notes is to provide an overview of our analytical
approach. We have not attempted to be exhaustive; we aim instead to highlight
the principal inputs and assumptions on which our methodology is built. This
chapter has two sections:
Methodology for productivity calculations discusses how productivity is
measured and what main data sources have been used.
Methodological considerations in the individual sectors discusses the
specific sector studies and how the overall methodology has been adapted to
the conditions in each sector.
MEtHoDoloGy for ProDuCtIvIty CAlCulAtIonS
MGI has a long history of productivity studies at the industry level across many
different countries and industries. The methodology has been developed together
with Martin Baily from the Institute for International Economics and other leading
academics. The approach is based on established economic theory, combined
with the business experience of McKinsey’s global consulting practice.
While productivity fundamentally describes the relation between input and
output, there are many ways to measure it. The chosen productivity measure
for this report is labor productivity, defined as the relation between output and
the amount of labor input needed to produce it. Even though there are other,
more complex, measures, labor productivity was preferred due to its widespread
use and the close linkage to national accounts. Using a generally understood
247

24�
productivity measure places the focus on the implications rather than the method
itself. Following the definition, there are two ways to increase productivity; either
reducing the labor input needed in the production or increasing the output given
a certain level of labor input.
Calculating labor productivity within a country
The labor productivity within a country is calculated as the output value divided
by the input value:
Output is measured as value added. It is defined as the value of the output
minus the value of the intermediary input used. One advantage of value added
as an output measure is the ability to compensate for vertical integration or
quality differences of the output. Value added by industry sector is found in
annual national accounts and calculated at fixed prices typically using industry
specific deflation of both input and output values. (For retail banking, and
partly in retailing, physical output measures have been used; see industry
sector specific methodological notes for a more complete discussion).
Labor input is measured as total hours worked. The hours worked are found
in national statistics and are typically derived from labor force surveys. Often
the average number of hours worked per year per person engaged in the
industry is multiplied by the number of people engaged to calculate the total
hours worked.
A coherent set of cross-country data is used. To get a coherent data set
and allow for cross-country comparisons, the 60-Industry Database (October
2005) from Groningen Growth and Development Centre (GGDC) has been
used as the primary data source. It is built upon the OECD STAN database, to
which are added annual national accounts and industry specific data sources
from each country respectively. The design of the 60-Industry Database makes
industry sector comparisons among countries possible. In some cases,
data for a specific industry and country was not available for a particular
time period, in which case assumptions were made based on the available
data. Consequently, there are some differences with national accounts data,
but when found, these were not large enough to distort the picture. A more
detailed description of methodology, sources and the actual datasets are
available at www.ggdc.nl.

249
Comparing productivity levels among countries
In order to make cross-country comparisons of GDP and value added, Purchasing
Power Parities (PPPs) are used to adjust for differences in price levels. The PPPs
are constructed by OECD and Eurostat in large price benchmarking studies,
looking at baskets of goods and services in each country. When the labor
productivity of an industry sector is analyzed across countries, industry-specific
PPPs need to be used. There are initiatives that try to establish industry-specific
PPPs, e.g., GGDC’s International Comparisons of Output and Productivity (ICOP)
project started by Angus Maddison. However, there are still large gaps in the
coverage of industries and countries.
this study’s approach to cross-country comparisons
The main objective of this study is to analyze the recent development of the
Swedish economy in order to understand what the most important drivers of
future development will be. Consequently, focus has been on the productivity
development rather than the absolute levels. However, thanks to an earlier MGI
study, it has also been possible to estimate relative cross-country productivity
levels. The approach is to combine an already established starting point of
relative productivity levels with the subsequent productivity development:
Starting point. In the early 1990s, MGI conducted primary research on the
productivity levels of several Swedish industry sectors and how they compared
to the same sectors in a set of peer countries. The results were published in
a report in 1995. Processed food, automotive, construction, retail, and retail
banking were all part of the study. The overall approach in processed food,
automotive and construction was to calculate labor productivity based on
national accounts and manufacturing census data. The value added was then
converted into a common currency by using industry-specific PPPs. For retail
and retail banking, productivity was calculated based on store format mix and
output of financial products, respectively.
Productivity development. With the exception of retail banking, the productivity
development since the endpoint of the 1995 study is calculated by using
the labor productivity growth in the Groningen 60 Industry Database. The
growth numbers are cross-verified against other sources and used in the
qualitative analysis of the industry sector’s development. The purpose is to

250
further understand the drivers of productivity and employment. Focus has
been on Swedish development and conditions. However, thanks to experts
and professionals in the global McKinsey network, the understanding of
international benchmarks and trends has played an important part in the
individual sector analyses, as well as in the overall synthesis.
Today’s productivity levels. By combining the starting point and the growth
numbers, today’s relative productivity levels can be estimated. Retail banking
is the exception, where the productivity level is established by looking directly
at physical output measures. The main reason behind this is the difficulty of
constructing a high-quality retail banking deflator and industry PPP.
MEtHoDoloGICAl ConSIDErAtIonS In tHE InDIvIDuAl SECtorS
The overall methodology is basically the same for the majority of sector studies.
However, some adjustments are made based on conditions in the sector:
Automotive. The starting point of the 1992 (199� for Sweden) productivity
levels for the automotive industry was established based on manufacturing
census data. Output was measured as value added, defined as the value
of goods produced less the cost of materials and energy used to produce
them. The automotive industry PPP was calculated based on industry data
of individual price differences between the studied countries. The input
measure used was hours worked, also taken from manufacturing census.
The development between 1992 and 200� is taken from the Groningen 60
Industry Database. In addition to census and national accounts, individual
company labor productivity was calculated based on annual reports both in
the previous MGI study, as well as in this study.
Retail. In services such as retail, product-to-product comparisons needed to
calculate the PPPs are more difficult to construct. Instead, the productivity
levels in 1992 were estimated for general merchandise retailing by assuming
that different store formats have the same productivity across countries. The
productivity of various retail formats in the United States was calculated, and
data on share of employment working in different store formats was used to
estimate relative productivity for each country respectively. The development
between 1992 and 200� is for the whole retailing business and is taken from
the Groningen 60 Industry Database.

251
Retail banking. As pointed out earlier, it is difficult to calculate relevant deflators
and PPPs for retail banking. Instead, the relative productivity levels of 2002
have been calculated based on output of a number of financial products and
transactions. Using a physical output indicator allows an examination of the
technical efficiency of the industry, i.e., performance excluding price effects.
This study uses retail banking productivity indices that have been calculated
by dividing an aggregate output index by a corresponding input index. The
approach has been developed by MGI and the McKinsey European Financial
Institutions Center. The details of this approach are further explained in the
retail banking sector study.
Processed food. The starting point of 1990 productivity levels was established
for the processed food sector by using value added and hours worked from
manufacturing census. The industry (factory gate) PPP was generated by
using OECD final expenditure PPP adjusted for differences in value-added
taxes and total wholesale and retail distribution margins. The input used
was hours worked, which was also found in manufacturing census data.
The development between 1990 and 200� is for the total processed food,
tobacco and beverages industry, and is taken from the Groningen 60-Industry
Database.
Construction. The starting point of 1990 productivity levels was established
based on national accounts data. Output was measured as value added and
input was number of employees adjusted with average hours worked per
person based on household surveys. To get consistent data, OECD annual
national accounts were used as the primary data source. The industry PPP
was calculated based on the OECD final expenditure PPP adjusted for price
differences in construction output. The development between 1990 and 200�
is taken from the Groningen 60-Industry Database.

McKinsey Global Institute06/04/04Copyright © McKinsey & Companywww.mckinsey.com/knowledge/mgiDesign by New Media, McKinsey & Company, Sydney


