53
Swimming in a Fishbowl: Holding your agency accountable for its work Karen Finn, Senior Consultant www.resultsleadership.org [email protected]
| Date post: | 22-Dec-2015 |
| Category: |
Documents |
| Upload: | marcia-webb |
| View: | 220 times |
| Download: | 1 times |
Swimming in a Fishbowl: Holding your agency accountable for its
work
Karen Finn, Senior Consultant

Use your imagination for a minute:
It is the year 2015 and your organization has just been awarded the “Community Program of the Year Award” by the National Human Services Assembly because of of the significant impact your organization has made on the lives of the people and community that you serve. Your organization is featured on the front page of Time Magazine because of this award. What would your headline say?


What problems have you encountered with accountability?
Not having data to show how well my program is working
Being overwhelmed by too much data
My program being held accountable for improvement on a community level
Using a complicated system that I don’t understand

USEFUL TO MANAGERS
SIMPLE
COMMON SENSE
PLAIN LANGUAGE

What is Results-Based Accountability
(RBA)?A disciplined way of thinking and
taking action that:
•Communities can use to improve the lives of children, youth, adults,
families and the community as a whole.
• Agencies can use to improve the performance of programs and the
agency as a whole.

Based on the work of Mark Friedman:
WEBSITES:
www.raguide.orgwww.resultsaccountability.com
BOOK and DVD ORDERS: www.trafford.comwww.resultsleadership.org

RBA in a Nutshell2 – 3 – 7
2 Kinds of Accountability plus Language Discipline• Population- or Community-Level Quality of Life
• (Results & Indicators)• Performance- or Program-Level
• (Performance Measures)
3 Kinds of Performance Measures• How much did we do?• How well did we do it?• Is anyone better off?
7 Questions From Ends to Means (In less than an hour)
8
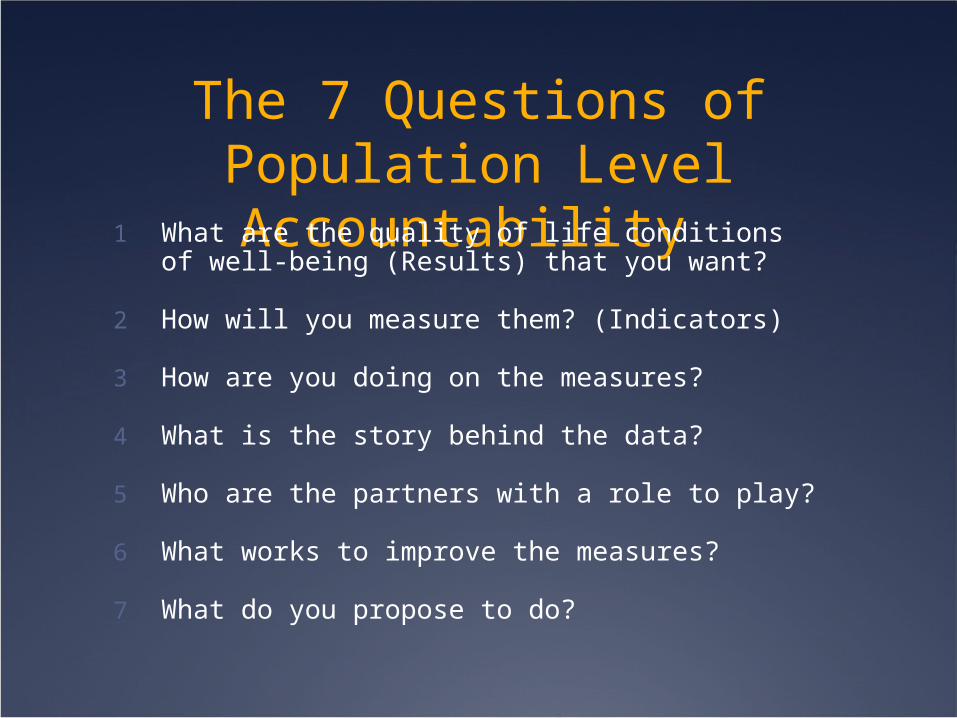
The 7 Questions of Population Level Accountability
1 What are the quality of life conditions of well-being (Results) that you want?
2 How will you measure them? (Indicators)
3 How are you doing on the measures?
4 What is the story behind the data?
5 Who are the partners with a role to play?
6 What works to improve the measures?
7 What do you propose to do?

The 7 Questions of Performance Accountability:
1 Who are your customers?
2 How can you measure if your customers are better off?
3 How can you measure if you are delivering service well?
4 How are you doing on these measures? What is the story behind the data?
5 Who are the partners with a role to play to help you do better?
6 What works?
7 What do you propose to do?

Results Accountabilityis made up of two parts:
Performance Accountabilityabout the well-being of
CLIENT POPULATIONSFor Programs – Agencies – and Service Systems
Population Accountabilityabout the well-being of
WHOLE POPULATIONSFor Communities – Cities – Counties – States - Nations

DEFINITIONSRESULT
INDICATOR
PERFORMANCE MEASURE
Babies born healthy, Children succeeding in school, Safe communities, Clean Environment, Prosperous Economy
Rate of low-birthweight babies, Rate of high school graduation, crime rate, air quality index, unemployment rate
1. How much did we do? 2. How well did we do it?
3. Is anyone better off?
A condition of well-being for children, adults, families or communities.
A measure which helps quantify the achievement of a result.
A measure of how well a program, agency or service systemis working. Three types:
= Customer Results or Outcomes

13
However beautiful However beautiful the strategy, the strategy,
you should occasionally you should occasionally look at the look at the resultsresults..
Winston ChurchillWinston Churchill

From Ends to MeansFrom Talk to Action
ENDS
MEANS
RESULT
INDICATOR
PERFORMANCE MEASURE
Customer result = EndsService delivery = Means
From Talk to Action

RLG 15
Mental Models:
Deeply ingrained assumptions, generalizations, or even pictures or
images that influence how we understand the world and how we
take action.
Peter Senge, The Fifth Discipline

RLG 16
Noteworthy Mental Models

RLG 17
Other Noteworthy Mental Models
"Who the hell wants to hear actors talk?"
H.M. Warner, Warner Brothers, 1927.
"This 'telephone' has too many shortcomings to be seriously considered as a means of communication. The device is inherently of no value to us."
Western Union internal memo, 1876.
"We don't like their sound, and guitar music is on the way out.“
Decca Recording Co. rejecting the Beatles, 1962.
There is no reason anyone would want a computer in their home."
Ken Olson, president, chairman and founder of Digital Equipment Corp., 1977

FPSI/RLG 18
Select the Right Strategy: Automotive Crossing of Water

FPSI/RLG 19
Right Implementation?

Performance Accountability
For Programs, Agencies and Service Systems

21
As a manager, if you wanted to make the headline a reality in
2015:
1.1. What information would you What information would you want to have? want to have?
2.2. How would you use this How would you use this information?information?

22
Performance Measures
1. How much do you do?Who are our customers (the people receiving our services) and what
services do we provide to them?
2. How well did do you do it? What is the quality of the services we provide?
3. Is anyone better off?What is the desired impact of those services for/on
the people using our services?

How much did we do?
Program Performance Measures
How welldid we do it?
Is anyonebetter off?
Quantity Quality
Effe
ct
Effo
rt
# %

FPSI/RLG 24
Selecting Headline Performance Measures
How much did we do?
# Clients/customers served
# Activities (by typeof activity)

How much did we do?
Education
How well did we do it?
Is anyone better off?
Quantity Quality
Effe
ct
E
ffort
Number ofstudents
Number of classes provided
Student-teacherratio
Percent of 9th graders whoenter college or
employment after graduation
Number of 9th graders whoenter college or
employment after graduation

FPSI/RLG 26
Selecting Headline Performance Measures
How much did we do?How well did we do it?
% Common measurese.g. workload ratio, staff turnover rate, % staff fully trained, unit cost, worker
safety
% Activity-specific measurese.g. % timely, % standards met

How much did we do?
Senior Tenant Services
How well did we do it?
Is anyone better off?
Number oftenants served
Percent of tenants reporting
satisfaction with case manager
Number of tenants who report feeling safe
Number of tenants with depression
Percent of tenants reporting feeling safe.
Percent of tenants with depression
Quantity Quality
Effe
ct
E
ffort

FPSI/RLG 28
Selecting Headline Performance Measures
How well did we do it?
Is anyone better off?
#/% Skills / Knowledge
#/% Attitude
#/% Behavior
#/% Circumstance
How much did we do?

How much did we do?
Drug/Alcohol Treatment Program
How well did we do it?
Is anyone better off?
Number ofpersonstreated
Percent ofstaff withtraining/
certification
Number of clientsoff of alcohol & drugs - at exit - 12 months after exit
Percent of clientsoff of alcohol & drugs - at exit - 12 months after exit
Quantity Quality
Effe
ct
E
ffort

How much did we do?
After School Program for Middle School Boys
How well did we do it?
Is anyone better off?
Quantity Quality
Effe
ct
E
ffort Number of boys
attending per week
% of staff certified in
Youth Worker Methods
% of boys with improved decision-
making skills
% of boys maintaining a healthy weight
Number of boys with improved decision-
making skills
Number of boys maintaining a healthy
weight

31
Story behind the baseline
Partners (with a role to play in turning the curve)
What Works
Action Plan (w/ Budget)
Agency/Division/Branch/Program
Performance MeasureBaseline
How are we doing?
Why?
Help?
Options?
Results-Based Decision Making: Talk to Action
Propose to do?

32
Story behind the baseline
Partners (with a role to play in turning the curve)
What Works
Action Plan (w/ Budget)
Middle School After School Nutrition Program
% of boys maintaining a healthy weight
Results-Based Decision Making: Talk to Action
How are we doing?

33
Story behind the baseline
Partners (with a role to play in turning the curve)
What Works
Action Plan (w/ Budget)
Middle School After School Nutrition Program
% of boys maintaining a healthy weight
Why?
Results-Based Decision Making: Talk to Action
How are we doing?

34
The Story Behind the Baseline
The Story Behind the Baseline Key Factors/Causes?
Root Causes (Ask “Why?” 3 times)
Prioritize – which are the most important to address to “turn the curve” of the
trend line? Research Agenda?

35
Story behind the baseline
Partners (with a role to play in turning the curve)
What Works
Action Plan (w/ Budget)
Middle School After School Nutrition Program
% of boys maintaining a healthy weight
Why?
Help?
Results-Based Decision Making: Talk to Action
How are we doing?

36
PartnersPartners
Who are partners who may have a role to play in
turning the curve?
Does the story behind the curve suggest any new
partners?

37
Story behind the baseline
Partners (with a role to play in turning the curve)
What Works
Action Plan (w/ Budget)
Middle School After School Nutrition Program
% of boys maintaining a healthy weight
Why?
Help?
Options?
Results-Based Decision Making: Talk to Action
How are we doing?

38
What WorksWhat Works
Brainstorm options for actions to
“turn the curve”?
Low-cost/no-cost?
Off-the-wall ideas?
Passionately sell your idea

39
Story behind the baseline
Partners (with a role to play in turning the curve)
What Works
Action Plan (w/ Budget)
Middle School After School Nutrition Program
% of boys maintaining a healthy weight
Why?
Help?
Options?
Results-Based Decision Making: Talk to Action
Propose to do?
How are we doing?

40
Action PlanAction Plan
Leverage: will turn the curve of the baseline?
Feasible and Affordable? Specific: who, what, when,
where, how? Consistent with values?

POPULATIONACCOUNTABILITY
For Whole Populationsin a Geographic Area
42
Start With EndsStart With Ends Start With EndsStart With Ends

43
WORK BACKWARDS WORK BACKWARDS
TO MEANSTO MEANS
(Data-driven and transparent decision making)
WORK BACKWARDS WORK BACKWARDS
TO MEANSTO MEANS
(Data-driven and transparent decision making)

The 7 Questions of Population Level Accountability
1 What are the quality of life conditions of well-being (Results) that you want?
2 How will you measure them? (Indicators)
3 How are you doing on the measures?
4 What is the story behind the data?
5 Who are the partners with a role to play?
6 What works to improve the measures?
7 What do you propose to do?

Maryland Child Well-Being Results
Babies born healthy
Healthy children
Children enter school ready to learn
Children are successful in school
Children completing school
Children safe in their families and communities
Stable and economically independent families
Communities that support family life
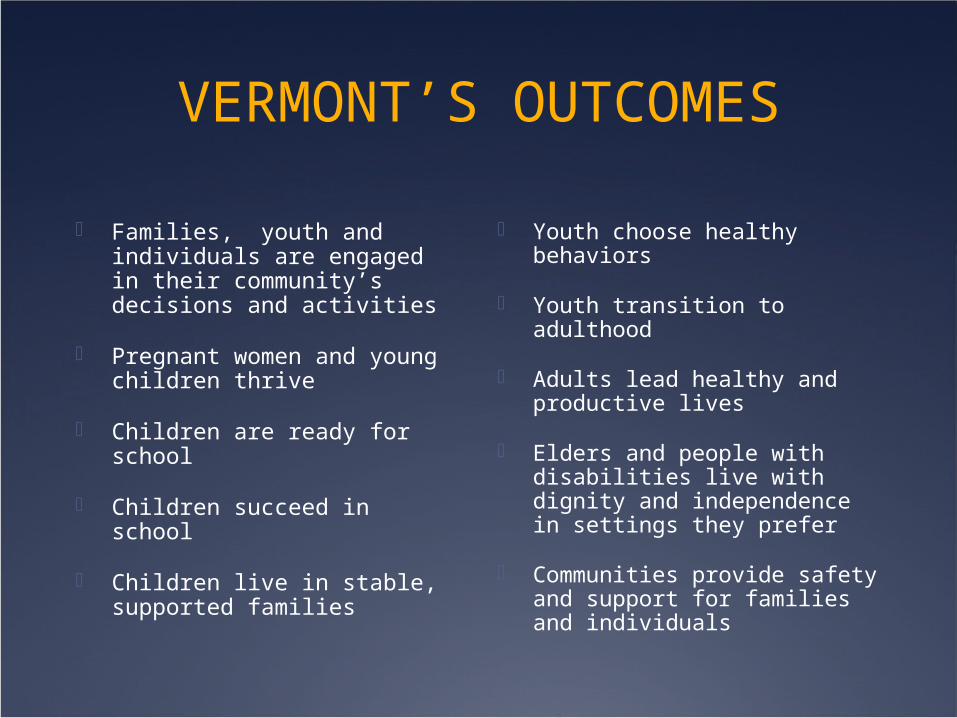
VERMONT’S OUTCOMES
Families, youth and individuals are engaged in their community’s decisions and activities
Pregnant women and young children thrive
Children are ready for school
Children succeed in school
Children live in stable, supported families
Youth choose healthy behaviors
Youth transition to adulthood
Adults lead healthy and productive lives
Elders and people with disabilities live with dignity and independence in settings they prefer
Communities provide safety and support for families and individuals

United Ways
Greater Lehigh Valley: Children healthy and
ready to learn Youth succeed in school Older adults aging
successfully Strong families and vital
neighborhoods
Westchester and Putnam New York: Young children enter
school prepared to achieve;
Children and youth make healthy and safe decisions;
Children and youth are academically successful

Slide courtesy of Phil Lee
Population & Result:
Indicator
Story behind the baseline
Partners
Population Accountability: Talk to Action
Start at the End
Work Backwards
to Means
Strategy---------------------------------------------------------------------------------
What Works

FPSI/RLG 49
Children and Youth have optimal physical and emotional health
Comprehensive Strategy/Partners
After School ProgramPerformance Measures
Health Department Performance Measures
END
MEA
NS
Indicator: Obesity Rate Population Accountability
Perform
ance
AccountabilityPerformance
Accountability

Every timeyou make apresentation,
use atwo-partapproach
Result: to which you contribute to most directly.
Indicators:
Story:
Partners:
What would it take?:
Your Role: as part of a larger strategy.
Population Accountability
Program:Performance measures:
Story:
Partners:
Action plan to get better:
Performance Accountability
Your Role
50

Acknowledgements: Many of these materials draw from the work of:
Mark Friedman, Founder of the Fiscal Policies Study Institute and author of “Trying Hard is Not Good Enough” www.raguide.org www.resultsaccountability.com
Phil Lee, Founder and President of the Results Leadership Group: www.resultsleadership.org

Other References and Interesting Reading:
Edward DeBono: Six Hats Thinking
Peter Senge (et.al): The Fifth Discipline and the Fifth Discipline Fieldbook
Margaret Wheatley: Finding our way: Leadership for uncertain times Margaret Wheatley with Myron Rogers: The uses
and abuses of measurement. In: Finding our way, Leadership for uncertain times (p. 156-162)

Contact Information:
Karen Finn, Senior Consultant
Results Leadership Group, LLC
www.resultsleadership.org
301-907-7541


