Page 1
Swiss Software Industry Survey 2019
THOMAS HURNI, CORINNA RUTSCHI, AND JENS DIBBERN INSTITUTE OF INFORMATION SYSTEMS - INFORMATION ENGINEERING
A Study of the University of Bern on behalf of ICTswitzerland
November 2019
Current State, Emerging Trends, and Long-term developments
in the Swiss Software Industry
Page 2
Principal:
ICTswitzerland
Aarbergergasse 30
CH - 3011 Bern
Authors:
Corinna Rutschi
Dr. Thomas Hurni
Prof. Dr. Jens Dibbern
University of Bern
Institute of Information Systems
Department of Information Engineering
Engehaldenstrasse 8
CH - 3012 Bern
www.iwi.unibe.ch
Substantial and methodological partners:
ICTswitzerland
Dr. Pascal Sieber & Partners AG
Institut für Wirtschaftsstudien Basel
Tran Engineering
Promotional partners:
inside-it.ch
topsoft
SWICO
Alp ICT
Editorial support:
Nicolas Mayr von Baldegg
Stephanie Elliott
Maximilian Walser
Gowthaman Udayakumar
Jessica Zurbriggen
Anna Filippova
Louis Felder
Picture Credits:
Cover: Pexels.com; 4: Pexels.com; 6: Pexels.com; 13: Pexels.com; 16: Pexels.com; 27: Pexels.com
Bern, November 2019
Note regarding use :
No use of this publication may be made for resale
or any other commercial purpose whatsoever.
Additional remarks:
The report reflects the view of the authors which
does not necessarily correspond with the views of
the principal or of the support group.
Page 3
Swiss Software Industry Survey 2019 3
Preface
The fifth edition of the Swiss Software Industry Survey (SSIS), the
most extensive study of its kind in Switzerland, provides you with
comprehensive information about the current state, emerging
trends, and long-term developments of the Swiss software industry.
As in previous years, our goal was to be as close as possible to the
Swiss software industry and the people who shape it. To this end,
we conducted a workshop with representatives of the Swiss soft-
ware industry and used their feedback to optimize our question-
naire. The highly valuable feedback from this workshop, however,
not only helped us to optimize the SSIS as a whole but also served
as valuable input for the design of this year’s two special topics. The
first of these two special topics focuses on the productivity of the
Swiss software industry, thus on a central aspect in an increasingly
competitive environment. Here we show what measures Swiss soft-
ware companies are taking to increase their productivity. Besides,
we illustrate what changes Swiss software companies expect to see
in the sources of their revenues over the next three years. The sec-
ond special topic focuses on public tenders. Here we show the rea-
sons why Swiss software companies participate in public tenders or
explicitly refrain from doing so. We also illustrate the importance of
public tenders for individual subindustries and the major regions of
Switzerland.
This year, we again improved our SSIS benchmarking website to
provide a unique service to our participants. The SSIS benchmarking
website has become central to our value proposition, as it delivers
actionable information for participating companies. As an additional
incentive, we were able to offer participating companies, which
shared all key figures with us, a voucher for a free job advertise-
ment on ictjobs.ch. We thank our partner inside-it.ch for this oppor-
tunity.
The SSIS would not be possible without the long-term support of
our partners, in particular, ICTswitzerland, the principal of the
study, and Sieber & Partners. We want to thank ICTswitzerland,
Sieber & Partners, and all other partners for their continued sup-
port.
Finally, we would like to thank Thomas Huber for his many years of
commitment to the SSIS. Thomas Huber was appointed Assistant
Professor at the ESSEC Business School in Paris. Corinna Rutschi
joined the SSIS team this year and therewith completes our team.
We hope you enjoy reading this report!
Corinna Rutschi
Dr. Thomas Hurni
Prof. Jens Dibbern
Editorial
Corinna Rutschi
Dr. Thomas Hurni
Prof. Dr. Jens Dibbern
Page 4
Swiss Software Industry Survey 2019 4
Preface
5 Executive Summary
6 Revenue, Profitability & Future Growth
13 Sources of Revenue
16 Internationalization & Sourcing
20 Productivity
24 Public Tenders
27 About the SSIS 2019
Page 5
Swiss Software Industry Survey 2019 5
The EBIT margin of the Swiss software industry improved by 1.5 percentage points compared to the previ-
ous year and now amounts to 8.2%.This growing EBIT margin is reflected in the increase in revenues per
employee from CHF 221’098.4 in 2017 to CHF 225’498.9 in 2018. These positive developments result in a
more optimistic outlook for 2019 and 2020: For this year, a growth in revenues of 9.5% and an increase in
the number of employees of 11.6% are expected.
Growing EBIT Margins and Revenues per Employee
Executive Summary
2018 was a successful year for the Swiss software industry. The industry-wide revenue per employee rose from CHF
221’098.4 in 2017 to CHF 225’498.9 in 2018 and the industry-wide EBIT margin from 6.7% in 2017 to 8.2% in 2018. Due
to these positive developments, Swiss software companies are more optimistic about the future. Both the expected
growth of revenues (i.e., 9.5% in 2019 and 11.3% in 2020) and employees (i.e., 11.6% for 2019 and 14.9% for 2020) is
higher than in the previous year. Also, software companies are trying to become more productive through process opti-
mization and employee development.
Executive Summary
Swiss software companies expect cloud solutions to gain in importance by 2021. The share of cloud solu-
tions in industry sales is expected to rise from 7.5% today to 11.5% in 2021. According to expectations,
this increase will be at the expense of the development of custom software. Here a reduction of 5.2 per-
centage points in the share of industry revenue is expected by 2021. This development indicates that the
industry will increasingly focus on more scalable products and services.
Shift Towards Cloud
Swiss software companies find themselves in an increasingly international competitive environment. To
survive in this environment, they invest in productivity-enhancing measures. By far the most important
measures concern existing processes that are optimized, agilitized, automatized and/or digitalized. Be-
sides, Swiss software companies also invest heavily in the development of their workforce and infrastruc-
ture, in adapting their product and service portfolios, and in improving their knowledge management.
Productivity: Do Things Better
The Swiss software industry generates about 17% of its revenue from contracts awarded in compliance
with WTO rules. Such contracts are particularly relevant for software companies from the Espace Mittel-
land and for consulting companies. The most important reason why Swiss software companies explicitly
refrain from participating in WTO-compliant tenders is the high cost in relation to the expected return.
The most important reason for participation is the attractiveness of such contracts.
Public Tenders
Page 6
Swiss Software Industry Survey 2019 6
Revenue, Profitability & Future Growth
Spotlight on
Page 7
Swiss Software Industry Survey 2019 7
Distribution of Participating Companies
Figure 1: Number of companies per subindustry as percentage of total responses
Source: SSIS 2019
Spotlight on Revenue, Profitability and Future Growth
As in previous years, custom software manufacturers
and standard software manufacturers dominate our
sample. Both subindustries account for about one third
of the answers. Consulting companies (12.4%), software
integrators (8.5%), and technology and service provid-
ers (6.4%) follow at some distance (see Figure 1).
To make valid statements about the Swiss software in-
dustry as a whole, we post-stratified our sample. This
statistical procedure compares our sample with the
software industry as a whole by taking into account offi-
cial statistics on regions, subindustries, company sizes,
and revenues. If this procedure finds that individual
participating companies are under-represented in our
sample, then it assigns them higher weights to adjust
for biases. The advantage of this procedure is that state-
ments about the industry as a whole become more reli-
able. Moreover, the SSIS 2019 is backward compatible
as we have applied the same statistical procedure to the
samples of the SSIS in 2017 and 2018. The figures in this
report are therefore comparable to those in the previ-
ous two reports.
Figure 2 shows that consulting companies are the main
contributors to industry revenue (43.3%), followed by
manufacturers of custom software (24.4%) and stand-
ard software (24.0%). Together, these three sub-
industries account for more than 90.0% of the industry
revenue.
Given that software companies usually operate in a
wide variety of fields, i.e., consulting companies do not
only ‘consult’ but also create revenue through other
activities such as custom software development or soft-
ware integration. Figure 3 considers this diversity by
showing the revenues by activity. Here, consulting
(22.6%), standard (23.5%) and custom software manu-
facturing (32.2%) contribute most significantly to the
industry revenue. Interestingly, Figure 3 shows that
across all companies, more than 50.0% of the industry
revenue is created through the development of soft-
ware (standard and custom).
Sample, Projection Method, and Industry Revenue
N = 484
Standard software manufacturer (including SaaS)
33.1%
Custom software manufacturer29.3%
Consulting12.4%
Software integrator
8.5%
Technology and service providers6.4%
Other
10.3%
Page 8
Swiss Software Industry Survey 2019 8
Distribution of Revenue per Subindustry
Figure 2: Revenue per subindustry as percentage of industry revenue
Spotlight on Revenue, Profitability and Future Growth
Distribution of Revenue per Activity
Figure 3: Revenue per field of activity as percentage of industry revenue
Source: SSIS 2019 N = 191
Source: SSIS 2019 N = 191
Consulting43.3%
Custom software manufacturer24.4%
Standard software manufacturer (including SaaS)
24.0%
Software integrator2.0%
Technology and service providers1.6%
Other4.6%
Custom software manufacturing32.2%
Standard software manufacturing (including SaaS)
23.5%
Consulting22.6%
Software integration10.6%
Providing software-related mainteneance services3.8%
Other7.2%
Page 9
Swiss Software Industry Survey 2019 9
Spotlight on Revenue, Profitability and Future Growth
Revenue per Employee
Figure 4: Average revenue per employee
Source: SSIS 2019 N = 190
Figure 4 shows the revenue per employee in 2018 com-
pared to 2017. Overall, the revenue per employee in-
creased slightly to CHF 225’498.9 in 2018 compared to
CHF 221’098.4 in 2017. As in previous years, manufac-
turers of custom software generated the lowest reve-
nue per employee (CHF 189’246.3), followed by tech-
nology and service providers (CHF 239’221.1), con-
sulting companies (CHF 241’173.9), standard software
manufacturers (CHF 248’156.3), and software integra-
tors (CHF 252’597.4).
Figure 5 shows the distribution of employees. It mirrors
the distribution of revenues, i.e., consulting companies
(33.6%), custom software manufacturers (31.5%), and
standard software manufacturers (25.5%) account for
more than 90.0% of the industry’s employees.
Higher Revenues per Employee
Distribution of Employees
Figure 5: Number of employees per subindustry as percentage of total employees
Source: SSIS 2019 N = 191
Consulting
33.6%
Custom software manufacturer31.5%
Standard software manufacturer
(including SaaS)
25.5%
Software integrator2.6%
Technology and service providers1.9%
Other
4.9%
CH
F 1
81
’86
3.8
CH
F 2
31
’48
4.4
CH
F 2
38
’61
5.1
CH
F 2
55
’21
1.0
CH
F 2
64
’26
5.1
CH
F 2
21
’09
8.4
CH
F 1
89
’24
6.3
CH
F 2
48
’15
6.3
CHF
241’
173.
9
CH
F 2
52
’59
7.4
CH
F 2
39
’22
1.1
CH
F 2
25
’49
8.9
CHF -
CHF 50’000.0
CHF 100’000.0
CHF 150’000.0
CHF 200’000.0
CHF 250’000.0
CHF 300’000.0
Custom softwaremanufacturer
Standard softwaremanufacturer
(including SaaS)
Consulting Softwareintegrator
Technology andservice providers
Software Industry
2017 2018
Page 10
Swiss Software Industry Survey 2019 10
Spotlight on Spotlight on Revenue, Profitability and Future Growth
Figure 6 shows the EBIT margins of the subindustries
with an industry-wide increase from 6.7% in 2017 to
8.2% in 2018. This upward trend applies to all subindus-
tries, with the exception of standard software manufac-
turers, which generated a lower margin (from 9.1% in
2017 to 4.8% in 2018).
Figure 7 shows the EBIT margins by activities. This figure
reflects broadly the same pattern as Figure 6: compared
to the previous year, profitability has increased overall.
Again, this increase is shown in almost all activities, ex-
cept for standard software manufacturing and software
integration, which have both decreased in profitability.
Increasing EBIT Margins
EBIT Margins in the Swiss Software Industry
Figure 6: EBIT margins by subindustries
Source: SSIS 2019 N = 171
EBIT Margins per Activity
Figure 7: EBIT margins per activity
Source: SSIS 2019 N = 171
5.5%
9.1%
6.7%7.5%
5.3%
6.7%
7.8%
4.6%
10.1%9.4%
6.8%
8.2%
0.0%
2.0%
4.0%
6.0%
8.0%
10.0%
12.0%
Custom softwaremanufacturer
Standard softwaremanufacturer
(including SaaS)
Consulting Software integrator Technology andservice providers
Software Industry
2017 2018
6.1%
8.0%
5.9%
8.5%
5.0%
6.7%
8.4%
4.4%
11.3%
7.7%6.6%
8.2%
0.0%
2.0%
4.0%
6.0%
8.0%
10.0%
12.0%
Custom softwaremanufacturing
Standard softwaremanufacturing(including SaaS)
Consulting Software integration Technology andservice provision
Software Industry
2017 2018
Page 11
Swiss Software Industry Survey 2019 11
Expected Growth in Revenue
Figure 8: Expected year-over-year revenue growth for 2019 and 2020
Spotlight on Revenue, Profitability and Future Growth
Source: SSIS 2019 N = 189
Research and Development Investments
Figure 9: R&D investments in 2017 and 2018 as percentage of revenue
Figure 8 shows the positive revenue expectations of the
Swiss software industry. Compared to the moderate
expectations of the previous year, Swiss software com-
panies now expect a growth of 9.5% in 2019 and even
11.3% in the following year. In 2019, standard software
manufacturers expect the highest revenue growth
(10.8%), followed by software integrators (10.4%), con-
sulting firms (10.1%), custom software manufacturers
(8.9%), and technology and service providers (8.0%).
Overall, this leads to the assumption that the Swiss soft-
ware industry is optimistic about the future.
Optimistic Growth Expectations
Across all subindustries, Swiss software companies have
invested less of their revenues in research and develop-
ment (see Figure 9) compared to the previous year.
R&D expenses thus fell to the level of 2016.
As in prior years, manufacturers of standard software
have invested the most in R&D (13.8%), while all other
subindustries invested less than 6.0%. More specifically,
manufacturers of custom software spent 5.4%, con-
sulting firms 5.1%, technology and service providers
4.5%, and software integrators 3.9% of their revenues in
R&D.
Lower R&D Investments
Source: SSIS 2019 N = 177
8.9%10.8% 10.1% 10.4%
8.0% 9.5%12.1%
14.7%
9.4%
19.7%
9.6%11.3%
0.0%
5.0%
10.0%
15.0%
20.0%
25.0%
Custom softwaremanufacturer
Standard softwaremanufacturer
(including SaaS)
Consulting Software integrator Technology andservice providers
Software Industry
2019 2020
12.6%
25.3%
4.0%7.0% 5.8%
11.3%
5.4%
13.8%
5.1% 3.9% 4.5%7.1%
0.0%5.0%
10.0%15.0%20.0%25.0%30.0%
Custom softwaremanufacturer
Standard softwaremanufacturer
(including SaaS)
Consulting Software integrator Technology andservice providers
Software Industry
2017 2018
Page 12
Swiss Software Industry Survey 2019 12
Spotlight on Revenue, Profitability and Future Growth
Employee Growth Prospects
Figure 10: Expected year over year growth of workforce for 2019 and 2020
Source: SSIS 2019 N = 191
Figure 10 shows the employee growth expectations of
the Swiss software industry. Interestingly, the overall
employee growth expectations (11.6% for 2019 and
14.9% for 2020) reflect the revenue growth expecta-
tions (9.9% for 2019 and 11.3% for 2020), i.e., high in-
creases in expected revenue mirror similarly high in-
creases in the workforce.
For 2019, the Swiss software industry expects to hire
11.6% additional employees, and 13.6% in 2020.
No subindustry plans to reduce their workforce in the
upcoming two years. In 2019, manufacturers of custom
software plan the steepest increases in their workforce
(15.7%), followed by technology and service providers
(12.7%), consulting companies (11.9%), software inte-
grators (11.3%), and standard software manufacturers
(7.3%). In 2020, software integrators (20.0%) and con-
sulting companies (19.9%) plan the steepest increases in
their workforce. However, given the small number of
responses within these subindustries, these high values
are not as robust as those for the industry as a whole.
Besides, technology and service providers expect an
increase of 14.5%, custom software manufacturers of
13.5% and standard software manufacturers of 9.8% in
their workforce.
Expected Employee Growth Reflects Expected Revenue Growth
Expected employee growth of
in 2019
11.6%
15.7%
7.3%
11.9%11.3%
12.7%11.6%
13.5%
9.8%
19.9% 20.0%
14.5% 14.9%
0.0%
5.0%
10.0%
15.0%
20.0%
25.0%
Custom softwaremanufacturer
Standard softwaremanufacturer
(including SaaS)
Consulting Software integrator Technology andservice providers
Software Industry
2019 2020
Page 13
Swiss Software Industry Survey 2019 13
Sources of Revenue Spotlight on
Page 14
Swiss Software Industry Survey 2019 14
Spotlight on Sources of Revenue
Sources of Revenue
Figure 11: Revenue from different revenue sources as percentage of industry revenue
Source: SSIS 2019 N = 178
Figure 11 shows the sources of revenue of Swiss soft-
ware companies in 2018. With a share of 39.2%, the
most crucial source of revenue for Swiss software com-
panies in 2018 was the development of custom-made
software, followed by maintenance and support
(16.7%). Together, with the revenues from the two cus-
tomization categories (i.e., customization of self-
developed standard software (7.1%) and third-party
standard software (5.6%)), the development of custom-
made software and maintenance and support account
for almost three-fourths of the revenue. This underlines
the importance of custom software solutions in Switzer-
land. At the same time, it is evident that the Swiss soft-
ware industry offers only a minimal range of scalable
standard software and incurs license fees for it (8.9%).
Interestingly, revenues from cloud solutions (7.5%) be-
came more critical compared to 2017 (5.0%).
If we now look at the revenue sources of standard and
individual software manufacturers separately, the pic-
ture is quite different. For manufacturers of standard
software (see Figure 12), maintenance and support
(37.8%), royalties from own software licenses (27.5%),
and customization of self-developed standard software
(14.1%) account for more than three-fourths of the rev-
enue. Revenues from cloud solutions grew in im-
portance since 2017 and now account for 13.8%
(compared to 6.2% in 2017).
For custom software manufacturers (see Figure 13), the
development of custom software is the largest source of
revenue (59.1%). Together with revenues from mainte-
nance and support (11.2%), the development of custom
software accounts for almost three fourths.
Sources of Revenue
From the industry revenue
are generated through cloud solutions
7.5%
Development of custom-made software39.2%
Maintenance and support16.7%
Royalties (own software licenses)8.9%
Cloud solutions
7.5%
Customization (self-developed standard software)
7.1%
Customization (3rd-party s tandard software)
5.6%
Embedded software2.0%
Royalties (resale)
1.7%
Other11.2%
Page 15
Swiss Software Industry Survey 2019 15
Sources of Revenue for Manufacturers of Standard Software
Figure 12: Revenue from different revenue sources as percentage of standard software manufacturer revenue
Spotlight on Sources of Revenue
Sources of Revenue for Manufacturers of Custom Software
Figure 13: Revenue from different revenue sources as percentage of custom software manufacturer revenue
Source: SSIS 2019 N = 51
Source: SSIS 2019 N = 61
Maintenance and support37.8%
Royalties (own software licenses)27.5%
Customization (self-developed s tandard software)
14.1%
Cloud solutions13.8%
Development of custom-made software2.1%
Customization (3rd-party s tandard software)1.5%
Royalties (resale)0.8%
Embedded software
0.3% Other
1.9%
Development of custom-made software
59.1%
Maintenance and support11.2%
Customization (self-developed standard software)
10.0%
Royalties (own software licenses)8.0%
Customization (3rd-party
s tandard software)4.8%
Cloud solutions
1.9%
Royalties (resale)0.4%
Embedded software0.2%
Other4.4%
Page 16
Swiss Software Industry Survey 2019 16
Internationalization & Sourcing
Spotlight on
Page 17
Swiss Software Industry Survey 2019 17
Degree of Internationalization and Target Markets
Figure 14: Distribution of international revenue
Source: SSIS 2019
Spotlight on Internationalization & Sourcing
N = 188
Figure 14 shows the degree of internationalization and
the target markets in 2018. Compared to 2017, the per-
centage of revenue Swiss software companies genera-
ted abroad decreased to 14.0%. This is a sharp de-
crease of 11.0 percentage points compared to 2017.
Like in prior years, Germany remains the most im-
portant export market (26.9%). Compared to 2017,
however, this is a decrease of 9.8 percentage points and
thus one possible explanation for the overall decline.
The second most important international market in
2018 was Luxembourg, with 19.8%, followed by North
America (9.8%), the United Kingdom (7.2%), and the
neighbouring countries France (6.0%) and Italy (5.3%).
Figure 15 shows the employee growth prospects ab-
road. With 10.6% for 2019 and 13.5% for 2020, these
growth prospects are lower than the growth prospects
in Switzerland (11.6% for 2019 and 14.9% for 2020).
Increasing Internationalization of Swiss Software Companies
Growth of Headcounts Abroad
Figure 15: Percentage of growth in headcounts of employees in Switzerland and abroad
Source: SSIS 2019 N = 48
10.6%
13.5%
0.0%
2.0%
4.0%
6.0%
8.0%
10.0%
12.0%
14.0%
16.0%
2019 2020
Switzerland
86.0%
Germany26.9%
Luxembourg19.8%
North
America9.8%
United Kingdom7.2%
France
6.0%Ita ly5.3%
Asia4.8%
Other European countries
12.9%
Rest of the World7.3%
Page 18
Swiss Software Industry Survey 2019 18
Spotlight on Sources of Revenue
Outsourcing Yes—No
Figure 16: Percentage of companies that outsource by subindustries
Source: SSIS 2019 N = 260
Sourcing, the development, improvement, and opera-
tion of IT products and/or services through external
service providers and/or own subsidiaries, remains vital
for Swiss software companies. Figure 16 shows the pro-
pensity to source products or services from external
service providers, own subsidiaries, or both external
service providers and own subsidiaries in 2018.
Our results show that the propensity to outsource is the
highest among consulting firms (54.8%), followed by
software integrators (45.8%), custom software manu-
facturers (40.5%), technology and service providers
(30.8%), and standard software manufacturers (30.6%).
Interestingly, the propensity to source services and/or
products from own subsidiaries is the highest among
standard software manufacturers (10.6%). So while
standard software manufacturers are comparably reluc-
tant to source from external service providers, they are
relatively often doing so from their subsidiaries. The
second-highest propensity to source services and/or
products from own subsidiaries had technology and
service providers (7.7%), followed by custom software
manufacturers (6.3%), software integrators (4.2%), and
consulting companies (3.2%).
When it comes to sourcing from both external service
providers and own subsidiaries, software integrators
had the highest propensity (16.7%), followed by tech-
nology and service providers (15.4%), consulting compa-
nies (12.9%), standard software manufacturers (10.6%),
and custom software manufacturers (7.6%).
Outsourcing in the Swiss Software Industry
Among consulting companies
do source products and/or services from external service providers
54.8%
40.5%30.6%
54.8%45.8%
30.8%38.1%
6.3%
10.6%
3.2%
4.2%
7.7%
6.5%
7.6%10.6%
12.9%
16.7%
15.4%12.3%
0.0%
10.0%
20.0%
30.0%
40.0%
50.0%
60.0%
70.0%
80.0%
90.0%
100.0%
Custom softwaremanufacturer
Standard softwaremanufacturer
(including SaaS)
Consulting Software integrator Technology andservice providers
Software industry
External Service Provider Own Subsidiary Both External Service Provider and Own Subsidiary
Page 19
Swiss Software Industry Survey 2019 19
Spotlight on Internationalization & Sourcing
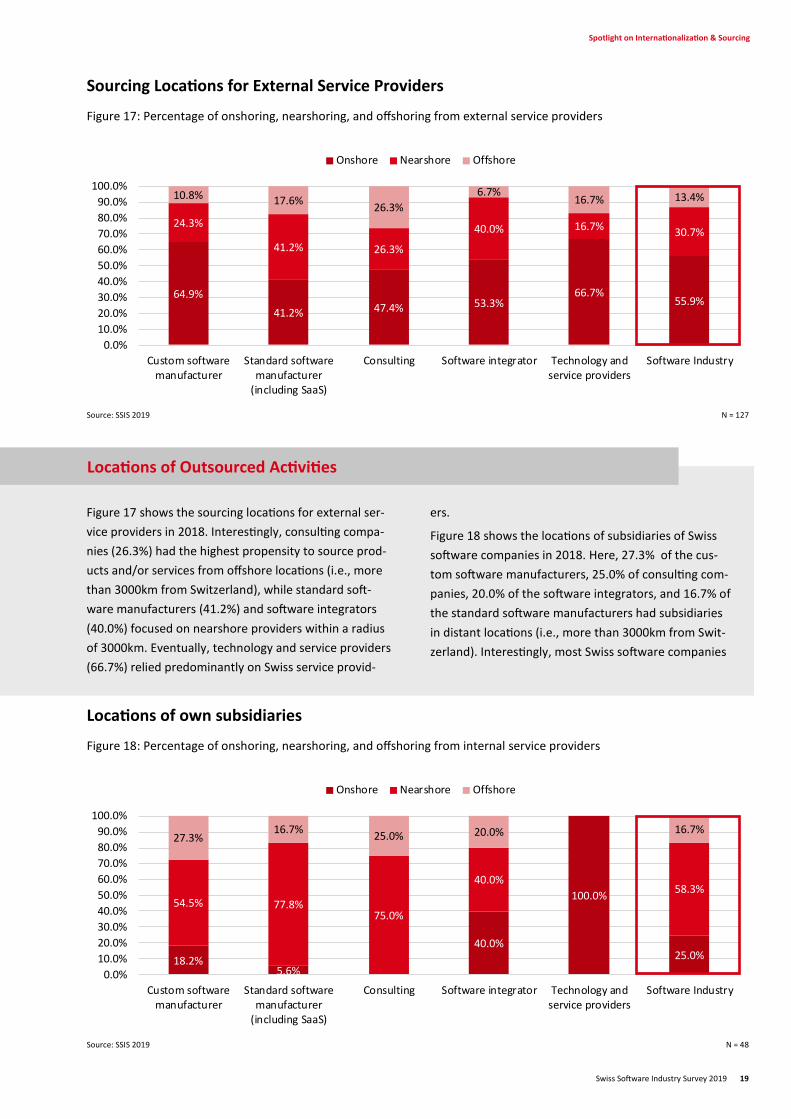
Sourcing Locations for External Service Providers
Figure 17: Percentage of onshoring, nearshoring, and offshoring from external service providers
Source: SSIS 2019 N = 127
Locations of own subsidiaries
Figure 18: Percentage of onshoring, nearshoring, and offshoring from internal service providers
Source: SSIS 2019 N = 48
Figure 17 shows the sourcing locations for external ser-
vice providers in 2018. Interestingly, consulting compa-
nies (26.3%) had the highest propensity to source prod-
ucts and/or services from offshore locations (i.e., more
than 3000km from Switzerland), while standard soft-
ware manufacturers (41.2%) and software integrators
(40.0%) focused on nearshore providers within a radius
of 3000km. Eventually, technology and service providers
(66.7%) relied predominantly on Swiss service provid-
ers.
Figure 18 shows the locations of subsidiaries of Swiss
software companies in 2018. Here, 27.3% of the cus-
tom software manufacturers, 25.0% of consulting com-
panies, 20.0% of the software integrators, and 16.7% of
the standard software manufacturers had subsidiaries
in distant locations (i.e., more than 3000km from Swit-
zerland). Interestingly, most Swiss software companies
Locations of Outsourced Activities
64.9%
41.2% 47.4% 53.3%66.7%
55.9%
24.3%
41.2% 26.3%
40.0% 16.7% 30.7%
10.8% 17.6%26.3%
6.7%16.7% 13.4%
0.0%
10.0%
20.0%
30.0%
40.0%
50.0%
60.0%
70.0%
80.0%
90.0%
100.0%
Custom softwaremanufacturer
Standard softwaremanufacturer
(including SaaS)
Consulting Software integrator Technology andservice providers
Software Industry
Onshore Nearshore Offshore
18.2%5.6%
40.0%
100.0%
25.0%
54.5% 77.8%75.0%
40.0%58.3%
27.3%16.7%
25.0% 20.0% 16.7%
0.0%
10.0%
20.0%
30.0%
40.0%
50.0%
60.0%
70.0%
80.0%
90.0%
100.0%
Custom softwaremanufacturer
Standard softwaremanufacturer
(including SaaS)
Consulting Software integrator Technology andservice providers
Software Industry
Onshore Nearshore Offshore
Page 20
Swiss Software Industry Survey 2019 20
Productivity Spotlight on
Page 21
Swiss Software Industry Survey 2019 21
Spotlight on Productivity
Source: SSIS 2019
Figure 19 shows the measures taken by Swiss software
companies in 2018 to enhance their productivity. Most
of the enhancement measures concerned existing pro-
cesses, including the optimization, agilization, automa-
tion, and digitalization of business processes. Swiss soft-
ware companies have also invested heavily in upskilling
their staff through trainings and new employees,
streamlining their product and service portfolios
through standardizations and cloud solutions, using the
latest technologies, improving their knowledge manage-
ment, and promoting employee loyalty.
Figure 20 shows the measures Swiss Software compa-
nies consider efficient to enhance productivity.
Productivity-enhancing measures in the Swiss software industry
Named Measures to Enhance Productivity
Figure 19: Measures to increase productivity in proportion to their naming
Source: SSIS 2019 N =
Page 22
Swiss Software Industry Survey 2019 22
Spotlight on Internationalization & Sourcing
Effectiveness of Productivity-Enhancing Measures
Figure 20: Which productivity-enhancing measures do Swiss software companies consider efficient?
Source: SSIS 2019 N = 200
Shifts in Sources of Revenue until 2021
Figure 21: Revenue sources in 2018 compared to revenue sources in 2021
Source: SSIS 2019 N = 178
Figure 21 shows the revenue sources in 2018 compared
with the revenue sources expected by Swiss software
companies in 2021. Interestingly, Swiss software com-
panies expect a significant shift in revenues from the
development of custom-made software (from 39.2% in
2018 to 34.0% in 2021) to cloud solutions (from 7.5% in
2018 to 11.5% in 2021), and maintenance and support
(from 16.7% in 2018 to 18.7% in 2021).
Figure 22 shows the same diagram for standard soft-
ware manufacturers. Here, revenues from cloud solu-
tions increase from 13.8% to 21.4% while, revenues
from royalties decrease from 27.5% to 23.1% .
Figure 23 shows the same diagram for custom software
manufacturers. Here, revenues from cloud solutions
increase from 1.9% to 7.1%, while revenues from cus-
tom-made software decrease from 59.1% to 49.8%.
Expected Changes in the Sources of Their Revenues
-80.0% -60.0% -40.0% -20.0% 0.0% 20.0% 40.0% 60.0% 80.0% 100.0%
Training existing employees
Simplifying of internal processes
Standardizing of internal processes
Reusing existing components
Automating of internal processes
Hiring more productive employees
Sourcing activites
39
.2%
16
.7%
7.5
%
8.9
%
7.1
%
5.6%
2.0
%
1.7
%
11.2
%
34
.0%
18
.7%
11
.5%
8.5%
7.0
%
5.7
%
1.9
%
1.9%
10.9
%
0.0%5.0%
10.0%15.0%20.0%25.0%30.0%35.0%40.0%45.0%
De
ve
lop
me
nt
of
cust
om-m
ade
soft
war
e
Mai
nten
ance
and
sup
po
rt
Clo
ud
so
luti
on
s
Ro
yalt
ies
(ow
nso
ftw
are
licen
ses)
Cust
om
izat
ion
(sel
f-d
ev
elo
pe
d s
tan
da
rdso
ftw
are
)
Cu
sto
miz
atio
n (3
rd-
pa
rty
sta
nd
ard
soft
wa
re)
Emb
edde
d s
oftw
are
Ro
yalt
ies
(res
ale)
Oth
er
2018 2021
Page 23
Swiss Software Industry Survey 2019 23
Shifts in Sources of Revenue until 2021 for Standard Software Manufacturers
Figure 22: Revenue sources of standard software manufacturers in 2018 compared to revenue sources in 2021
Spotlight on Sources of Revenue
Shifts in Sources of Revenue until 2021 for Custom Software Manufacturers
Figure 23: Revenue sources of custom software manufacturers in 2018 compared to revenue sources in 2021
Source: SSIS 2019 N = 51
Source: SSIS 2019 N = 61
37
.8%
27
.5%
13.8
%
14
.1%
1.5
%
0.8
%
2.1
%
0.3
%
1.9
%
35.1
%
23.1
%
21
.4%
12
.6%
2.3
%
1.3%
1.3%
1.0
%
1.8
%
0.0%
5.0%
10.0%
15.0%
20.0%
25.0%
30.0%
35.0%
40.0%
Ma
inte
na
nce
an
d s
up
po
rt
Ro
yalt
ies
(ow
n s
oft
wa
relic
ense
s)
Clou
d so
luti
ons
Cust
om
izat
ion
(sel
f-de
velo
ped
stan
da
rd s
oft
wa
re)
Cu
sto
miz
ati
on
(3
rd-p
art
yst
and
ard
so
ftw
are)
Ro
yalt
ies
(res
ale)
Dev
elo
pm
ent
of c
ust
om-m
ade
soft
war
e
Emb
edde
d s
oftw
are
Oth
er
2018 20215
9.1
%
11.2
%
10.0
%
8.0
%
4.8%
1.9
%
0.4
%
0.2
% 4.4%
49
.8%
11.3
%
10.5
%
10
.2%
5.1
%
7.1%
0.9%
0.2
% 4.8
%
0.0%
10.0%
20.0%
30.0%
40.0%
50.0%
60.0%
70.0%
Dev
elop
men
t of
cus
tom
-mad
eso
ftw
are
Ma
inte
na
nce
an
d s
up
po
rt
Cust
om
izat
ion
(sel
f-de
velo
ped
stan
da
rd s
oft
wa
re)
Ro
yalt
ies
(ow
n s
oft
wa
relic
ense
s)
Cu
sto
miz
ati
on
(3rd
-pa
rty
stan
dar
d s
oft
war
e)
Clo
ud
so
luti
on
s
Ro
yalt
ies
(re
sale
)
Emb
edde
d s
oftw
are
Oth
er
2018 2021
Page 24
Swiss Software Industry Survey 2019 24
Public Tenders Spotlight on
Page 25
Swiss Software Industry Survey 2019 25
Spotlight on Internationalization & Sourcing
Reasons for Participating in WTO Tenders
Figure 24: Reasons for participation in WTO tenders in proportion to their naming
Source: SSIS 2019 N = 70
Reasons Against Participation in WTO Tenders
Figure 25: Reasons against participation in WTO tenders in proportion to their naming
Source: SSIS 2019 N = 145
Figure 24 shows the reasons why Swiss software com-
panies participate in public tenders. Here, the most im-
portant reason for participation is the exploitation of
opportunities through attractive public projects, large
projects, new markets, or new customers. The second
most important reason was the specific orientation on
the public sector, followed by the ability to use free
capabilities and capacities, and to increase sales.
Figure 25 shows the reasons why Swiss software com-
panies do not participate in public tenders. The most
important reason for non-participation is the time and
effort small companies can hardly bear, the lack of ca-
pacity, and the low success rate. The second most im-
portant reason was a different orientation or simply a
lack of awareness.
WTO Tenders and the Swiss Software Industry Survey
Page 26
Swiss Software Industry Survey 2019 26
Spotlight on Internationalization & Sourcing
WTO-Compliant Revenues in the Subindustries
Figure 26: Percentage of revenues in 2018 in the individual subindustries from contracts awarded under WTO rules
Source: SSIS 2019 N = 72
WTO-Compliant Revenues in the Major Regions of Switzerland
Figure 27: Percentage of revenues in 2018 in the major regions of Switzerland from contracts awarded under WTO rules
Source: SSIS 2019 N = 72
Figure 26 shows the percentage of revenues in 2018 of
Swiss software companies from contracts awarded un-
der WTO rules. On average Swiss software companies
generate among 16.7% of the revenues form contracts
awarded under WTO. This source of revenue is most
important for consulting companies (22.2%) and soft-
ware integrators (18.1%).
Figure 27 shows the percentage of revenues in 2018 in
the major regions of Switzerland from contracts award-
ed under WTO rules. Revenues form contracts awarded
under WTO rules are most important for the Espace
Mittelland (31.9%), followed by Zurich (16.6%), eastern
Switzerland (15.7%), northern Switzerland (8.9%), and
the lake Geneva region (0.9%).
Revenues from Contracts Awarded in Accordance with WTO Rules
10.6% 7.8%22.2% 18.1%
6.5% 9.8% 16.7%
89.4% 92.2%77.8% 81.9%
93.5% 90.2% 83.3%
0.0%10.0%20.0%30.0%40.0%50.0%60.0%70.0%80.0%90.0%
100.0%
Custom softwaremanufacturer
Standardsoftware
manufacturer(including SaaS)
Consulting Softwareintegrator
Technology andservice providers
Other SoftwareIndustry
Revenues in 2018 from contracts awarded in accordance with WTO rules Other Revenues in 2018
31.9%16.6% 15.9% 15.7% 8.9% 0.9%
68.1%83.4% 84.1% 84.3% 91.1%
99.1%
0%
10%
20%
30%
40%
50%
60%
70%
80%
90%
100%
Espace Mittelland Zurich Eastern Switzerland Central Switzerland NorthwesternSwitzerland
Lake Geneva Region
Revenues in 2018 from contracts awarded in accordance with WTO rules Other Revenues in 2018
Page 27
Swiss Software Industry Survey 2019 27
About the SSIS Method and Official Statistics
Page 28
Swiss Software Industry Survey 2019 28
Geographical Distribution of the Participants in 2019
Figure 28: Participating companies per canton
The SSIS and Official Statistics
This year we conducted the Swiss Software Industry
Survey (SSIS) for the fifth time. With the fifth iteration,
the SSIS managed to defend its pole position in terms of
size, geographical reach, and methodological rigor:
Reach of the survey: The Swiss software industry sur-
vey aims to represent the entire Swiss software indus-
try—rather than only a couple of large companies.
Therefore, the SSIS…
Builds on an extended and refined high-quality
contact database with approximately 5’000 vali-
dated Swiss software companies
Covers all Swiss language regions
Covers 20 cantons (see Figure 28)
Builds on a large sample size with 591 partici-
pants, 271 complete responses, and 191 post-
stratified data points on revenue and profitability
Rigor of the survey: To meet highest research stand-
ards...
… we developed, refined, and assessed new con-
structs by following state-of-the-art procedures
for construct development
… we relied on the extrapolation method devel-
oped for last year’s SSIS, which builds on state-of
-the-art econometrical procedures (post-
stratification by region, subindustries, company
size, and revenue)
Additional benefits for participating companies: All
participants of the survey can compare their own per-
formance against other companies using our bench-
marking website. In addition, companies which partici-
pate regularly can now benchmark their performance
over time (www.softwareindustrysurvey.ch).
About the SSIS in 2019
Source: SSIS 2019
1
83
Responses
Page 29
Swiss Software Industry Survey 2019 29
Official Statistics - Employees and Added Value
Table 1: Distribution of Added Value in 2017 and distribution of Full-Time Equivalents in 2016 by industry
Source: BESTA , Added Value 2016, FTEs 2016
The SSIS and Official Statistics
Added Value FTEs
Energy Supply, Water Supply, Waste Management 1.6% 1.1%
Construction 5.5% 8.5%
Manufacturing 19.1% 16.0%
Trade, Repair of Motor Vehicles & Motorcycles 14.3% 13.5%
Accommodation and Food Service Activities 1.7% 4.9%
IT and Other Information Services (NOGA 62, 63) 2.4% 2.4%
Financial Service Activities & Insurance 9.4% 3.9%
Public Administration 10.8% 4.3%
Education 0.6% 6.0%
Human Health & Social Work Activites 8.2% 13.1%
Transportation, Storage, Information & Communication 6.1% 6.7%
Real Estate, Professional, Scientific, Technical & Administrative Activities 18.1% 15.7%
Other Sectors 2.2% 3.9%
Total 100% 100%
Data about the Swiss software industry is provided as
part of official statistics nested in the broad categories
of “Computer programming, consultancy and related
activities” and “Information service activities” (NOGA
codes 62 & 63).
The respective data on added value (i.e., revenue) and
number of employees from Swiss Statistics emphasize
the major importance of the Helvetic Information Tech-
nology and Information Services sector. With more than
20 billion Swiss francs it adds roughly 2.4% to the Swiss
GDP (see Table 1) and employs almost 2.4% of all job-
holders in Switzerland (see Table 1), and is one of the
strongest growing sectors. Figures 29 and 30 show the
official employee statistics.
Official statistics provide reliable information about the
size and growth of the overall IT sector. However, they
do not draw a very detailed picture about the Swiss
software industry.
Therefore, the SSIS positions itself as a complementary
study that enriches official statistics. Compatibility with
official statistics is ensured by focusing on two NOGA
codes (62, 63). Yet, we provide a richer picture of what
is going on within these codes. Specifically, the report
enables the following additional insights:
Trend analysis of key performance indicators
incl. EBIT, R&D expenditure, employee growth,
and revenue growth
Indicators on profitability and R&D investments
Analyses along practically relevant categories
(standard vs. custom software, maintenance vs.
testing, etc.).
The SSIS as Complement to Official Statistics
Page 30
Swiss Software Industry Survey 2019 30
Employees in the Swiss ICT Sector
Figure 29: Number of FTEs in NOGA 62 & 63 from 1991-2018
Spotlight on Sources of Revenue
Part-Time Employees in the Swiss ICT Sector
Figure 30: Number of FTEs and Part-Time Employees in NOGA 62 & 63 from 1991 - 2018
Source: BESTA 2019
Source: BESTA 2019
0.00
10'000.00
20'000.00
30'000.00
40'000.00
50'000.00
60'000.00
70'000.00
80'000.00
90'000.00
100'000.00
19
91
19
92
19
93
19
94
19
95
19
96
19
97
19
98
19
99
20
00
20
01
20
02
20
03
20
04
20
05
20
06
20
07
20
08
20
09
20
10
20
11
20
12
20
13
20
14
20
15
20
16
20
17
20
18
Full
Tim
e Eq
uiv
ale
nts
Total (in FTE)
Full-time Employees (absolute numbers)
Part-time Employees (absolute numbers)
Total Male Employees (FTE)
Total Female Employees (FTE)
-
10'000.00
20'000.00
30'000.00
40'000.00
50'000.00
60'000.00
70'000.00
80'000.00
19
91
19
92
19
93
19
94
19
95
19
96
19
97
19
98
19
99
20
00
20
01
20
02
20
03
20
04
20
05
20
06
20
07
20
08
20
09
20
10
20
11
20
12
20
13
20
14
20
15
20
16
20
17
20
18
Full
Tim
e Eq
uiv
ale
nts
Male Full-time Employees
Female Full-time Employees
Male Part-time Employees
Female Part-time Employees