56
© Towson University, Division of Innovation and Applied Research RESI of Towson University Daraius Irani, Ph.D. Chief Economist, RESI
| Date post: | 07-Aug-2015 |
| Category: |
Government & Nonprofit |
| Upload: | susquehanna-workforce-network |
| View: | 22 times |
| Download: | 0 times |

© Towson University, Division of Innovation and Applied Research
RESI of Towson University
Daraius Irani, Ph.D.Chief Economist, RESI

© Towson University, Division of Innovation and Applied Research Source: RackaFracka.com

2004Q2
2004Q4
2005Q2
2005Q4
2006Q2
2006Q4
2007Q2
2007Q4
2008Q2
2008Q4
2009Q2
2009Q4
2010Q2
2010Q4
2011Q2
2011Q4
2012Q2
2012Q4
2013Q2
2013Q4
2014Q2
2014Q4$0
$2,000
$4,000
$6,000
$8,000
$10,000
$12,000
$14,000
$16,000
$18,000
-5.0%
-4.0%
-3.0%
-2.0%
-1.0%
0.0%
1.0%
2.0%
3.0%
4.0%
5.0%
Real Gross Domestic ProductSeasonally Adjusted, Chained Dollars (2004Q2 to 2015Q1)
Recession US GDP % Change
Billi
ons
of D
olla
rs
Annu
al R
ate
of C
hang
e
© Towson University, Division of Innovation and Applied Research Source: Bureau of Economic Analysis
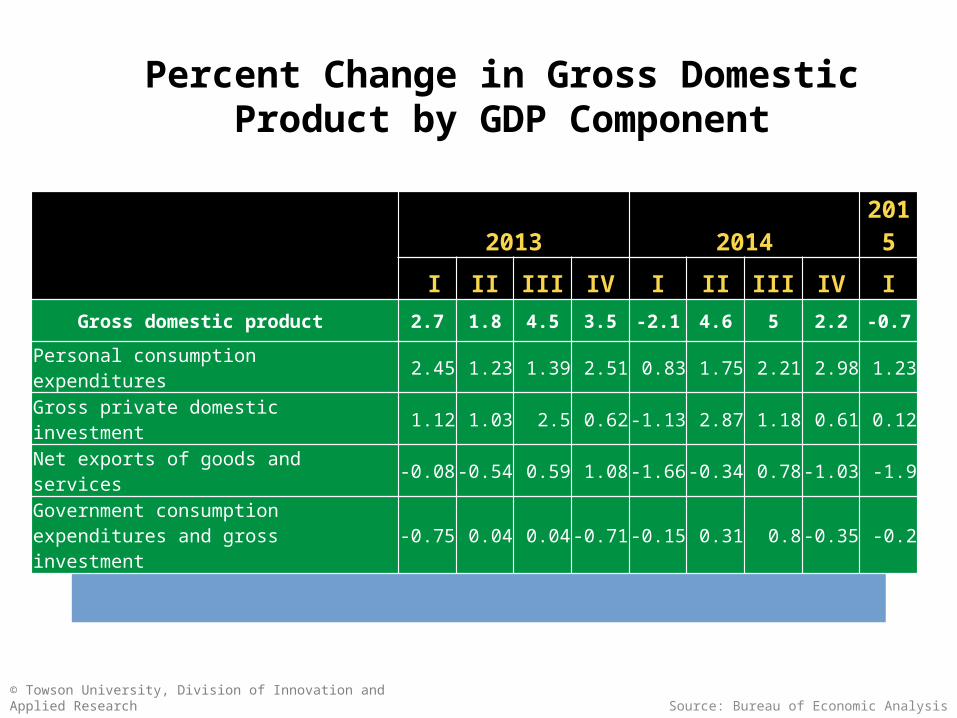
Percent Change in Gross Domestic Product by GDP Component
© Towson University, Division of Innovation and Applied Research Source: Bureau of Economic Analysis
2013 2014 2015
II II III IV I II III IV I Gross domestic product 2.7 1.8 4.5 3.5 -2.1 4.6 5 2.2 -0.7
Personal consumption expenditures 2.45 1.23 1.39 2.51 0.83 1.75 2.21 2.98 1.23
Gross private domestic investment 1.12 1.03 2.5 0.62 -1.13 2.87 1.18 0.61 0.12
Net exports of goods and services -0.08 -0.54 0.59 1.08 -1.66 -0.34 0.78 -1.03 -1.9
Government consumption expenditures and gross investment -0.75 0.04 0.04 -0.71 -0.15 0.31 0.8 -0.35 -0.2

2004Q2
2004Q4
2005Q2
2005Q4
2006Q2
2006Q4
2007Q2
2007Q4
2008Q2
2008Q4
2009Q2
2009Q4
2010Q2
2010Q4
2011Q2
2011Q4
2012Q2
2012Q4
2013Q2
2013Q4
2014Q2
2014Q4$0
$2,000
$4,000
$6,000
$8,000
$10,000
$12,000
-6.0
-4.0
-2.0
0.0
2.0
4.0
6.0
U.S. Personal Consumption ExpendituresSeasonally Adjusted 2004Q2 to 2015Q1
Recession PCE Compound Annual Rate of Change
Billi
ons
of 2
0009
Cha
ined
Dol
lars
Com
poun
d An
nual
Rat
e of
Cha
nge
© Towson University, Division of Innovation and Applied Research
Source: Economic Research Federal Reserve Bank of St. Louis.

1/1/0
4
7/1/0
4
1/1/0
5
7/1/0
5
1/1/0
6
7/1/0
6
1/1/0
7
7/1/0
7
1/1/0
8
7/1/0
8
1/1/0
9
7/1/0
9
1/1/1
0
7/1/1
0
1/1/1
1
7/1/1
1
1/1/1
2
7/1/1
2
1/1/1
3
7/1/1
3
1/1/1
4
7/1/1
4
1/1/1
50
20
40
60
80
100
Consumer Sentiment IndexMonthly (Jan. 2004 to June
2015)
Recession Consumer Sentiment Base Year (1966 = 100)
Inde
x Va
lue
Nov. 2008-55.3
June 2015-94.6
© Towson University, Division of Innovation and Applied Research Sources: University of Michigan, Thomson Reuters
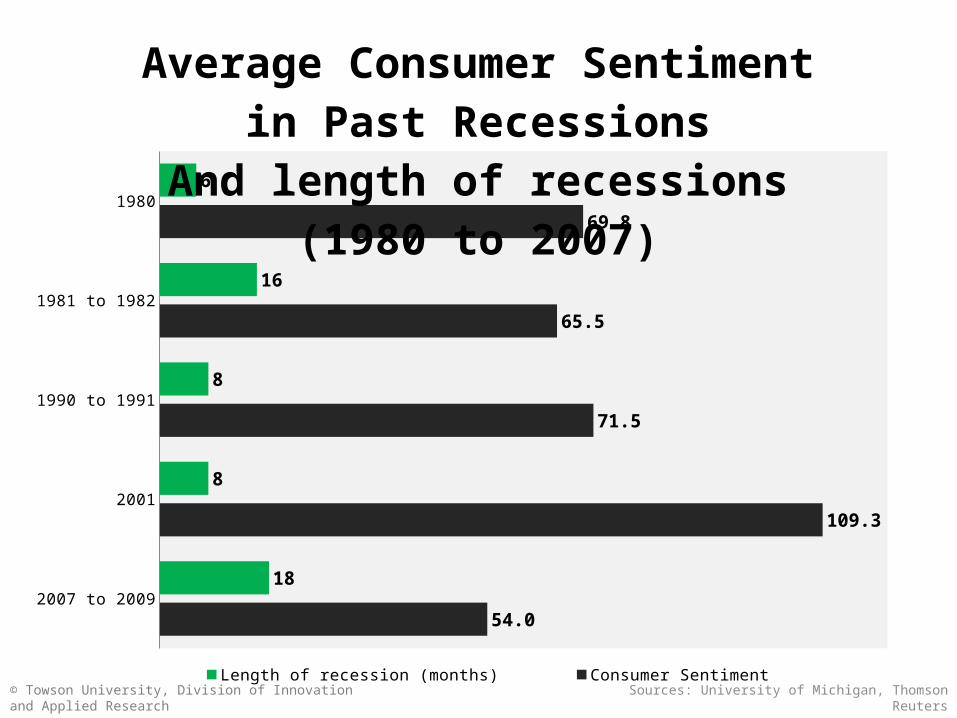
2007 to 2009
2001
1990 to 1991
1981 to 1982
1980
54.0
109.3
71.5
65.5
69.8
18
8
8
16
6
Average Consumer Sentimentin Past Recessions
And length of recessions (1980 to 2007)
Length of recession (months) Consumer Sentiment
Sources: University of Michigan, Thomson Reuters© Towson University, Division of Innovation and Applied Research

2003Q1
2003Q3
2004Q1
2004Q3
2005Q1
2005Q3
2006Q1
2006Q3
2007Q1
2007Q3
2008Q1
2008Q3
2009Q1
2009Q3
2010Q1
2010Q3
2011Q1
2011Q3
2012Q1
2012Q3
2013Q1
2013Q3
2014Q1
2014Q3
2015Q10.0%
2.0%
4.0%
6.0%
8.0%
10.0%
12.0%
Delinquency Rates by Loan Type
Seasonally Adjusted (2003Q1 to 2015Q1)
Recession Single Family Residential Loans Credit Cards Other Consumer Loans
Perc
ent R
ate
© Towson University, Division of Innovation & Applied Research Source: Federal Reserve Bank of New York
2010Q1: 11.3%
2009Q2: 6.8%
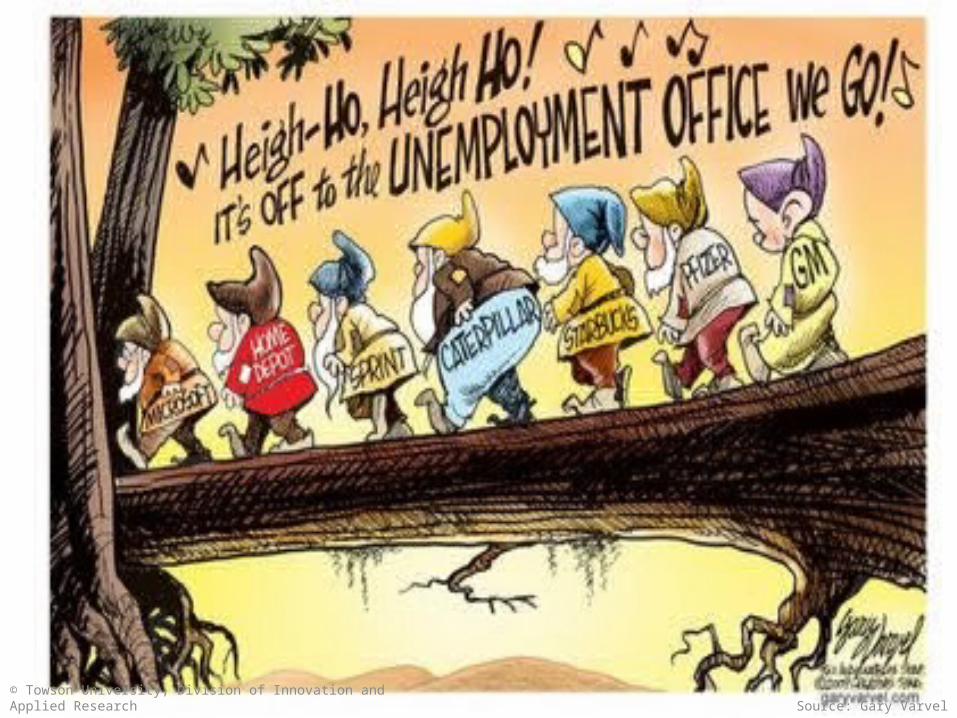
© Towson University, Division of Innovation and Applied Research Source: Gary Varvel
Jan-01
Aug-01
Mar-0
2
Oct-02
May-0
3
Dec-03
Jul-04
Feb-05
Sep-05
Apr-06
Nov-06
Jun-07Jan-08
Aug-08
Mar-0
9
Oct-09
May-1
0
Dec-10
Jul-11
Feb-12
Sep-12
Apr-13
Nov-13
Jun-14Jan-15
0
2000
4000
6000
8000
10000
12000
14000
16000
18000
20000
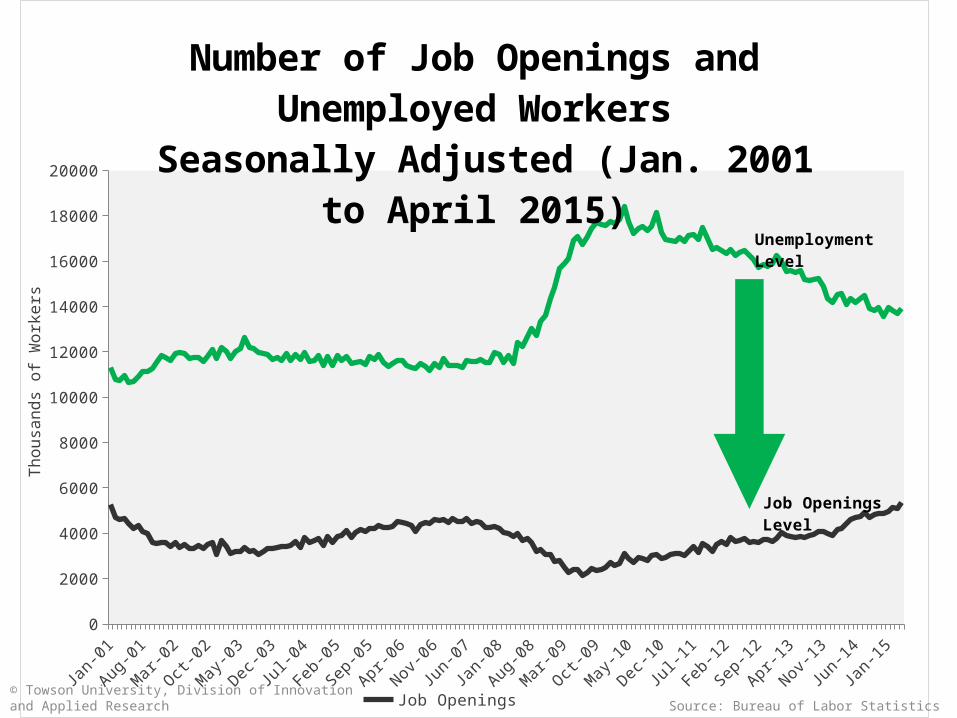
Number of Job Openings and Unemployed Workers
Seasonally Adjusted (Jan. 2001 to April 2015)
Job Openings Unemployment Level
Unemployment Level
Job Openings Level
Thou
sand
s of
Wor
kers
© Towson University, Division of Innovation and Applied Research Source: Bureau of Labor Statistics

Dec-99
Apr-03
Aug-06
Dec-09
Apr-13
Aug-16
Dec-19
Apr-23
Aug-26
Dec-29
Apr-33
Aug-36
Dec-39
Apr-43
Aug-46
Dec-49
Apr-53
Aug-56
Dec-59
Apr-63
Aug-66
Dec-69
Apr-73
Aug-76
Dec-79
Apr-83
Aug-86
Dec-89
Apr-93
Aug-96
Dec-99
Apr-03
Aug-06
Dec-09
Apr-13
-2.0%
0.0%
2.0%
4.0%
6.0%
8.0%
10.0%
12.0%
14.0%
16.0%
18.0%
National Rate of Unemployment and Underemployment
Seasonally Adjusted (2007 to May 2015)
Recession Underemployed Unemployed
Perc
ent o
f Lab
or F
orce
© Towson University, Division of Innovation & Applied Research Source: Bureau of Labor Statistics
Jan-07
May-0
7
Sep-07
Jan-08
May-0
8
Sep-08
Jan-09
May-0
9
Sep-09
Jan-10
May-1
0
Sep-10
Jan-11
May-1
1
Sep-11
Jan-12
May-1
2
Sep-12
Jan-13
May-1
3
Sep-13
Jan-14
May-1
4
Sep-14
Jan-15
May-1
50
2,000
4,000
6,000
8,000
10,000
12,000
14,000
16,000
18,000
0.0
5.0
10.0
15.0
20.0
25.0
30.0
35.0
40.0
45.0
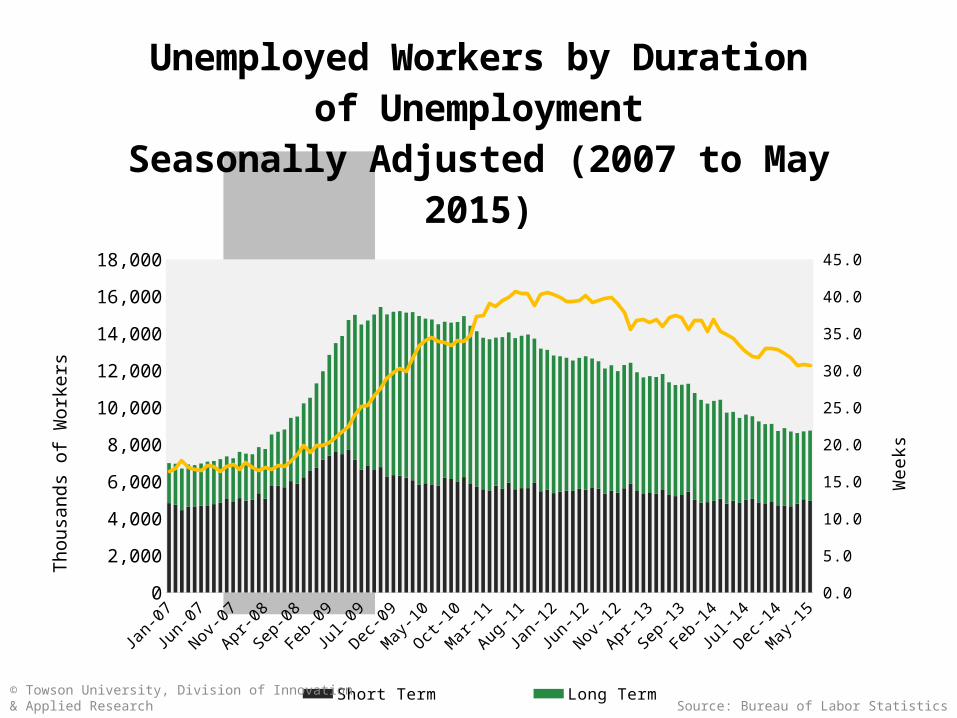
Unemployed Workers by Duration of Unemployment
Seasonally Adjusted (2007 to May 2015)
Short Term Long Term Average duration
Thou
sand
s of W
orke
rs
Wee
ks
Source: Bureau of Labor Statistics© Towson University, Division of Innovation & Applied Research

© Towson University, Division of Innovation & Applied Research Source: Lisa Benson

© Towson University, Division of Innovation & Applied Research Source: Bureau of Labor Statistics
Jan-05
May-0
5
Sep-05
Jan-06
May-0
6
Sep-06
Jan-07
May-0
7
Sep-07
Jan-08
May-0
8
Sep-08
Jan-09
May-0
9
Sep-09
Jan-10
May-1
0
Sep-10
Jan-11
May-1
1
Sep-11
Jan-12
May-1
2
Sep-12
Jan-13
May-1
3
Sep-13
Jan-14
May-1
4
Sep-14
Jan-15
May-1
5132,000
134,000
136,000
138,000
140,000
142,000
144,000
146,000
148,000
150,000
National EmploymentJan. 2005-May 2015
Thou
sand
s of
Wor
kers
Dec. 2009:138.0 mil-
lion
Nov. 2007:146.6
million

16 to 24 25 to 54 55 and Older0.0%
10.0%
20.0%
30.0%
40.0%
50.0%
60.0%
70.0%
80.0%
90.0%
66.1%
83.6%
29.7%
63.3%
83.3%
34.5%
54.9%
81.4%
40.5%
49.6%
81.0%
41.5%
Labor Force Participation Rateby Age Group
(1992 to 2022)
1992 2002 2012 2022 (Projected)
Labo
r Fo
rce
Parti
cipa
tion
Rate
Source: Bureau of Labor Statistics© Towson University, Division of Innovation and Applied Research

Source: Bureau of Labor Statistics
Life, Physical, and Social Sciences
Legal
Education, Training, and Library
Business and Finance
Building and Grounds Cleaning and Maintenance
Community and Social Service
Computer and Mathematical
Personal Care and Service
Construction and Extraction
Healthcare Practitioners and Technicians
Health Support
10.1%
10.7%
11.1%
12.5%
12.5%
17.2%
18.0%
20.9%
21.4%
21.5%
28.1%
National Employment Projections by Major Occupational Groups
Growth above 10% (2012 to 2022)
© Towson University, Division of Innovation and Applied Research

Farming, Fishing, and Forestry
Production
Office and Administrative Support
Arts, Design, Enterntainment, Sports, and Media
Management
Archictecture and Engineering
Sales and Related
Protective Service
Transportation and Material Moving
Food Preparation and Serving Related
Installation, Maintenance, and Repair
-3.4%
0.8%
6.8%
7.0%
7.2%
7.3%
7.3%
7.9%
8.6%
9.4%
9.6%
National Employment Projections by Major Occupational Groups
Growth below 10% (2012 to 2022)
Source: Bureau of Labor Statistics© Towson University, Division of Innovation and Applied Research

© Towson University, Division of Innovation and Applied Research Source: Drew Sheneman
2004Q1
2004Q3
2005Q1
2005Q3
2006Q1
2006Q3
2007Q1
2007Q3
2008Q1
2008Q3
2009Q1
2009Q3
2010Q1
2010Q3
2011Q1
2011Q3
2012Q1
2012Q3
2013Q1
2013Q3
2014Q1
2014Q3
2015Q10
20,000
40,000
60,000
80,000
100,000
120,000
140,000
160,000
15.0%
16.0%
17.0%
18.0%
19.0%
20.0%
21.0%
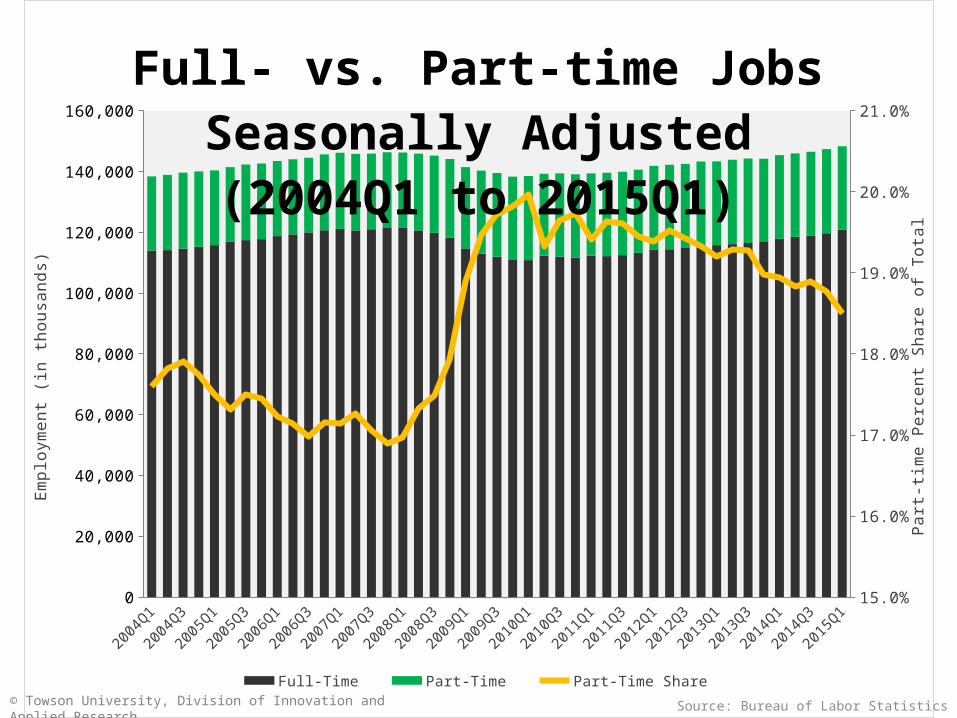
Full- vs. Part-time JobsSeasonally Adjusted (2004Q1 to
2015Q1)
Full-Time Part-Time Part-Time Share
Empl
oym
ent (
in th
ousa
nds)
Part
-tim
e Pe
rcen
t Sha
re o
f Tot
al
© Towson University, Division of Innovation and Applied Research
Source: Bureau of Labor Statistics
Source: Bureau of Labor Statistics© Towson University, Division of Innovation and Applied Research
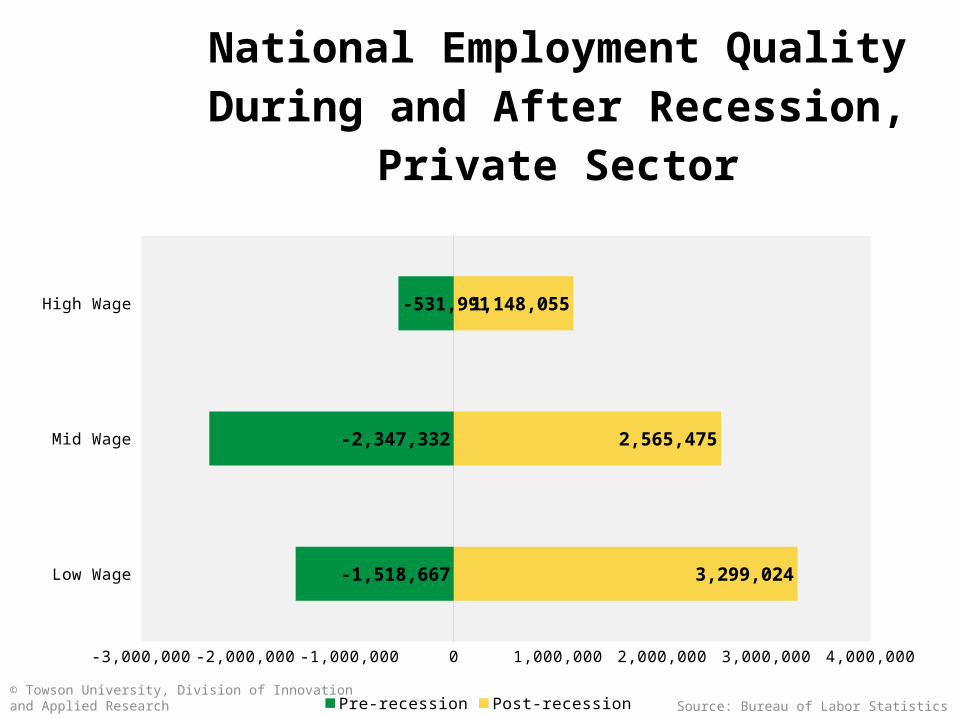
Low Wage
Mid Wage
High Wage
-3,000,000 -2,000,000 -1,000,000 0 1,000,000 2,000,000 3,000,000 4,000,000
-1,518,667
-2,347,332
-531,991
3,299,024
2,565,475
1,148,055
National Employment QualityDuring and After Recession, Private
Sector
Pre-recession Post-recession

© Towson University, Division of Innovation and Applied Research Source: Jack Ohman, Tribune Media Services

Mid-Atlantic Region GDP GrowthPercent Change, 2009 Chained Dollars
State 2007-2008
2008-2009
2009-2010
2010-2011
2012-2011
2011-2012
2012-2013
2013-2014
Maryland 1 -0.3 2.5 1.3 0.4 0.7 0.8 1
Pennsylvania 0.3 -2.1 2.2 1.1 0.7 1.5 1.8 0.3
Virginia 0 0.5 2.4 0.6 0.7 0.4 0 0
Delaware -5.6 3 0.6 1.2 -3 0.7 1.2 -5.6
DC 3.3 -1.3 2.8 1.9 0 -0.6 1.6 3.3
© Towson University, Division of Innovation & Applied Research Source: Bureau of Economic Analysis
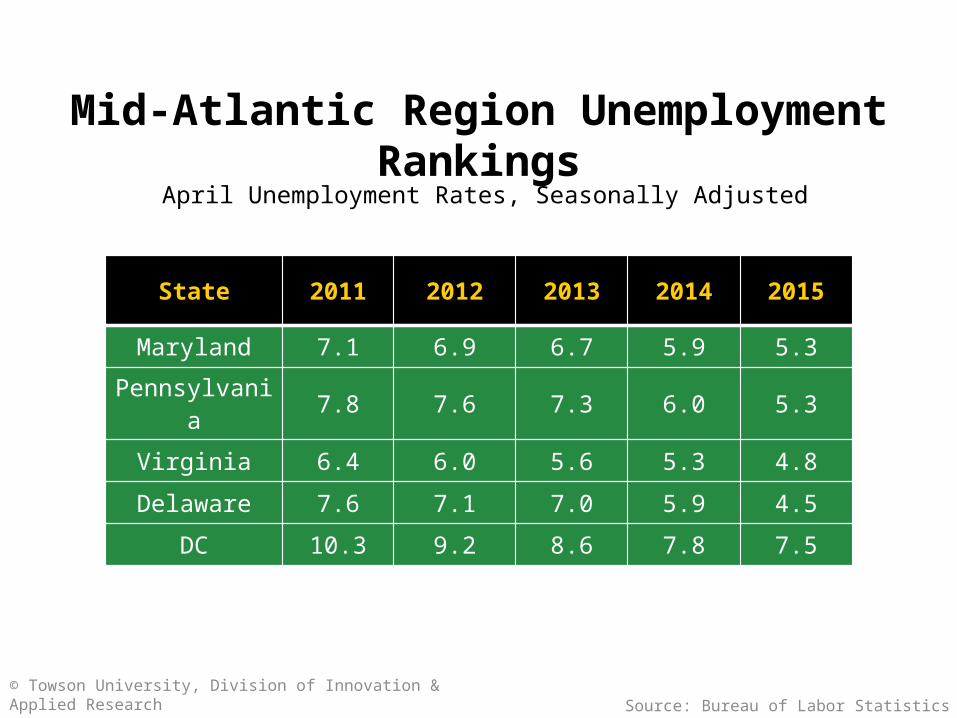
Mid-Atlantic Region Unemployment RankingsApril Unemployment Rates, Seasonally Adjusted
State 2011 2012 2013 2014 2015
Maryland 7.1 6.9 6.7 5.9 5.3
Pennsylvania 7.8 7.6 7.3 6.0 5.3
Virginia 6.4 6.0 5.6 5.3 4.8
Delaware 7.6 7.1 7.0 5.9 4.5
DC 10.3 9.2 8.6 7.8 7.5
© Towson University, Division of Innovation & Applied Research Source: Bureau of Labor Statistics

Source: Bureau of Labor Statistics
2004 2005 2006 2007 2008 2009 2010 2011 2012 2013 2014
-0.00999999999999998
1.90819582357449E-17
0.01
0.02
0.03
0.04
0.05
0.06
0.07
0.08
0.09
4.2% 4.1%3.9%
3.5%
4.4%
7.1%7.6%
7.1%6.9%
6.5%
5.8%
Maryland Historic Unemployment Rates Seasonally Adjusted (2004 to 2014)
Unem
ploy
men
t rat
e
© Towson University, Division of Innovation and Applied Research
© Towson University, Division of Innovation and Applied Research
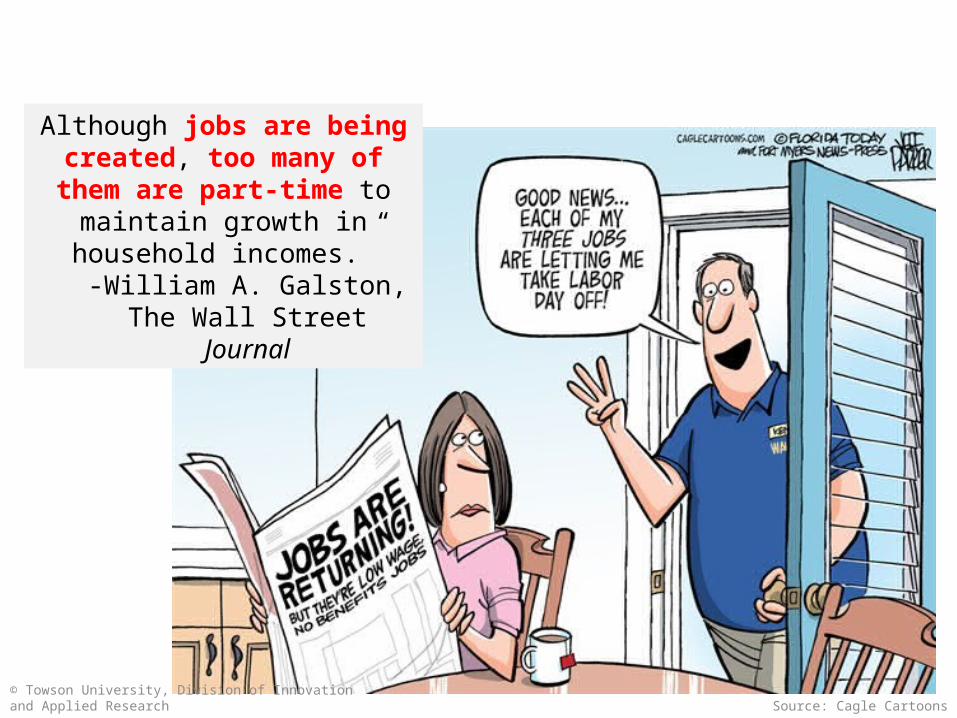
Although jobs are being created, too many of them are part-time to maintain growth in
household incomes.”-William A. Galston, The Wall
Street Journal
Source: Cagle Cartoons

Jan-04Jan-05
Jan-06Jan-07
Jan-08Jan-09
Jan-10Jan-11
Jan-12Jan-13
Jan-14Jan-15
2,600,000
2,650,000
2,700,000
2,750,000
2,800,000
2,850,000
2,900,000
2,950,000
3,000,000
3,050,000
Actual vs Needed Employment Growth in Maryland
Seasonally Adjusted (Jan. 2004 to April 2015)
Desired Employment (96.6% of Labor Force) Actual Employment
Empl
oym
ent
+38,078Jobs not realized
© Towson University, Division of Innovation and Applied Research Source: Bureau of Labor Statistics
+154,822
Employment peak:
2.9 million jobs
Employment trough:
2.8 million jobs
Jobs lost

© Towson University, Division of Innovation and Applied Research Source: RESI, Bureau of Labor Statistics
Low Wage
Mid Wage
High Wage
3,122
-59,058
8,932
42,300
19,884
11,066
Maryland Employment Growth by WageDuring and After Recession (Private
Sector)
Post-recession Pre-recession

© Towson University, Division of Innovation and Applied Research Source: Maryland DLLR, RESI
Education and Health Services
Professional and Business Services
Leisure and Hospitality
Retail Trade
Government
Trade, Transportation, and Utilities
Mining, Logging, and Construction
Financial Activities
Information
Manufacturing
-4 -2 0 2 4 6 8 10 12 14 16
14.8
9.69999999999999
7.20000000000005
4.69999999999999
3.59999999999997
3.39999999999998
3.19999999999999
0.399999999999977
0
-2
Change in Employment in MarylandSeasonally Adjusted, In Thousands,
April 2014-2015

© Towson University, Division of Innovation and Applied Research Source: Newsday
Jan-2004
May-2
004
Sep-2004
Jan-2005
May-2
005
Sep-2005
Jan-2006
May-2
006
Sep-2006
Jan-2007
May-2
007
Sep-2007
Jan-2008
May-2
008
Sep-2008
Jan-2009
May-2
009
Sep-2009
Jan-2010
May-2
010
Sep-2010
Jan-2011
May-2
011
Sep-2011
Jan-2012
May-2
012
Sep-2012
Jan-2013
May-2
013
Sep-2013
Jan-2014
May-2
014
Sep-14
Jan-15100
110
120
130
140
150
160
170
180
190
200
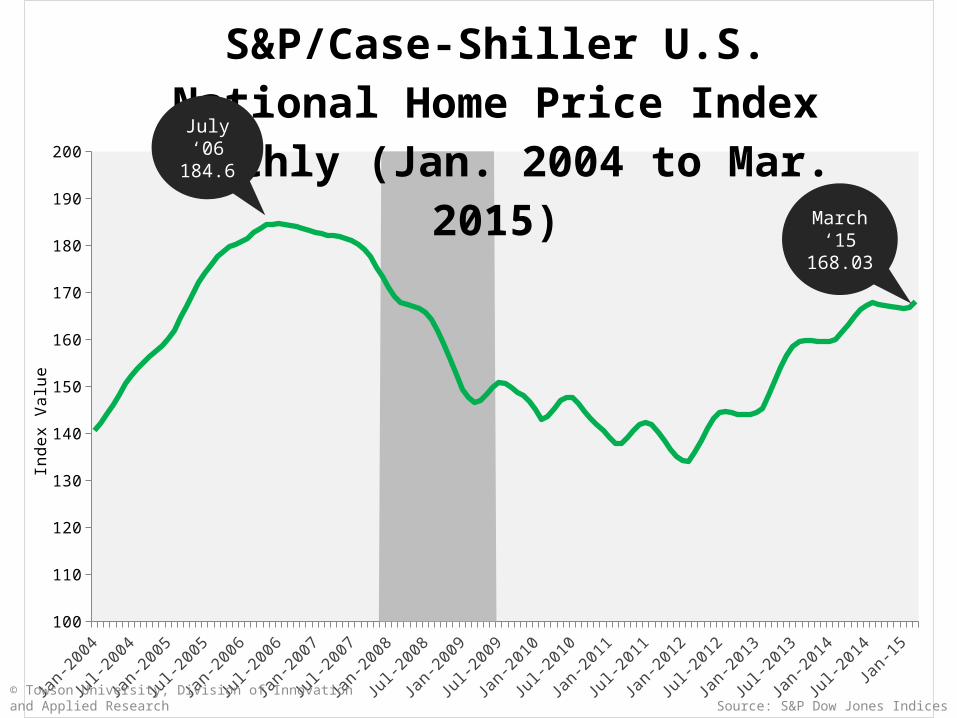
S&P/Case-Shiller U.S. National Home Price Index
Monthly (Jan. 2004 to Mar. 2015)
Inde
x Va
lue
© Towson University, Division of Innovation and Applied Research Source: S&P Dow Jones Indices
July ‘06184.6
March ‘15
168.03

Jan 1981
Jan 1982
Jan 1983
Jan 1984
Jan 1985
Jan 1986
Jan 1987
Jan 1988
Jan 1989
Jan 1990
Jan 1991
Jan 1992
Jan 1993
Jan 1994
Jan 1995
Jan 1996
Jan 1997
Jan 1998
Jan 1999
Jan 2000
Jan 2001
Jan 2002
Jan 2003
Jan 2004
Jan 2005
Jan 2006
Jan 2007
Jan 2008
Jan 2009
Jan 2010
Jan 2011
Jan 2012
Jan 2013
Jan 2014
Jan 20150
500
1,000
1,500
2,000
2,500
Housing Starts in U.S.(Jan. 1981 to May 2015)
Current Level – May 2015
© Towson University, Division of Innovation and Applied Research
Sources: US Census Bureau, Department of Housing and Urban Development
Tota
l Priv
atel
y-O
wne
d, In
thou
sand
s
May2015: 1,036

2012Q1
2012Q2
2012Q3
2012Q4
2013Q1
2013Q2
2013Q3
2013Q4
2014Q1
2014Q2
2014Q3
2014Q4
2015Q1
2015Q2
2015Q3
2015Q4
2016Q1
2016Q2
2016Q3
2016Q40
50
100
150
200
250
300
350
400
450
0.0%
1.0%
2.0%
3.0%
4.0%
5.0%
6.0%
$254 $263
$342
$388 $388
$354
$206
$155
$123 $118 $115$128
$175 $170
$108$98 $98 $96 $95 $91
Mortgage Refinance Loans and 30-Year Fixed Rate
U.S. Actual and Projected, 2012Q1 through 2016Q4
Mortgage Refinance Originations 30-Year FRM
Loan
Am
ount
(bill
ions
)
Fixe
d Ra
te
Source: Mortgage Bankers Association
© Towson University, Division of Innovation and Applied Research
ProjectionsMeasured

© Towson University, Division of Innovation and Applied Research Source: Pittsburgh Post-Gazette

0
2
4
6
8
10
12
0
5,000
10,000
15,000
20,000
25,000
30,000
35,000
40,000
Janu
ary
Febr
uary
Mar
chAp
rilM
ayJu
neJu
lyAu
gust
Sept
embe
rO
ctob
erN
ovem
ber
Dece
mbe
rJa
nuar
yFe
brua
ryM
arch
April
May
June
July
Augu
stSe
ptem
ber
Oct
ober
Nov
embe
rDe
cem
ber
Janu
ary
Febr
uary
Mar
chAp
rilM
ayJu
neJu
lyAu
gust
Sept
embe
rO
ctob
erN
ovem
ber
Dece
mbe
rJa
nuar
yFe
brua
ryM
arch
April
May
June
July
Augu
st
SeptemberOct
ober
Nov
embe
rDe
cem
ber
Janu
ary
Febr
uary
Mar
chAp
rilM
ay
Months of Inventory vs. Active InventoryMaryland (2011 to 2015)
Months of Inventory Active Inventory
Mon
ths
Hom
es
Source: Maryland Association of Realtors
© Towson University, Division of Innovation and Applied Research
2011 2012 2013 2014 2015

Source: Maryland Association of Realtors
© Towson University, Division of Innovation and Applied Research
Jan-08
Apr-08Jul-0
8
Oct-08Jan-09
Apr-09Jul-0
9
Oct-09Jan-10
Apr-10Jul-1
0
Oct-10Jan-11
Apr-11Jul-1
1
Oct-11Jan-12
Apr-12Jul-1
2
Oct-12Jan-13
Apr-13Jul-1
3
Oct-13Jan-14
Apr-14Jul-1
4
Oct-14Jan-15
Apr-15
$0
$50,000
$100,000
$150,000
$200,000
$250,000
$300,000
$350,000
$400,000
0
1,000
2,000
3,000
4,000
5,000
6,000
7,000
8,000
Maryland Home Prices vs. Sales(Jan. 2008 to May 2015)
Average Price Units Sold
Aver
age
Pric
e
Uni
ts S
old
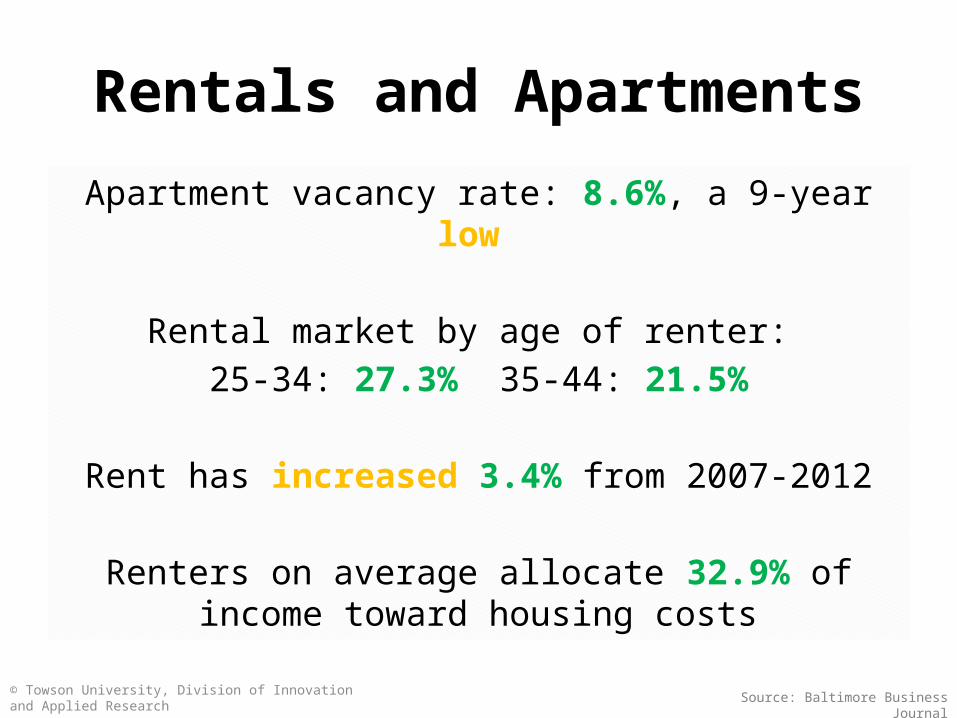
Rentals and Apartments
Apartment vacancy rate: 8.6%, a 9-year low
Rental market by age of renter: 25-34: 27.3% 35-44: 21.5%
Rent has increased 3.4% from 2007-2012
Renters on average allocate 32.9% of income toward housing costs
Source: Baltimore Business Journal© Towson University, Division of Innovation and Applied Research

2005Q1
2005Q3
2006Q1
2006Q3
2007Q1
2007Q3
2008Q1
2008Q3
2009Q1
2009Q3
2010Q1
2010Q3
2011Q1
2011Q3
2012Q1
2012Q3
2013Q1
2013Q3
2014Q1
2014Q3
2015Q10
20
40
60
80
100
120
140
160
180
0.0
2.0
4.0
6.0
8.0
10.0
12.0
14.0
16.0
Maryland Rental Vacancy Rate and Building Permits for Buildings with 5+ Units in Maryland
2005-2015
Building Permits for Structures with 5 Units or More Rental Vacancy Rate
Perc
ent V
acan
t
Build
ing
Perm
its fo
r 5+
Uni
t Str
uctu
res
© Towson University, Division of Innovation and Applied Research Source: U.S. Census Bureau
© Towson University, Division of Innovation and Applied Research Source: U.S. Census Bureau
2005Q1
2005Q3
2006Q1
2006Q3
2007Q1
2007Q3
2008Q1
2008Q3
2009Q1
2009Q3
2010Q1
2010Q3
2011Q1
2011Q3
2012Q1
2012Q3
2013Q1
2013Q3
2014Q1
2014Q3
2015Q10
20
40
60
80
100
120
140
160
180
200
0.0
2.0
4.0
6.0
8.0
10.0
12.0
14.0
16.0
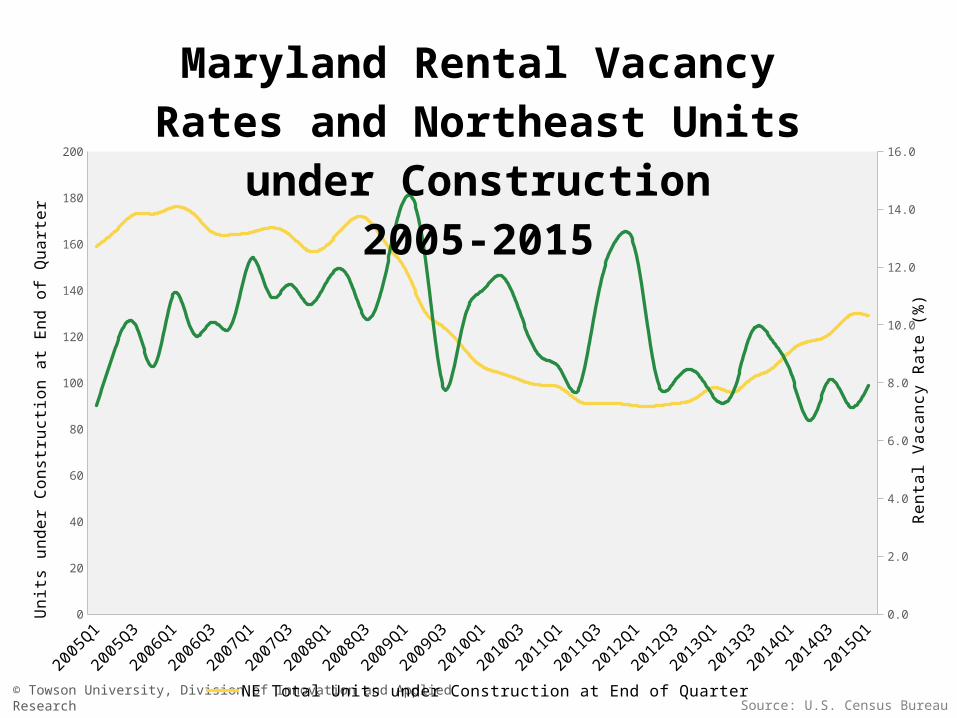
Maryland Rental Vacancy Rates and Northeast Units under Construction
2005-2015
NE Total Units under Construction at End of Quarter MD Rental Vacancy Rate
Uni
ts u
nder
Con
stru
ction
at E
nd o
f Qua
rter
Rent
al V
acan
cy R
ate
(%)
© Towson University, Division of Innovation and Applied Research Source: Mark Anderson

© Towson University, Division of Innovation & Applied Research Source: Bureau of Labor Statistics
Jan Feb Mar Apr May Jun Jul Aug Sep Oct Nov Dec Jan Feb Mar Apr2014 2014 2014 2014 2014 2014 2014 2014 2014 2014 2014 2014 2015 2015 2015 2015
0.0
1.0
2.0
3.0
4.0
5.0
6.0
7.0
Harford County Unemployment Rate
Not Seasonally Adjusted
Harford County Maryland
Perc
ent U
nem
ploy
men
t

- 50,000 100,000 150,000 200,000 250,000 300,000 0.0%
5.0%
10.0%
15.0%
20.0%
25.0%
30.0%
35.0%
Anne Arundel281,795
Mid-Maryland279,480
Frederick137,236
Montgomery628,899
Southern Maryland137,913
Upper Shore78,207
Baltimore571,721
Baltimore City367,444
Lower Shore99,802
Prince George's367,775
Susquehanna142,018
Western Maryland140,135
2010-2020 Job Openings
2010
-201
0 Em
ploy
men
t G
row
th
Source: Maryland Department of Labor, Licensing and Regulation
Employment Growth and Job Openingsby WIA (2010 to 2020)
Wes
tern
Mar
ylan
d &
Eas
tern
Sho
re
Cen
tral
Mar
ylan
d
© Towson University, Division of Innovation and Applied Research
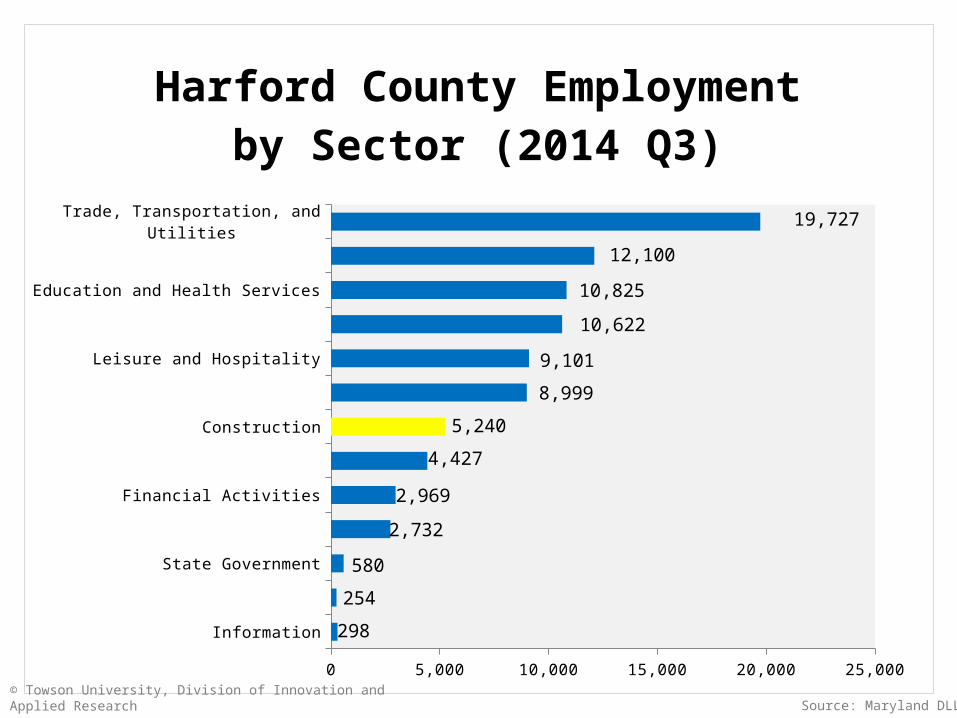
Information
Natural Resources and Mining
State Government
Other Services/Unclassified
Financial Activities
Manufacturing
Construction
Local Government
Leisure and Hospitality
Professional and Business Services
Education and Health Services
Federal Government
Trade, Transportation, and Utilities
0 5,000 10,000 15,000 20,000 25,000
298
254
580
2,732
2,969
4,427
5,240
8,999
9,101
10,622
10,825
12,100
19,727
Harford County Employment by Sector (2014 Q3)
Source: Maryland DLLR© Towson University, Division of Innovation and Applied Research

Source: Maryland DLLR© Towson University, Division of Innovation and Applied Research
Professional and Business Services
Construction
Leisure and Hospitality
Other Services
Financial Activities
Natural Resources and Mining
Education and Health Services
Information
Trade, Transportation, and Utilities
Manufacturing
-300 -200 -100 0 100 200 300 400 500 600
467
431
296
46
41
1
-42
-48
-77
-187
Harford County Employment Change
2013 Q3 - 2014 Q3
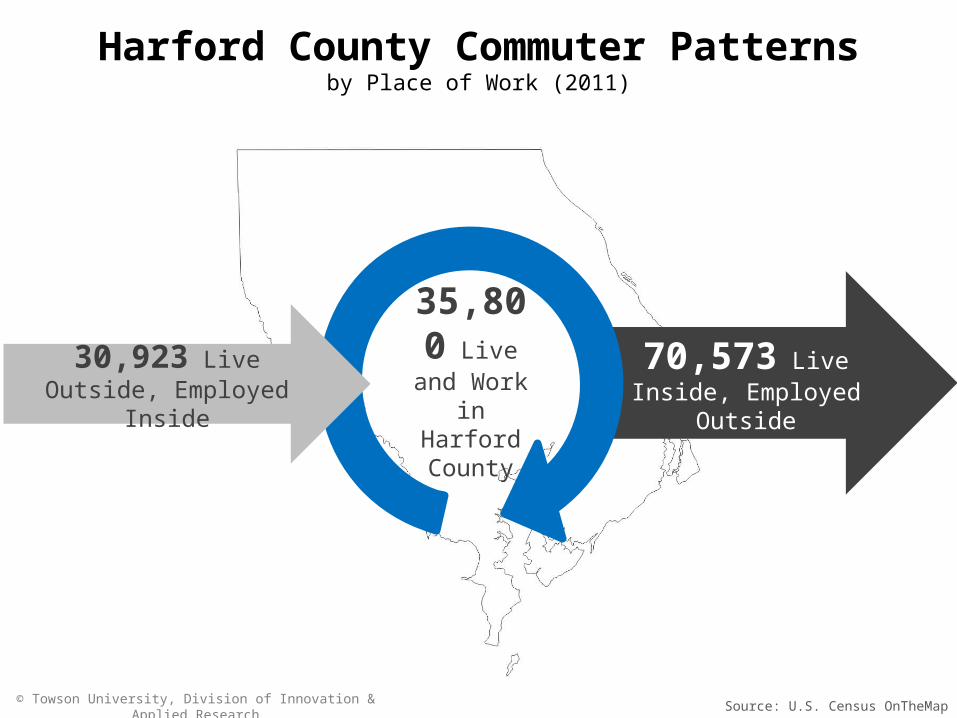
Harford County Commuter Patternsby Place of Work (2011)
Source: U.S. Census OnTheMap© Towson University, Division of Innovation & Applied Research
70,573 Live Inside, Employed Outside
30,923 Live Outside, Employed Inside
35,800 Live and Work in Harford County
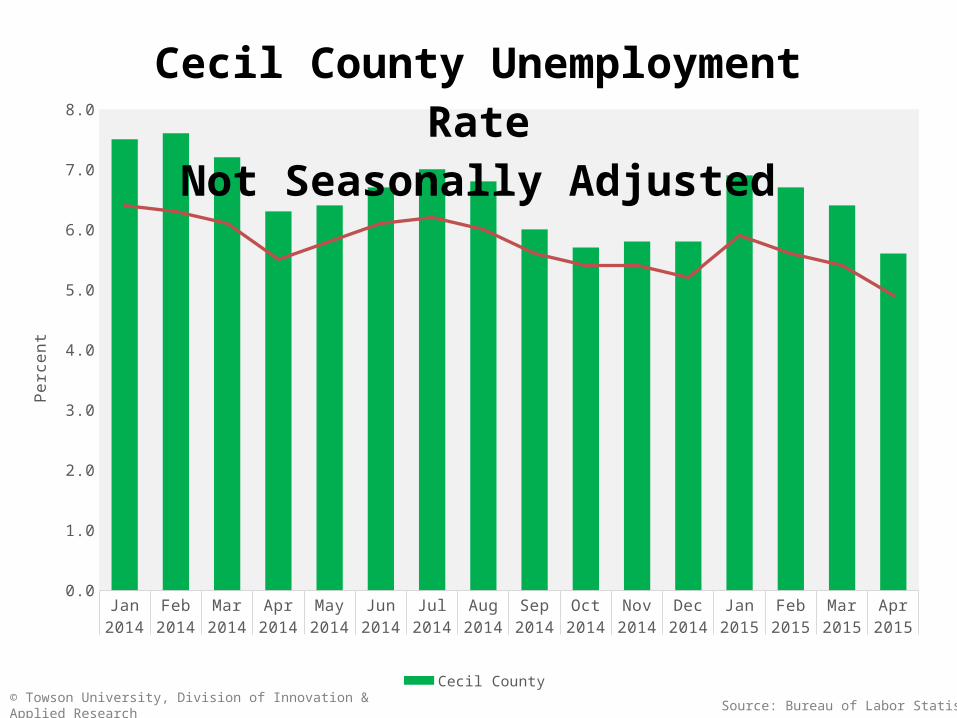
Jan Feb Mar Apr May Jun Jul Aug Sep Oct Nov Dec Jan Feb Mar Apr2014 2014 2014 2014 2014 2014 2014 2014 2014 2014 2014 2014 2015 2015 2015 2015
0.0
1.0
2.0
3.0
4.0
5.0
6.0
7.0
8.0
Cecil County Unemployment RateNot Seasonally Adjusted
Cecil County Maryland
Perc
ent
Source: Bureau of Labor Statistics© Towson University, Division of Innovation & Applied Research

© Towson University, Division of Innovation and Applied Research
Information
State Government
Financial Activities
Other Services/Unclassified
Natural Resources and Mining
Construction
Professional & Business Services
Federal Government
Local Government
Education & Health Services
Manufacturing
Leisure and Hospitality
Trade, Transportation, and Utilities
0 1000 2000 3000 4000 5000 6000 7000
112
547
604
838
937
1,160
1,693
1,746
3,554
4,073
4,261
4,845
6,450
Cecil County Employment by Sector 2014 Q3
Source: Maryland DLLR

© Towson University, Division of Innovation and Applied Research Source: Maryland DLLR
Leisure and Hospitality
Education and Health Services
Other Services
Natural Resources and Mining
Professional and Business Services
Construction
Manufacturing
Information
Financial Activities
Trade, Transportation, and Utilities
-150 -100 -50 0 50 100 150 200 250 300
266
100
36
23
0
-3
-6
-14
-45
-111
Cecil County Employment Change 2013 Q3-2014 Q3

Cecil County Commuter Patternsby Place of Work (2011)
Source: U.S. Census OnTheMap© Towson University, Division of Innovation & Applied Research
29,053 Live Inside, Employed Outside
13,012 Live Outside, Employed Inside
12,876 Live and
Work in Cecil County
© Towson University, Division of Innovation and Applied Research
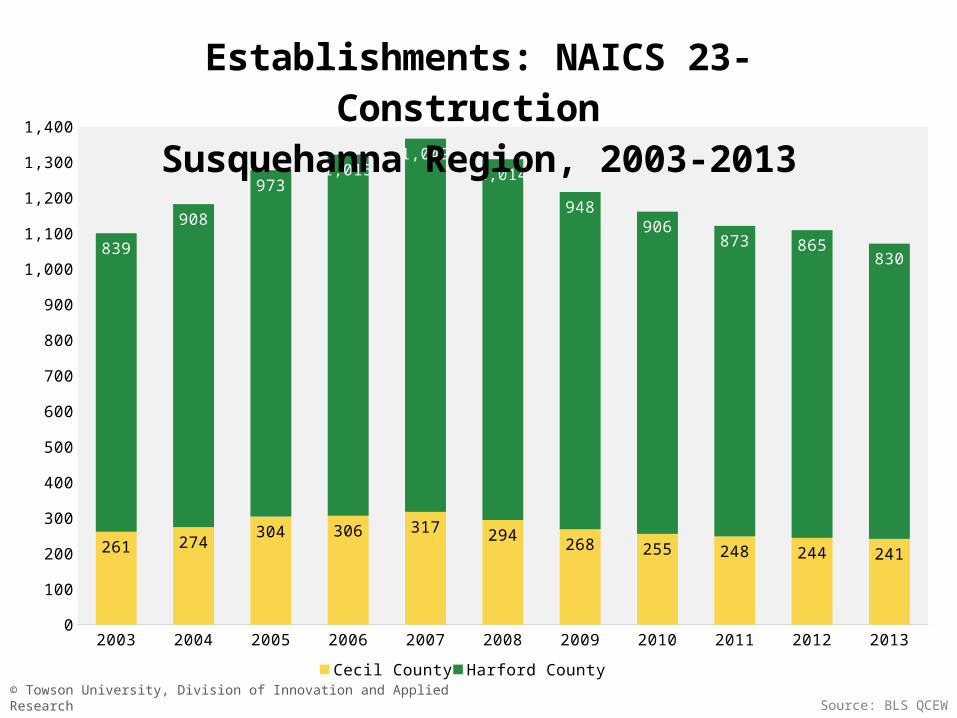
2003 2004 2005 2006 2007 2008 2009 2010 2011 2012 20130
100
200
300
400
500
600
700
800
900
1,000
1,100
1,200
1,300
1,400
261 274304 306 317 294 268 255 248 244 241
839
908
9731,015
1,0491,014
948906
873 865830
Establishments: NAICS 23-Construction Susquehanna Region, 2003-2013
Cecil County Harford County
Source: BLS QCEW
© Towson University, Division of Innovation and Applied Research
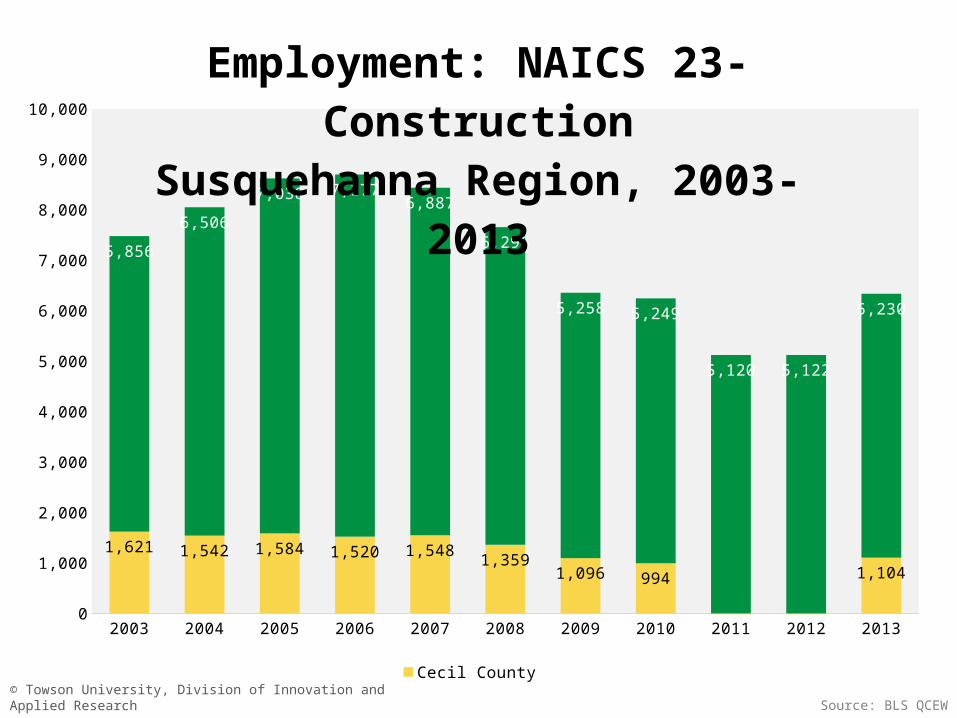
2003 2004 2005 2006 2007 2008 2009 2010 2011 2012 20130
1,000
2,000
3,000
4,000
5,000
6,000
7,000
8,000
9,000
10,000
1,621 1,542 1,584 1,520 1,548 1,3591,096 994 1,104
5,856
6,506
7,038 7,1776,887
6,296
5,258 5,249
5,120 5,122
5,230
Employment: NAICS 23-Con-struction
Susquehanna Region, 2003-2013
Cecil County Harford County
Source: BLS QCEW

Moody’s ratings
• Cecil County– Rated Aa2 in May 2014
• Harford County– One of 37 local
governments with Aaa rating
© Towson University, Division of Innovation and Applied ResearchSources: Cecil County Government,
Moody’s

© Towson University, Division of Innovation and Applied Research Source: Alexei Talimonov

2007 2008 2009 2010 2011 2012 2013 2014 2015 2016 2017-3.0%
-2.0%
-1.0%
0.0%
1.0%
2.0%
3.0%
2,650,000
2,700,000
2,750,000
2,800,000
2,850,000
2,900,000
2,950,000
3,000,000
2.1%
-0.6%
-2.6%
-1.1%
1.8%2.0% 2.0%
0.5% 0.5%0.3% 0.3%
RESI Employment OutlookTotal Nonfarm Employment
Growth (2007 to 2017)
Percent Change Employment
Perc
ent C
hang
e
Tota
l Non
farm
Em
ploy
men
t
actual projections
© Towson University, Division of Innovation and Applied Research Source: RESI
© Towson University, Division of Innovation and Applied Research Source: RESI
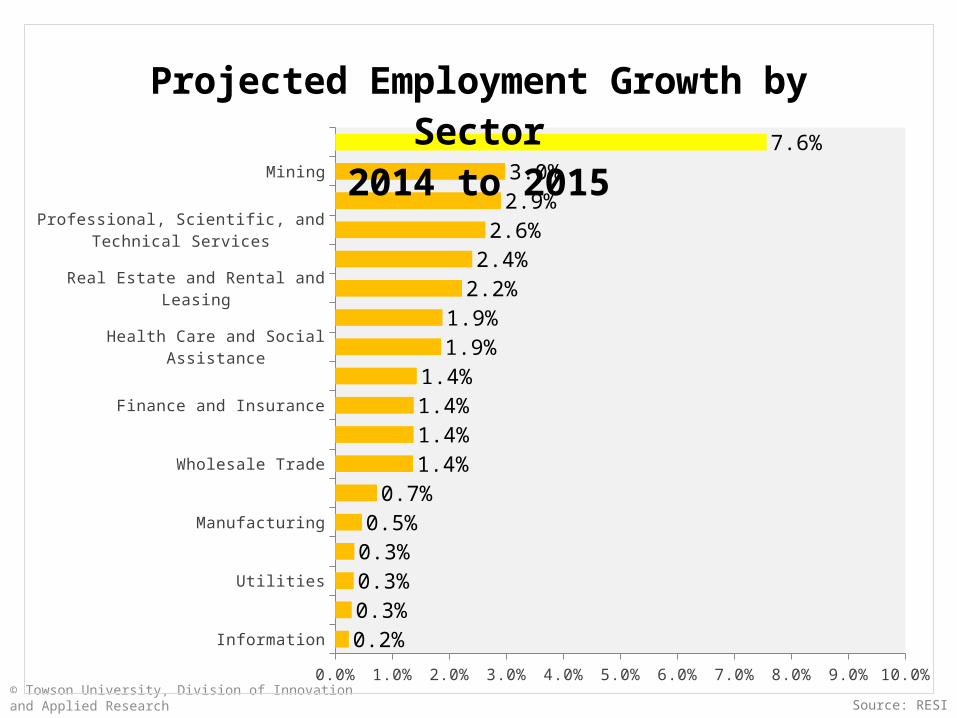
Information
Other Services, except Public Administration
Utilities
Arts, Entertainment, and Recreation
Manufacturing
Transportation and Warehousing
Wholesale Trade
Management of Companies and Enterprises
Finance and Insurance
Retail Trade
Health Care and Social Assistance
Educational Services
Real Estate and Rental and Leasing
Administrative and Waste Management Services
Professional, Scientific, and Technical Services
Accommodation and Food Services
Mining
Construction
0.0% 1.0% 2.0% 3.0% 4.0% 5.0% 6.0% 7.0% 8.0% 9.0% 10.0%
0.2%0.3%0.3%0.3%0.5%
0.7%1.4%1.4%1.4%1.4%
1.9%1.9%
2.2%2.4%
2.6%2.9%3.0%
7.6%
Projected Employment Growth by Sector2014 to 2015
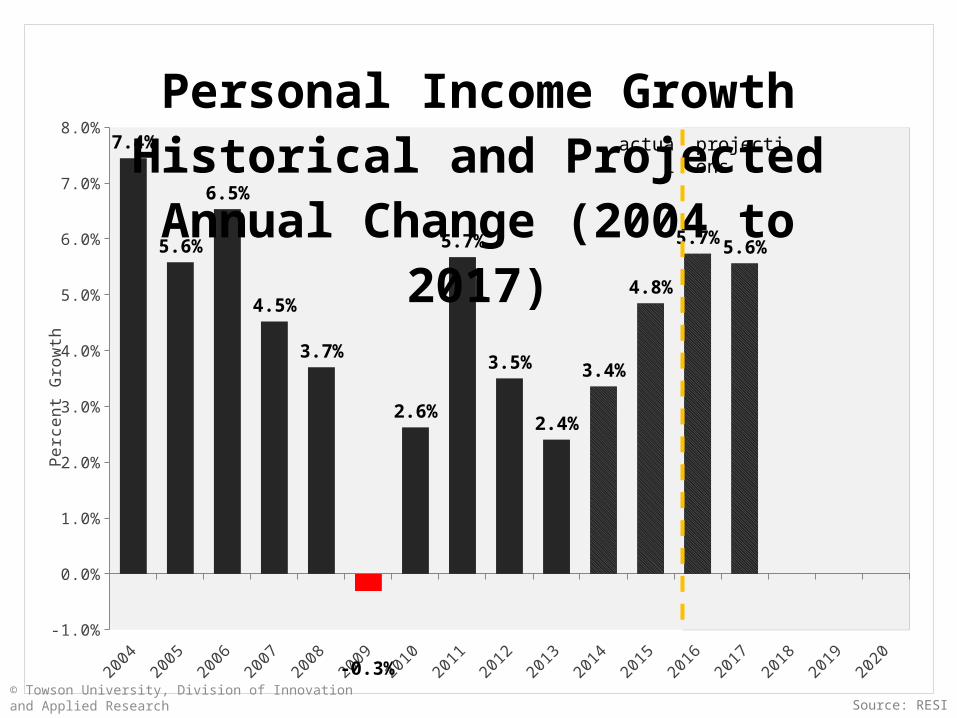
20042005
20062007
20082009
20102011
20122013
20142015
20162017
20182019
2020-1.0%
0.0%
1.0%
2.0%
3.0%
4.0%
5.0%
6.0%
7.0%
8.0%7.4%
5.6%
6.5%
4.5%
3.7%
-0.3%
2.6%
5.7%
3.5%
2.4%
3.4%
4.8%
5.7% 5.6%
Personal Income GrowthHistorical and Projected Annual
Change (2004 to 2017)
Perc
ent G
row
th
© Towson University, Division of Innovation and Applied Research Source: RESI
actual projections

Economic Impact Analysis | Policy Analysis | Fiscal Impact Analysis | Survey Development and Analysis | Economic Forecasting | Market Feasibility Analysis | Workforce and Commuter Analysis | Tax Policy Solutions | Economic Development Planning & Strategy | Cost Benefit Analysis | Environmental Policy Analysis | Stakeholder and Community Engagement | Zoning and Land Use Analysis | Real Estate Analysis | Community Impact Analysis | Economic Impact Analysis | Policy Analysis | Fiscal Impact Analysis | Survey Development and Analysis | Economic Forecasting | Market Feasibility Analysis | Workforce and Commuter Analysis | Tax Policy Solutions | Economic Development Planning & Strategy | Cost Benefit Analysis | Environmental Policy Analysis | Stakeholder and Community Engagement | Zoning and Land Use Analysis | Real Estate Analysis | Community Impact Analysis | Economic Impact Analysis | Policy Analysis | Fiscal Impact Analysis | Survey Development and Analysis | Economic Forecasting | Market Feasibility Analysis | Workforce and Commuter Analysis | Tax Policy Solutions | Economic Development Planning & Strategy | Cost Benefit Analysis | Environmental Policy Analysis | Stakeholder and Community Engagement | Zoning and Land Use Analysis | Real Estate Analysis | Community Impact Analysis | Economic Impact Analysis | Policy Analysis | Fiscal Impact Analysis | Survey Development and Analysis | Economic Forecasting | Market Feasibility Analysis | Workforce and Commuter Analysis | Tax Policy Solutions | Economic Development Planning & Strategy | Cost Benefit Analysis | Environmental Policy Analysis | Stakeholder and Community Engagement | Zoning and Land Use Analysis | Real Estate Analysis | Community Impact Analysis | Economic Impact Analysis | Policy Analysis | Fiscal Impact Analysis | Survey Development and Analysis | Economic Forecasting | Market Feasibility Analysis | Workforce and Commuter Analysis | Tax Policy Solutions | Economic Development Planning & Strategy | Cost Benefit Analysis | Environmental Policy Analysis | Stakeholder and Community Engagement | Zoning and Land Use Analysis | Real Estate Analysis | Community Impact Analysis |
© Towson University, Division of Innovation and Applied Research
THANK YOU
Learn More About RESI’s Projects and Services
Towson.edu/innovation/RESI
@RESIofTU
TUinnovates.com


