210
Symbolizing Growth 2017 ANNUAL REPORT
SymbolizingGrowth
2017ANNUALREPORT

SymbolizingGrowth
SymbolizingGrowthWe symbolize growth with every move we make. Our defined strategy helps us to choose a pathway that enhance our efficiency in every way possible and leads us towards success. The excellence we churn speaks for itself with the values and persistence that are keenly embedded in it.
We at Thatta Cement, symbolize growth with the priorities and actions that set us apart and refine the organization with advancement as we proceed.
CONTENTSVision
Mission
Company Information
Group Structure
Nature of Business
Geographical Presence
Management’s Strategic Objectives
Board of Directors
Organisational Structure
Code of Conduct
Director’s Report
Key Operating and Financial Statistics of Six Years
Combined Pattern of CDC and Physical Shareholdings
Pattern of Shareholdings - CDC and Physical
Shareholders Engagement
Corporate Governance
Whistleblower Policy
IT Governance Policy
Corporate Social Responsibility
Quality Management
Additional Information
Financial Highlights
Unconsolidated Financial Statements
Consolidated Financial Statements
Bank Account Information Form
Form of Proxy
Jama Punji
2
3
4
5
6
7
8
11
16
17
19
41
42
43
45
53
65
66
67
72
73
77
95
145
199
201
203
To transform the company into
a modern and dynamic cement
manufacturing unit fully equipped
to play a meaningful role on sustainable
basis in the economy
of Pakistan.
VIsionForesight of the Future

MissionProsperity with a Purpose
• To provide quality
products to customers at
competitive prices; and
• To generate sufficient
profit to add to the
shareholder’s value.
04
Thatta Cement
COMPANY INFORMATIONBOARD OF DIRECTORSMr. Khawaja Muhammad Salman Younis ChairmanMr. Shahid Aziz Siddiqui DirectorMr. Agha Sher Shah DirectorMr. Saleem Zamindar DirectorMr. Attaullah A. Rasheed DirectorMr. Muhammad Fazlullah Shariff Chief ExecutiveMr. Muhammad Taha Hamdani Director
AUDIT COMMITTEEMr. Attaullah A. Rasheed ChairmanMr. Khawaja Muhammad Salman Younis MemberMr. Shahid Aziz Siddiqui MemberMr. Saleem Zamindar Member
HR & REMUNERATION COMMITTEEMr. Saleem Zamindar ChairmanMr. Shahid Aziz Siddiqui MemberMr. Agha Sher Shah MemberMr. Muhammad Fazlullah Shariff Member
CHIEF FINANCIAL OFFICER & COMPANY SECRETARY Muhammad Taha Hamdani
STATUTORY AUDITORM/s Grant Thornton Anjum Rahman, Chartered Accountants
CORPORATE ADVISOR M/s Shekha & Mufti, Chartered Accountants
LEGAL ADVISORM/s Usmani & Iqbal
BANKERS - ConventionalSindh Bank LimitedNational Bank of PakistanSummit Bank LimitedSilk Bank Limited
REGISTERED OFFICEOffice No. 606-608A,Continental Trade Center,Block 8, Clifton, Karachi.UAN: 0092-21-111-842-882Fax no.: 0092-21-35303074-75Website: www.thattacement.comE-mail: [email protected]
FACTORYGhulamullah Road, Makli,District Thatta, Sindh 73160
SHARE REGISTRARTHK Associates (Pvt) Limited1st Floor, 40-C, Block-6, P.E.C.H.S.,Karachi-75400UAN: 021-111-000-322 Fax: 021-34168271Website: www.thk.com.pk
05
Annual Report 2017
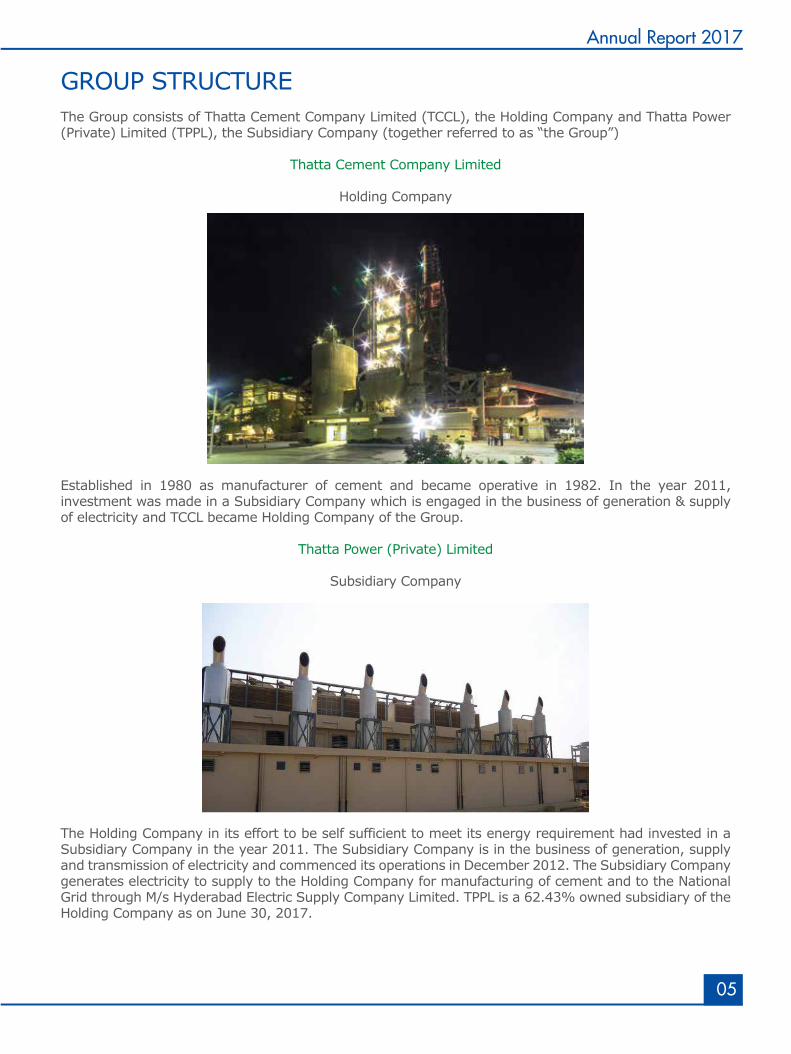
GROUP STRUCTURE The Group consists of Thatta Cement Company Limited (TCCL), the Holding Company and Thatta Power (Private) Limited (TPPL), the Subsidiary Company (together referred to as “the Group”)
Thatta Cement Company Limited
Holding Company
Established in 1980 as manufacturer of cement and became operative in 1982. In the year 2011, investment was made in a Subsidiary Company which is engaged in the business of generation & supply of electricity and TCCL became Holding Company of the Group.
Thatta Power (Private) Limited
Subsidiary Company
The Holding Company in its effort to be self sufficient to meet its energy requirement had invested in a Subsidiary Company in the year 2011. The Subsidiary Company is in the business of generation, supply and transmission of electricity and commenced its operations in December 2012. The Subsidiary Company generates electricity to supply to the Holding Company for manufacturing of cement and to the National Grid through M/s Hyderabad Electric Supply Company Limited. TPPL is a 62.43% owned subsidiary of the Holding Company as on June 30, 2017.
06
Thatta Cement
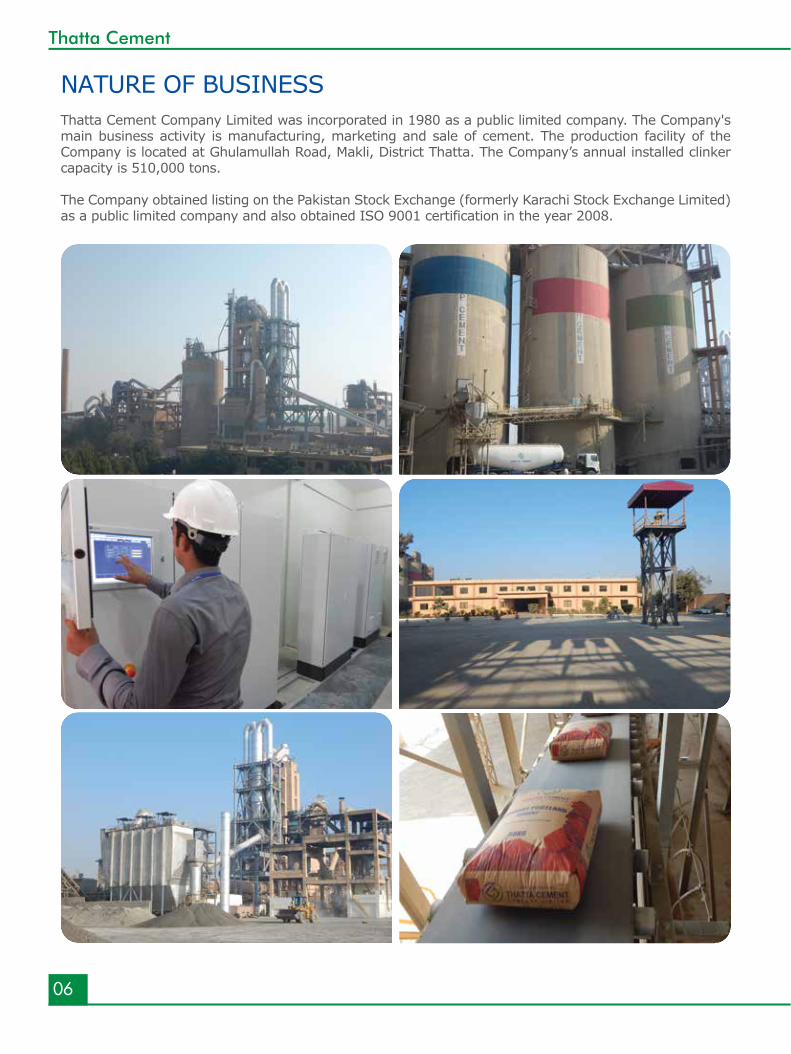
NATURE OF BUSINESSThatta Cement Company Limited was incorporated in 1980 as a public limited company. The Company's main business activity is manufacturing, marketing and sale of cement. The production facility of the Company is located at Ghulamullah Road, Makli, District Thatta. The Company’s annual installed clinker capacity is 510,000 tons.
The Company obtained listing on the Pakistan Stock Exchange (formerly Karachi Stock Exchange Limited) as a public limited company and also obtained ISO 9001 certification in the year 2008.
07
Annual Report 2017
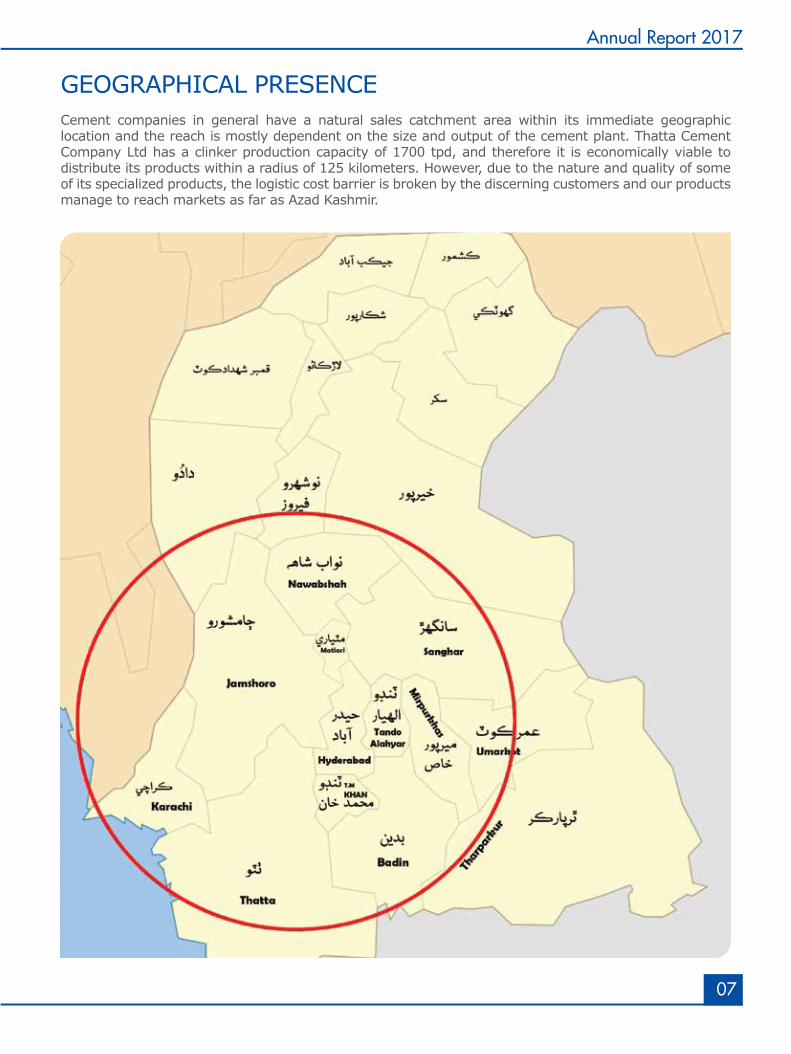
GEOGRAPHICAL PRESENCECement companies in general have a natural sales catchment area within its immediate geographic location and the reach is mostly dependent on the size and output of the cement plant. Thatta Cement Company Ltd has a clinker production capacity of 1700 tpd, and therefore it is economically viable to distribute its products within a radius of 125 kilometers. However, due to the nature and quality of some of its specialized products, the logistic cost barrier is broken by the discerning customers and our products manage to reach markets as far as Azad Kashmir.
08
Thatta Cement
MANAGEMENT’S STRATEGIC OBJECTIVES• We intend to increase the value in long term through sustainable and result-oriented growth by
providing high-performance, innovative and cost effective solutions aimed at customers evolving needs.
• We aim to recruit the right talent to mentor future leaders, cascading knowledge to create a culture of values and competitiveness.
• We incorporate ecological and social targets in our business strategy to protect the climate and biodiversity, as well as our social responsibility
Objectives and Strategies:
Management's objectives, strategies for meeting those objectives and relationship between entity’s results and management’s objectives:
OBJECTIVE 1: To Enhance sales
Strategy: Sales enhancement through increased market share.
Status: The Company has surpassed its Annual sales targets
Relationship between Company’s result and management’s objective:
The Company has achieved highest sales ever in its 35 years history. The Company’s sales have increased by 28.48% as compared to the previous year. Sales volume also increased by 35.84%.
OBJECTIVE 2: Maintain and improve industry position
Strategy: Technological advancements and continuously upgrade its production facilities to maximize efficiency.
Status: Ongoing process
Relationship between Company’s result and management’s objective:
During the year sales volume of the Company has shown remarkable improvement. Capacity utilization of the plant during the year stood at 100.5% as compared to 75.02% in the previous year. Overall clinker production was higher by 34.03% as compared to the last year whereas cement production was higher by 13.40% than that of the previous year.
OBJECTIVE 3 : Cost Reduction
Strategy: To optimize resource utilization by adopting cutting edge technology.
Status: Ongoing process
Relationship between Company’s result and management’s objective:
The Company has completed various improvement projects to achieve more efficient results.
09
Annual Report 2017
OBJECTIVE 4 : Maintaining balance between economic progress, social responsibility and environmental protection
Strategy: To provide sustainable livelihood to the society and to minimize the adverse effect on environment.
Status: Ongoing process
Relationship between Company’s result and management’s objective:
The Company invested huge capital on environmental impact control equipment and practices like dust cyclones, bag houses, damping down dust suppression, electrostatic precipitators, personal protective equipment and speed limit controls in Company’s premises to overcome RSPM (respirable suspended particulate matter) and FRD (fugitive road dust).
SIGNIFICANT CHANGES IN OBJECTIVES & STRATEGIES
The strategies and objectives of the Company were well planned and no significant changes have occurred during the year affecting Company’s operations.

10
Thatta Cement
This page is intentionally left blank
Board of Directors
Defining Directions to ExcelOur legacy of leaders has always been one of a kind. They are the ones we look forward to for excelling and practicing to meet all challenges.
12
Thatta Cement
Mr. Khawaja Muhammad Salman YounisChairman
Dato' Khawaja Muhammad Salman Younis has over 30 years of experience in banking industry covering services, support, information technology, business development, corporate finance, advisory, risk management, re-structuring, process re-engineering, project management, asset management, private equity, regulatory and anti-money laundering compliance, administration and training.
Prior to founding and joining the Al - Tayseer Group, Mr. Salman Younis was with one of the world's leading Islamic banks based out of the GCC where he was responsible for setting up the Bank's operations in Malaysia in 2005 in a record of 5 months, and helming the bank as its Managing Director for 3 years during which time the Bank was voted as the Best Islamic Bank in the World by Islamic Finance News in 2006. He was also instrumental in setting up the Bank's representative offices in Australia and Singapore and its asset management was one of the first Islamic Fund Management Companies to be licensed by the Securities Commissions of Malaysia.
He has worked for the Citi Group from November 1981 to August 2001. Between 1981 and 1996, he worked in various capacities with the Saudi American Bank, now known as SAMBA. In areas of services, support and information technology and later with the corporate and investment group where he concluded several high profile structured deals in oil and gas, petrochemical, shipping, water and power, high tech operation and maintenance, infrastructure development, contracting and trading. During his stay with SAMBA, he witnessed three economic down turns and was also involved in remedial management of complex credits and several successful re-structuring and re-scheduling.
In September 1996, he was transferred from SAMBA to Citi Bahrain and was part of the team responsible for setting up Citi Islamic Investment Bank (CIIB), the first Islamic bank to set up as an International Financial Institution. In 1998, he was promoted and appointed as Managing Director of CIIB and Head of Global Islamic Finance. At CIIB, he developed a range of Islamic banking products and also structured first time Shariah compatible deals for clients in Eastern Europe, Brazil, Korea and Taiwan among others.
13
Annual Report 2017
Mr. Shahid Aziz SiddiquiDirector
Mr. Shahid Aziz Siddiqui has lead various government organizations including Chairman of State Life Corporation of Pakistan and Chairman of National Highway Authority. He has also served as Managing Director of Rice Export Corporation of Pakistan, Director General of Ports and Shipping, Commissioner of Karachi Division, Deputy Commissioner of the Districts of Thatta, Sanghar and Larkana and as Director Labour, Sindh. He was also the Chairman of Board of Directors of Sui Southern Gas Company Limited and at present serving as Director on the Board of Thatta Cement Company Limited. Mr. Shahid Aziz Siddiqui had topped the CSS Examination of 1968. Mr. Siddiqui holds post graduate degree in Development Economics from the University of Cambridge UK and masters from University of Karachi. He is also a Certified Director by Pakistan Institute of Corporate Governance (PICG).
Mr. Agha Sher Shah Director
Mr. Agha Sher Shah is currently the Chairman and Chief Executive of Bandhi Sugar Mills, a Greenfield 7000 tons sugar mill which he successfully set up in 2012. He is also a Director of Attock Cement Pakistan Limited, Habib Bank Limited, Thatta Cement Company Limited, Newport Container Terminal (Private) Limited, Sui Southern Gas Company Limited and Triton LPG (Private) Limited.
Mr. Agha Sher Shah started his career as an investment analyst covering consumer, energy and finance sectors of the S&P 500 in US equity market. In his career of over 27 years he has held senior portfolio management positions in US and Global equities. Prior to his current role, he was Senior Portfolio Manager of a multi-billion dollar portfolio in Abu Dhabi Investment Authority, one of the largest sovereign wealth funds in the world.
He has a Bachelor of Science in Engineering from Rice University and holds a Master of Business Administration from Cornell University.
14
Thatta Cement
Mr. Saleem ZamindarDirector
Mr. Saleem Zamindar has a Bachelor of Arts (BA) degree in Economics from Boston University, USA and a Master of Business Administration (MBA) from Durham University Business School, UK. He has over 22 years of experience across several countries in investment management, board level general management & international banking. He is a Certified company Director by the Pakistan Institute of Corporate Governance and additionally also holds the globally prestigious Certificate in Company Direction from the Institute of Directors (IoD) UK. Presently, he serves on the Board of Directors of several publicly listed & private limited companies. He is also the past President of the Rotary Club of Karachi, the largest and oldest Rotary Club in District 3271, and is a former member of the Managing Committee of the Karachi Boat Club and a current member of the Board of Governors of the Karachi Council on Foreign Relations.
Mr. Attaullah A. Rasheed Director
Mr. Attaullah A. Rasheed is working as General Manager in State Life Corporation of Pakistan, the largest national organization engaged in Life Insurance Business having a work experience of over 25 years in the field of Investment, Finance, Taxation and corporate affairs with various reputable organizations. He is a Fellow member of Institute of Cost & Management Accountants of Pakistan and Institute of Corporate Secretaries of Pakistan and also holds master’s degrees in Economics and Commerce from University of Sindh.
He is also serving as nominated director on the Board of listed companies namely, Premier Insurance Company Limited and Shahtaj Sugar Mills Limited on behalf of State Life Insurance Corporation of Pakistan.
15
Annual Report 2017
Mr. Muhammad Fazlullah Shariff Chief Executive Officer
Mr. Muhammad Fazlullah Shariff is a qualified Chemical Engineer, graduated from the Middle East Technical University, Ankara, Turkey. He joined Thatta Cement Company as Chief Operating Officer at the time of takeover by Al-Abbas Group from the State Cement Corporation through Privatization Commission. Subsequently he was elevated to the position of Director Project to look after Thatta Cement and the expansion and modernization of the Al-Abbas Cement Industry (formerly ESSA Cement).
Mr. Shariff has spent over thirty five years in the cement industry. He has worked on eight cement plants in various capacities and five as consultant besides numerous other projects. He has also worked on IFC financed cement projects in Pakistan as a consultant. This has made his experience very diversified in all areas: Production, Quality Control, Raw Material Investigations, Feasibility Studies, Project Appraisals, Project and Contract Management, Environmental Impact Assessment Studies, Technical Audits, Plant Optimization, Acquisition and Takeovers. He is well-known for practical measures to keep his organization competitive and profitable using cutting edge technologies and innovative solutions under local conditions. He has contributed technical papers to local and international magazines.
He is a certified Company Director from the Institute of Chartered Accountants of Pakistan.
He is a life member of the Pakistan Engineering Council and a member of the American Institute of Chemical Engineers and the American Chemical Society.
Muhammad Taha HamdaniDirector
Muhammad Taha Hamdani has qualified his Chartered Accountancy in July 2001 and was associated with Ford Rhodes Sidat Hyder, Chartered Accountants. He has also completed Director’s Training Program conducted by the Institute of Chartered Accountants of Pakistan. He has over seventeen years working experience with vast exposure in diversified sectors which range from telecommunication, asset management, hospitality, power, oil & gas and cement. Prior to joining Thatta Cement Company Limited in 2011 as Chief Financial Officer & Company Secretary, he was associated with Hascol Petroleum Limited as Chief Financial Officer. He carries immense exposure in asset management sector while working as Head of Internal Audit & Compliance with JS Investments Limited and Head of Finance & Operations with Faysal Asset Management Limited.
He also carries the experience of working as Deputy Director – Internal Audit, of Pakistan Telecommunication Company Limited, the largest telecommunication network in the country, as a Group Internal Auditor for one of the leading Five Star International Hotels in Pakistan and as a Group Finance Manager for an International Trading & Manufacturing Group based in Saudi Arabia.
16
Thatta Cement
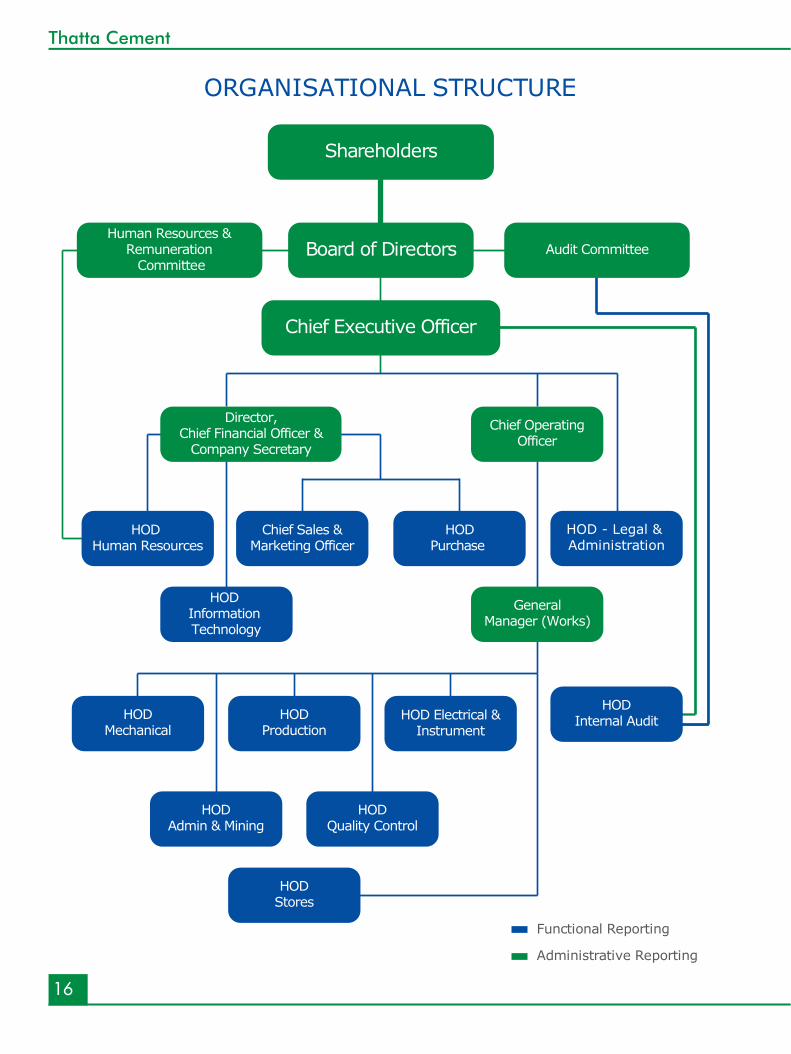
ORGANISATIONAL STRUCTURE
Shareholders
Board of Directors
Chief Executive Officer
Human Resources &Remuneration Committee
Audit Committee
HODPurchase
Chief Sales &Marketing Officer
HODInternal Audit
HOD Human Resources
HOD Information Technology
GeneralManager (Works)
HOD Electrical &Instrument
HODProduction
HODMechanical
HODStores
HODQuality Control
HODAdmin & Mining
Director,Chief Financial Officer &
Company Secretary
Chief OperatingOfficer
HOD - Legal & Administration
Functional Reporting
Administrative Reporting
17
Annual Report 2017
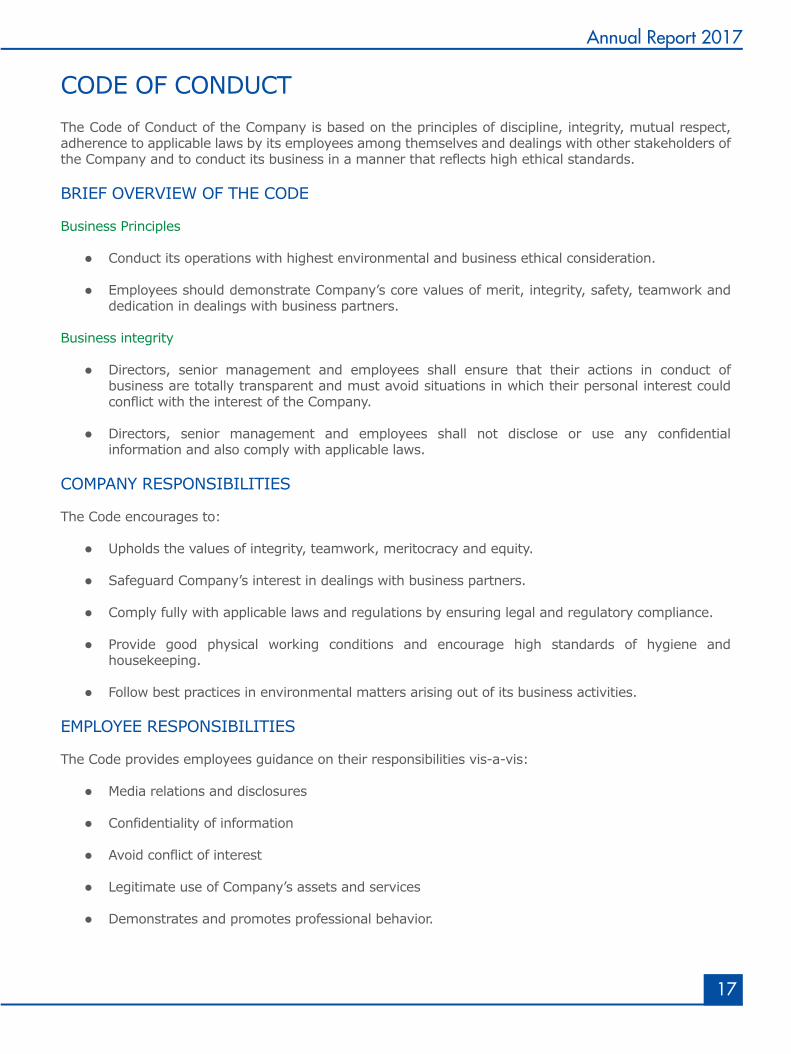
CODE OF CONDUCTThe Code of Conduct of the Company is based on the principles of discipline, integrity, mutual respect, adherence to applicable laws by its employees among themselves and dealings with other stakeholders of the Company and to conduct its business in a manner that reflects high ethical standards.
BRIEF OVERVIEW OF THE CODE
Business Principles
Conduct its operations with highest environmental and business ethical consideration.
Employees should demonstrate Company’s core values of merit, integrity, safety, teamwork and dedication in dealings with business partners.
Business integrity
Directors, senior management and employees shall ensure that their actions in conduct of business are totally transparent and must avoid situations in which their personal interest could conflict with the interest of the Company.
Directors, senior management and employees shall not disclose or use any confidential information and also comply with applicable laws.
COMPANY RESPONSIBILITIES
The Code encourages to:
Upholds the values of integrity, teamwork, meritocracy and equity.
Safeguard Company’s interest in dealings with business partners.
Comply fully with applicable laws and regulations by ensuring legal and regulatory compliance.
Provide good physical working conditions and encourage high standards of hygiene and housekeeping.
Follow best practices in environmental matters arising out of its business activities.
EMPLOYEE RESPONSIBILITIES
The Code provides employees guidance on their responsibilities vis-a-vis:
Media relations and disclosures
Confidentiality of information
Avoid conflict of interest
Legitimate use of Company’s assets and services
Demonstrates and promotes professional behavior.

18
Thatta Cement
This page is intentionally left blank
Directors'Report
Governance with Care and Diligence
All the decisions made by the Board of Directors assure maintaining exceptional standard and
creating a workworthy environment for sustaining a prosperous future.
20
Thatta Cement
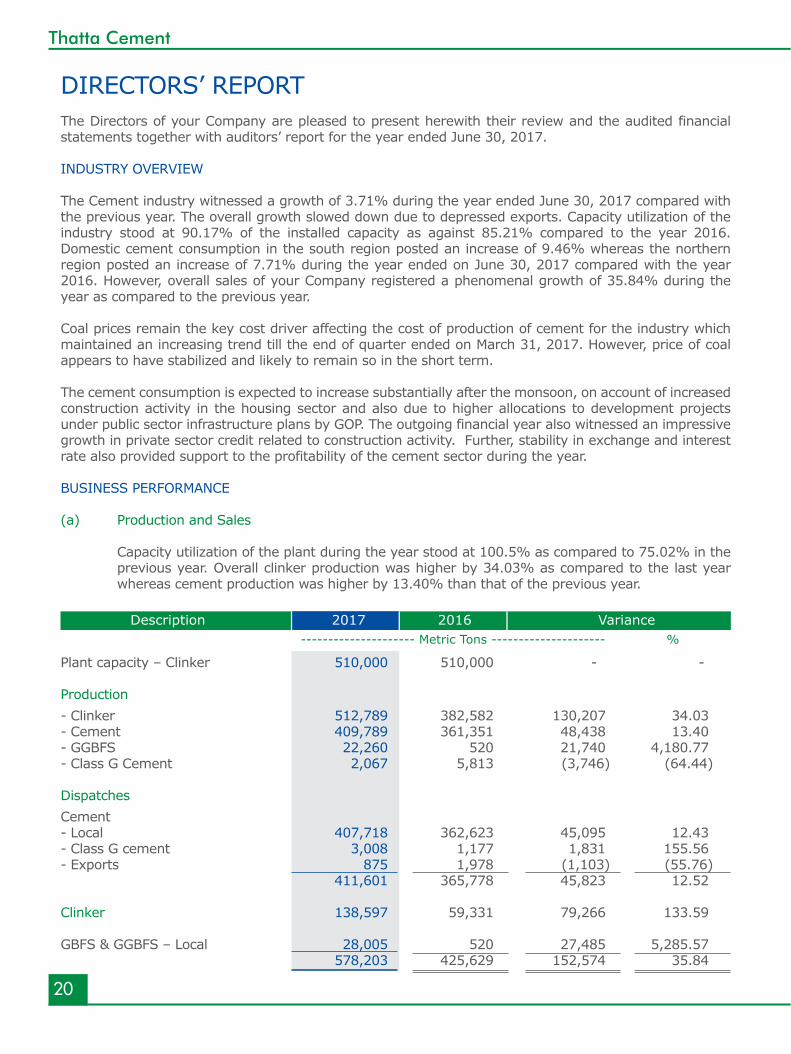
DIRECTORS’ REPORTThe Directors of your Company are pleased to present herewith their review and the audited financial statements together with auditors’ report for the year ended June 30, 2017.
INDUSTRY OVERVIEW
The Cement industry witnessed a growth of 3.71% during the year ended June 30, 2017 compared with the previous year. The overall growth slowed down due to depressed exports. Capacity utilization of the industry stood at 90.17% of the installed capacity as against 85.21% compared to the year 2016. Domestic cement consumption in the south region posted an increase of 9.46% whereas the northern region posted an increase of 7.71% during the year ended on June 30, 2017 compared with the year 2016. However, overall sales of your Company registered a phenomenal growth of 35.84% during the year as compared to the previous year.
Coal prices remain the key cost driver affecting the cost of production of cement for the industry which maintained an increasing trend till the end of quarter ended on March 31, 2017. However, price of coal appears to have stabilized and likely to remain so in the short term.
The cement consumption is expected to increase substantially after the monsoon, on account of increased construction activity in the housing sector and also due to higher allocations to development projects under public sector infrastructure plans by GOP. The outgoing financial year also witnessed an impressive growth in private sector credit related to construction activity. Further, stability in exchange and interest rate also provided support to the profitability of the cement sector during the year.
BUSINESS PERFORMANCE
(a) Production and Sales
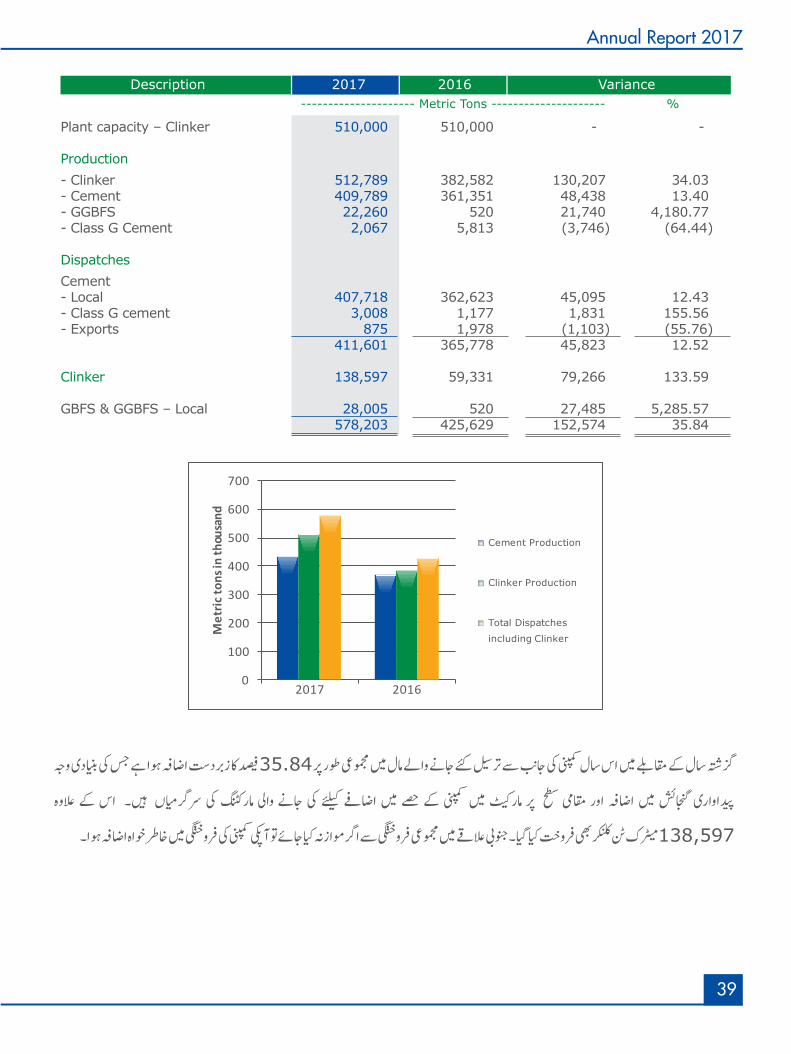
Capacity utilization of the plant during the year stood at 100.5% as compared to 75.02% in the previous year. Overall clinker production was higher by 34.03% as compared to the last year whereas cement production was higher by 13.40% than that of the previous year.
Plant capacity – Clinker 510,000 510,000 - -
Production - Clinker 512,789 382,582 130,207 34.03 - Cement 409,789 361,351 48,438 13.40 - GGBFS 22,260 520 21,740 4,180.77 - Class G Cement 2,067 5,813 (3,746) (64.44) Dispatches Cement - Local 407,718 362,623 45,095 12.43 - Class G cement 3,008 1,177 1,831 155.56 - Exports 875 1,978 (1,103) (55.76) 411,601 365,778 45,823 12.52
Clinker 138,597 59,331 79,266 133.59 GBFS & GGBFS – Local 28,005 520 27,485 5,285.57 578,203 425,629 152,574 35.84
2017Description--------------------- Metric Tons --------------------- %
2016 Variance
21
Annual Report 2017
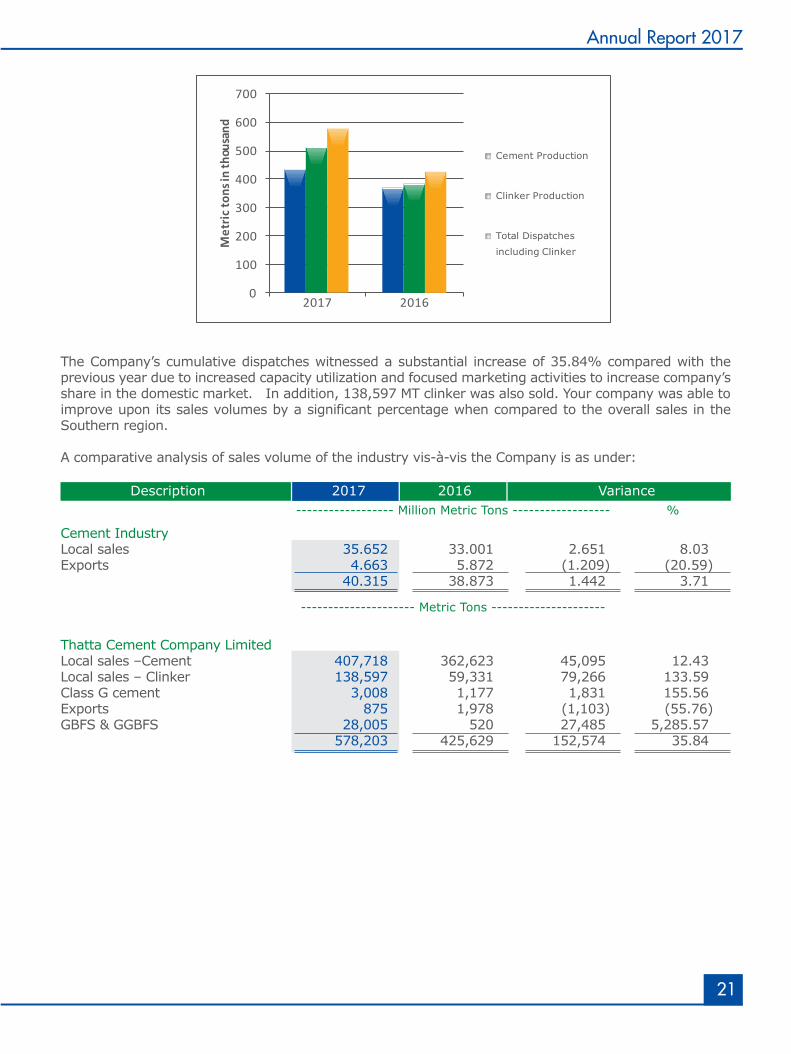
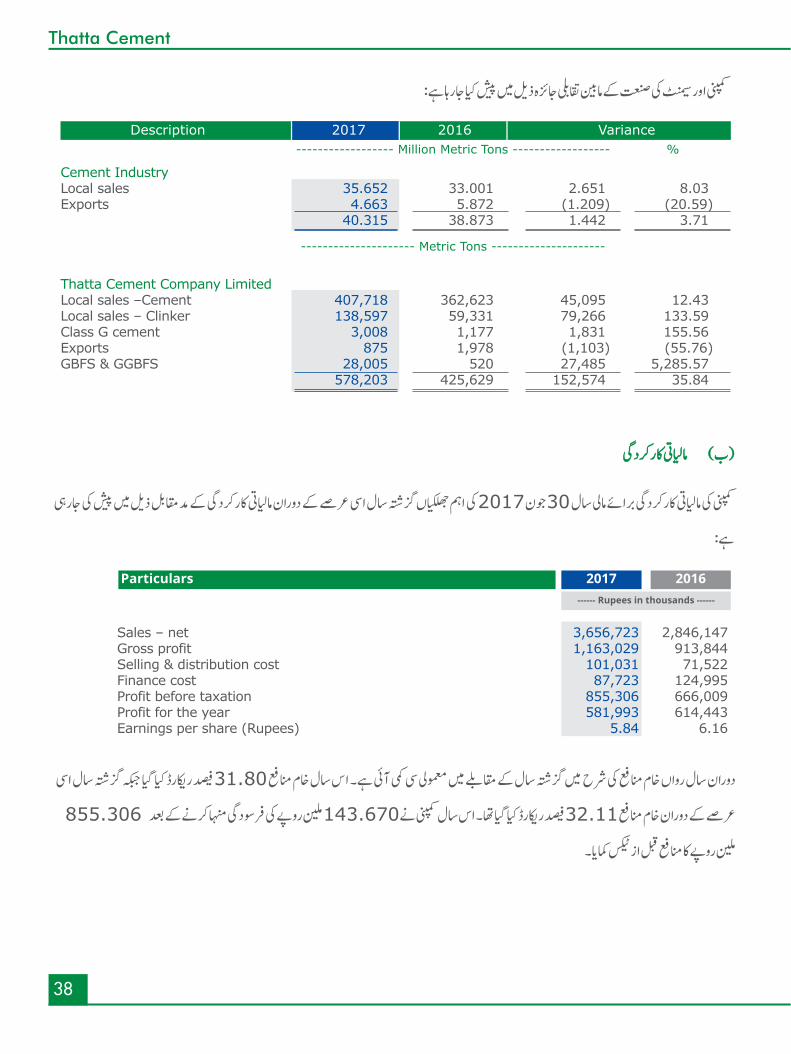
The Company’s cumulative dispatches witnessed a substantial increase of 35.84% compared with the previous year due to increased capacity utilization and focused marketing activities to increase company’s share in the domestic market. In addition, 138,597 MT clinker was also sold. Your company was able to improve upon its sales volumes by a significant percentage when compared to the overall sales in the Southern region.
A comparative analysis of sales volume of the industry vis-à-vis the Company is as under:
Cement Industry Local sales 35.652 33.001 2.651 8.03 Exports 4.663 5.872 (1.209) (20.59) 40.315 38.873 1.442 3.71 Thatta Cement Company Limited Local sales –Cement 407,718 362,623 45,095 12.43 Local sales – Clinker 138,597 59,331 79,266 133.59 Class G cement 3,008 1,177 1,831 155.56 Exports 875 1,978 (1,103) (55.76)GBFS & GGBFS 28,005 520 27,485 5,285.57 578,203 425,629 152,574 35.84
2017Description------------------ Million Metric Tons ------------------
--------------------- Metric Tons ---------------------
%2016 Variance
0
100
200
300
400
500
600
700
2017 2016
Met
ric to
ns in
thou
sand
Cement Production
Clinker Production
Total Dispatches
including Clinker
22
Thatta Cement
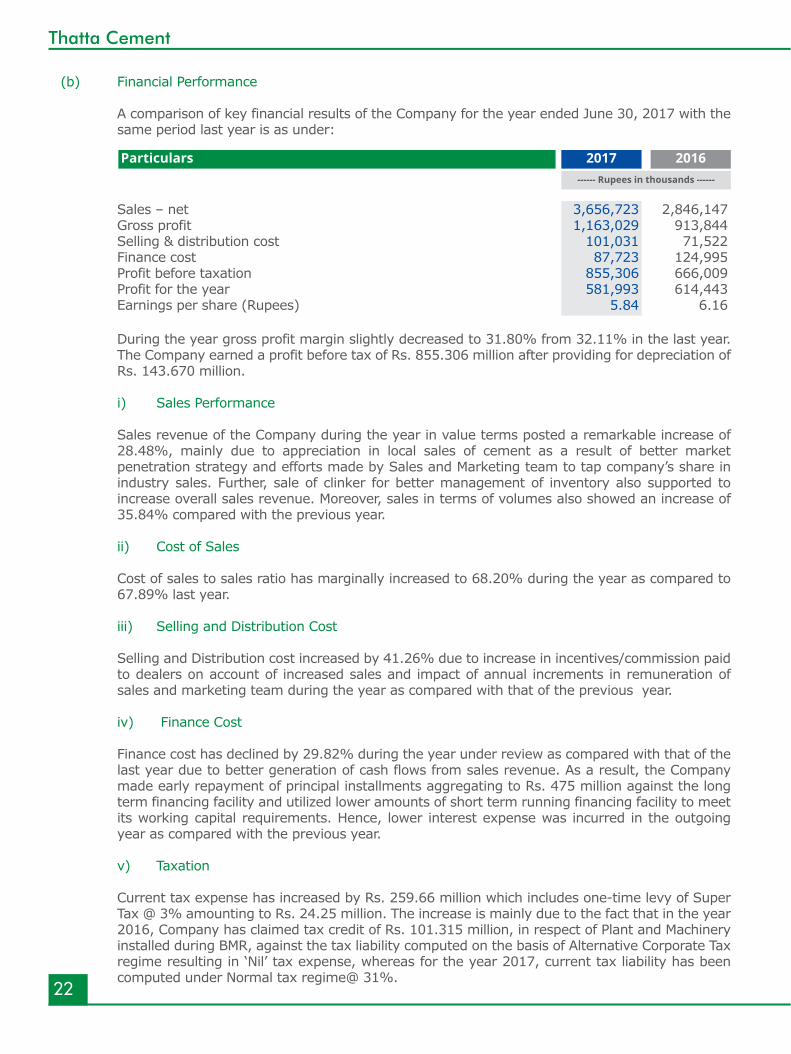
(b) Financial Performance
A comparison of key financial results of the Company for the year ended June 30, 2017 with the same period last year is as under:
Sales – net 3,656,723 2,846,147 Gross profit 1,163,029 913,844 Selling & distribution cost 101,031 71,522 Finance cost 87,723 124,995 Profit before taxation 855,306 666,009 Profit for the year 581,993 614,443 Earnings per share (Rupees) 5.84 6.16
During the year gross profit margin slightly decreased to 31.80% from 32.11% in the last year. The Company earned a profit before tax of Rs. 855.306 million after providing for depreciation of Rs. 143.670 million.
i) Sales Performance
Sales revenue of the Company during the year in value terms posted a remarkable increase of 28.48%, mainly due to appreciation in local sales of cement as a result of better market penetration strategy and efforts made by Sales and Marketing team to tap company’s share in industry sales. Further, sale of clinker for better management of inventory also supported to increase overall sales revenue. Moreover, sales in terms of volumes also showed an increase of 35.84% compared with the previous year.
ii) Cost of Sales
Cost of sales to sales ratio has marginally increased to 68.20% during the year as compared to 67.89% last year.
iii) Selling and Distribution Cost
Selling and Distribution cost increased by 41.26% due to increase in incentives/commission paid to dealers on account of increased sales and impact of annual increments in remuneration of sales and marketing team during the year as compared with that of the previous year.
iv) Finance Cost
Finance cost has declined by 29.82% during the year under review as compared with that of the last year due to better generation of cash flows from sales revenue. As a result, the Company made early repayment of principal installments aggregating to Rs. 475 million against the long term financing facility and utilized lower amounts of short term running financing facility to meet its working capital requirements. Hence, lower interest expense was incurred in the outgoing year as compared with the previous year.
v) Taxation
Current tax expense has increased by Rs. 259.66 million which includes one-time levy of Super Tax @ 3% amounting to Rs. 24.25 million. The increase is mainly due to the fact that in the year 2016, Company has claimed tax credit of Rs. 101.315 million, in respect of Plant and Machinery installed during BMR, against the tax liability computed on the basis of Alternative Corporate Tax regime resulting in ‘Nil’ tax expense, whereas for the year 2017, current tax liability has been computed under Normal tax regime@ 31%.
------ Rupees in thousands ------
2017Particulars 2016
23
Annual Report 2017
Subsequent appropriations
Based on the profit during the year under review, the Board of Directors has recommended a final cash dividend for the year ended June 30, 2017 at Rs. 2.35/- per share i.e. 23.5% of par value. The entitlement shall be available to those shareholders whose name(s) appear on the shareholders’ register at the close of business on September 08, 2017. The appropriation will be reflected in the subsequent financial statements, in compliance with Fourth Schedule to the Companies Ordinance, 1984.
Principal risks and uncertainties facing the Company
Cement production capacity in the country is expected to rise to around 73.8 million metric tons by FY20 as a result of expansion projects initiated by leading players of the industry. These expansion projects may put those cement companies including your company in an unfavorable position, which have not been able to achieve economies of scale and competitive advantage by enhancing their production capacity in line with the industry. Keeping in view this risk, your company is continuously evolving strategies and adopting appropriate measures to manage such risks to meet challenges ahead to maintain business growth.
Moreover, details of the Company’s financial risk management policies and objectives in respect of its use of financial instruments are included in Note 41 to the financial statements together with a description of its exposure, including its exposure to market risk, credit risk and liquidity risk.
Impact of Company’s business on the environment
The major impact of cement manufacturing business on environment is related to particulate matter and fugitive dust emitted from processes adopted for clinker production.
The Company has a dedicated and qualified team to meet the statutory and regulatory compliances of EPA and NEQS standards. Being proactive on the impact of the Company’s business on the environment, the Company has installed dedusting equipment such as dust cyclones, bag houses, dust suppression by damping down method, electrostatic precipitators, personal protective equipment and speed limit controls in Company’s premises to overcome RSPM (respirable suspended particulate matter) and FRD (fugitive road dust).
In recognition of its efforts towards sustainability and minimizing the impact of business operations on environment and its surroundings, the Company has been awarded Environment Excellence Award 2016, conducted by NFEH (A society registered with United Nations Environment Program UNEP).
Emissions from the cement making process are periodically monitored as per NEQS standards through EPA Certified reputed labs. The Company’s production facility has always been in compliance with the National Environmental Quality Standards (NEQS).
Corporate Social Responsibility
Being a responsible corporate citizen, the Company always strives to discharge its social responsibilities towards the society. The Company promotes and facilitates welfare of the local communities in the town where the Company operates. During the year, the Company has incurred a reasonable amount on various education and health initiatives.
Adequacy of internal financial controls
All the necessary steps are being employed by the Directors to ensure the effectiveness of the Company’s internal financial control systems upto and including the date of approval of the financial statements. This had regard to all material controls, including financial, operational and compliance controls that could affect the Company’s business.
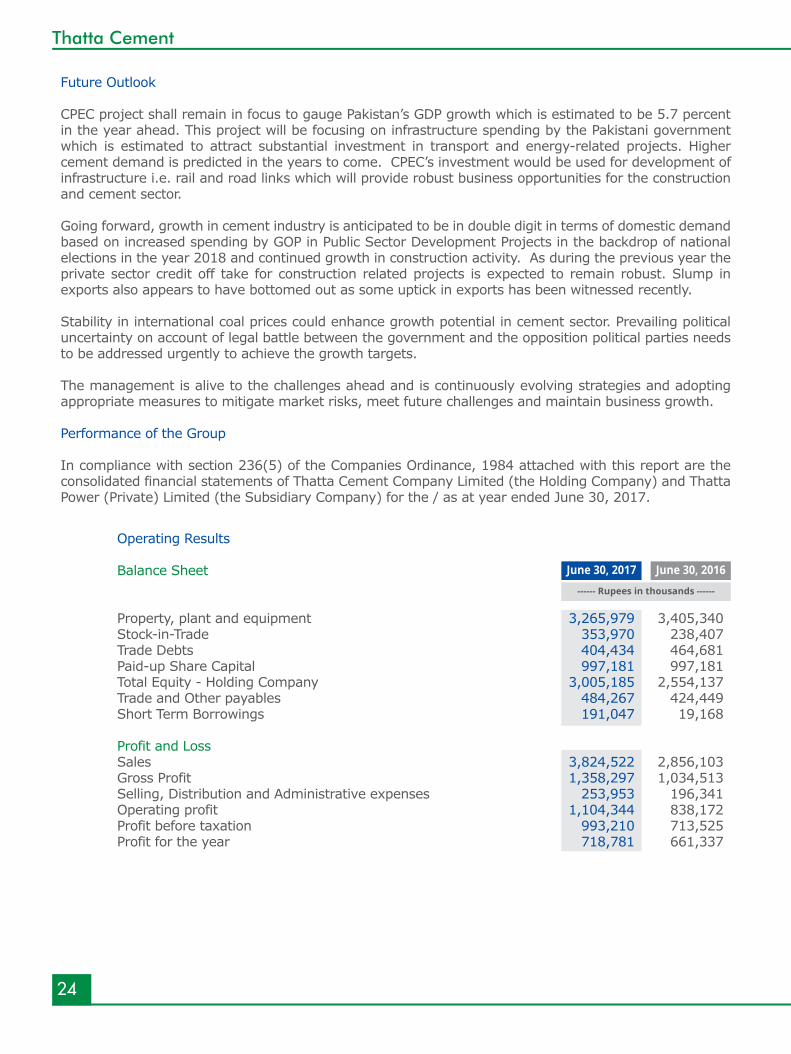
------ Rupees in thousands ------
June 30, 2017 June 30, 2016
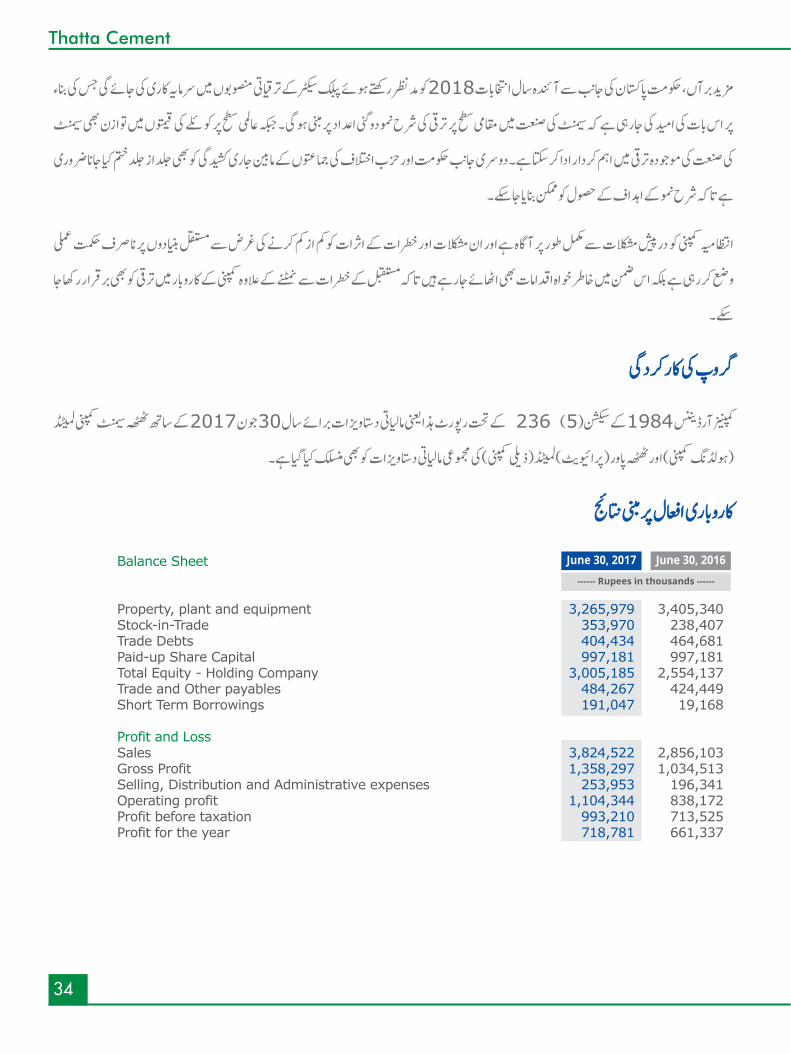
Operating Results Balance Sheet
Property, plant and equipment 3,265,979 3,405,340 Stock-in-Trade 353,970 238,407 Trade Debts 404,434 464,681 Paid-up Share Capital 997,181 997,181 Total Equity - Holding Company 3,005,185 2,554,137 Trade and Other payables 484,267 424,449 Short Term Borrowings 191,047 19,168 Profit and Loss Sales 3,824,522 2,856,103 Gross Profit 1,358,297 1,034,513 Selling, Distribution and Administrative expenses 253,953 196,341 Operating profit 1,104,344 838,172 Profit before taxation 993,210 713,525 Profit for the year 718,781 661,337
24
Thatta Cement
Future Outlook
CPEC project shall remain in focus to gauge Pakistan’s GDP growth which is estimated to be 5.7 percent in the year ahead. This project will be focusing on infrastructure spending by the Pakistani government which is estimated to attract substantial investment in transport and energy-related projects. Higher cement demand is predicted in the years to come. CPEC’s investment would be used for development of infrastructure i.e. rail and road links which will provide robust business opportunities for the construction and cement sector.
Going forward, growth in cement industry is anticipated to be in double digit in terms of domestic demand based on increased spending by GOP in Public Sector Development Projects in the backdrop of national elections in the year 2018 and continued growth in construction activity. As during the previous year the private sector credit off take for construction related projects is expected to remain robust. Slump in exports also appears to have bottomed out as some uptick in exports has been witnessed recently.
Stability in international coal prices could enhance growth potential in cement sector. Prevailing political uncertainty on account of legal battle between the government and the opposition political parties needs to be addressed urgently to achieve the growth targets.
The management is alive to the challenges ahead and is continuously evolving strategies and adopting appropriate measures to mitigate market risks, meet future challenges and maintain business growth.
Performance of the Group
In compliance with section 236(5) of the Companies Ordinance, 1984 attached with this report are the consolidated financial statements of Thatta Cement Company Limited (the Holding Company) and Thatta Power (Private) Limited (the Subsidiary Company) for the / as at year ended June 30, 2017.
25
Annual Report 2017
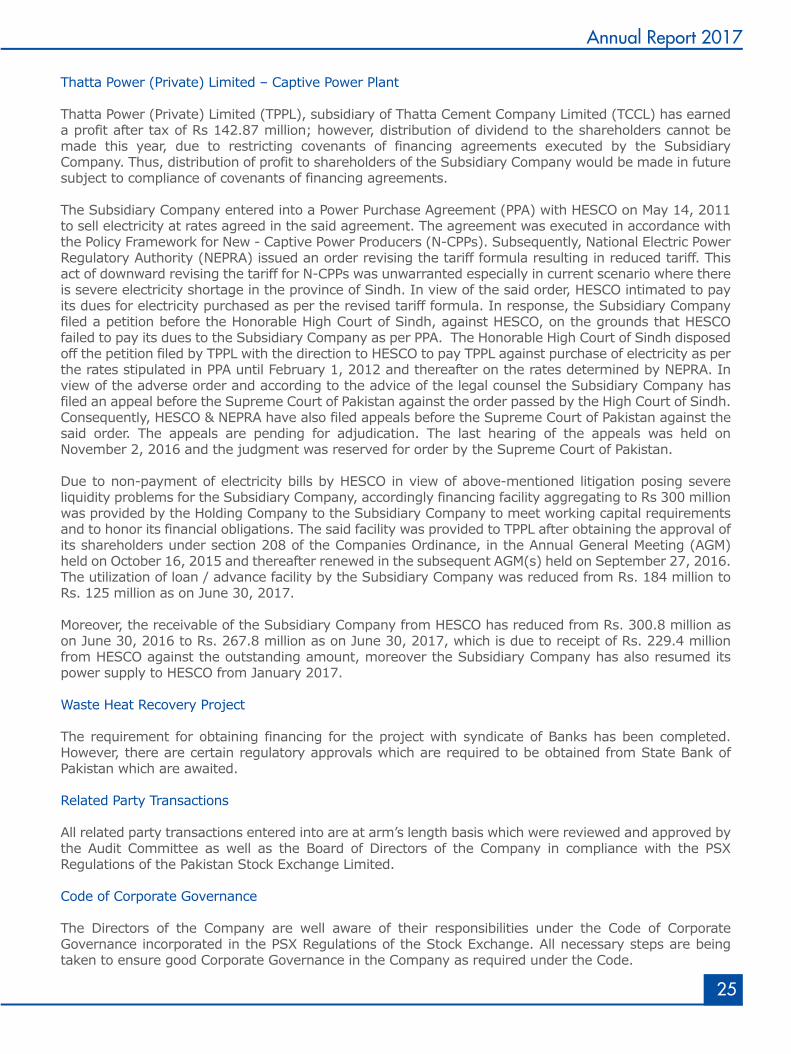
Thatta Power (Private) Limited – Captive Power Plant
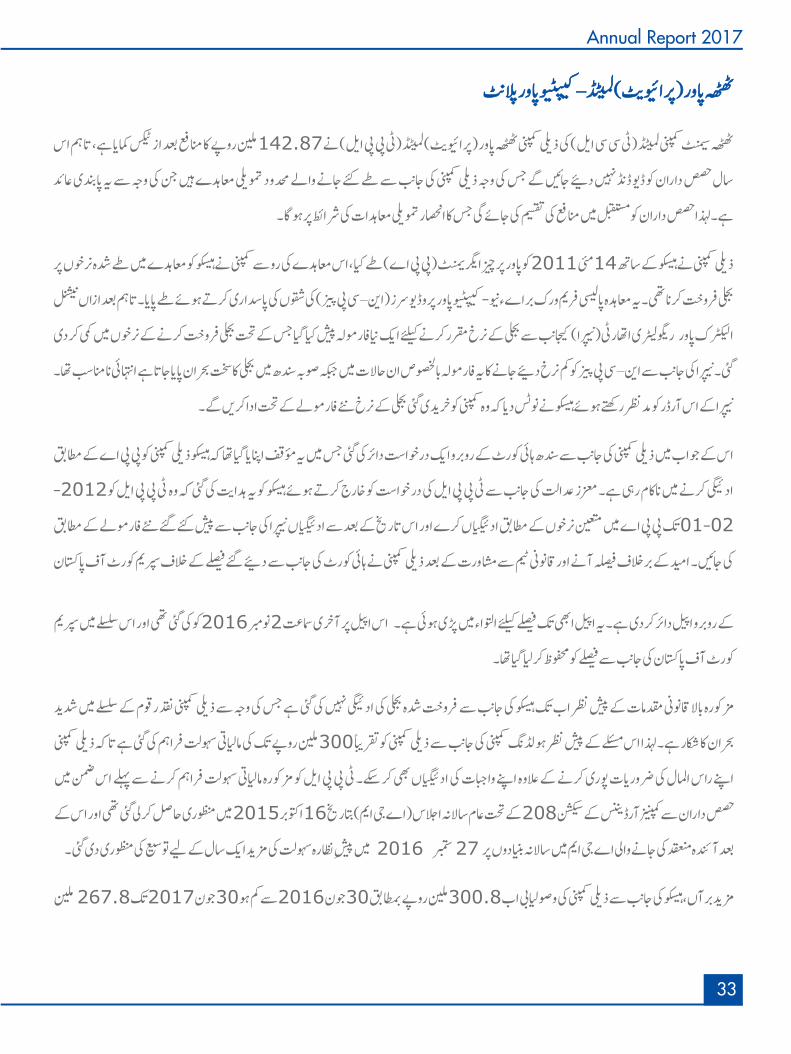
Thatta Power (Private) Limited (TPPL), subsidiary of Thatta Cement Company Limited (TCCL) has earned a profit after tax of Rs 142.87 million; however, distribution of dividend to the shareholders cannot be made this year, due to restricting covenants of financing agreements executed by the Subsidiary Company. Thus, distribution of profit to shareholders of the Subsidiary Company would be made in future subject to compliance of covenants of financing agreements.
The Subsidiary Company entered into a Power Purchase Agreement (PPA) with HESCO on May 14, 2011 to sell electricity at rates agreed in the said agreement. The agreement was executed in accordance with the Policy Framework for New - Captive Power Producers (N-CPPs). Subsequently, National Electric Power Regulatory Authority (NEPRA) issued an order revising the tariff formula resulting in reduced tariff. This act of downward revising the tariff for N-CPPs was unwarranted especially in current scenario where there is severe electricity shortage in the province of Sindh. In view of the said order, HESCO intimated to pay its dues for electricity purchased as per the revised tariff formula. In response, the Subsidiary Company filed a petition before the Honorable High Court of Sindh, against HESCO, on the grounds that HESCO failed to pay its dues to the Subsidiary Company as per PPA. The Honorable High Court of Sindh disposed off the petition filed by TPPL with the direction to HESCO to pay TPPL against purchase of electricity as per the rates stipulated in PPA until February 1, 2012 and thereafter on the rates determined by NEPRA. In view of the adverse order and according to the advice of the legal counsel the Subsidiary Company has filed an appeal before the Supreme Court of Pakistan against the order passed by the High Court of Sindh. Consequently, HESCO & NEPRA have also filed appeals before the Supreme Court of Pakistan against the said order. The appeals are pending for adjudication. The last hearing of the appeals was held on November 2, 2016 and the judgment was reserved for order by the Supreme Court of Pakistan.
Due to non-payment of electricity bills by HESCO in view of above-mentioned litigation posing severe liquidity problems for the Subsidiary Company, accordingly financing facility aggregating to Rs 300 million was provided by the Holding Company to the Subsidiary Company to meet working capital requirements and to honor its financial obligations. The said facility was provided to TPPL after obtaining the approval of its shareholders under section 208 of the Companies Ordinance, in the Annual General Meeting (AGM) held on October 16, 2015 and thereafter renewed in the subsequent AGM(s) held on September 27, 2016. The utilization of loan / advance facility by the Subsidiary Company was reduced from Rs. 184 million to Rs. 125 million as on June 30, 2017.
Moreover, the receivable of the Subsidiary Company from HESCO has reduced from Rs. 300.8 million as on June 30, 2016 to Rs. 267.8 million as on June 30, 2017, which is due to receipt of Rs. 229.4 million from HESCO against the outstanding amount, moreover the Subsidiary Company has also resumed its power supply to HESCO from January 2017.
Waste Heat Recovery Project
The requirement for obtaining financing for the project with syndicate of Banks has been completed. However, there are certain regulatory approvals which are required to be obtained from State Bank of Pakistan which are awaited.
Related Party Transactions
All related party transactions entered into are at arm’s length basis which were reviewed and approved by the Audit Committee as well as the Board of Directors of the Company in compliance with the PSX Regulations of the Pakistan Stock Exchange Limited.
Code of Corporate Governance
The Directors of the Company are well aware of their responsibilities under the Code of Corporate Governance incorporated in the PSX Regulations of the Stock Exchange. All necessary steps are being taken to ensure good Corporate Governance in the Company as required under the Code.
26
Thatta Cement
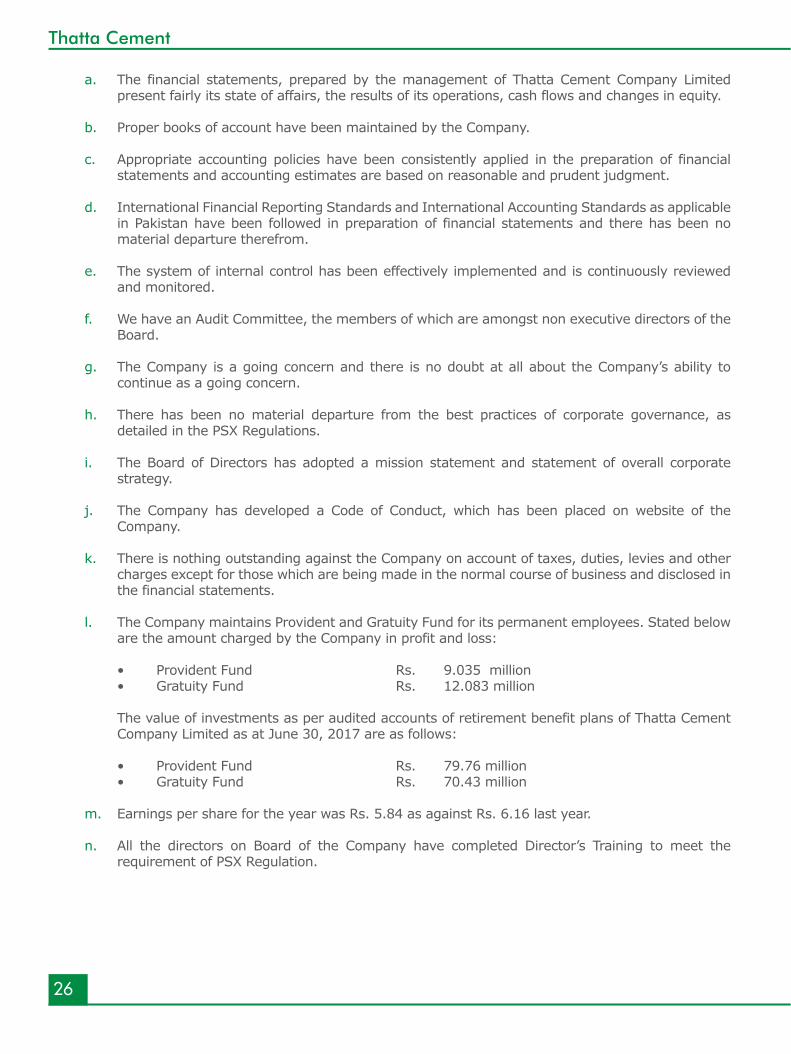
a. The financial statements, prepared by the management of Thatta Cement Company Limited present fairly its state of affairs, the results of its operations, cash flows and changes in equity.
b. Proper books of account have been maintained by the Company.
c. Appropriate accounting policies have been consistently applied in the preparation of financial statements and accounting estimates are based on reasonable and prudent judgment.
d. International Financial Reporting Standards and International Accounting Standards as applicable in Pakistan have been followed in preparation of financial statements and there has been no material departure therefrom.
e. The system of internal control has been effectively implemented and is continuously reviewed and monitored.
f. We have an Audit Committee, the members of which are amongst non executive directors of the Board.
g. The Company is a going concern and there is no doubt at all about the Company’s ability to continue as a going concern.
h. There has been no material departure from the best practices of corporate governance, as detailed in the PSX Regulations.
i. The Board of Directors has adopted a mission statement and statement of overall corporate strategy.
j. The Company has developed a Code of Conduct, which has been placed on website of the Company.
k. There is nothing outstanding against the Company on account of taxes, duties, levies and other charges except for those which are being made in the normal course of business and disclosed in the financial statements.
l. The Company maintains Provident and Gratuity Fund for its permanent employees. Stated below are the amount charged by the Company in profit and loss:
• Provident Fund Rs. 9.035 million • Gratuity Fund Rs. 12.083 million
The value of investments as per audited accounts of retirement benefit plans of Thatta Cement Company Limited as at June 30, 2017 are as follows:
• Provident Fund Rs. 79.76 million • Gratuity Fund Rs. 70.43 million
m. Earnings per share for the year was Rs. 5.84 as against Rs. 6.16 last year.
n. All the directors on Board of the Company have completed Director’s Training to meet the requirement of PSX Regulation.
27
Annual Report 2017
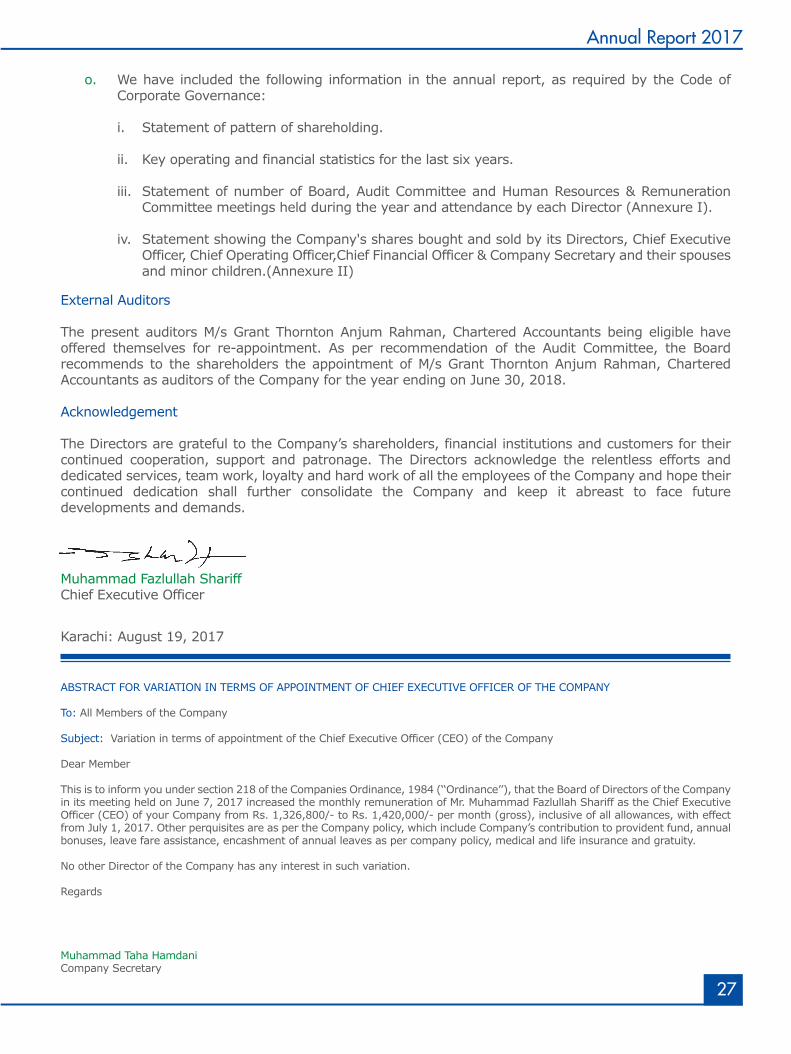
External Auditors
The present auditors M/s Grant Thornton Anjum Rahman, Chartered Accountants being eligible have offered themselves for re-appointment. As per recommendation of the Audit Committee, the Board recommends to the shareholders the appointment of M/s Grant Thornton Anjum Rahman, Chartered Accountants as auditors of the Company for the year ending on June 30, 2018.
Acknowledgement
The Directors are grateful to the Company’s shareholders, financial institutions and customers for their continued cooperation, support and patronage. The Directors acknowledge the relentless efforts and dedicated services, team work, loyalty and hard work of all the employees of the Company and hope their continued dedication shall further consolidate the Company and keep it abreast to face future developments and demands.
ABSTRACT FOR VARIATION IN TERMS OF APPOINTMENT OF CHIEF EXECUTIVE OFFICER OF THE COMPANY
To: All Members of the Company
Subject: Variation in terms of appointment of the Chief Executive Officer (CEO) of the Company
Dear Member
This is to inform you under section 218 of the Companies Ordinance, 1984 (‘‘Ordinance’’), that the Board of Directors of the Company in its meeting held on June 7, 2017 increased the monthly remuneration of Mr. Muhammad Fazlullah Shariff as the Chief Executive Officer (CEO) of your Company from Rs. 1,326,800/- to Rs. 1,420,000/- per month (gross), inclusive of all allowances, with effect from July 1, 2017. Other perquisites are as per the Company policy, which include Company’s contribution to provident fund, annual bonuses, leave fare assistance, encashment of annual leaves as per company policy, medical and life insurance and gratuity.
No other Director of the Company has any interest in such variation.
Regards
Muhammad Taha HamdaniCompany Secretary
o. We have included the following information in the annual report, as required by the Code of Corporate Governance:
i. Statement of pattern of shareholding.
ii. Key operating and financial statistics for the last six years.
iii. Statement of number of Board, Audit Committee and Human Resources & Remuneration Committee meetings held during the year and attendance by each Director (Annexure I).
iv. Statement showing the Company's shares bought and sold by its Directors, Chief Executive Officer, Chief Operating Officer,Chief Financial Officer & Company Secretary and their spouses and minor children.(Annexure II)
Muhammad Fazlullah ShariffChief Executive Officer
Karachi: August 19, 2017
28
Thatta Cement
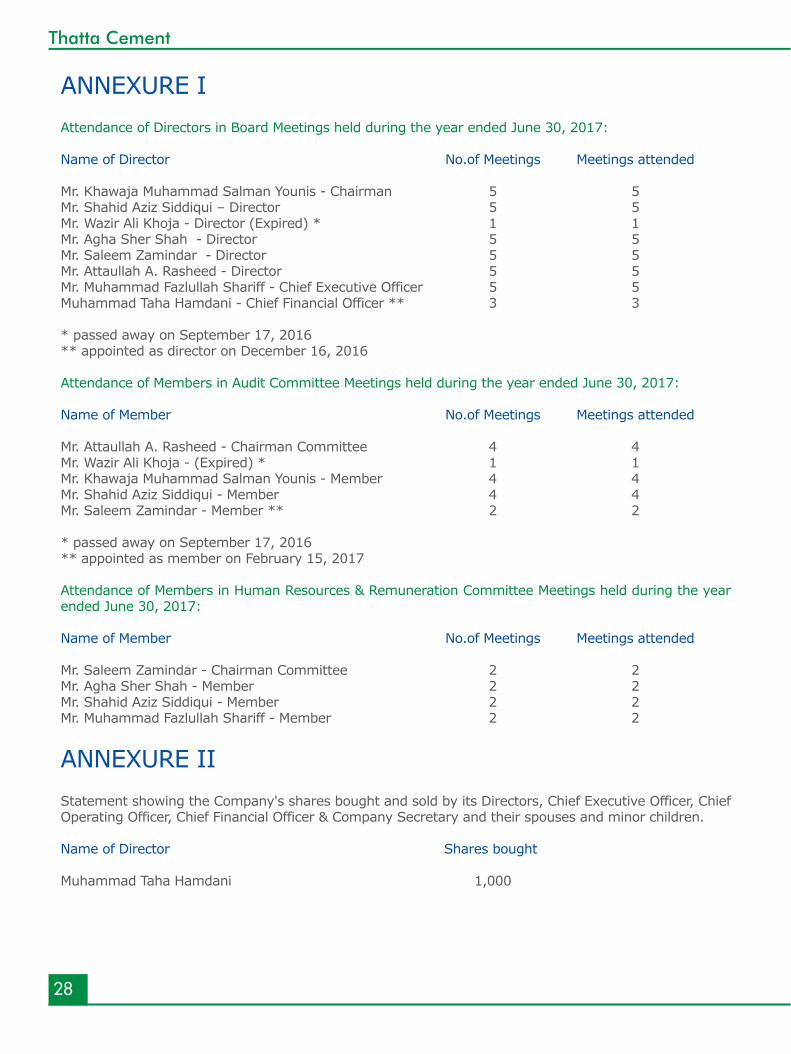
ANNEXURE I Attendance of Directors in Board Meetings held during the year ended June 30, 2017:
Name of Director No.of Meetings Meetings attended
Mr. Khawaja Muhammad Salman Younis - Chairman 5 5Mr. Shahid Aziz Siddiqui – Director 5 5Mr. Wazir Ali Khoja - Director (Expired) * 1 1Mr. Agha Sher Shah - Director 5 5Mr. Saleem Zamindar - Director 5 5Mr. Attaullah A. Rasheed - Director 5 5Mr. Muhammad Fazlullah Shariff - Chief Executive Officer 5 5Muhammad Taha Hamdani - Chief Financial Officer ** 3 3
* passed away on September 17, 2016** appointed as director on December 16, 2016
Attendance of Members in Audit Committee Meetings held during the year ended June 30, 2017:
Name of Member No.of Meetings Meetings attended
Mr. Attaullah A. Rasheed - Chairman Committee 4 4Mr. Wazir Ali Khoja - (Expired) * 1 1Mr. Khawaja Muhammad Salman Younis - Member 4 4Mr. Shahid Aziz Siddiqui - Member 4 4Mr. Saleem Zamindar - Member ** 2 2 * passed away on September 17, 2016 ** appointed as member on February 15, 2017
Attendance of Members in Human Resources & Remuneration Committee Meetings held during the year ended June 30, 2017:
Name of Member No.of Meetings Meetings attended
Mr. Saleem Zamindar - Chairman Committee 2 2Mr. Agha Sher Shah - Member 2 2Mr. Shahid Aziz Siddiqui - Member 2 2Mr. Muhammad Fazlullah Shariff - Member 2 2
ANNEXURE IIStatement showing the Company's shares bought and sold by its Directors, Chief Executive Officer, Chief Operating Officer, Chief Financial Officer & Company Secretary and their spouses and minor children. Name of Director Shares bought
Muhammad Taha Hamdani 1,000
29
Annual Report 2017
30
Thatta Cement
31
Annual Report 2017
32
Thatta Cement
33
Annual Report 2017
34
Thatta Cement
------ Rupees in thousands ------
June 30, 2017 June 30, 2016Balance Sheet
Property, plant and equipment 3,265,979 3,405,340 Stock-in-Trade 353,970 238,407 Trade Debts 404,434 464,681 Paid-up Share Capital 997,181 997,181 Total Equity - Holding Company 3,005,185 2,554,137 Trade and Other payables 484,267 424,449 Short Term Borrowings 191,047 19,168 Profit and Loss Sales 3,824,522 2,856,103 Gross Profit 1,358,297 1,034,513 Selling, Distribution and Administrative expenses 253,953 196,341 Operating profit 1,104,344 838,172 Profit before taxation 993,210 713,525 Profit for the year 718,781 661,337
35
Annual Report 2017
36
Thatta Cement
37
Annual Report 2017
38
Thatta Cement
Sales – net 3,656,723 2,846,147 Gross profit 1,163,029 913,844 Selling & distribution cost 101,031 71,522 Finance cost 87,723 124,995 Profit before taxation 855,306 666,009 Profit for the year 581,993 614,443 Earnings per share (Rupees) 5.84 6.16
------ Rupees in thousands ------
2017Particulars 2016
Cement Industry Local sales 35.652 33.001 2.651 8.03 Exports 4.663 5.872 (1.209) (20.59) 40.315 38.873 1.442 3.71 Thatta Cement Company Limited Local sales –Cement 407,718 362,623 45,095 12.43 Local sales – Clinker 138,597 59,331 79,266 133.59 Class G cement 3,008 1,177 1,831 155.56 Exports 875 1,978 (1,103) (55.76)GBFS & GGBFS 28,005 520 27,485 5,285.57 578,203 425,629 152,574 35.84
2017Description------------------ Million Metric Tons ------------------
--------------------- Metric Tons ---------------------
%2016 Variance
39
Annual Report 2017
0
100
200
300
400
500
600
700
2017 2016
Met
ric to
ns in
thou
sand
Cement Production
Clinker Production
Total Dispatches
including Clinker
Plant capacity – Clinker 510,000 510,000 - -
Production - Clinker 512,789 382,582 130,207 34.03 - Cement 409,789 361,351 48,438 13.40 - GGBFS 22,260 520 21,740 4,180.77 - Class G Cement 2,067 5,813 (3,746) (64.44) Dispatches Cement - Local 407,718 362,623 45,095 12.43 - Class G cement 3,008 1,177 1,831 155.56 - Exports 875 1,978 (1,103) (55.76) 411,601 365,778 45,823 12.52
Clinker 138,597 59,331 79,266 133.59 GBFS & GGBFS – Local 28,005 520 27,485 5,285.57 578,203 425,629 152,574 35.84
2017Description--------------------- Metric Tons --------------------- %
2016 Variance
40
Thatta Cement
41
Annual Report 2017
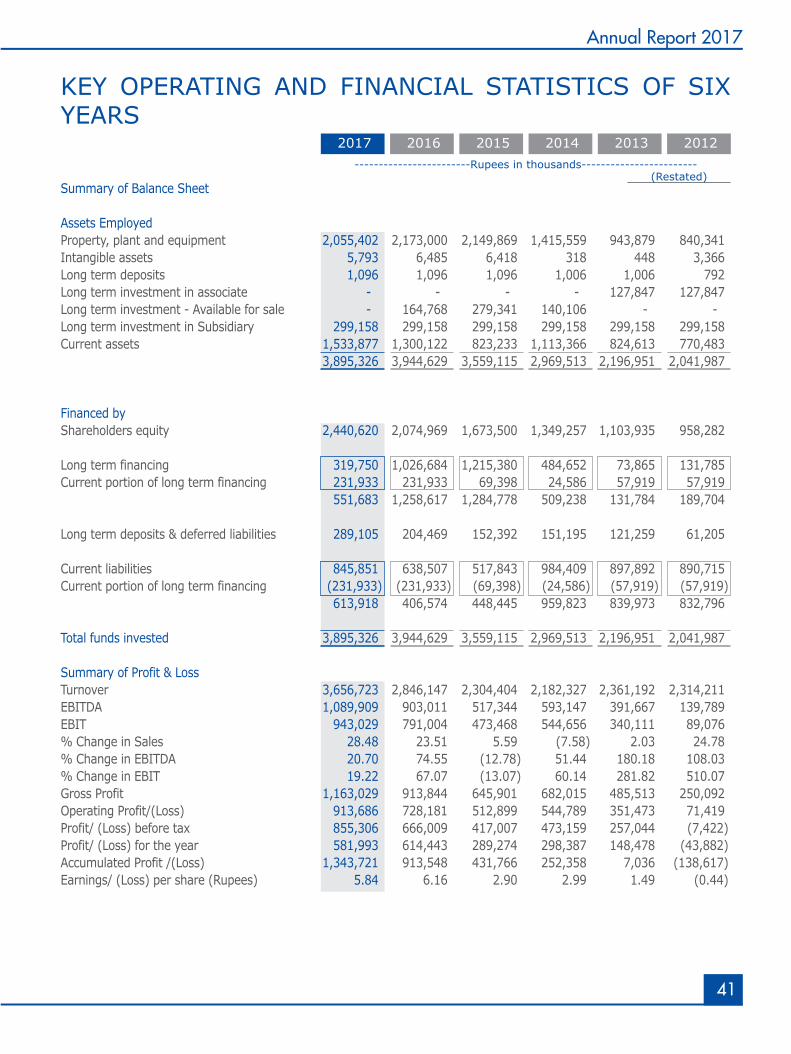
Summary of Balance Sheet Assets Employed Property, plant and equipment 2,055,402 2,173,000 2,149,869 1,415,559 943,879 840,341 Intangible assets 5,793 6,485 6,418 318 448 3,366 Long term deposits 1,096 1,096 1,096 1,006 1,006 792 Long term investment in associate - - - - 127,847 127,847 Long term investment - Available for sale - 164,768 279,341 140,106 - - Long term investment in Subsidiary 299,158 299,158 299,158 299,158 299,158 299,158 Current assets 1,533,877 1,300,122 823,233 1,113,366 824,613 770,483 3,895,326 3,944,629 3,559,115 2,969,513 2,196,951 2,041,987 Financed by Shareholders equity 2,440,620 2,074,969 1,673,500 1,349,257 1,103,935 958,282 Long term financing 319,750 1,026,684 1,215,380 484,652 73,865 131,785 Current portion of long term financing 231,933 231,933 69,398 24,586 57,919 57,919 551,683 1,258,617 1,284,778 509,238 131,784 189,704 Long term deposits & deferred liabilities 289,105 204,469 152,392 151,195 121,259 61,205 Current liabilities 845,851 638,507 517,843 984,409 897,892 890,715 Current portion of long term financing (231,933) (231,933) (69,398) (24,586) (57,919) (57,919) 613,918 406,574 448,445 959,823 839,973 832,796 Total funds invested 3,895,326 3,944,629 3,559,115 2,969,513 2,196,951 2,041,987 Summary of Profit & Loss Turnover 3,656,723 2,846,147 2,304,404 2,182,327 2,361,192 2,314,211 EBITDA 1,089,909 903,011 517,344 593,147 391,667 139,789 EBIT 943,029 791,004 473,468 544,656 340,111 89,076 % Change in Sales 28.48 23.51 5.59 (7.58) 2.03 24.78 % Change in EBITDA 20.70 74.55 (12.78) 51.44 180.18 108.03 % Change in EBIT 19.22 67.07 (13.07) 60.14 281.82 510.07 Gross Profit 1,163,029 913,844 645,901 682,015 485,513 250,092 Operating Profit/(Loss) 913,686 728,181 512,899 544,789 351,473 71,419 Profit/ (Loss) before tax 855,306 666,009 417,007 473,159 257,044 (7,422)Profit/ (Loss) for the year 581,993 614,443 289,274 298,387 148,478 (43,882)Accumulated Profit /(Loss) 1,343,721 913,548 431,766 252,358 7,036 (138,617)Earnings/ (Loss) per share (Rupees) 5.84 6.16 2.90 2.99 1.49 (0.44)
KEY OPERATING AND FINANCIAL STATISTICS OF SIX YEARS
------------------------Rupees in thousands------------------------(Restated)
2017 2016 2015 2014 2013 2012
42
Thatta Cement
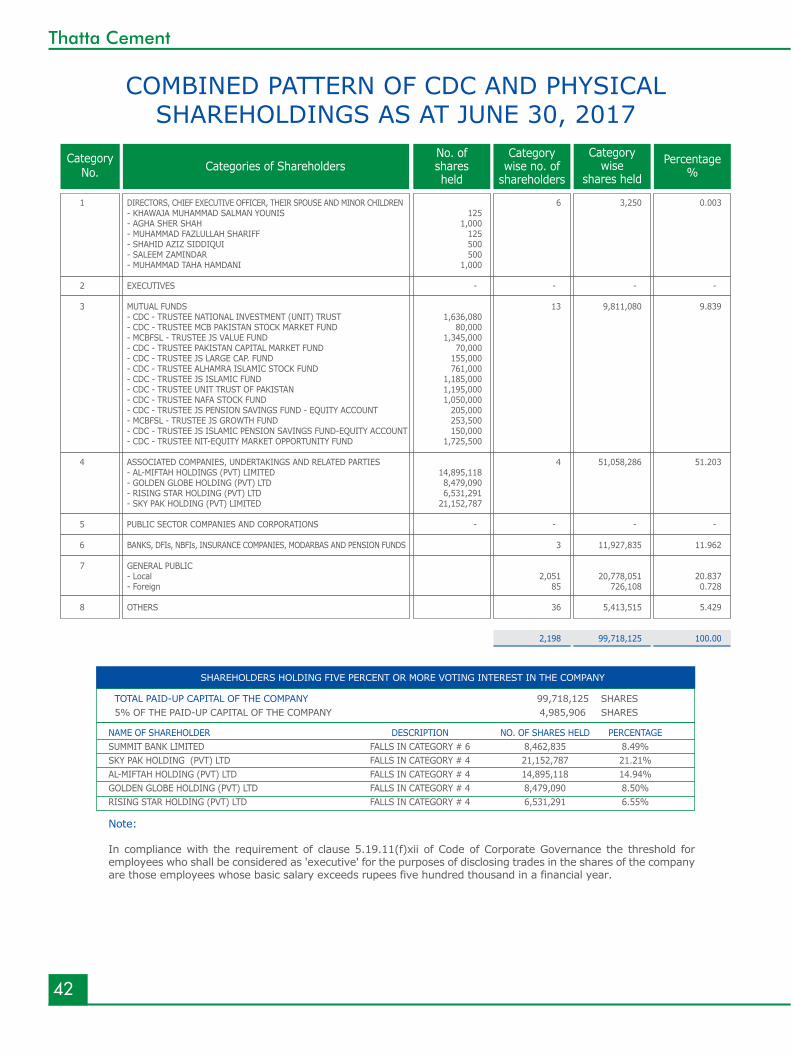
Note: In compliance with the requirement of clause 5.19.11(f)xii of Code of Corporate Governance the threshold for employees who shall be considered as 'executive' for the purposes of disclosing trades in the shares of the company are those employees whose basic salary exceeds rupees five hundred thousand in a financial year.
COMBINED PATTERN OF CDC AND PHYSICAL SHAREHOLDINGS AS AT JUNE 30, 2017
CategoryNo.
No. ofsharesheld
Categorywise no. of
shareholders
Categorywise
shares heldPercentage
%Categories of Shareholders
1 DIRECTORS, CHIEF EXECUTIVE OFFICER, THEIR SPOUSE AND MINOR CHILDREN 6 3,250 0.003 - KHAWAJA MUHAMMAD SALMAN YOUNIS 125 - AGHA SHER SHAH 1,000 - MUHAMMAD FAZLULLAH SHARIFF 125 - SHAHID AZIZ SIDDIQUI 500 - SALEEM ZAMINDAR 500 - MUHAMMAD TAHA HAMDANI 1,000 2 EXECUTIVES - - - -
3 MUTUAL FUNDS 13 9,811,080 9.839 - CDC - TRUSTEE NATIONAL INVESTMENT (UNIT) TRUST 1,636,080 - CDC - TRUSTEE MCB PAKISTAN STOCK MARKET FUND 80,000 - MCBFSL - TRUSTEE JS VALUE FUND 1,345,000 - CDC - TRUSTEE PAKISTAN CAPITAL MARKET FUND 70,000 - CDC - TRUSTEE JS LARGE CAP. FUND 155,000 - CDC - TRUSTEE ALHAMRA ISLAMIC STOCK FUND 761,000 - CDC - TRUSTEE JS ISLAMIC FUND 1,185,000 - CDC - TRUSTEE UNIT TRUST OF PAKISTAN 1,195,000 - CDC - TRUSTEE NAFA STOCK FUND 1,050,000 - CDC - TRUSTEE JS PENSION SAVINGS FUND - EQUITY ACCOUNT 205,000 - MCBFSL - TRUSTEE JS GROWTH FUND 253,500 - CDC - TRUSTEE JS ISLAMIC PENSION SAVINGS FUND-EQUITY ACCOUNT 150,000 - CDC - TRUSTEE NIT-EQUITY MARKET OPPORTUNITY FUND 1,725,500 4 ASSOCIATED COMPANIES, UNDERTAKINGS AND RELATED PARTIES 4 51,058,286 51.203 - AL-MIFTAH HOLDINGS (PVT) LIMITED 14,895,118 - GOLDEN GLOBE HOLDING (PVT) LTD 8,479,090 - RISING STAR HOLDING (PVT) LTD 6,531,291 - SKY PAK HOLDING (PVT) LIMITED 21,152,787 5 PUBLIC SECTOR COMPANIES AND CORPORATIONS - - - - 6 BANKS, DFIs, NBFIs, INSURANCE COMPANIES, MODARBAS AND PENSION FUNDS 3 11,927,835 11.962 7 GENERAL PUBLIC - Local 2,051 20,778,051 20.837 - Foreign 85 726,108 0.728 8 OTHERS 36 5,413,515 5.429
2,198 99,718,125 100.00
NAME OF SHAREHOLDER DESCRIPTION NO. OF SHARES HELD PERCENTAGESUMMIT BANK LIMITED FALLS IN CATEGORY # 6 8,462,835 8.49%SKY PAK HOLDING (PVT) LTD FALLS IN CATEGORY # 4 21,152,787 21.21%AL-MIFTAH HOLDING (PVT) LTD FALLS IN CATEGORY # 4 14,895,118 14.94%GOLDEN GLOBE HOLDING (PVT) LTD FALLS IN CATEGORY # 4 8,479,090 8.50%RISING STAR HOLDING (PVT) LTD FALLS IN CATEGORY # 4 6,531,291 6.55%
TOTAL PAID-UP CAPITAL OF THE COMPANY5% OF THE PAID-UP CAPITAL OF THE COMPANY
99,718,125 SHARES 4,985,906 SHARES
SHAREHOLDERS HOLDING FIVE PERCENT OR MORE VOTING INTEREST IN THE COMPANY
235 1 100 2,008 699 101 500 341,448 330 501 1,000 316,679 503 1,001 5,000 1,429,789 165 5,001 10,000 1,378,500 58 10,001 15,000 751,000 33 15,001 20,000 623,000 37 20,001 25,000 864,000 15 25,001 30,000 439,000 10 30,001 35,000 342,500 10 35,001 40,000 385,500 6 40,001 45,000 263,000 23 45,001 50,000 1,139,500 2 50,001 55,000 105,500 8 55,001 60,000 469,500 2 60,001 65,000 127,000 2 65,001 70,000 138,000 3 70,001 75,000 224,000 4 75,001 80,000 318,500 1 80,001 85,000 80,500 2 85,001 90,000 180,000 1 90,001 95,000 95,000 6 95,001 100,000 600,000 1 100,001 105,000 105,000 1 140,001 145,000 144,500 3 145,001 150,000 450,000 2 150,001 155,000 310,000 2 165,001 170,000 339,000 1 200,001 205,000 205,000 1 205,001 210,000 205,500 1 235,001 240,000 236,500 2 250,001 255,000 504,000 1 260,001 265,000 264,500
1 270,001 275,000 275,000 1 295,001 300,000 300,000 1 310,001 315,000 310,500 1 395,001 400,000 400,000 1 400,001 405,000 405,000 1 405,001 410,000 408,500 1 495,001 500,000 500,000 1 520,001 525,000 521,500 1 535,001 540,000 539,500 1 540,001 545,000 545,000 1 760,001 765,000 761,000 1 795,001 800,000 800,000 1 990,001 995,000 995,000 1 1,045,001 1,050,000 1,050,000 1 1,180,001 1,185,000 1,185,000 1 1,190,001 1,195,000 1,195,000 1 1,340,001 1,345,000 1,345,000 1 1,635,001 1,640,000 1,636,080 1 1,725,001 1,730,000 1,725,500 1 2,385,001 2,390,000 2,388,000 1 2,640,001 2,645,000 2,644,500 1 3,370,001 3,375,000 3,375,000 1 3,510,001 3,515,000 3,514,000 1 6,530,001 6,535,000 6,531,291 1 8,460,001 8,465,000 8,462,835 1 8,475,001 8,480,000 8,479,090 1 14,895,001 14,900,000 14,895,118 1 21,150,001 21,155,000 21,152,787 2,198 99,718,125
43
Annual Report 2017
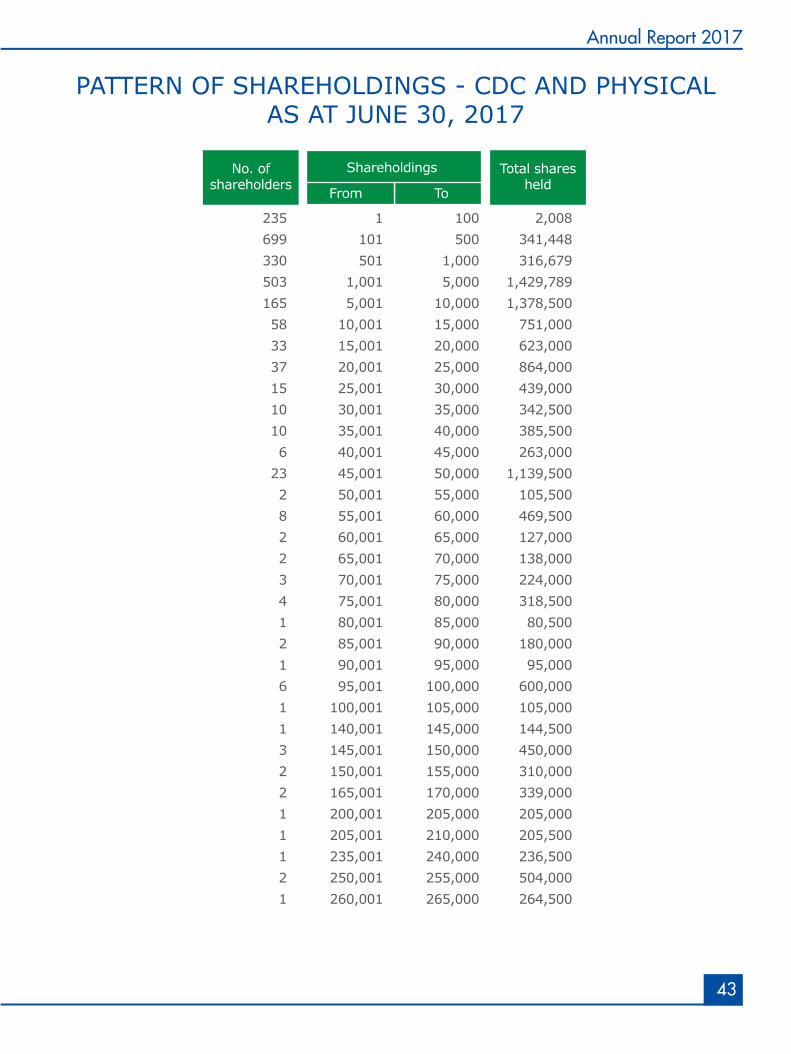
PATTERN OF SHAREHOLDINGS - CDC AND PHYSICAL AS AT JUNE 30, 2017
235 1 100 2,008 699 101 500 341,448 330 501 1,000 316,679 503 1,001 5,000 1,429,789 165 5,001 10,000 1,378,500 58 10,001 15,000 751,000 33 15,001 20,000 623,000 37 20,001 25,000 864,000 15 25,001 30,000 439,000 10 30,001 35,000 342,500 10 35,001 40,000 385,500 6 40,001 45,000 263,000 23 45,001 50,000 1,139,500 2 50,001 55,000 105,500 8 55,001 60,000 469,500 2 60,001 65,000 127,000 2 65,001 70,000 138,000 3 70,001 75,000 224,000 4 75,001 80,000 318,500 1 80,001 85,000 80,500 2 85,001 90,000 180,000 1 90,001 95,000 95,000 6 95,001 100,000 600,000 1 100,001 105,000 105,000 1 140,001 145,000 144,500 3 145,001 150,000 450,000 2 150,001 155,000 310,000 2 165,001 170,000 339,000 1 200,001 205,000 205,000 1 205,001 210,000 205,500 1 235,001 240,000 236,500 2 250,001 255,000 504,000 1 260,001 265,000 264,500
No. ofshareholders
Shareholdings Total sharesheldFrom To
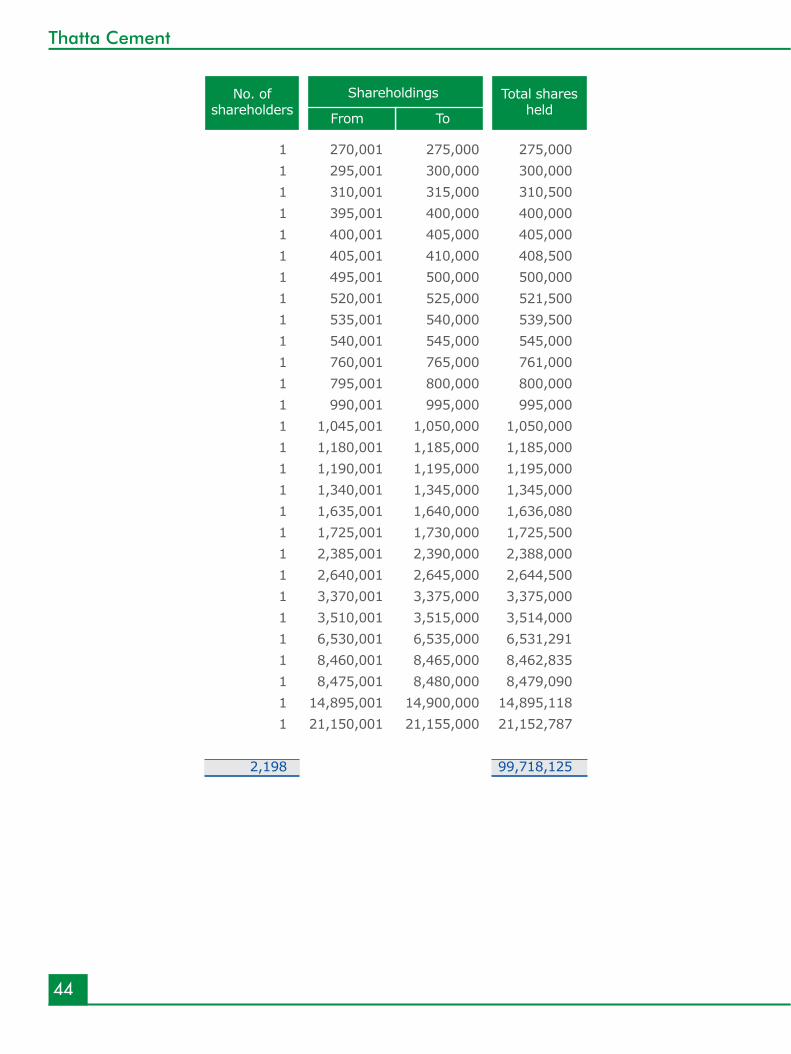
1 270,001 275,000 275,000 1 295,001 300,000 300,000 1 310,001 315,000 310,500 1 395,001 400,000 400,000 1 400,001 405,000 405,000 1 405,001 410,000 408,500 1 495,001 500,000 500,000 1 520,001 525,000 521,500 1 535,001 540,000 539,500 1 540,001 545,000 545,000 1 760,001 765,000 761,000 1 795,001 800,000 800,000 1 990,001 995,000 995,000 1 1,045,001 1,050,000 1,050,000 1 1,180,001 1,185,000 1,185,000 1 1,190,001 1,195,000 1,195,000 1 1,340,001 1,345,000 1,345,000 1 1,635,001 1,640,000 1,636,080 1 1,725,001 1,730,000 1,725,500 1 2,385,001 2,390,000 2,388,000 1 2,640,001 2,645,000 2,644,500 1 3,370,001 3,375,000 3,375,000 1 3,510,001 3,515,000 3,514,000 1 6,530,001 6,535,000 6,531,291 1 8,460,001 8,465,000 8,462,835 1 8,475,001 8,480,000 8,479,090 1 14,895,001 14,900,000 14,895,118 1 21,150,001 21,155,000 21,152,787 2,198 99,718,125
44
Thatta Cement
235 1 100 2,008 699 101 500 341,448 330 501 1,000 316,679 503 1,001 5,000 1,429,789 165 5,001 10,000 1,378,500 58 10,001 15,000 751,000 33 15,001 20,000 623,000 37 20,001 25,000 864,000 15 25,001 30,000 439,000 10 30,001 35,000 342,500 10 35,001 40,000 385,500 6 40,001 45,000 263,000 23 45,001 50,000 1,139,500 2 50,001 55,000 105,500 8 55,001 60,000 469,500 2 60,001 65,000 127,000 2 65,001 70,000 138,000 3 70,001 75,000 224,000 4 75,001 80,000 318,500 1 80,001 85,000 80,500 2 85,001 90,000 180,000 1 90,001 95,000 95,000 6 95,001 100,000 600,000 1 100,001 105,000 105,000 1 140,001 145,000 144,500 3 145,001 150,000 450,000 2 150,001 155,000 310,000 2 165,001 170,000 339,000 1 200,001 205,000 205,000 1 205,001 210,000 205,500 1 235,001 240,000 236,500 2 250,001 255,000 504,000 1 260,001 265,000 264,500
1 270,001 275,000 275,000 1 295,001 300,000 300,000 1 310,001 315,000 310,500 1 395,001 400,000 400,000 1 400,001 405,000 405,000 1 405,001 410,000 408,500 1 495,001 500,000 500,000 1 520,001 525,000 521,500 1 535,001 540,000 539,500 1 540,001 545,000 545,000 1 760,001 765,000 761,000 1 795,001 800,000 800,000 1 990,001 995,000 995,000 1 1,045,001 1,050,000 1,050,000 1 1,180,001 1,185,000 1,185,000 1 1,190,001 1,195,000 1,195,000 1 1,340,001 1,345,000 1,345,000 1 1,635,001 1,640,000 1,636,080 1 1,725,001 1,730,000 1,725,500 1 2,385,001 2,390,000 2,388,000 1 2,640,001 2,645,000 2,644,500 1 3,370,001 3,375,000 3,375,000 1 3,510,001 3,515,000 3,514,000 1 6,530,001 6,535,000 6,531,291 1 8,460,001 8,465,000 8,462,835 1 8,475,001 8,480,000 8,479,090 1 14,895,001 14,900,000 14,895,118 1 21,150,001 21,155,000 21,152,787 2,198 99,718,125
No. ofshareholders
Shareholdings Total sharesheldFrom To
Shareholder'sEngagementCommunication beyond DisclosureThe communication bonding between our shareholders is exemplary. It focuses on confidentiality and affirms fluent knowledge of organizational matters between each other.
46
Thatta Cement
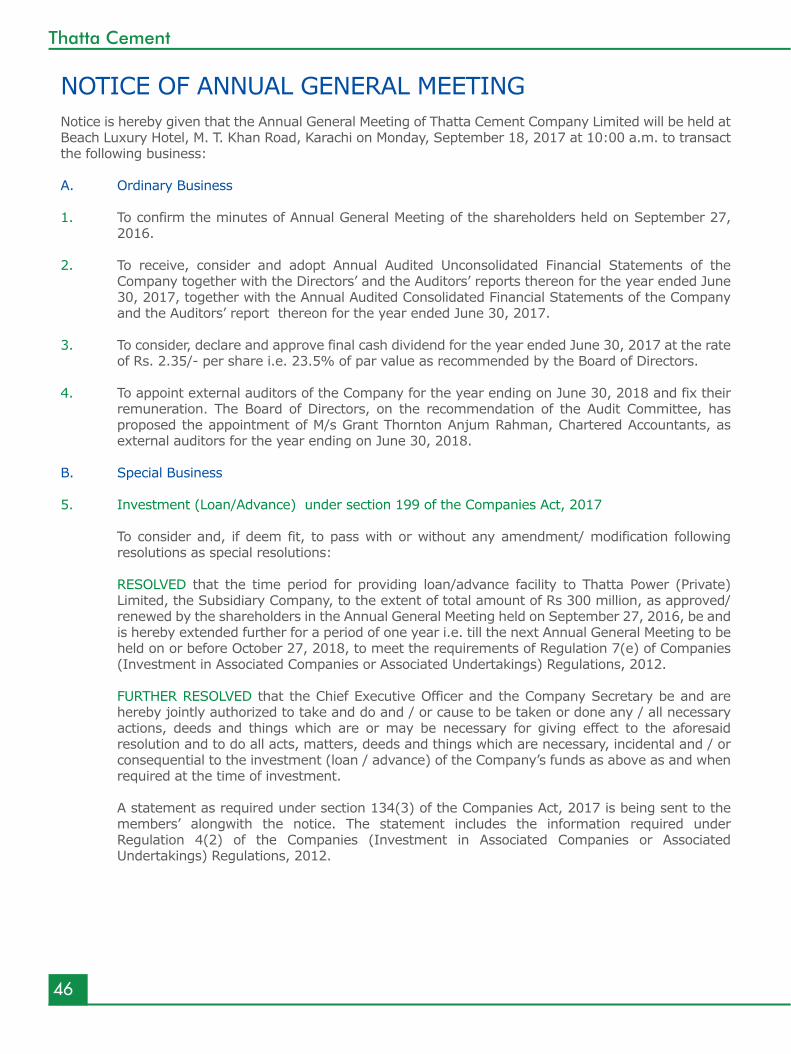
NOTICE OF ANNUAL GENERAL MEETING Notice is hereby given that the Annual General Meeting of Thatta Cement Company Limited will be held at Beach Luxury Hotel, M. T. Khan Road, Karachi on Monday, September 18, 2017 at 10:00 a.m. to transact the following business:
A. Ordinary Business
1. To confirm the minutes of Annual General Meeting of the shareholders held on September 27, 2016.
2. To receive, consider and adopt Annual Audited Unconsolidated Financial Statements of the Company together with the Directors’ and the Auditors’ reports thereon for the year ended June 30, 2017, together with the Annual Audited Consolidated Financial Statements of the Company and the Auditors’ report thereon for the year ended June 30, 2017.
3. To consider, declare and approve final cash dividend for the year ended June 30, 2017 at the rate of Rs. 2.35/- per share i.e. 23.5% of par value as recommended by the Board of Directors.
4. To appoint external auditors of the Company for the year ending on June 30, 2018 and fix their remuneration. The Board of Directors, on the recommendation of the Audit Committee, has proposed the appointment of M/s Grant Thornton Anjum Rahman, Chartered Accountants, as external auditors for the year ending on June 30, 2018.
B. Special Business
5. Investment (Loan/Advance) under section 199 of the Companies Act, 2017
To consider and, if deem fit, to pass with or without any amendment/ modification following resolutions as special resolutions:
RESOLVED that the time period for providing loan/advance facility to Thatta Power (Private) Limited, the Subsidiary Company, to the extent of total amount of Rs 300 million, as approved/ renewed by the shareholders in the Annual General Meeting held on September 27, 2016, be and is hereby extended further for a period of one year i.e. till the next Annual General Meeting to be held on or before October 27, 2018, to meet the requirements of Regulation 7(e) of Companies (Investment in Associated Companies or Associated Undertakings) Regulations, 2012.
FURTHER RESOLVED that the Chief Executive Officer and the Company Secretary be and are hereby jointly authorized to take and do and / or cause to be taken or done any / all necessary actions, deeds and things which are or may be necessary for giving effect to the aforesaid resolution and to do all acts, matters, deeds and things which are necessary, incidental and / or consequential to the investment (loan / advance) of the Company’s funds as above as and when required at the time of investment.
A statement as required under section 134(3) of the Companies Act, 2017 is being sent to the members’ alongwith the notice. The statement includes the information required under Regulation 4(2) of the Companies (Investment in Associated Companies or Associated Undertakings) Regulations, 2012.
47
Annual Report 2017
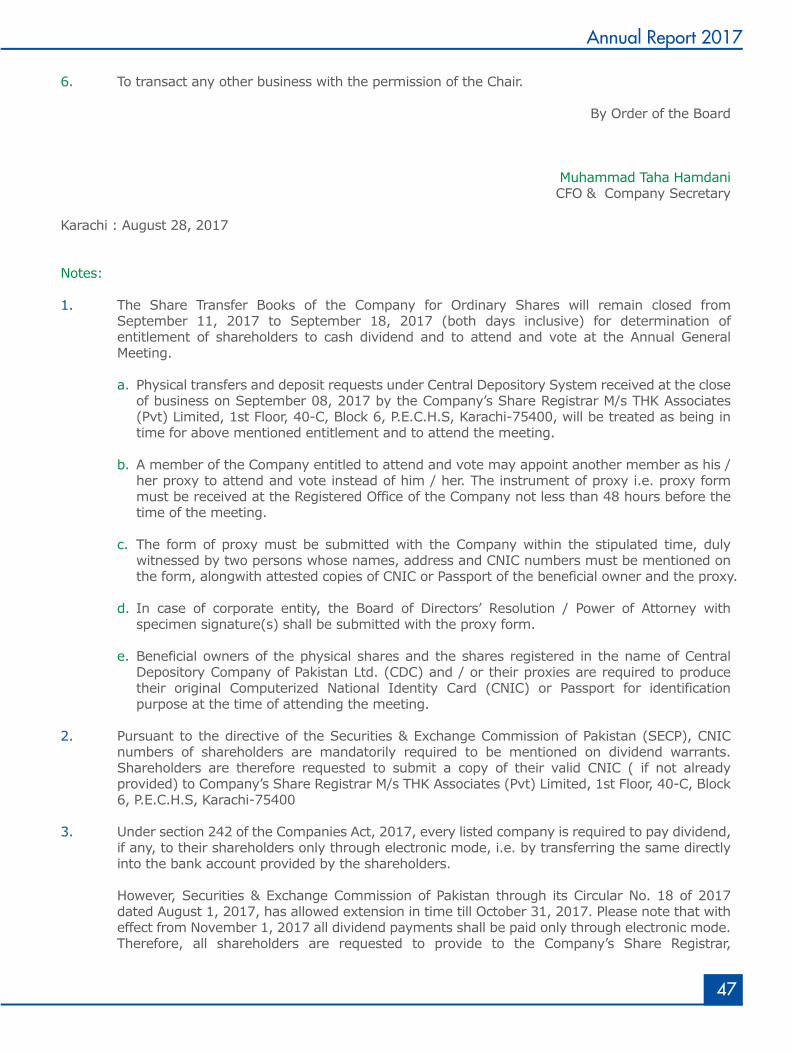
6. To transact any other business with the permission of the Chair.
By Order of the Board
Muhammad Taha HamdaniCFO & Company Secretary
Karachi : August 28, 2017
Notes:
1. The Share Transfer Books of the Company for Ordinary Shares will remain closed from September 11, 2017 to September 18, 2017 (both days inclusive) for determination of entitlement of shareholders to cash dividend and to attend and vote at the Annual General Meeting.
a. Physical transfers and deposit requests under Central Depository System received at the close of business on September 08, 2017 by the Company’s Share Registrar M/s THK Associates (Pvt) Limited, 1st Floor, 40-C, Block 6, P.E.C.H.S, Karachi-75400, will be treated as being in time for above mentioned entitlement and to attend the meeting.
b. A member of the Company entitled to attend and vote may appoint another member as his / her proxy to attend and vote instead of him / her. The instrument of proxy i.e. proxy form must be received at the Registered Office of the Company not less than 48 hours before the time of the meeting.
c. The form of proxy must be submitted with the Company within the stipulated time, duly witnessed by two persons whose names, address and CNIC numbers must be mentioned on the form, alongwith attested copies of CNIC or Passport of the beneficial owner and the proxy.
d. In case of corporate entity, the Board of Directors’ Resolution / Power of Attorney with specimen signature(s) shall be submitted with the proxy form.
e. Beneficial owners of the physical shares and the shares registered in the name of Central Depository Company of Pakistan Ltd. (CDC) and / or their proxies are required to produce their original Computerized National Identity Card (CNIC) or Passport for identification purpose at the time of attending the meeting.
2. Pursuant to the directive of the Securities & Exchange Commission of Pakistan (SECP), CNIC numbers of shareholders are mandatorily required to be mentioned on dividend warrants. Shareholders are therefore requested to submit a copy of their valid CNIC ( if not already provided) to Company’s Share Registrar M/s THK Associates (Pvt) Limited, 1st Floor, 40-C, Block 6, P.E.C.H.S, Karachi-75400
3. Under section 242 of the Companies Act, 2017, every listed company is required to pay dividend, if any, to their shareholders only through electronic mode, i.e. by transferring the same directly into the bank account provided by the shareholders.
However, Securities & Exchange Commission of Pakistan through its Circular No. 18 of 2017 dated August 1, 2017, has allowed extension in time till October 31, 2017. Please note that with effect from November 1, 2017 all dividend payments shall be paid only through electronic mode. Therefore, all shareholders are requested to provide to the Company’s Share Registrar,
48
Thatta Cement
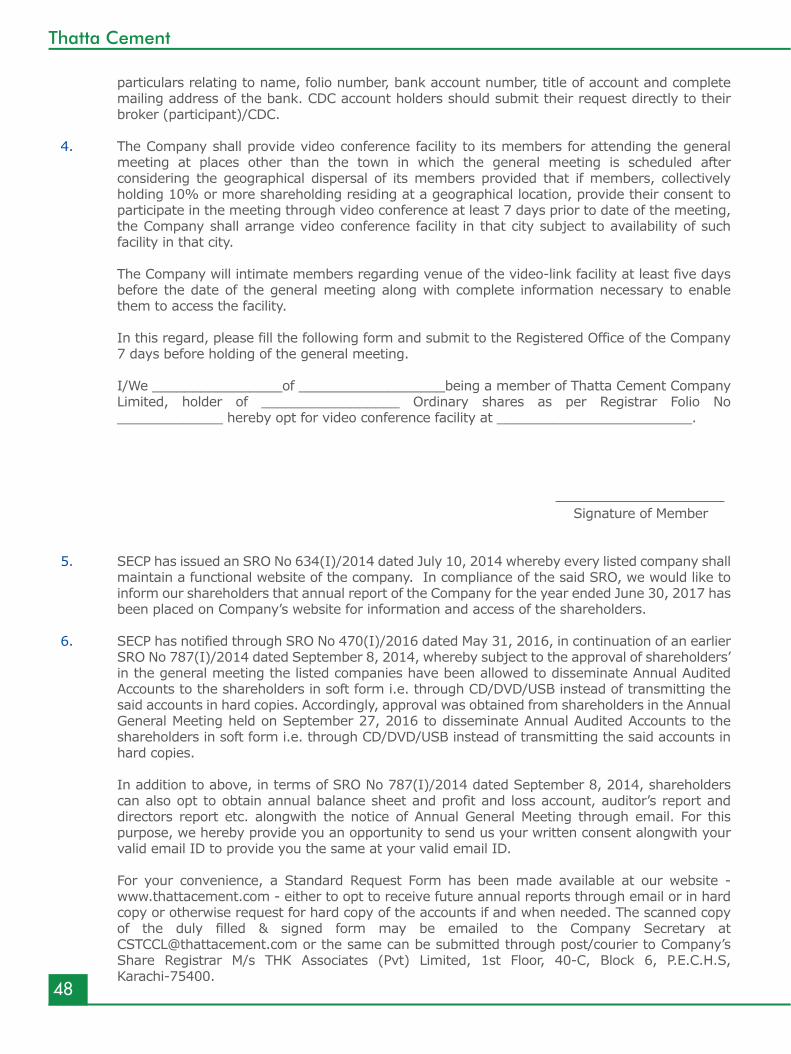
particulars relating to name, folio number, bank account number, title of account and complete mailing address of the bank. CDC account holders should submit their request directly to their broker (participant)/CDC.
4. The Company shall provide video conference facility to its members for attending the general meeting at places other than the town in which the general meeting is scheduled after considering the geographical dispersal of its members provided that if members, collectively holding 10% or more shareholding residing at a geographical location, provide their consent to participate in the meeting through video conference at least 7 days prior to date of the meeting, the Company shall arrange video conference facility in that city subject to availability of such facility in that city.
The Company will intimate members regarding venue of the video-link facility at least five days before the date of the general meeting along with complete information necessary to enable them to access the facility.
In this regard, please fill the following form and submit to the Registered Office of the Company 7 days before holding of the general meeting.
I/We ________________of __________________being a member of Thatta Cement Company Limited, holder of _________________ Ordinary shares as per Registrar Folio No _____________ hereby opt for video conference facility at ________________________.
Signature of Member
5. SECP has issued an SRO No 634(I)/2014 dated July 10, 2014 whereby every listed company shall maintain a functional website of the company. In compliance of the said SRO, we would like to inform our shareholders that annual report of the Company for the year ended June 30, 2017 has been placed on Company’s website for information and access of the shareholders.
6. SECP has notified through SRO No 470(I)/2016 dated May 31, 2016, in continuation of an earlier SRO No 787(I)/2014 dated September 8, 2014, whereby subject to the approval of shareholders’ in the general meeting the listed companies have been allowed to disseminate Annual Audited Accounts to the shareholders in soft form i.e. through CD/DVD/USB instead of transmitting the said accounts in hard copies. Accordingly, approval was obtained from shareholders in the Annual General Meeting held on September 27, 2016 to disseminate Annual Audited Accounts to the shareholders in soft form i.e. through CD/DVD/USB instead of transmitting the said accounts in hard copies.
In addition to above, in terms of SRO No 787(I)/2014 dated September 8, 2014, shareholders can also opt to obtain annual balance sheet and profit and loss account, auditor’s report and directors report etc. alongwith the notice of Annual General Meeting through email. For this purpose, we hereby provide you an opportunity to send us your written consent alongwith your valid email ID to provide you the same at your valid email ID.
For your convenience, a Standard Request Form has been made available at our website - www.thattacement.com - either to opt to receive future annual reports through email or in hard copy or otherwise request for hard copy of the accounts if and when needed. The scanned copy of the duly filled & signed form may be emailed to the Company Secretary at [email protected] or the same can be submitted through post/courier to Company’s Share Registrar M/s THK Associates (Pvt) Limited, 1st Floor, 40-C, Block 6, P.E.C.H.S, Karachi-75400.
49
Annual Report 2017
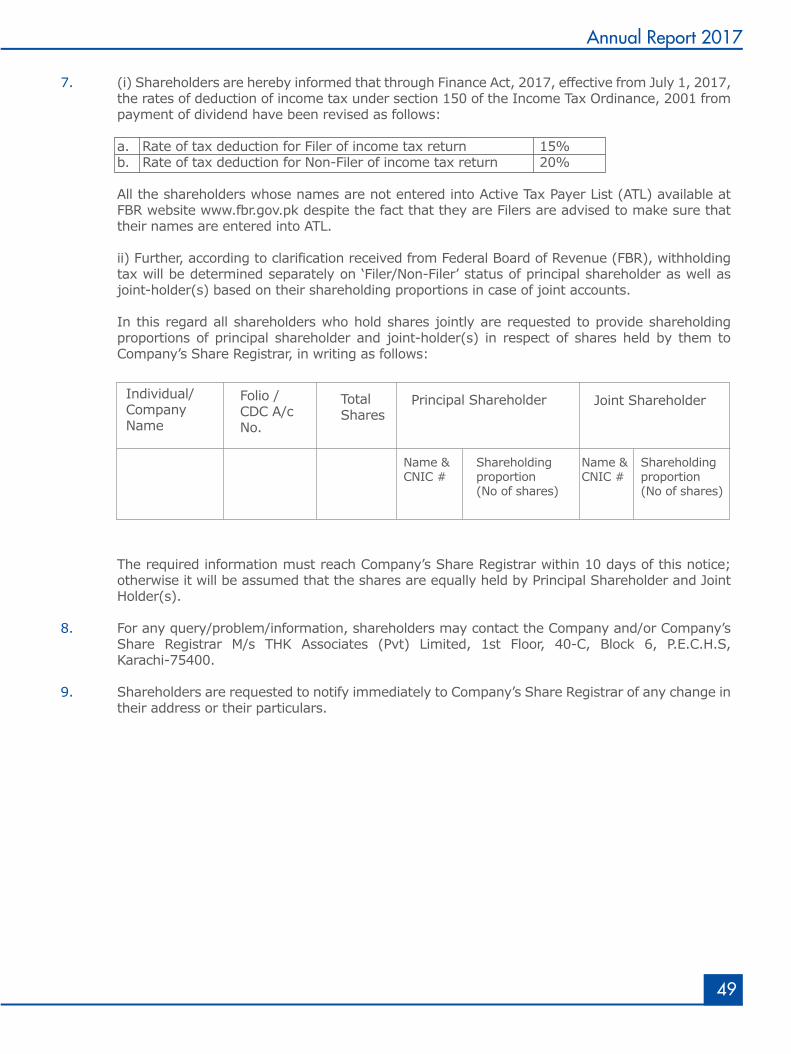
7. (i) Shareholders are hereby informed that through Finance Act, 2017, effective from July 1, 2017, the rates of deduction of income tax under section 150 of the Income Tax Ordinance, 2001 from payment of dividend have been revised as follows:
a. Rate of tax deduction for Filer of income tax return 15% b. Rate of tax deduction for Non-Filer of income tax return 20%
All the shareholders whose names are not entered into Active Tax Payer List (ATL) available at FBR website www.fbr.gov.pk despite the fact that they are Filers are advised to make sure that their names are entered into ATL.
ii) Further, according to clarification received from Federal Board of Revenue (FBR), withholding tax will be determined separately on ‘Filer/Non-Filer’ status of principal shareholder as well as joint-holder(s) based on their shareholding proportions in case of joint accounts.
In this regard all shareholders who hold shares jointly are requested to provide shareholding proportions of principal shareholder and joint-holder(s) in respect of shares held by them to Company’s Share Registrar, in writing as follows:
The required information must reach Company’s Share Registrar within 10 days of this notice; otherwise it will be assumed that the shares are equally held by Principal Shareholder and Joint Holder(s).
8. For any query/problem/information, shareholders may contact the Company and/or Company’s Share Registrar M/s THK Associates (Pvt) Limited, 1st Floor, 40-C, Block 6, P.E.C.H.S, Karachi-75400.
9. Shareholders are requested to notify immediately to Company’s Share Registrar of any change in their address or their particulars.
Individual/CompanyName
Folio /CDC A/cNo.
TotalShares
Principal Shareholder Joint Shareholder
Name &CNIC #
Name &CNIC #
Shareholdingproportion(No of shares)
Shareholdingproportion(No of shares)
50
Thatta Cement
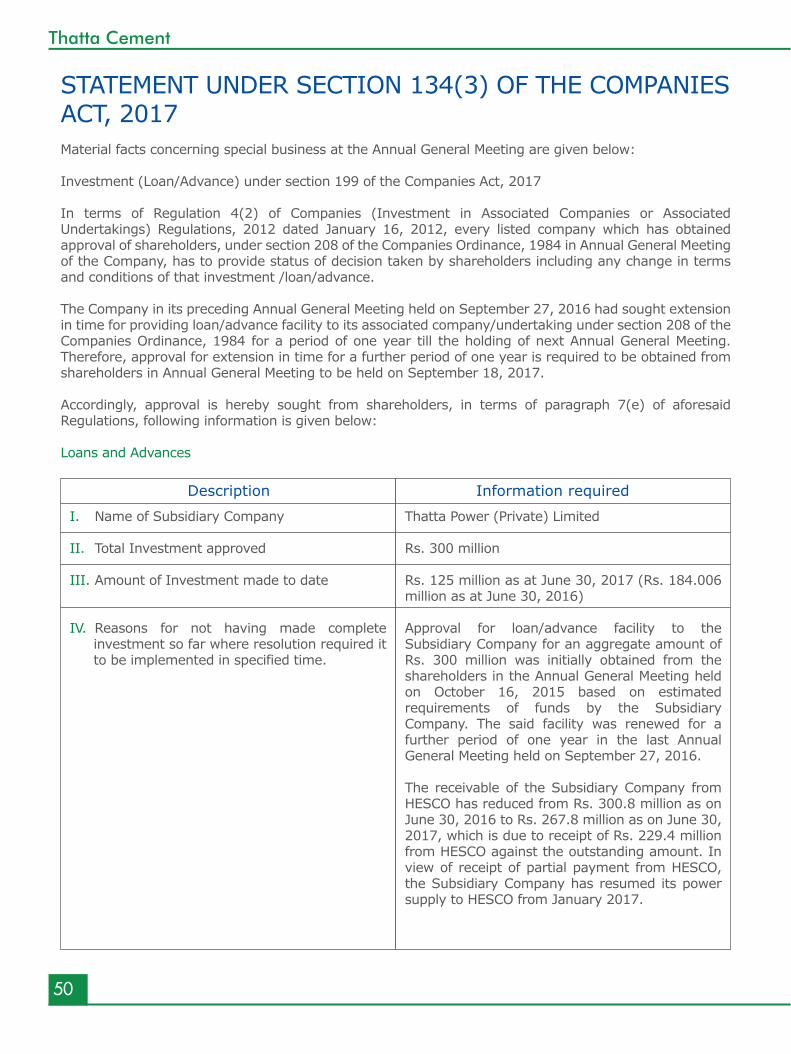
STATEMENT UNDER SECTION 134(3) OF THE COMPANIES ACT, 2017Material facts concerning special business at the Annual General Meeting are given below:
Investment (Loan/Advance) under section 199 of the Companies Act, 2017
In terms of Regulation 4(2) of Companies (Investment in Associated Companies or Associated Undertakings) Regulations, 2012 dated January 16, 2012, every listed company which has obtained approval of shareholders, under section 208 of the Companies Ordinance, 1984 in Annual General Meeting of the Company, has to provide status of decision taken by shareholders including any change in terms and conditions of that investment /loan/advance.
The Company in its preceding Annual General Meeting held on September 27, 2016 had sought extension in time for providing loan/advance facility to its associated company/undertaking under section 208 of the Companies Ordinance, 1984 for a period of one year till the holding of next Annual General Meeting. Therefore, approval for extension in time for a further period of one year is required to be obtained from shareholders in Annual General Meeting to be held on September 18, 2017. Accordingly, approval is hereby sought from shareholders, in terms of paragraph 7(e) of aforesaid Regulations, following information is given below:
Loans and Advances
Description Information required
I. Name of Subsidiary Company
II. Total Investment approved
III. Amount of Investment made to date
IV. Reasons for not having made complete investment so far where resolution required it to be implemented in specified time.
Thatta Power (Private) Limited
Rs. 300 million
Rs. 125 million as at June 30, 2017 (Rs. 184.006 million as at June 30, 2016)
Approval for loan/advance facility to the Subsidiary Company for an aggregate amount of Rs. 300 million was initially obtained from the shareholders in the Annual General Meeting held on October 16, 2015 based on estimated requirements of funds by the Subsidiary Company. The said facility was renewed for a further period of one year in the last Annual General Meeting held on September 27, 2016.
The receivable of the Subsidiary Company from HESCO has reduced from Rs. 300.8 million as on June 30, 2016 to Rs. 267.8 million as on June 30, 2017, which is due to receipt of Rs. 229.4 million from HESCO against the outstanding amount. In view of receipt of partial payment from HESCO, the Subsidiary Company has resumed its power supply to HESCO from January 2017.
51
Annual Report 2017
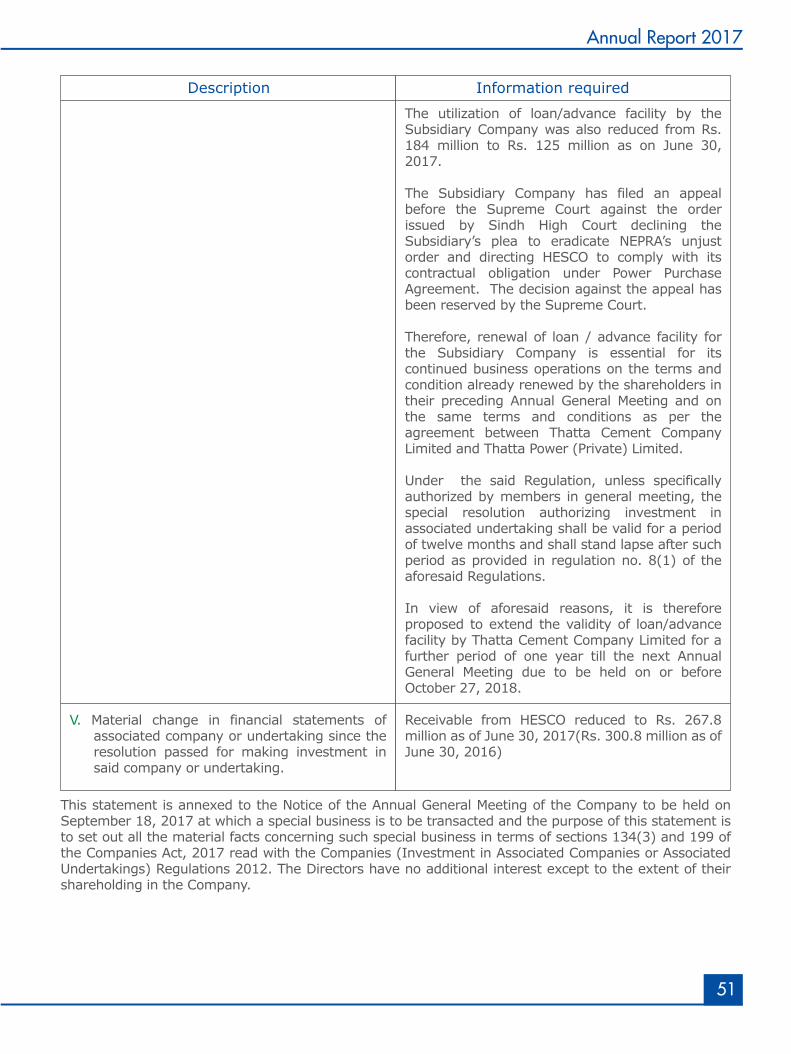
This statement is annexed to the Notice of the Annual General Meeting of the Company to be held on September 18, 2017 at which a special business is to be transacted and the purpose of this statement is to set out all the material facts concerning such special business in terms of sections 134(3) and 199 of the Companies Act, 2017 read with the Companies (Investment in Associated Companies or Associated Undertakings) Regulations 2012. The Directors have no additional interest except to the extent of their shareholding in the Company.
V. Material change in financial statements of associated company or undertaking since the resolution passed for making investment in said company or undertaking.
Description Information required
The utilization of loan/advance facility by the Subsidiary Company was also reduced from Rs. 184 million to Rs. 125 million as on June 30, 2017.
The Subsidiary Company has filed an appeal before the Supreme Court against the order issued by Sindh High Court declining the Subsidiary’s plea to eradicate NEPRA’s unjust order and directing HESCO to comply with its contractual obligation under Power Purchase Agreement. The decision against the appeal has been reserved by the Supreme Court.
Therefore, renewal of loan / advance facility for the Subsidiary Company is essential for its continued business operations on the terms and condition already renewed by the shareholders in their preceding Annual General Meeting and on the same terms and conditions as per the agreement between Thatta Cement Company Limited and Thatta Power (Private) Limited.
Under the said Regulation, unless specifically authorized by members in general meeting, the special resolution authorizing investment in associated undertaking shall be valid for a period of twelve months and shall stand lapse after such period as provided in regulation no. 8(1) of the aforesaid Regulations.
In view of aforesaid reasons, it is therefore proposed to extend the validity of loan/advance facility by Thatta Cement Company Limited for a further period of one year till the next Annual General Meeting due to be held on or before October 27, 2018.
Receivable from HESCO reduced to Rs. 267.8 million as of June 30, 2017(Rs. 300.8 million as of June 30, 2016)
52
Thatta Cement
INTERACTION WITH SHAREHOLDER’S
Protecting the shareholders’ interest is our primary responsibility. We seek to meet our shareholders interest through maintaining profitability and growth in business operations and effective governance and corporate reporting framework. Annual General Meeting and statutory reporting are effective means of communication with our shareholders.
Investor’s Grievances
Any complaint or observation received during general meetings or directly from shareholder are addressed by the Company Secretary. Furthermore, information to shareholders is provided within the statutory timeframe.
Investors section
To provide updated information about the financial health of the Company, the website of Thatta Cement (http://thattacement.com/Financial%20Statement.html) provides all the financial reports that may be used by existing or prospective investors to facilitate their investment decisions.
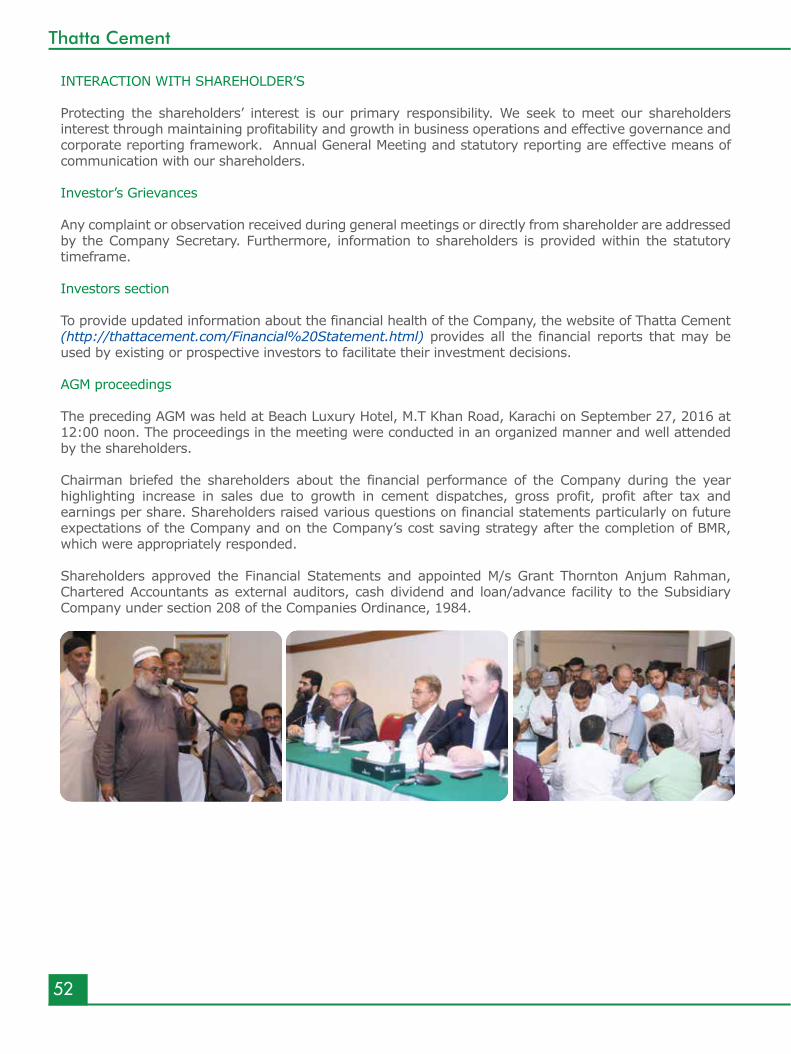
AGM proceedings
The preceding AGM was held at Beach Luxury Hotel, M.T Khan Road, Karachi on September 27, 2016 at 12:00 noon. The proceedings in the meeting were conducted in an organized manner and well attended by the shareholders.
Chairman briefed the shareholders about the financial performance of the Company during the year highlighting increase in sales due to growth in cement dispatches, gross profit, profit after tax and earnings per share. Shareholders raised various questions on financial statements particularly on future expectations of the Company and on the Company’s cost saving strategy after the completion of BMR, which were appropriately responded.
Shareholders approved the Financial Statements and appointed M/s Grant Thornton Anjum Rahman, Chartered Accountants as external auditors, cash dividend and loan/advance facility to the Subsidiary Company under section 208 of the Companies Ordinance, 1984.
53
Annual Report 2017
Corporate Governance
Maintaining Exemplary StandardsOur defined system of governance reflects
our organization, performance and attitude towards our stakeholders which benefits
in maintaining a long term successful relationship.
54
Thatta Cement
We have reviewed the Statement of Compliance with the best practices (the Statement) contained in the Code of Corporate Governance (the Code) prepared by the Board of Directors (the Board) of Thatta Cement Company Limited (“the Company”) for the year ended June 30, 2017, to comply with the requirements of Listing Regulation No. 5.19 of Listing of Companies and Securities Regulation contained in the Rule Book of Pakistan Stock Exchange Limited, where the Company is listed.
The responsibility for compliance with the Code is that of the Board of Directors of the Company. Our responsibility is to review, to the extent where such compliance can be objectively verified, whether the Statement of compliance reflects the status of the Company’s compliance with the provisions of the Code and report if it does not and to highlight any non – compliance with the requirements of the Code. A review is limited primarily to inquiries of the Company’s personnel and review of various documents prepared by the Company to comply with the Code.
As part of our audit of financial statements, we are required to obtain an understanding of the accounting and internal control systems sufficient to plan the audit and develop an effective audit approach. We are not required to consider whether the Board of Directors’ statement on internal control covers all risks and controls, or to form an opinion on the effectiveness of such internal controls, the Company’s corporate governance procedures and risk.
The Code requires the Company to place before the Audit Committee, and upon recommendation of the Audit committee placed before the Board of Directors for their review and approval of its related party transactions distinguishing between transactions carried out on terms equivalent to those that prevail in arm's length transactions and transactions which are not executed at arm's length price and recording proper justification for using such alternate pricing mechanism. We are only required and have ensured compliance of this requirement to the extent of approval of related party transactions by the Board upon recommendation of the Audit Committee. We have not carried out any procedures to determine whether the related party transactions were undertaken at arm's length price or not.
Review Report to the Memberson Statement of Compliance withThe Code of Corporate Governance
55
Annual Report 2017
Based on our review, nothing has come to our attention, which causes us to believe that the Statement of Compliance does not appropriately reflect the Company’s compliance, in all material respects, with the best practices contained in the Code as applicable to the Company for the year ended June 30, 2017.
Date: August 19, 2017 Grant Thornton Anjum RahmanKarachi Chartered Accountants Muhammad Shaukat Naseeb Engagement Partner
56
Thatta Cement
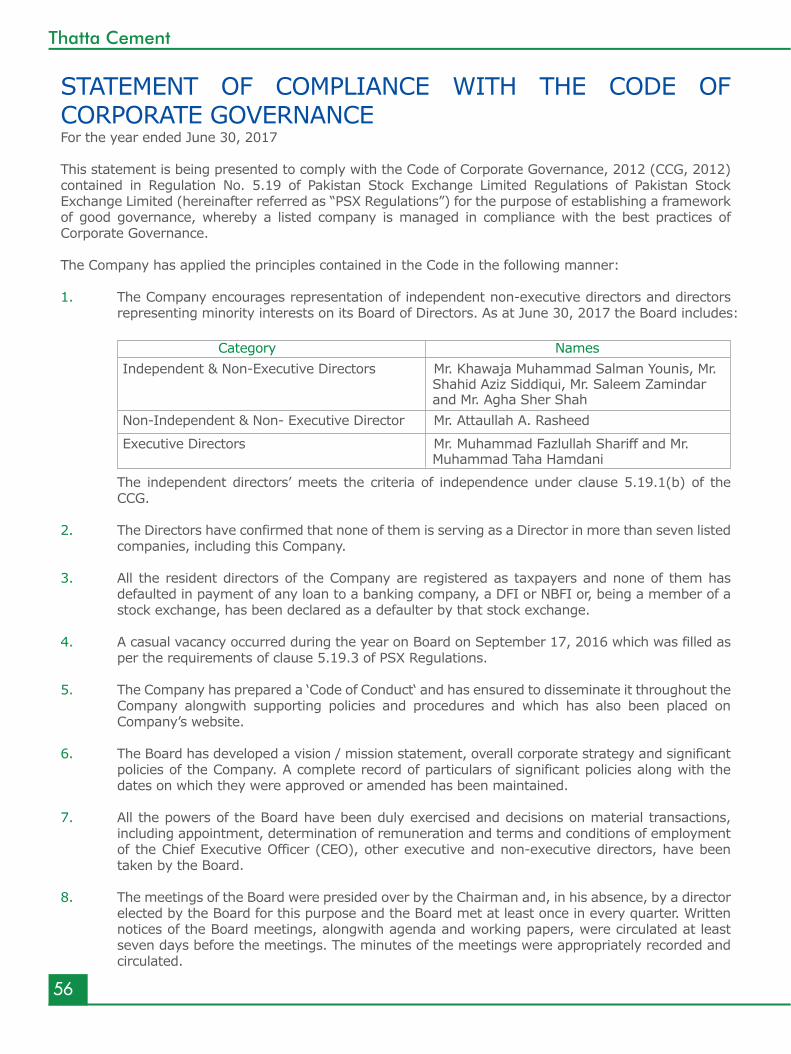
STATEMENT OF COMPLIANCE WITH THE CODE OF CORPORATE GOVERNANCEFor the year ended June 30, 2017
This statement is being presented to comply with the Code of Corporate Governance, 2012 (CCG, 2012) contained in Regulation No. 5.19 of Pakistan Stock Exchange Limited Regulations of Pakistan Stock Exchange Limited (hereinafter referred as “PSX Regulations”) for the purpose of establishing a framework of good governance, whereby a listed company is managed in compliance with the best practices of Corporate Governance.
The Company has applied the principles contained in the Code in the following manner:
1. The Company encourages representation of independent non-executive directors and directors representing minority interests on its Board of Directors. As at June 30, 2017 the Board includes:
The independent directors’ meets the criteria of independence under clause 5.19.1(b) of the CCG.
2. The Directors have confirmed that none of them is serving as a Director in more than seven listed companies, including this Company.
3. All the resident directors of the Company are registered as taxpayers and none of them has
defaulted in payment of any loan to a banking company, a DFI or NBFI or, being a member of a stock exchange, has been declared as a defaulter by that stock exchange.
4. A casual vacancy occurred during the year on Board on September 17, 2016 which was filled as per the requirements of clause 5.19.3 of PSX Regulations.
5. The Company has prepared a ‘Code of Conduct‘ and has ensured to disseminate it throughout the
Company alongwith supporting policies and procedures and which has also been placed on Company’s website.
6. The Board has developed a vision / mission statement, overall corporate strategy and significant policies of the Company. A complete record of particulars of significant policies along with the dates on which they were approved or amended has been maintained.
7. All the powers of the Board have been duly exercised and decisions on material transactions, including appointment, determination of remuneration and terms and conditions of employment of the Chief Executive Officer (CEO), other executive and non-executive directors, have been taken by the Board.
8. The meetings of the Board were presided over by the Chairman and, in his absence, by a director elected by the Board for this purpose and the Board met at least once in every quarter. Written notices of the Board meetings, alongwith agenda and working papers, were circulated at least seven days before the meetings. The minutes of the meetings were appropriately recorded and circulated.
Category NamesIndependent & Non-Executive Directors Mr. Khawaja Muhammad Salman Younis, Mr.
Shahid Aziz Siddiqui, Mr. Saleem Zamindar and Mr. Agha Sher Shah
Non-Independent & Non- Executive Director Mr. Attaullah A. Rasheed
Executive Directors Mr. Muhammad Fazlullah Shariff and Mr. Muhammad Taha Hamdani
57
Annual Report 2017
9. As per the requirement of Regulation no. 5.19.7 of the PSX Regulations, all directors on Board of the Company have completed Director’s Training to meet the requirement of aforesaid Regulation.
10. No new appointment of Chief Financial Officer (CFO), Company Secretary and Head of Internal Audit has been made during the year. However, their remuneration and terms and conditions of employment have been duly approved by the Board.
11. The Directors’ Report for this year has been prepared in compliance with the requirements of the Code and fully describes the salient matters required to be disclosed.
12. The financial statements of the Company were duly endorsed by CEO and CFO before approval of the Board.
13. The Directors, CEO and other executives do not hold any interest in the shares of the Company other than disclosed in the pattern of shareholdings.
14. The Company has complied with all the corporate and financial reporting requirement of the Code.
15. The Board has formed an Audit Committee. It comprises of four members of whom majority are non-executive directors and the Chairman of the committee is Non-independent director.
16. The meetings of the Audit Committee were held at least once every quarter prior to approval of interim and final results of the Company as required by the Code. The terms of reference of the committee have been formed and advised to the committee for compliance.
17. The Board has also formed an HR and Remuneration Committee. It comprises of four members of whom majority are non-executive directors and the Chairman of the committee is an independent director.
18. The Board has developed a Board Evaluation Framework for annual evaluation of its own performance to meet the requirement of CCG, 2012 and has also carried its evaluation on the basis of such framework. The overall result of Board’s evaluation has been termed as “Effective Board” based on scoring criteria provided in the said framework.
19. The Board has outsourced the internal audit function to M/s Deloitte Yousuf Adil & Co., Chartered Accountants and also appointed a Head of Internal Audit who is suitably qualified and experienced for the purpose and is conversant with the policies and procedures of the Company.
20. The statutory auditors of the Company have confirmed that they have been given a satisfactory
rating under the quality control review programe of the Institute of Chartered Accountants of Pakistan, that they or any of the partners of the firm, their spouses and minor children do not hold shares of the Company and that the firm and all its partners are in compliance with International Federation of Accountants (IFAC) guidelines on code of ethics as adopted by the Institute of Chartered Accountants of Pakistan.
21. The statutory auditors or the persons associated with them have not been appointed to provide other services except in accordance with the PSX Regulations and the auditors have confirmed that they have observed IFAC guidelines in this regard.
22. The ‘closed period’, prior to the announcement of interim/final results, and business decisions, which may materially affect the market price of company’s securities, was determined and intimated to directors, employees and stock exchange.
58
Thatta Cement
23. Material/price sensitive information has been disseminated among all the participants at once through stock exchange.
24. The Company has complied with the requirements relating to maintenance of register of persons having access to inside information by designated senior management officer in a timely manner and maintained proper record including basis for inclusion or exclusion of names of persons from the said list.
25. We confirm that all other material principles contained in the Code have been duly complied with.
Muhammad Fazlullah ShariffChief Executive Officer
Karachi: August 19, 2017
59
Annual Report 2017
CORPORATE GOVERNANCE - ADDITIONAL INFORMATIONBOARD COMMITTEES
The Board is assisted by two Committees, namely the Audit Committee and the Human Resources & Remuneration Committee, to support its decision-making in their respective domains:
AUDIT COMMITTEE - COMPOSITION
Mr. Attaullah A. Rasheed- ChairmanMr. Khawaja Muhammad Salman Younis - MemberMr. Shahid Aziz Siddiqui - MemberMr. Saleem Zamindar - Member
All the members of Audit Committee are Non-Executive Directors.All the members of Audit Committee are Independent directors except for Mr. Attaullah A. Rasheed.
Meetings of the Audit Committee are held at least once every quarter. The Audit Committee also separately meets with the Head of Internal Audit and external auditors at least once a year without the presence of the management.
The Committee reviews the annual financial statements in the presence of external auditors. The recommendations of the Audit Committee are then submitted for approval of financial results of the Company by the Board. During the year 2016-17, the Audit Committee held four [4] meetings. The minutes of the meetings of the Audit Committee were provided to all the members.
Terms of Reference of Audit Committee
The Board provides adequate resources and authority to enable the Audit Committee to carry out its responsibilities effectively. The Audit Committee, inter alia, recommend to the Board of Directors the appointment of external auditors, their removal, audit fees, the provision by the external auditors of any service to the listed company in addition to audit of its financial statements. The Board of Directors give due consideration to the recommendations of the Audit Committee in all these matters and where it acts otherwise; it shall record the reasons thereof.
The terms of reference of the Audit Committee include the following:
a- determination of appropriate measures to safeguard the Company’s assets;
b- review of quarterly, half yearly and annual financial statements of the Company, prior to their approval by the Board of Directors, focusing on:
• Major judgmental areas;• Significant adjustments resulting from the audit;• going-concern assumption;• any changes in accounting policies and practices;• Compliance with applicable accounting standards;• Compliance with listing regulations and other statutory and regulatory requirements; and• Significant related party transactions.
c- review of preliminary announcement of results prior to publication;
d- facilitating the external audit and discussion with external auditors on major observations arising from interim and final audits and any matter that the auditors may wish to highlight (in the absence of management, where necessary);
60
Thatta Cement
e- review of management letter issued by external auditors and management’s response thereto;
f- ensuring coordination between the internal and external auditors of the Company;
g- review of the scope and extent of internal audit and ensuring that the internal audit function has adequate resources and is appropriately placed within the Company;
h- consideration of major findings of internal investigations of activities characterized by fraud, corruption and abuse of power and management's response thereto;
i- ascertaining that the internal control system including financial and operational controls, accounting systems for timely and appropriate recording of purchases and sales, receipts and payments, assets and liabilities and the reporting structure is adequate and effective;
j- review of the Company’s statement on internal control systems prior to endorsement by the Board of Directors and internal audit reports;
k- instituting special projects, value for money studies or other investigations on any matter specified by the Board of Directors, in consultation with the Chief Executive and to consider remittance of any matter to the external auditors or to any other external body;
l- determination of compliance with relevant statutory requirements;
m- monitoring compliance with the best practices of corporate governance and identification of significant violations thereof; and
n- Consideration of any other issue or matter as may be assigned by the Board of Directors.
61
Annual Report 2017
REPORT OF THE AUDIT COMMITTEEThe Audit Committee has concluded its annual review of the control environment of the Company for the year ended June 30, 2017 and reports that:
• The Company has issued a "Statement of Compliance with the Code of Corporate Governance” which has also been reviewed.
• Understanding and compliance with Company codes and policies has been affirmed by the mem-bers of the Board, the Management and employees of the Company individually.
• Appropriate accounting policies have been consistently applied throughout the period. All core & other applicable International Accounting Standards were followed in preparation of unconsoli-dated and consolidated financial statements of the Company on a going concern basis, for the financial year ended June 30, 2017, which presents fairly the state of affairs, results of opera-tions, profits, cash flows and changes in equity of the Company and its subsidiary for the year under review.
• The Chief Executive and the CFO have endorsed the unconsolidated financial statements and consolidated financial statements of the Company. They acknowledge their responsibility for true and fair presentation of the Company’s financial condition and results, compliance with regula-tions and applicable accounting standards and establishment and maintenance of internal controls and systems of the Company.
• Accounting estimates are based on reasonable and prudent judgment. Proper and adequate accounting records have been maintained by the Company in accordance with the Companies Ordinance, 1984. The financial statements comply with the requirements of the Fourth Schedule to the Companies Ordinance, 1984 and the external reporting is consistent with management processes and adequate for shareholder needs.
• All Directors have access to the Company Secretary. All direct or indirect trading and holdings of Company’s shares by Directors & Executives or their spouses were notified in writing to the Com-pany Secretary along with the price, number of shares, form of share certificates and nature of transaction which were notified by the Company Secretary to the Board within the stipulated time. All such holdings have been disclosed in the Pattern of Shareholdings. The Annual Secre-tarial Compliance Certificate for the year 2015-2016 has been filed within the stipulated time.
• Closed periods were duly determined and announced by the Company, precluding the Directors, the Chief Executive and Executives of the Company from dealing in Company’s shares, prior to each Board meeting involving announcement of interim / final results, distribution to sharehold-ers or any other business decision or information, which could materially affect the share market price of the Company.
INTERNAL AUDIT
• The Company’s system of internal control is sound in design and has been continually evaluated for effectiveness and adequacy.
• The Audit Committee has ensured the achievement of operational, compliance, risk manage-ment, financial reporting and control objectives, safeguarding of the assets of the Company and the shareholders wealth at all levels within the Company.
• The Internal Audit function has carried out its duties under The Internal Audit Charter defined by the Committee and approved by the Board of Directors.
62
Thatta Cement
• The Committee has reviewed material Internal Audit findings, taking appropriate actions or bringing the matters to the Board’s attention where required.
• The Head of Internal Audit has direct access to the Chairman of the Audit Committee and the Committee has ensured staffing of personnel through outsourcing the internal audit function to a firm of Chartered Accountants having sufficient internal audit acumen. The Internal Audit func-tion has all necessary access to Management and the right to seek information and explanations.
• Coordination between the External and Internal Auditors was facilitated to ensure efficiency and contribution to the Company’s objectives, including a reliable financial reporting system and com-pliance with laws and regulations.
EXTERNAL AUDITORS
• The Statutory external auditors of the Company, Grant Thornton Anjum Rahman (GTAR) Char-tered Accountants, have completed their audit of the “Company’s Unconsolidated Financial State-ments”, the “Consolidated Financial Statements" and the “Statement of Compliance with the Code of Corporate Governance" for the financial year ended on June 30, 2017.
• The Auditors have been allowed direct access to the Committee and the effectiveness, indepen-dence and objectivity of the Auditors has thereby been ensured.
• The Auditors attended the preceding Annual General Meeting of the Company held on September 27, 2016 and have given their consent to act as external auditors of the Company for the year 2016-2017. The Audit Committee has also recommended to Board of Directors the re-appoint-ment of external auditors, subject to approval of shareholders in Annual General Meeting to be held on September 18, 2017.
Date: August 19, 2017 Chairman-Audit Committee
63
Annual Report 2017
HUMAN RESOURCES AND REMUNERATION COMMITTEEThatta Cement Company Limited (TCCL) acknowledges that the success of its organization is closely linked to the success of its people. Towards this the Company has cultivated the right climate for employees to thrive and contribute to achieve organization’s objectives. The Company continuously aligns its people processes to reinforce the right foundation upon which to build and grow.
The Company has an effective and dynamic Human Resources (HR) function to address all employee related matters including training, performance evaluation, career development and succession planning in a transparent and non-discriminatory manner. For the purpose of governing HR, the Board has constituted a Human Resources and Remuneration Committee and also approved the following terms of reference.
In the below mentioned Terms of Reference (TOR) the Human Resources and Remuneration Committee is referred to as the Committee and Thatta Cement Company Limited is referred to as the Company.
I. PURPOSE
The purpose of the Human Resources and Remuneration Committee is to assist the Board in fulfilling its obligations relating to Human Resources Policies and related matters and to establish a plan of continuity and development of human resources for TCCL.
II. COMPOSITION AND OPERATIONS
A. The Committee shall be composed of at least three members comprising a majority of non-executive directors, including preferably an independent director. The CEO may be included as a member of the committee but not as the chairman of committee.
B. The Committee shall meet at least twice in each financial year.
C. From time to time, as deemed required by the Committee, the Committee may obtain independent advice regarding human resource, health and safety, disputes of labour unions and compensation issues.
D. The Head of Human Resources shall serve as the Secretary of the Committee.
III. DUTIES AND RESPONSIBILITIES
Subject to the powers and duties delegated by the Board of Directors of the Company, the Committee will review the following and recommend to the Board for their approval where required:
A. The objectives, strategies and overall plans of Human Resources and ensure that they are within the framework of existing laws and regulations.
B. The Company’s compensation and benefits philosophy, strategy and guidelines are in compliance with laws and any applicable guidelines established by the Labor Laws of Pakistan, competitiveness with the market, annual country inflation rate and changes in trends adopted by the Cement manufacturing sector in the country.
C. The Company’s strategy, plans and proposals related to salary adjustments are based on market surveys, fixed and performance bonuses of the Company’s staff.
64
Thatta Cement
D. Approve annual increments of Company’s staff excluding Key Management Personnel (i.e. CEO, COO, CFO, GM Works, Company Secretary and Head of Internal Audit) on the recommendation of CEO.
E. Review and recommend the annual increments and adjustments of Key Management Personnel i.e. CEO, COO, CFO, Company Secretary, GM Works, and Head of Internal Audit, based on performance.
F. Review and recommend the selection, evaluation, compensation package (including retirement benefits) and succession planning of the CEO, COO, CFO, Company Secretary, GM Works and Head of Internal Audit.
G. The Company’s strategy related to Human Capital Management and Planning, includes:
i. Recruitment and selection strategy is aligned to business objectives and philosophy;
ii. Training and developmental needs of Human Resources are identified, adequately met and aligned to business objectives;
iii. Performance Evaluation and Management System is objective, transparent and unbiased;
H. Review the Human Resources Policies of the Company and ensure that they are updated from time to time to keep abreast with market practices.
I. Review and recommend Core Values to be adopted by the Company.
J. Review and recommend the Corporate Social Responsibility (CSR) philosophy, initiatives and other philanthropic activities including donations, charities, contributions and other payments of a similar nature.
K. Review and recommend health, safety and environment policies and ensure that they are in line with best practices.
L. Review and recommend the whistle blower policy and ensure that it provides a mechanism of protection for the whistle blower.
M. Annually review and recommend changes to the Committee’s Terms of Reference.
N. Ensure that Executive Directors do not participate in any discussions on the subject of their own remuneration.
O. Disclose the members of the Committee in each Annual Report.
IV. ACCOUNTABILITY
The Committee shall report its discussions to the Board by oral or written report at every Board meeting.
65
Annual Report 2017
WHISTLEBLOWER POLICY Thatta Cement requires employees to observe high standards of business and personal ethics in the conduct of their duties and responsibilities. The employees must perform their functions as representatives of the Company and fulfill their responsibilities with honesty and integrity in compliance with all applicable laws and HR Policy rules.
It is the responsibility of all employees to comply with the Code and to report violations or suspected violations in accordance with this Whistleblower Policy.
Whistleblowing means a disclosure of information by an employee where he/she reasonably believes that one of the following or some other illegalities/irregularities are happening or likely to happen as a result of deviations, lapses or violations on the part of a co-employee:
• A criminal offence
• A failure to comply with legal obligation
• A danger to the health and safety of an employee
• A serious breach of the Company’s internal policies, rules, regulations or business principles exposing the Company to any financial, operational, market or reputational risk
• Any unethical conduct
• Questionable/ unusual accounting of business practices
• A deliberate concealment of information tending to show any of the above
No employee who in good faith reports a violation or a potential violation not directly related to code shall suffer harassment, prejudicial to his/her employment as a consequence of retaliation. An employee who retaliates against someone who has reported a violation in good faith shall be liable to disciplinary action including termination of employment.
Reporting Violations
The policy suggests that employees share their questions, concerns, suggestions or complaints with someone who can address them properly which in general is employee’s immediate supervisor or Head of HRD or Head of Legal.
66
Thatta Cement
IT GOVERNANCE POLICYFor any organization, in order to deliver full value, has to invest in Information Technology which is to be fully aligned to business strategies and direction, key risks have to be identified and controlled, standards are followed and legislative and regulatory compliance demonstrated. In Thatta Cement, we emphasize on implementation and adoption of right tools and latest technologies to support the management in imparting their role of decision making. TCCL IT Governance Policy provides a framework to ensure:
• Priorities are set and communicated for conflicting resource requirements and aligned with busi-ness objectives.
• Effectiveness of TCCL’s IT investments is monitored.• Confidentiality, Integrity and Availability of data is ensured.• Effective lines of accountability, responsibility and authority are created for compliance.• Key risks are identified and remedial actions are taken on timely basis.• IT Policies are implemented and noncompliance is highlighted.• Implementation of planned initiatives and projects are monitored and reported to management.
DISASTER RECOVERY & BUSINESS CONTINUITY PLANNINGWhile focusing on avoidance of disaster at first hand, a comprehensive Disaster Recovery Plan covering all essential and critical infrastructure elements is implemented and a DR site is established after approval from Board of Directors. Plan is designed to cater disasters from small incidents/events to large scale disasters having onsite as well as off-site arrangements. The overall objective of Disaster/Business Recovery Plan (DRP) is to protect Thatta Cement Company Limited’s resources and employees, to safeguard the organization’s vital records and to ensure the ability of the Company to function effectively in the event of a severe disruption to normal operating procedures.
BC/DR plans are substantiated through testing, which identifies deficiencies and provides opportunities to fix problems before a disaster occurs. To substantiate TCCL BCP/DRP and check its effectiveness, drills had been performed at Head Office and Factory on March 25, 2017 and March 29, 2017 respectively.
ERP IMPLEMENTATION/GO-LIVEWith a vision to take benefits of technological advancement made in information technology, TCCL has implemented its new ERP System in July 2016, to achieve greater visibility, control and operational efficiencies in its business operations. Prior to the implementation of ERP, the company was using standalone legacy systems for financials, inventory and sales which were functioning in silos. ERP System implementation has integrated and streamlined all business processes resulting in rapid access to information for management to take better business decisions.
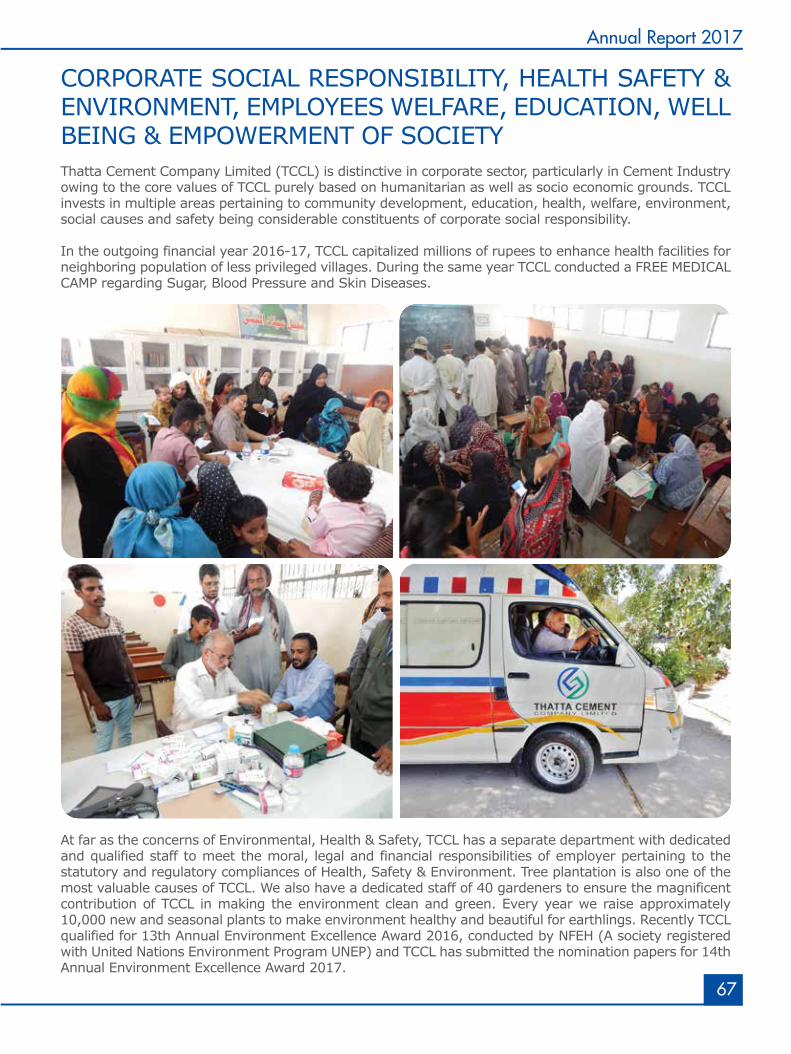
67
Annual Report 2017
CORPORATE SOCIAL RESPONSIBILITY, HEALTH SAFETY & ENVIRONMENT, EMPLOYEES WELFARE, EDUCATION, WELL BEING & EMPOWERMENT OF SOCIETY Thatta Cement Company Limited (TCCL) is distinctive in corporate sector, particularly in Cement Industry owing to the core values of TCCL purely based on humanitarian as well as socio economic grounds. TCCL invests in multiple areas pertaining to community development, education, health, welfare, environment, social causes and safety being considerable constituents of corporate social responsibility.
In the outgoing financial year 2016-17, TCCL capitalized millions of rupees to enhance health facilities for neighboring population of less privileged villages. During the same year TCCL conducted a FREE MEDICAL CAMP regarding Sugar, Blood Pressure and Skin Diseases.
At far as the concerns of Environmental, Health & Safety, TCCL has a separate department with dedicated and qualified staff to meet the moral, legal and financial responsibilities of employer pertaining to the statutory and regulatory compliances of Health, Safety & Environment. Tree plantation is also one of the most valuable causes of TCCL. We also have a dedicated staff of 40 gardeners to ensure the magnificent contribution of TCCL in making the environment clean and green. Every year we raise approximately 10,000 new and seasonal plants to make environment healthy and beautiful for earthlings. Recently TCCL qualified for 13th Annual Environment Excellence Award 2016, conducted by NFEH (A society registered with United Nations Environment Program UNEP) and TCCL has submitted the nomination papers for 14th Annual Environment Excellence Award 2017.
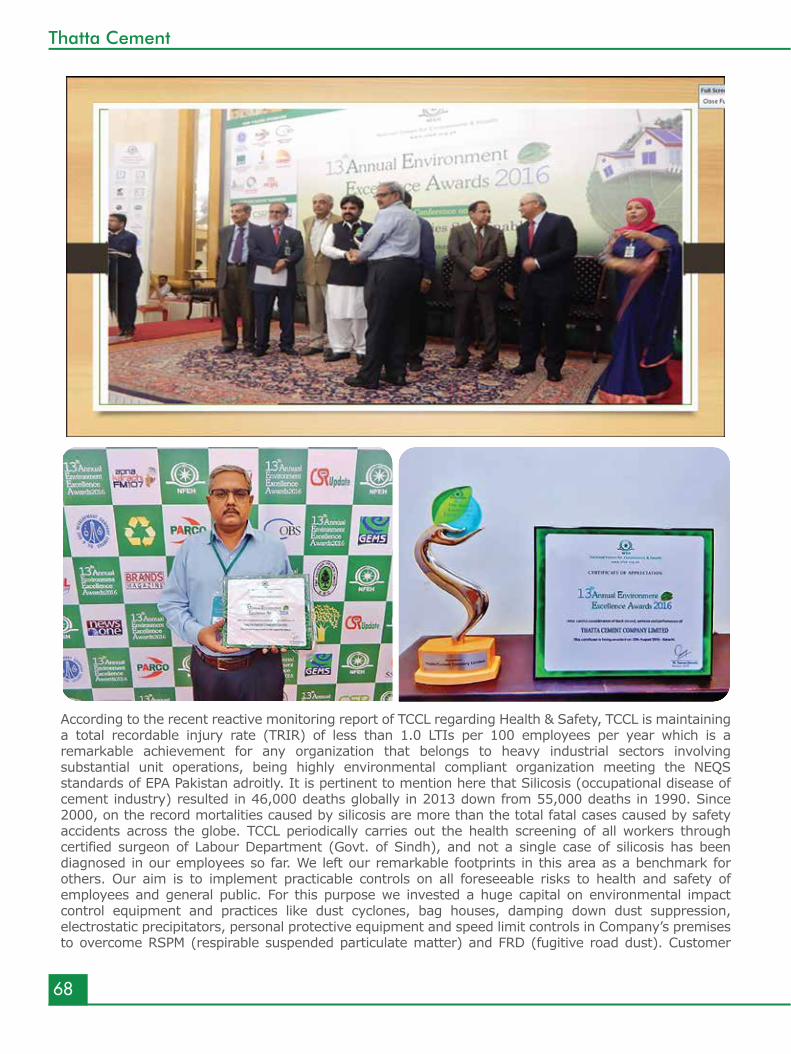
68
Thatta Cement
According to the recent reactive monitoring report of TCCL regarding Health & Safety, TCCL is maintaining a total recordable injury rate (TRIR) of less than 1.0 LTIs per 100 employees per year which is a remarkable achievement for any organization that belongs to heavy industrial sectors involving substantial unit operations, being highly environmental compliant organization meeting the NEQS standards of EPA Pakistan adroitly. It is pertinent to mention here that Silicosis (occupational disease of cement industry) resulted in 46,000 deaths globally in 2013 down from 55,000 deaths in 1990. Since 2000, on the record mortalities caused by silicosis are more than the total fatal cases caused by safety accidents across the globe. TCCL periodically carries out the health screening of all workers through certified surgeon of Labour Department (Govt. of Sindh), and not a single case of silicosis has been diagnosed in our employees so far. We left our remarkable footprints in this area as a benchmark for others. Our aim is to implement practicable controls on all foreseeable risks to health and safety of employees and general public. For this purpose we invested a huge capital on environmental impact control equipment and practices like dust cyclones, bag houses, damping down dust suppression, electrostatic precipitators, personal protective equipment and speed limit controls in Company’s premises to overcome RSPM (respirable suspended particulate matter) and FRD (fugitive road dust). Customer
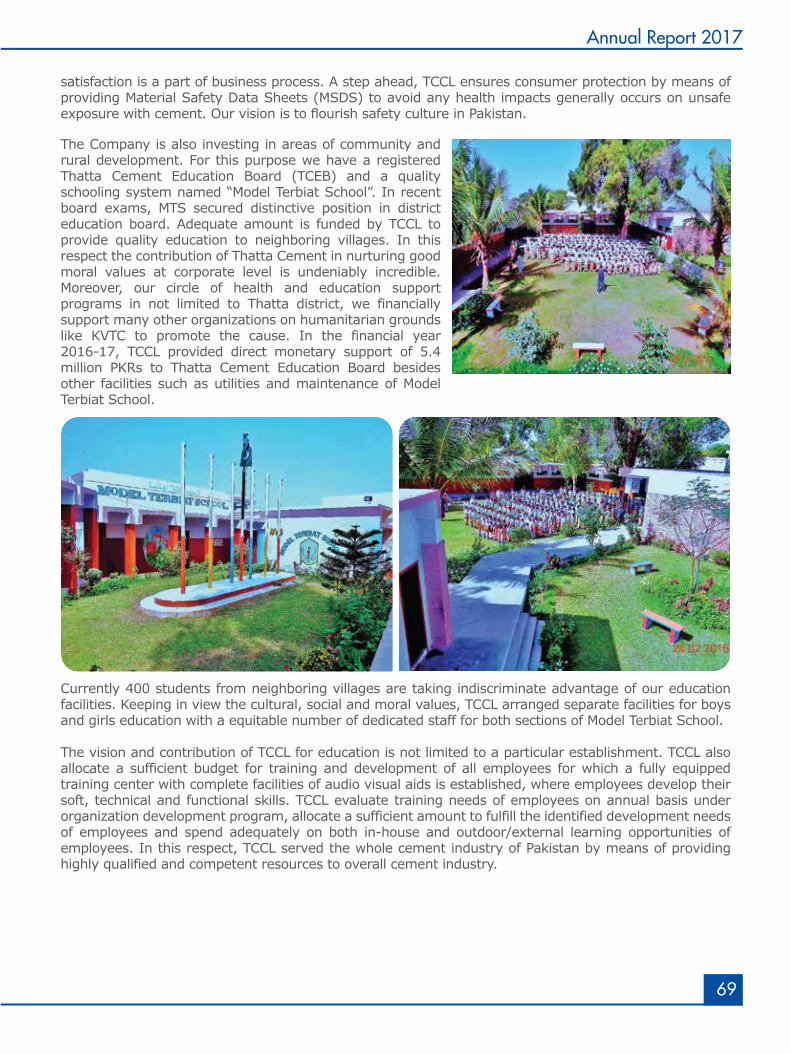
69
Annual Report 2017
Currently 400 students from neighboring villages are taking indiscriminate advantage of our education facilities. Keeping in view the cultural, social and moral values, TCCL arranged separate facilities for boys and girls education with a equitable number of dedicated staff for both sections of Model Terbiat School.
The vision and contribution of TCCL for education is not limited to a particular establishment. TCCL also allocate a sufficient budget for training and development of all employees for which a fully equipped training center with complete facilities of audio visual aids is established, where employees develop their soft, technical and functional skills. TCCL evaluate training needs of employees on annual basis under organization development program, allocate a sufficient amount to fulfill the identified development needs of employees and spend adequately on both in-house and outdoor/external learning opportunities of employees. In this respect, TCCL served the whole cement industry of Pakistan by means of providing highly qualified and competent resources to overall cement industry.
satisfaction is a part of business process. A step ahead, TCCL ensures consumer protection by means of providing Material Safety Data Sheets (MSDS) to avoid any health impacts generally occurs on unsafe exposure with cement. Our vision is to flourish safety culture in Pakistan.
The Company is also investing in areas of community and rural development. For this purpose we have a registered Thatta Cement Education Board (TCEB) and a quality schooling system named “Model Terbiat School”. In recent board exams, MTS secured distinctive position in district education board. Adequate amount is funded by TCCL to provide quality education to neighboring villages. In this respect the contribution of Thatta Cement in nurturing good moral values at corporate level is undeniably incredible. Moreover, our circle of health and education support programs in not limited to Thatta district, we financially support many other organizations on humanitarian grounds like KVTC to promote the cause. In the financial year 2016-17, TCCL provided direct monetary support of 5.4 million PKRs to Thatta Cement Education Board besides other facilities such as utilities and maintenance of Model Terbiat School.
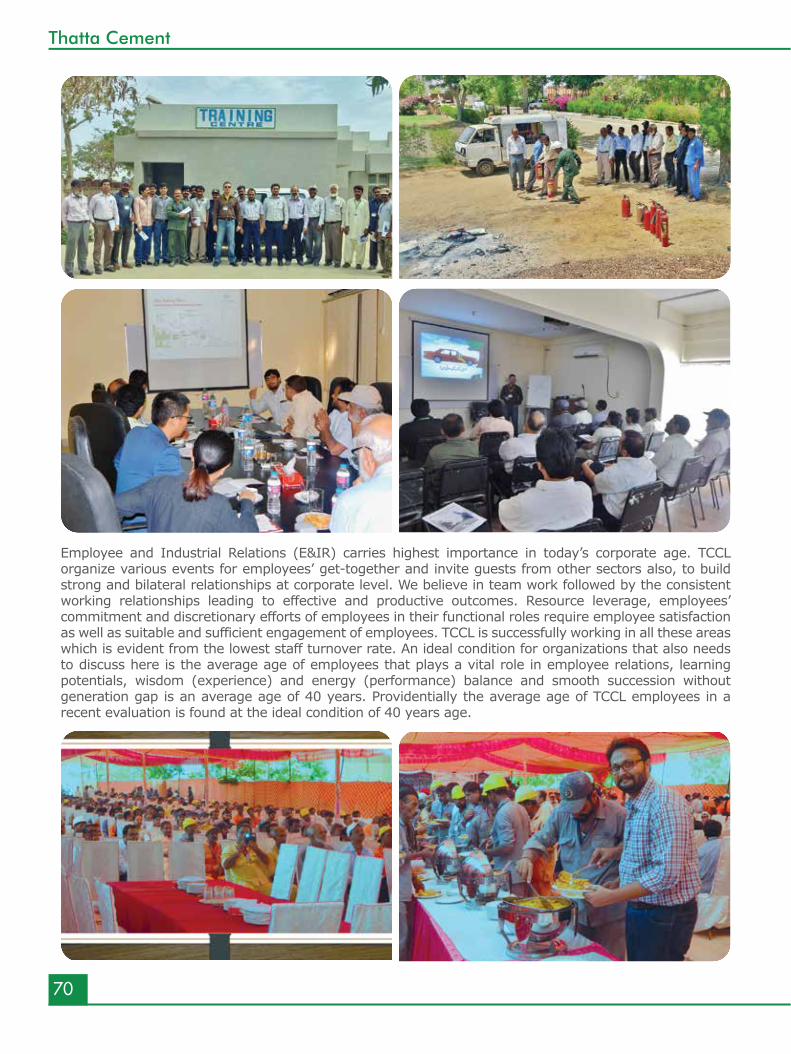
70
Thatta Cement
Employee and Industrial Relations (E&IR) carries highest importance in today’s corporate age. TCCL organize various events for employees’ get-together and invite guests from other sectors also, to build strong and bilateral relationships at corporate level. We believe in team work followed by the consistent working relationships leading to effective and productive outcomes. Resource leverage, employees’ commitment and discretionary efforts of employees in their functional roles require employee satisfaction as well as suitable and sufficient engagement of employees. TCCL is successfully working in all these areas which is evident from the lowest staff turnover rate. An ideal condition for organizations that also needs to discuss here is the average age of employees that plays a vital role in employee relations, learning potentials, wisdom (experience) and energy (performance) balance and smooth succession without generation gap is an average age of 40 years. Providentially the average age of TCCL employees in a recent evaluation is found at the ideal condition of 40 years age.
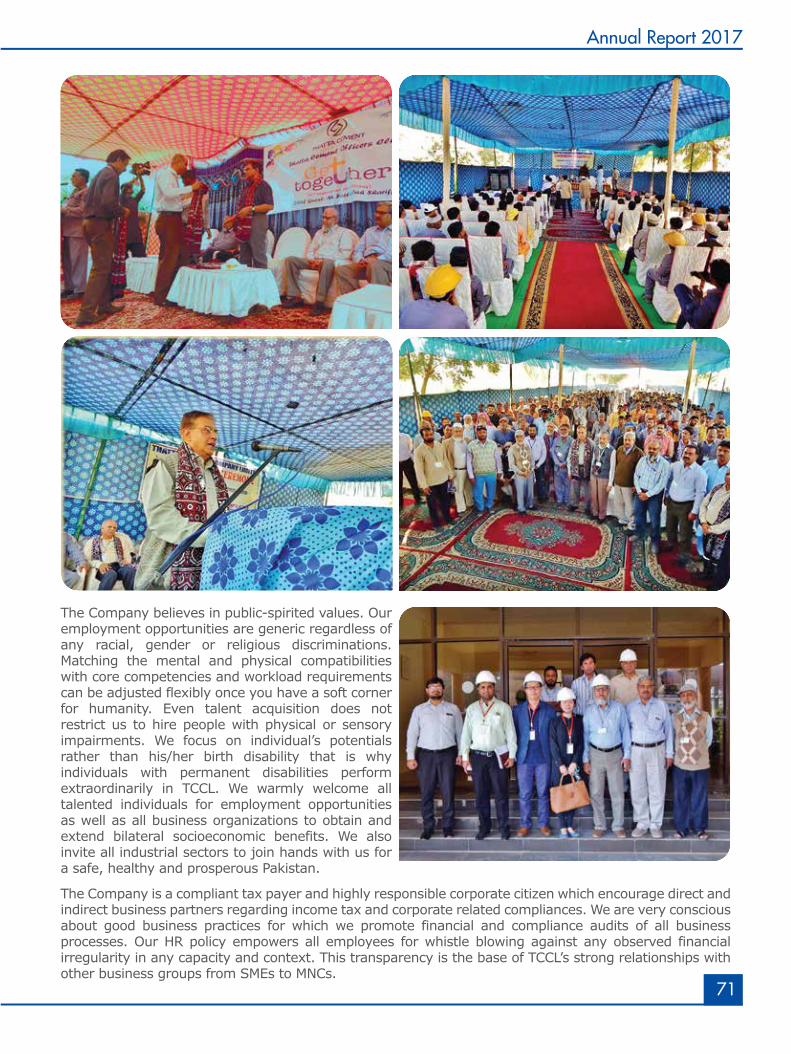
71
Annual Report 2017
The Company believes in public-spirited values. Our employment opportunities are generic regardless of any racial, gender or religious discriminations. Matching the mental and physical compatibilities with core competencies and workload requirements can be adjusted flexibly once you have a soft corner for humanity. Even talent acquisition does not restrict us to hire people with physical or sensory impairments. We focus on individual’s potentials rather than his/her birth disability that is why individuals with permanent disabilities perform extraordinarily in TCCL. We warmly welcome all talented individuals for employment opportunities as well as all business organizations to obtain and extend bilateral socioeconomic benefits. We also invite all industrial sectors to join hands with us for a safe, healthy and prosperous Pakistan.
The Company is a compliant tax payer and highly responsible corporate citizen which encourage direct and indirect business partners regarding income tax and corporate related compliances. We are very conscious about good business practices for which we promote financial and compliance audits of all business processes. Our HR policy empowers all employees for whistle blowing against any observed financial irregularity in any capacity and context. This transparency is the base of TCCL’s strong relationships with other business groups from SMEs to MNCs.
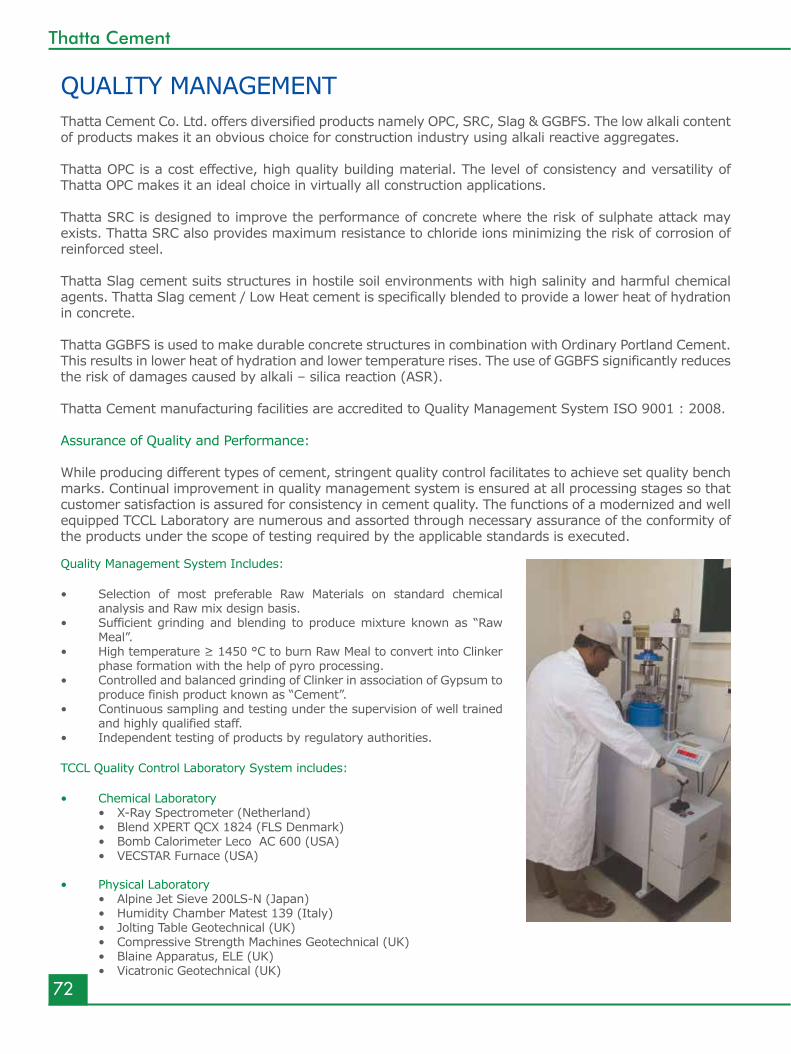
Quality Management System Includes:
• Selection of most preferable Raw Materials on standard chemical analysis and Raw mix design basis.
• Sufficient grinding and blending to produce mixture known as “Raw Meal”.
• High temperature ≥ 1450 °C to burn Raw Meal to convert into Clinker phase formation with the help of pyro processing.
• Controlled and balanced grinding of Clinker in association of Gypsum to produce finish product known as “Cement”.
• Continuous sampling and testing under the supervision of well trained and highly qualified staff.
• Independent testing of products by regulatory authorities.
TCCL Quality Control Laboratory System includes:
• Chemical Laboratory• X-Ray Spectrometer (Netherland)• Blend XPERT QCX 1824 (FLS Denmark)• Bomb Calorimeter Leco AC 600 (USA)• VECSTAR Furnace (USA)
• Physical Laboratory• Alpine Jet Sieve 200LS-N (Japan)• Humidity Chamber Matest 139 (Italy)• Jolting Table Geotechnical (UK)• Compressive Strength Machines Geotechnical (UK)• Blaine Apparatus, ELE (UK)• Vicatronic Geotechnical (UK)
72
Thatta Cement
QUALITY MANAGEMENTThatta Cement Co. Ltd. offers diversified products namely OPC, SRC, Slag & GGBFS. The low alkali content of products makes it an obvious choice for construction industry using alkali reactive aggregates.
Thatta OPC is a cost effective, high quality building material. The level of consistency and versatility of Thatta OPC makes it an ideal choice in virtually all construction applications.
Thatta SRC is designed to improve the performance of concrete where the risk of sulphate attack may exists. Thatta SRC also provides maximum resistance to chloride ions minimizing the risk of corrosion of reinforced steel.
Thatta Slag cement suits structures in hostile soil environments with high salinity and harmful chemical agents. Thatta Slag cement / Low Heat cement is specifically blended to provide a lower heat of hydration in concrete.
Thatta GGBFS is used to make durable concrete structures in combination with Ordinary Portland Cement. This results in lower heat of hydration and lower temperature rises. The use of GGBFS significantly reduces the risk of damages caused by alkali – silica reaction (ASR).
Thatta Cement manufacturing facilities are accredited to Quality Management System ISO 9001 : 2008.
Assurance of Quality and Performance:
While producing different types of cement, stringent quality control facilitates to achieve set quality bench marks. Continual improvement in quality management system is ensured at all processing stages so that customer satisfaction is assured for consistency in cement quality. The functions of a modernized and well equipped TCCL Laboratory are numerous and assorted through necessary assurance of the conformity of the products under the scope of testing required by the applicable standards is executed.
73
Annual Report 2017
ADDITIONAL INFORMATIONA. Analysis of Capital Structure, liquidity, cash flows and financing arrangements
Capital Structure:
Accumulated profit of the Company increased by 47.1% in 2017 on account of higher profit retention thereby increasing equity by 17.6% to Rs 2.44 billion. Total equity of the Company comprises of share capital amounting to Rs. 997.18 million representing 99.72 million ordinary shares of Rs. 10 each, share premium of Rs. 99.72 million and retained profits of Rs. 1.34 billion.
Debt to equity ratio of the Company continues to improve due to the fact that the Company not only paid the quarterly installments of long term loan on time but also prepaid an amount of Rs. 475 million during the year ended June 30, 2017. Debt/equity ratio has improved from 38:62 in the year 2016 to 18:82 in 2017. The Company’s future projections indicate adequacy of capital structure for the foreseeable future.
Liquidity Position: Effective management of treasury operation and higher collection from customers has improved
the liquidity position of the Company. The Company utilized excess liquidity generated during the year in prepayment of its Long Term Debt.
The current ratio of the Company stood at 1.81:1 despite substantial increase in coal purchase in anticipation of a price hike. The stock of coal & other fuels have increased from Rs.56.54 million to Rs. 250 million in the year 2017.
Cash Flows:
The Company has historically had very nominal cash balances, however due to increase in profitability through increase in sales, the Company has generated sufficient cash flows to fulfill its working capital needs. Cash flows from operations shows a steady growth pattern from the year 2014 onwards.
Financing Arrangements:
The Company relied principally on internally generated funds to fulfill its working capital needs and external financing is secondary to internally generated funds. Long Term Borrowing of the Company has substantially reduced from Rs. 1,258.6 million in the year 2016 to Rs. 551.6 million as on June 30, 2017. The Company holds a sizeable unutilized capacity available to meet any future funding requirements.
B. Strategy to overcome liquidity problem and the Company’s plan to manage its repayment of debt
The Company closely monitors its liquidity position to ensure availability of sufficient funds to meet its operational requirement and to safe guard the Company against cash flow risk. The Company follows effective cash flow forecasting alongwith management of maturity profile of assets and liabilities which apprise the Company well in advance for any funding requirement or surplus funds that need to be invested.
Working capital requirements of the Company are primarily managed through internal cash generation with external financing acting as secondary means of funding. The Company has sufficient credit lines available to fulfill its funding requirement.
74
Thatta Cement
C. Significant changes in financial position, liquidity and performance compared with those of the previous Period;
Net worth of the Company as at June 30, 2017 stood at Rs. 2.44 billion translating into a breakup value of Rs. 24.48 per share, with a growth of 17.6% due to appreciation in profit for the year thereby increasing accumulated profit from Rs. 913.5 million for 2016 to Rs. 1,343.7 million in 2017.
Long term debt & its current portion witnessed a decrease from Rs. 1,258.6 million to Rs. 551.6 million, which is mainly due to the repayment of loan including Prepayment of Rs. 475 million against long term loan acquired for BMR.
Trade payables have enhanced mainly due to accrual of expenses/employee benefits for the year
ended June 30, 2017.
Net cash flows from operating activities for the year stood at Rs. 449.277 million whereas the payment for Investing and Financing activities amounts to Rs. 756.894 million resulting in higher utilization of Short Term Running Finance Facility in the last quarter of the year.
Long term investment – Available for sale has decreased due to disposal of entire investment portfolio during the year.
Stores & Spares have substantially increased on account of increase in stock of coal. In view of increasing trend in international coal prices (July 2016 - June 2017 : US $ 61 to US$ 104), two month inventory of coal is being maintained to minimize the impact of said increase.
Stock-in-trade has increased mainly due to increase in clinker production by 34.03% from 382,582 tons to 512,789 tons whereas 138,597 tons of clinker was sold to manage inventory and to earn additional profit and hence increasing shareholders wealth.
Profit for the year has decreased considerably due to current tax of Rs. 259.6 million charged for the year ended June 30, 2017, whereas no current tax was charged in the corresponding period.
D. Analysis of the prospects of the entity including targets for financial and non-financial measures Thorough evaluation and effective implementation has been carried out during the year in order
to achieve Company’s set goals and targets. This is evident from the fact that the Company has achieved exceptional production, sales and revenue levels during the year ended June 30, 2017.
Taking into account the general economic and industry-specific outlook for the cement industry and the growth prospects for markets in which Thatta Cement operates, we expect a steady growth in revenue for 2018. The growth in revenue is primary due to increase in sales volume, it is assumed that price may remain constant or under pressure in the year 2018, provided demand & supply gap is not fully consumed.
The Company sets it financial indicators for revenue, costs, profitability, gearing and liquidity etc. The Company on an annual basis sets marketing, production and other targets in the form of a budget which is duly approved by the Board of Directors.
Operational health and safety generally plays a major role in the production processes and in addition, emissions in cement production especially. Therefore, TCCL give due consideration to Health, Safety & Environment while developing key performance measure. The followings are identified by the Company as key non-financial performance measure:
Risk & OpportunitiesRisk is a consequence of happenings that negatively impact the performance of a Company. Risks arises from events that occur inside and outside the organization. The consequence of an event can impact the quality, cost or operation of the Company, or combination of these events. Risk can arise from unplanned changes to the internal environment or changes in the external environment, such as the economy, costs of materials, labour market, customer preferences or actions by a competitor, a regulating body or a government agency.
Risk management refers to the practice of identifying potential risks in advance, analysing them and taking precautionary steps to reduce the risk. Risk Management forms an integral part of your Company’s operations. Following are the risks that are required to be timely identified and mitigated to the best possible extent.
a. Strategic risks
Strategic risks include risks created by the Company’s strategic objectives and business strategy decisions that could affect its long term positioning and performance. They are monitored at the highest level with active oversight by the Board of Directors.
b. Commercial Risks
These risks emanate from the commercial substance of an organization. Cut down in an entity’s market share, product price, regulation or a constitutional amendment posing threat to the organization’s profitability and commercial viability are a few examples of this risk that might affect your Company.
c. Operational Risk
These are risks that can affect the Company’s ability to execute its plans and objectives including operational and administrative procedures, such as workforce turnover, supply chain disruption, IT system shutdowns or control failures.
75
Annual Report 2017
• Health & Safety • Environmental protection • Energy conservation • Responsibility towards the society • Compliance with the regulatory framework • Improve corporate image • Relationship with customers and business partners • Employee satisfaction and wellbeing • Maintenance of product quality for fulfillment of customer needs • Transparency, accountability and good governance
E. Efforts made to mitigate the adverse impact of industrial effluents by adapting techniques, creating awareness and providing training etc to the surrounding communities.
TCCL is meeting international standards of environmental compliances in all areas including Solid Waste, Liquid Effluents & Fugitive and Gaseous Emissions which is evident from the fact that Thatta Cement once again qualified the Annual Environment Excellence Award (AEEA).
Thatta Cement Company Limited (TCCL) is distinctive in corporate sector, particularly in Cement Industry owing to the core values of TCCL purely based on humanitarian as well as socio economic grounds. TCCL invests in multiple areas pertaining to community development, education, health, welfare, environment, social causes and safety.
76
Thatta Cement
d. Credit Risk
Credit risk is the risk that one party to a financial instrument may fail to discharge its obligation and causes the other party to incur a financial loss.
To reduce the exposure to credit risk the Company has developed a policy of obtaining advance payment from its customers. Except for customers relating to the Government and certain credit worthy customers, the management strictly adheres to this policy. Cash is held only with banks with high quality credit worthiness.
e. Liquidity Risk
Liquidity risk is the risk that the Company will encounter difficulty in meeting its financial obligations as they fall due. Liquidity risk arises because of the possibility that the Company could be required to pay its liabilities earlier than expected or may face difficulty in raising funds to meet commitments associated with financial liabilities as they fall due.
The Company is exposed to liquidity risk in respect of non-current interest bearing liabilities, long term deposits, short term borrowings, trade and other payable and mark-up accrued.
The Company's approach to manage liquidity is to ensure, as far as possible, that it will always have sufficient liquidity to meet its liabilities when due, under both normal and stressed conditions, without incurring unacceptable losses or risking damage to the Company's reputation.
Management closely monitors the Company's liquidity and cash flow position. This includes maintenance of balance sheet liquidity ratios, debtors and creditors concentration both in terms of the overall funding mix and avoidance of undue reliance on large individual customers.
f. Interest Rate Risk
Interest / mark-up rate risk management arises from the possibility of changes in interest/mark-up rates which may affect the value of financial instruments. The Company has long term finance and short term borrowing at variable rates. Company is exposed to interest / mark-up rates risk on long term financing and short term borrowing which is covered by holding "Prepayment option" which can be exercised upon any adverse movement in the underlying interest rates.
g. Foreign Exchange Risk
Foreign exchange risk is the risk that the value of financial asset or a liability will fluctuate due to change in foreign exchange rates. It arises mainly where receivables and payables exist due to transactions entered into foreign currencies. Currently, the Company's foreign exchange risk exposure is restricted to the amounts payable to the foreign entities against outstanding letters of credit and bills payable.
Opportunities
The management always remains vigilant about the identification and capitalization of opportunities coming across in different areas including operational, commercial and financial aspects while dealing with suppliers, customers, bankers etc to keep the direction and pace of the Company in line with its stated mission and vision.
Financial Highlights
Performing at the Right TimeTime is the ultimate driver of everything that makes success possible. For us, it is the core foundation of making triumphs over the year and feel the pride in showcasing it to the world.
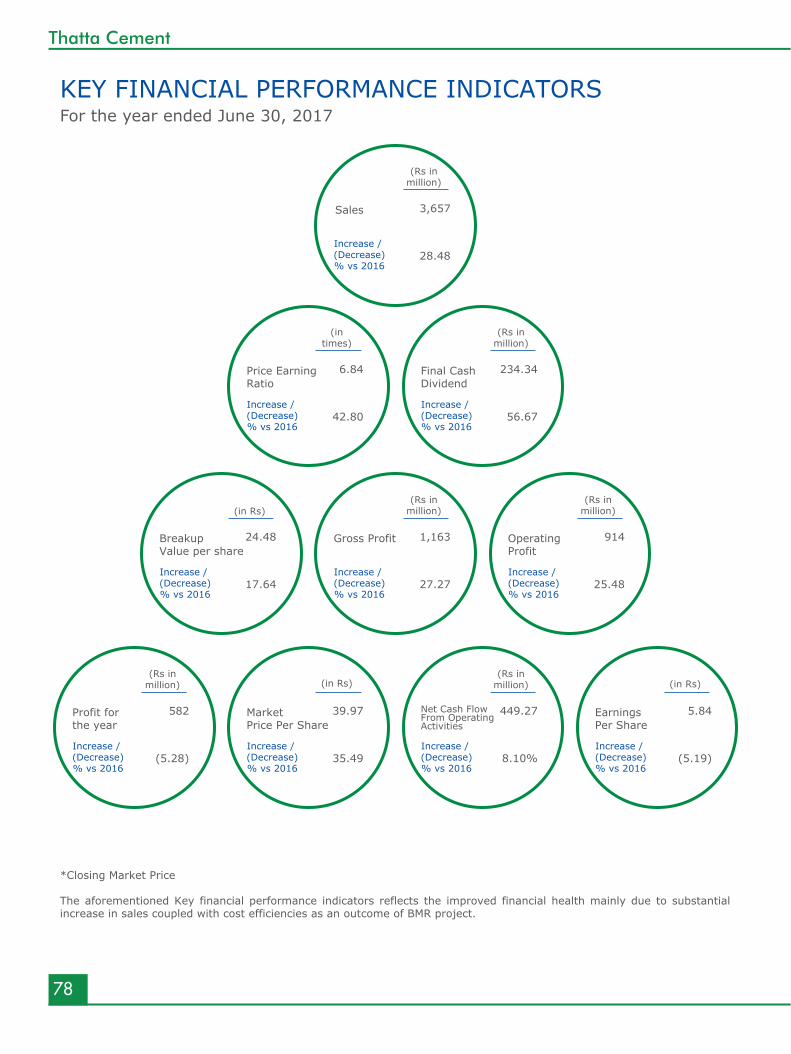
78
Thatta Cement
KEY FINANCIAL PERFORMANCE INDICATORSFor the year ended June 30, 2017
*Closing Market Price The aforementioned Key financial performance indicators reflects the improved financial health mainly due to substantial increase in sales coupled with cost efficiencies as an outcome of BMR project.
Sales 3,657
28.48
(Rs inmillion)
Increase / (Decrease)% vs 2016
Price EarningRatio
6.84
42.80
(intimes)
Increase / (Decrease)% vs 2016
Earnings Per Share
5.84
(5.19)
(in Rs)
Increase / (Decrease)% vs 2016
OperatingProfit
914
25.48
(Rs inmillion)
Increase / (Decrease)% vs 2016
Gross Profit 1,163
27.27
(Rs inmillion)
Increase / (Decrease)% vs 2016
Breakup Value per share
24.48
17.64
(in Rs)
Increase / (Decrease)% vs 2016
Profit forthe year
582
(5.28)
(Rs inmillion)
Increase / (Decrease)% vs 2016
Market Price Per Share
39.97
35.49
(in Rs)
Increase / (Decrease)% vs 2016
Net Cash FlowFrom OperatingActivities
449.27
8.10%
(Rs inmillion)
Increase / (Decrease)% vs 2016
Final CashDividend
234.34
56.67
(Rs inmillion)
Increase / (Decrease)% vs 2016
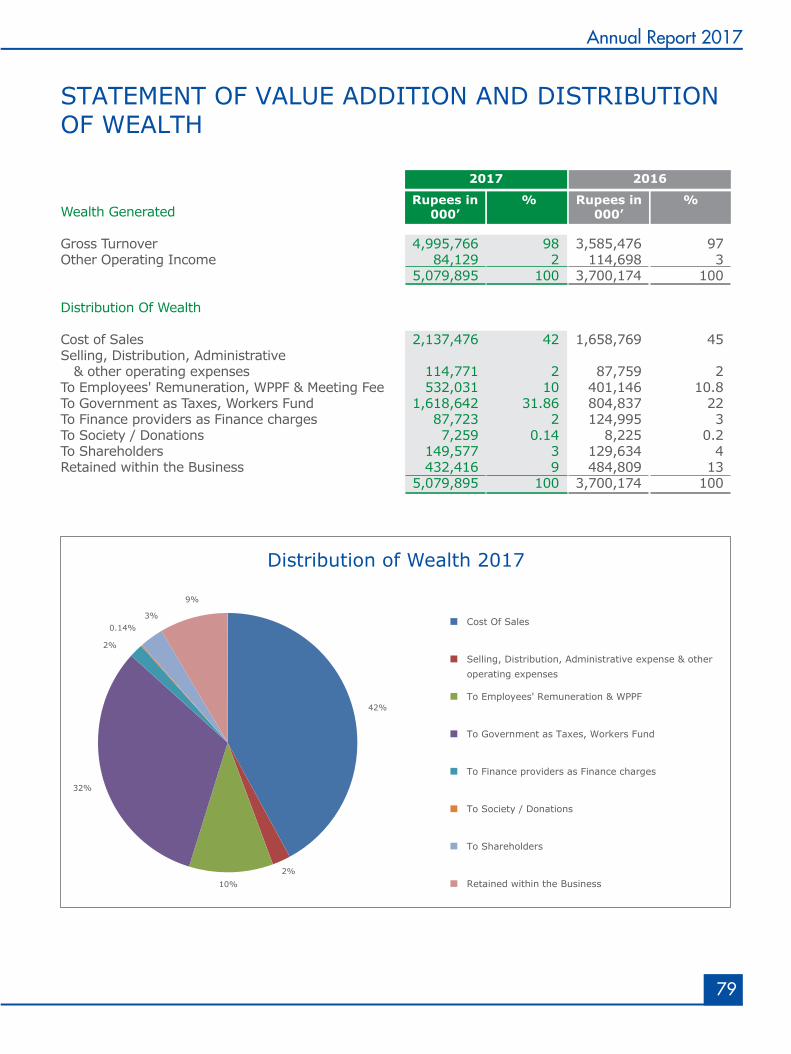
79
Annual Report 2017
STATEMENT OF VALUE ADDITION AND DISTRIBUTION OF WEALTH
%Rupees in000’
%Rupees in000’
2017 2016
Wealth Generated Gross Turnover 4,995,766 98 3,585,476 97 Other Operating Income 84,129 2 114,698 3 5,079,895 100 3,700,174 100 Distribution Of Wealth Cost of Sales 2,137,476 42 1,658,769 45 Selling, Distribution, Administrative & other operating expenses 114,771 2 87,759 2 To Employees' Remuneration, WPPF & Meeting Fee 532,031 10 401,146 10.8 To Government as Taxes, Workers Fund 1,618,642 31.86 804,837 22 To Finance providers as Finance charges 87,723 2 124,995 3 To Society / Donations 7,259 0.14 8,225 0.2 To Shareholders 149,577 3 129,634 4 Retained within the Business 432,416 9 484,809 13 5,079,895 100 3,700,174 100
Distribution of Wealth 2017
42%
2%10%
32%
2%
0.14%3%
9%
Cost Of Sales
Selling, Distribution, Administrative expense & otheroperating expenses
To Employees' Remuneration & WPPF
To Government as Taxes, Workers Fund
To Finance providers as Finance charges
To Society / Donations
To Shareholders
Retained within the Business
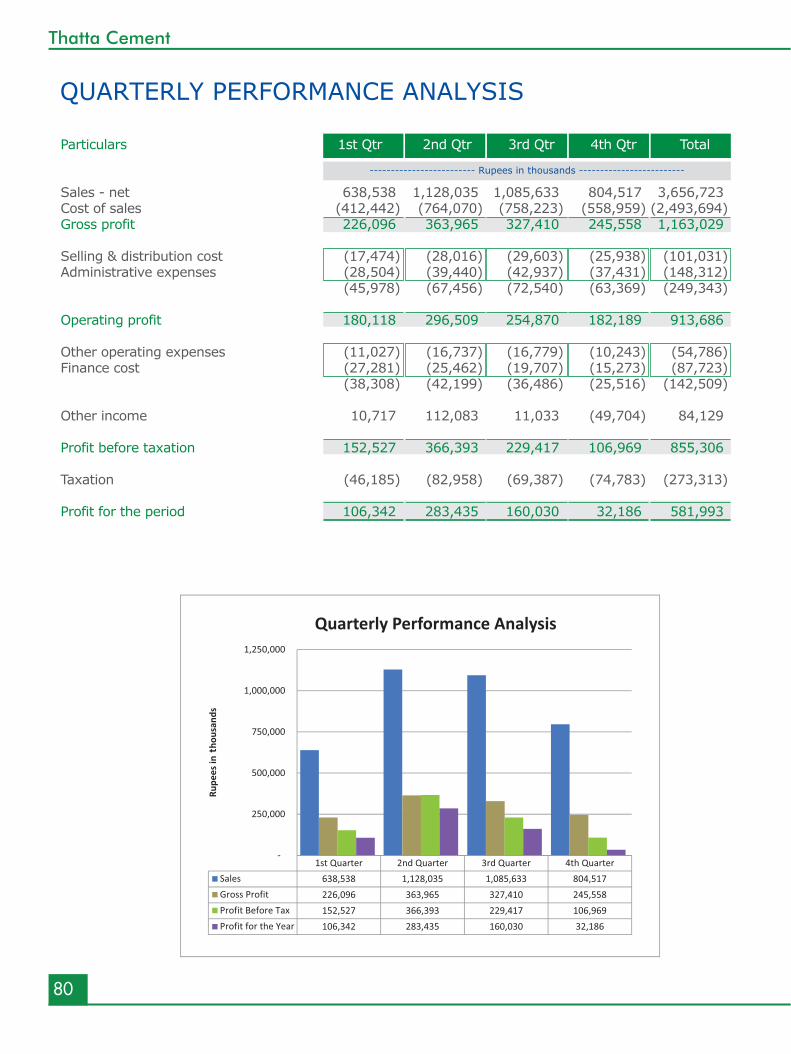
80
Thatta Cement
QUARTERLY PERFORMANCE ANALYSIS
------------------------- Rupees in thousands -------------------------
Particulars 1st Qtr 2nd Qtr 3rd Qtr 4th Qtr Total Sales - net 638,538 1,128,035 1,085,633 804,517 3,656,723 Cost of sales (412,442) (764,070) (758,223) (558,959) (2,493,694)Gross profit 226,096 363,965 327,410 245,558 1,163,029 Selling & distribution cost (17,474) (28,016) (29,603) (25,938) (101,031)Administrative expenses (28,504) (39,440) (42,937) (37,431) (148,312) (45,978) (67,456) (72,540) (63,369) (249,343) Operating profit 180,118 296,509 254,870 182,189 913,686 Other operating expenses (11,027) (16,737) (16,779) (10,243) (54,786)Finance cost (27,281) (25,462) (19,707) (15,273) (87,723) (38,308) (42,199) (36,486) (25,516) (142,509) Other income 10,717 112,083 11,033 (49,704) 84,129 Profit before taxation 152,527 366,393 229,417 106,969 855,306 Taxation (46,185) (82,958) (69,387) (74,783) (273,313) Profit for the period 106,342 283,435 160,030 32,186 581,993
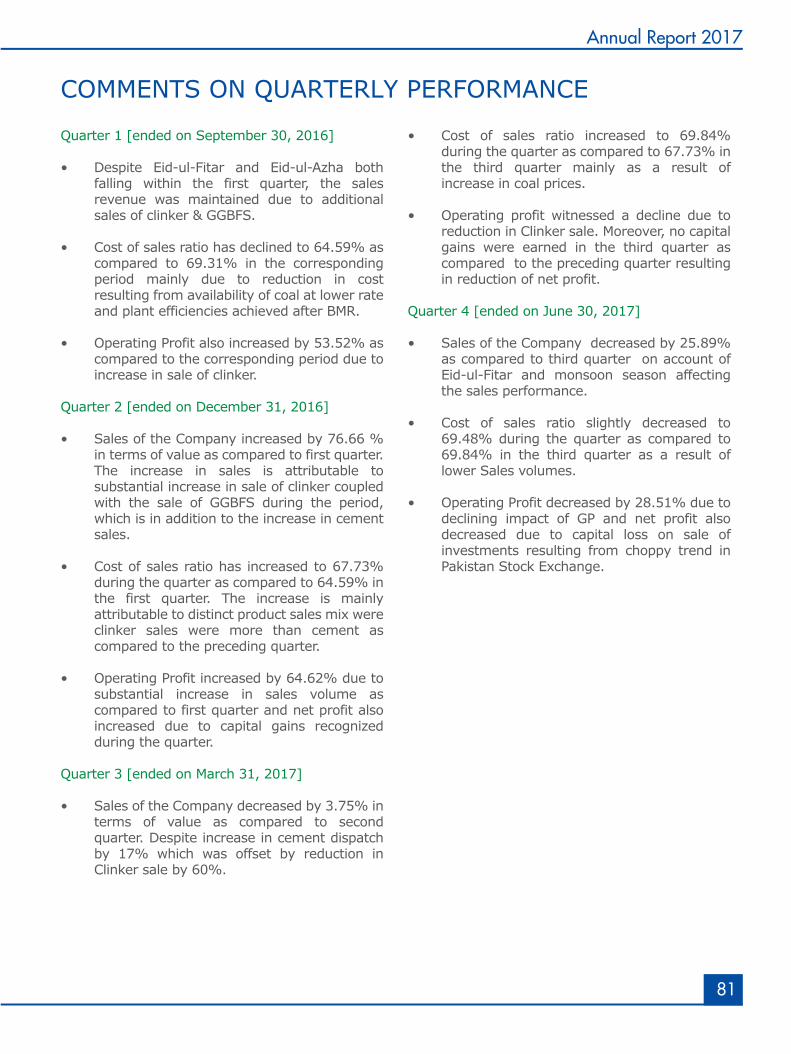
81
Annual Report 2017
Quarter 1 [ended on September 30, 2016]
• Despite Eid-ul-Fitar and Eid-ul-Azha both falling within the first quarter, the sales revenue was maintained due to additional sales of clinker & GGBFS.
• Cost of sales ratio has declined to 64.59% as
compared to 69.31% in the corresponding period mainly due to reduction in cost resulting from availability of coal at lower rate and plant efficiencies achieved after BMR.
• Operating Profit also increased by 53.52% as compared to the corresponding period due to increase in sale of clinker.
Quarter 2 [ended on December 31, 2016]
• Sales of the Company increased by 76.66 % in terms of value as compared to first quarter. The increase in sales is attributable to substantial increase in sale of clinker coupled with the sale of GGBFS during the period, which is in addition to the increase in cement sales.
• Cost of sales ratio has increased to 67.73% during the quarter as compared to 64.59% in the first quarter. The increase is mainly attributable to distinct product sales mix were clinker sales were more than cement as compared to the preceding quarter.
• Operating Profit increased by 64.62% due to substantial increase in sales volume as compared to first quarter and net profit also increased due to capital gains recognized during the quarter.
Quarter 3 [ended on March 31, 2017]
• Sales of the Company decreased by 3.75% in terms of value as compared to second quarter. Despite increase in cement dispatch by 17% which was offset by reduction in Clinker sale by 60%.
• Cost of sales ratio increased to 69.84% during the quarter as compared to 67.73% in the third quarter mainly as a result of increase in coal prices.
• Operating profit witnessed a decline due to reduction in Clinker sale. Moreover, no capital gains were earned in the third quarter as compared to the preceding quarter resulting in reduction of net profit.
Quarter 4 [ended on June 30, 2017]
• Sales of the Company decreased by 25.89% as compared to third quarter on account of Eid-ul-Fitar and monsoon season affecting the sales performance.
• Cost of sales ratio slightly decreased to 69.48% during the quarter as compared to 69.84% in the third quarter as a result of lower Sales volumes.
• Operating Profit decreased by 28.51% due to declining impact of GP and net profit also decreased due to capital loss on sale of investments resulting from choppy trend in Pakistan Stock Exchange.
COMMENTS ON QUARTERLY PERFORMANCE
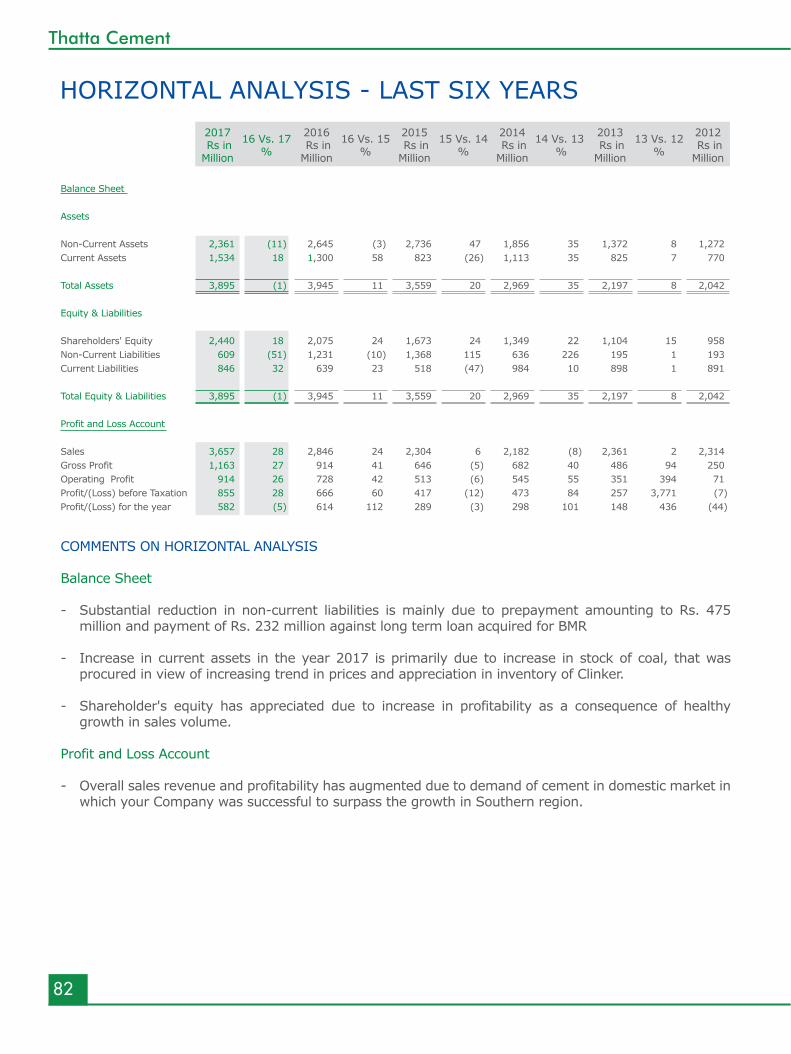
82
Thatta Cement
HORIZONTAL ANALYSIS - LAST SIX YEARS
COMMENTS ON HORIZONTAL ANALYSIS
Balance Sheet
- Substantial reduction in non-current liabilities is mainly due to prepayment amounting to Rs. 475 million and payment of Rs. 232 million against long term loan acquired for BMR
- Increase in current assets in the year 2017 is primarily due to increase in stock of coal, that was procured in view of increasing trend in prices and appreciation in inventory of Clinker.
- Shareholder's equity has appreciated due to increase in profitability as a consequence of healthy growth in sales volume.
Profit and Loss Account
- Overall sales revenue and profitability has augmented due to demand of cement in domestic market in
which your Company was successful to surpass the growth in Southern region.
Balance Sheet Assets Non-Current Assets 2,361 (11) 2,645 (3) 2,736 47 1,856 35 1,372 8 1,272 Current Assets 1,534 18 1,300 58 823 (26) 1,113 35 825 7 770
Total Assets 3,895 (1) 3,945 11 3,559 20 2,969 35 2,197 8 2,042 Equity & Liabilities Shareholders' Equity 2,440 18 2,075 24 1,673 24 1,349 22 1,104 15 958 Non-Current Liabilities 609 (51) 1,231 (10) 1,368 115 636 226 195 1 193 Current Liabilities 846 32 639 23 518 (47) 984 10 898 1 891 Total Equity & Liabilities 3,895 (1) 3,945 11 3,559 20 2,969 35 2,197 8 2,042 Profit and Loss Account Sales 3,657 28 2,846 24 2,304 6 2,182 (8) 2,361 2 2,314 Gross Profit 1,163 27 914 41 646 (5) 682 40 486 94 250 Operating Profit 914 26 728 42 513 (6) 545 55 351 394 71 Profit/(Loss) before Taxation 855 28 666 60 417 (12) 473 84 257 3,771 (7)Profit/(Loss) for the year 582 (5) 614 112 289 (3) 298 101 148 436 (44)
2017 Rs inMillion
16 Vs. 17%
2016 Rs inMillion
16 Vs. 15%
2015 Rs inMillion
15 Vs. 14%
2014 Rs inMillion
14 Vs. 13 %
2013 Rs inMillion
13 Vs. 12%
2012 Rs inMillion
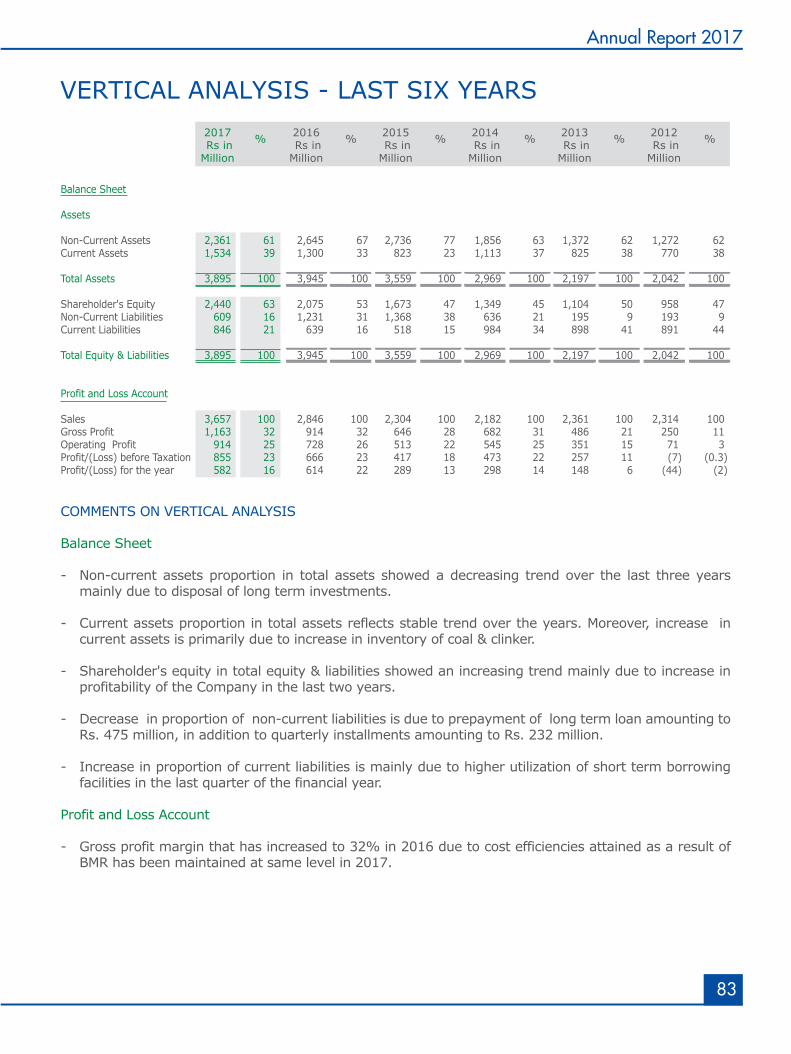
83
Annual Report 2017
VERTICAL ANALYSIS - LAST SIX YEARS2017 Rs inMillion
% 2016 Rs inMillion
% 2015 Rs inMillion
% 2014 Rs inMillion
% 2013 Rs inMillion
% %2012 Rs inMillion
COMMENTS ON VERTICAL ANALYSIS Balance Sheet - Non-current assets proportion in total assets showed a decreasing trend over the last three years
mainly due to disposal of long term investments.
- Current assets proportion in total assets reflects stable trend over the years. Moreover, increase in current assets is primarily due to increase in inventory of coal & clinker.
- Shareholder's equity in total equity & liabilities showed an increasing trend mainly due to increase in
profitability of the Company in the last two years.
- Decrease in proportion of non-current liabilities is due to prepayment of long term loan amounting to Rs. 475 million, in addition to quarterly installments amounting to Rs. 232 million.
- Increase in proportion of current liabilities is mainly due to higher utilization of short term borrowing
facilities in the last quarter of the financial year.
Profit and Loss Account
- Gross profit margin that has increased to 32% in 2016 due to cost efficiencies attained as a result of BMR has been maintained at same level in 2017.
Balance Sheet Assets
Non-Current Assets 2,361 61 2,645 67 2,736 77 1,856 63 1,372 62 1,272 62 Current Assets 1,534 39 1,300 33 823 23 1,113 37 825 38 770 38
Total Assets 3,895 100 3,945 100 3,559 100 2,969 100 2,197 100 2,042 100 Shareholder's Equity 2,440 63 2,075 53 1,673 47 1,349 45 1,104 50 958 47 Non-Current Liabilities 609 16 1,231 31 1,368 38 636 21 195 9 193 9 Current Liabilities 846 21 639 16 518 15 984 34 898 41 891 44
Total Equity & Liabilities 3,895 100 3,945 100 3,559 100 2,969 100 2,197 100 2,042 100 Profit and Loss Account Sales 3,657 100 2,846 100 2,304 100 2,182 100 2,361 100 2,314 100 Gross Profit 1,163 32 914 32 646 28 682 31 486 21 250 11 Operating Profit 914 25 728 26 513 22 545 25 351 15 71 3 Profit/(Loss) before Taxation 855 23 666 23 417 18 473 22 257 11 (7) (0.3)Profit/(Loss) for the year 582 16 614 22 289 13 298 14 148 6 (44) (2)
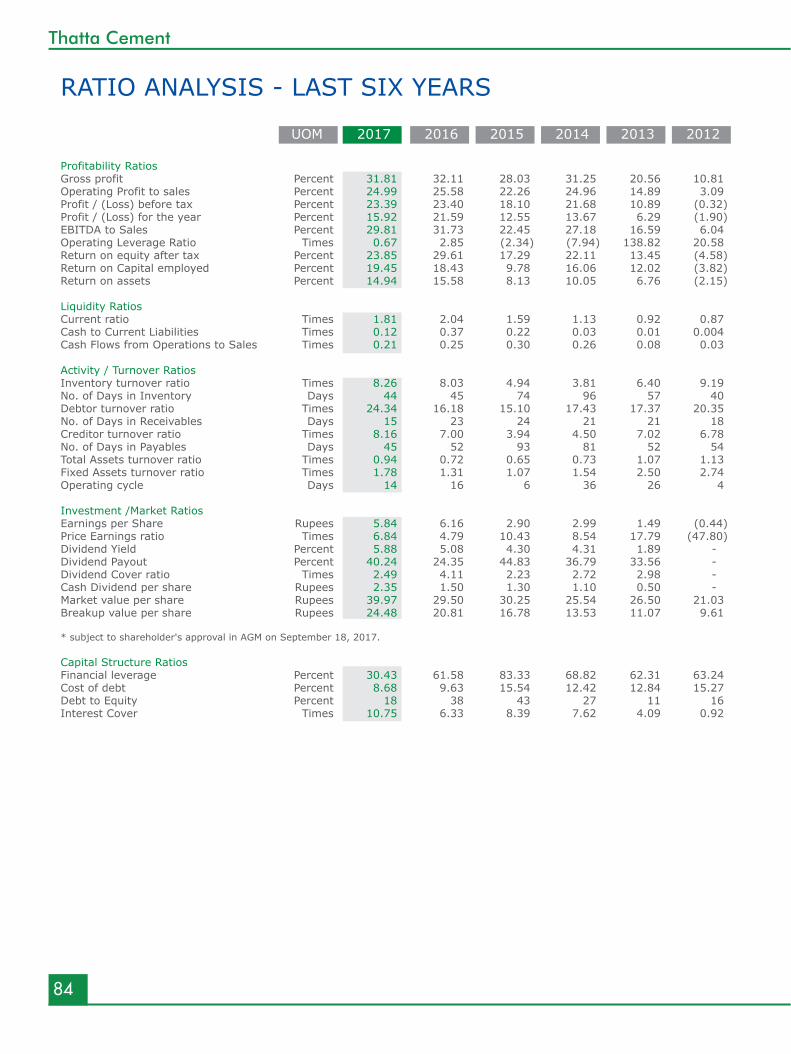
84
Thatta Cement
RATIO ANALYSIS - LAST SIX YEARS
2017UOM 2016 2015 2014 2013 2012
Profitability Ratios Gross profit Percent 31.81 32.11 28.03 31.25 20.56 10.81 Operating Profit to sales Percent 24.99 25.58 22.26 24.96 14.89 3.09 Profit / (Loss) before tax Percent 23.39 23.40 18.10 21.68 10.89 (0.32)Profit / (Loss) for the year Percent 15.92 21.59 12.55 13.67 6.29 (1.90)EBITDA to Sales Percent 29.81 31.73 22.45 27.18 16.59 6.04 Operating Leverage Ratio Times 0.67 2.85 (2.34) (7.94) 138.82 20.58 Return on equity after tax Percent 23.85 29.61 17.29 22.11 13.45 (4.58)Return on Capital employed Percent 19.45 18.43 9.78 16.06 12.02 (3.82)Return on assets Percent 14.94 15.58 8.13 10.05 6.76 (2.15) Liquidity Ratios Current ratio Times 1.81 2.04 1.59 1.13 0.92 0.87 Cash to Current Liabilities Times 0.12 0.37 0.22 0.03 0.01 0.004 Cash Flows from Operations to Sales Times 0.21 0.25 0.30 0.26 0.08 0.03 Activity / Turnover Ratios Inventory turnover ratio Times 8.26 8.03 4.94 3.81 6.40 9.19 No. of Days in Inventory Days 44 45 74 96 57 40 Debtor turnover ratio Times 24.34 16.18 15.10 17.43 17.37 20.35 No. of Days in Receivables Days 15 23 24 21 21 18 Creditor turnover ratio Times 8.16 7.00 3.94 4.50 7.02 6.78 No. of Days in Payables Days 45 52 93 81 52 54 Total Assets turnover ratio Times 0.94 0.72 0.65 0.73 1.07 1.13 Fixed Assets turnover ratio Times 1.78 1.31 1.07 1.54 2.50 2.74 Operating cycle Days 14 16 6 36 26 4 Investment /Market Ratios Earnings per Share Rupees 5.84 6.16 2.90 2.99 1.49 (0.44)Price Earnings ratio Times 6.84 4.79 10.43 8.54 17.79 (47.80)Dividend Yield Percent 5.88 5.08 4.30 4.31 1.89 - Dividend Payout Percent 40.24 24.35 44.83 36.79 33.56 - Dividend Cover ratio Times 2.49 4.11 2.23 2.72 2.98 - Cash Dividend per share Rupees 2.35 1.50 1.30 1.10 0.50 - Market value per share Rupees 39.97 29.50 30.25 25.54 26.50 21.03 Breakup value per share Rupees 24.48 20.81 16.78 13.53 11.07 9.61 * subject to shareholder's approval in AGM on September 18, 2017. Capital Structure Ratios Financial leverage Percent 30.43 61.58 83.33 68.82 62.31 63.24 Cost of debt Percent 8.68 9.63 15.54 12.42 12.84 15.27 Debt to Equity Percent 18 38 43 27 11 16 Interest Cover Times 10.75 6.33 8.39 7.62 4.09 0.92
85
Annual Report 2017
COMMENTS ON RATIOSPROFITABILITY RATIOS:
The Gross Profit margins remains steady as compared to the previous year due to cost efficiency achieved through implementation of BMR. Return on capital employed was improved mainly due to reduction in long term borrowings. Profitability ratios of the Company have moved slightly in downward trajectory due to choppy trend in PSX resulting in capital loss on the sale of Long term investment.
LIQUIDITY RATIOS:
The Company had maintained strong liquidity position resulting from efficient working capital management. Cash flows from operations have improved steadily from the year 2014 onwards. Moreover, the excess liquidity generated was utilized in making pre-payment against long term financing. ACTIVITY /TURNOVER RATIOS:
The turnover ratios of the Company showed study improvement during the year. Debtor turnover days have improved considerably due to reduction in average debtors, whereas creditor turnover days also improved due effective management and timely payments to the creditors.
INVESTMENT/MARKET RATIOS:
There is a slight reduction in current year’s earnings per share due to capital loss resulting from sale of long term investments and also due to substantial increase in taxation charge during the year. Despite nominal reduction in earnings per share the price earnings ratio has improved as compared to the previous year, which clearly depicts investors’ confidence on the prosperous future of the Company.
CAPITAL STRUCTURE RATIOS:
One of the primary objectives of the Company is to utilize financing resources at its optimum level. The financial leverage was declined substantially during the year due to pre-payment made against long term financing. Debt to equity ratio and Interest cover ratio also shown drastic improvement due to reduction in long term financing.
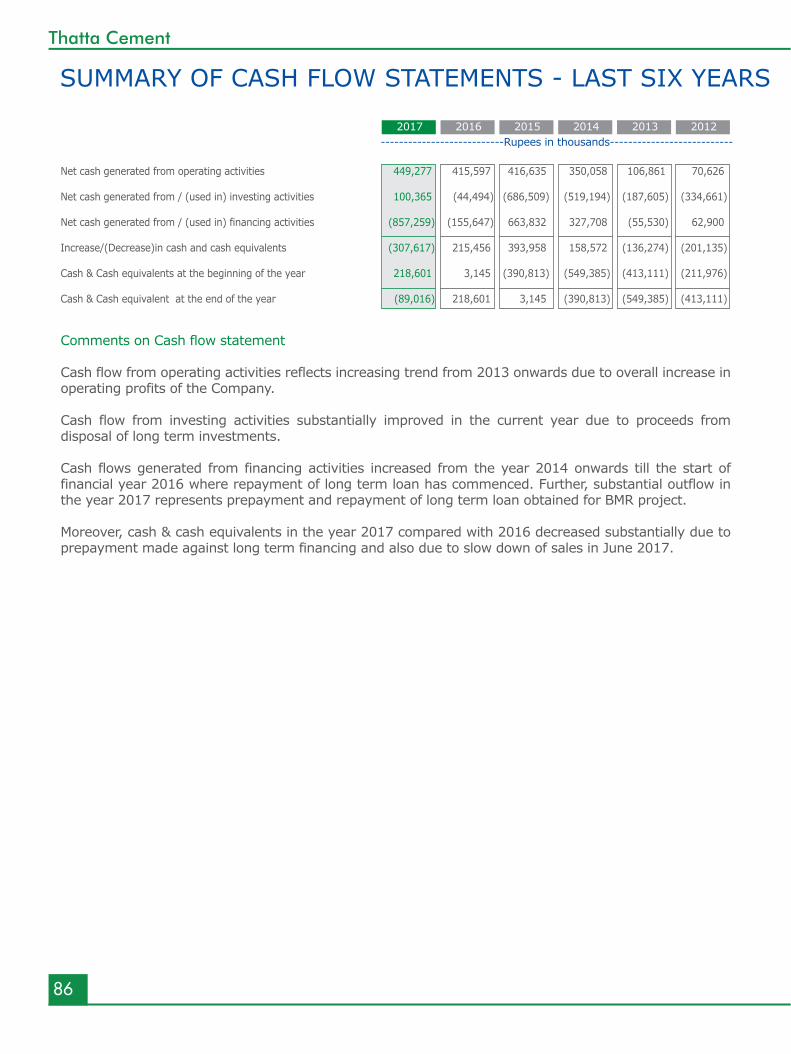
86
Thatta Cement
Comments on Cash flow statement Cash flow from operating activities reflects increasing trend from 2013 onwards due to overall increase in operating profits of the Company. Cash flow from investing activities substantially improved in the current year due to proceeds from disposal of long term investments. Cash flows generated from financing activities increased from the year 2014 onwards till the start of financial year 2016 where repayment of long term loan has commenced. Further, substantial outflow in the year 2017 represents prepayment and repayment of long term loan obtained for BMR project. Moreover, cash & cash equivalents in the year 2017 compared with 2016 decreased substantially due to prepayment made against long term financing and also due to slow down of sales in June 2017.
Net cash generated from operating activities 449,277 415,597 416,635 350,058 106,861 70,626 Net cash generated from / (used in) investing activities 100,365 (44,494) (686,509) (519,194) (187,605) (334,661) Net cash generated from / (used in) financing activities (857,259) (155,647) 663,832 327,708 (55,530) 62,900 Increase/(Decrease)in cash and cash equivalents (307,617) 215,456 393,958 158,572 (136,274) (201,135) Cash & Cash equivalents at the beginning of the year 218,601 3,145 (390,813) (549,385) (413,111) (211,976) Cash & Cash equivalent at the end of the year (89,016) 218,601 3,145 (390,813) (549,385) (413,111)
2017 2016 2015 2014 2013 2012---------------------------Rupees in thousands---------------------------
SUMMARY OF CASH FLOW STATEMENTS - LAST SIX YEARS
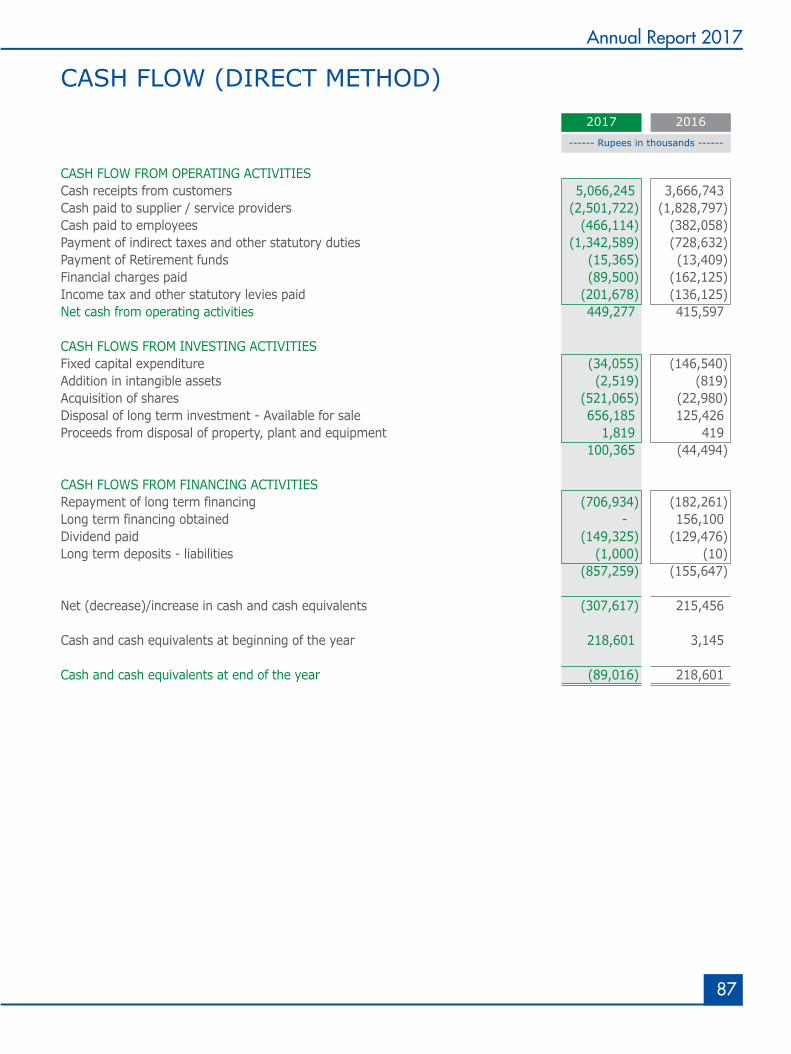
87
Annual Report 2017
CASH FLOW FROM OPERATING ACTIVITIESCash receipts from customers 5,066,245 3,666,743 Cash paid to supplier / service providers (2,501,722) (1,828,797)Cash paid to employees (466,114) (382,058)Payment of indirect taxes and other statutory duties (1,342,589) (728,632)Payment of Retirement funds (15,365) (13,409)Financial charges paid (89,500) (162,125)Income tax and other statutory levies paid (201,678) (136,125)Net cash from operating activities 449,277 415,597
CASH FLOWS FROM INVESTING ACTIVITIES Fixed capital expenditure (34,055) (146,540)Addition in intangible assets (2,519) (819)Acquisition of shares (521,065) (22,980)Disposal of long term investment - Available for sale 656,185 125,426 Proceeds from disposal of property, plant and equipment 1,819 419 100,365 (44,494) CASH FLOWS FROM FINANCING ACTIVITIES Repayment of long term financing (706,934) (182,261)Long term financing obtained - 156,100 Dividend paid (149,325) (129,476)Long term deposits - liabilities (1,000) (10) (857,259) (155,647) Net (decrease)/increase in cash and cash equivalents (307,617) 215,456 Cash and cash equivalents at beginning of the year 218,601 3,145 Cash and cash equivalents at end of the year (89,016) 218,601
------ Rupees in thousands ------
2017 2016
CASH FLOW (DIRECT METHOD)
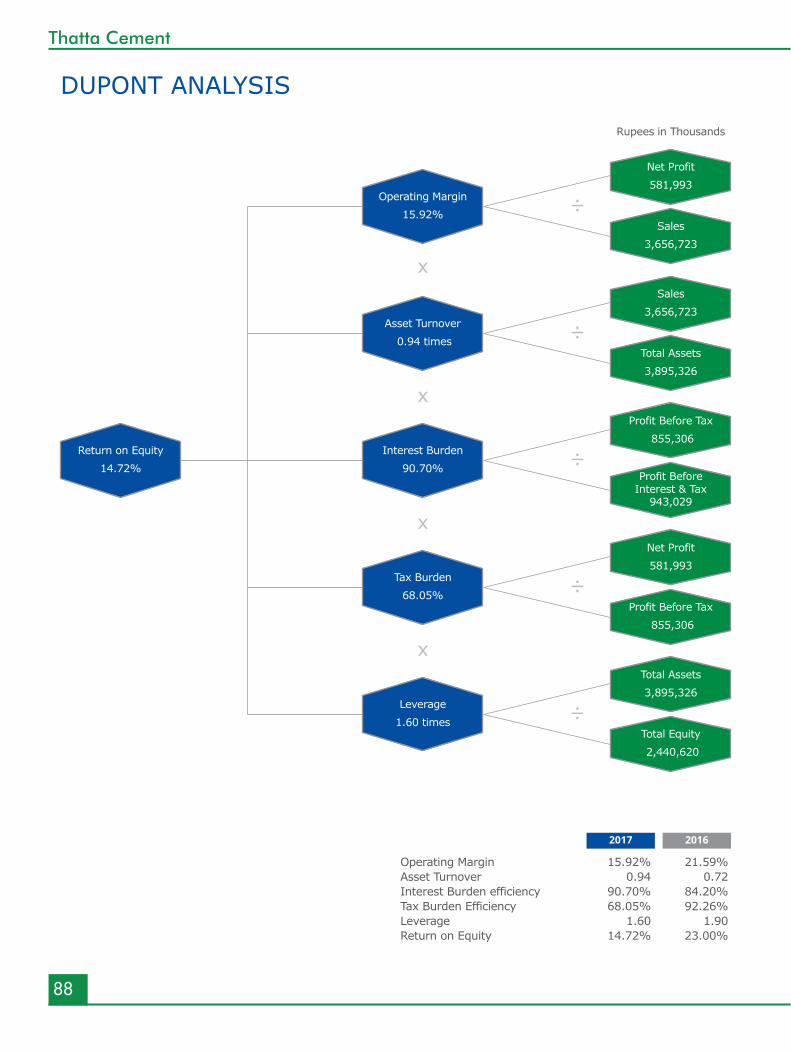
88
Thatta Cement
DUPONT ANALYSIS
Operating Margin
15.92%Sales
3,656,723
Sales
3,656,723
Total Assets
3,895,326
Total Assets
3,895,326
Total Equity
2,440,620
Profit Before Tax
855,306
Profit Before Tax
855,306
Profit BeforeInterest & Tax
943,029
Net Profit
581,993
Net Profit
581,993
Rupees in Thousands
Return on Equity
14.72%
Asset Turnover
0.94 times
Interest Burden
90.70%
Tax Burden
68.05%
Leverage
1.60 times
x
÷
÷
÷
÷
÷
x
x
x
Operating Margin 15.92% 21.59%Asset Turnover 0.94 0.72Interest Burden efficiency 90.70% 84.20%Tax Burden Efficiency 68.05% 92.26%Leverage 1.60 1.90Return on Equity 14.72% 23.00%
2017 2016
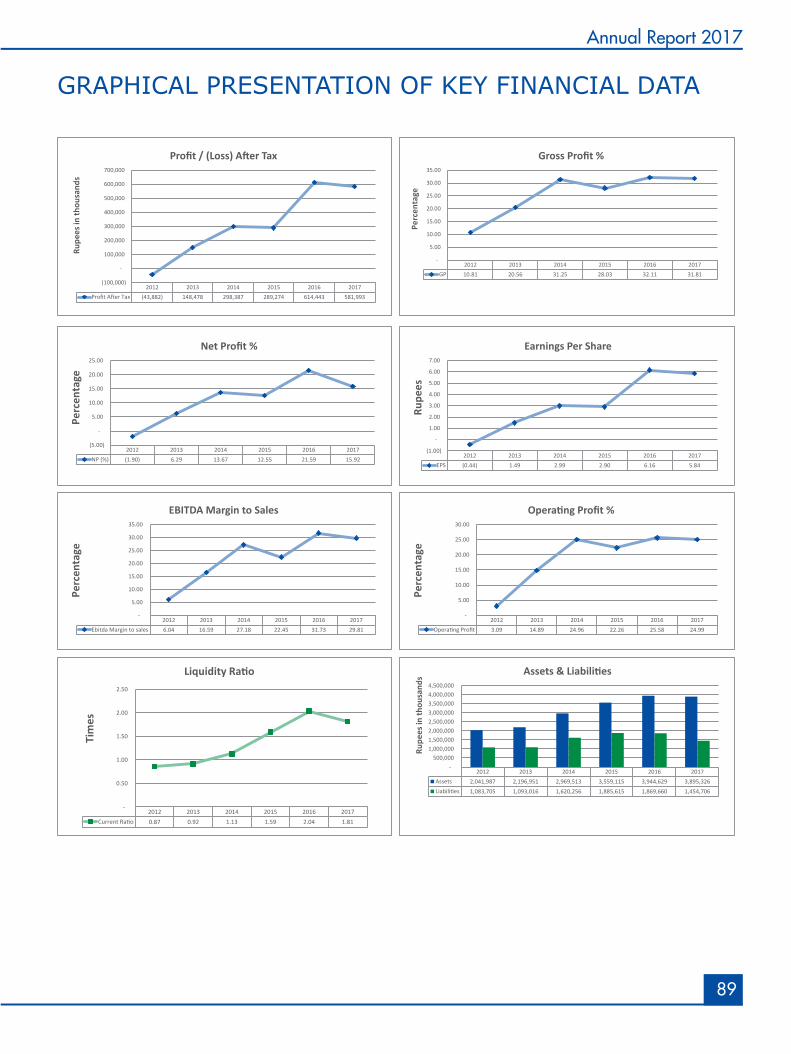
89
Annual Report 2017
GRAPHICAL PRESENTATION OF KEY FINANCIAL DATA
2012 2013 2014 2015 2016 2017Profit After Tax (43,882) 148,478 298,387 289,274 614,443 581,993
(100,000)
-
100,000
200,000
300,000
400,000
500,000
600,000
700,000
Rupe
es in
thou
sand
s
Profit / (Loss) After Tax
2012 2013 2014 2015 2016 2017GP 10.81 20.56 31.25 28.03 32.11 31.81
-
5.00
10.00
15.00
20.00
25.00
30.00
35.00
Perc
enta
ge
Gross Profit %
2012 2013 2014 2015 2016 2017NP (%) (1.90) 6.29 13.67 12.55 21.59 15.92
(5.00)
-
5.00
10.00
15.00
20.00
25.00
Perc
enta
ge
Net Profit %
2012 2013 2014 2015 2016 2017EPS (0.44) 1.49 2.99 2.90 6.16 5.84
(1.00)
-
1.00
2.00
3.00
4.00
5.00
6.00
7.00
Rupe
es
Earnings Per Share
2012 2013 2014 2015 2016 2017Ebitda Margin to sales 6.04 16.59 27.18 22.45 31.73 29.81
-
5.00
10.00
15.00
20.00
25.00
30.00
35.00
Perc
enta
ge
EBITDA Margin to Sales
2012 2013 2014 2015 2016 2017Operating Profit 3.09 14.89 24.96 22.26 25.58 24.99
-
5.00
10.00
15.00
20.00
25.00
30.00
Perc
enta
ge
Operating Profit %
2012 2013 2014 2015 2016 2017Current Ratio 0.87 0.92 1.13 1.59 2.04 1.81
-
0.50
1.00
1.50
2.00
2.50
Tim
es
Liquidity Ratio
2012 2013 2014 2015 2016 2017Assets 2,041,987 2,196,951 2,969,513 3,559,115 3,944,629 3,895,326Liabilities 1,083,705 1,093,016 1,620,256 1,885,615 1,869,660 1,454,706
- 500,000
1,000,000 1,500,000 2,000,000 2,500,000 3,000,000 3,500,000 4,000,000 4,500,000
Rupe
es in
thou
sand
s Assets & Liabilities
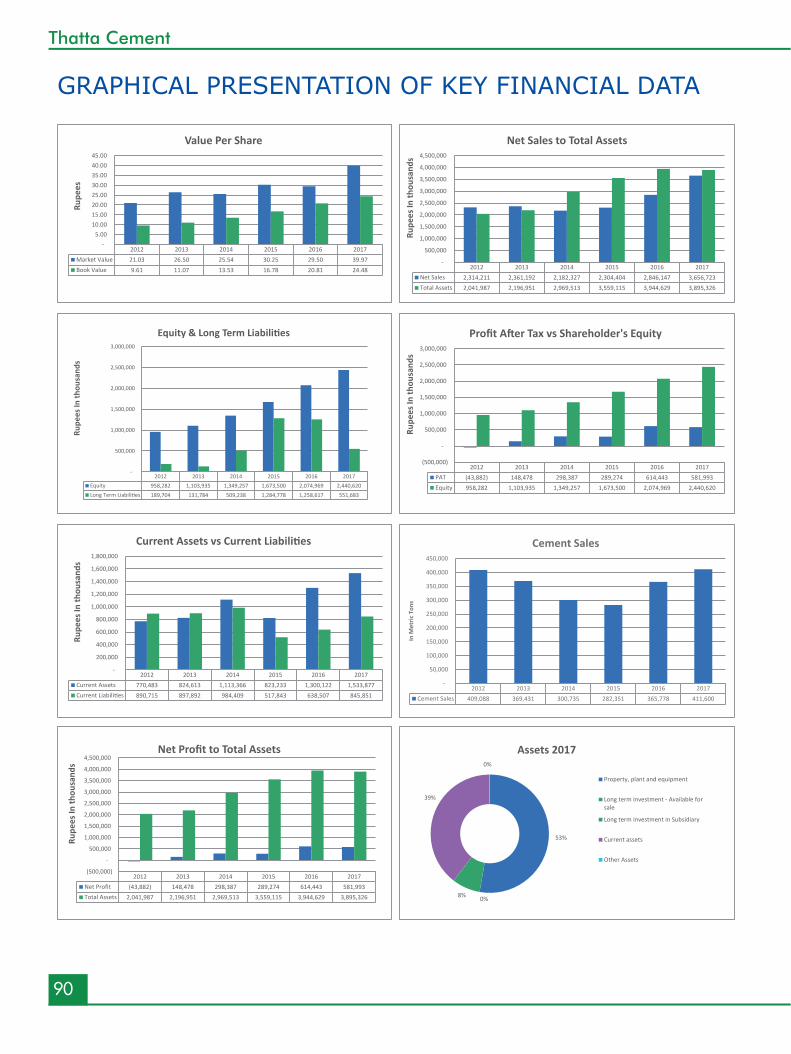
90
Thatta Cement
2012 2013 2014 2015 2016 2017Market Value 21.03 26.50 25.54 30.25 29.50 39.97Book Value 9.61 11.07 13.53 16.78 20.81 24.48
- 5.00
10.00 15.00 20.00 25.00 30.00 35.00 40.00 45.00
Rupe
es
Value Per Share
2012 2013 2014 2015 2016 2017Net Sales 2,314,211 2,361,192 2,182,327 2,304,404 2,846,147 3,656,723Total Assets 2,041,987 2,196,951 2,969,513 3,559,115 3,944,629 3,895,326
-
500,000
1,000,000
1,500,000
2,000,000
2,500,000
3,000,000
3,500,000
4,000,000
4,500,000
Rupe
es In
thou
sand
s
Net Sales to Total Assets
2012 2013 2014 2015 2016 2017Equity 958,282 1,103,935 1,349,257 1,673,500 2,074,969 2,440,620Long Term Liabilities 189,704 131,784 509,238 1,284,778 1,258,617 551,683
-
500,000
1,000,000
1,500,000
2,000,000
2,500,000
3,000,000
Rupe
es In
thou
sand
s
Equity & Long Term Liabilities
2012 2013 2014 2015 2016 2017PAT (43,882) 148,478 298,387 289,274 614,443 581,993Equity 958,282 1,103,935 1,349,257 1,673,500 2,074,969 2,440,620
(500,000)
-
500,000
1,000,000
1,500,000
2,000,000
2,500,000
3,000,000
Rupe
es In
thou
sand
s
Profit After Tax vs Shareholder's Equity
2012 2013 2014 2015 2016 2017Current Assets 770,483 824,613 1,113,366 823,233 1,300,122 1,533,877Current Liabilities 890,715 897,892 984,409 517,843 638,507 845,851
-
200,000
400,000
600,000
800,000
1,000,000
1,200,000
1,400,000
1,600,000
1,800,000
Rupe
es In
thou
sand
s
Current Assets vs Current Liabilities
2012 2013 2014 2015 2016 2017Net Profit (43,882) 148,478 298,387 289,274 614,443 581,993Total Assets 2,041,987 2,196,951 2,969,513 3,559,115 3,944,629 3,895,326
(500,000)
-
500,000
1,000,000
1,500,000
2,000,000
2,500,000
3,000,000
3,500,000
4,000,000
4,500,000
Rupe
es In
thou
sand
s
Net Profit to Total Assets
53%
0%8%
39%
0%
Assets 2017
Property, plant and equipment
Long term investment - Available forsale
Long term investment in Subsidiary
Current assets
Other Assets
GRAPHICAL PRESENTATION OF KEY FINANCIAL DATA
2012 2013 2014 2015 2016 2017Cement Sales 409,088 369,431 300,735 282,351 365,778 411,600
-
50,000
100,000
150,000
200,000
250,000
300,000
350,000
400,000
450,000
In M
etric
Ton
s
Cement Sales
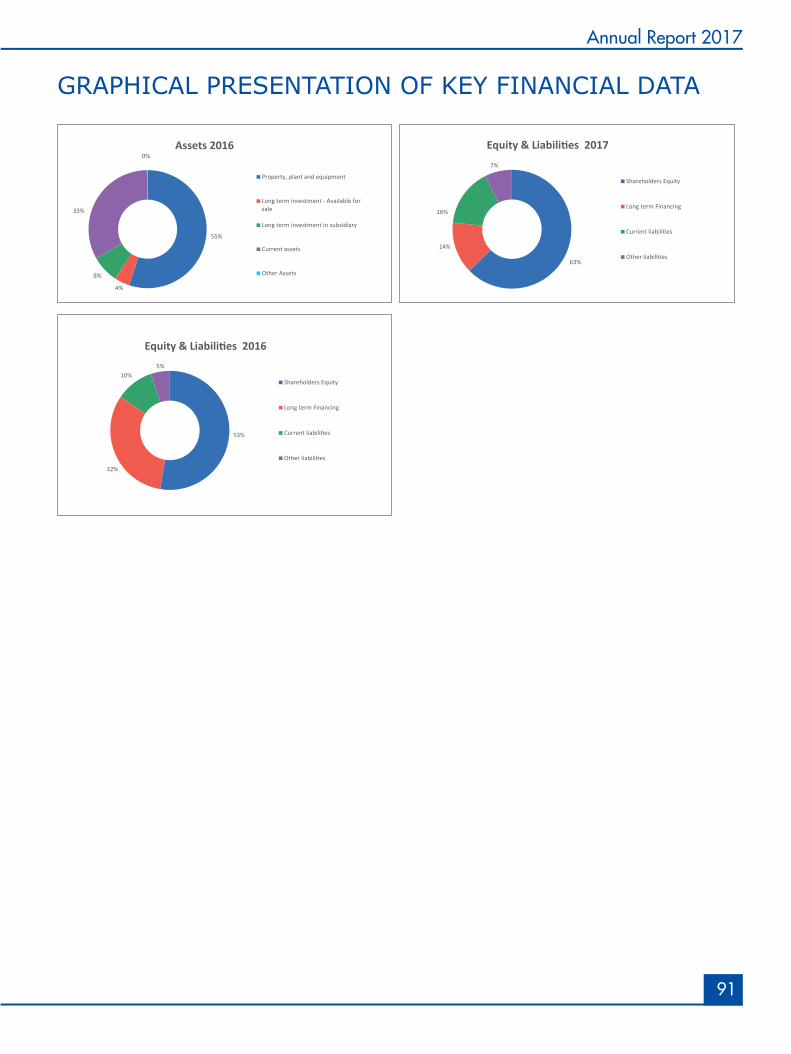
91
Annual Report 2017
55%
4%
8%
33%
0%Assets 2016
Property, plant and equipment
Long term investment - Available forsale
Long term investment in subsidiary
Current assets
Other Assets
63%
14%
16%
7%
Equity & Liabilities 2017
Shareholders Equity
Long term Financing
Current liabilities
Other liabilities
53%
32%
10%5%
Equity & Liabilities 2016
Shareholders Equity
Long term Financing
Current liabilities
Other liabilities
GRAPHICAL PRESENTATION OF KEY FINANCIAL DATA
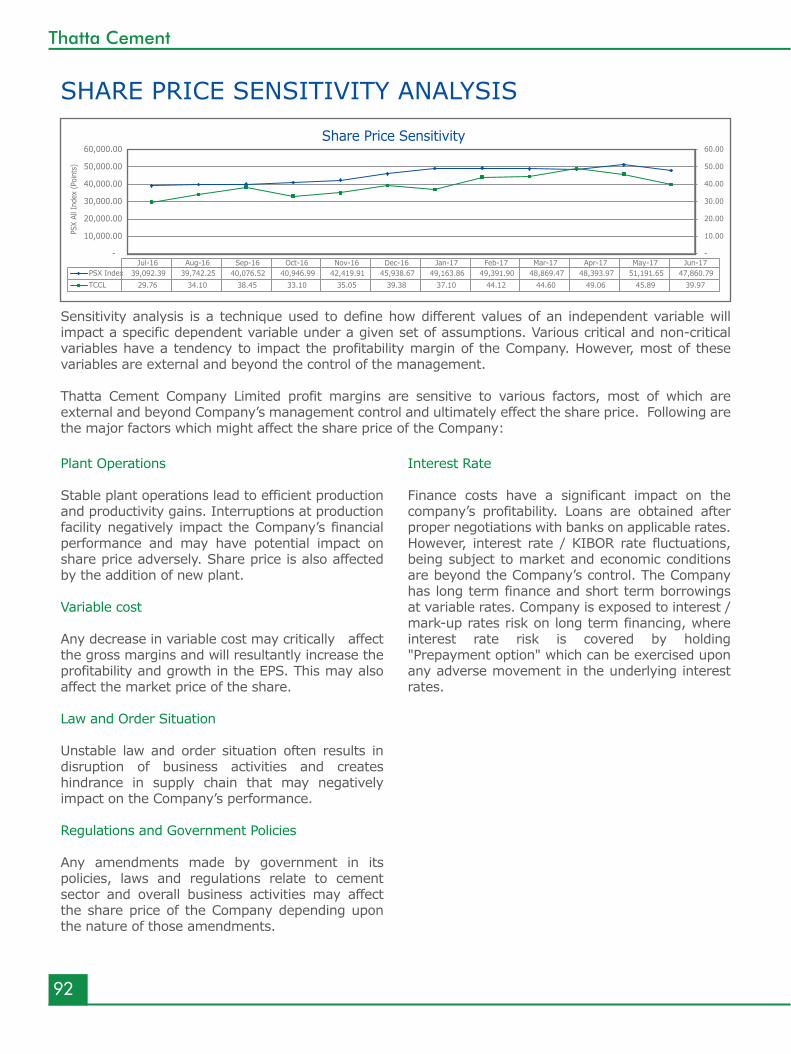
92
Thatta Cement
Sensitivity analysis is a technique used to define how different values of an independent variable will impact a specific dependent variable under a given set of assumptions. Various critical and non-critical variables have a tendency to impact the profitability margin of the Company. However, most of these variables are external and beyond the control of the management.
Thatta Cement Company Limited profit margins are sensitive to various factors, most of which are external and beyond Company’s management control and ultimately effect the share price. Following are the major factors which might affect the share price of the Company:
Plant Operations
Stable plant operations lead to efficient production and productivity gains. Interruptions at production facility negatively impact the Company’s financial performance and may have potential impact on share price adversely. Share price is also affected by the addition of new plant.
Variable cost
Any decrease in variable cost may critically affect the gross margins and will resultantly increase the profitability and growth in the EPS. This may also affect the market price of the share.
Law and Order Situation
Unstable law and order situation often results in disruption of business activities and creates hindrance in supply chain that may negatively impact on the Company’s performance.
Regulations and Government Policies
Any amendments made by government in its policies, laws and regulations relate to cement sector and overall business activities may affect the share price of the Company depending upon the nature of those amendments.
Interest Rate
Finance costs have a significant impact on the company’s profitability. Loans are obtained after proper negotiations with banks on applicable rates. However, interest rate / KIBOR rate fluctuations, being subject to market and economic conditions are beyond the Company’s control. The Company has long term finance and short term borrowings at variable rates. Company is exposed to interest / mark-up rates risk on long term financing, where interest rate risk is covered by holding "Prepayment option" which can be exercised upon any adverse movement in the underlying interest rates.
SHARE PRICE SENSITIVITY ANALYSIS
-
10.00
20.00
30.00
40.00
50.00
60.00
-
10,000.00
20,000.00
30,000.00
40,000.00
50,000.00
60,000.00
PSX
All I
ndex
(Poi
nts)
Jul-16 Aug-16 Sep-16 Oct-16 Nov-16 Dec-16 Jan-17 Feb-17 Mar-17 Apr-17 May-17 Jun-17PSX Index 39,092.39 39,742.25 40,076.52 40,946.99 42,419.91 45,938.67 49,163.86 49,391.90 48,869.47 48,393.97 51,191.65 47,860.79TCCL 29.76 34.10 38.45 33.10 35.05 39.38 37.10 44.12 44.60 49.06 45.89 39.97
Share Price Sensitivity
93
Annual Report 2017
Assets: The total resources with monetary value owned or controlled by an individual or a business.
AGM: Annual general meeting of shareholders held each year as per the requirements of Companies Act 2017.
Borrowing Cost: refers to finance cost that are directly attributable to the construction/acquisition of qualifying assets and included in the cost of such asset.
Syndicate/Consortium Financing: is a solution that entails several banks or financial institutions joining hands to finance large projects through a common appraisal, common documentation and joint supervision.
Current Ratio: The current ratio indicates a company's ability to meet short-term debt obligations.
Dividend Payout Ratio: The ratio is found by dividing the annual dividends per share by the annual earnings per share.
Dividend Yield: The ratio is calculated by dividing the dividend per share by the market price per share.
Earnings Per Share: found by dividing the net income of the company by the number of shares of common outstanding stock.
EBITDA: Earnings before Interest, Taxes, Depreciation and Amortization.
GGBFS: Ground Granulated Blast Furnace Slag
IASB: International Accounting Standards Board.
IFRS: International Financial Reporting Standard.
IFRIC: International Financial Reporting Issues Committee.
KIBOR: Karachi Inter Bank Offer Rate.
Liquidity Ratios: The ratio used to determine the Company’s ability to meet its short term financial obligations.
Long Term Debt-to-Equity Ratio: The ratio found by dividing long-term debt including current maturity by the equity plus long term debt.
Non-Operating Revenue: Revenue generated by an entity which is not directly related to production. Non-operating revenue includes things such as interest income, gains and losses.
Operating Cycle: The average time between purchasing or acquiring inventory and receiving cash proceeds from its sale.
OPC: Ordinary Portland Cement.
Profitability Ratios: Profitability Ratios are used to assess the Company’s ability to generate profits in relation to its sales, assets and equity.
Price-Earnings Ratio (P/E): The ratio found by dividing market price per share by earnings per share (This ratio indicates what investors think of the firm's earnings' growth and risk prospects).
Qualifying Asset: An asset that takes substantial period of time to get ready for its intended use/sale.
Return on Assets: The return on assets ratio is calculated by dividing net income by total assets.
Return on Equity (ROE): The value found by dividing the company's net income by its net assets (ROE measures the amount a company earns on investments).
Spread: Rate charged by the bank over KIBOR.
SRC: Sulphate Resistant Cement.
Term: Refers to the maturity or length of time until final repayment of loan, bond, sale or other contractual obligation.
GLOSSARY OF TERMS

This page is intentionally left blank
94
Thatta Cement
FinancialStatements
(UNConsolidated)
Putting Forward the OutcomeOur brilliance embedded in all our actions
promises to reach greater heights of the bar charts. We aim to put forward outstanding
results that represents our expertise and excellence.
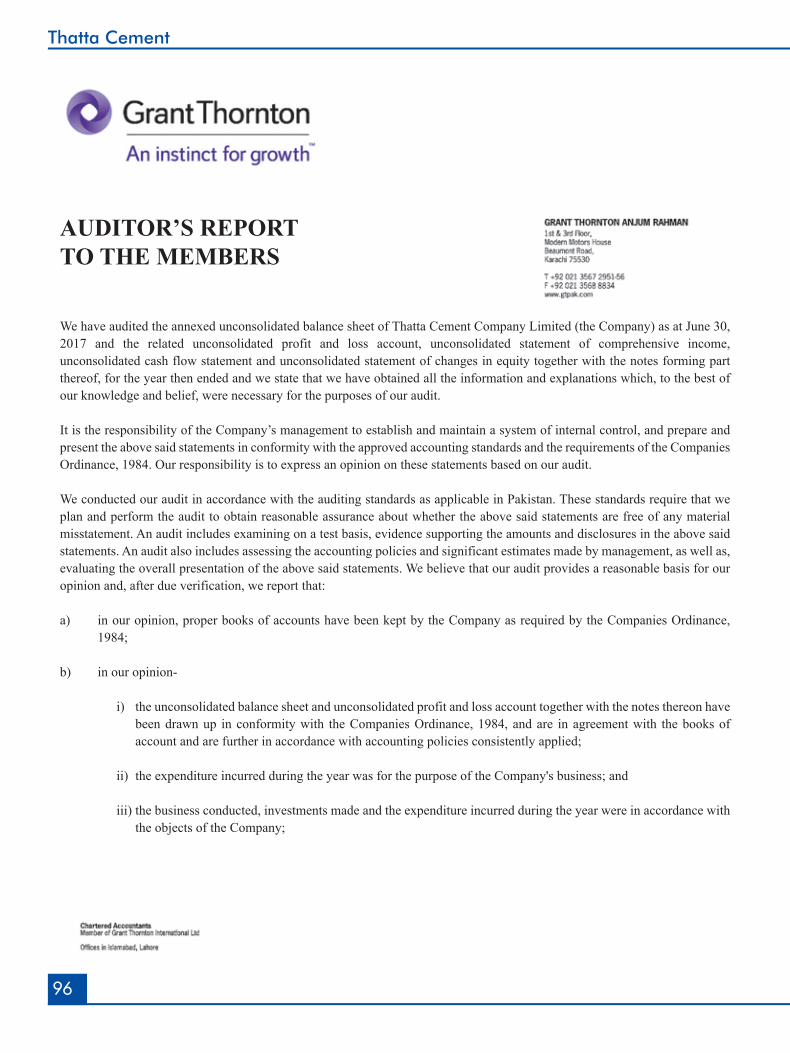
96
Thatta Cement
AUDITOR’S REPORTTO THE MEMBERS
We have audited the annexed unconsolidated balance sheet of Thatta Cement Company Limited (the Company) as at June 30, 2017 and the related unconsolidated profit and loss account, unconsolidated statement of comprehensive income, unconsolidated cash flow statement and unconsolidated statement of changes in equity together with the notes forming part thereof, for the year then ended and we state that we have obtained all the information and explanations which, to the best of our knowledge and belief, were necessary for the purposes of our audit.
It is the responsibility of the Company’s management to establish and maintain a system of internal control, and prepare and present the above said statements in conformity with the approved accounting standards and the requirements of the Companies Ordinance, 1984. Our responsibility is to express an opinion on these statements based on our audit.
We conducted our audit in accordance with the auditing standards as applicable in Pakistan. These standards require that we plan and perform the audit to obtain reasonable assurance about whether the above said statements are free of any material misstatement. An audit includes examining on a test basis, evidence supporting the amounts and disclosures in the above said statements. An audit also includes assessing the accounting policies and significant estimates made by management, as well as, evaluating the overall presentation of the above said statements. We believe that our audit provides a reasonable basis for our opinion and, after due verification, we report that:
a) in our opinion, proper books of accounts have been kept by the Company as required by the Companies Ordinance, 1984;
b) in our opinion-
i) the unconsolidated balance sheet and unconsolidated profit and loss account together with the notes thereon have been drawn up in conformity with the Companies Ordinance, 1984, and are in agreement with the books of account and are further in accordance with accounting policies consistently applied;
ii) the expenditure incurred during the year was for the purpose of the Company's business; and
iii) the business conducted, investments made and the expenditure incurred during the year were in accordance with the objects of the Company;
97
Annual Report 2017
c) in our opinion and to the best of our information and according to the explanations given to us, the unconsolidated balance sheet, unconsolidated profit and loss account, unconsolidated statement of comprehensive income, unconsolidated cash flow statement and unconsolidated statement of changes in equity together with the notes forming part thereof conform with approved accounting standards as applicable in Pakistan, and, give the information required by the Companies Ordinance, 1984, in the manner so required and respectively give a true and fair view of the state of the Company's affairs as at June 30, 2017 and of profit, total comprehensive income, changes in equity and its cash flows for the year then ended; and
d) in our opinion, Zakat deductible at source under the Zakat and Ushr Ordinance, 1980 (XVIII of 1980), was deducted by Company and deposited in the Central Zakat Fund established under section 7 of that Ordinance.
Date: August 19, 2017 Grant Thornton Anjum Rahman Karachi Chartered Accountants Muhammad Shaukat Naseeb Engagement Partner
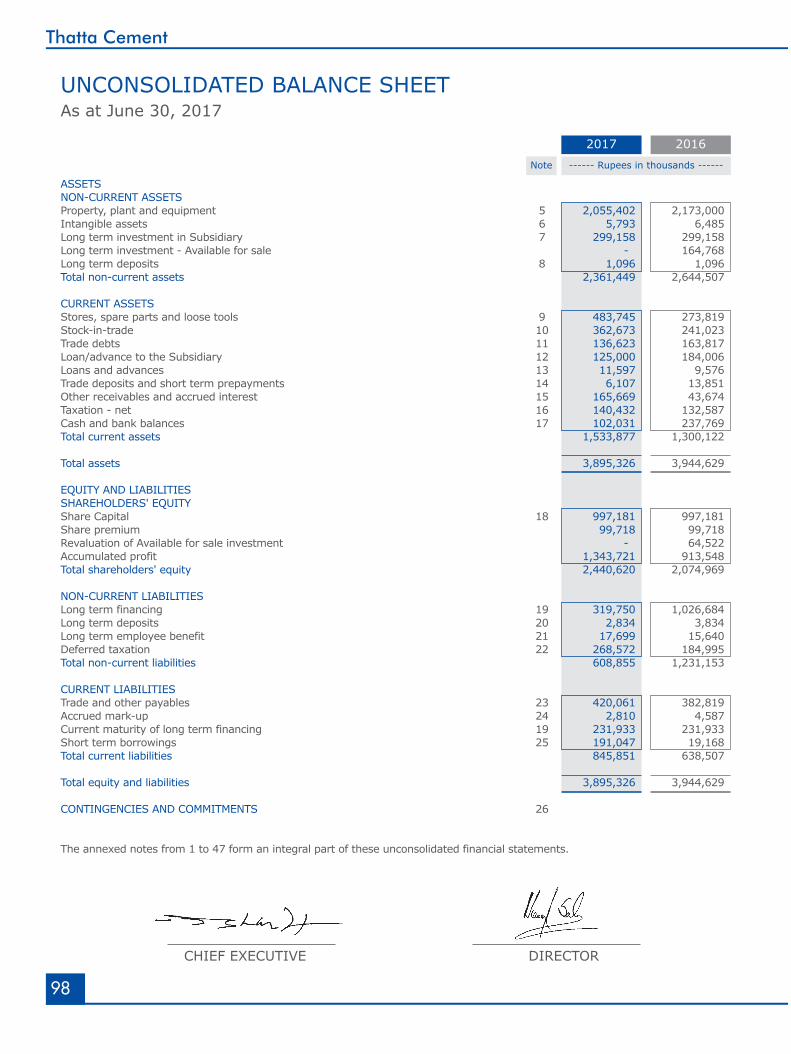
98
Thatta Cement
UNCONSOLIDATED BALANCE SHEET As at June 30, 2017
ASSETS NON-CURRENT ASSETS Property, plant and equipment 5 2,055,402 2,173,000 Intangible assets 6 5,793 6,485 Long term investment in Subsidiary 7 299,158 299,158 Long term investment - Available for sale - 164,768 Long term deposits 8 1,096 1,096 Total non-current assets 2,361,449 2,644,507 CURRENT ASSETS Stores, spare parts and loose tools 9 483,745 273,819 Stock-in-trade 10 362,673 241,023 Trade debts 11 136,623 163,817 Loan/advance to the Subsidiary 12 125,000 184,006 Loans and advances 13 11,597 9,576 Trade deposits and short term prepayments 14 6,107 13,851 Other receivables and accrued interest 15 165,669 43,674 Taxation - net 16 140,432 132,587 Cash and bank balances 17 102,031 237,769 Total current assets 1,533,877 1,300,122 Total assets 3,895,326 3,944,629
EQUITY AND LIABILITIES SHAREHOLDERS' EQUITY Share Capital 18 997,181 997,181 Share premium 99,718 99,718 Revaluation of Available for sale investment - 64,522 Accumulated profit 1,343,721 913,548 Total shareholders' equity 2,440,620 2,074,969 NON-CURRENT LIABILITIES Long term financing 19 319,750 1,026,684 Long term deposits 20 2,834 3,834 Long term employee benefit 21 17,699 15,640 Deferred taxation 22 268,572 184,995 Total non-current liabilities 608,855 1,231,153 CURRENT LIABILITIES Trade and other payables 23 420,061 382,819 Accrued mark-up 24 2,810 4,587 Current maturity of long term financing 19 231,933 231,933 Short term borrowings 25 191,047 19,168 Total current liabilities 845,851 638,507 Total equity and liabilities 3,895,326 3,944,629 CONTINGENCIES AND COMMITMENTS 26 The annexed notes from 1 to 47 form an integral part of these unconsolidated financial statements.
------ Rupees in thousands ------Note
2017 2016
CHIEF EXECUTIVE DIRECTOR
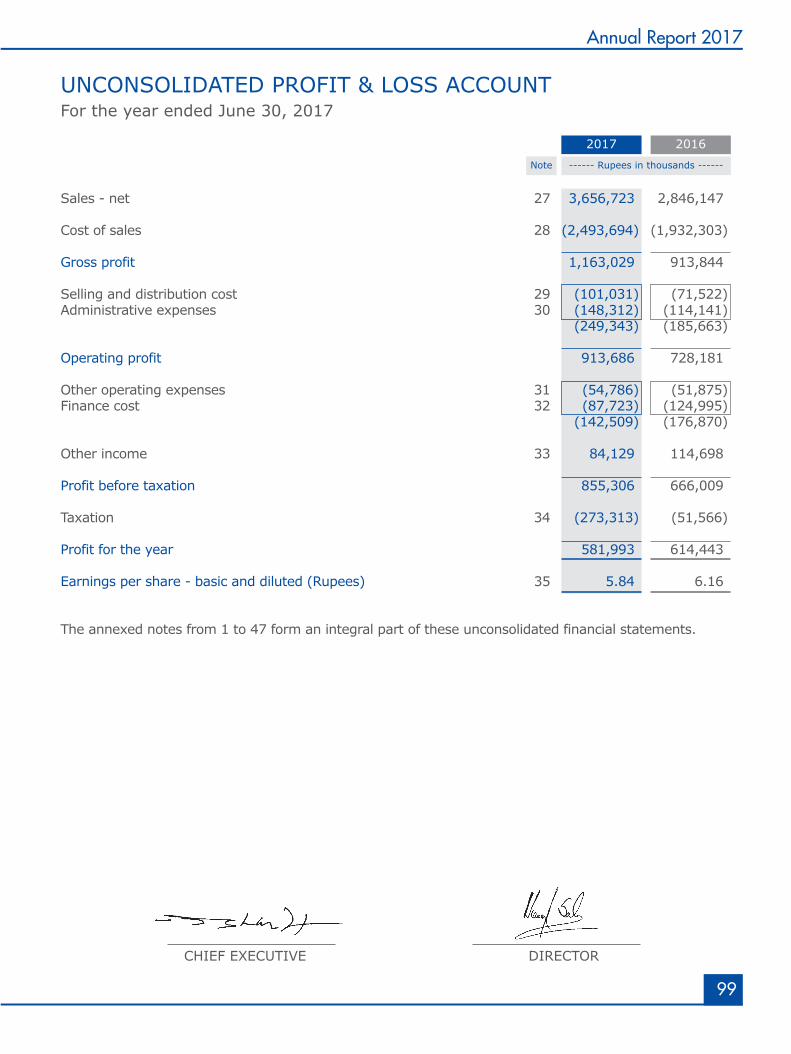
99
Annual Report 2017
UNCONSOLIDATED PROFIT & LOSS ACCOUNTFor the year ended June 30, 2017
------ Rupees in thousands ------Note
2017 2016
Sales - net 27 3,656,723 2,846,147 Cost of sales 28 (2,493,694) (1,932,303) Gross profit 1,163,029 913,844 Selling and distribution cost 29 (101,031) (71,522)Administrative expenses 30 (148,312) (114,141) (249,343) (185,663) Operating profit 913,686 728,181 Other operating expenses 31 (54,786) (51,875)Finance cost 32 (87,723) (124,995) (142,509) (176,870) Other income 33 84,129 114,698 Profit before taxation 855,306 666,009 Taxation 34 (273,313) (51,566) Profit for the year 581,993 614,443
Earnings per share - basic and diluted (Rupees) 35 5.84 6.16
The annexed notes from 1 to 47 form an integral part of these unconsolidated financial statements.
CHIEF EXECUTIVE DIRECTOR
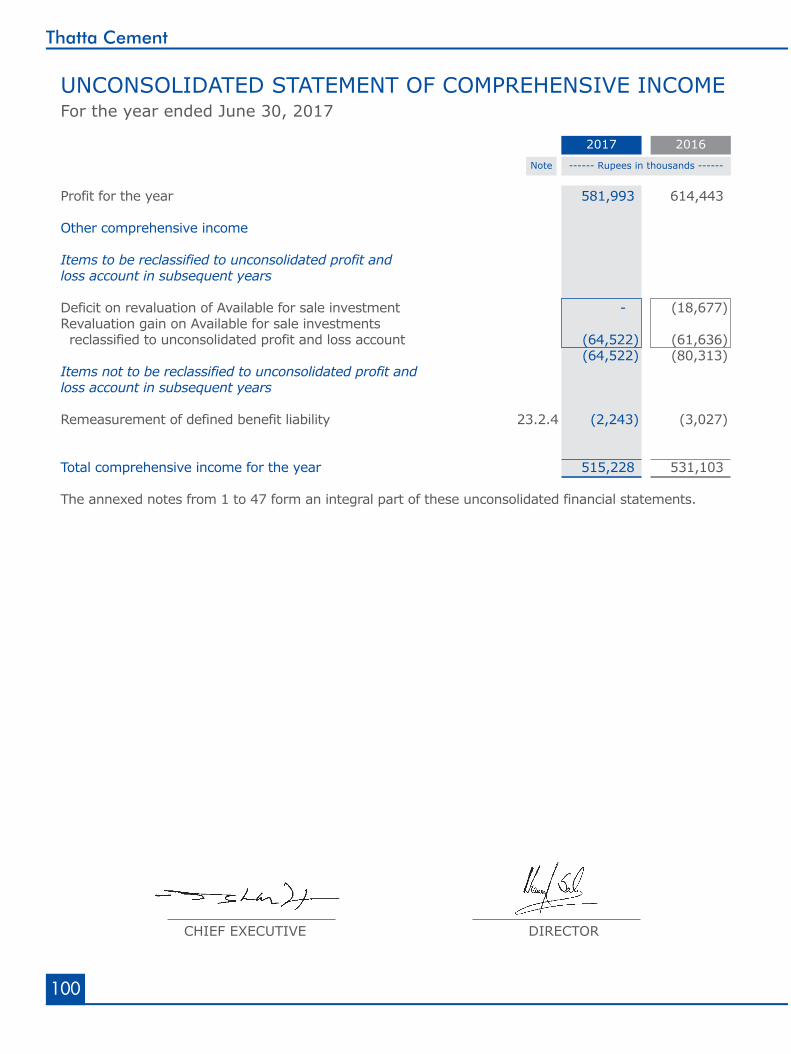
100
Thatta Cement
UNCONSOLIDATED STATEMENT OF COMPREHENSIVE INCOME For the year ended June 30, 2017
------ Rupees in thousands ------Note
2017 2016
Profit for the year 581,993 614,443 Other comprehensive income Items to be reclassified to unconsolidated profit andloss account in subsequent years Deficit on revaluation of Available for sale investment - (18,677)Revaluation gain on Available for sale investments reclassified to unconsolidated profit and loss account (64,522) (61,636) (64,522) (80,313)Items not to be reclassified to unconsolidated profit andloss account in subsequent years Remeasurement of defined benefit liability 23.2.4 (2,243) (3,027) Total comprehensive income for the year 515,228 531,103 The annexed notes from 1 to 47 form an integral part of these unconsolidated financial statements.
CHIEF EXECUTIVE DIRECTOR
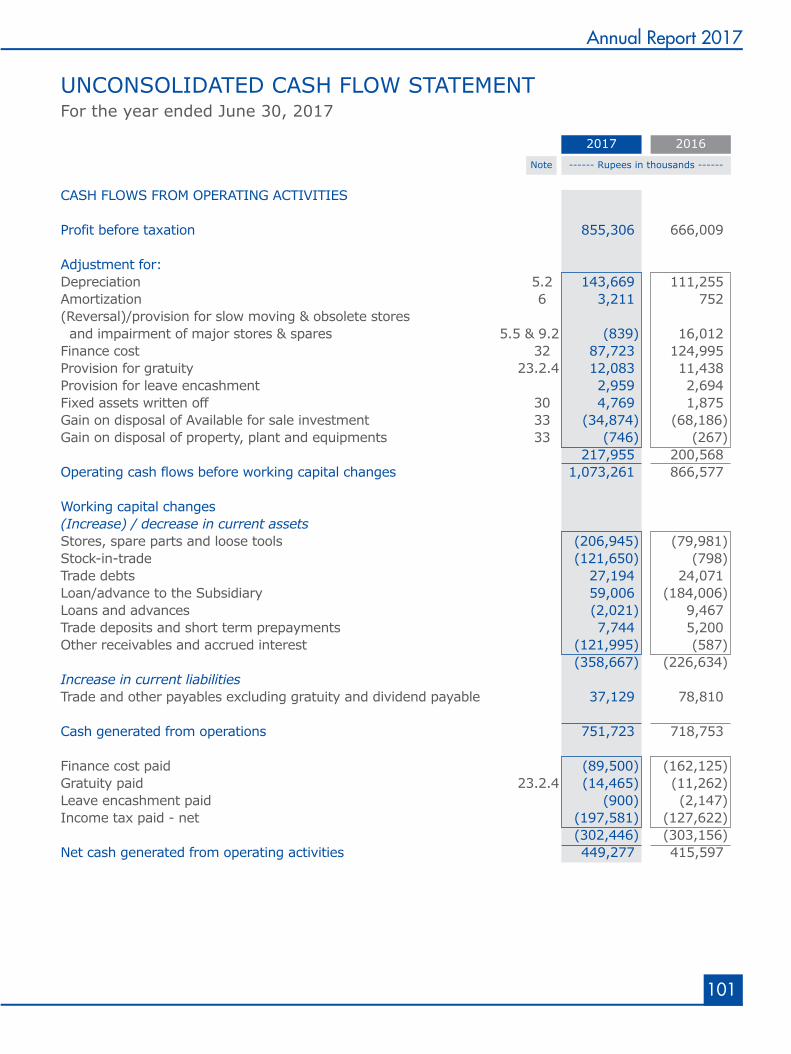
101
Annual Report 2017
UNCONSOLIDATED CASH FLOW STATEMENT For the year ended June 30, 2017
CASH FLOWS FROM OPERATING ACTIVITIES Profit before taxation 855,306 666,009 Adjustment for: Depreciation 5.2 143,669 111,255 Amortization 6 3,211 752 (Reversal)/provision for slow moving & obsolete stores and impairment of major stores & spares 5.5 & 9.2 (839) 16,012 Finance cost 32 87,723 124,995 Provision for gratuity 23.2.4 12,083 11,438 Provision for leave encashment 2,959 2,694 Fixed assets written off 30 4,769 1,875 Gain on disposal of Available for sale investment 33 (34,874) (68,186)Gain on disposal of property, plant and equipments 33 (746) (267) 217,955 200,568 Operating cash flows before working capital changes 1,073,261 866,577 Working capital changes(Increase) / decrease in current assets Stores, spare parts and loose tools (206,945) (79,981)Stock-in-trade (121,650) (798)Trade debts 27,194 24,071 Loan/advance to the Subsidiary 59,006 (184,006)Loans and advances (2,021) 9,467 Trade deposits and short term prepayments 7,744 5,200 Other receivables and accrued interest (121,995) (587) (358,667) (226,634)Increase in current liabilities Trade and other payables excluding gratuity and dividend payable 37,129 78,810 Cash generated from operations 751,723 718,753 Finance cost paid (89,500) (162,125)Gratuity paid 23.2.4 (14,465) (11,262)Leave encashment paid (900) (2,147)Income tax paid - net (197,581) (127,622) (302,446) (303,156)Net cash generated from operating activities 449,277 415,597
------ Rupees in thousands ------Note
2017 2016
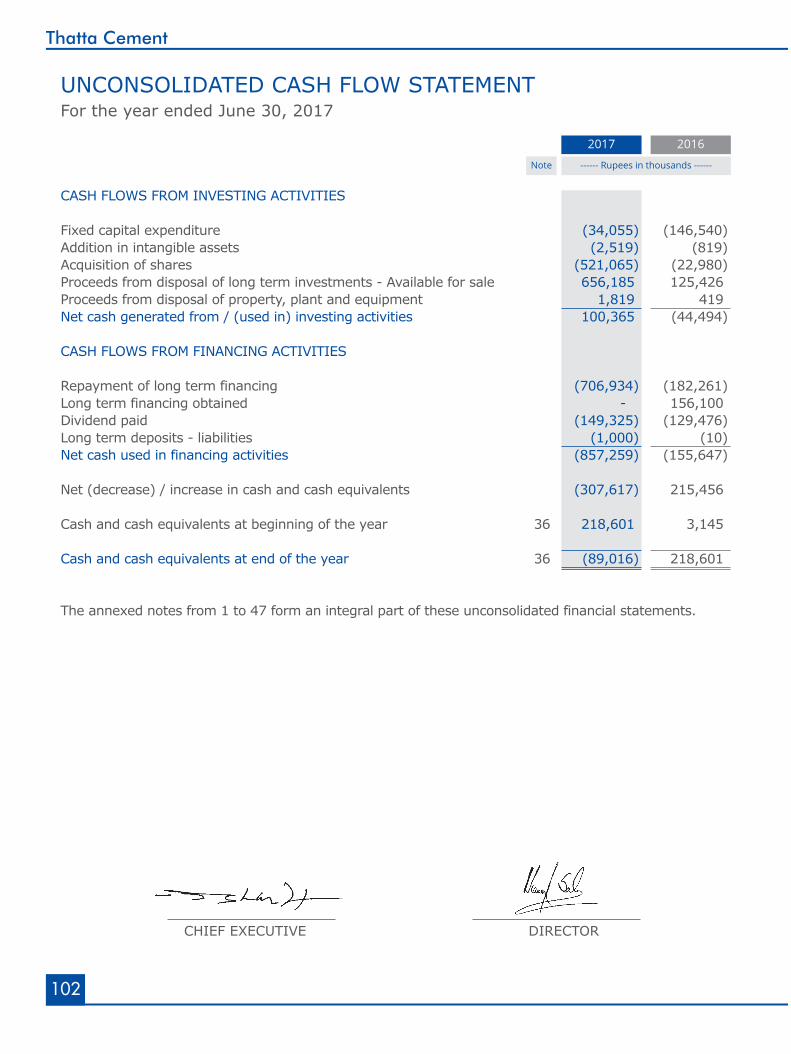
102
Thatta Cement
UNCONSOLIDATED CASH FLOW STATEMENT For the year ended June 30, 2017
CASH FLOWS FROM INVESTING ACTIVITIES Fixed capital expenditure (34,055) (146,540)Addition in intangible assets (2,519) (819)Acquisition of shares (521,065) (22,980)Proceeds from disposal of long term investments - Available for sale 656,185 125,426 Proceeds from disposal of property, plant and equipment 1,819 419 Net cash generated from / (used in) investing activities 100,365 (44,494) CASH FLOWS FROM FINANCING ACTIVITIES Repayment of long term financing (706,934) (182,261)Long term financing obtained - 156,100 Dividend paid (149,325) (129,476)Long term deposits - liabilities (1,000) (10)Net cash used in financing activities (857,259) (155,647) Net (decrease) / increase in cash and cash equivalents (307,617) 215,456 Cash and cash equivalents at beginning of the year 36 218,601 3,145 Cash and cash equivalents at end of the year 36 (89,016) 218,601 The annexed notes from 1 to 47 form an integral part of these unconsolidated financial statements.
------ Rupees in thousands ------Note
2017 2016
CHIEF EXECUTIVE DIRECTOR
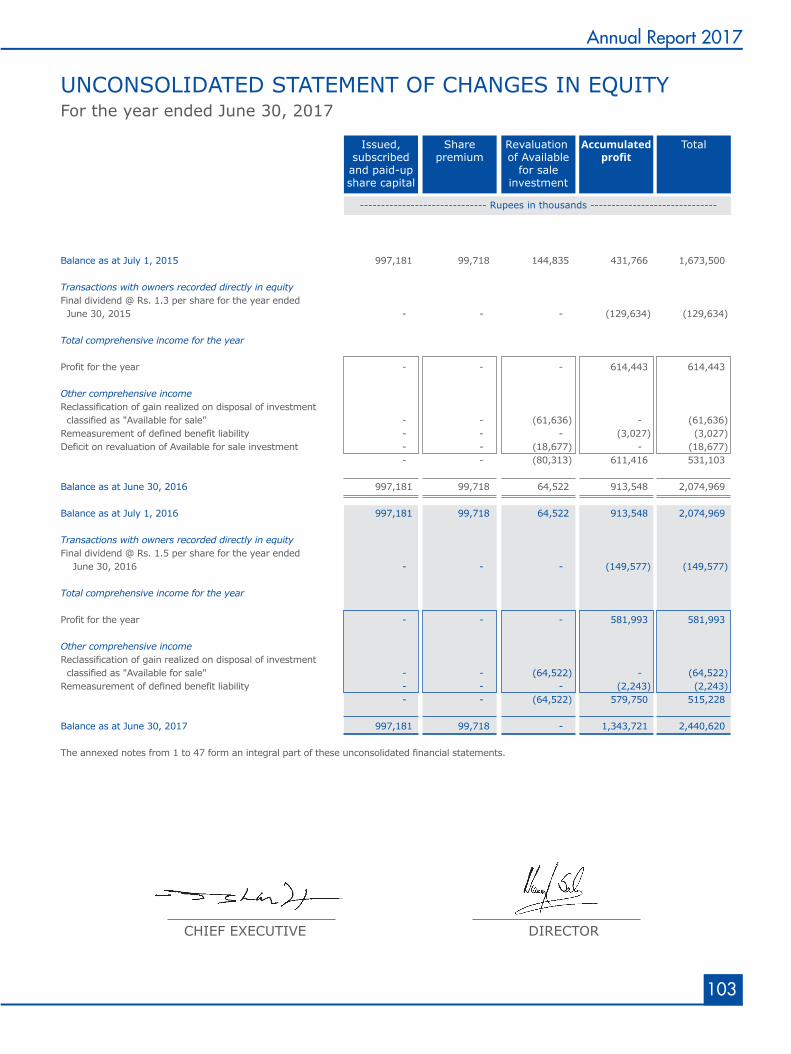
UNCONSOLIDATED STATEMENT OF CHANGES IN EQUITY For the year ended June 30, 2017
Balance as at July 1, 2015 997,181 99,718 144,835 431,766 1,673,500
Transactions with owners recorded directly in equity Final dividend @ Rs. 1.3 per share for the year ended June 30, 2015 - - - (129,634) (129,634) Total comprehensive income for the year Profit for the year - - - 614,443 614,443 Other comprehensive income Reclassification of gain realized on disposal of investment classified as "Available for sale" - - (61,636) - (61,636)Remeasurement of defined benefit liability - - - (3,027) (3,027)Deficit on revaluation of Available for sale investment - - (18,677) - (18,677) - - (80,313) 611,416 531,103 Balance as at June 30, 2016 997,181 99,718 64,522 913,548 2,074,969 Balance as at July 1, 2016 997,181 99,718 64,522 913,548 2,074,969
Transactions with owners recorded directly in equity Final dividend @ Rs. 1.5 per share for the year ended June 30, 2016 - - - (149,577) (149,577) Total comprehensive income for the year
Profit for the year - - - 581,993 581,993 Other comprehensive income Reclassification of gain realized on disposal of investment classified as "Available for sale" - - (64,522) - (64,522)Remeasurement of defined benefit liability - - - (2,243) (2,243) - - (64,522) 579,750 515,228
Balance as at June 30, 2017 997,181 99,718 - 1,343,721 2,440,620 The annexed notes from 1 to 47 form an integral part of these unconsolidated financial statements.
------------------------------ Rupees in thousands ------------------------------
Accumulatedprofit
TotalSharepremium
Revaluation of Available
for saleinvestment
Issued,subscribedand paid-upshare capital
103
Annual Report 2017
CHIEF EXECUTIVE DIRECTOR
104
Thatta Cement
NOTES TO THE UNCONSOLIDATED FINANCIAL STATEMENTSFor the year ended June 30, 2017
1 STATUS AND NATURE OF BUSINESS Thatta Cement Company Limited ("the Company") was incorporated in Pakistan in 1980 as a
public limited company. The shares of the Company are quoted at the Pakistan Stock Exchange. The Company's main business activity is manufacturing and marketing of cement. The registered office of the Company is situated at Office No. 606, 607, 608 & 608A, Continental Trade Centre, Block 8, Clifton, Karachi. The production facility of the Company comprises of 233 acres and is located at Ghulamullah Road, Makli, District Thatta, Sindh.
2 BASIS OF PREPARATION 2.1 Statement of compliance These unconsolidated financial statements have been prepared in accordance with approved
accounting standards as applicable in Pakistan. Approved accounting standards comprises of such International Financial Reporting Standards (IFRSs) issued by the International Accounting Standards Board as are notified under the Companies Ordinance, 1984 and provisions of and directives issued under the Companies Ordinance, 1984. In case the requirements differ, the provisions or directives of the Companies Ordinance, 1984 shall prevail.
These unconsolidated financial statements are being submitted to the shareholders as required
under section 233 of the Companies Ordinance, 1984 and the Pakistan Stock Exchange Regulations.
2.2 Basis of measurement These unconsolidated financial statements have been prepared under historical cost convention
except for recognition of staff retirement benefits at present value based on actuarial valuation and foreign currency liabilities which are stated at the exchange rate at the balance sheet date.
2.3 Financial year The Company's financial year starts from July 1 and ends at June 30. 2.4 Functional and presentation currency These unconsolidated financial statements have been prepared & presented in Pakistani Rupee,
which is the Company's functional and presentation currency. 2.5 Use of estimates and judgments The preparation of these unconsolidated financial statements in conformity with approved
accounting standards require management to make estimates, assumptions and use judgments that affect the application of policies and reported amounts of assets, liabilities, income and expenses. Estimates, assumptions and judgments are continually evaluated and are based on historical experience and other factors, including reasonable expectations of future events. Revisions to accounting estimates are recognized prospectively commencing from the period of revision. In preparing these unconsolidated financial statements, the significant judgments made by the management in applying the Company's accounting policies and key sources of estimation and uncertainty were the same as those that were applied to the unconsolidated financial statements as at and for the year ended June 30, 2016.
105
Annual Report 2017
Management has made the following estimates and judgments which are significant to these unconsolidated financial statements:
a) Property, plant and equipment The Company’s management determines the estimated useful lives and related depreciation
charge for its property, plant and equipments. The Company also reviews the value of the assets for possible impairment on an annual basis. Any change in the estimates in future years might affect the carrying amounts of the respective items of property, plant and equipments with a corresponding effect on the depreciation charge and impairment.
b) Intangible assets The Company’s management determines the estimated useful lives and related amortization
charge for its intangibles. The Company also reviews the value of the intangibles for possible impairment on an annual basis. Any change in the estimates in future years might affect the carrying amounts of the respective items of intangibles with a corresponding effect on the amortization charge and impairment.
c) Trade debts The Company reviews it’s doubtful debts at each reporting date to assess whether provision
should be recorded in the unconsolidated profit and loss account. In particular, judgment by management is required in the estimates of the amount and timing of future cash flows when determining the level of provision required. Such estimates are based on assumptions about number of factors and actual results may differ, resulting in future changes to the provision.
d) Stock-in-trade and stores & spares The Company reviews the net realizable value of stock-in-trade and stores and spares to assess
any diminution in the respective carrying values. Any change in the estimates in future years might affect the carrying amounts of stock-in-trade and stores & spares and corresponding effect in unconsolidated profit and loss account of those future years. Net realizable value is determined with respect to estimated selling price less estimated expenditures to make the sale.
e) Taxation In making the estimates for income taxes currently payable by the Company, the management
considers the current income tax law and the decisions of appellate authorities on certain issues in the past. In making the provision for deferred tax, estimates of the Company's future taxable profits are taken into account.
f) Contingencies The assessment of the contingencies inherently involves the exercise of significant judgment as
the outcome of the future events cannot be predicted with certainty. The Company, based on the availability of the latest information, estimates the value of contingent assets and liabilities which may differ on the occurrence / non-occurrence of the uncertain future events with respect to evaluation based on element of issue involved and opinion of the legal counsel.
g) Staff retirement benefits Certain actuarial assumptions have been adopted as disclosed in these unconsolidated financial
statements for actuarial valuation of present value of defined benefit obligation and leave encashment. Change in these assumptions in future years may affect the liability under the schemes in those years.
106
Thatta Cement
h) Impairment of investments The Company determines that a significant and prolonged decline in the fair value of its
investments below its cost is an objective evidence of impairment. The impairment loss is recognized when the carrying amount exceeds the higher of fair value less cost to sell and value in use.
3 STANDARDS, AMENDMENTS OR INTERPRETATIONS WHICH BECAME EFFECTIVE DURING THE
YEAR 3.1 Promulgation of Companies Act, 2017 Consequent to the promulgation and implementation of Companies Act, 2017, additional
information have been voluntarily disclosed in note 2.3, 12,15, 28.1.1, 34.4, 43 & 44 to these unconsolidated financial statements.
3.2 Standards, amendments and interpretations to the published standards that are relevant to the
company and adopted in the current year The following standards, amendments and interpretations of approved accounting standards
which became effective during the year and adopted by the Company:
Standard or Interpretation Effective date
IAS 1 - Disclosure Initiative (Amendments to IAS 1 Presentation of Financial Statements) January 1, 2016 IFRS 10, IFRS 12 and IAS 28 - Investment Entities : Applying the Consolidation Exception (Amendments to IFRS 10, IFRS 12 and IAS 28) January 1, 2016 Annual Improvements to IFRSs 2012 - 2014 Cycle January 1, 2016 IAS 16 and IAS 41 - Agriculture: Bearer Plants (Amendments to IAS 16 and IAS 41) January 1, 2016 IAS 16 and IAS 38 - Clarification of Acceptable Methods of Depreciation and Amortisation (Amendments to IAS 16 and IAS 38) January 1, 2016 The adoption of the above accounting standards or interpretations do not have any material
effect on the unconsolidated financial statements including comparative amounts. 3.3 Standards, amendments to published standards and interpretations that are effective but not
relevant The other new standards, amendments to the published standards and interpretations that are
mandatory for the financial year beginning on July 01, 2016 are considered not to be relevant nor to have any significant effect on the Company's financial reporting and operations and are therefore not presented here.
3.4 Standards, amendments and interpretations to the published standards that are relevant but not
yet effective and not early adopted by the Company The following new standards, amendments to the published standards and interpretations will be
effective from the dates mentioned below against the respective standard or interpretation.
107
Annual Report 2017
Standard or Interpretation Effective date (annual periods beginning on or after)
IFRS 10 and IAS 28 - Sale or Contribution of Assets between an Investor and its Associate or Joint Venture (Amendments to IFRS 10 and IAS 28) Postponed IAS 7 - Disclosure Initiative (Amendments to IAS 7) January 1, 2017 IAS 12 - Recognition of Deferred Tax Assets for Unrealized Losses (Amendments to IAS 12) January 1, 2017 IFRS 12 - Annual Improvements to IFRS 2014-2016 January 1, 2017 IFRS 2 - Classification and Measurement of Share-based Payment Transaction (Amendments to IFRS 2) January 1, 2018 IFRS 1 and IAS 28 - Annual Improvements to IFRSs 2014-2016 January 1, 2018 IFRIC 22 - Foreign Currency Transactions and Advance Consideration January 1, 2018 IAS 40 - Transfers of Investment Property (Amendments to IAS 40) January 1, 2018 IFRIC 23 - Uncertainty over Income Tax Treatments January 1, 2019 The above standards and amendments are not expected to have any material impact on the
Company's financial statements in the period of initial application. 3.5 Standards, amendments and interpretations to the published standards that are not yet notified
by the Securities and Exchange Commission of Pakistan (SECP) Following new standards have been issued by the International Accounting Standards Board
(IASB) which are yet to be notified by the SECP for the purpose of applicability in Pakistan. Standard or Interpretation IASB effective date (Annual periods beginning on or after) IFRS 9 - Financial Instruments (2014) and consequent amendments to IFRS 4 Insurance Contracts January 1, 2018 IFRS 14 - Regulatory Deferral Accounts January 1, 2016 IFRS 15 - Revenue from Contracts with Customers January 1, 2018 IFRS 16 - Leases January 1, 2019 IFRS 17 – Insurance Contracts January 1, 2021 4 SUMMARY OF SIGNIFICANT ACCOUNTING POLICIES The significant accounting policies adopted in the preparation of these unconsolidated financial
statements are set out below and have been consistently applied to all years presented.
108
Thatta Cement
4.1 Property, plant and equipment Property, plant and equipments (except freehold land) are stated at cost less accumulated
depreciation and impairment losses, if any. Cost includes expenditure that is directly attributable to the acquisition of an asset.
Depreciation Depreciation is charged using straight line method on all assets except on plant and machinery
(other than utilities within plant and machinery) on which depreciation is charged by applying 'Units of Production (UoP) method'. Depreciation rates of each item is mentioned in note 5.1. Depreciation on addition is charged from the date when the asset is available for use and on disposal upto the date when the asset is classified as 'held for sale' in accordance with IFRS 5 'Non-current Assets Held for Sale and Discontinued Operations' or the date when the asset is derecognized, whichever is earlier. Asset's residual values and useful lives are reviewed and adjusted, if appropriate at each balance sheet date.
Subsequent costs Subsequent costs are included in the asset’s carrying amount or recognized as a separate asset,
as appropriate, only when it is probable that future economic benefits associated with the asset will flow to the Company and the cost of the asset can be measured reliably. The carrying amount of the replaced part is derecognised. Normal maintenance and repairs are charged to unconsolidated profit and loss account as and when incurred whereas major renewals and improvements are capitalized.
Disposal The gain or loss on disposal of an item of property, plant and equipments is determined by
comparing the proceeds from disposal with the carrying amount of the property, plant and equipments and is recognised in unconsolidated profit and loss account.
4.1.1 Capital work-in-progress (CWIP) Capital work-in-progress is stated at cost including, where relevant, related financing costs less
impairment loss, if any. These costs are transferred to fixed assets as and when assets are available for use.
4.2 Government grant Government grants related to assets are presented by deducting the grant amount in arriving at
the carrying amount of the asset. The grant is recognized in unconsolidated profit and loss account over the useful life of the asset as reduced by depreciation expense.
4.3 Intangible assets Intangible assets are recognized when it is probable that the expected future economic benefits
will flow to the entity and the cost of an asset can be measured reliably. Cost of intangible asset includes purchase cost and directly attributable expenses incidental to bring the asset for its intended use. Costs associated with maintaining computer software are recognized as an expense as and when incurred. Intangible assets are stated at cost less accumulated amortization and accumulated impairment losses, if any. Amortization is charged over the estimated useful life of an asset on a systematic basis applying the straight line method. Useful lives of all intangible assets are reviewed at each balance sheet date and adjusted if the impact of amortization is significant. Subsequent expenditure on intangible asset is capitalized only when it increases the future economic benefits embodied in the specific assets to which it relates.
109
Annual Report 2017
4.4 Impairment Financial assets A financial asset is assessed at each reporting date to determine whether there is any objective
evidence that it is impaired. A financial asset is considered to be impaired if objective evidence indicates that one or more events have had a negative effect on the estimated future cash flows of that asset. An asset's carrying amount is written down immediately to its recoverable amount if the asset's carrying amount is greater than its estimated recoverable amount.
Non-Financial assets The carrying amounts of non-financial assets other than stock-in-trade and deferred tax asset,
are assessed at each reporting date to ascertain whether there is any indication of impairment. If any such indication exists then the asset's recoverable amount is estimated. An impairment loss is recognized, as an expense in the unconsolidated profit and loss account, for the amount by which the asset's carrying amount exceeds its recoverable amount. The recoverable amount is the higher of an asset's fair value less cost to sell and value in use. Value in use is ascertained through discounting of the estimated future cash flows using a discount rate that reflects current market assessments of the time value of money and the risk specific to the assets. For the purpose of assessing impairment, assets are grouped at the lowest levels for which there are separately identifiable cash flows (cash generating units).
An impairment loss is reversed if there has been a change in the estimates used to determine the
recoverable amount. An impairment loss is reversed only to the extent that the asset's carrying amount does not exceed the carrying amount that would have been determined, net of depreciation or amortization, if no impairment loss had been recognized.
4.5 Investments Investment in subsidiaries Investment in subsidiaries are initially recognized at cost. The carrying amount of investment is
reviewed at each reporting date to determine whether there is any indication of impairment. If any such indication exists the investment's recoverable amount is estimated which is higher of its value in use and its fair value less cost to sell. An impairment loss is recognized if the carrying amount exceeds its recoverable amount. Impairment losses are recognized in unconsolidated profit and loss account. An impairment loss is reversed if there has been a change in the estimates used to determine the recoverable amount but limited to the extent of initial cost of investment. A reversal of impairment loss is recognized in the unconsolidated profit and loss account.
Investment in associates Investment in associates are initially recognized at cost. The carrying amount of investment is
reviewed at each reporting date to determine whether there is any indication of impairment. If any such indication exist the investment's recoverable amount is estimated which is higher of its value in use and its fair value less cost to sell. An impairment loss is recognized if the carrying amount exceeds its recoverable amount. Impairment losses are recognized in unconsolidated profit and loss account. An impairment loss is reversed if there has been a change in the estimates used to determine the recoverable amount but limited to the extent of initial cost of investment. A reversal of impairment loss is recognized in the unconsolidated profit and loss account.
110
Thatta Cement
Investment - Available for sale The Company classifies its other long term investment as 'Available for sale' investments which
are non-derivatives and are either designated in this category or not classified as 'Fair value through profit and loss', 'Loans and receivables' or 'Held to maturity financial assets'.
Available for sale investment is initially recorded at fair value and subsequently remeasured at fair value at each reporting date. Changes in fair value are taken to unconsolidated other comprehensive income. When investment classified as Available for sale is sold or impaired, the accumulated fair value adjustments recognized in unconsolidated other comprehensive income are included in the unconsolidated profit and loss account. Dividends on Available for sale investment is recognized in the unconsolidated profit and loss account as part of 'other income' when the Company's right to receive payment is established.
The Company assesses at each balance sheet date whether there is an objective evidence that
an 'Available for sale' investment is impaired. For such investment, a significant prolonged decline in the fair value of the investment below the carrying value is considered as an indicator that the investment is impaired. If any such evidence exists, the cumulative loss is transferred from unconsolidated other comprehensive income to the unconsolidated profit and loss account. Impairment losses previously recognized in the unconsolidated profit and loss account on 'Available for sale' investment is not reversed through unconsolidated profit and loss account.
4.6 Stores, spare parts and loose tools These are stated at lower of cost (calculated on weighted average basis) or net realisable value,
less provision for obsolete and slow moving stores and spares. Store and spares in transit are valued at invoice value plus other charges incurred thereon as on the unconsolidated balance sheet date.
Provision for obsolete and slow moving stores, spare parts and loose tools is determined based
on management's estimate regarding their future usability. Net realisable value signifies the estimated selling price in the ordinary course of business less the
estimated cost necessary to be incurred to make the sale. 4.7 Stock-in-trade Stock of raw and packing material, work in process and finished goods are valued at the lower of
cost or net realizable value. Cost in relation to work in process and finished goods includes prime cost and appropriate proportion of production overheads incurred in bringing the inventory to their present location and condition. Stocks of raw and packing material are valued at cost on weighted average basis. Stocks in transit are valued at cost comprising of invoice value plus other charges directly attributable to the acquisition of related purchase incurred upto the unconsolidated balance sheet date.
Net realizable value signifies the estimated selling price in the ordinary course of business less the
estimated cost of completion and cost necessary to be incurred in order to make the sale.
4.8 Trade debts and other receivables Trade debts and other receivables are stated initially at fair value and subsequently measured at
amortized cost using the effective interest rate method if applicable, less provision for impairment and provision for doubtful debts, if any. Provision for impairment and provision for doubtful debts are established where there is objective evidence that the Company will not be able to collect all amounts due according to the original terms of the receivables. Trade debts and receivables are written off when considered irrecoverable.
111
Annual Report 2017
Export debts are initially recognized at the exchange rate prevailing on the date when significant risks and rewards of ownership of goods are transferred and subsequently remeasured at each balance sheet date. Exchange gain / (loss) on remeasurement is taken to unconsolidated profit and loss account.
4.9 Cash and cash equivalents Cash and cash equivalents in local currency are carried in the unconsolidated balance sheet at
cost and cash in foreign currencies are stated at the exchange rate prevailing at the balance sheet date. For the purposes of the unconsolidated cash flow statement, cash and cash equivalents comprises of cash in hand, with banks in current, PLS and deposit accounts net of short term borrowings under mark-up arrangements, if any.
4.10 Employee retirement benefits Defined benefit plan The Company operates an approved funded gratuity scheme covering all permanent employees.
The scheme is administered by the trustees nominated under the Trust Deed. The liability recognized in respect of gratuity is the present value of the Company's obligations under the scheme at the unconsolidated balance sheet date less the fair value of plan assets, together with adjustment for unrecognized actuarial gains or losses. Contribution is made to this scheme on the basis of actuarial recommendations. The actuarial valuation is carried out using the Projected Unit Credit Method.
The present value of obligations are determined by discounting the estimated future cash
outflows using interest rates of government bonds. The government bonds are consistent with the estimated term of the post-employment benefit obligations.
Defined contribution plan The Company also operates an approved contributory provident fund for all its permanent
employees to which equal monthly contributions are made, both by the Company and the employees at the rate of 10% of basic salary.
Leave encashment The liability for accumulated earned leaves which are eligible for encashment relating to
permanent employees are recognised on the basis of actuarial valuation in the period in which permanent employees render service that increases their entitlement to future leave encashment.
4.11 Borrowings and finance cost Loans and borrowings are recorded as and when the proceeds are received. Borrowing cost incurred on long term finances directly attributable to the construction/
acquisition of qualifying asset are capitalized up to the date, the respective assets are available for the intended use. All other mark-up, interest and other related charges are taken to unconsolidated profit and loss account.
112
Thatta Cement
4.12 Taxation Current Provision for current taxation is computed in accordance with the provisions of Income Tax
Ordinance, 2001. The charge for current income tax is recorded after adjustment, if any, to the provision for tax made in prior years including those arising from assessment and amendments in assessments during the year in such years.
Deferred The Company accounts for deferred taxation on all temporary differences using liability method.
Deferred tax asset is recognized only to the extent that it is probable that future taxable profit will be available and the credits can be utilized.
4.13 Trade and other payables These are recognized and carried at cost which is fair value of the consideration to be paid in
future for goods and services received, whether or not billed to the Company. 4.14 Provisions Provisions are recognized when the Company has a present legal or constructive obligation as a
result of past events and it is probable that an outflow of resources embodying economic benefits will be required to settle the obligation and a reliable estimate can be made of the amount of obligation. Provisions are reviewed at each balance sheet date and adjusted to reflect the best estimate.
4.15 Transactions with related parties Transactions in relation to sales, purchases and services with related parties are made at arm's
length prices except for the allocation of expenses such as sharing of electricity, gas, water, repair and maintenance with the Subsidiary Company relating to the Head Office and Business Support Services for which the pricing mechanism is subject to approval of the Board of Directors.
4.16 Revenue recognition Revenue is recognized to the extent it is probable that the economic benefits will flow to the
Company and the revenue can be measured reliably. Revenue is measured at the fair value of the consideration received or receivable. Revenue from sales is recognized upon passage of title to the customers usually on dispatch of goods. Export sales are recognized as revenue when significant risks and rewards of ownership of goods are transferred. Interest and rental/other income is recognized on accrual basis.
4.17 Financial instruments All the financial assets and financial liabilities are recognized at the time when the Company
becomes a party to the contractual provisions of the instrument. Financial assets are de-recognized at the time when the Company looses control of the contractual rights that comprises the financial assets. Financial liabilities are de-recognized at the time when they are extinguished, that is when the obligation specified in the contract is discharged, cancelled or expired. Any gains or losses on de-recognition of financial assets and financial liabilities are taken to unconsolidated profit and loss account.
113
Annual Report 2017
4.18 Offsetting of financial assets and financial liabilities A financial asset and financial liability is offset and the net amount is reported in the balance
sheet if the Company has a legally enforceable right to set-off the recognized amounts and the Company intends either to settle on a net basis or to realize the asset and discharge the liability simultaneously. Corresponding income on assets and charge on liability is also offset.
4.19 Segment reporting Segment results that are reported to the Company’s CEO (the chief operating decision maker)
include items directly attributable to a segment as well as those that can be allocated on a reasonable basis. Unallocated items, if any, mainly comprises of corporate assets, head office expenses and tax assets and liabilities. Management has determined that the Company has a single reportable segment and therefore it has only presented entity wide disclosures.
4.20 Foreign currency transactions Transactions in foreign currencies are translated into Pak Rupees using the exchange rates
prevailing on the date of each transaction. Monetary assets and liabilities in foreign currencies are reported in Pak Rupees using the exchange rates prevailing on the unconsolidated balance sheet date. All exchange differences are taken into unconsolidated profit and loss account.
4.21 Earnings per share The Company presents basic and diluted earnings per share (EPS) data. Basic EPS is calculated
by dividing the profit or loss attributable to shareholders of the Company by the weighted average number of ordinary shares outstanding during the year. Diluted EPS is determined by adjusting the profit or loss attributable to shareholders and the weighted average number of ordinary shares outstanding, adjusted for the effects of all dilutive potential ordinary shares.
4.22 Dividends and appropriations Dividends and reserve appropriations are recognized in the period in which these are declared /
approved.
5 PROPERTY, PLANT AND EQUIPMENT
Operating fixed assets 5.1 2,008,696 2,100,608 Capital work-in-progress 5.4 - 1,403 Major stores and spares 5.5 46,706 70,989 2,055,402 2,173,000
------ Rupees in thousands ------Note
2017 2016
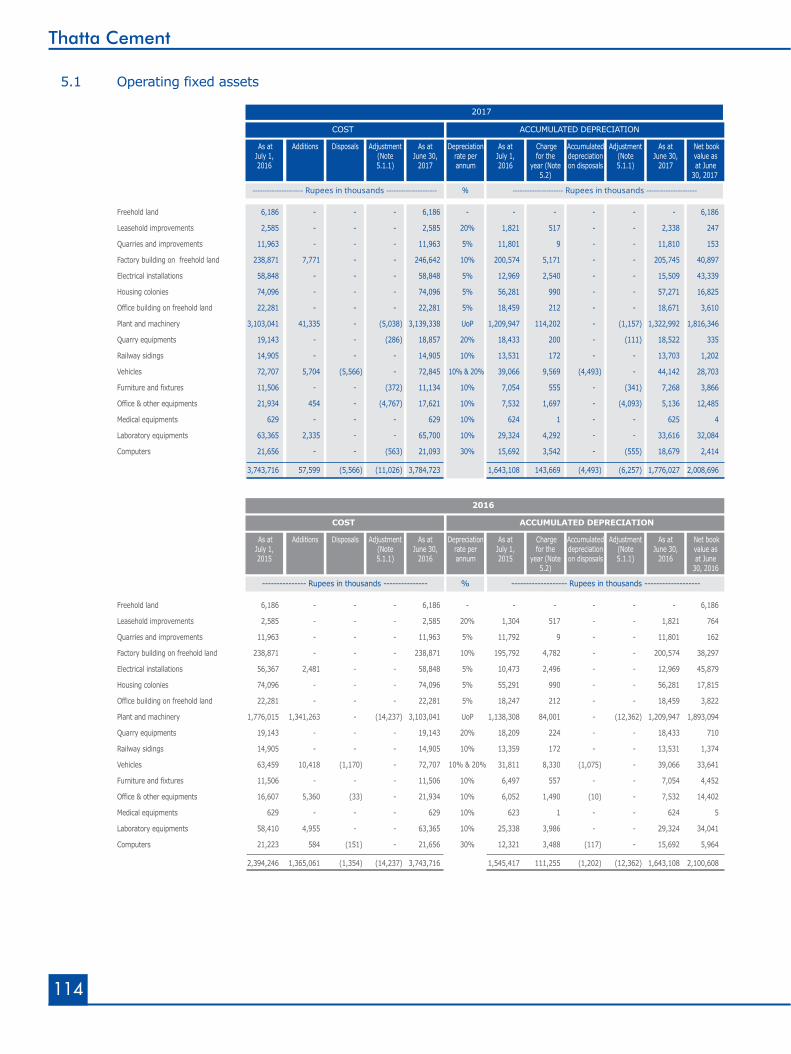
114
Thatta Cement
Freehold land 6,186 - - - 6,186 - - - - - - 6,186
Leasehold improvements 2,585 - - - 2,585 20% 1,821 517 - - 2,338 247
Quarries and improvements 11,963 - - - 11,963 5% 11,801 9 - - 11,810 153
Factory building on freehold land 238,871 7,771 - - 246,642 10% 200,574 5,171 - - 205,745 40,897
Electrical installations 58,848 - - - 58,848 5% 12,969 2,540 - - 15,509 43,339
Housing colonies 74,096 - - - 74,096 5% 56,281 990 - - 57,271 16,825
Office building on freehold land 22,281 - - - 22,281 5% 18,459 212 - - 18,671 3,610
Plant and machinery 3,103,041 41,335 - (5,038) 3,139,338 UoP 1,209,947 114,202 - (1,157) 1,322,992 1,816,346
Quarry equipments 19,143 - - (286) 18,857 20% 18,433 200 - (111) 18,522 335
Railway sidings 14,905 - - - 14,905 10% 13,531 172 - - 13,703 1,202
Vehicles 72,707 5,704 (5,566) - 72,845 10% & 20% 39,066 9,569 (4,493) - 44,142 28,703
Furniture and fixtures 11,506 - - (372) 11,134 10% 7,054 555 - (341) 7,268 3,866
Office & other equipments 21,934 454 - (4,767) 17,621 10% 7,532 1,697 - (4,093) 5,136 12,485
Medical equipments 629 - - - 629 10% 624 1 - - 625 4
Laboratory equipments 63,365 2,335 - - 65,700 10% 29,324 4,292 - - 33,616 32,084
Computers 21,656 - - (563) 21,093 30% 15,692 3,542 - (555) 18,679 2,414
3,743,716 57,599 (5,566) (11,026) 3,784,723 1,643,108 143,669 (4,493) (6,257) 1,776,027 2,008,696
5.1 Operating fixed assets
Freehold land 6,186 - - - 6,186 - - - - - - 6,186
Leasehold improvements 2,585 - - - 2,585 20% 1,304 517 - - 1,821 764
Quarries and improvements 11,963 - - - 11,963 5% 11,792 9 - - 11,801 162
Factory building on freehold land 238,871 - - - 238,871 10% 195,792 4,782 - - 200,574 38,297
Electrical installations 56,367 2,481 - - 58,848 5% 10,473 2,496 - - 12,969 45,879
Housing colonies 74,096 - - - 74,096 5% 55,291 990 - - 56,281 17,815
Office building on freehold land 22,281 - - - 22,281 5% 18,247 212 - - 18,459 3,822
Plant and machinery 1,776,015 1,341,263 - (14,237) 3,103,041 UoP 1,138,308 84,001 - (12,362) 1,209,947 1,893,094
Quarry equipments 19,143 - - - 19,143 20% 18,209 224 - - 18,433 710
Railway sidings 14,905 - - - 14,905 10% 13,359 172 - - 13,531 1,374
Vehicles 63,459 10,418 (1,170) - 72,707 10% & 20% 31,811 8,330 (1,075) - 39,066 33,641
Furniture and fixtures 11,506 - - - 11,506 10% 6,497 557 - - 7,054 4,452
Office & other equipments 16,607 5,360 (33) - 21,934 10% 6,052 1,490 (10) - 7,532 14,402
Medical equipments 629 - - - 629 10% 623 1 - - 624 5
Laboratory equipments 58,410 4,955 - - 63,365 10% 25,338 3,986 - - 29,324 34,041
Computers 21,223 584 (151) - 21,656 30% 12,321 3,488 (117) - 15,692 5,964
2,394,246 1,365,061 (1,354) (14,237) 3,743,716 1,545,417 111,255 (1,202) (12,362) 1,643,108 2,100,608
COST
2016
As atJuly 1,2015
Additions Disposals As atJune 30,
2016
As atJuly 1,2015
As atJune 30,
2016
Net bookvalue asat June
30, 2016
Accumulateddepreciationon disposals
Adjustment(Note5.1.1)
Chargefor the
year (Note5.2)
Depreciationrate perannum
Adjustment(Note5.1.1)
ACCUMULATED DEPRECIATION
--------------- Rupees in thousands --------------- ------------------- Rupees in thousands -------------------%
COST
As atJuly 1,2016
Additions Disposals As atJune 30,
2017
As atJuly 1,2016
As atJune 30,
2017
Net bookvalue asat June
30, 2017
Accumulateddepreciationon disposals
Adjustment(Note5.1.1)
Chargefor the
year (Note5.2)
Depreciationrate perannum
Adjustment(Note5.1.1)
ACCUMULATED DEPRECIATION
--------------------- Rupees in thousands --------------------- % --------------------- Rupees in thousands ---------------------
2017
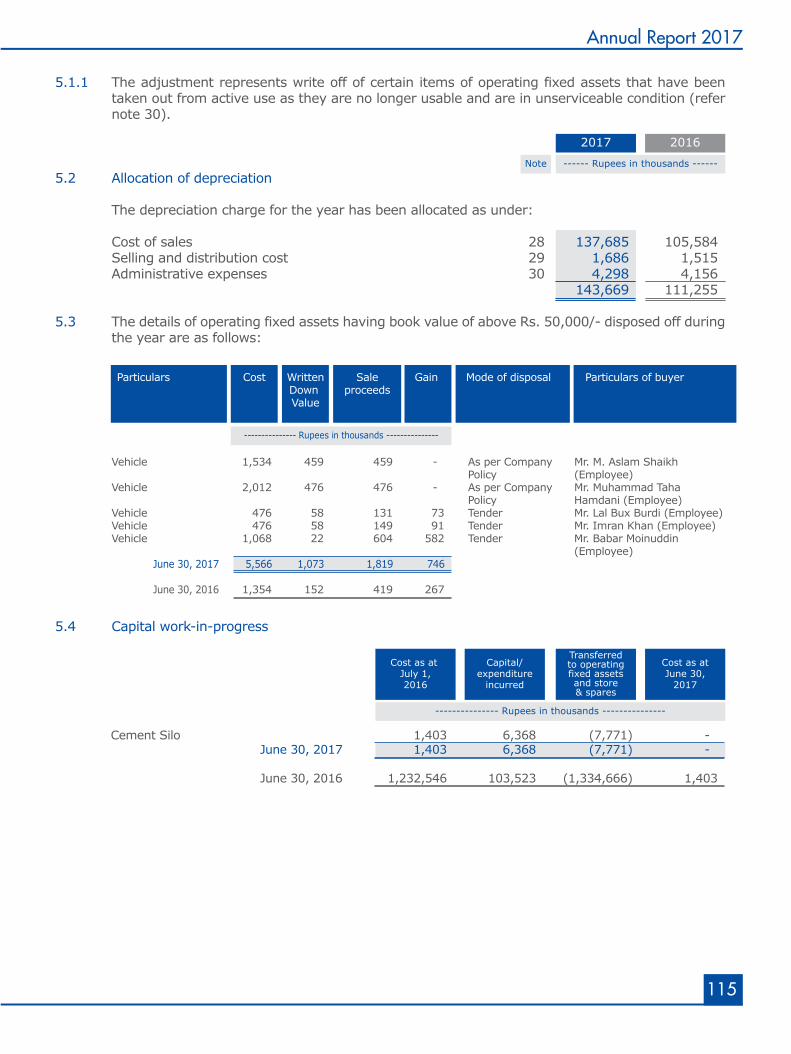
115
Annual Report 2017
5.4 Capital work-in-progress
5.1.1 The adjustment represents write off of certain items of operating fixed assets that have been taken out from active use as they are no longer usable and are in unserviceable condition (refer note 30).
5.2 Allocation of depreciation The depreciation charge for the year has been allocated as under:
Cost of sales 28 137,685 105,584 Selling and distribution cost 29 1,686 1,515 Administrative expenses 30 4,298 4,156 143,669 111,255
5.3 The details of operating fixed assets having book value of above Rs. 50,000/- disposed off during the year are as follows:
------ Rupees in thousands ------Note
2017 2016
Vehicle 1,534 459 459 - As per Company Mr. M. Aslam Shaikh Policy (Employee)
Vehicle 2,012 476 476 - As per Company Mr. Muhammad Taha Policy Hamdani (Employee)
Vehicle 476 58 131 73 Tender Mr. Lal Bux Burdi (Employee) Vehicle 476 58 149 91 Tender Mr. Imran Khan (Employee) Vehicle 1,068 22 604 582 Tender Mr. Babar Moinuddin
(Employee) June 30, 2017 5,566 1,073 1,819 746
June 30, 2016 1,354 152 419 267
Particulars Cost WrittenDown Value
Saleproceeds
Gain Mode of disposal Particulars of buyer
--------------- Rupees in thousands ---------------
Cement Silo 1,403 6,368 (7,771) - June 30, 2017 1,403 6,368 (7,771) - June 30, 2016 1,232,546 103,523 (1,334,666) 1,403
--------------- Rupees in thousands ---------------
Transferredto operatingfixed assetsand store& spares
Cost as atJune 30,
2017
Cost as at July 1,2016
Capital/expenditure
incurred
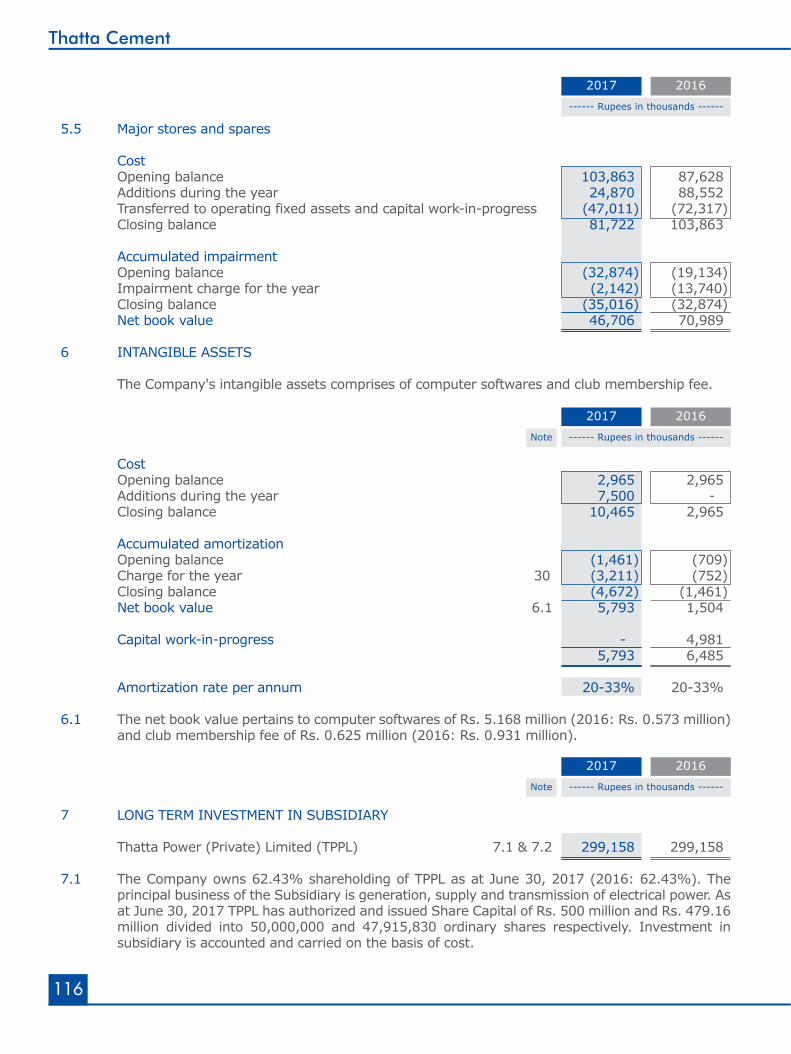
116
Thatta Cement
5.5 Major stores and spares Cost Opening balance 103,863 87,628 Additions during the year 24,870 88,552 Transferred to operating fixed assets and capital work-in-progress (47,011) (72,317) Closing balance 81,722 103,863 Accumulated impairment Opening balance (32,874) (19,134) Impairment charge for the year (2,142) (13,740) Closing balance (35,016) (32,874) Net book value 46,706 70,989 6 INTANGIBLE ASSETS The Company's intangible assets comprises of computer softwares and club membership fee.
Cost Opening balance 2,965 2,965 Additions during the year 7,500 - Closing balance 10,465 2,965 Accumulated amortization Opening balance (1,461) (709) Charge for the year 30 (3,211) (752) Closing balance (4,672) (1,461) Net book value 6.1 5,793 1,504
Capital work-in-progress - 4,981 5,793 6,485 Amortization rate per annum 20-33% 20-33% 6.1 The net book value pertains to computer softwares of Rs. 5.168 million (2016: Rs. 0.573 million)
and club membership fee of Rs. 0.625 million (2016: Rs. 0.931 million).
7 LONG TERM INVESTMENT IN SUBSIDIARY
Thatta Power (Private) Limited (TPPL) 7.1 & 7.2 299,158 299,158 7.1 The Company owns 62.43% shareholding of TPPL as at June 30, 2017 (2016: 62.43%). The
principal business of the Subsidiary is generation, supply and transmission of electrical power. As at June 30, 2017 TPPL has authorized and issued Share Capital of Rs. 500 million and Rs. 479.16 million divided into 50,000,000 and 47,915,830 ordinary shares respectively. Investment in subsidiary is accounted and carried on the basis of cost.
------ Rupees in thousands ------
2017 2016
------ Rupees in thousands ------Note
2017 2016
------ Rupees in thousands ------Note
2017 2016
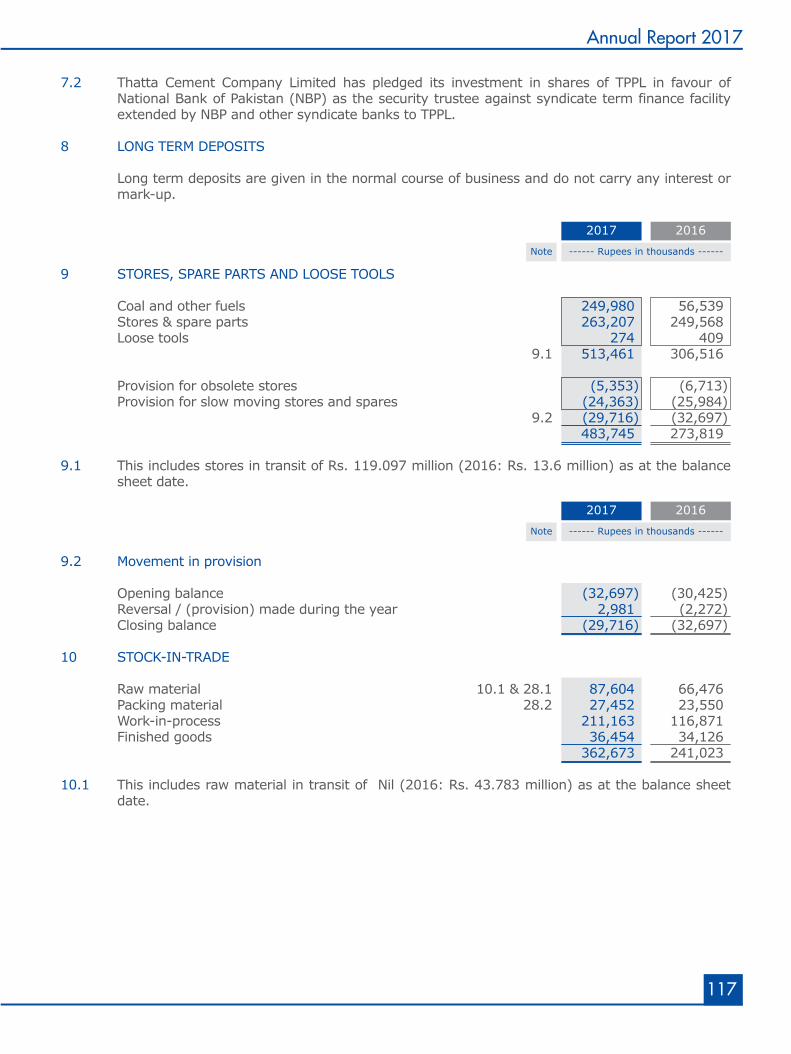
117
Annual Report 2017
------ Rupees in thousands ------Note
2017 2016
------ Rupees in thousands ------Note
2017 2016
7.2 Thatta Cement Company Limited has pledged its investment in shares of TPPL in favour of National Bank of Pakistan (NBP) as the security trustee against syndicate term finance facility extended by NBP and other syndicate banks to TPPL.
8 LONG TERM DEPOSITS Long term deposits are given in the normal course of business and do not carry any interest or
mark-up.
9 STORES, SPARE PARTS AND LOOSE TOOLS
Coal and other fuels 249,980 56,539 Stores & spare parts 263,207 249,568 Loose tools 274 409 9.1 513,461 306,516 Provision for obsolete stores (5,353) (6,713) Provision for slow moving stores and spares (24,363) (25,984) 9.2 (29,716) (32,697) 483,745 273,819 9.1 This includes stores in transit of Rs. 119.097 million (2016: Rs. 13.6 million) as at the balance
sheet date.
9.2 Movement in provision Opening balance (32,697) (30,425) Reversal / (provision) made during the year 2,981 (2,272) Closing balance (29,716) (32,697) 10 STOCK-IN-TRADE Raw material 10.1 & 28.1 87,604 66,476 Packing material 28.2 27,452 23,550 Work-in-process 211,163 116,871 Finished goods 36,454 34,126 362,673 241,023 10.1 This includes raw material in transit of Nil (2016: Rs. 43.783 million) as at the balance sheet
date.
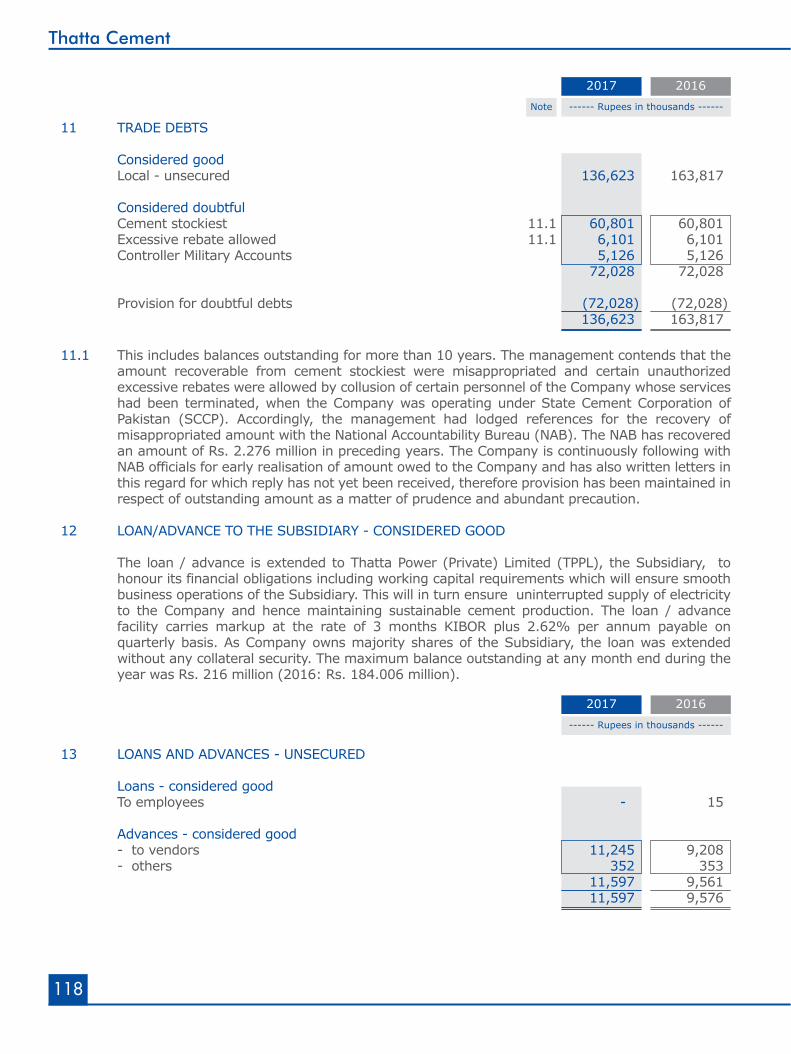
118
Thatta Cement
11 TRADE DEBTS
Considered good Local - unsecured 136,623 163,817 Considered doubtful Cement stockiest 11.1 60,801 60,801 Excessive rebate allowed 11.1 6,101 6,101 Controller Military Accounts 5,126 5,126 72,028 72,028 Provision for doubtful debts (72,028) (72,028) 136,623 163,817
11.1 This includes balances outstanding for more than 10 years. The management contends that the amount recoverable from cement stockiest were misappropriated and certain unauthorized excessive rebates were allowed by collusion of certain personnel of the Company whose services had been terminated, when the Company was operating under State Cement Corporation of Pakistan (SCCP). Accordingly, the management had lodged references for the recovery of misappropriated amount with the National Accountability Bureau (NAB). The NAB has recovered an amount of Rs. 2.276 million in preceding years. The Company is continuously following with NAB officials for early realisation of amount owed to the Company and has also written letters in this regard for which reply has not yet been received, therefore provision has been maintained in respect of outstanding amount as a matter of prudence and abundant precaution.
12 LOAN/ADVANCE TO THE SUBSIDIARY - CONSIDERED GOOD
The loan / advance is extended to Thatta Power (Private) Limited (TPPL), the Subsidiary, to
honour its financial obligations including working capital requirements which will ensure smooth business operations of the Subsidiary. This will in turn ensure uninterrupted supply of electricity to the Company and hence maintaining sustainable cement production. The loan / advance facility carries markup at the rate of 3 months KIBOR plus 2.62% per annum payable on quarterly basis. As Company owns majority shares of the Subsidiary, the loan was extended without any collateral security. The maximum balance outstanding at any month end during the year was Rs. 216 million (2016: Rs. 184.006 million).
13 LOANS AND ADVANCES - UNSECURED Loans - considered good To employees - 15 Advances - considered good - to vendors 11,245 9,208 - others 352 353 11,597 9,561 11,597 9,576
------ Rupees in thousands ------Note
2017 2016
------ Rupees in thousands ------
2017 2016
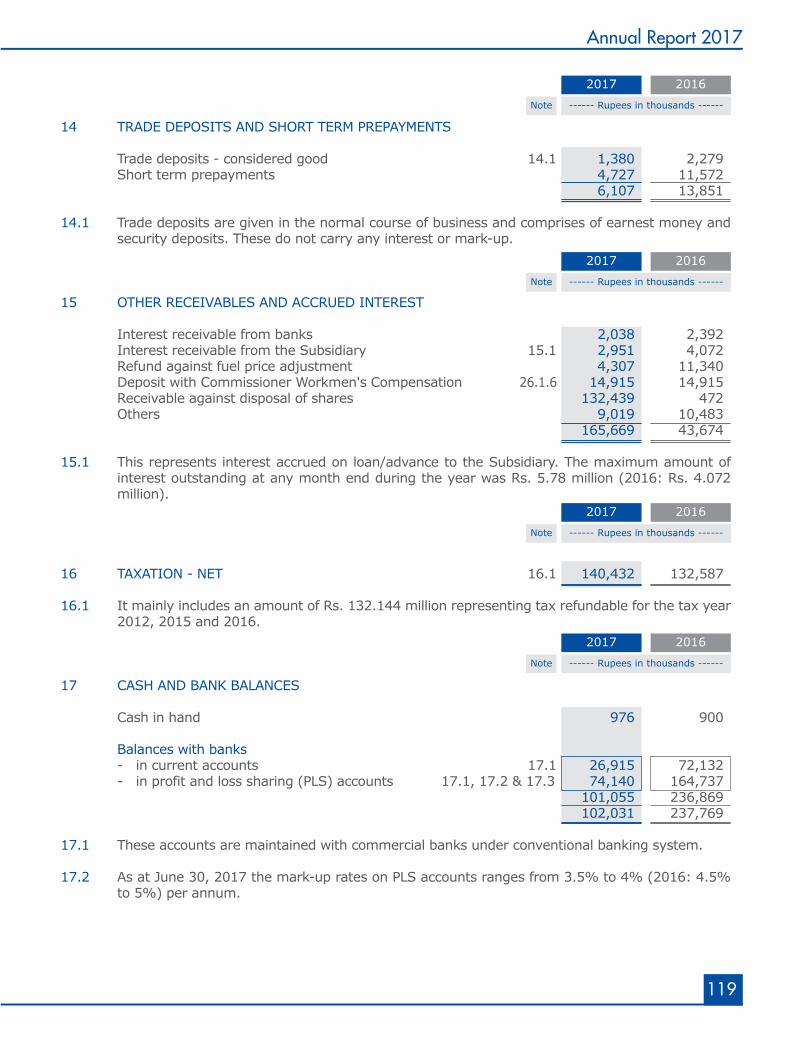
119
Annual Report 2017
------ Rupees in thousands ------Note
2017 2016
------ Rupees in thousands ------Note
2017 2016
------ Rupees in thousands ------Note
2017 2016
------ Rupees in thousands ------Note
2017 2016
14 TRADE DEPOSITS AND SHORT TERM PREPAYMENTS Trade deposits - considered good 14.1 1,380 2,279 Short term prepayments 4,727 11,572 6,107 13,851 14.1 Trade deposits are given in the normal course of business and comprises of earnest money and
security deposits. These do not carry any interest or mark-up.
15 OTHER RECEIVABLES AND ACCRUED INTEREST
Interest receivable from banks 2,038 2,392 Interest receivable from the Subsidiary 15.1 2,951 4,072 Refund against fuel price adjustment 4,307 11,340 Deposit with Commissioner Workmen's Compensation 26.1.6 14,915 14,915 Receivable against disposal of shares 132,439 472 Others 9,019 10,483 165,669 43,674 15.1 This represents interest accrued on loan/advance to the Subsidiary. The maximum amount of
interest outstanding at any month end during the year was Rs. 5.78 million (2016: Rs. 4.072 million).
16 TAXATION - NET 16.1 140,432 132,587 16.1 It mainly includes an amount of Rs. 132.144 million representing tax refundable for the tax year
2012, 2015 and 2016.
17 CASH AND BANK BALANCES
Cash in hand 976 900 Balances with banks - in current accounts 17.1 26,915 72,132 - in profit and loss sharing (PLS) accounts 17.1, 17.2 & 17.3 74,140 164,737 101,055 236,869 102,031 237,769 17.1 These accounts are maintained with commercial banks under conventional banking system.
17.2 As at June 30, 2017 the mark-up rates on PLS accounts ranges from 3.5% to 4% (2016: 4.5% to 5%) per annum.
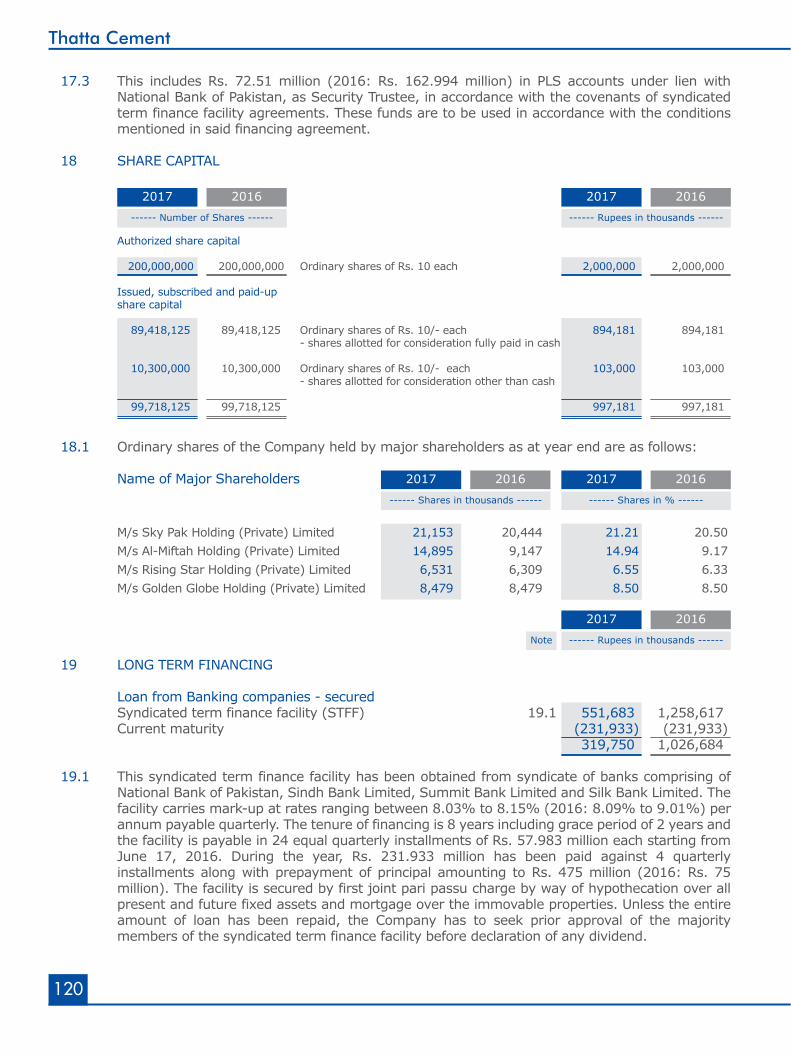
120
Thatta Cement
17.3 This includes Rs. 72.51 million (2016: Rs. 162.994 million) in PLS accounts under lien with National Bank of Pakistan, as Security Trustee, in accordance with the covenants of syndicated term finance facility agreements. These funds are to be used in accordance with the conditions mentioned in said financing agreement.
18 SHARE CAPITAL
19 LONG TERM FINANCING
Loan from Banking companies - secured Syndicated term finance facility (STFF) 19.1 551,683 1,258,617 Current maturity (231,933) (231,933) 319,750 1,026,684 19.1 This syndicated term finance facility has been obtained from syndicate of banks comprising of
National Bank of Pakistan, Sindh Bank Limited, Summit Bank Limited and Silk Bank Limited. The facility carries mark-up at rates ranging between 8.03% to 8.15% (2016: 8.09% to 9.01%) per annum payable quarterly. The tenure of financing is 8 years including grace period of 2 years and the facility is payable in 24 equal quarterly installments of Rs. 57.983 million each starting from June 17, 2016. During the year, Rs. 231.933 million has been paid against 4 quarterly installments along with prepayment of principal amounting to Rs. 475 million (2016: Rs. 75 million). The facility is secured by first joint pari passu charge by way of hypothecation over all present and future fixed assets and mortgage over the immovable properties. Unless the entire amount of loan has been repaid, the Company has to seek prior approval of the majority members of the syndicated term finance facility before declaration of any dividend.
18.1 Ordinary shares of the Company held by major shareholders as at year end are as follows:
Name of Major Shareholders
M/s Sky Pak Holding (Private) Limited 21,153 20,444 21.21 20.50
M/s Al-Miftah Holding (Private) Limited 14,895 9,147 14.94 9.17 M/s Rising Star Holding (Private) Limited 6,531 6,309 6.55 6.33 M/s Golden Globe Holding (Private) Limited 8,479 8,479 8.50 8.50
------ Shares in % ------
2017 2016------ Shares in thousands ------
2017 2016
Authorized share capital
200,000,000 200,000,000 Ordinary shares of Rs. 10 each 2,000,000 2,000,000
Issued, subscribed and paid-up share capital 89,418,125 89,418,125 Ordinary shares of Rs. 10/- each 894,181 894,181 - shares allotted for consideration fully paid in cash 10,300,000 10,300,000 Ordinary shares of Rs. 10/- each 103,000 103,000 - shares allotted for consideration other than cash 99,718,125 99,718,125 997,181 997,181
------ Rupees in thousands ------
2017 2016------ Number of Shares ------
2017 2016
------ Rupees in thousands ------Note
2017 2016
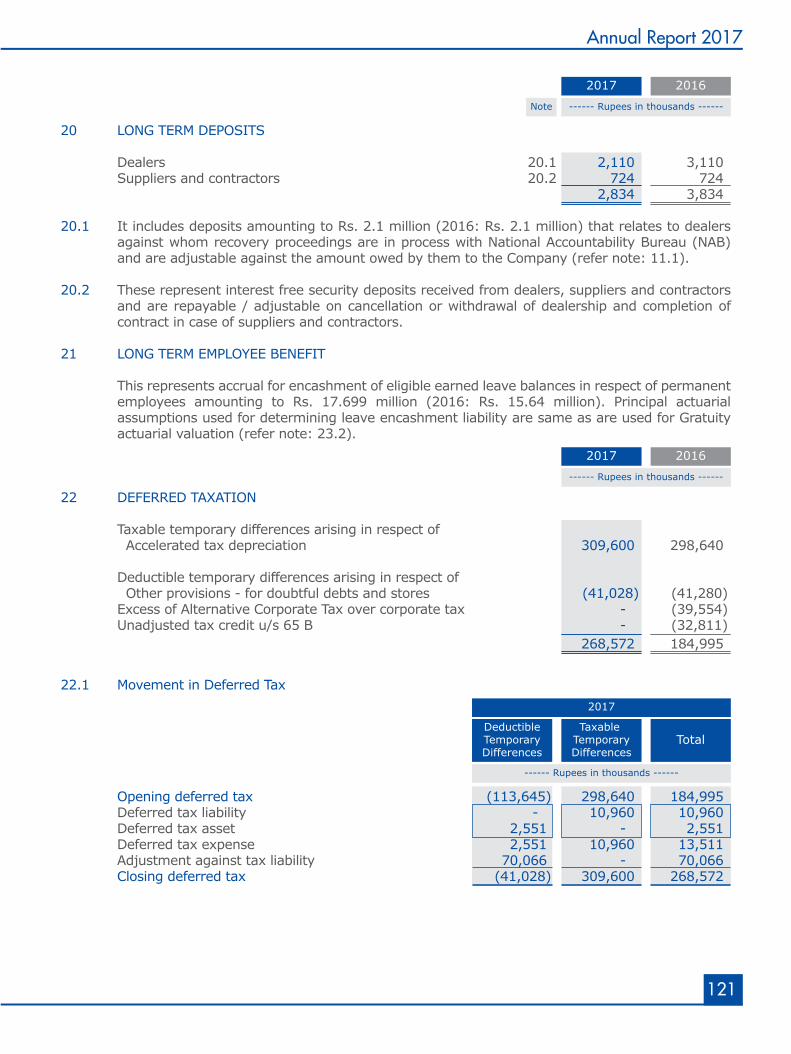
121
Annual Report 2017
20 LONG TERM DEPOSITS
Dealers 20.1 2,110 3,110 Suppliers and contractors 20.2 724 724 2,834 3,834 20.1 It includes deposits amounting to Rs. 2.1 million (2016: Rs. 2.1 million) that relates to dealers
against whom recovery proceedings are in process with National Accountability Bureau (NAB) and are adjustable against the amount owed by them to the Company (refer note: 11.1).
20.2 These represent interest free security deposits received from dealers, suppliers and contractors
and are repayable / adjustable on cancellation or withdrawal of dealership and completion of contract in case of suppliers and contractors.
21 LONG TERM EMPLOYEE BENEFIT This represents accrual for encashment of eligible earned leave balances in respect of permanent
employees amounting to Rs. 17.699 million (2016: Rs. 15.64 million). Principal actuarial assumptions used for determining leave encashment liability are same as are used for Gratuity actuarial valuation (refer note: 23.2).
22 DEFERRED TAXATION
Taxable temporary differences arising in respect of Accelerated tax depreciation 309,600 298,640 Deductible temporary differences arising in respect of Other provisions - for doubtful debts and stores (41,028) (41,280) Excess of Alternative Corporate Tax over corporate tax - (39,554) Unadjusted tax credit u/s 65 B - (32,811) 268,572 184,995
------ Rupees in thousands ------Note
2017 2016
------ Rupees in thousands ------
2017 2016
22.1 Movement in Deferred Tax
Opening deferred tax (113,645) 298,640 184,995 Deferred tax liability - 10,960 10,960 Deferred tax asset 2,551 - 2,551 Deferred tax expense 2,551 10,960 13,511 Adjustment against tax liability 70,066 - 70,066 Closing deferred tax (41,028) 309,600 268,572
------ Rupees in thousands ------
2017
Taxable TemporaryDifferences
TotalDeductibleTemporaryDifferences
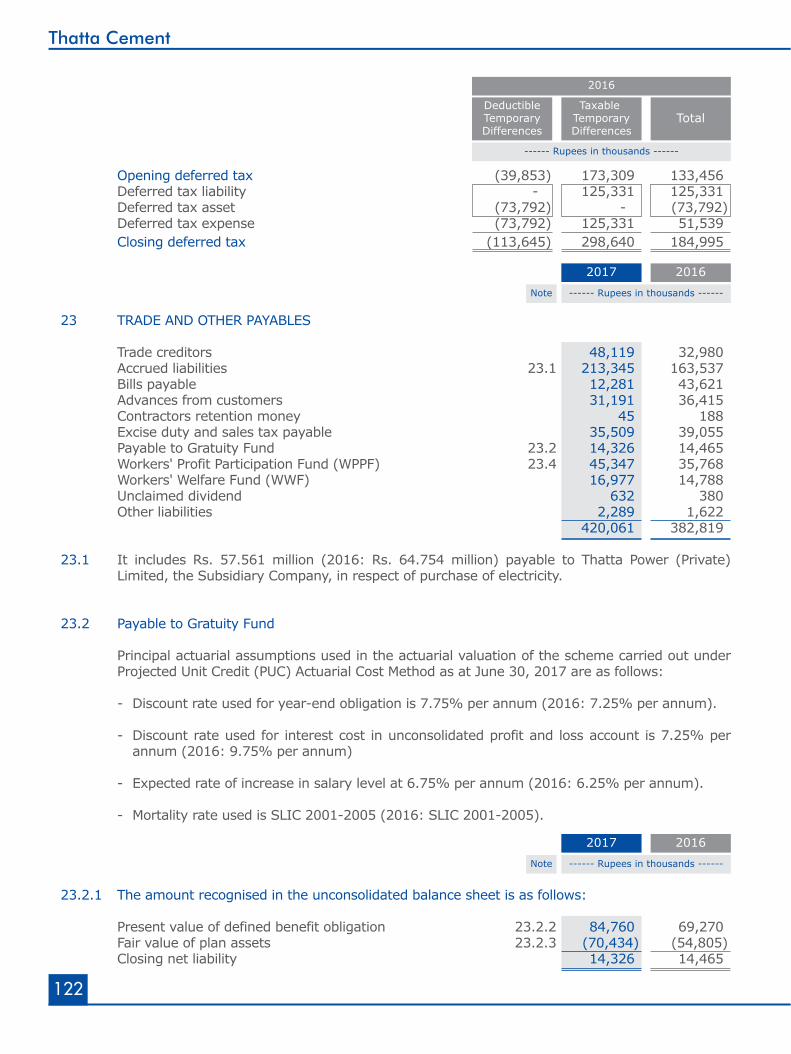
122
Thatta Cement
Opening deferred tax (39,853) 173,309 133,456 Deferred tax liability - 125,331 125,331 Deferred tax asset (73,792) - (73,792) Deferred tax expense (73,792) 125,331 51,539 Closing deferred tax (113,645) 298,640 184,995
23 TRADE AND OTHER PAYABLES Trade creditors 48,119 32,980 Accrued liabilities 23.1 213,345 163,537 Bills payable 12,281 43,621 Advances from customers 31,191 36,415 Contractors retention money 45 188 Excise duty and sales tax payable 35,509 39,055 Payable to Gratuity Fund 23.2 14,326 14,465 Workers' Profit Participation Fund (WPPF) 23.4 45,347 35,768 Workers' Welfare Fund (WWF) 16,977 14,788 Unclaimed dividend 632 380 Other liabilities 2,289 1,622 420,061 382,819 23.1 It includes Rs. 57.561 million (2016: Rs. 64.754 million) payable to Thatta Power (Private)
Limited, the Subsidiary Company, in respect of purchase of electricity.
23.2 Payable to Gratuity Fund Principal actuarial assumptions used in the actuarial valuation of the scheme carried out under
Projected Unit Credit (PUC) Actuarial Cost Method as at June 30, 2017 are as follows:
- Discount rate used for year-end obligation is 7.75% per annum (2016: 7.25% per annum).
- Discount rate used for interest cost in unconsolidated profit and loss account is 7.25% per annum (2016: 9.75% per annum)
- Expected rate of increase in salary level at 6.75% per annum (2016: 6.25% per annum).
- Mortality rate used is SLIC 2001-2005 (2016: SLIC 2001-2005).
23.2.1 The amount recognised in the unconsolidated balance sheet is as follows:
Present value of defined benefit obligation 23.2.2 84,760 69,270 Fair value of plan assets 23.2.3 (70,434) (54,805) Closing net liability 14,326 14,465
------ Rupees in thousands ------
2016
Taxable TemporaryDifferences
TotalDeductibleTemporaryDifferences
------ Rupees in thousands ------Note
2017 2016
------ Rupees in thousands ------Note
2017 2016
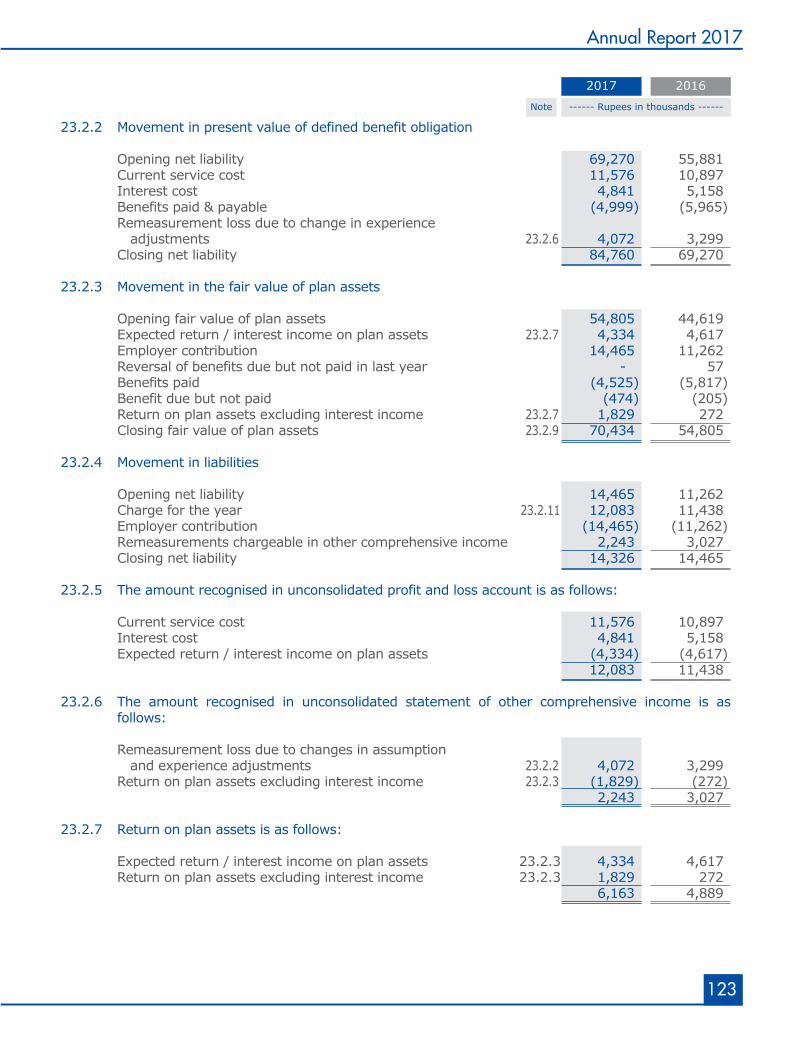
123
Annual Report 2017
23.2.2 Movement in present value of defined benefit obligation
Opening net liability 69,270 55,881 Current service cost 11,576 10,897 Interest cost 4,841 5,158 Benefits paid & payable (4,999) (5,965) Remeasurement loss due to change in experience adjustments 23.2.6 4,072 3,299 Closing net liability 84,760 69,270 23.2.3 Movement in the fair value of plan assets Opening fair value of plan assets 54,805 44,619 Expected return / interest income on plan assets 23.2.7 4,334 4,617 Employer contribution 14,465 11,262 Reversal of benefits due but not paid in last year - 57 Benefits paid (4,525) (5,817) Benefit due but not paid (474) (205) Return on plan assets excluding interest income 23.2.7 1,829 272 Closing fair value of plan assets 23.2.9 70,434 54,805 23.2.4 Movement in liabilities Opening net liability 14,465 11,262 Charge for the year 23.2.11 12,083 11,438 Employer contribution (14,465) (11,262) Remeasurements chargeable in other comprehensive income 2,243 3,027 Closing net liability 14,326 14,465 23.2.5 The amount recognised in unconsolidated profit and loss account is as follows: Current service cost 11,576 10,897 Interest cost 4,841 5,158 Expected return / interest income on plan assets (4,334) (4,617) 12,083 11,438 23.2.6 The amount recognised in unconsolidated statement of other comprehensive income is as
follows: Remeasurement loss due to changes in assumption and experience adjustments 23.2.2 4,072 3,299 Return on plan assets excluding interest income 23.2.3 (1,829) (272) 2,243 3,027
23.2.7 Return on plan assets is as follows: Expected return / interest income on plan assets 23.2.3 4,334 4,617 Return on plan assets excluding interest income 23.2.3 1,829 272 6,163 4,889
------ Rupees in thousands ------Note
2017 2016
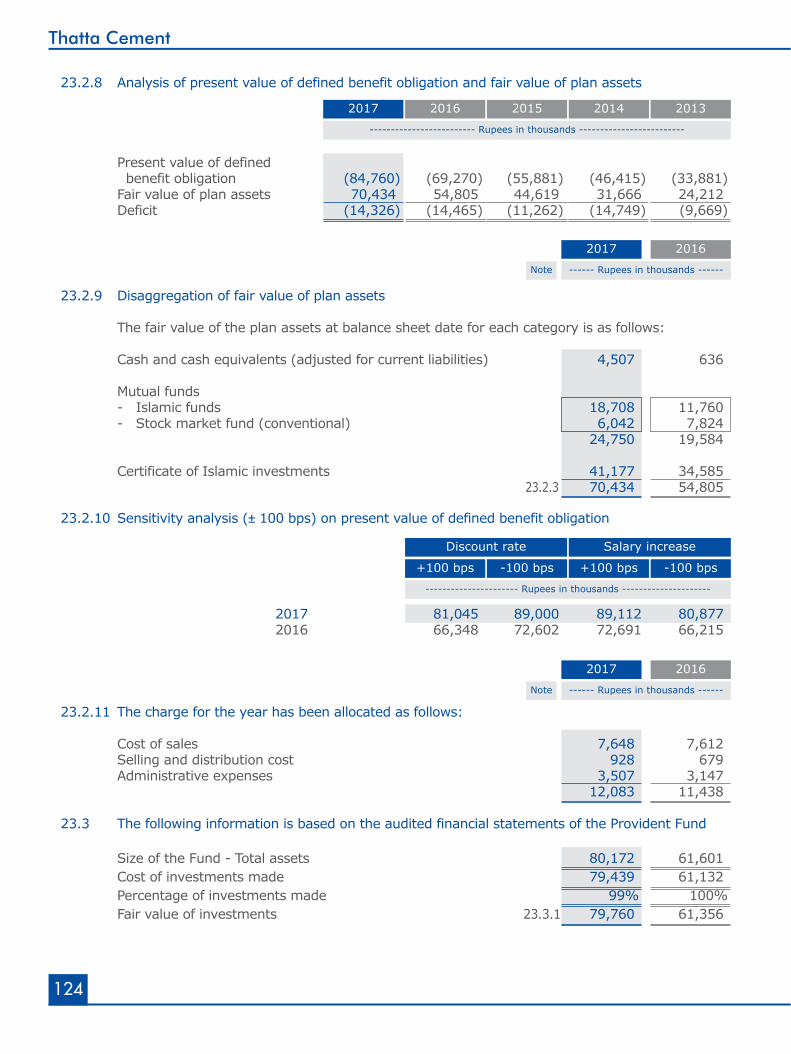
124
Thatta Cement
23.2.11 The charge for the year has been allocated as follows: Cost of sales 7,648 7,612 Selling and distribution cost 928 679 Administrative expenses 3,507 3,147 12,083 11,438 23.3 The following information is based on the audited financial statements of the Provident Fund
Size of the Fund - Total assets 80,172 61,601 Cost of investments made 79,439 61,132 Percentage of investments made 99% 100% Fair value of investments 23.3.1 79,760 61,356
------ Rupees in thousands ------Note
2017 2016
23.2.9 Disaggregation of fair value of plan assets
The fair value of the plan assets at balance sheet date for each category is as follows:
Cash and cash equivalents (adjusted for current liabilities) 4,507 636 Mutual funds - Islamic funds 18,708 11,760 - Stock market fund (conventional) 6,042 7,824 24,750 19,584 Certificate of Islamic investments 41,177 34,585 23.2.3 70,434 54,805
------ Rupees in thousands ------Note
2017 2016
23.2.8 Analysis of present value of defined benefit obligation and fair value of plan assets
Present value of defined benefit obligation (84,760) (69,270) (55,881) (46,415) (33,881) Fair value of plan assets 70,434 54,805 44,619 31,666 24,212 Deficit (14,326) (14,465) (11,262) (14,749) (9,669)
------------------------- Rupees in thousands -------------------------
20132014201520162017
23.2.10 Sensitivity analysis (± 100 bps) on present value of defined benefit obligation
2017 81,045 89,000 89,112 80,877 2016 66,348 72,602 72,691 66,215
---------------------- Rupees in thousands ---------------------
-100 bps+100 bps-100 bps+100 bps
Discount rate Salary increase
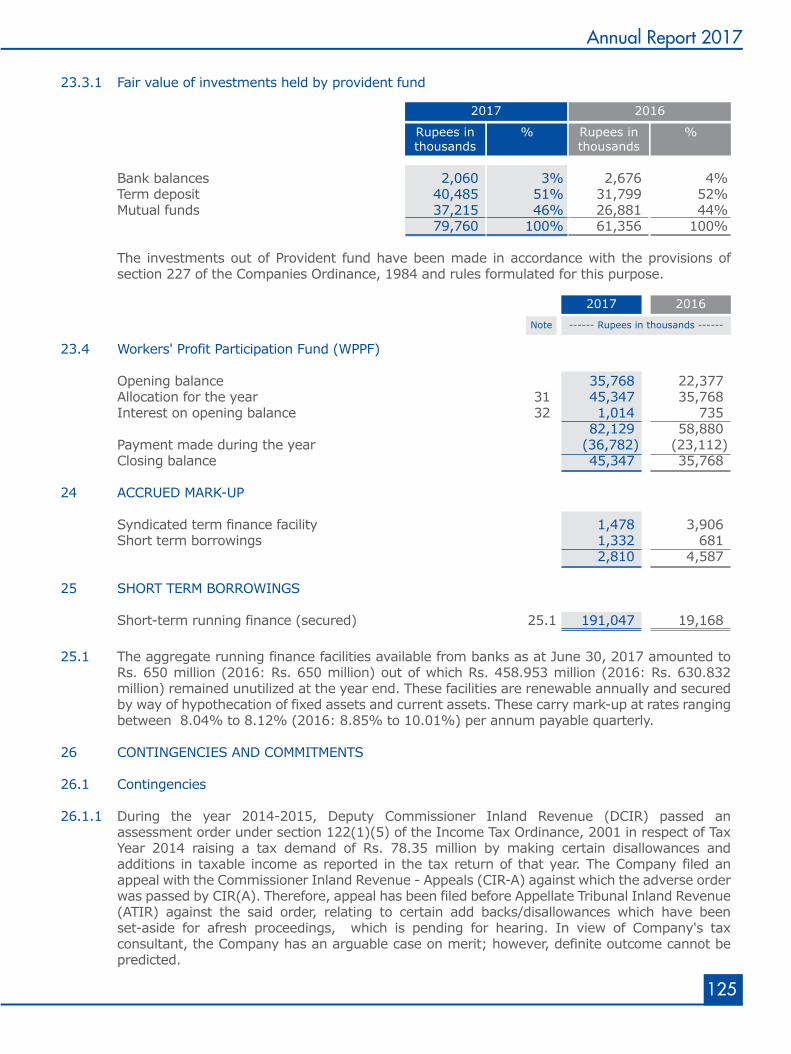
125
Annual Report 2017
------ Rupees in thousands ------Note
2017 2016
25.1 The aggregate running finance facilities available from banks as at June 30, 2017 amounted to Rs. 650 million (2016: Rs. 650 million) out of which Rs. 458.953 million (2016: Rs. 630.832 million) remained unutilized at the year end. These facilities are renewable annually and secured by way of hypothecation of fixed assets and current assets. These carry mark-up at rates ranging between 8.04% to 8.12% (2016: 8.85% to 10.01%) per annum payable quarterly.
26 CONTINGENCIES AND COMMITMENTS 26.1 Contingencies 26.1.1 During the year 2014-2015, Deputy Commissioner Inland Revenue (DCIR) passed an
assessment order under section 122(1)(5) of the Income Tax Ordinance, 2001 in respect of Tax Year 2014 raising a tax demand of Rs. 78.35 million by making certain disallowances and additions in taxable income as reported in the tax return of that year. The Company filed an appeal with the Commissioner Inland Revenue - Appeals (CIR-A) against which the adverse order was passed by CIR(A). Therefore, appeal has been filed before Appellate Tribunal Inland Revenue (ATIR) against the said order, relating to certain add backs/disallowances which have been set-aside for afresh proceedings, which is pending for hearing. In view of Company's tax consultant, the Company has an arguable case on merit; however, definite outcome cannot be predicted.
23.4 Workers' Profit Participation Fund (WPPF)
Opening balance 35,768 22,377 Allocation for the year 31 45,347 35,768 Interest on opening balance 32 1,014 735 82,129 58,880 Payment made during the year (36,782) (23,112) Closing balance 45,347 35,768 24 ACCRUED MARK-UP Syndicated term finance facility 1,478 3,906 Short term borrowings 1,332 681 2,810 4,587 25 SHORT TERM BORROWINGS Short-term running finance (secured) 25.1 191,047 19,168
23.3.1 Fair value of investments held by provident fund
Bank balances 2,060 3% 2,676 4% Term deposit 40,485 51% 31,799 52% Mutual funds 37,215 46% 26,881 44% 79,760 100% 61,356 100% The investments out of Provident fund have been made in accordance with the provisions of
section 227 of the Companies Ordinance, 1984 and rules formulated for this purpose.
%Rupees inthousands
%Rupees inthousands
2017 2016
126
Thatta Cement
26.1.2 The Company has adjusted minimum tax aggregating to Rs. 31.47 million against its income tax liability in terms of section 113(2)(c) of the Income Tax Ordinance, 2001 (the Ordinance). An appeal was filed in 2014-2015 before the Commissioner Inland Revenue - Appeals (CIR-A) against the order of the Assessing Officer disallowing adjustment of minimum tax amounting to Rs. 15.721 million in respect of Tax Year 2012. However, the appeal before CIR-A has been decided against the Company, therefore, further appeal has been filed before Appellate Tribunal Inland Revenue (ATIR) against the order of CIR-A which is pending for hearing.
Moreover, in view of Company's legal counsel, the Company has strong arguable case and the
matter can be agitated upto the level of Supreme Court of Pakistan. Hence, no provision in this respect has been made in these unconsolidated financial statements.
26.1.3 In respect of Tax Year 2008, an appeal was filed in 2014-2015 before Commissioner Inland
Revenue - Appeals (CIR-A) against certain disallowances and additions in taxable income while passing assessment order under 122(5A) of the Income Tax Ordinance, 2001, thereby raising a tax demand of Rs. 2.787 million. The appeal has been heard, however order of CIR-A is pending. The management is confident that the Company has an arguable case on merits, however definite outcome cannot be predicted. Hence, no provision is required to be made in these unconsolidated financial statements.
26.1.4 The Deputy Commissioner Inland Revenue (DCIR) has passed Assessment Orders in 2014-2015
raising an aggregate sales tax demand for Rs. 5.989 million by disallowing certain input tax claimed by the Company in its sales tax return for tax period from July 2012 to February 2015. The Company had filed appeals against such Assessment Orders before Commissioner Inland Revenue (CIR-A) who has passed orders aggregating to Rs. 5.91 million in favor of the Company. The Tax department has filed appeals against the said orders before Appellate Tribunal Inland Revenue (ATIR) which are pending for hearing. In view of Company's tax consultant, favourable outcome of such appeals are anticipated; hence no provision is required to be made in these unconsolidated financial statements.
26.1.5 In respect of tax periods from July 2012 to December 2014, an Order in Original (ONO) has been
issued by an Officer of Sales Tax in 2014-2015 against the Company raising a demand of Rs. 244.274 million which is mainly based on comparison of industry average for fuel and power consumption with that of the Company and thereby presuming the production quantities which in the view of tax authorities have not been subject to Sales Tax and Federal Excise Duty. Accordingly, the Company has filed an appeal before Commissioner Inland Revenue - Appeals (CIR-A) against the ONO passed by the Officer of Sales Tax, however CIR-A decided the case against the Company. Accordingly, the Company has filed an appeal before the Appellate Tribunal Inland Revenue (ATIR) against the order of CIR-A. Moreover, recovery proceedings were also initiated by tax authorities in the matter for an aggregate demand amount of Rs 488.548 million including 100% penalty on the principal amount as aforesaid. Therefore, the Company filed a stay application against the said aggregate demand before Sindh High Court. The Sindh High Court has allowed ad interim relief against recovery of demand and refrained tax authorities to take any adverse action in this respect. During the year ended June 30, 2017, Appellate Tribunal Inland Revenue (ATIR) has passed an order in favor of the Company. However, the aggrieved party i.e. Commissioner Inland Revenue, Zone II, Large Taxpayer Unit, Karachi has an option to file an appeal against the appellate order passed by ATIR in favor of the Company before appellate court.
26.1.6 Certain ex-employees of the Company contested the Company's gratuity policy of 30 days and
filed a Suit against the Company demanding 60 days gratuity as applicable to the employees of former holding company having an impact of Rs. 14.9 million. The said Suit has been decided in favour of the applicants. However, the Company challenged the said order vide C.P. no. 591/2013, before the Sindh High Court at Hyderabad and later on filed Labour Appeal No. 04/2014, before the Sindh Labour Court No. VI at Hyderabad being the Court of appropriate jurisdiction. After dismissal of the said appeal, a revision application has been filed before the
127
Annual Report 2017
Sindh Labour Appellate Tribunal, Karachi. The Tribunal also dismissed the appeal and hence C.P. no. D - 2636 has been filed before the Honourable High Court of Sindh at Hyderabad wherein stay has been granted by the High Court. The matter is pending for disposal. In view of the Company's legal counsel, no definite outcome can be anticipated but the Company has a good case.
26.1.7 An ex-employee of the former holding company had filed CP # 86/2013 for recovery of Rs. 2.10
million out of which an amount of Rs. 0.248 million has been claimed on account of 60 days gratuity and numerous other false and fabricated claims of short payments of Rs. 1.86 million. In view of the Company's legal counsel, the Company has a good case whereas no definite outcome can be estimated.
26.1.8 Ex-workers of Labour Contractor had filed applications against the Company before the Labour Court at Hyderabad for reinstatement of their services which were not maintainable therefore, dismissed by the Court. The decision has been challenged vide Appeal no. Hyd-25/2016, Hyd-26/2016, Hyd-27/2016 and Hyd-28/2016 before the Sindh Labour Appellate Tribunal in Karachi and the matter is subjudice. According to Company's legal counsel opinion, the appeals are time barred and are also not fit for grant of any relief, therefore, ultimately these are liable to be dismissed.
26.1.9 During the year , an ex-employee of the Company has filed a Suit no. 51/2017 for recovery of damages, salaries and mesne profit of Rs. 197 million in the High Court of Sindh. The said ex- employee was dismissed from the Company's service on November 1, 1999 due to involvement in serious acts of misconduct. The said person has challenged the dismissal before different forums including High Court of Sindh, Federal Services Tribunal and the Supreme Court of Pakistan and lost all the cases. In view of Company's legal counsel, this litigation will also lead to the same fate as detailed above.
26.1.10 Two cement dealers had filed Suit no. 150/2001 & 151/2001 against the Company for Rs. 6.5
million and Rs. 1.5 million respectively being value of trucks which were handed over to the Company in lieu of outstanding dues from these dealers. The Company's legal counsel is of the opinion that no unfavourable outcome can be estimated.
26.2 Commitments 26.2.1 Guarantee given by a commercial bank to Sui Southern Gas Company Limited on behalf of the
Company amounts to Rs. 45 million (2016: Rs. 45 million). 26.2.2 Other outstanding guarantees given on behalf of the Company by banks amounts to Rs. 25.204
million (2016: Rs. 40.408 million). 26.2.3 Irrevocable letter of credit under revenue & capital expenditure as on balance sheet date were
Rs. 133.011 million (2016: Nil ) & Rs. 66.248 million (2016: Rs. 4.852 million) respectively.
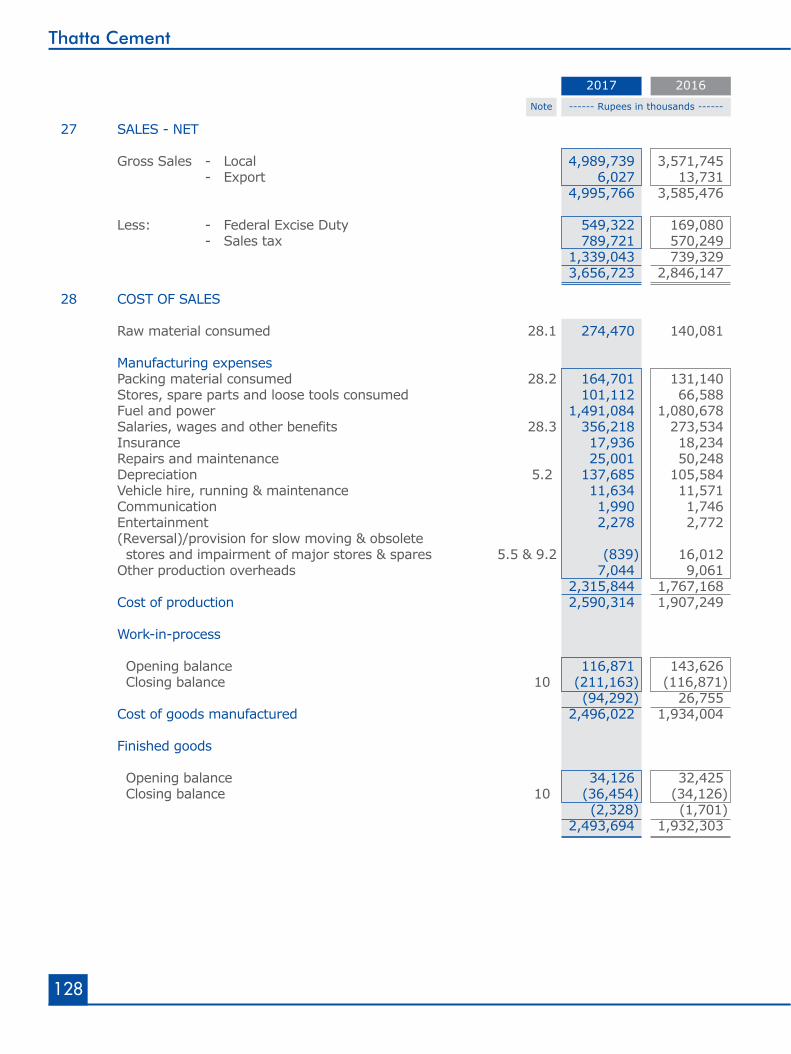
128
Thatta Cement
28 COST OF SALES Raw material consumed 28.1 274,470 140,081 Manufacturing expenses Packing material consumed 28.2 164,701 131,140 Stores, spare parts and loose tools consumed 101,112 66,588 Fuel and power 1,491,084 1,080,678 Salaries, wages and other benefits 28.3 356,218 273,534 Insurance 17,936 18,234 Repairs and maintenance 25,001 50,248 Depreciation 5.2 137,685 105,584 Vehicle hire, running & maintenance 11,634 11,571 Communication 1,990 1,746 Entertainment 2,278 2,772 (Reversal)/provision for slow moving & obsolete stores and impairment of major stores & spares 5.5 & 9.2 (839) 16,012 Other production overheads 7,044 9,061 2,315,844 1,767,168 Cost of production 2,590,314 1,907,249 Work-in-process Opening balance 116,871 143,626 Closing balance 10 (211,163) (116,871) (94,292) 26,755 Cost of goods manufactured 2,496,022 1,934,004 Finished goods Opening balance 34,126 32,425 Closing balance 10 (36,454) (34,126) (2,328) (1,701) 2,493,694 1,932,303
------ Rupees in thousands ------Note
2017 2016
27 SALES - NET
Gross Sales - Local 4,989,739 3,571,745 - Export 6,027 13,731 4,995,766 3,585,476 Less: - Federal Excise Duty 549,322 169,080 - Sales tax 789,721 570,249 1,339,043 739,329 3,656,723 2,846,147
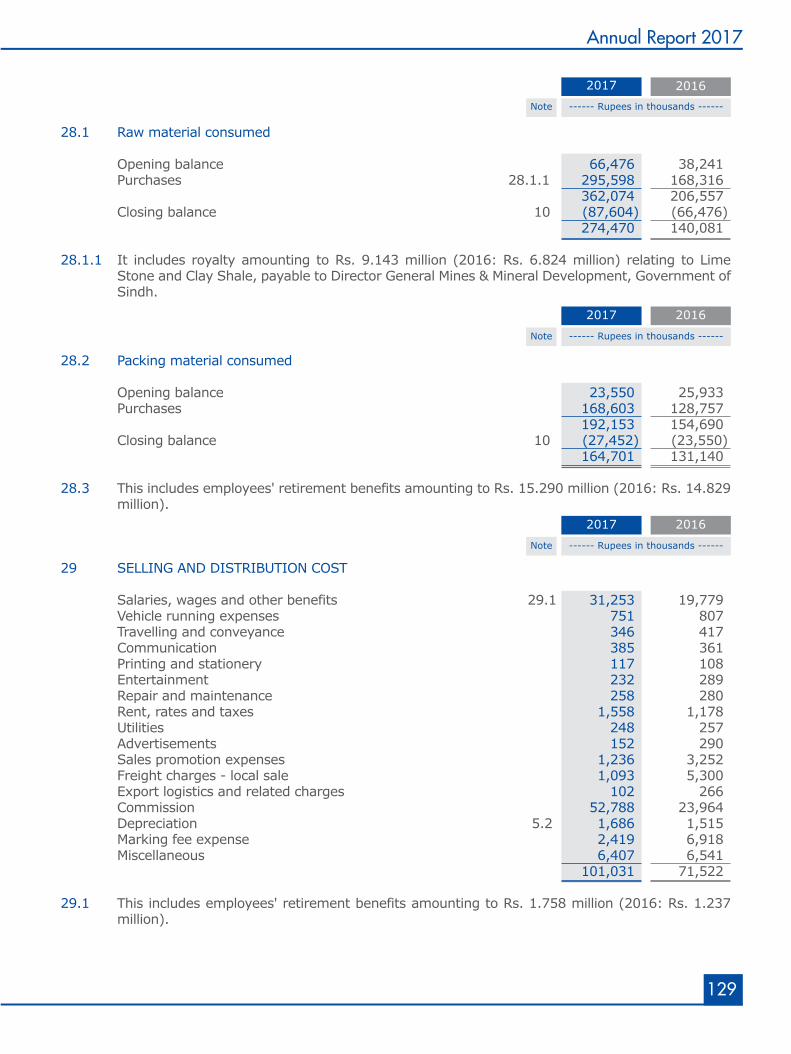
28.2 Packing material consumed Opening balance 23,550 25,933 Purchases 168,603 128,757 192,153 154,690 Closing balance 10 (27,452) (23,550) 164,701 131,140 28.3 This includes employees' retirement benefits amounting to Rs. 15.290 million (2016: Rs. 14.829
million).
29 SELLING AND DISTRIBUTION COST Salaries, wages and other benefits 29.1 31,253 19,779 Vehicle running expenses 751 807 Travelling and conveyance 346 417 Communication 385 361 Printing and stationery 117 108 Entertainment 232 289 Repair and maintenance 258 280 Rent, rates and taxes 1,558 1,178 Utilities 248 257 Advertisements 152 290 Sales promotion expenses 1,236 3,252 Freight charges - local sale 1,093 5,300 Export logistics and related charges 102 266 Commission 52,788 23,964 Depreciation 5.2 1,686 1,515 Marking fee expense 2,419 6,918 Miscellaneous 6,407 6,541 101,031 71,522
29.1 This includes employees' retirement benefits amounting to Rs. 1.758 million (2016: Rs. 1.237 million).
129
Annual Report 2017
------ Rupees in thousands ------Note
2017 2016
------ Rupees in thousands ------Note
2017 2016
------ Rupees in thousands ------Note
2017 2016
28.1 Raw material consumed
Opening balance 66,476 38,241 Purchases 28.1.1 295,598 168,316 362,074 206,557 Closing balance 10 (87,604) (66,476) 274,470 140,081
28.1.1 It includes royalty amounting to Rs. 9.143 million (2016: Rs. 6.824 million) relating to Lime Stone and Clay Shale, payable to Director General Mines & Mineral Development, Government of Sindh.
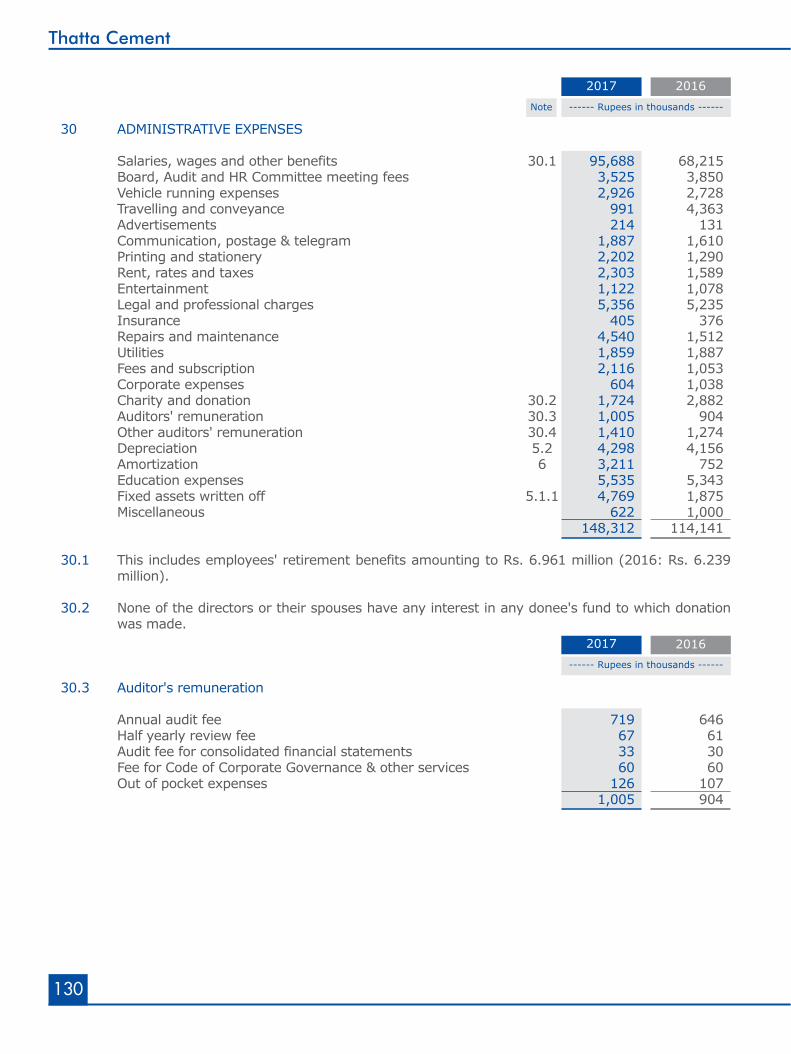
130
Thatta Cement
------ Rupees in thousands ------Note
2017 2016
------ Rupees in thousands ------
2017 2016
30 ADMINISTRATIVE EXPENSES Salaries, wages and other benefits 30.1 95,688 68,215 Board, Audit and HR Committee meeting fees 3,525 3,850 Vehicle running expenses 2,926 2,728 Travelling and conveyance 991 4,363 Advertisements 214 131 Communication, postage & telegram 1,887 1,610 Printing and stationery 2,202 1,290 Rent, rates and taxes 2,303 1,589 Entertainment 1,122 1,078 Legal and professional charges 5,356 5,235 Insurance 405 376 Repairs and maintenance 4,540 1,512 Utilities 1,859 1,887 Fees and subscription 2,116 1,053 Corporate expenses 604 1,038 Charity and donation 30.2 1,724 2,882 Auditors' remuneration 30.3 1,005 904 Other auditors' remuneration 30.4 1,410 1,274 Depreciation 5.2 4,298 4,156 Amortization 6 3,211 752 Education expenses 5,535 5,343 Fixed assets written off 5.1.1 4,769 1,875 Miscellaneous 622 1,000 148,312 114,141 30.1 This includes employees' retirement benefits amounting to Rs. 6.961 million (2016: Rs. 6.239
million). 30.2 None of the directors or their spouses have any interest in any donee's fund to which donation
was made.
30.3 Auditor's remuneration
Annual audit fee 719 646 Half yearly review fee 67 61 Audit fee for consolidated financial statements 33 30 Fee for Code of Corporate Governance & other services 60 60 Out of pocket expenses 126 107 1,005 904
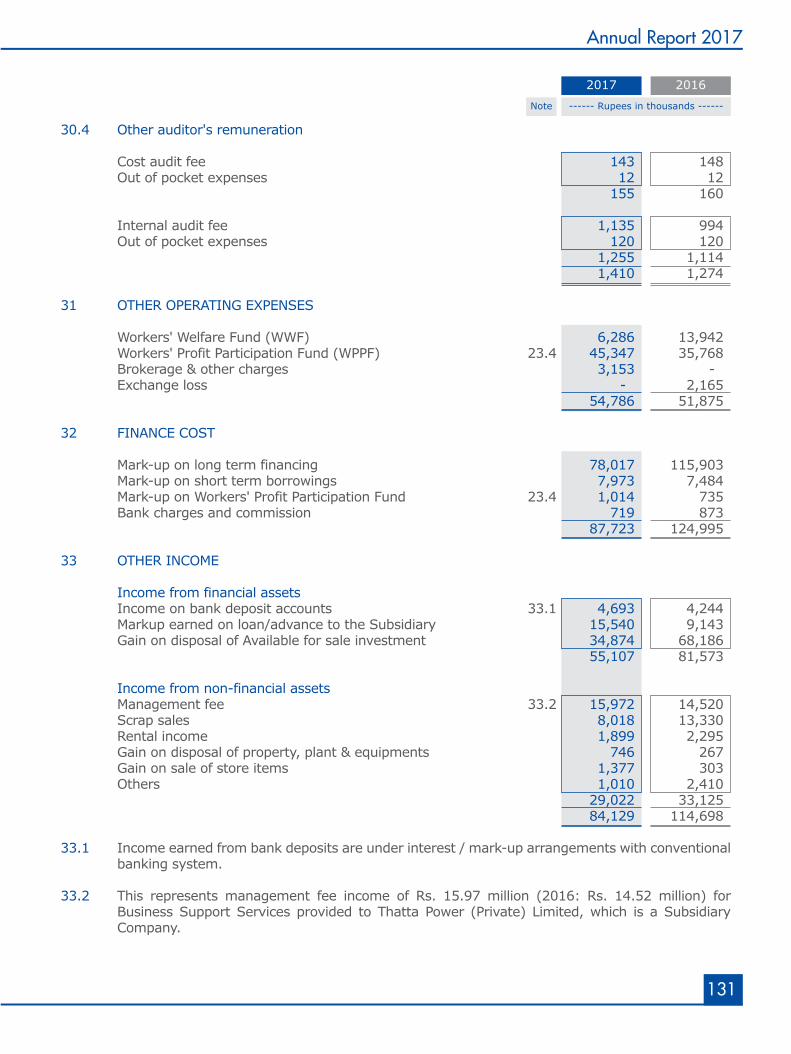
131
Annual Report 2017
------ Rupees in thousands ------Note
2017 2016
30.4 Other auditor's remuneration
Cost audit fee 143 148 Out of pocket expenses 12 12 155 160 Internal audit fee 1,135 994 Out of pocket expenses 120 120 1,255 1,114 1,410 1,274 31 OTHER OPERATING EXPENSES Workers' Welfare Fund (WWF) 6,286 13,942 Workers' Profit Participation Fund (WPPF) 23.4 45,347 35,768 Brokerage & other charges 3,153 - Exchange loss - 2,165 54,786 51,875 32 FINANCE COST Mark-up on long term financing 78,017 115,903 Mark-up on short term borrowings 7,973 7,484 Mark-up on Workers' Profit Participation Fund 23.4 1,014 735 Bank charges and commission 719 873 87,723 124,995
33 OTHER INCOME Income from financial assets Income on bank deposit accounts 33.1 4,693 4,244 Markup earned on loan/advance to the Subsidiary 15,540 9,143 Gain on disposal of Available for sale investment 34,874 68,186 55,107 81,573 Income from non-financial assets Management fee 33.2 15,972 14,520 Scrap sales 8,018 13,330 Rental income 1,899 2,295 Gain on disposal of property, plant & equipments 746 267 Gain on sale of store items 1,377 303 Others 1,010 2,410 29,022 33,125 84,129 114,698 33.1 Income earned from bank deposits are under interest / mark-up arrangements with conventional
banking system. 33.2 This represents management fee income of Rs. 15.97 million (2016: Rs. 14.52 million) for
Business Support Services provided to Thatta Power (Private) Limited, which is a Subsidiary Company.
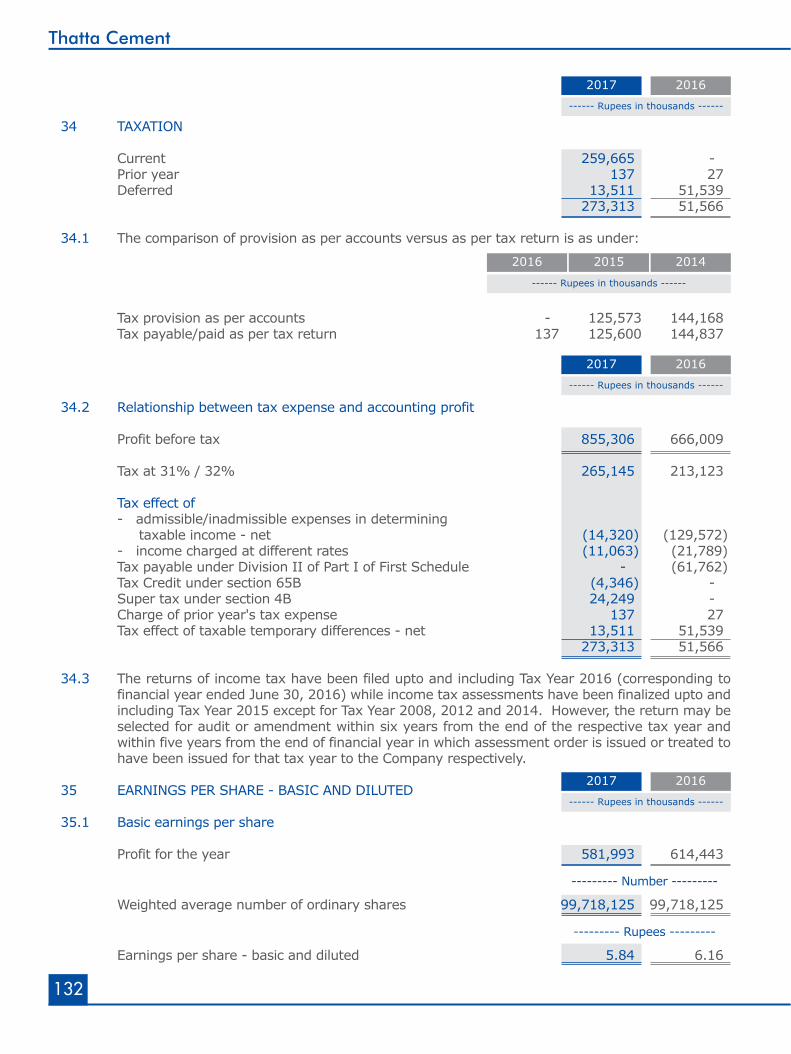
132
Thatta Cement
------ Rupees in thousands ------
2017 2016
------ Rupees in thousands ------
2017 2016
34 TAXATION Current 259,665 - Prior year 137 27 Deferred 13,511 51,539 273,313 51,566 34.1 The comparison of provision as per accounts versus as per tax return is as under:
Tax provision as per accounts - 125,573 144,168 Tax payable/paid as per tax return 137 125,600 144,837
34.2 Relationship between tax expense and accounting profit Profit before tax 855,306 666,009 Tax at 31% / 32% 265,145 213,123 Tax effect of - admissible/inadmissible expenses in determining taxable income - net (14,320) (129,572) - income charged at different rates (11,063) (21,789) Tax payable under Division II of Part I of First Schedule - (61,762) Tax Credit under section 65B (4,346) - Super tax under section 4B 24,249 - Charge of prior year's tax expense 137 27 Tax effect of taxable temporary differences - net 13,511 51,539 273,313 51,566
34.3 The returns of income tax have been filed upto and including Tax Year 2016 (corresponding to financial year ended June 30, 2016) while income tax assessments have been finalized upto and including Tax Year 2015 except for Tax Year 2008, 2012 and 2014. However, the return may be selected for audit or amendment within six years from the end of the respective tax year and within five years from the end of financial year in which assessment order is issued or treated to have been issued for that tax year to the Company respectively.
35 EARNINGS PER SHARE - BASIC AND DILUTED 35.1 Basic earnings per share
Profit for the year 581,993 614,443
--------- Number --------- Weighted average number of ordinary shares 99,718,125 99,718,125
--------- Rupees ---------
Earnings per share - basic and diluted 5.84 6.16
2015 20142016
------ Rupees in thousands ------
------ Rupees in thousands ------
2017 2016
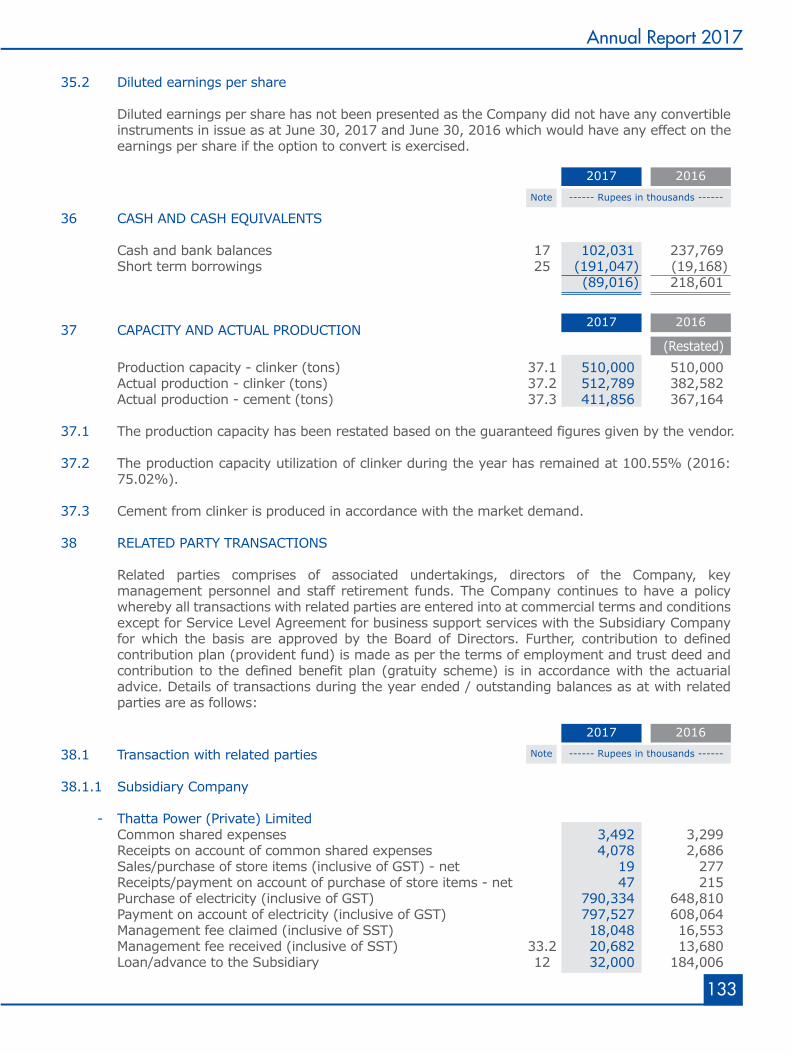
133
Annual Report 2017
35.2 Diluted earnings per share Diluted earnings per share has not been presented as the Company did not have any convertible
instruments in issue as at June 30, 2017 and June 30, 2016 which would have any effect on the earnings per share if the option to convert is exercised.
38.1 Transaction with related parties 38.1.1 Subsidiary Company
- Thatta Power (Private) Limited Common shared expenses 3,492 3,299 Receipts on account of common shared expenses 4,078 2,686 Sales/purchase of store items (inclusive of GST) - net 19 277 Receipts/payment on account of purchase of store items - net 47 215 Purchase of electricity (inclusive of GST) 790,334 648,810 Payment on account of electricity (inclusive of GST) 797,527 608,064 Management fee claimed (inclusive of SST) 18,048 16,553 Management fee received (inclusive of SST) 33.2 20,682 13,680 Loan/advance to the Subsidiary 12 32,000 184,006
------ Rupees in thousands ------Note
2017 2016
------ Rupees in thousands ------Note
2017 2016
2017 2016
36 CASH AND CASH EQUIVALENTS
Cash and bank balances 17 102,031 237,769 Short term borrowings 25 (191,047) (19,168) (89,016) 218,601
37 CAPACITY AND ACTUAL PRODUCTION (Restated) Production capacity - clinker (tons) 37.1 510,000 510,000 Actual production - clinker (tons) 37.2 512,789 382,582 Actual production - cement (tons) 37.3 411,856 367,164 37.1 The production capacity has been restated based on the guaranteed figures given by the vendor.
37.2 The production capacity utilization of clinker during the year has remained at 100.55% (2016:
75.02%). 37.3 Cement from clinker is produced in accordance with the market demand.
38 RELATED PARTY TRANSACTIONS Related parties comprises of associated undertakings, directors of the Company, key
management personnel and staff retirement funds. The Company continues to have a policy whereby all transactions with related parties are entered into at commercial terms and conditions except for Service Level Agreement for business support services with the Subsidiary Company for which the basis are approved by the Board of Directors. Further, contribution to defined contribution plan (provident fund) is made as per the terms of employment and trust deed and contribution to the defined benefit plan (gratuity scheme) is in accordance with the actuarial advice. Details of transactions during the year ended / outstanding balances as at with related parties are as follows:
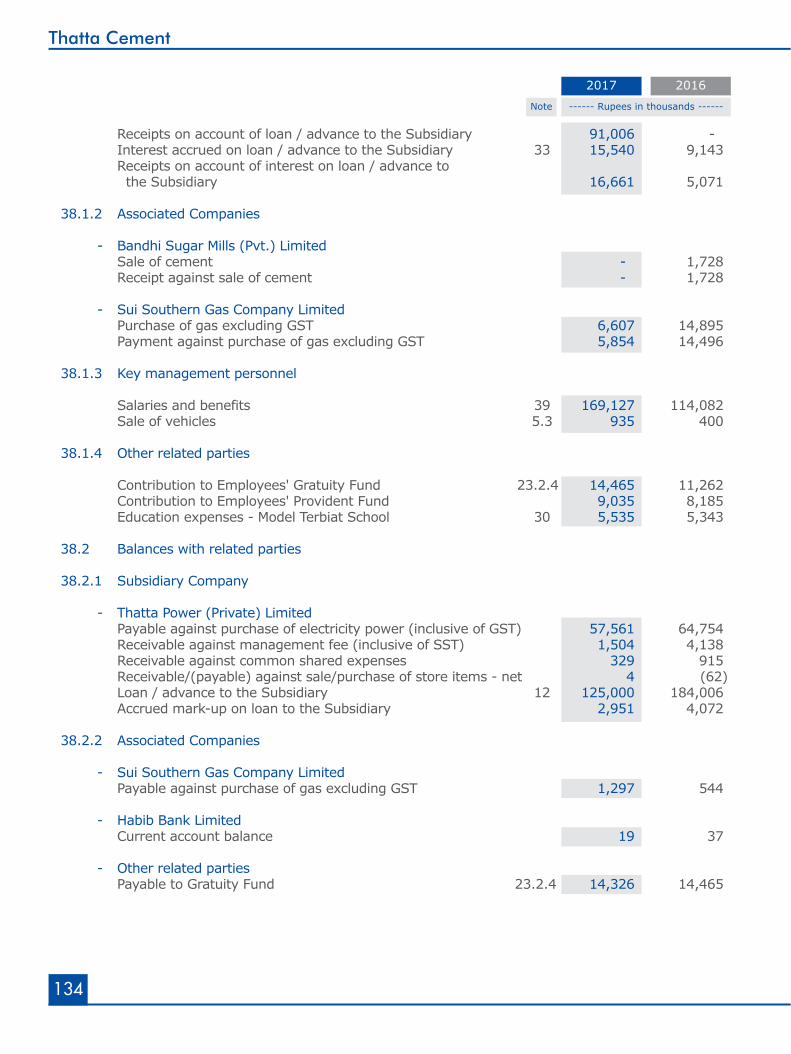
134
Thatta Cement
Receipts on account of loan / advance to the Subsidiary 91,006 - Interest accrued on loan / advance to the Subsidiary 33 15,540 9,143 Receipts on account of interest on loan / advance to the Subsidiary 16,661 5,071
38.1.2 Associated Companies
- Bandhi Sugar Mills (Pvt.) Limited Sale of cement - 1,728 Receipt against sale of cement - 1,728 - Sui Southern Gas Company Limited Purchase of gas excluding GST 6,607 14,895 Payment against purchase of gas excluding GST 5,854 14,496
38.1.3 Key management personnel
Salaries and benefits 39 169,127 114,082 Sale of vehicles 5.3 935 400 38.1.4 Other related parties
Contribution to Employees' Gratuity Fund 23.2.4 14,465 11,262 Contribution to Employees' Provident Fund 9,035 8,185 Education expenses - Model Terbiat School 30 5,535 5,343 38.2 Balances with related parties 38.2.1 Subsidiary Company
- Thatta Power (Private) Limited Payable against purchase of electricity power (inclusive of GST) 57,561 64,754 Receivable against management fee (inclusive of SST) 1,504 4,138 Receivable against common shared expenses 329 915 Receivable/(payable) against sale/purchase of store items - net 4 (62) Loan / advance to the Subsidiary 12 125,000 184,006 Accrued mark-up on loan to the Subsidiary 2,951 4,072
38.2.2 Associated Companies
- Sui Southern Gas Company Limited Payable against purchase of gas excluding GST 1,297 544 - Habib Bank Limited Current account balance 19 37 - Other related parties Payable to Gratuity Fund 23.2.4 14,326 14,465
------ Rupees in thousands ------Note
2017 2016
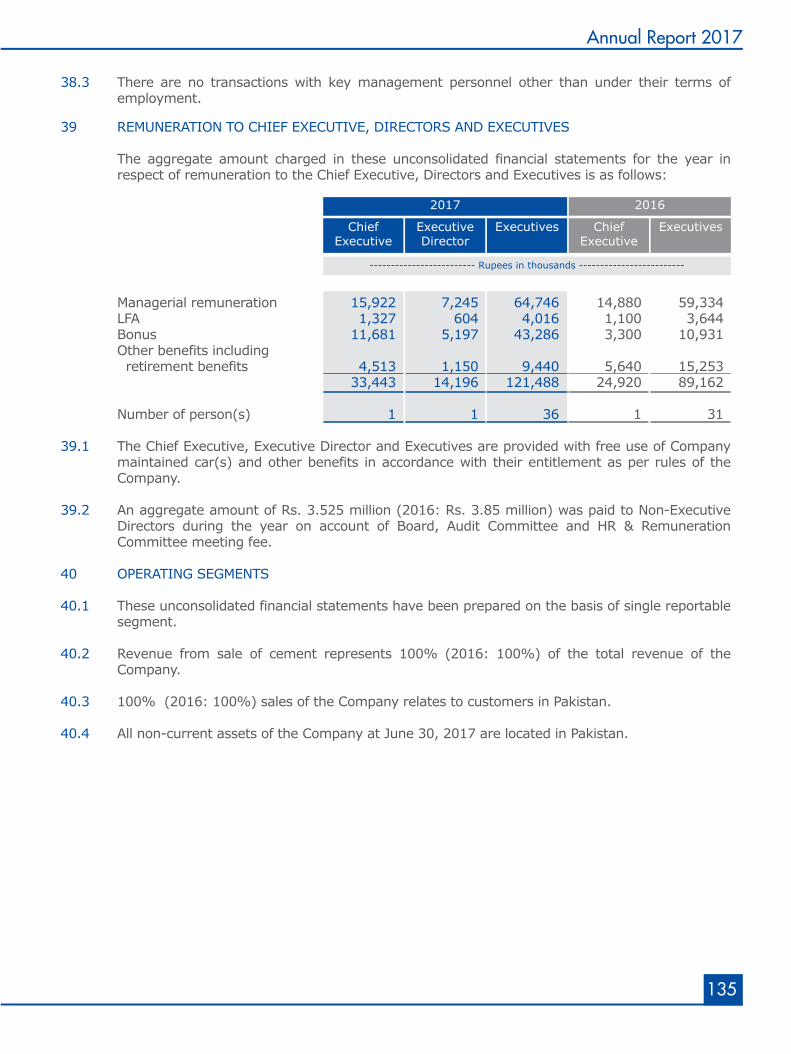
135
Annual Report 2017
38.3 There are no transactions with key management personnel other than under their terms of employment.
39 REMUNERATION TO CHIEF EXECUTIVE, DIRECTORS AND EXECUTIVES
The aggregate amount charged in these unconsolidated financial statements for the year in respect of remuneration to the Chief Executive, Directors and Executives is as follows:
Managerial remuneration 15,922 7,245 64,746 14,880 59,334 LFA 1,327 604 4,016 1,100 3,644 Bonus 11,681 5,197 43,286 3,300 10,931 Other benefits including retirement benefits 4,513 1,150 9,440 5,640 15,253 33,443 14,196 121,488 24,920 89,162 Number of person(s) 1 1 36 1 31 39.1 The Chief Executive, Executive Director and Executives are provided with free use of Company
maintained car(s) and other benefits in accordance with their entitlement as per rules of the Company.
39.2 An aggregate amount of Rs. 3.525 million (2016: Rs. 3.85 million) was paid to Non-Executive Directors during the year on account of Board, Audit Committee and HR & Remuneration Committee meeting fee.
40 OPERATING SEGMENTS 40.1 These unconsolidated financial statements have been prepared on the basis of single reportable
segment. 40.2 Revenue from sale of cement represents 100% (2016: 100%) of the total revenue of the
Company. 40.3 100% (2016: 100%) sales of the Company relates to customers in Pakistan.
40.4 All non-current assets of the Company at June 30, 2017 are located in Pakistan.
------------------------- Rupees in thousands -------------------------
2017 2016
ExecutivesChiefExecutive
ExecutivesExecutiveDirector
ChiefExecutive
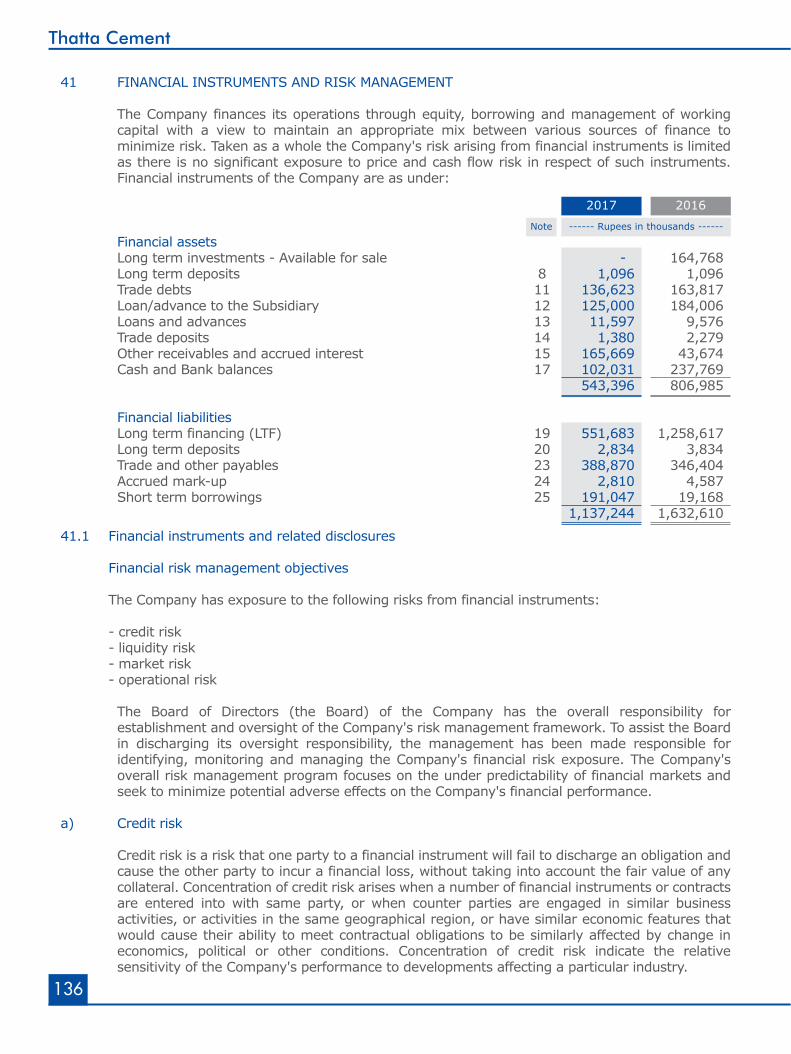
136
Thatta Cement
41.1 Financial instruments and related disclosures
Financial risk management objectives
The Company has exposure to the following risks from financial instruments:
- credit risk - liquidity risk - market risk - operational risk The Board of Directors (the Board) of the Company has the overall responsibility for
establishment and oversight of the Company's risk management framework. To assist the Board in discharging its oversight responsibility, the management has been made responsible for identifying, monitoring and managing the Company's financial risk exposure. The Company's overall risk management program focuses on the under predictability of financial markets and seek to minimize potential adverse effects on the Company's financial performance.
a) Credit risk Credit risk is a risk that one party to a financial instrument will fail to discharge an obligation and
cause the other party to incur a financial loss, without taking into account the fair value of any collateral. Concentration of credit risk arises when a number of financial instruments or contracts are entered into with same party, or when counter parties are engaged in similar business activities, or activities in the same geographical region, or have similar economic features that would cause their ability to meet contractual obligations to be similarly affected by change in economics, political or other conditions. Concentration of credit risk indicate the relative sensitivity of the Company's performance to developments affecting a particular industry.
41 FINANCIAL INSTRUMENTS AND RISK MANAGEMENT The Company finances its operations through equity, borrowing and management of working
capital with a view to maintain an appropriate mix between various sources of finance to minimize risk. Taken as a whole the Company's risk arising from financial instruments is limited as there is no significant exposure to price and cash flow risk in respect of such instruments. Financial instruments of the Company are as under:
Financial assets Long term investments - Available for sale - 164,768 Long term deposits 8 1,096 1,096 Trade debts 11 136,623 163,817 Loan/advance to the Subsidiary 12 125,000 184,006 Loans and advances 13 11,597 9,576 Trade deposits 14 1,380 2,279 Other receivables and accrued interest 15 165,669 43,674 Cash and Bank balances 17 102,031 237,769 543,396 806,985 Financial liabilities Long term financing (LTF) 19 551,683 1,258,617 Long term deposits 20 2,834 3,834 Trade and other payables 23 388,870 346,404 Accrued mark-up 24 2,810 4,587 Short term borrowings 25 191,047 19,168 1,137,244 1,632,610
------ Rupees in thousands ------Note
2017 2016
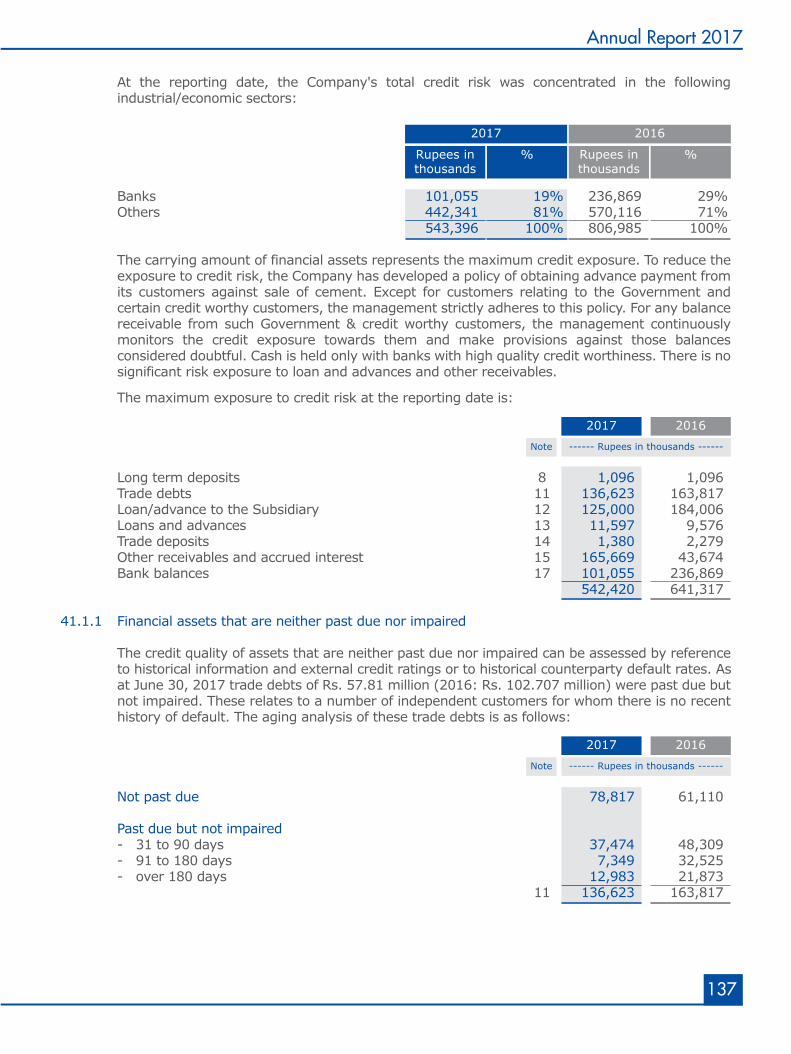
137
Annual Report 2017
At the reporting date, the Company's total credit risk was concentrated in the following industrial/economic sectors:
The maximum exposure to credit risk at the reporting date is:
Long term deposits 8 1,096 1,096 Trade debts 11 136,623 163,817 Loan/advance to the Subsidiary 12 125,000 184,006 Loans and advances 13 11,597 9,576 Trade deposits 14 1,380 2,279 Other receivables and accrued interest 15 165,669 43,674 Bank balances 17 101,055 236,869 542,420 641,317 41.1.1 Financial assets that are neither past due nor impaired The credit quality of assets that are neither past due nor impaired can be assessed by reference
to historical information and external credit ratings or to historical counterparty default rates. As at June 30, 2017 trade debts of Rs. 57.81 million (2016: Rs. 102.707 million) were past due but
not impaired. These relates to a number of independent customers for whom there is no recent history of default. The aging analysis of these trade debts is as follows:
Not past due 78,817 61,110 Past due but not impaired - 31 to 90 days 37,474 48,309 - 91 to 180 days 7,349 32,525 - over 180 days 12,983 21,873 11 136,623 163,817
------ Rupees in thousands ------Note
2017 2016
%Rupees inthousands
%Rupees inthousands
2017 2016
Banks 101,055 19% 236,869 29% Others 442,341 81% 570,116 71% 543,396 100% 806,985 100% The carrying amount of financial assets represents the maximum credit exposure. To reduce the
exposure to credit risk, the Company has developed a policy of obtaining advance payment from its customers against sale of cement. Except for customers relating to the Government and certain credit worthy customers, the management strictly adheres to this policy. For any balance receivable from such Government & credit worthy customers, the management continuously monitors the credit exposure towards them and make provisions against those balances considered doubtful. Cash is held only with banks with high quality credit worthiness. There is no significant risk exposure to loan and advances and other receivables.
------ Rupees in thousands ------Note
2017 2016
------ Rupees in thousands ------Note
2017 2016
138
Thatta Cement
The credit quality of cash at bank (in Current, PLS and deposit accounts) as per credit rating agencies is as follows:
Rating A1 + 99,657 165,434 A1 1,367 71,403 A2 31 32 17 101,055 236,869
Due to Company's long standing relationship with these counterparties and after giving due consideration to their strong financial standing, management does not expect non-performance by these counterparties on their obligation to the Company. For trade debts, internal risk assessment process determines the credit quality of the customer, taking into account its financial position, past experience and other factors. Individual risk limits are fixed based on internal or external ratings in accordance with limits set by the management. The utilization of said limits is regularly monitored.
Financial assets that are past due or impaired The credit quality of financial assets that are past due or impaired can be assessed by reference
to note 11.1. The aging analysis of these impaired trade debts is as follows:
Over ten years 72,028 72,028 b) Liquidity risk and management Liquidity risk is the risk that the Company will encounter difficulty in meeting its financial
obligations as they fall due. Liquidity risk arises because of the possibility that the Company could be required to pay its liabilities earlier than expected or may face difficulty in raising funds to meet commitments associated with financial liabilities as they fall due.
The Company is exposed to liquidity risk in respect of non-current interest bearing liabilities, long
term deposit, short term borrowings, trade and other payable and mark-up accrued. The Company's approach to manage liquidity is to ensure, as far as possible, that it will always
have sufficient liquidity to meet its liabilities when due, under both normal and stressed conditions, without incurring unacceptable losses or risking damage to the Company's reputation.
Management closely monitors the Company's liquidity and cash flow position. This includes
maintenance of balance sheet liquidity ratios, debtors and creditors concentration both in terms of the overall funding mix and avoidance of undue reliance on large individual customers.
------ Rupees in thousands ------
2017 2016
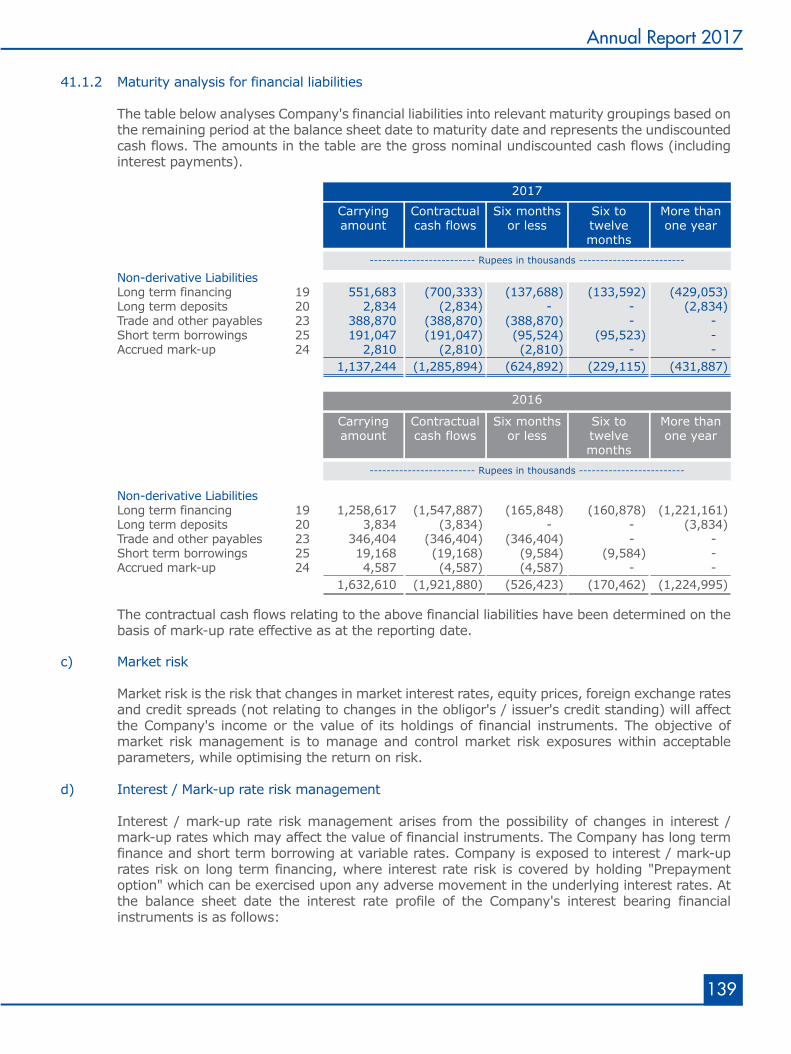
139
Annual Report 2017
------------------------- Rupees in thousands -------------------------
2017
More thanone year
Six totwelvemonths
Six monthsor less
Contractualcash flows
Carryingamount
------------------------- Rupees in thousands -------------------------
2016
More thanone year
Six totwelvemonths
Six monthsor less
Contractualcash flows
Carryingamount
c) Market risk Market risk is the risk that changes in market interest rates, equity prices, foreign exchange rates
and credit spreads (not relating to changes in the obligor's / issuer's credit standing) will affect the Company's income or the value of its holdings of financial instruments. The objective of market risk management is to manage and control market risk exposures within acceptable parameters, while optimising the return on risk.
d) Interest / Mark-up rate risk management Interest / mark-up rate risk management arises from the possibility of changes in interest /
mark-up rates which may affect the value of financial instruments. The Company has long term finance and short term borrowing at variable rates. Company is exposed to interest / mark-up rates risk on long term financing, where interest rate risk is covered by holding "Prepayment option" which can be exercised upon any adverse movement in the underlying interest rates. At the balance sheet date the interest rate profile of the Company's interest bearing financial instruments is as follows:
41.1.2 Maturity analysis for financial liabilities The table below analyses Company's financial liabilities into relevant maturity groupings based on
the remaining period at the balance sheet date to maturity date and represents the undiscounted cash flows. The amounts in the table are the gross nominal undiscounted cash flows (including interest payments).
Non-derivative Liabilities Long term financing 19 551,683 (700,333) (137,688) (133,592) (429,053) Long term deposits 20 2,834 (2,834) - - (2,834) Trade and other payables 23 388,870 (388,870) (388,870) - - Short term borrowings 25 191,047 (191,047) (95,524) (95,523) - Accrued mark-up 24 2,810 (2,810) (2,810) - - 1,137,244 (1,285,894) (624,892) (229,115) (431,887)
Non-derivative Liabilities Long term financing 19 1,258,617 (1,547,887) (165,848) (160,878) (1,221,161) Long term deposits 20 3,834 (3,834) - - (3,834) Trade and other payables 23 346,404 (346,404) (346,404) - - Short term borrowings 25 19,168 (19,168) (9,584) (9,584) - Accrued mark-up 24 4,587 (4,587) (4,587) - - 1,632,610 (1,921,880) (526,423) (170,462) (1,224,995) The contractual cash flows relating to the above financial liabilities have been determined on the
basis of mark-up rate effective as at the reporting date.
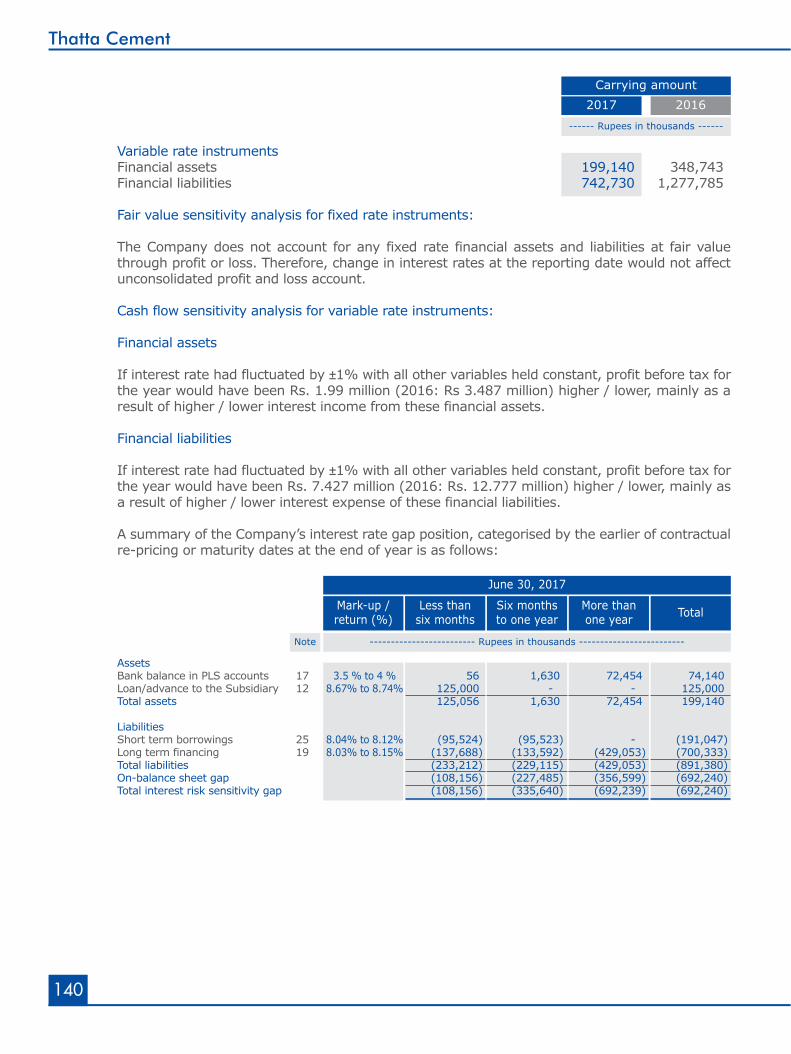
------ Rupees in thousands ------
Carrying amount2017 2016
140
Thatta Cement
Assets Bank balance in PLS accounts 17 3.5 % to 4 % 56 1,630 72,454 74,140 Loan/advance to the Subsidiary 12 8.67% to 8.74% 125,000 - - 125,000 Total assets 125,056 1,630 72,454 199,140 Liabilities Short term borrowings 25 8.04% to 8.12% (95,524) (95,523) - (191,047) Long term financing 19 8.03% to 8.15% (137,688) (133,592) (429,053) (700,333) Total liabilities (233,212) (229,115) (429,053) (891,380) On-balance sheet gap (108,156) (227,485) (356,599) (692,240) Total interest risk sensitivity gap (108,156) (335,640) (692,239) (692,240)
------------------------- Rupees in thousands -------------------------
June 30, 2017
TotalMore thanone year
Six monthsto one year
Less thansix months
Mark-up /return (%)
Note
Variable rate instruments Financial assets 199,140 348,743 Financial liabilities 742,730 1,277,785 Fair value sensitivity analysis for fixed rate instruments: The Company does not account for any fixed rate financial assets and liabilities at fair value
through profit or loss. Therefore, change in interest rates at the reporting date would not affect unconsolidated profit and loss account.
Cash flow sensitivity analysis for variable rate instruments: Financial assets If interest rate had fluctuated by ±1% with all other variables held constant, profit before tax for
the year would have been Rs. 1.99 million (2016: Rs 3.487 million) higher / lower, mainly as a result of higher / lower interest income from these financial assets.
Financial liabilities If interest rate had fluctuated by ±1% with all other variables held constant, profit before tax for
the year would have been Rs. 7.427 million (2016: Rs. 12.777 million) higher / lower, mainly as a result of higher / lower interest expense of these financial liabilities.
A summary of the Company’s interest rate gap position, categorised by the earlier of contractual re-pricing or maturity dates at the end of year is as follows:
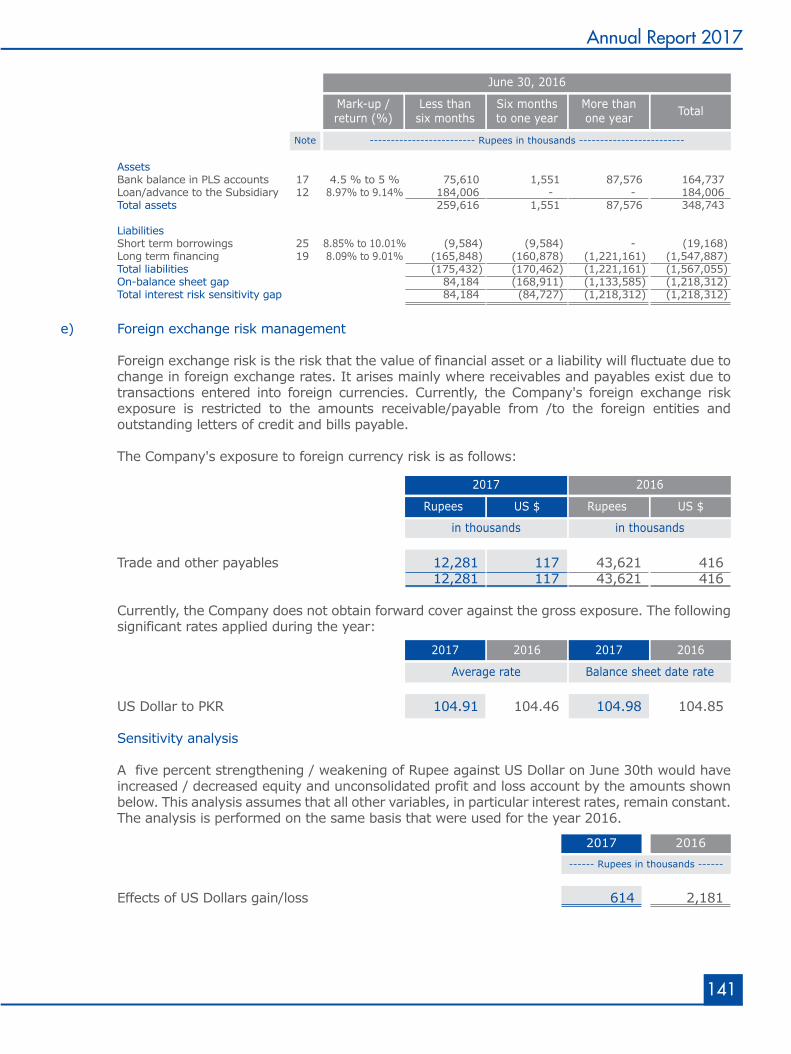
141
Annual Report 2017
e) Foreign exchange risk management Foreign exchange risk is the risk that the value of financial asset or a liability will fluctuate due to
change in foreign exchange rates. It arises mainly where receivables and payables exist due to transactions entered into foreign currencies. Currently, the Company's foreign exchange risk exposure is restricted to the amounts receivable/payable from /to the foreign entities and outstanding letters of credit and bills payable.
The Company's exposure to foreign currency risk is as follows:
Assets Bank balance in PLS accounts 17 4.5 % to 5 % 75,610 1,551 87,576 164,737 Loan/advance to the Subsidiary 12 8.97% to 9.14% 184,006 - - 184,006 Total assets 259,616 1,551 87,576 348,743
Liabilities Short term borrowings 25 8.85% to 10.01% (9,584) (9,584) - (19,168) Long term financing 19 8.09% to 9.01% (165,848) (160,878) (1,221,161) (1,547,887) Total liabilities (175,432) (170,462) (1,221,161) (1,567,055) On-balance sheet gap 84,184 (168,911) (1,133,585) (1,218,312) Total interest risk sensitivity gap 84,184 (84,727) (1,218,312) (1,218,312)
------------------------- Rupees in thousands -------------------------
June 30, 2016
TotalMore thanone year
Six monthsto one year
Less thansix months
Mark-up /return (%)
Note
Trade and other payables 12,281 117 43,621 416 12,281 117 43,621 416 Currently, the Company does not obtain forward cover against the gross exposure. The following
significant rates applied during the year:
US Dollar to PKR 104.91 104.46 104.98 104.85 Sensitivity analysis A five percent strengthening / weakening of Rupee against US Dollar on June 30th would have
increased / decreased equity and unconsolidated profit and loss account by the amounts shown below. This analysis assumes that all other variables, in particular interest rates, remain constant. The analysis is performed on the same basis that were used for the year 2016.
Effects of US Dollars gain/loss 614 2,181
2017 2016
US $Rupees US $Rupees
in thousands in thousands
2017 2016 2017 2016
Balance sheet date rateAverage rate
------ Rupees in thousands ------
2017 2016
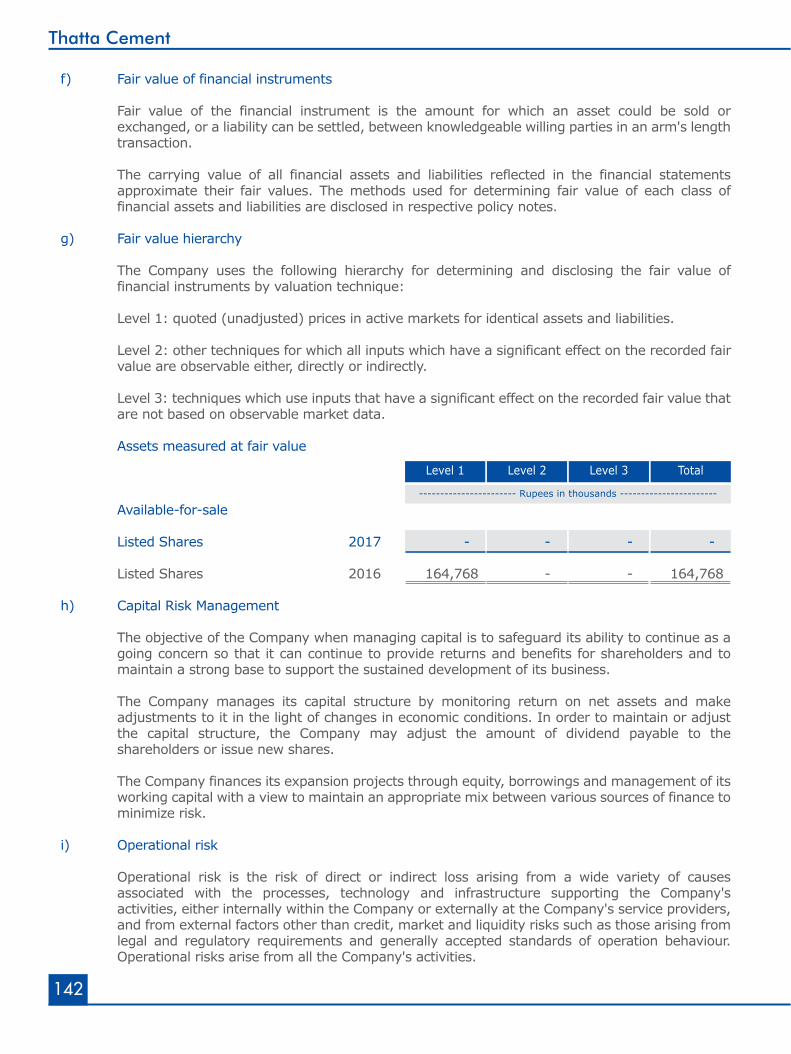
142
Thatta Cement
----------------------- Rupees in thousands -----------------------
TotalLevel 3Level 2Level 1
f) Fair value of financial instruments Fair value of the financial instrument is the amount for which an asset could be sold or
exchanged, or a liability can be settled, between knowledgeable willing parties in an arm's length transaction.
The carrying value of all financial assets and liabilities reflected in the financial statements
approximate their fair values. The methods used for determining fair value of each class of financial assets and liabilities are disclosed in respective policy notes.
g) Fair value hierarchy The Company uses the following hierarchy for determining and disclosing the fair value of
financial instruments by valuation technique: Level 1: quoted (unadjusted) prices in active markets for identical assets and liabilities.
Level 2: other techniques for which all inputs which have a significant effect on the recorded fair
value are observable either, directly or indirectly. Level 3: techniques which use inputs that have a significant effect on the recorded fair value that
are not based on observable market data.
Assets measured at fair value
Available-for-sale Listed Shares 2017 - - - - Listed Shares 2016 164,768 - - 164,768 h) Capital Risk Management
The objective of the Company when managing capital is to safeguard its ability to continue as a
going concern so that it can continue to provide returns and benefits for shareholders and to maintain a strong base to support the sustained development of its business.
The Company manages its capital structure by monitoring return on net assets and make adjustments to it in the light of changes in economic conditions. In order to maintain or adjust the capital structure, the Company may adjust the amount of dividend payable to the shareholders or issue new shares.
The Company finances its expansion projects through equity, borrowings and management of its working capital with a view to maintain an appropriate mix between various sources of finance to minimize risk.
i) Operational risk
Operational risk is the risk of direct or indirect loss arising from a wide variety of causes associated with the processes, technology and infrastructure supporting the Company's activities, either internally within the Company or externally at the Company's service providers, and from external factors other than credit, market and liquidity risks such as those arising from legal and regulatory requirements and generally accepted standards of operation behaviour. Operational risks arise from all the Company's activities.
143
Annual Report 2017
The Company's objective is to manage operational risk so as to balance limiting of financial losses and damage to its reputation while achieving its objectives of becoming a profitable organisation, producing high quality cement and generating returns for investors. Primary responsibility for the development and implementation of controls over operational risk rests with the Board of Directors. This responsibility encompasses the controls in the following areas:
- requirements for appropriate segregation of duties between various functions, roles and
responsibilities; - requirements for reconciliation and monitoring of transactions;
- compliance with regulatory and other legal requirements;
- documentation of controls and procedures;
- requirements for periodic assessment of operational risks faced and the adequacy of controls and procedures to address the risks identified;
- ethical and business standards;
- risk mitigation, including insurance where this is effective; and
- operational and qualitative track record of the plant and equipment supplier and related service providers.
42 CORRESPONDING FIGURES
Corresponding figures have been reclassified for the purposes of better comparison and presentation as follows:
Other receivables Receivable against and accrued interest 15 Others disposal of shares 472
Others 10,483 Cost of sales 28 Other production Vehicle hire, running & overheads maintenance 11,571
Communication 1,746
Entertainment 2,772
Other production overheads 9,061 Administrative expenses 30 Salaries, wages and Board, Audit and other benefits HR Committee meeting fees 3,850
Nature of reclassification Note Reclassification from Reclassification to Rupees inthousands
144
Thatta Cement
43 SUMMARY OF SIGNIFICANT TRANSACTIONS Sales - net 3,656,723 2,846,147 Long term financing 551,683 1,258,617 During the year, the sales of the Company increased by Rs. 810.576 million (2016: Rs. 542
million). Furthermore, due to efficient management of funds, long term loan amounting to Rs. 475 million was prepaid having a favourable impact on the Company's leveraging.
44 NUMBER OF EMPLOYEES The total number of employees as at year end were 534 (2016: 541) out of which 473 (2016:
481) were employed at factory and average number of employees were 543 (2016: 542) out of which 482 (2016: 484) were employed at factory.
45 NON-ADJUSTING EVENT AFTER THE BALANCE SHEET DATE The Board of Directors in their meeting held on August 19, 2017 have proposed for the year
ended June 30, 2017, final cash dividend of Rs. 2.35 per share i.e. 23.5% (2016: Rs. 1.5 per share i.e. 15%) amounting to Rs. 234.33 million (2016: Rs.149.577 million) for approval by the members of the Company in the Annual General Meeting to be held on September 18, 2017. These unconsolidated financial statements for the year ended June 30, 2017 do not include the effect of the proposed cash dividend, which will be recognized in the unconsolidated financial statements for the year ending on June 30, 2018.
46 DATE OF AUTHORIZATION These unconsolidated financial statements were authorized for issue on August 19, 2017 by the
Board of Directors of the Company. 47 GENERAL Figures have been rounded off to the nearest thousand of Rupees.
------ Rupees in thousands ------
2017 2016
CHIEF EXECUTIVE DIRECTOR
Financial Statements (consolidated)
Accomplishing Milestones of SuccessAccomplishing targets through collective efforts, determination and integrity invested round the year are the most significant events for us.
AUDITOR’S REPORTTO THE MEMBERS
We have audited the annexed consolidated financial statements comprising of consolidated balance sheet of Thatta Cement Company Limited (the Holding Company) and its subsidiary company collectively referred as “the Group” as at June 30, 2017 and the related consolidated profit and loss account, consolidated statement of comprehensive income, consolidated cash flow statement and consolidated statement of changes in equity together with the notes forming part thereof, for the year then ended. We have also expressed separate opinion on the financial statements of Thatta Cement Company Limited. The financial statements of its subsidiary Thatta Power (Private) Limited were audited by other firm of auditors whose report has been furnished to us and our opinion, in so far as it relates to the amounts included for such company, is based solely on the report of such other auditors. These consolidated financial statements are the responsibility of the Holding Company’s management. Our responsibility is to express an opinion on these consolidated financial statements based on our audit.
Our audit was conducted in accordance with the International Standards on Auditing and accordingly included such tests of accounting records and such other auditing procedures as we considered necessary in the circumstances.
In our opinion, the consolidated financial statements present fairly the financial position of Thatta Cement Company Limited and its subsidiary company as at June 30, 2017 and the results of their operations for the year then ended.
146
Thatta Cement
Date: August 19, 2017 Grant Thornton Anjum RahmanKarachi Chartered Accountants Muhammad Shaukat Naseeb Engagement Partner
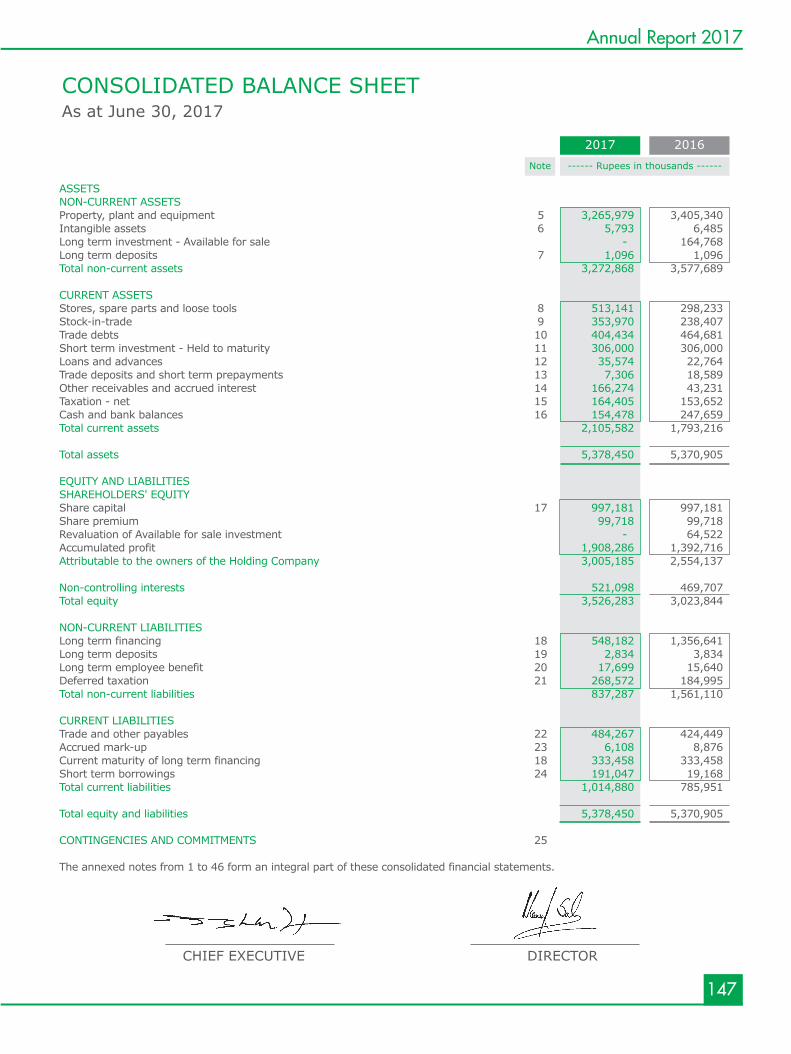
147
Annual Report 2017
CONSOLIDATED BALANCE SHEETAs at June 30, 2017
ASSETS NON-CURRENT ASSETS Property, plant and equipment 5 3,265,979 3,405,340 Intangible assets 6 5,793 6,485 Long term investment - Available for sale - 164,768 Long term deposits 7 1,096 1,096 Total non-current assets 3,272,868 3,577,689 CURRENT ASSETS Stores, spare parts and loose tools 8 513,141 298,233 Stock-in-trade 9 353,970 238,407 Trade debts 10 404,434 464,681 Short term investment - Held to maturity 11 306,000 306,000 Loans and advances 12 35,574 22,764 Trade deposits and short term prepayments 13 7,306 18,589 Other receivables and accrued interest 14 166,274 43,231 Taxation - net 15 164,405 153,652 Cash and bank balances 16 154,478 247,659 Total current assets 2,105,582 1,793,216 Total assets 5,378,450 5,370,905
EQUITY AND LIABILITIES SHAREHOLDERS' EQUITY Share capital 17 997,181 997,181 Share premium 99,718 99,718 Revaluation of Available for sale investment - 64,522 Accumulated profit 1,908,286 1,392,716 Attributable to the owners of the Holding Company 3,005,185 2,554,137 Non-controlling interests 521,098 469,707 Total equity 3,526,283 3,023,844 NON-CURRENT LIABILITIES Long term financing 18 548,182 1,356,641 Long term deposits 19 2,834 3,834 Long term employee benefit 20 17,699 15,640 Deferred taxation 21 268,572 184,995 Total non-current liabilities 837,287 1,561,110 CURRENT LIABILITIES Trade and other payables 22 484,267 424,449 Accrued mark-up 23 6,108 8,876 Current maturity of long term financing 18 333,458 333,458 Short term borrowings 24 191,047 19,168 Total current liabilities 1,014,880 785,951 Total equity and liabilities 5,378,450 5,370,905 CONTINGENCIES AND COMMITMENTS 25 The annexed notes from 1 to 46 form an integral part of these consolidated financial statements.
------ Rupees in thousands ------Note
2017 2016
CHIEF EXECUTIVE DIRECTOR
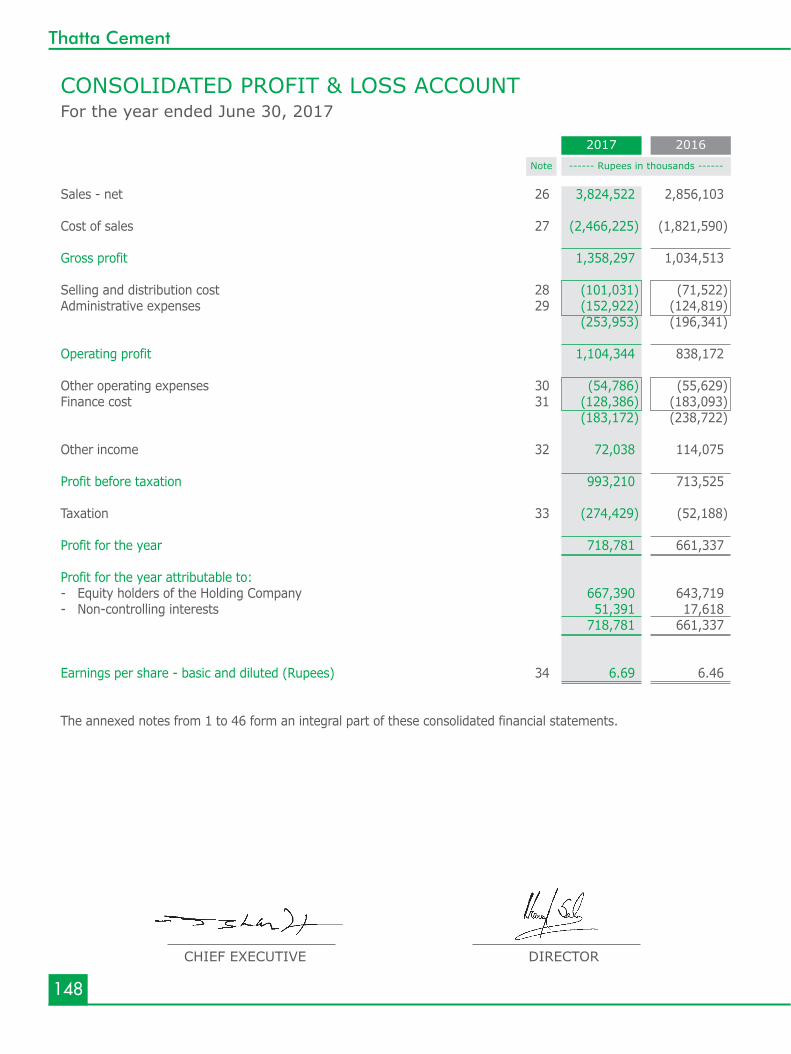
148
Thatta Cement
CONSOLIDATED PROFIT & LOSS ACCOUNTFor the year ended June 30, 2017
------ Rupees in thousands ------Note
2017 2016
Sales - net 26 3,824,522 2,856,103 Cost of sales 27 (2,466,225) (1,821,590) Gross profit 1,358,297 1,034,513 Selling and distribution cost 28 (101,031) (71,522)Administrative expenses 29 (152,922) (124,819) (253,953) (196,341) Operating profit 1,104,344 838,172 Other operating expenses 30 (54,786) (55,629)Finance cost 31 (128,386) (183,093) (183,172) (238,722) Other income 32 72,038 114,075 Profit before taxation 993,210 713,525 Taxation 33 (274,429) (52,188) Profit for the year 718,781 661,337 Profit for the year attributable to: - Equity holders of the Holding Company 667,390 643,719 - Non-controlling interests 51,391 17,618 718,781 661,337 Earnings per share - basic and diluted (Rupees) 34 6.69 6.46 The annexed notes from 1 to 46 form an integral part of these consolidated financial statements.
CHIEF EXECUTIVE DIRECTOR
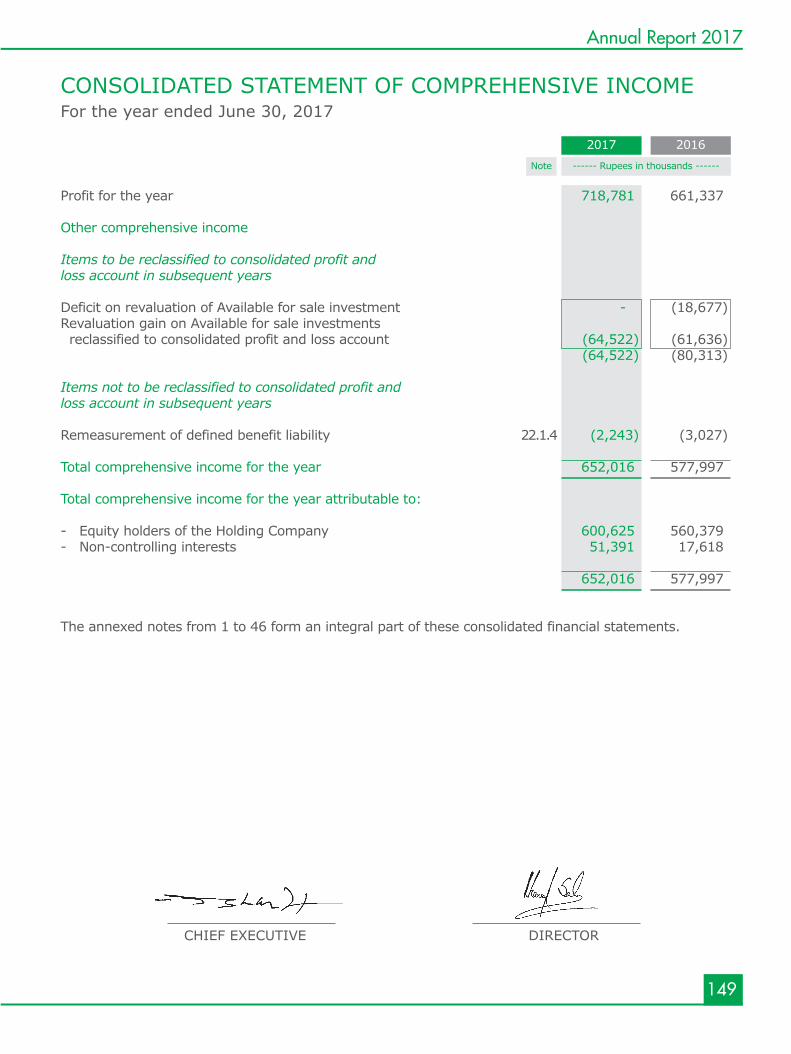
149
Annual Report 2017
CONSOLIDATED STATEMENT OF COMPREHENSIVE INCOME For the year ended June 30, 2017
------ Rupees in thousands ------Note
2017 2016
Profit for the year 718,781 661,337 Other comprehensive income Items to be reclassified to consolidated profit and loss account in subsequent years
Deficit on revaluation of Available for sale investment - (18,677)Revaluation gain on Available for sale investments reclassified to consolidated profit and loss account (64,522) (61,636) (64,522) (80,313) Items not to be reclassified to consolidated profit and loss account in subsequent years Remeasurement of defined benefit liability 22.1.4 (2,243) (3,027)
Total comprehensive income for the year 652,016 577,997 Total comprehensive income for the year attributable to: - Equity holders of the Holding Company 600,625 560,379 - Non-controlling interests 51,391 17,618 652,016 577,997 The annexed notes from 1 to 46 form an integral part of these consolidated financial statements.
CHIEF EXECUTIVE DIRECTOR
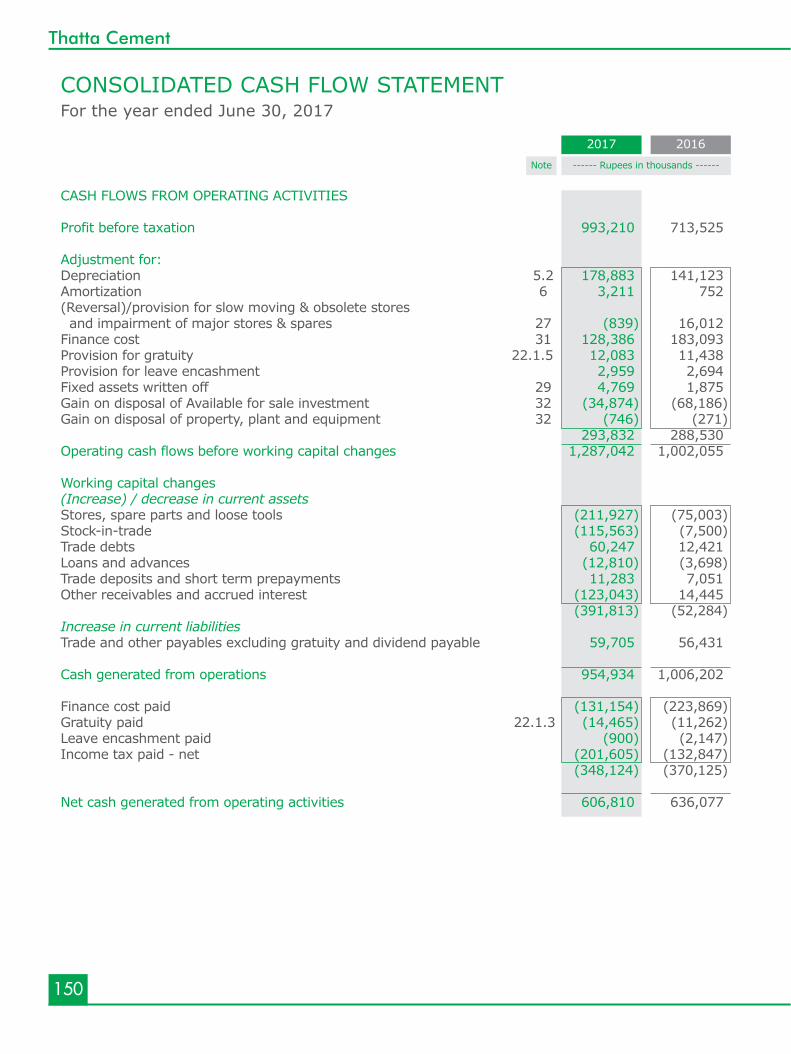
150
Thatta Cement
CONSOLIDATED CASH FLOW STATEMENTFor the year ended June 30, 2017
------ Rupees in thousands ------Note
2017 2016
CASH FLOWS FROM OPERATING ACTIVITIES Profit before taxation 993,210 713,525 Adjustment for: Depreciation 5.2 178,883 141,123 Amortization 6 3,211 752 (Reversal)/provision for slow moving & obsolete stores and impairment of major stores & spares 27 (839) 16,012 Finance cost 31 128,386 183,093 Provision for gratuity 22.1.5 12,083 11,438 Provision for leave encashment 2,959 2,694 Fixed assets written off 29 4,769 1,875 Gain on disposal of Available for sale investment 32 (34,874) (68,186)Gain on disposal of property, plant and equipment 32 (746) (271) 293,832 288,530 Operating cash flows before working capital changes 1,287,042 1,002,055 Working capital changes (Increase) / decrease in current assets Stores, spare parts and loose tools (211,927) (75,003)Stock-in-trade (115,563) (7,500)Trade debts 60,247 12,421 Loans and advances (12,810) (3,698)Trade deposits and short term prepayments 11,283 7,051 Other receivables and accrued interest (123,043) 14,445 (391,813) (52,284)Increase in current liabilities Trade and other payables excluding gratuity and dividend payable 59,705 56,431 Cash generated from operations 954,934 1,006,202 Finance cost paid (131,154) (223,869)Gratuity paid 22.1.3 (14,465) (11,262)Leave encashment paid (900) (2,147)Income tax paid - net (201,605) (132,847) (348,124) (370,125) Net cash generated from operating activities 606,810 636,077
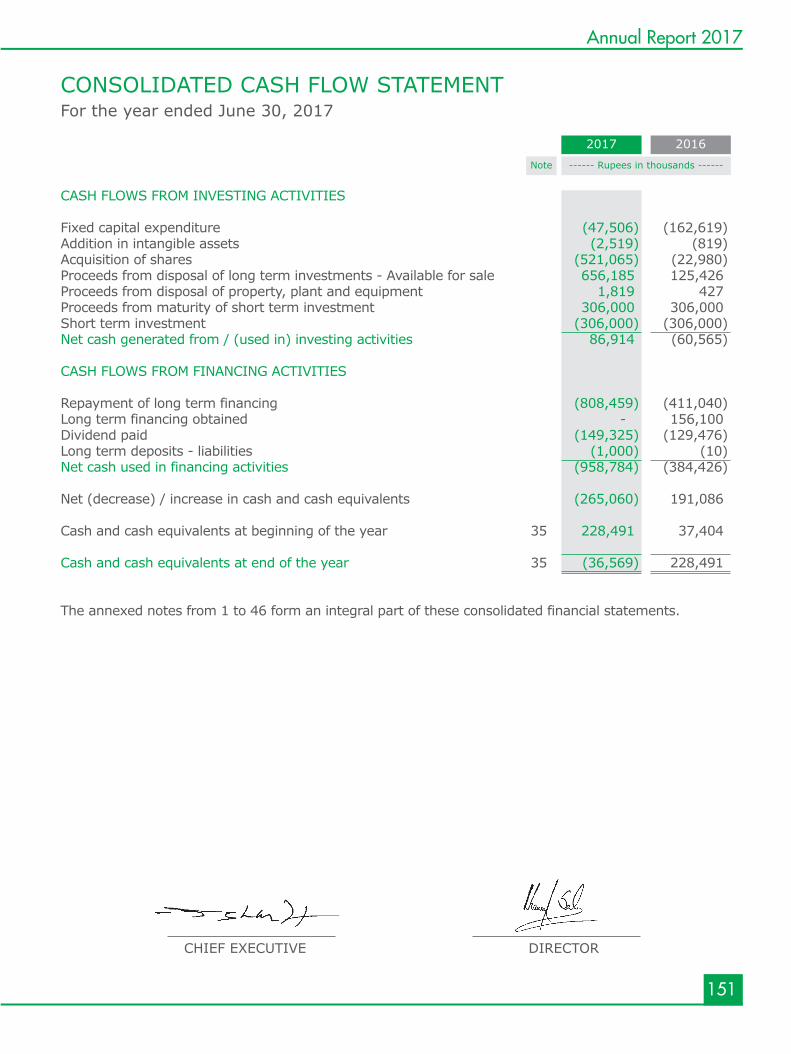
151
Annual Report 2017
CONSOLIDATED CASH FLOW STATEMENTFor the year ended June 30, 2017
------ Rupees in thousands ------Note
2017 2016
CHIEF EXECUTIVE DIRECTOR
CASH FLOWS FROM INVESTING ACTIVITIES Fixed capital expenditure (47,506) (162,619)Addition in intangible assets (2,519) (819)Acquisition of shares (521,065) (22,980)Proceeds from disposal of long term investments - Available for sale 656,185 125,426 Proceeds from disposal of property, plant and equipment 1,819 427 Proceeds from maturity of short term investment 306,000 306,000 Short term investment (306,000) (306,000)Net cash generated from / (used in) investing activities 86,914 (60,565) CASH FLOWS FROM FINANCING ACTIVITIES Repayment of long term financing (808,459) (411,040)Long term financing obtained - 156,100 Dividend paid (149,325) (129,476)Long term deposits - liabilities (1,000) (10)Net cash used in financing activities (958,784) (384,426) Net (decrease) / increase in cash and cash equivalents (265,060) 191,086 Cash and cash equivalents at beginning of the year 35 228,491 37,404 Cash and cash equivalents at end of the year 35 (36,569) 228,491 The annexed notes from 1 to 46 form an integral part of these consolidated financial statements.
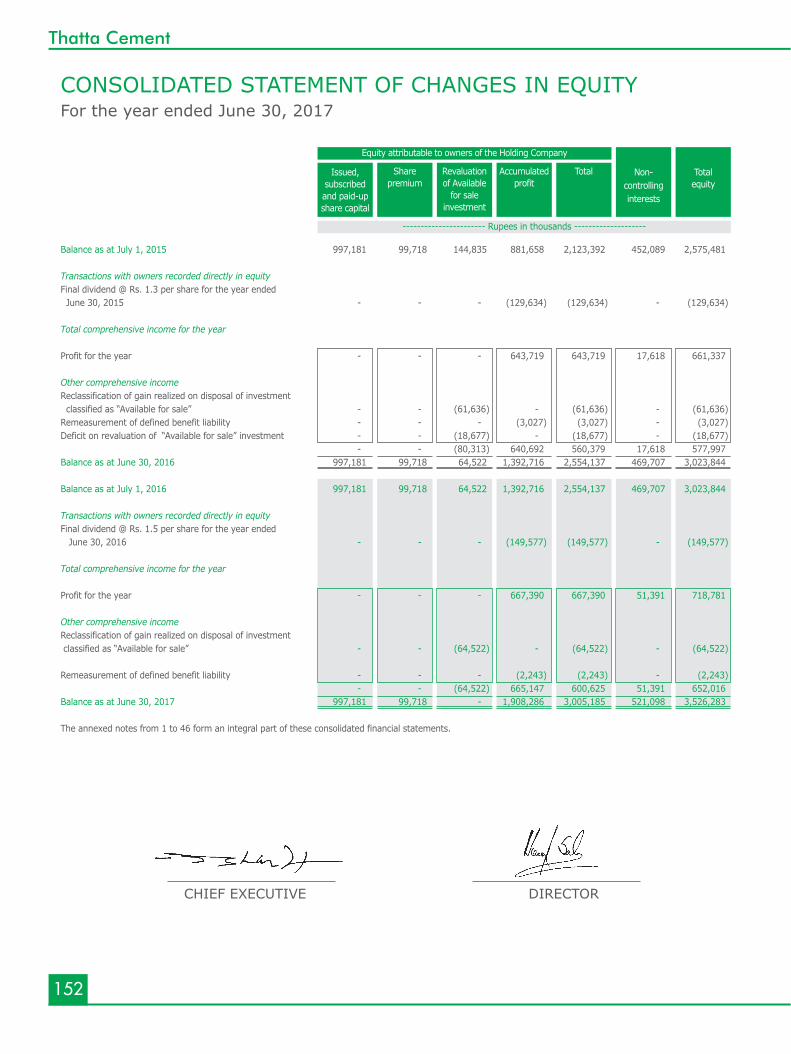
152
Thatta Cement
CONSOLIDATED STATEMENT OF CHANGES IN EQUITYFor the year ended June 30, 2017
CHIEF EXECUTIVE DIRECTOR
Balance as at July 1, 2015 997,181 99,718 144,835 881,658 2,123,392 452,089 2,575,481
Transactions with owners recorded directly in equity Final dividend @ Rs. 1.3 per share for the year ended June 30, 2015 - - - (129,634) (129,634) - (129,634) Total comprehensive income for the year
Profit for the year - - - 643,719 643,719 17,618 661,337 Other comprehensive incomeReclassification of gain realized on disposal of investment classified as “Available for sale” - - (61,636) - (61,636) - (61,636)Remeasurement of defined benefit liability - - - (3,027) (3,027) - (3,027)Deficit on revaluation of “Available for sale” investment - - (18,677) - (18,677) - (18,677) - - (80,313) 640,692 560,379 17,618 577,997 Balance as at June 30, 2016 997,181 99,718 64,522 1,392,716 2,554,137 469,707 3,023,844 Balance as at July 1, 2016 997,181 99,718 64,522 1,392,716 2,554,137 469,707 3,023,844 Transactions with owners recorded directly in equityFinal dividend @ Rs. 1.5 per share for the year ended June 30, 2016 - - - (149,577) (149,577) - (149,577) Total comprehensive income for the year
Profit for the year - - - 667,390 667,390 51,391 718,781 Other comprehensive income Reclassification of gain realized on disposal of investment classified as “Available for sale” - - (64,522) - (64,522) - (64,522) Remeasurement of defined benefit liability - - - (2,243) (2,243) - (2,243) - - (64,522) 665,147 600,625 51,391 652,016 Balance as at June 30, 2017 997,181 99,718 - 1,908,286 3,005,185 521,098 3,526,283
The annexed notes from 1 to 46 form an integral part of these consolidated financial statements.
Sharepremium
Revaluationof Available
for sale investment
Accumulatedprofit
Total Totalequity
Issued,subscribedand paid-upshare capital
Non-controllinginterests
Equity attributable to owners of the Holding Company
----------------------- Rupees in thousands --------------------
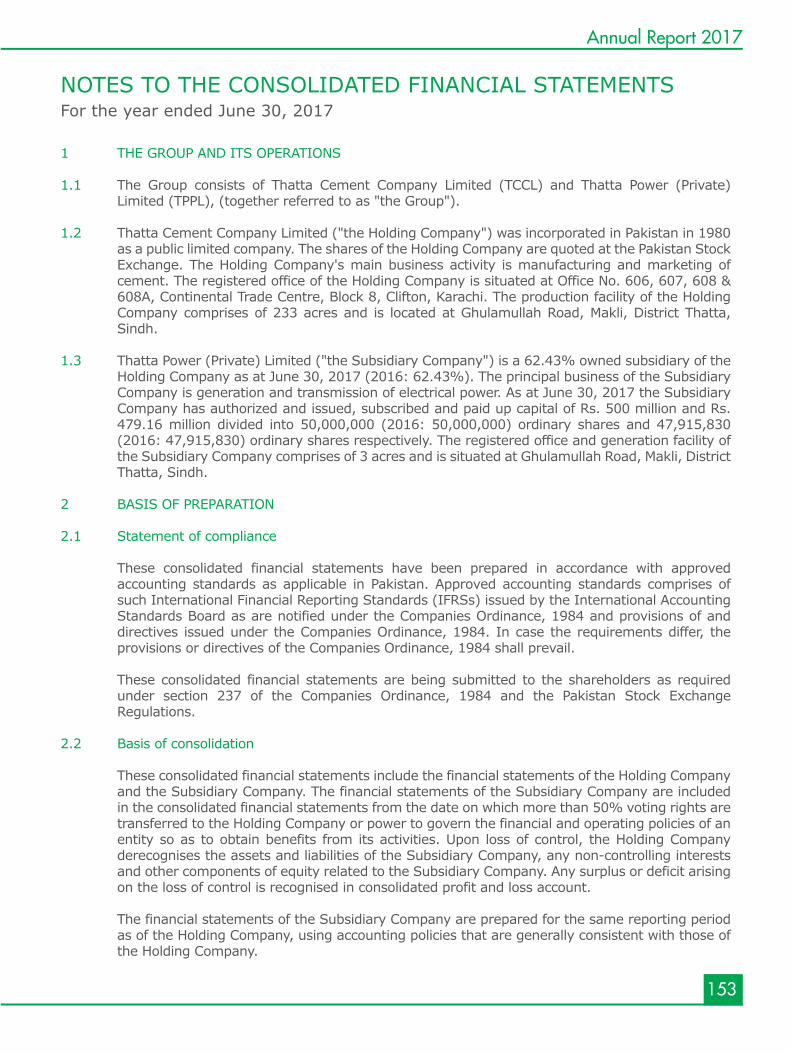
153
Annual Report 2017
NOTES TO THE CONSOLIDATED FINANCIAL STATEMENTS For the year ended June 30, 2017
1 THE GROUP AND ITS OPERATIONS
1.1 The Group consists of Thatta Cement Company Limited (TCCL) and Thatta Power (Private) Limited (TPPL), (together referred to as "the Group").
1.2 Thatta Cement Company Limited ("the Holding Company") was incorporated in Pakistan in 1980
as a public limited company. The shares of the Holding Company are quoted at the Pakistan Stock Exchange. The Holding Company's main business activity is manufacturing and marketing of cement. The registered office of the Holding Company is situated at Office No. 606, 607, 608 & 608A, Continental Trade Centre, Block 8, Clifton, Karachi. The production facility of the Holding Company comprises of 233 acres and is located at Ghulamullah Road, Makli, District Thatta, Sindh.
1.3 Thatta Power (Private) Limited ("the Subsidiary Company") is a 62.43% owned subsidiary of the Holding Company as at June 30, 2017 (2016: 62.43%). The principal business of the Subsidiary Company is generation and transmission of electrical power. As at June 30, 2017 the Subsidiary Company has authorized and issued, subscribed and paid up capital of Rs. 500 million and Rs. 479.16 million divided into 50,000,000 (2016: 50,000,000) ordinary shares and 47,915,830 (2016: 47,915,830) ordinary shares respectively. The registered office and generation facility of the Subsidiary Company comprises of 3 acres and is situated at Ghulamullah Road, Makli, District Thatta, Sindh.
2 BASIS OF PREPARATION 2.1 Statement of compliance These consolidated financial statements have been prepared in accordance with approved
accounting standards as applicable in Pakistan. Approved accounting standards comprises of such International Financial Reporting Standards (IFRSs) issued by the International Accounting Standards Board as are notified under the Companies Ordinance, 1984 and provisions of and directives issued under the Companies Ordinance, 1984. In case the requirements differ, the provisions or directives of the Companies Ordinance, 1984 shall prevail.
These consolidated financial statements are being submitted to the shareholders as required
under section 237 of the Companies Ordinance, 1984 and the Pakistan Stock Exchange Regulations.
2.2 Basis of consolidation These consolidated financial statements include the financial statements of the Holding Company
and the Subsidiary Company. The financial statements of the Subsidiary Company are included in the consolidated financial statements from the date on which more than 50% voting rights are transferred to the Holding Company or power to govern the financial and operating policies of an entity so as to obtain benefits from its activities. Upon loss of control, the Holding Company derecognises the assets and liabilities of the Subsidiary Company, any non-controlling interests and other components of equity related to the Subsidiary Company. Any surplus or deficit arising on the loss of control is recognised in consolidated profit and loss account.
The financial statements of the Subsidiary Company are prepared for the same reporting period as of the Holding Company, using accounting policies that are generally consistent with those of the Holding Company.
154
Thatta Cement
The assets and liabilities of the Subsidiary Company have been consolidated on a line-by-line basis. The carrying value of investment held by the Holding Company is eliminated against the Subsidiary's shareholders' equity in the consolidated financial statements. Intra group balances and transactions are eliminated.
2.3 Basis of measurement These consolidated financial statements have been prepared under historical cost convention
except for certain employee retirement benefits and foreign currency liabilities which are stated as reported in their respective notes.
2.4 Financial year The Group's financial year starts from July 1 and ends at June 30. 2.5 Functional and presentation currency
These consolidated financial statements have been prepared & presented in Pakistani Rupee,
which is the Group's functional and presentation currency. 2.6 Use of estimates and judgments The preparation of these consolidated financial statements in conformity with approved
accounting standards require management to make estimates, assumptions and use judgments that affect the application of policies and reported amounts of assets, liabilities, income and expenses. Estimates, assumptions and judgments are continually evaluated and are based on historical experience and other factors, including reasonable expectations of future events. Revisions to accounting estimates are recognized prospectively commencing from the period of revision. In preparing these consolidated financial statements, the significant judgments made by the management in applying the Group's accounting policies and key sources of estimation and uncertainty were the same as those that were applied to the consolidated financial statements as at and for the year ended June 30, 2016.
Management has made the following estimates and judgments which are significant to these
consolidated financial statements: a) Property, plant and equipment
The Group’s management determines the estimated useful lives and related depreciation charge
for its property, plant and equipments. The Group also reviews the value of the assets for possible impairment on an annual basis. Any change in the estimates in future years might affect the carrying amounts of the respective items of property, plant and equipment with a corresponding affect on the depreciation charge and impairment.
b) Intangible assets The Group’s management determines the estimated useful lives and related amortization charge
for its intangibles. The Group also reviews the value of the intangibles for possible impairment on an annual basis. Any change in the estimates in future years might affect the carrying amounts of the respective items of intangibles with a corresponding affect on the amortization charge and impairment.
c) Trade debts The Group reviews it’s doubtful debts at each reporting date to assess whether provision should
be recorded in the consolidated profit and loss account. In particular, judgment by management is required in the estimates of the amount and timing of future cash flows when determining the
155
Annual Report 2017
level of provision required. Such estimates are based on assumptions about number of factors and actual results may differ, resulting in future changes to the provisions.
d) Stock-in-trade and stores and spares
The Group reviews the net realizable value of stock-in-trade and stores and spares to assess any diminution in the respective carrying values. Any change in the estimates in future years might affect the carrying amounts of stock-in-trade and stores & spares and corresponding effect in consolidated profit and loss account of those future years. Net realizable value is determined with respect to estimated selling price less estimated expenditures to make the sale.
e) Taxation In making the estimates for income taxes currently payable by the Group, the management
considers the current income tax law and the decisions of appellate authorities on certain issues in the past. In making the provision for deferred tax, estimates of the Group's future taxable profits are taken into account.
f) Contingencies The assessment of the contingencies inherently involves the exercise of significant judgment as
the outcome of the future events cannot be predicted with certainty. The Group, based on the availability of the latest information, estimates the value of contingent assets and liabilities which may differ on the occurrence / non-occurrence of uncertain future events with respect to evaluation based on element of issue involved and opinion of the legal counsel.
g) Staff retirement benefits Certain actuarial assumptions have been adopted as disclosed in these consolidated financial
statements for actuarial valuation of present value of defined benefit obligation and leave encashment. Change in these assumptions in future years may affect the liability under the schemes in those years.
h) Impairment of investments The Group determines that a significant and prolonged decline in the fair value of its investments
below its cost is an objective evidence of impairment. The impairment loss is recognized when the carrying amount exceeds the higher of fair value less cost to sell and value in use.
3 STANDARDS, AMENDMENTS OR INTERPRETATIONS WHICH BECAME EFFECTIVE DURING THE YEAR
3.1 Promulgation of Companies Act, 2017
Consequent to the promulgation and implementation of Companies Act, 2017, additional information have been voluntarily disclosed in note 2.4, 27.1.1, 33.1, 42 & 43 to these consolidated financial statements.
3.2 Standards, amendments and interpretations to the published standards that are relevant to the
Group and adopted in the current year
The following standards, amendments and interpretations of approved accounting standards which became effective during the year and adopted by the Group:
156
Thatta Cement
Standard or Interpretation Effective date IAS 1 - Disclosure Initiative (Amendments to IAS 1 Presentation of Financial Statements) January 1, 2016 IFRS 10, IFRS 12 and IAS 28 - Investment Entities : Applying the Consolidation Exception (Amendments to IFRS 10, IFRS 12 and IAS 28) January 1, 2016 Annual Improvements to IFRSs 2012 - 2014 Cycle January 1, 2016 IAS 16 and IAS 41 - Agriculture: Bearer Plants (Amendments to IAS 16 and IAS 41) January 1, 2016 IAS 16 and IAS 38 - Clarification of Acceptable Methods of Depreciation and Amortisation (Amendments to IAS 16 and IAS 38) January 1, 2016 The adoption of the above accounting standards or interpretations do not have any material
effect on these consolidated financial statements including comparative amounts.
3.3 Standards, amendments to published standards and interpretations that are effective but not relevant
The other new standards, amendments to the published standards and interpretations that are
mandatory for the financial year beginning on July 01, 2016 are considered not to be relevant nor to have any significant effect on the Group's financial reporting and operations and are therefore not presented here.
3.4 Standards, amendments and interpretations to the published standards that are relevant but not
yet effective and not early adopted by the Group The following new standards, amendments to the published standards and interpretations will be
effective from the dates mentioned below against the respective standard or interpretation.
Standard or Interpretation Effective date (annual periods beginning on or after)
IFRS 10 and IAS 28 - Sale or Contribution of Assets between an Investor and its Associate or Joint Venture (Amendments to IFRS 10 and IAS 28) Postponed IAS 7 - Disclosure Initiative (Amendments to IAS 7) January 1, 2017 IAS 12 - Recognition of Deferred Tax Assets for Unrealized Losses (Amendments to IAS 12) January 1, 2017 IFRS 12 - Annual Improvements to IFRS 2014-2016 January 1, 2017 IFRS 2 - Classification and Measurement of Share-based Payment Transaction (Amendments to IFRS 2) January 1, 2018 IFRS 1 and IAS 28 - Annual Improvements to IFRSs 2014-2016 January 1, 2018
157
Annual Report 2017
Standard or Interpretation Effective date (annual periods beginning on or after)
IFRIC 22 - Foreign Currency Transactions and Advance Consideration January 1, 2018 IAS 40 - Transfers of Investment Property (Amendments to IAS 40) January 1, 2018 IFRIC 23 - Uncertainty over Income Tax Treatments January 1, 2019
The above standards and amendments are not expected to have any material impact on the Group's consolidated financial statements in the period of initial application.
3.5 Standards, amendments and interpretations to the published standards that are not yet notified by the Securities and Exchange Commission of Pakistan (SECP)
Following new standards have been issued by the International Accounting Standards Board (IASB) which are yet to be notified by the SECP for the purpose of applicability in Pakistan.
Standard or Interpretation IASB effective date (Annual periods beginning on or after) IFRS 9 - Financial Instruments (2014) and consequent amendments to IFRS 4 Insurance Contracts January 1, 2018 IFRS 14 - Regulatory Deferral Accounts January 1, 2016 IFRS 15 - Revenue from Contracts with Customers January 1, 2018 IFRS 16 - Leases January 1, 2019 IFRS 17 – Insurance Contracts January 1, 2021
4 SUMMARY OF SIGNIFICANT ACCOUNTING POLICIES The significant accounting policies adopted in the preparation of these consolidated financial
statements are set out below and have been consistently applied to all years presented.
4.1 Property, plant and equipments Property, plant and equipments (except freehold land) are stated at cost less accumulated
depreciation and impairment losses, if any. Cost includes expenditure that is directly attributable to the acquisition of an asset.
Depreciation
Depreciation is charged using straight line method on all assets except on plant and machinery (other than utilities within plant and machinery) on which depreciation is charged by applying 'Units of Production (UoP) method'. Majority items of plant and machinery of the Subsidiary Company are depreciated on the basis of 'Running Hours' (RH) of engines. Depreciation rates of each item is mentioned in note 5.1. Depreciation on addition is charged from the date when the asset is available for use and on disposal upto the date when the asset is classified as
held-for-sale in accordance with IFRS 5 'Non-current Assets Held for Sale and Discontinued Operations' or the date when the asset is derecognized, whichever is earlier. Assets' residual values and useful lives are reviewed and adjusted, if appropriate at each consolidated balance sheet date.
158
Thatta Cement
Subsequent costs Subsequent costs are included in the asset’s carrying amount or recognized as a separate asset,
as appropriate, only when it is probable that future economic benefits associated with the asset will flow to the Group and the cost of the asset can be measured reliably. The carrying amount of the replaced part is derecognised. Normal maintenance and repairs are charged to consolidated profit and loss account as and when incurred whereas major renewals and improvements are capitalized.
Disposal The gain or loss on disposal of an item of property, plant and equipments is determined by
comparing the proceeds from disposal with the carrying amount of the property, plant and equipments and is recognized in consolidated profit and loss account.
4.1.1 Capital work-in-progress (CWIP) Capital work-in-progress is stated at cost including, where relevant, related financing costs less
impairment loss, if any. These costs are transferred to fixed assets as and when assets are available for use.
4.2 Government grant
Government grants related to assets are presented by deducting the grant amount in arriving at the carrying amount of the asset. The grant is recognized in consolidated profit and loss account over the useful life of the asset as reduced by depreciation expense.
4.3 Intangible assets Intangible assets are recognized when it is probable that the expected future economic benefits
will flow to the entity and the cost of an asset can be measured reliably. Cost of intangible asset includes purchase cost and directly attributable expenses incidental to bring the asset for its intended use. Costs associated with maintaining computer software are recognized as an expense as and when incurred. Intangible assets are stated at cost less accumulated amortization and accumulated impairment losses, if any. Amortization is charged over the estimated useful life of an asset on a systematic basis by applying the straight line method. Useful lives of all intangible assets are reviewed at each consolidated balance sheet date and adjusted if the impact of amortization is significant. Subsequent expenditure on intangible asset is capitalized only when it increases the future economic benefits embodied in the specific asset to which it relates.
4.4 Impairment Financial assets A financial asset is assessed at each reporting date to determine whether there is any objective
evidence that it is impaired. A financial asset is considered to be impaired if objective evidence indicates that one or more events have had a negative effect on the estimated future cash flows of that asset. An asset's carrying amount is written down immediately to its recoverable amount if the asset's carrying amount is greater than its estimated recoverable amount.
Non-Financial assets The carrying amounts of non-financial assets other than stock-in-trade and deferred tax asset,
are assessed at each reporting date to ascertain whether there is any indication of impairment.
159
Annual Report 2017
If any such indication exists then the asset's recoverable amount is estimated. An impairment loss is recognized, as an expense in the consolidated profit and loss account, for the amount by which the asset's carrying amount exceeds its recoverable amount. The recoverable amount is the higher of an asset's fair value less cost to sell and value in use. Value in use is ascertained through discounting of the estimated future cash flows using a discount rate that reflects current market assessments of the time value of money and the risk specific to the assets. For the purpose of assessing impairment, assets are grouped at the lowest levels for which there are separately identifiable cash flows (cash generating units).
An impairment loss is reversed if there has been a change in the estimates used to determine the
recoverable amount. An impairment loss is reversed only to the extent that the asset's carrying amount does not exceed the carrying amount that would have been determined, net of depreciation or amortization, if no impairment loss had been recognized.
4.5 Investments Investment in associate Investment in associates are initially recognized at cost. The carrying amount of investment is
reviewed at each reporting date to determine whether there is any indication of impairment. If any such indication exist the investment's recoverable amount is estimated which is higher of its value in use and its fair value less cost to sell. An impairment loss is recognized if the carrying amount exceeds its recoverable amount. Impairment losses are recognized in consolidated profit and loss account. An impairment loss is reversed if there has been a change in the estimates used to determine the recoverable amount but limited to the extent of initial cost of investment. A reversal of impairment loss is recognized in the consolidated profit and loss account.
Investment - Available for sale The Group classifies its other long term investment as 'Available for sale' investments which are
non-derivatives and are either designated in this category or not classified as 'Fair value through profit and loss', 'Loans and receivables' or 'Held to maturity financial assets'.
Available for sale investment is initially recorded at fair value and subsequently remeasured at
fair value at each reporting date. Changes in fair value are taken to consolidated other comprehensive income. When investment classified as Available for sale is sold or impaired, the accumulated fair value adjustments recognized in consolidated other comprehensive income are included in the consolidated profit and loss account. Dividends on Available for sale investment is recognized in consolidated profit and loss account as part of 'other income' when the Group's right to receive payment is established.
The Group assesses at each consolidated balance sheet date whether there is an objective
evidence that an 'Available for sale' investment is impaired. For such investment, a significant prolonged decline in the fair value of the investment below the carrying value is considered as an indicator that the investment is impaired. If any such evidence exists, the cumulative loss is transferred from consolidated other comprehensive income to the consolidated profit and loss account. Impairment losses previously recognized in the consolidated profit and loss account on 'Available for sale' investment is not reversed through consolidated profit and loss account.
Investment - Held to maturity Held to maturity financial assets are non-derivative financial assets with fixed or determinable
payments and maturity where management has a positive intention and ability to hold till maturity and are stated at amortised cost.
160
Thatta Cement
4.6 Stores, spare parts and loose tools These are stated at lower of cost (calculated on weighted average basis) or net realisable value,
less provision for obsolete and slow moving stores and spares. Stores and spares in transit are valued at invoice value plus other charges incurred thereon as on the consolidated balance sheet date.
Provision for obsolete and slow moving stores, spare parts and loose tools is determined based
on management's estimate regarding their future usability.
Net realisable value signifies the estimated selling price in the ordinary course of business less the estimated cost necessary to be incurred to make the sale.
4.7 Stock-in-trade Stock of raw and packing material, work in process and finished goods are valued at the lower of
cost or net realisable value. Cost in relation to work in process and finished goods includes prime cost and appropriate proportion of production overheads incurred in bringing the inventory to their present location and condition. Stocks of raw and packing material are valued at cost on weighted average basis. Stocks in transit are valued at cost comprising of invoice value plus other charges directly attributable to the acquisition of related purchase incurred upto the consolidated balance sheet date.
Net realisable value signifies the estimated selling price in the ordinary course of business less the
estimated cost of completion and cost necessary to be incurred in order to make the sale.
4.8 Trade debts and other receivables Trade debts and other receivables are stated initially at fair value and subsequently measured at
amortized cost using the effective interest rate method if applicable, less provision for impairment and provision for doubtful debts, if any. Provision for impairment and provision for doubtful debts are established where there is objective evidence that the Group will not be able to collect all amounts due according to the original terms of the receivables. Trade debts and receivables are written off when considered irrecoverable.
Export debts are initially recognized at the exchange rate prevailing on the date when significant
risks and rewards of ownership of goods are transferred and subsequently remeasured at each consolidated balance sheet date. Exchange gain/(loss) on remeasurement is taken to consolidated profit and loss account.
4.9 Cash and cash equivalents Cash and cash equivalents in local currency are carried in the consolidated balance sheet at cost
and cash in foreign currencies are stated at the exchange rate prevailing at the consolidated balance sheet date. For the purposes of the consolidated cash flow statement, cash and cash equivalents comprises of cash in hand, with banks in current, PLS and deposit accounts net of short term borrowings under mark-up arrangements, if any.
4.10 Employee retirement benefits Defined benefit plan The Holding Company operates an approved funded gratuity scheme covering all permanent
employees. The scheme is administered by the trustees nominated under the Trust Deed. The liability recognized in respect of gratuity is the present value of the Holding Company's
161
Annual Report 2017
obligations under the scheme at the consolidated balance sheet date less the fair value of plan assets, together with adjustment for unrecognized actuarial gains or losses. Contribution is made to this scheme on the basis of actuarial recommendations. The actuarial valuation is carried out using the Projected Unit Credit Method.
The present value of obligations are determined by discounting the estimated future cash
outflows using interest rates of government bonds. The government bonds are consistent with the estimated term of the post-employment benefit obligations.
Defined contribution plan The Holding Company also operates an approved contributory provident fund for all its
permanent employees to which equal monthly contributions are made, both by the Holding Company and the employees at the rate of 10% of basic salary.
Leave encashment The liability for accumulated earned leaves which are eligible for encashment relating to
permanent employees are recognised on the basis of actuarial valuation in the period in which permanent employees render service that increases their entitlement to future leave encashment.
4.11 Borrowings and finance cost Loans and borrowings are recorded as and when the proceeds are received. Borrowing cost incurred on long term finances directly attributable to the construction/
acquisition of qualifying assets are capitalized up to the date, the respective assets are available for the intended use. All other mark-up, interest and other related charges are taken to consolidated profit and loss account.
4.12 Taxation Current Provision for current taxation of the Holding Company is computed in accordance with the
provisions of Income Tax Ordinance, 2001. The charge for current income tax is recorded after adjustment, if any, to the provision for tax made in prior years including those arising from assessment and amendments in assessments during the year in such years.
The profits and gains of the Subsidiary Company derived from electric power generation are exempt from income tax in terms of Clause 132 of Part I of the Second Schedule to the Income Tax Ordinance, 2001 subject to the conditions and limitations provided therein. Under clause 11A of Part IV of the Second Schedule to the Income Tax Ordinance, 2001, the Subsidiary Company is also exempt from levy of minimum tax on 'turnover' under section 113 of the Income Tax Ordinance, 2001. However, full provision is made in the consolidated profit and loss account on income from other sources not covered under the above clauses at current rate of taxation after taking into account tax credits and rebates available, if any.
Deferred The Holding Company accounts for deferred taxation on all temporary differences using liability
method. Deferred tax asset is recognized only to the extent that it is probable that future taxable profits will be available and the credits can be utilized.
162
Thatta Cement
Deferred tax has not been provided in these consolidated financial statements for the Subsidiary Company as the Group's management believes that the temporary differences will not reverse in the foreseeable future due to the fact that the profits and gains of the Subsidiary Company derived from electric power generation are exempt from tax subject to the conditions and limitations provided for in the Income Tax Ordinance, 2001.
4.13 Trade and other payables These are recognized and carried at cost which is fair value of the consideration to be paid in
future for goods and services received, whether or not billed to the Group. 4.14 Provisions Provisions are recognized when the Group has a present legal or constructive obligation as a
result of past events and it is probable that an outflow of resources embodying economic benefits will be required to settle the obligation and a reliable estimate can be made of the amount of obligation. Provisions are reviewed at each consolidated balance sheet date and adjusted to reflect the best estimate.
4.15 Transactions with related parties Transactions in relation to sales, purchases and services with related parties are made at arm's
length prices except for the allocation of expenses such as sharing of electricity, gas, water, repair and maintenance with the Subsidiary Company relating to the Head Office and Business Support Services for which the pricing mechanism is subject to the approval of the Board of Directors.
4.16 Revenue recognition Thatta Cement Company Limited Revenue is recognized to the extent it is probable that the economic benefits will flow to the
Holding Company and the revenue can be measured reliably. Revenue is measured at the fair value of the consideration received or receivable. Revenue from sales is recognised upon passage of title to the customers usually on dispatch of goods. Export sales are recognised as revenue when significant risks and rewards of ownership of goods are transferred. Interest and rentals / other income are recognised on accrual basis.
Thatta Power (Private) Limited Revenue from the sale of electric power is recorded based upon the output delivered and grid
unavailability at rates specified under the Power Purchase Agreement whereas income on short term investments is recorded on accrual basis using effective interest rate method. Interest and other income are recognised on accrual basis.
4.17 Financial instruments All the financial assets and financial liabilities are recognized at the time when the Group becomes
a party to the contractual provisions of the instrument. Financial assets are de-recognized at the time when the Group looses control of the contractual rights that comprises the financial assets. Financial liabilities are de-recognized at the time when they are extinguished, that is when the obligation specified in the contract is discharged, cancelled or expired. Any gains or losses on de-recognition of financial assets and financial liabilities are taken to the consolidated profit and loss account.
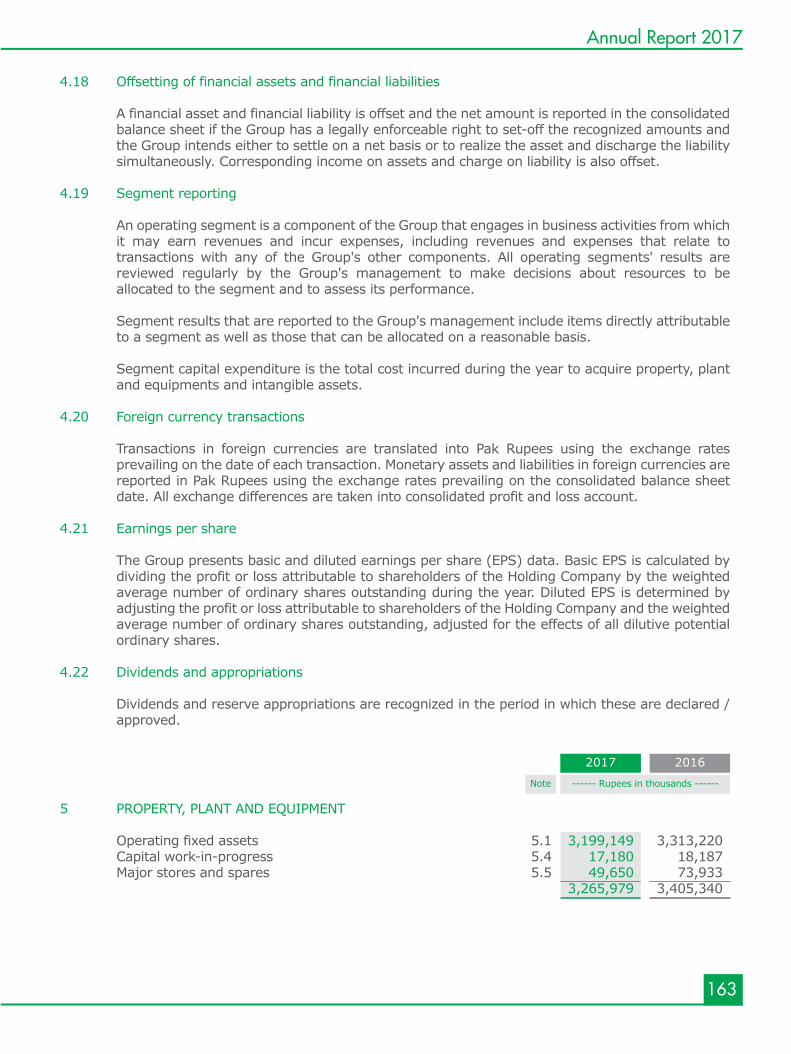
163
Annual Report 2017
4.18 Offsetting of financial assets and financial liabilities A financial asset and financial liability is offset and the net amount is reported in the consolidated
balance sheet if the Group has a legally enforceable right to set-off the recognized amounts and the Group intends either to settle on a net basis or to realize the asset and discharge the liability simultaneously. Corresponding income on assets and charge on liability is also offset.
4.19 Segment reporting An operating segment is a component of the Group that engages in business activities from which
it may earn revenues and incur expenses, including revenues and expenses that relate to transactions with any of the Group's other components. All operating segments' results are reviewed regularly by the Group's management to make decisions about resources to be allocated to the segment and to assess its performance.
Segment results that are reported to the Group's management include items directly attributable
to a segment as well as those that can be allocated on a reasonable basis.
Segment capital expenditure is the total cost incurred during the year to acquire property, plant and equipments and intangible assets.
4.20 Foreign currency transactions Transactions in foreign currencies are translated into Pak Rupees using the exchange rates
prevailing on the date of each transaction. Monetary assets and liabilities in foreign currencies are reported in Pak Rupees using the exchange rates prevailing on the consolidated balance sheet date. All exchange differences are taken into consolidated profit and loss account.
4.21 Earnings per share The Group presents basic and diluted earnings per share (EPS) data. Basic EPS is calculated by
dividing the profit or loss attributable to shareholders of the Holding Company by the weighted average number of ordinary shares outstanding during the year. Diluted EPS is determined by adjusting the profit or loss attributable to shareholders of the Holding Company and the weighted average number of ordinary shares outstanding, adjusted for the effects of all dilutive potential ordinary shares.
4.22 Dividends and appropriations Dividends and reserve appropriations are recognized in the period in which these are declared /
approved.
5 PROPERTY, PLANT AND EQUIPMENT Operating fixed assets 5.1 3,199,149 3,313,220 Capital work-in-progress 5.4 17,180 18,187 Major stores and spares 5.5 49,650 73,933 3,265,979 3,405,340
------ Rupees in thousands ------Note
2017 2016------ Rupees in thousands ------Note
2017 2016
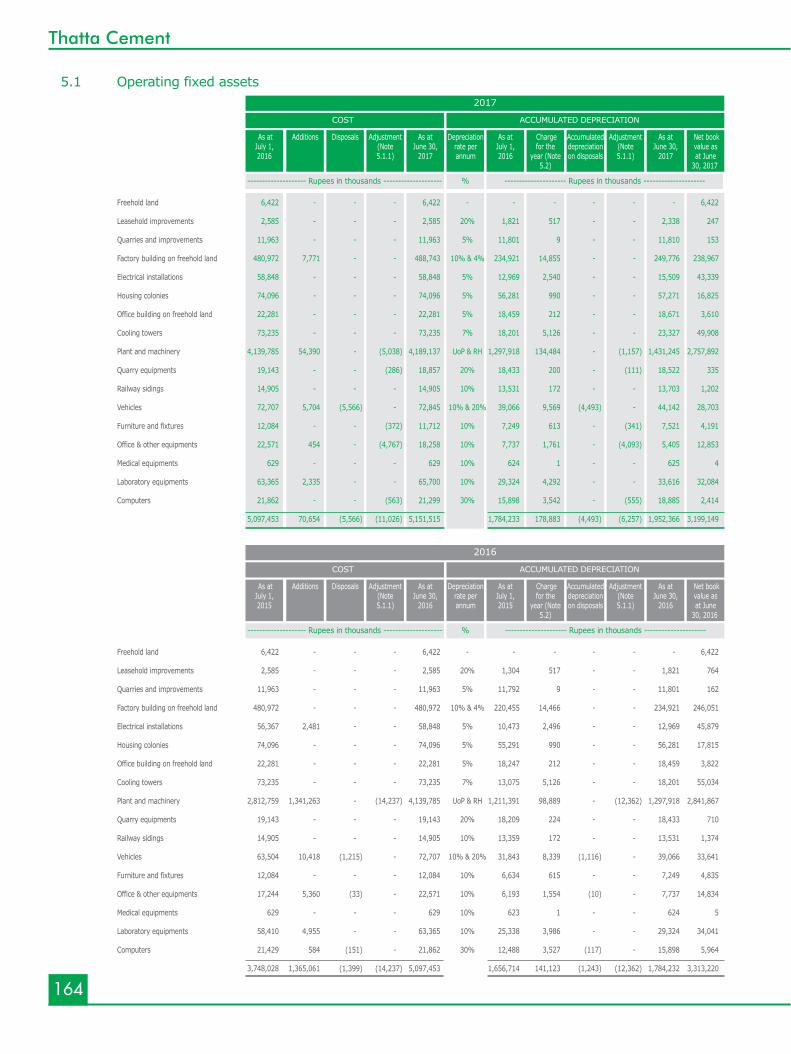
164
Thatta Cement
Freehold land 6,422 - - - 6,422 - - - - - - 6,422
Leasehold improvements 2,585 - - - 2,585 20% 1,821 517 - - 2,338 247
Quarries and improvements 11,963 - - - 11,963 5% 11,801 9 - - 11,810 153
Factory building on freehold land 480,972 7,771 - - 488,743 10% & 4% 234,921 14,855 - - 249,776 238,967
Electrical installations 58,848 - - - 58,848 5% 12,969 2,540 - - 15,509 43,339
Housing colonies 74,096 - - - 74,096 5% 56,281 990 - - 57,271 16,825
Office building on freehold land 22,281 - - - 22,281 5% 18,459 212 - - 18,671 3,610
Cooling towers 73,235 - - - 73,235 7% 18,201 5,126 - - 23,327 49,908
Plant and machinery 4,139,785 54,390 - (5,038) 4,189,137 UoP & RH 1,297,918 134,484 - (1,157) 1,431,245 2,757,892
Quarry equipments 19,143 - - (286) 18,857 20% 18,433 200 - (111) 18,522 335
Railway sidings 14,905 - - - 14,905 10% 13,531 172 - - 13,703 1,202
Vehicles 72,707 5,704 (5,566) - 72,845 10% & 20% 39,066 9,569 (4,493) - 44,142 28,703
Furniture and fixtures 12,084 - - (372) 11,712 10% 7,249 613 - (341) 7,521 4,191
Office & other equipments 22,571 454 - (4,767) 18,258 10% 7,737 1,761 - (4,093) 5,405 12,853
Medical equipments 629 - - - 629 10% 624 1 - - 625 4
Laboratory equipments 63,365 2,335 - - 65,700 10% 29,324 4,292 - - 33,616 32,084
Computers 21,862 - - (563) 21,299 30% 15,898 3,542 - (555) 18,885 2,414
5,097,453 70,654 (5,566) (11,026) 5,151,515 1,784,233 178,883 (4,493) (6,257) 1,952,366 3,199,149
5.1 Operating fixed assets
COST
As atJuly 1,2016
Additions Disposals As atJune 30,
2017
As atJuly 1,2016
As atJune 30,
2017
Net bookvalue asat June
30, 2017
Accumulateddepreciationon disposals
Adjustment(Note5.1.1)
Chargefor the
year (Note5.2)
Depreciationrate perannum
Adjustment(Note5.1.1)
ACCUMULATED DEPRECIATION
-------------------- Rupees in thousands -------------------- --------------------- Rupees in thousands ---------------------%
2017
Freehold land 6,422 - - - 6,422 - - - - - - 6,422
Leasehold improvements 2,585 - - - 2,585 20% 1,304 517 - - 1,821 764
Quarries and improvements 11,963 - - - 11,963 5% 11,792 9 - - 11,801 162
Factory building on freehold land 480,972 - - - 480,972 10% & 4% 220,455 14,466 - - 234,921 246,051
Electrical installations 56,367 2,481 - - 58,848 5% 10,473 2,496 - - 12,969 45,879
Housing colonies 74,096 - - - 74,096 5% 55,291 990 - - 56,281 17,815
Office building on freehold land 22,281 - - - 22,281 5% 18,247 212 - - 18,459 3,822
Cooling towers 73,235 - - - 73,235 7% 13,075 5,126 - - 18,201 55,034
Plant and machinery 2,812,759 1,341,263 - (14,237) 4,139,785 UoP & RH 1,211,391 98,889 - (12,362) 1,297,918 2,841,867
Quarry equipments 19,143 - - - 19,143 20% 18,209 224 - - 18,433 710
Railway sidings 14,905 - - - 14,905 10% 13,359 172 - - 13,531 1,374
Vehicles 63,504 10,418 (1,215) - 72,707 10% & 20% 31,843 8,339 (1,116) - 39,066 33,641
Furniture and fixtures 12,084 - - - 12,084 10% 6,634 615 - - 7,249 4,835
Office & other equipments 17,244 5,360 (33) - 22,571 10% 6,193 1,554 (10) - 7,737 14,834
Medical equipments 629 - - - 629 10% 623 1 - - 624 5
Laboratory equipments 58,410 4,955 - - 63,365 10% 25,338 3,986 - - 29,324 34,041
Computers 21,429 584 (151) - 21,862 30% 12,488 3,527 (117) - 15,898 5,964
3,748,028 1,365,061 (1,399) (14,237) 5,097,453 1,656,714 141,123 (1,243) (12,362) 1,784,232 3,313,220
COST
As atJuly 1,2015
Additions Disposals As atJune 30,
2016
As atJuly 1,2015
As atJune 30,
2016
Net bookvalue asat June
30, 2016
Accumulateddepreciationon disposals
Adjustment(Note5.1.1)
Chargefor the
year (Note5.2)
Depreciationrate perannum
Adjustment(Note5.1.1)
ACCUMULATED DEPRECIATION
-------------------- Rupees in thousands -------------------- --------------------- Rupees in thousands ---------------------%
2016
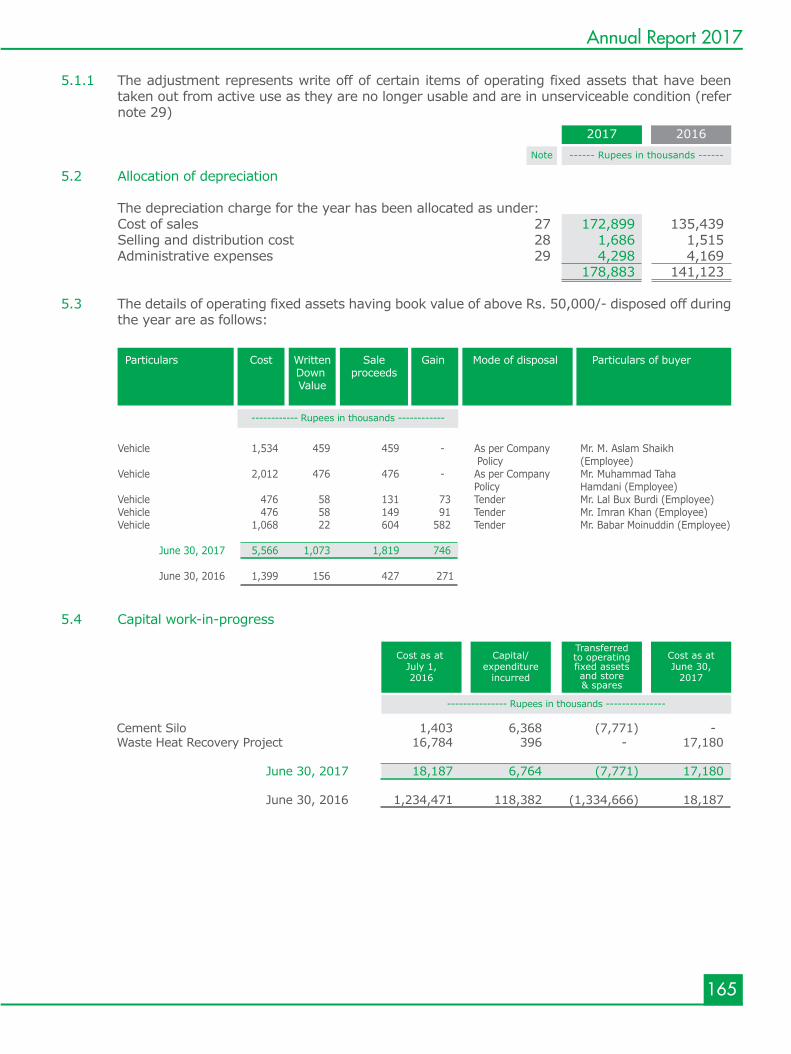
165
Annual Report 2017
5.1.1 The adjustment represents write off of certain items of operating fixed assets that have been taken out from active use as they are no longer usable and are in unserviceable condition (refer note 29)
5.2 Allocation of depreciation The depreciation charge for the year has been allocated as under: Cost of sales 27 172,899 135,439 Selling and distribution cost 28 1,686 1,515 Administrative expenses 29 4,298 4,169 178,883 141,123
5.3 The details of operating fixed assets having book value of above Rs. 50,000/- disposed off during the year are as follows:
Vehicle 1,534 459 459 - As per Company Mr. M. Aslam Shaikh Policy (Employee) Vehicle 2,012 476 476 - As per Company Mr. Muhammad Taha Policy Hamdani (Employee) Vehicle 476 58 131 73 Tender Mr. Lal Bux Burdi (Employee) Vehicle 476 58 149 91 Tender Mr. Imran Khan (Employee) Vehicle 1,068 22 604 582 Tender Mr. Babar Moinuddin (Employee) June 30, 2017 5,566 1,073 1,819 746
June 30, 2016 1,399 156 427 271
Particulars Cost WrittenDown Value
Saleproceeds
Gain Mode of disposal Particulars of buyer
------------ Rupees in thousands ------------
------ Rupees in thousands ------Note
2017 2016
5.4 Capital work-in-progress
Cement Silo 1,403 6,368 (7,771) - Waste Heat Recovery Project 16,784 396 - 17,180
June 30, 2017 18,187 6,764 (7,771) 17,180 June 30, 2016 1,234,471 118,382 (1,334,666) 18,187
--------------- Rupees in thousands ---------------
Transferredto operatingfixed assetsand store& spares
Cost as atJune 30,
2017
Cost as at July 1,2016
Capital/expenditure
incurred
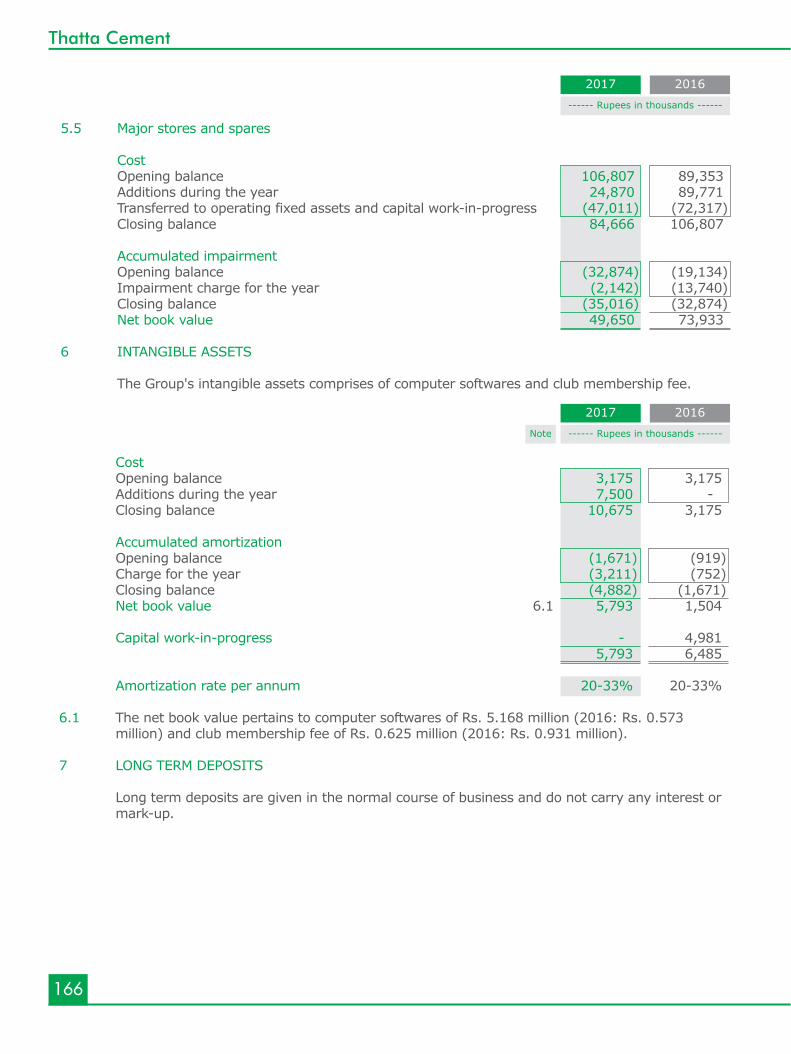
166
Thatta Cement
------ Rupees in thousands ------
2017 2016
------ Rupees in thousands ------Note
2017 2016
Cost Opening balance 3,175 3,175 Additions during the year 7,500 - Closing balance 10,675 3,175 Accumulated amortization Opening balance (1,671) (919) Charge for the year (3,211) (752) Closing balance (4,882) (1,671) Net book value 6.1 5,793 1,504
Capital work-in-progress - 4,981 5,793 6,485 Amortization rate per annum 20-33% 20-33%
6.1 The net book value pertains to computer softwares of Rs. 5.168 million (2016: Rs. 0.573 million) and club membership fee of Rs. 0.625 million (2016: Rs. 0.931 million).
7 LONG TERM DEPOSITS Long term deposits are given in the normal course of business and do not carry any interest or
mark-up.
5.5 Major stores and spares
Cost Opening balance 106,807 89,353 Additions during the year 24,870 89,771 Transferred to operating fixed assets and capital work-in-progress (47,011) (72,317) Closing balance 84,666 106,807 Accumulated impairment Opening balance (32,874) (19,134) Impairment charge for the year (2,142) (13,740) Closing balance (35,016) (32,874) Net book value 49,650 73,933
6 INTANGIBLE ASSETS
The Group's intangible assets comprises of computer softwares and club membership fee.
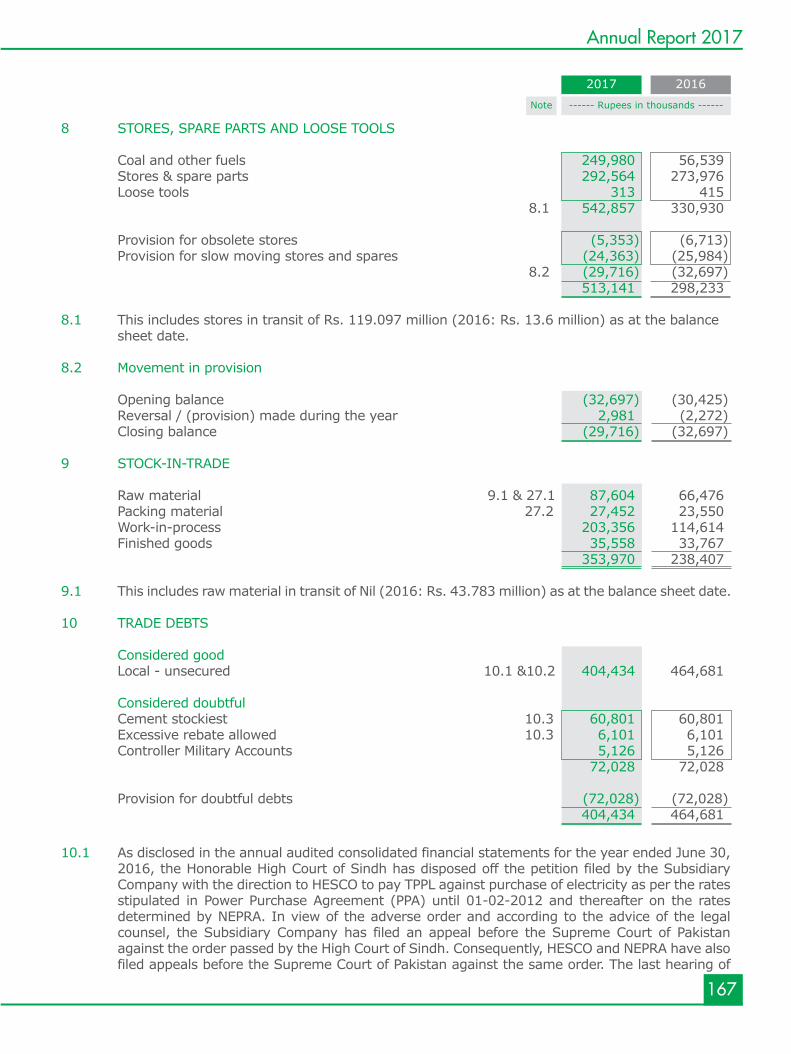
167
Annual Report 2017
------ Rupees in thousands ------Note
2017 2016
10.1 As disclosed in the annual audited consolidated financial statements for the year ended June 30, 2016, the Honorable High Court of Sindh has disposed off the petition filed by the Subsidiary Company with the direction to HESCO to pay TPPL against purchase of electricity as per the rates stipulated in Power Purchase Agreement (PPA) until 01-02-2012 and thereafter on the rates determined by NEPRA. In view of the adverse order and according to the advice of the legal counsel, the Subsidiary Company has filed an appeal before the Supreme Court of Pakistan against the order passed by the High Court of Sindh. Consequently, HESCO and NEPRA have also filed appeals before the Supreme Court of Pakistan against the same order. The last hearing of
8 STORES, SPARE PARTS AND LOOSE TOOLS
Coal and other fuels 249,980 56,539 Stores & spare parts 292,564 273,976 Loose tools 313 415 8.1 542,857 330,930
Provision for obsolete stores (5,353) (6,713) Provision for slow moving stores and spares (24,363) (25,984) 8.2 (29,716) (32,697) 513,141 298,233
8.1 This includes stores in transit of Rs. 119.097 million (2016: Rs. 13.6 million) as at the balance sheet date.
8.2 Movement in provision
Opening balance (32,697) (30,425) Reversal / (provision) made during the year 2,981 (2,272) Closing balance (29,716) (32,697)
9 STOCK-IN-TRADE
Raw material 9.1 & 27.1 87,604 66,476 Packing material 27.2 27,452 23,550 Work-in-process 203,356 114,614 Finished goods 35,558 33,767 353,970 238,407
9.1 This includes raw material in transit of Nil (2016: Rs. 43.783 million) as at the balance sheet date.
10 TRADE DEBTS
Considered good Local - unsecured 10.1 &10.2 404,434 464,681
Considered doubtful Cement stockiest 10.3 60,801 60,801 Excessive rebate allowed 10.3 6,101 6,101 Controller Military Accounts 5,126 5,126
72,028 72,028
Provision for doubtful debts (72,028) (72,028) 404,434 464,681
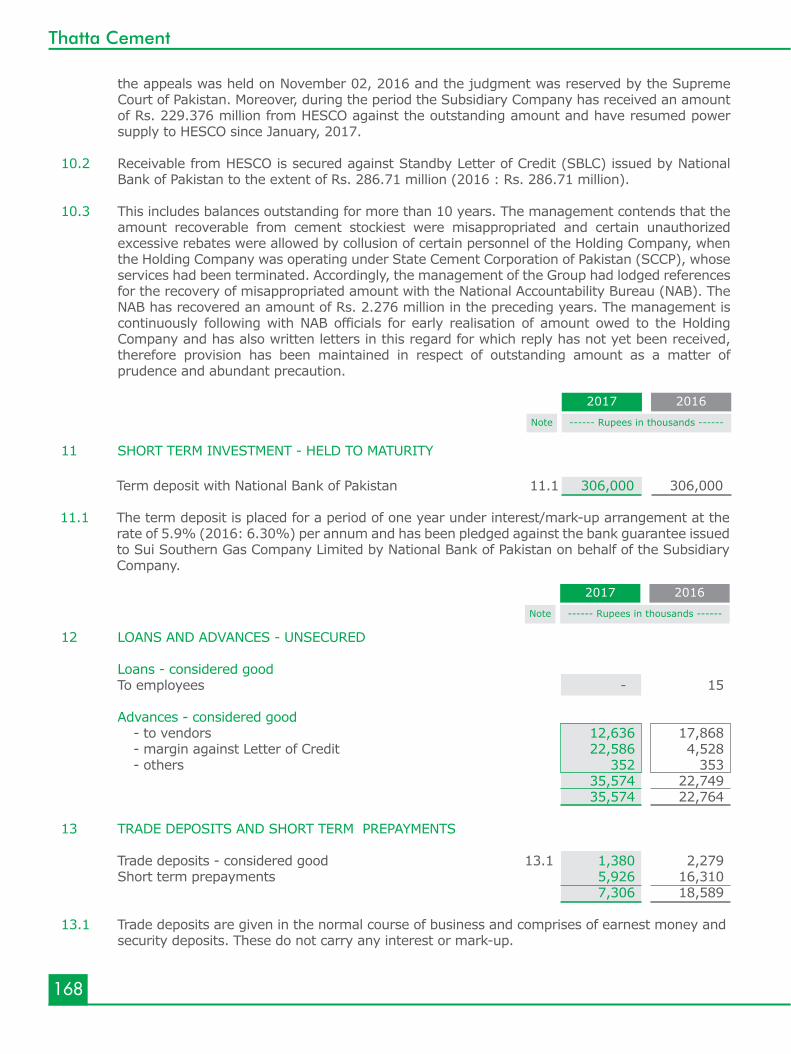
168
Thatta Cement
the appeals was held on November 02, 2016 and the judgment was reserved by the Supreme Court of Pakistan. Moreover, during the period the Subsidiary Company has received an amount
of Rs. 229.376 million from HESCO against the outstanding amount and have resumed power supply to HESCO since January, 2017.
10.2 Receivable from HESCO is secured against Standby Letter of Credit (SBLC) issued by National
Bank of Pakistan to the extent of Rs. 286.71 million (2016 : Rs. 286.71 million). 10.3 This includes balances outstanding for more than 10 years. The management contends that the
amount recoverable from cement stockiest were misappropriated and certain unauthorized excessive rebates were allowed by collusion of certain personnel of the Holding Company, when the Holding Company was operating under State Cement Corporation of Pakistan (SCCP), whose services had been terminated. Accordingly, the management of the Group had lodged references for the recovery of misappropriated amount with the National Accountability Bureau (NAB). The NAB has recovered an amount of Rs. 2.276 million in the preceding years. The management is continuously following with NAB officials for early realisation of amount owed to the Holding Company and has also written letters in this regard for which reply has not yet been received, therefore provision has been maintained in respect of outstanding amount as a matter of prudence and abundant precaution.
11 SHORT TERM INVESTMENT - HELD TO MATURITY
------ Rupees in thousands ------Note
2017 2016
12 LOANS AND ADVANCES - UNSECURED
Loans - considered good To employees - 15 Advances - considered good - to vendors 12,636 17,868 - margin against Letter of Credit 22,586 4,528 - others 352 353 35,574 22,749 35,574 22,764
13 TRADE DEPOSITS AND SHORT TERM PREPAYMENTS
Trade deposits - considered good 13.1 1,380 2,279 Short term prepayments 5,926 16,310
7,306 18,589
13.1 Trade deposits are given in the normal course of business and comprises of earnest money and security deposits. These do not carry any interest or mark-up.
------ Rupees in thousands ------Note
2017 2016
Term deposit with National Bank of Pakistan 11.1 306,000 306,000
11.1 The term deposit is placed for a period of one year under interest/mark-up arrangement at the rate of 5.9% (2016: 6.30%) per annum and has been pledged against the bank guarantee issued to Sui Southern Gas Company Limited by National Bank of Pakistan on behalf of the Subsidiary Company.
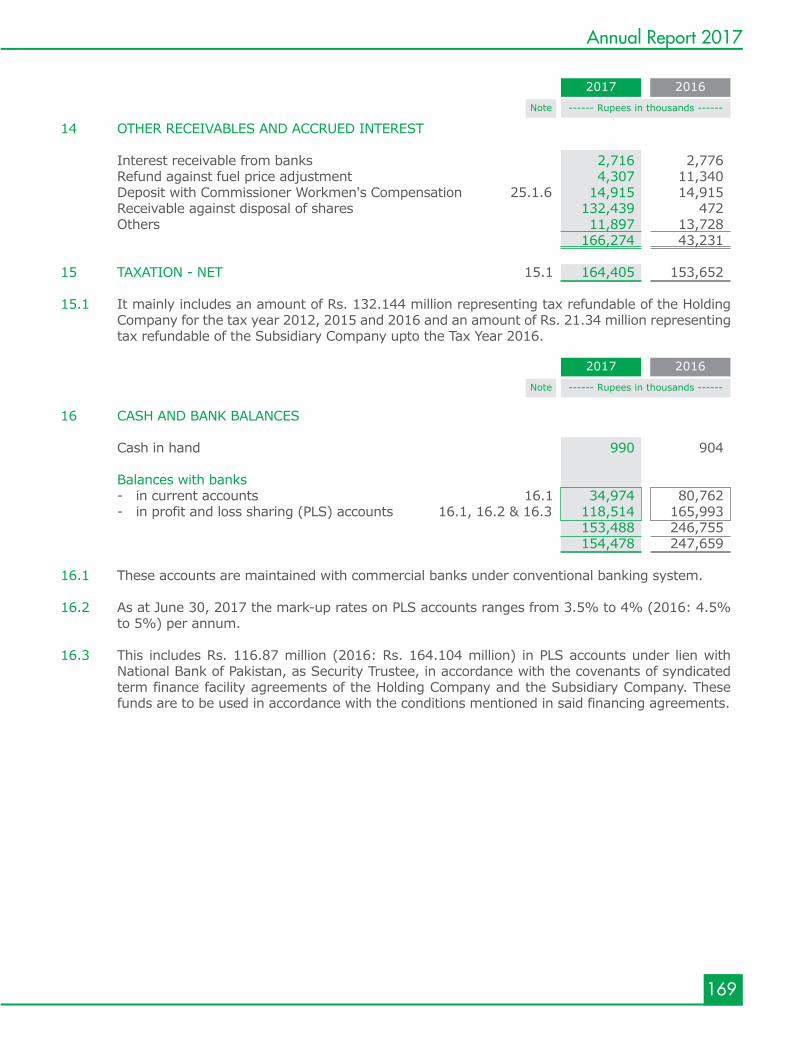
169
Annual Report 2017
------ Rupees in thousands ------Note
2017 2016
------ Rupees in thousands ------Note
2017 2016
14 OTHER RECEIVABLES AND ACCRUED INTEREST
Interest receivable from banks 2,716 2,776 Refund against fuel price adjustment 4,307 11,340 Deposit with Commissioner Workmen's Compensation 25.1.6 14,915 14,915 Receivable against disposal of shares 132,439 472 Others 11,897 13,728 166,274 43,231
15 TAXATION - NET 15.1 164,405 153,652
15.1 It mainly includes an amount of Rs. 132.144 million representing tax refundable of the Holding Company for the tax year 2012, 2015 and 2016 and an amount of Rs. 21.34 million representing tax refundable of the Subsidiary Company upto the Tax Year 2016.
16 CASH AND BANK BALANCES
Cash in hand 990 904
Balances with banks - in current accounts 16.1 34,974 80,762 - in profit and loss sharing (PLS) accounts 16.1, 16.2 & 16.3 118,514 165,993 153,488 246,755 154,478 247,659
16.1 These accounts are maintained with commercial banks under conventional banking system.
16.2 As at June 30, 2017 the mark-up rates on PLS accounts ranges from 3.5% to 4% (2016: 4.5% to 5%) per annum.
16.3 This includes Rs. 116.87 million (2016: Rs. 164.104 million) in PLS accounts under lien with National Bank of Pakistan, as Security Trustee, in accordance with the covenants of syndicated term finance facility agreements of the Holding Company and the Subsidiary Company. These funds are to be used in accordance with the conditions mentioned in said financing agreements.
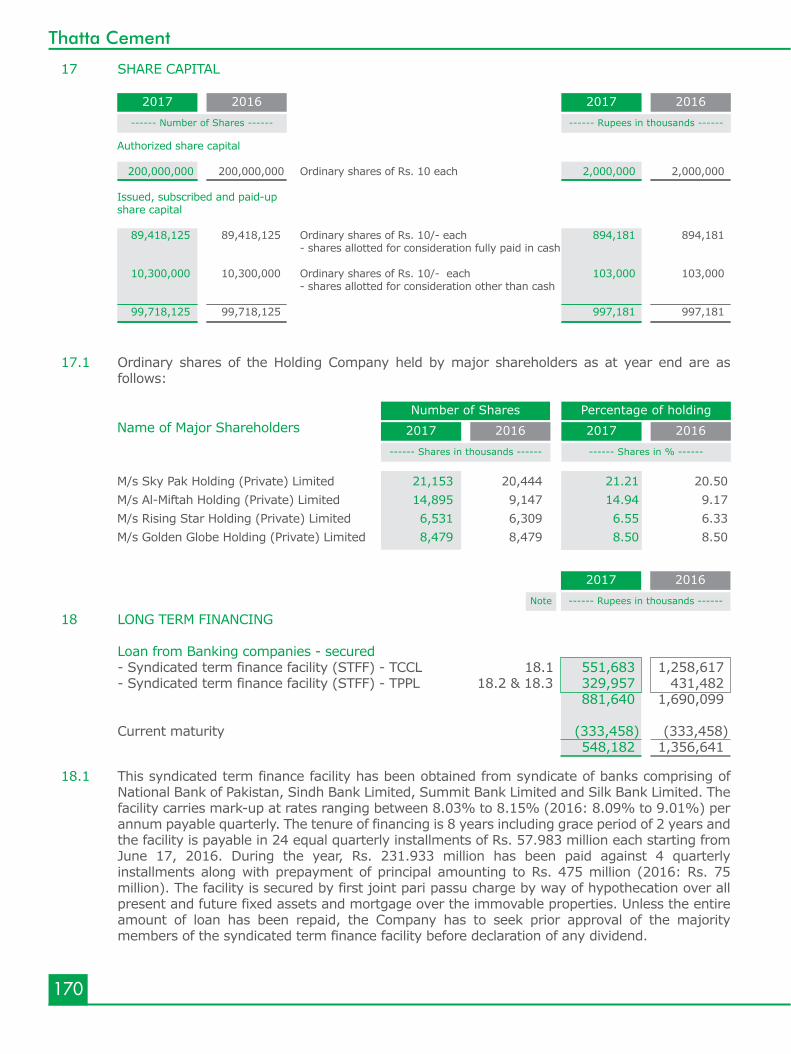
170
Thatta Cement
------ Rupees in thousands ------Note
2017 2016
18 LONG TERM FINANCING
Loan from Banking companies - secured - Syndicated term finance facility (STFF) - TCCL 18.1 551,683 1,258,617 - Syndicated term finance facility (STFF) - TPPL 18.2 & 18.3 329,957 431,482 881,640 1,690,099 Current maturity (333,458) (333,458) 548,182 1,356,641
17 SHARE CAPITAL
Authorized share capital
200,000,000 200,000,000 Ordinary shares of Rs. 10 each 2,000,000 2,000,000
Issued, subscribed and paid-up share capital 89,418,125 89,418,125 Ordinary shares of Rs. 10/- each 894,181 894,181 - shares allotted for consideration fully paid in cash 10,300,000 10,300,000 Ordinary shares of Rs. 10/- each 103,000 103,000 - shares allotted for consideration other than cash 99,718,125 99,718,125 997,181 997,181
------ Rupees in thousands ------
2017 2016------ Number of Shares ------
2017 2016
Number of Shares Percentage of holding
------ Shares in % ------
2017 2016------ Shares in thousands ------
2017 2016 Name of Major Shareholders
M/s Sky Pak Holding (Private) Limited 21,153 20,444 21.21 20.50
M/s Al-Miftah Holding (Private) Limited 14,895 9,147 14.94 9.17 M/s Rising Star Holding (Private) Limited 6,531 6,309 6.55 6.33 M/s Golden Globe Holding (Private) Limited 8,479 8,479 8.50 8.50
17.1 Ordinary shares of the Holding Company held by major shareholders as at year end are as follows:
18.1 This syndicated term finance facility has been obtained from syndicate of banks comprising of National Bank of Pakistan, Sindh Bank Limited, Summit Bank Limited and Silk Bank Limited. The facility carries mark-up at rates ranging between 8.03% to 8.15% (2016: 8.09% to 9.01%) per annum payable quarterly. The tenure of financing is 8 years including grace period of 2 years and the facility is payable in 24 equal quarterly installments of Rs. 57.983 million each starting from June 17, 2016. During the year, Rs. 231.933 million has been paid against 4 quarterly installments along with prepayment of principal amounting to Rs. 475 million (2016: Rs. 75 million). The facility is secured by first joint pari passu charge by way of hypothecation over all present and future fixed assets and mortgage over the immovable properties. Unless the entire amount of loan has been repaid, the Company has to seek prior approval of the majority members of the syndicated term finance facility before declaration of any dividend.
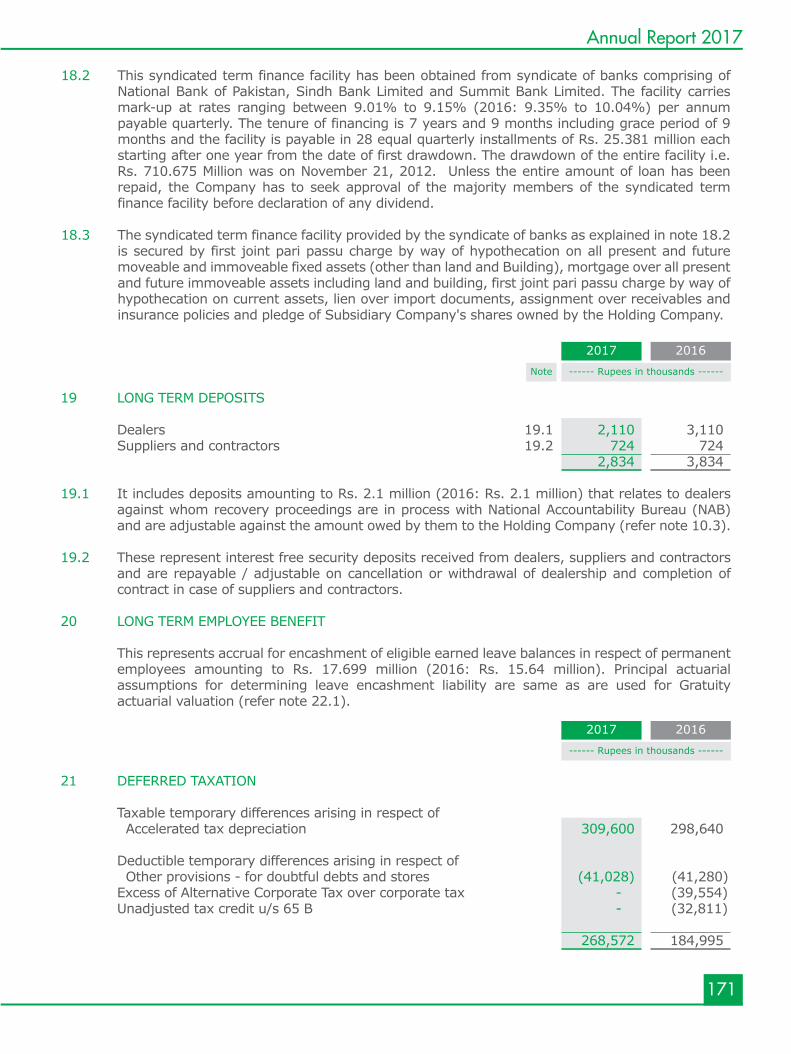
19 LONG TERM DEPOSITS
Dealers 19.1 2,110 3,110 Suppliers and contractors 19.2 724 724
2,834 3,834
19.1 It includes deposits amounting to Rs. 2.1 million (2016: Rs. 2.1 million) that relates to dealers against whom recovery proceedings are in process with National Accountability Bureau (NAB) and are adjustable against the amount owed by them to the Holding Company (refer note 10.3).
19.2 These represent interest free security deposits received from dealers, suppliers and contractors and are repayable / adjustable on cancellation or withdrawal of dealership and completion of contract in case of suppliers and contractors.
20 LONG TERM EMPLOYEE BENEFIT
This represents accrual for encashment of eligible earned leave balances in respect of permanent employees amounting to Rs. 17.699 million (2016: Rs. 15.64 million). Principal actuarial assumptions for determining leave encashment liability are same as are used for Gratuity actuarial valuation (refer note 22.1).
21 DEFERRED TAXATION
Taxable temporary differences arising in respect of Accelerated tax depreciation 309,600 298,640
Deductible temporary differences arising in respect of Other provisions - for doubtful debts and stores (41,028) (41,280)Excess of Alternative Corporate Tax over corporate tax - (39,554)Unadjusted tax credit u/s 65 B - (32,811)
268,572 184,995
171
Annual Report 2017
------ Rupees in thousands ------Note
2017 2016
------ Rupees in thousands ------
2017 2016
18.2 This syndicated term finance facility has been obtained from syndicate of banks comprising of National Bank of Pakistan, Sindh Bank Limited and Summit Bank Limited. The facility carries mark-up at rates ranging between 9.01% to 9.15% (2016: 9.35% to 10.04%) per annum payable quarterly. The tenure of financing is 7 years and 9 months including grace period of 9 months and the facility is payable in 28 equal quarterly installments of Rs. 25.381 million each starting after one year from the date of first drawdown. The drawdown of the entire facility i.e. Rs. 710.675 Million was on November 21, 2012. Unless the entire amount of loan has been repaid, the Company has to seek approval of the majority members of the syndicated term finance facility before declaration of any dividend.
18.3 The syndicated term finance facility provided by the syndicate of banks as explained in note 18.2 is secured by first joint pari passu charge by way of hypothecation on all present and future moveable and immoveable fixed assets (other than land and Building), mortgage over all present and future immoveable assets including land and building, first joint pari passu charge by way of hypothecation on current assets, lien over import documents, assignment over receivables and insurance policies and pledge of Subsidiary Company's shares owned by the Holding Company.
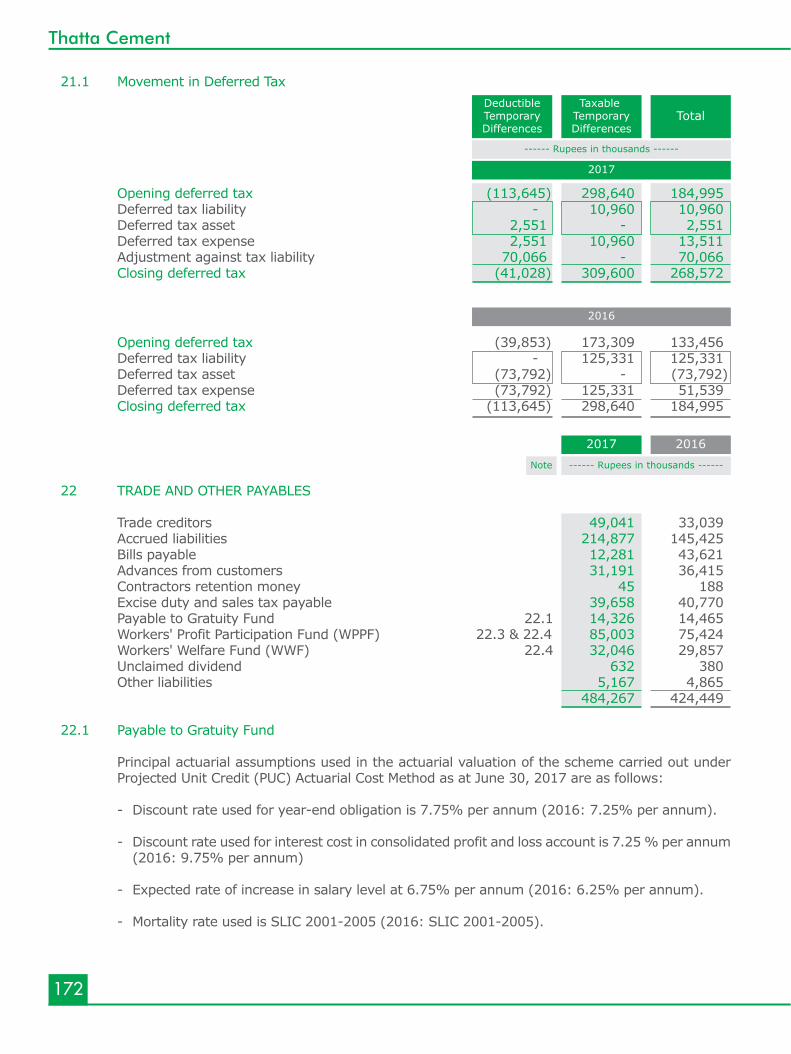
22 TRADE AND OTHER PAYABLES Trade creditors 49,041 33,039 Accrued liabilities 214,877 145,425 Bills payable 12,281 43,621 Advances from customers 31,191 36,415 Contractors retention money 45 188 Excise duty and sales tax payable 39,658 40,770 Payable to Gratuity Fund 22.1 14,326 14,465 Workers' Profit Participation Fund (WPPF) 22.3 & 22.4 85,003 75,424 Workers' Welfare Fund (WWF) 22.4 32,046 29,857 Unclaimed dividend 632 380 Other liabilities 5,167 4,865 484,267 424,449
22.1 Payable to Gratuity Fund
Principal actuarial assumptions used in the actuarial valuation of the scheme carried out under Projected Unit Credit (PUC) Actuarial Cost Method as at June 30, 2017 are as follows:
- Discount rate used for year-end obligation is 7.75% per annum (2016: 7.25% per annum).
- Discount rate used for interest cost in consolidated profit and loss account is 7.25 % per annum (2016: 9.75% per annum)
- Expected rate of increase in salary level at 6.75% per annum (2016: 6.25% per annum). - Mortality rate used is SLIC 2001-2005 (2016: SLIC 2001-2005).
------ Rupees in thousands ------Note
2017 2016
172
Thatta Cement
21.1 Movement in Deferred Tax
Opening deferred tax (113,645) 298,640 184,995 Deferred tax liability - 10,960 10,960 Deferred tax asset 2,551 - 2,551 Deferred tax expense 2,551 10,960 13,511 Adjustment against tax liability 70,066 - 70,066 Closing deferred tax (41,028) 309,600 268,572
2017
Taxable TemporaryDifferences
TotalDeductibleTemporaryDifferences
2016
Opening deferred tax (39,853) 173,309 133,456 Deferred tax liability - 125,331 125,331 Deferred tax asset (73,792) - (73,792) Deferred tax expense (73,792) 125,331 51,539 Closing deferred tax (113,645) 298,640 184,995
------ Rupees in thousands ------
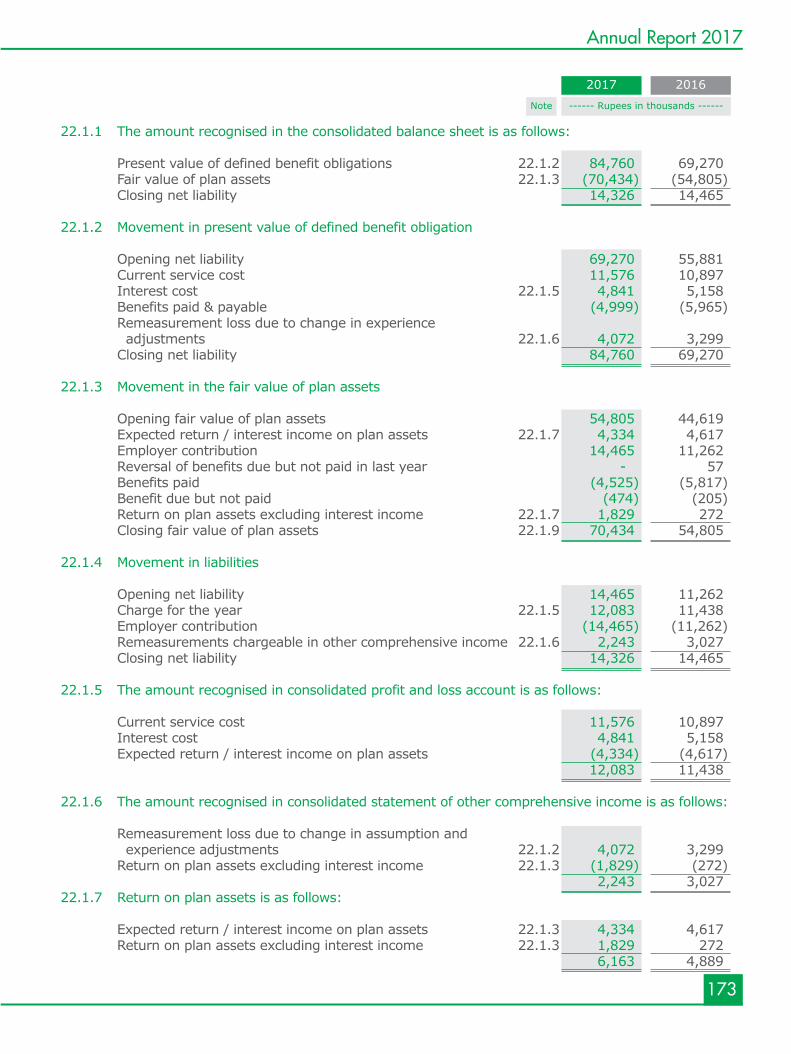
22.1.1 The amount recognised in the consolidated balance sheet is as follows: Present value of defined benefit obligations 22.1.2 84,760 69,270 Fair value of plan assets 22.1.3 (70,434) (54,805) Closing net liability 14,326 14,465 22.1.2 Movement in present value of defined benefit obligation Opening net liability 69,270 55,881 Current service cost 11,576 10,897 Interest cost 22.1.5 4,841 5,158 Benefits paid & payable (4,999) (5,965) Remeasurement loss due to change in experience adjustments 22.1.6 4,072 3,299 Closing net liability 84,760 69,270 22.1.3 Movement in the fair value of plan assets Opening fair value of plan assets 54,805 44,619 Expected return / interest income on plan assets 22.1.7 4,334 4,617 Employer contribution 14,465 11,262 Reversal of benefits due but not paid in last year - 57 Benefits paid (4,525) (5,817) Benefit due but not paid (474) (205) Return on plan assets excluding interest income 22.1.7 1,829 272 Closing fair value of plan assets 22.1.9 70,434 54,805 22.1.4 Movement in liabilities Opening net liability 14,465 11,262 Charge for the year 22.1.5 12,083 11,438 Employer contribution (14,465) (11,262) Remeasurements chargeable in other comprehensive income 22.1.6 2,243 3,027 Closing net liability 14,326 14,465
22.1.5 The amount recognised in consolidated profit and loss account is as follows:
Current service cost 11,576 10,897 Interest cost 4,841 5,158 Expected return / interest income on plan assets (4,334) (4,617) 12,083 11,438 22.1.6 The amount recognised in consolidated statement of other comprehensive income is as follows: Remeasurement loss due to change in assumption and experience adjustments 22.1.2 4,072 3,299 Return on plan assets excluding interest income 22.1.3 (1,829) (272) 2,243 3,027 22.1.7 Return on plan assets is as follows:
Expected return / interest income on plan assets 22.1.3 4,334 4,617 Return on plan assets excluding interest income 22.1.3 1,829 272 6,163 4,889
------ Rupees in thousands ------Note
2017 2016
173
Annual Report 2017
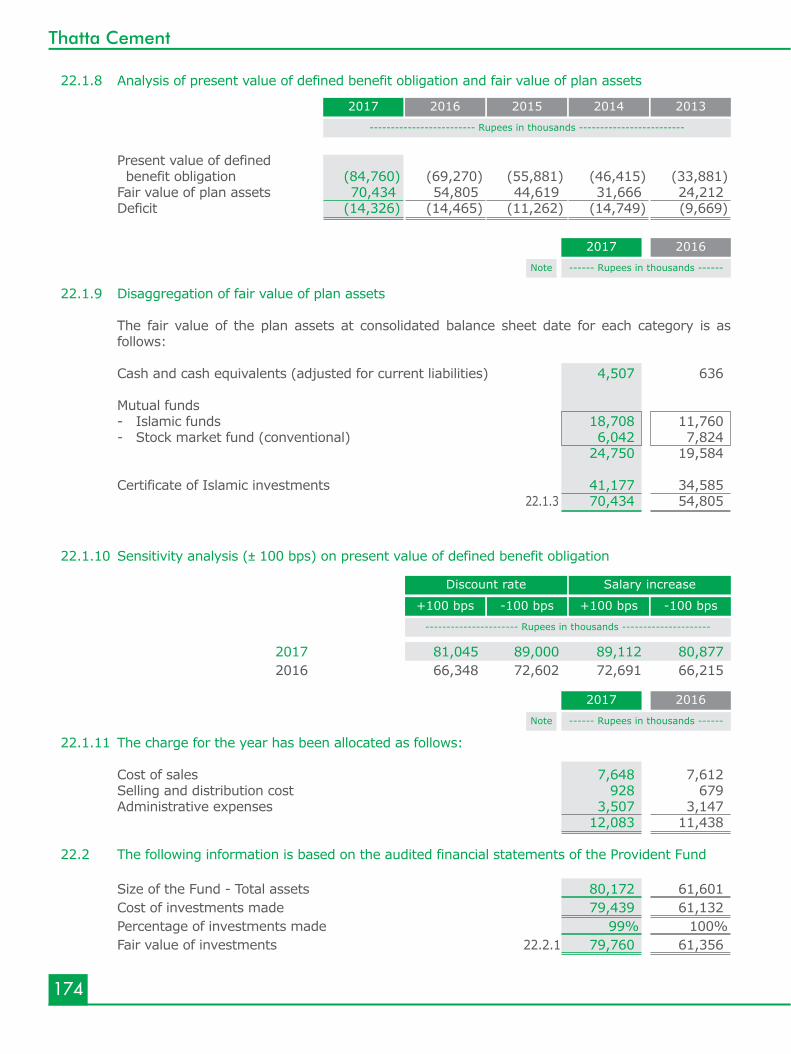
174
Thatta Cement
22.1.9 Disaggregation of fair value of plan assets
The fair value of the plan assets at consolidated balance sheet date for each category is as follows:
Cash and cash equivalents (adjusted for current liabilities) 4,507 636 Mutual funds - Islamic funds 18,708 11,760 - Stock market fund (conventional) 6,042 7,824 24,750 19,584 Certificate of Islamic investments 41,177 34,585 22.1.3 70,434 54,805
------ Rupees in thousands ------Note
2017 2016
22.1.8 Analysis of present value of defined benefit obligation and fair value of plan assets
Present value of defined benefit obligation (84,760) (69,270) (55,881) (46,415) (33,881) Fair value of plan assets 70,434 54,805 44,619 31,666 24,212 Deficit (14,326) (14,465) (11,262) (14,749) (9,669)
------------------------- Rupees in thousands -------------------------
20132014201520162017
22.1.10 Sensitivity analysis (± 100 bps) on present value of defined benefit obligation
2017 81,045 89,000 89,112 80,877 2016 66,348 72,602 72,691 66,215
---------------------- Rupees in thousands ---------------------
-100 bps+100 bps-100 bps+100 bps
Discount rate Salary increase
22.1.11 The charge for the year has been allocated as follows: Cost of sales 7,648 7,612 Selling and distribution cost 928 679 Administrative expenses 3,507 3,147 12,083 11,438 22.2 The following information is based on the audited financial statements of the Provident Fund
Size of the Fund - Total assets 80,172 61,601 Cost of investments made 79,439 61,132 Percentage of investments made 99% 100% Fair value of investments 22.2.1 79,760 61,356
------ Rupees in thousands ------Note
2017 2016
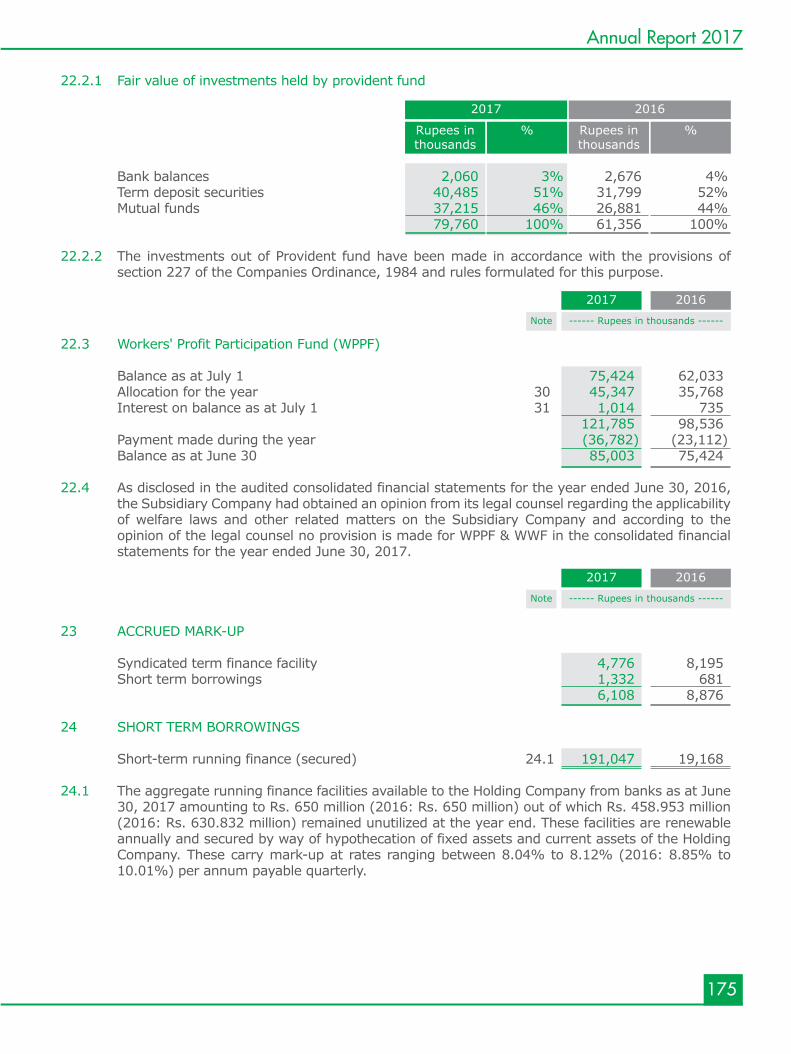
175
Annual Report 2017
22.3 Workers' Profit Participation Fund (WPPF) Balance as at July 1 75,424 62,033 Allocation for the year 30 45,347 35,768 Interest on balance as at July 1 31 1,014 735 121,785 98,536 Payment made during the year (36,782) (23,112) Balance as at June 30 85,003 75,424 22.4 As disclosed in the audited consolidated financial statements for the year ended June 30, 2016,
the Subsidiary Company had obtained an opinion from its legal counsel regarding the applicability of welfare laws and other related matters on the Subsidiary Company and according to the opinion of the legal counsel no provision is made for WPPF & WWF in the consolidated financial statements for the year ended June 30, 2017.
23 ACCRUED MARK-UP Syndicated term finance facility 4,776 8,195 Short term borrowings 1,332 681 6,108 8,876 24 SHORT TERM BORROWINGS Short-term running finance (secured) 24.1 191,047 19,168 24.1 The aggregate running finance facilities available to the Holding Company from banks as at June
30, 2017 amounting to Rs. 650 million (2016: Rs. 650 million) out of which Rs. 458.953 million (2016: Rs. 630.832 million) remained unutilized at the year end. These facilities are renewable annually and secured by way of hypothecation of fixed assets and current assets of the Holding Company. These carry mark-up at rates ranging between 8.04% to 8.12% (2016: 8.85% to 10.01%) per annum payable quarterly.
------ Rupees in thousands ------Note
2017 2016
------ Rupees in thousands ------Note
2017 2016
22.2.1 Fair value of investments held by provident fund
Bank balances 2,060 3% 2,676 4% Term deposit securities 40,485 51% 31,799 52% Mutual funds 37,215 46% 26,881 44% 79,760 100% 61,356 100% 22.2.2 The investments out of Provident fund have been made in accordance with the provisions of
section 227 of the Companies Ordinance, 1984 and rules formulated for this purpose.
%Rupees inthousands
%Rupees inthousands
2017 2016
176
Thatta Cement
25 CONTINGENCIES AND COMMITMENTS 25.1 Contingencies 25.1.1 During the year 2014-2015, Deputy Commissioner Inland Revenue (DCIR) passed an
assessment order under section 122(1)(5) of the Income Tax Ordinance, 2001 in respect of Tax Year 2014 raising a tax demand of Rs. 78.35 million by making certain disallowances and additions in taxable income as reported in the tax return of that year. The Holding Company filed an appeal with the Commissioner Inland Revenue - Appeals (CIR-A) against which the adverse order was passed by CIR-A. Therefore, appeal has been filed before Appellate Tribunal Inland Revenue (ATIR) against the said order, relating to certain add backs/disallowances which have been set-aside for afresh proceedings, which is pending for hearing. In view of Holding Company's tax consultant, the Holding Company has an arguable case on merit, however, definite outcome cannot be predicted.
25.1.2 The Holding Company has adjusted minimum tax aggregating to Rs. 31.47 million against its
income tax liability in terms of section 113(2)(c) of the Income Tax Ordinance, 2001. An appeal was filed in 2014-2015 before the Commissioner Inland Revenue - Appeals (CIR-A) against the order of Assessing Officer disallowing adjustment of minimum tax amounting to Rs. 15.721 million in respect of Tax Year 2012. However, the appeal before CIR-A has been decided against the Holding Company, therefore, further appeal has been filed before Appellate Tribunal Inland Revenue (ATIR) against the order of CIR-A which is pending for hearing.
Moreover, in view of the legal counsel, the Holding Company has a strong arguable case and the
matter can be agitated upto the level of Supreme Court of Pakistan. Hence, no provision in this respect has been made in these consolidated financial statements.
25.1.3 In respect of Tax Year 2008, an appeal was filed by the Holding Company in 2014-2015 before
Commissioner Inland Revenue - Appeals (CIR-A) against certain disallowances and additions in taxable income while passing assessment order under 122(5A) of the Income Tax Ordinance, 2001, thereby raising a tax demand of Rs. 2.787 million. The appeal has been heard, however order of CIR-A is pending. The management is confident that the Holding Company has an arguable case on merits, however definite outcome cannot be predicted. Hence, no provision is required to be made in these consolidated financial statements.
25.1.4 The Deputy Commissioner Inland Revenue (DCIR) has passed Assessment Orders in 2014-2015
raising an aggregate sales tax demand for Rs. 5.989 million by disallowing certain input tax claimed by the Holding Company in its sales tax return for tax period from July 2012 to February 2015. The Holding Company has filed appeals against such Assessment Orders before Commissioner Inland Revenue (CIR-A) who has passed orders aggregating to Rs. 5.91 million in favor of the Holding Company. The tax department has filed appeals against the said orders before Appellate Tribunal Inland Revenue (ATIR) which are pending for hearing. In view of Holding Company's tax consultant, favourable outcome of such appeals are anticipated; hence no provision is required to be made in these consolidated financial statements.
25.1.5 In respect of tax periods from July 2012 to December 2014, an Order in Original (ONO) has been issued by an Officer of Sales Tax in 2014-2015 against the Holding Company raising a demand of Rs. 244.274 million which is mainly based on comparison of industry average for fuel and power consumption with that of the Holding Company and thereby presuming the production quantities which in the view of tax authorities have not been subject to Sales Tax and Federal Excise Duty. Accordingly, the Holding Company has filed an appeal before Commissioner Inland Revenue - Appeals (CIR-A) against the ONO passed by the Officer of Sales Tax, however CIR–A decided the case against the Holding Company. Accordingly, the Holding Company has filed an appeal before the Appellate Tribunal Inland Revenue (ATIR) against the order of CIR-A. Moreover, recovery proceedings were also initiated by tax authorities in the matter for an aggregate demand amount
177
Annual Report 2017
of Rs. 488.548 million including 100% penalty on the principal amount as aforesaid. Therefore, the Holding Company filed a stay application against the said aggregate demand before Sindh High Court. The Sindh High Court has allowed ad interim relief against recovery of demand and refrained tax authorities to take any adverse action in this respect. During the year ended June 30, 2017, Appellate Tribunal Inland Revenue (ATIR) has passed an order in favor of the Holding Company. However, the aggrieved party i.e. Commissioner Inland Revenue, Zone II, Large Taxpayer Unit, Karachi has an option to file an appeal against the appellate order passed by ATIR in favor of the Holding Company before appellate court.
25.1.6 Certain ex-employees of the Holding Company contested the Holding Company's gratuity policy
of 30 days and filed a suit against the Holding Company demanding 60 days gratuity as applicable to the employees of former holding company having an impact of Rs. 14.9 million. The said suit has been decided in favour of the applicants. However, the Holding Company challenged the said order vide C.P. no. 591/2013 before the Sindh High Court at Hyderabad and later on filed Labour Appeal No. 04/2014 before the Sindh Labour Court No. VI at Hyderabad being the Court of appropriate jurisdiction. After dismissal of the said appeal, a revision application has been filed before the Sindh Labour Appellate Tribunal, Karachi. The Tribunal also dismissed the appeal and hence C.P. no. D - 2636 has been filed before the Honorable High Court of Sindh at Hyderabad wherein stay has been granted by the High Court and the matter is pending for disposal. In view of the Holding Company's legal counsel, no definite outcome can be anticipated but the Holding Company has good case.
25.1.7 One more ex-employee of the former holding company of TCCL had filed CP # 86/2013 for
recovery of total Rs. 2.10 million out of which an amount of Rs. 0.248 million has been claimed on account of 60 days gratuity and numerous other false and fabricated claims of short payments of Rs. 1.86 million. In view of the legal counsel, the Holding Company has a good case whereas no definite outcome can be estimated.
25.1.8 Ex-workers of Labour Contractor had filed applications against the Holding Company before the
Labour Court at Hyderabad for reinstatement of their services which were not maintainable therefore, dismissed by the Court. The decision has been challenged vide Appeal no. Hyd-25/2016, Hyd-26/2016, Hyd-27/2016 and Hyd-28/2016 before the Sindh Labour Appellate Tribunal in Karachi and the matter is subjudice. According to Holding Company's legal counsel opinion, the appeals are time barred and are also not fit for grant of any relief, therefore, ultimately these are liable to be dismissed.
25.1.9 During the year, an ex-employee of the Holding Company has filed a Suit no. 51/2017 for recovery of damages, salaries and mesne profit of Rs. 197 million in the High Court of Sindh. The said ex- employee was dismissed from the Holding Company's service on November 1, 1999 due to involvement in serious acts of misconduct. The said person has challenged the dismissal before different forums including High Court of Sindh, Federal Services Tribunal and the Supreme Court of Pakistan and lost all the cases. In view of Holding Company's legal counsel, this litigation will also lead to the same fate as detailed above.
25.1.10 Two cement dealers had filed Suit no. 150/2001 & 151/2001 against the Holding Company for
Rs. 6.5 million and Rs. 1.5 million respectively being value of trucks which were handed over to the Holding Company in lieu of outstanding dues from these dealers. The Holding Company's legal counsel is of the opinion that no unfavourable outcome can be estimated.
25.1.11 As disclosed in the consolidated financial statements for the year ended June 30, 2016, the
Subsidiary Company entered into Power Purchase Agreement (PPA) with HESCO on May 14, 2011 to sell electricity at rates agreed in the said agreement. The agreement was executed in accordance with the Policy Framework for New - Captive Power Producers (N-CPPs). Subsequently, National Electric Power Regulatory Authority (NEPRA) issued an order revising the
178
Thatta Cement
tariff formula resulting in reduced tariff. In view of the said order, HESCO intimated to pay its dues for electricity purchased as per the reduced tariff formula. In response, the Subsidiary Company filed a petition before the Honorable High Court of Sindh against HESCO on the grounds that HESCO failed to pay the dues to the Subsidiary Company as per PPA. The Honorable High Court of Sindh disposed off the petition filed by the Subsidiary Company with the direction to HESCO to pay TPPL against purchase of electricity as per the rates stipulated in PPA until February 01, 2012 and thereafter on the rates determined by NEPRA. In view of the adverse order and according to the advice of the legal counsel the Subsidiary Company has filed an appeal before the Supreme Court of Pakistan against the order passed by the High Court of Sindh. Consequently, HESCO & NEPRA have also filed appeals before the Supreme Court of Pakistan against the same order. The last hearing of the appeal was held on November 02, 2016 and the judgment was reserved by the Supreme Court of Pakistan.
25.1.12 As per clause 132 of Second Schedule of the Income Tax Ordinance, 2001, business income of
Subsidiary Company is exempt from Income Tax. On such basis the Subsidiary Company filed an income tax return for the Tax Year 2013, while claiming exemption from business income and paid income tax only on interest income. This exemption was challenged by Commissioner Income Tax, Hyderabad and subsequently he raised a tax demand of Rs 154 million rejecting basic income tax exemption and also increased Subsidiary Company’s taxable income based on certain unreasonable grounds. The aforesaid order was challenged by the Subsidiary Company before Commissioner Inland Revenue – Appeals (CIR-A) and ad interim stay from High Court was also obtained to refrain tax department to initiate recovery proceedings. However, CIR-A has passed the order against the Subsidiary Company. Thereafter the Subsidiary Company has filed an appeal before ATIR against the adverse order of CIR-A through its tax consultant. Moreover, tax department has also issued a show cause notice for Tax Year 2014 rejecting the claim of income tax exemption on the same basis and intend to recover an aggregate amount of Rs. 249 million including default surcharge and penalty.
As advised by the tax consultant and legal counsel, the Subsidiary Company filed a petition
before the Honorable High Court of Sindh in respect of show cause notice issued by FBR for the Tax Year 2014 and obtained stay from High Court of Sindh in respect of show cause notice issued by FBR to refrain tax department to issue assessment order and initiate recovery proceedings there against. Furthermore, notice for advance tax for Tax Year 2015 amounting to Rs 219 million was also served for two quarters ended on December 31, 2014 on the basis of business turnover [which has been claimed as exempt] for Tax Year 2014. As recommended by tax consultant and legal counsel, a separate petition was filed for Tax Year 2015. Subsequently, the Sindh High Court vacated the stay of demand and has ordered the Tribunal to decide the case within two months from the date of the order. The hearing of the appeal was held and the judgment was reserved. Subsequently, the ATIR issued an order and remand back the appeal of the Subsidiary Company for exemption under clause (132) of Second Schedule of the Income Tax Ordinance, 2001, while accepting the Subsidiary Company’s argument in principle. Moreover, tax consultant suggested to file a Miscellaneous Application (MA) before the ATIR requesting to decide the matter in favour of the Subsidiary Company instead of remand back the appeal. The hearing of the appeal was held and a favorable order was passed by ATIR, thereby allowing the Subsidiary Company to claim exemption under clause 132 of Second Schedule of the Income Tax Ordinance, 2001.
25.1.13 As disclosed in the consolidated financial statements for the year ended June 30, 2016, Sales tax
audit of the Subsidiary Company for the tax period June 2012 to August 2013 was also initiated and FBR has issued an order of approximately Rs. 11 million. Basis of the order were very weak and the management has filed an appeal before CIR-Appeals through its sales tax consultant. The hearing of the case was held and favorable order has been passed by CIR-A, thereby allowing input sales tax claimed by the Subsidiary Company to the extent of Rs. 10.513 million. Subsequently, FBR has filed an appeal in the Appellate Tribunal Inland Revenue (Appeals) against the order passed by CIR-A, which is pending for adjudication.
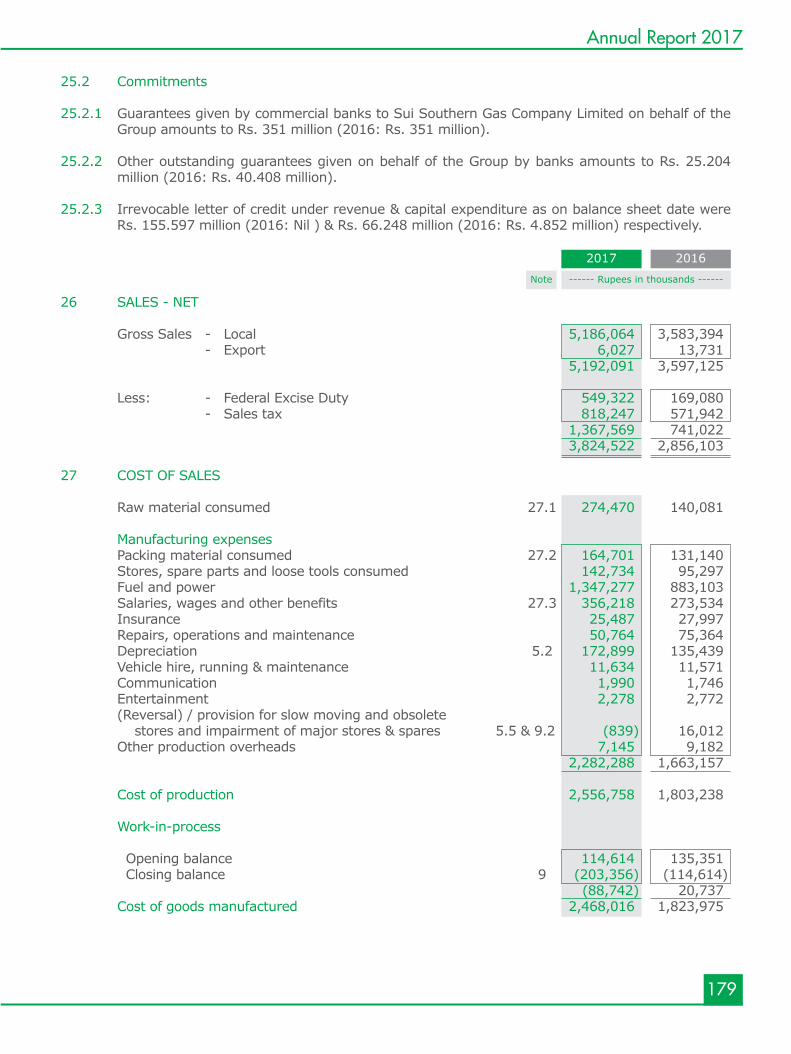
179
Annual Report 2017
25.2 Commitments 25.2.1 Guarantees given by commercial banks to Sui Southern Gas Company Limited on behalf of the
Group amounts to Rs. 351 million (2016: Rs. 351 million). 25.2.2 Other outstanding guarantees given on behalf of the Group by banks amounts to Rs. 25.204
million (2016: Rs. 40.408 million). 25.2.3 Irrevocable letter of credit under revenue & capital expenditure as on balance sheet date were
Rs. 155.597 million (2016: Nil ) & Rs. 66.248 million (2016: Rs. 4.852 million) respectively.
------ Rupees in thousands ------Note
2017 2016
26 SALES - NET
Gross Sales - Local 5,186,064 3,583,394 - Export 6,027 13,731 5,192,091 3,597,125 Less: - Federal Excise Duty 549,322 169,080 - Sales tax 818,247 571,942 1,367,569 741,022 3,824,522 2,856,103
27 COST OF SALES Raw material consumed 27.1 274,470 140,081 Manufacturing expenses Packing material consumed 27.2 164,701 131,140 Stores, spare parts and loose tools consumed 142,734 95,297 Fuel and power 1,347,277 883,103 Salaries, wages and other benefits 27.3 356,218 273,534 Insurance 25,487 27,997 Repairs, operations and maintenance 50,764 75,364 Depreciation 5.2 172,899 135,439 Vehicle hire, running & maintenance 11,634 11,571 Communication 1,990 1,746 Entertainment 2,278 2,772 (Reversal) / provision for slow moving and obsolete stores and impairment of major stores & spares 5.5 & 9.2 (839) 16,012 Other production overheads 7,145 9,182 2,282,288 1,663,157 Cost of production 2,556,758 1,803,238
Work-in-process
Opening balance 114,614 135,351 Closing balance 9 (203,356) (114,614) (88,742) 20,737 Cost of goods manufactured 2,468,016 1,823,975
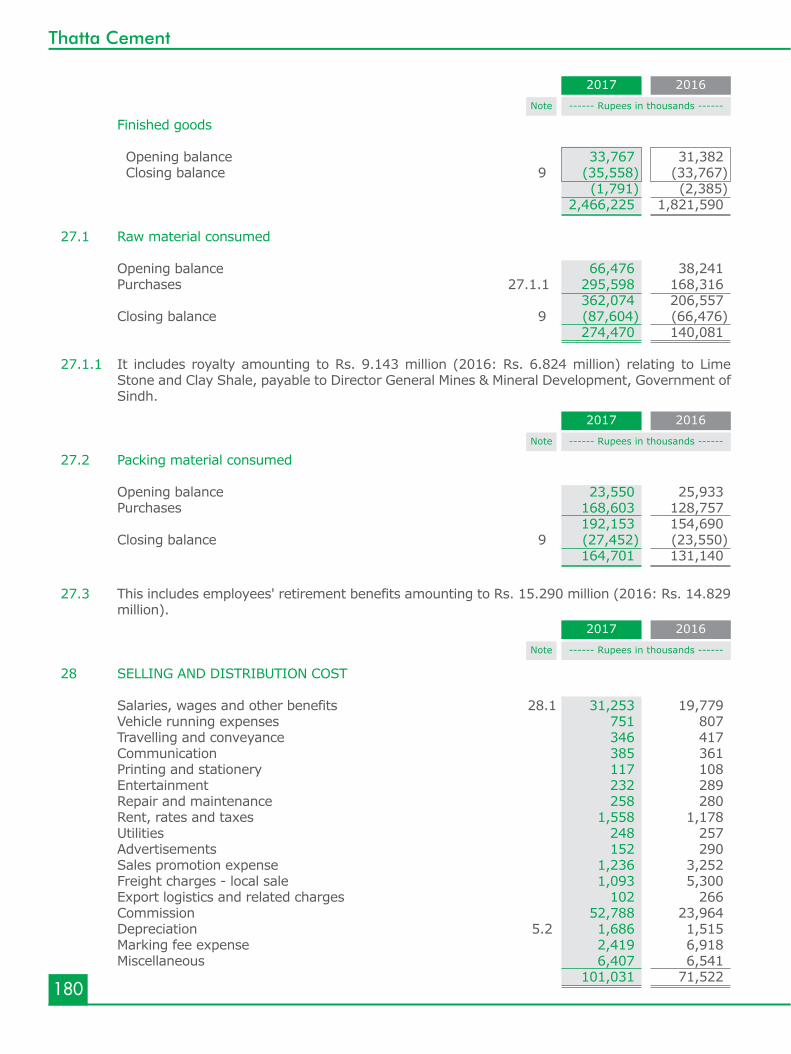
180
Thatta Cement
------ Rupees in thousands ------Note
2017 2016
Finished goods
Opening balance 33,767 31,382 Closing balance 9 (35,558) (33,767) (1,791) (2,385) 2,466,225 1,821,590 27.1 Raw material consumed Opening balance 66,476 38,241 Purchases 27.1.1 295,598 168,316 362,074 206,557 Closing balance 9 (87,604) (66,476) 274,470 140,081 27.1.1 It includes royalty amounting to Rs. 9.143 million (2016: Rs. 6.824 million) relating to Lime
Stone and Clay Shale, payable to Director General Mines & Mineral Development, Government of Sindh.
27.2 Packing material consumed Opening balance 23,550 25,933 Purchases 168,603 128,757 192,153 154,690 Closing balance 9 (27,452) (23,550) 164,701 131,140
27.3 This includes employees' retirement benefits amounting to Rs. 15.290 million (2016: Rs. 14.829 million).
28 SELLING AND DISTRIBUTION COST Salaries, wages and other benefits 28.1 31,253 19,779 Vehicle running expenses 751 807 Travelling and conveyance 346 417 Communication 385 361 Printing and stationery 117 108 Entertainment 232 289 Repair and maintenance 258 280 Rent, rates and taxes 1,558 1,178 Utilities 248 257 Advertisements 152 290 Sales promotion expense 1,236 3,252 Freight charges - local sale 1,093 5,300 Export logistics and related charges 102 266 Commission 52,788 23,964 Depreciation 5.2 1,686 1,515 Marking fee expense 2,419 6,918 Miscellaneous 6,407 6,541 101,031 71,522
------ Rupees in thousands ------Note
2017 2016
------ Rupees in thousands ------Note
2017 2016
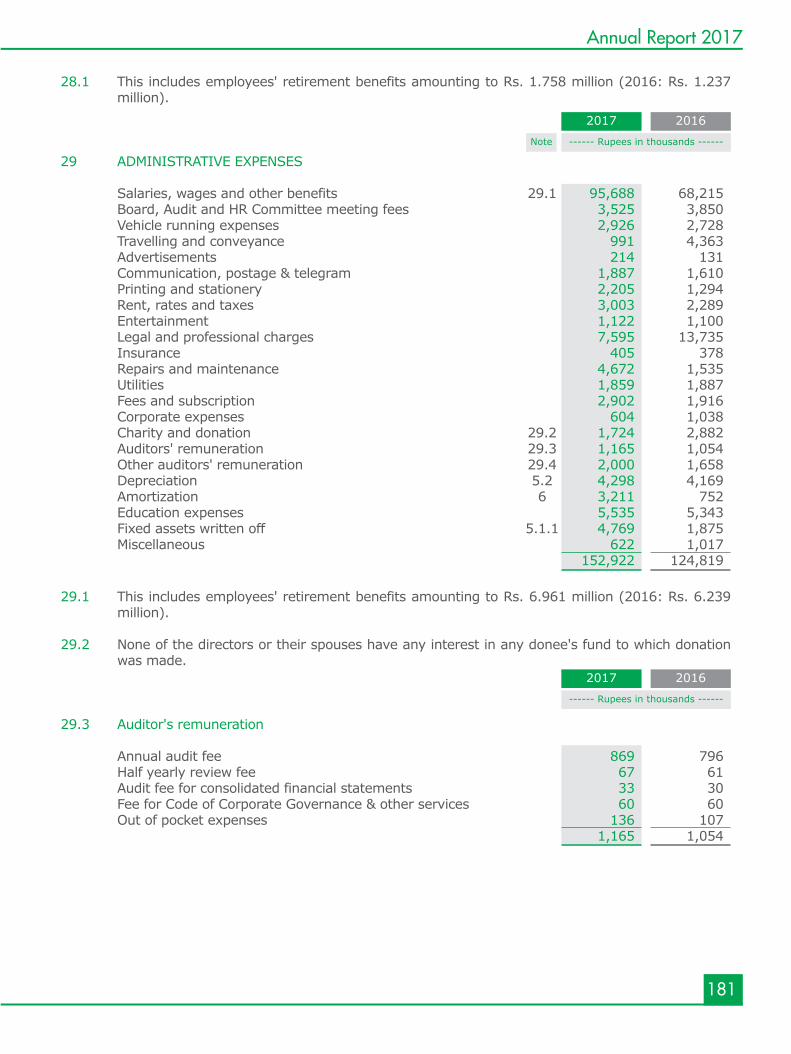
181
Annual Report 2017
------ Rupees in thousands ------
2017 2016
28.1 This includes employees' retirement benefits amounting to Rs. 1.758 million (2016: Rs. 1.237 million).
29 ADMINISTRATIVE EXPENSES Salaries, wages and other benefits 29.1 95,688 68,215 Board, Audit and HR Committee meeting fees 3,525 3,850 Vehicle running expenses 2,926 2,728 Travelling and conveyance 991 4,363 Advertisements 214 131 Communication, postage & telegram 1,887 1,610 Printing and stationery 2,205 1,294 Rent, rates and taxes 3,003 2,289 Entertainment 1,122 1,100 Legal and professional charges 7,595 13,735 Insurance 405 378 Repairs and maintenance 4,672 1,535 Utilities 1,859 1,887 Fees and subscription 2,902 1,916 Corporate expenses 604 1,038 Charity and donation 29.2 1,724 2,882 Auditors' remuneration 29.3 1,165 1,054 Other auditors' remuneration 29.4 2,000 1,658 Depreciation 5.2 4,298 4,169 Amortization 6 3,211 752 Education expenses 5,535 5,343 Fixed assets written off 5.1.1 4,769 1,875 Miscellaneous 622 1,017 152,922 124,819
29.1 This includes employees' retirement benefits amounting to Rs. 6.961 million (2016: Rs. 6.239 million).
29.2 None of the directors or their spouses have any interest in any donee's fund to which donation
was made.
29.3 Auditor's remuneration Annual audit fee 869 796 Half yearly review fee 67 61 Audit fee for consolidated financial statements 33 30 Fee for Code of Corporate Governance & other services 60 60 Out of pocket expenses 136 107 1,165 1,054
------ Rupees in thousands ------Note
2017 2016
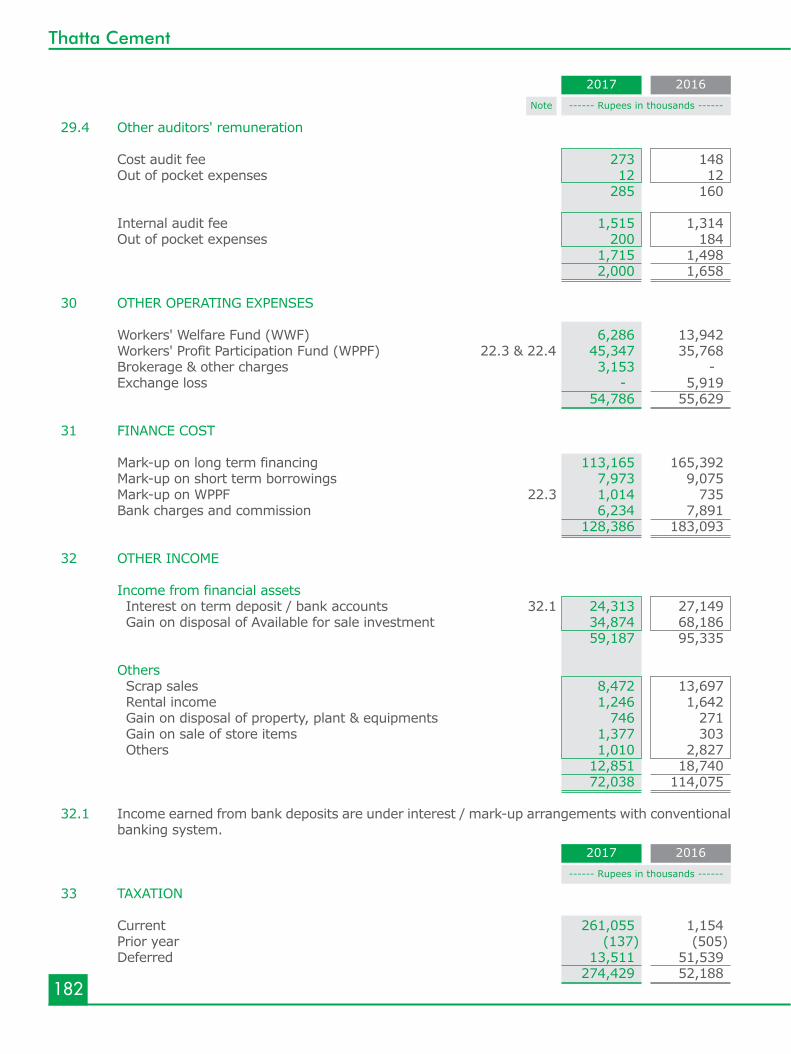
182
Thatta Cement
------ Rupees in thousands ------Note
2017 2016
29.4 Other auditors' remuneration Cost audit fee 273 148 Out of pocket expenses 12 12 285 160 Internal audit fee 1,515 1,314 Out of pocket expenses 200 184 1,715 1,498 2,000 1,658 30 OTHER OPERATING EXPENSES Workers' Welfare Fund (WWF) 6,286 13,942 Workers' Profit Participation Fund (WPPF) 22.3 & 22.4 45,347 35,768 Brokerage & other charges 3,153 - Exchange loss - 5,919 54,786 55,629
31 FINANCE COST Mark-up on long term financing 113,165 165,392 Mark-up on short term borrowings 7,973 9,075 Mark-up on WPPF 22.3 1,014 735 Bank charges and commission 6,234 7,891 128,386 183,093 32 OTHER INCOME Income from financial assets Interest on term deposit / bank accounts 32.1 24,313 27,149 Gain on disposal of Available for sale investment 34,874 68,186 59,187 95,335 Others Scrap sales 8,472 13,697 Rental income 1,246 1,642 Gain on disposal of property, plant & equipments 746 271 Gain on sale of store items 1,377 303 Others 1,010 2,827 12,851 18,740 72,038 114,075 32.1 Income earned from bank deposits are under interest / mark-up arrangements with conventional
banking system. 33 TAXATION Current 261,055 1,154 Prior year (137) (505) Deferred 13,511 51,539 274,429 52,188
------ Rupees in thousands ------
2017 2016
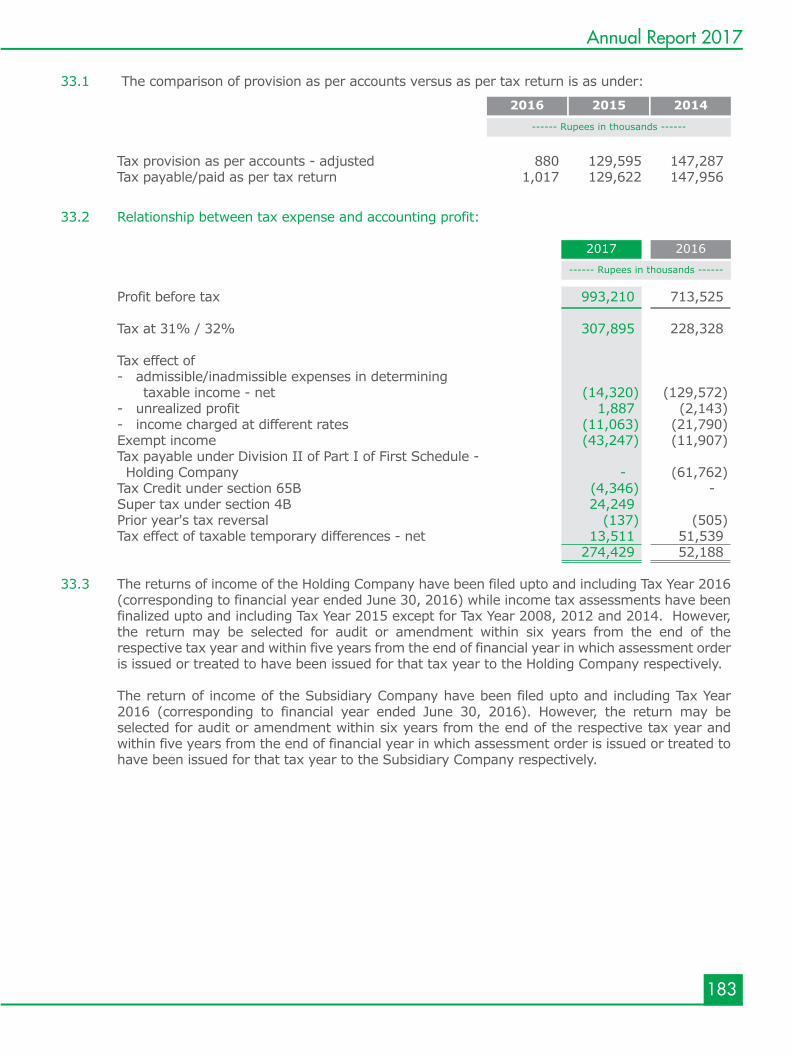
33.1 The comparison of provision as per accounts versus as per tax return is as under:
Tax provision as per accounts - adjusted 880 129,595 147,287 Tax payable/paid as per tax return 1,017 129,622 147,956
33.2 Relationship between tax expense and accounting profit: Profit before tax 993,210 713,525 Tax at 31% / 32% 307,895 228,328 Tax effect of - admissible/inadmissible expenses in determining taxable income - net (14,320) (129,572) - unrealized profit 1,887 (2,143) - income charged at different rates (11,063) (21,790) Exempt income (43,247) (11,907) Tax payable under Division II of Part I of First Schedule - Holding Company - (61,762) Tax Credit under section 65B (4,346) - Super tax under section 4B 24,249 Prior year's tax reversal (137) (505) Tax effect of taxable temporary differences - net 13,511 51,539 274,429 52,188 33.3 The returns of income of the Holding Company have been filed upto and including Tax Year 2016
(corresponding to financial year ended June 30, 2016) while income tax assessments have been finalized upto and including Tax Year 2015 except for Tax Year 2008, 2012 and 2014. However, the return may be selected for audit or amendment within six years from the end of the respective tax year and within five years from the end of financial year in which assessment order is issued or treated to have been issued for that tax year to the Holding Company respectively.
The return of income of the Subsidiary Company have been filed upto and including Tax Year
2016 (corresponding to financial year ended June 30, 2016). However, the return may be selected for audit or amendment within six years from the end of the respective tax year and within five years from the end of financial year in which assessment order is issued or treated to have been issued for that tax year to the Subsidiary Company respectively.
183
Annual Report 2017
------ Rupees in thousands ------
------ Rupees in thousands ------
2017 2016
2015 20142016
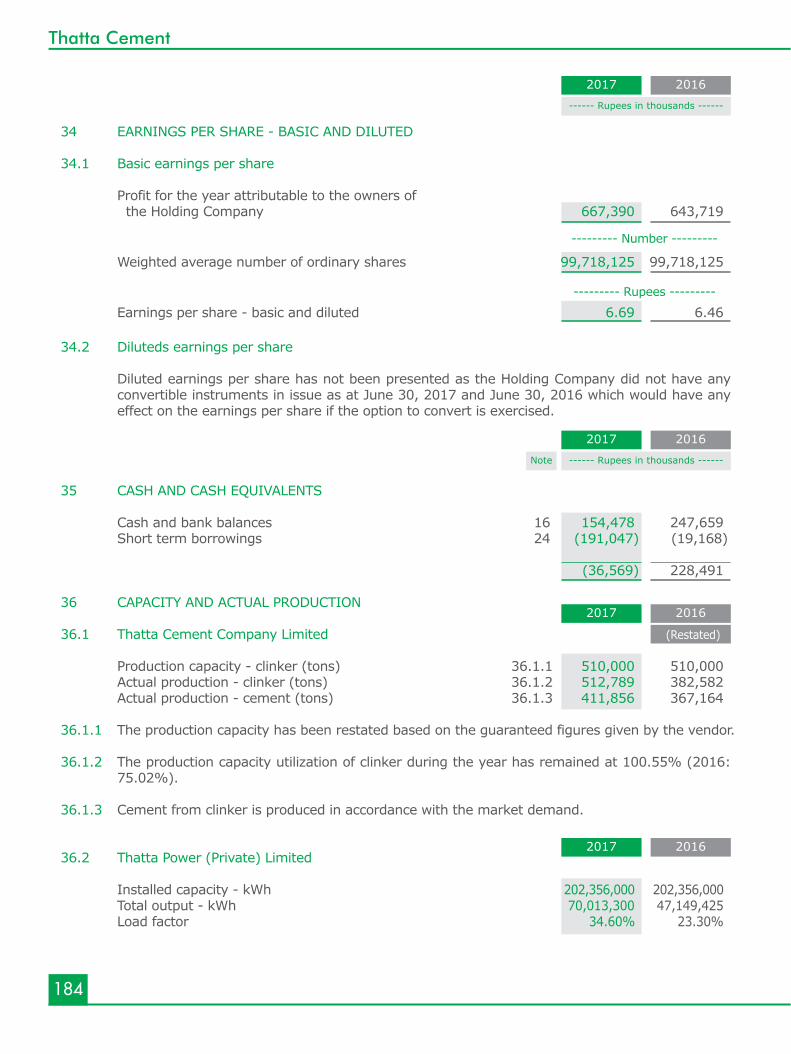
184
Thatta Cement
------ Rupees in thousands ------
2017 2016
34 EARNINGS PER SHARE - BASIC AND DILUTED 34.1 Basic earnings per share Profit for the year attributable to the owners of the Holding Company 667,390 643,719
--------- Number ---------
Weighted average number of ordinary shares 99,718,125 99,718,125
--------- Rupees ---------
Earnings per share - basic and diluted 6.69 6.46
34.2 Diluteds earnings per share Diluted earnings per share has not been presented as the Holding Company did not have any
convertible instruments in issue as at June 30, 2017 and June 30, 2016 which would have any effect on the earnings per share if the option to convert is exercised.
35 CASH AND CASH EQUIVALENTS Cash and bank balances 16 154,478 247,659 Short term borrowings 24 (191,047) (19,168)
(36,569) 228,491 36 CAPACITY AND ACTUAL PRODUCTION 36.1 Thatta Cement Company Limited (Restated) Production capacity - clinker (tons) 36.1.1 510,000 510,000 Actual production - clinker (tons) 36.1.2 512,789 382,582 Actual production - cement (tons) 36.1.3 411,856 367,164 36.1.1 The production capacity has been restated based on the guaranteed figures given by the vendor.
36.1.2 The production capacity utilization of clinker during the year has remained at 100.55% (2016:
75.02%). 36.1.3 Cement from clinker is produced in accordance with the market demand.
36.2 Thatta Power (Private) Limited Installed capacity - kWh 202,356,000 202,356,000 Total output - kWh 70,013,300 47,149,425 Load factor 34.60% 23.30%
------ Rupees in thousands ------Note
2017 2016
2017 2016
2017 2016
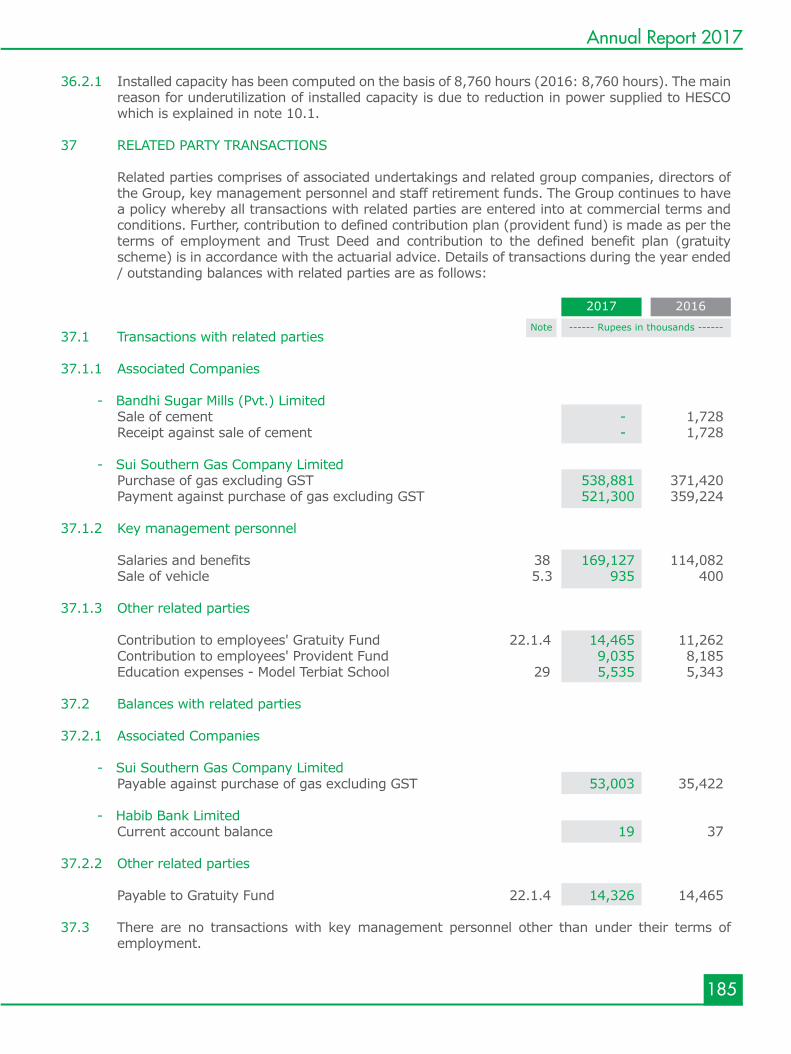
185
Annual Report 2017
36.2.1 Installed capacity has been computed on the basis of 8,760 hours (2016: 8,760 hours). The main reason for underutilization of installed capacity is due to reduction in power supplied to HESCO which is explained in note 10.1.
37 RELATED PARTY TRANSACTIONS Related parties comprises of associated undertakings and related group companies, directors of
the Group, key management personnel and staff retirement funds. The Group continues to have a policy whereby all transactions with related parties are entered into at commercial terms and conditions. Further, contribution to defined contribution plan (provident fund) is made as per the terms of employment and Trust Deed and contribution to the defined benefit plan (gratuity scheme) is in accordance with the actuarial advice. Details of transactions during the year ended / outstanding balances with related parties are as follows:
37.1 Transactions with related parties 37.1.1 Associated Companies
- Bandhi Sugar Mills (Pvt.) Limited Sale of cement - 1,728 Receipt against sale of cement - 1,728
- Sui Southern Gas Company Limited Purchase of gas excluding GST 538,881 371,420 Payment against purchase of gas excluding GST 521,300 359,224
37.1.2 Key management personnel
Salaries and benefits 38 169,127 114,082 Sale of vehicle 5.3 935 400 37.1.3 Other related parties Contribution to employees' Gratuity Fund 22.1.4 14,465 11,262 Contribution to employees' Provident Fund 9,035 8,185 Education expenses - Model Terbiat School 29 5,535 5,343 37.2 Balances with related parties 37.2.1 Associated Companies
- Sui Southern Gas Company Limited Payable against purchase of gas excluding GST 53,003 35,422 - Habib Bank Limited Current account balance 19 37
37.2.2 Other related parties
Payable to Gratuity Fund 22.1.4 14,326 14,465 37.3 There are no transactions with key management personnel other than under their terms of
employment.
------ Rupees in thousands ------Note
2017 2016
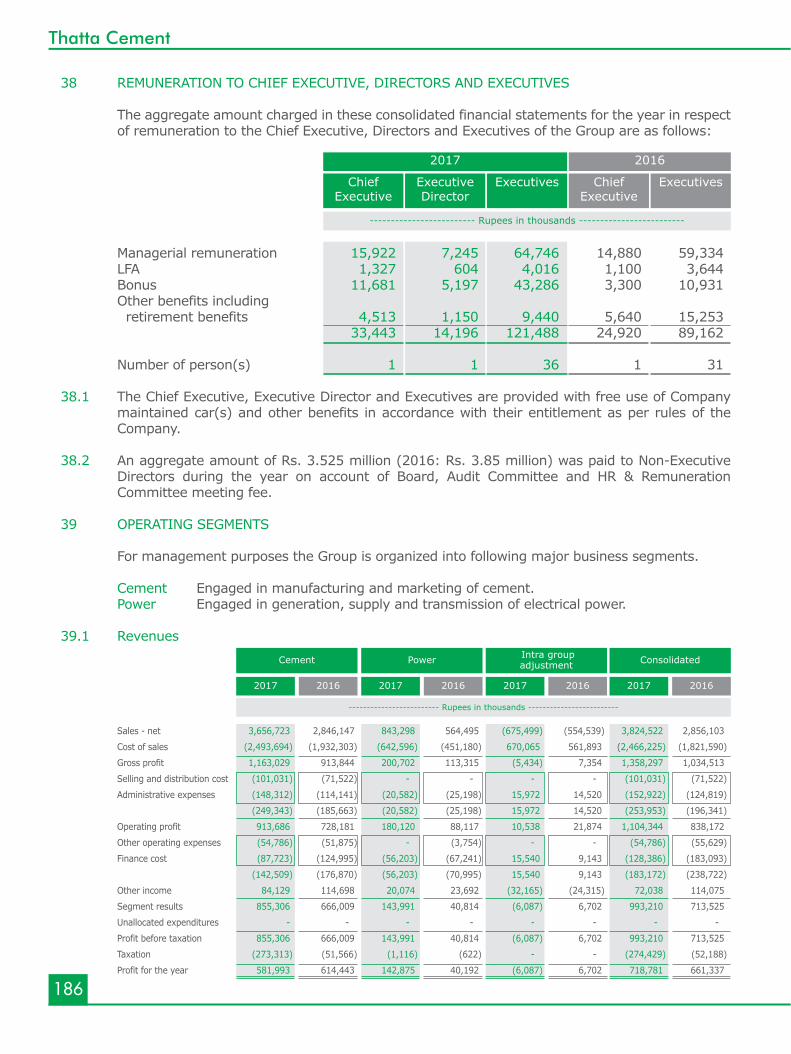
186
Thatta Cement
38 REMUNERATION TO CHIEF EXECUTIVE, DIRECTORS AND EXECUTIVES
The aggregate amount charged in these consolidated financial statements for the year in respect of remuneration to the Chief Executive, Directors and Executives of the Group are as follows:
Managerial remuneration 15,922 7,245 64,746 14,880 59,334 LFA 1,327 604 4,016 1,100 3,644 Bonus 11,681 5,197 43,286 3,300 10,931 Other benefits including retirement benefits 4,513 1,150 9,440 5,640 15,253 33,443 14,196 121,488 24,920 89,162 Number of person(s) 1 1 36 1 31 38.1 The Chief Executive, Executive Director and Executives are provided with free use of Company
maintained car(s) and other benefits in accordance with their entitlement as per rules of the Company.
38.2 An aggregate amount of Rs. 3.525 million (2016: Rs. 3.85 million) was paid to Non-Executive
Directors during the year on account of Board, Audit Committee and HR & Remuneration Committee meeting fee.
39 OPERATING SEGMENTS For management purposes the Group is organized into following major business segments.
Cement Engaged in manufacturing and marketing of cement. Power Engaged in generation, supply and transmission of electrical power.
39.1 Revenues
------------------------- Rupees in thousands -------------------------
2017 2016
ExecutivesChiefExecutive
ExecutivesExecutiveDirector
ChiefExecutive
------------------------- Rupees in thousands -------------------------
Sales - net 3,656,723 2,846,147 843,298 564,495 (675,499) (554,539) 3,824,522 2,856,103
Cost of sales (2,493,694) (1,932,303) (642,596) (451,180) 670,065 561,893 (2,466,225) (1,821,590)
Gross profit 1,163,029 913,844 200,702 113,315 (5,434) 7,354 1,358,297 1,034,513
Selling and distribution cost (101,031) (71,522) - - - - (101,031) (71,522)
Administrative expenses (148,312) (114,141) (20,582) (25,198) 15,972 14,520 (152,922) (124,819)
(249,343) (185,663) (20,582) (25,198) 15,972 14,520 (253,953) (196,341)
Operating profit 913,686 728,181 180,120 88,117 10,538 21,874 1,104,344 838,172
Other operating expenses (54,786) (51,875) - (3,754) - - (54,786) (55,629)
Finance cost (87,723) (124,995) (56,203) (67,241) 15,540 9,143 (128,386) (183,093)
(142,509) (176,870) (56,203) (70,995) 15,540 9,143 (183,172) (238,722)
Other income 84,129 114,698 20,074 23,692 (32,165) (24,315) 72,038 114,075
Segment results 855,306 666,009 143,991 40,814 (6,087) 6,702 993,210 713,525
Unallocated expenditures - - - - - - - -
Profit before taxation 855,306 666,009 143,991 40,814 (6,087) 6,702 993,210 713,525
Taxation (273,313) (51,566) (1,116) (622) - - (274,429) (52,188)
Profit for the year 581,993 614,443 142,875 40,192 (6,087) 6,702 718,781 661,337
Power Consolidated
20162017 20162017 20162017 2016
Cement
2017
Intra groupadjustment
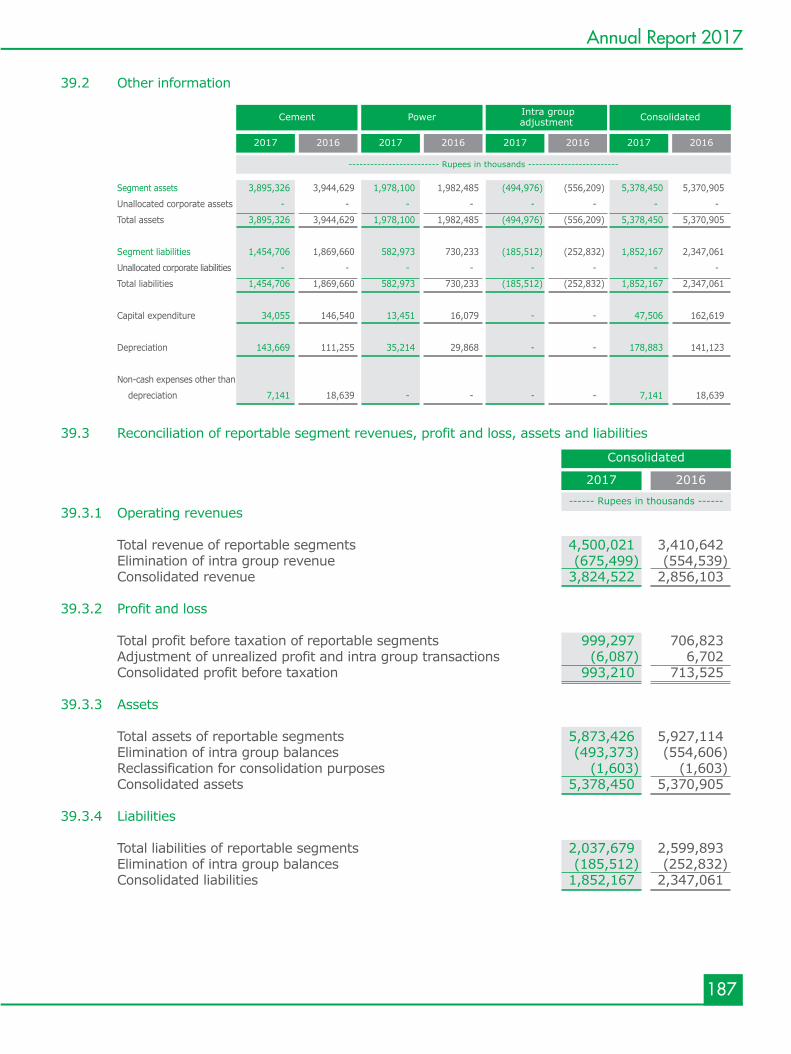
187
Annual Report 2017
39.2 Other information
39.3 Reconciliation of reportable segment revenues, profit and loss, assets and liabilities
39.3.1 Operating revenues
Total revenue of reportable segments 4,500,021 3,410,642 Elimination of intra group revenue (675,499) (554,539) Consolidated revenue 3,824,522 2,856,103
39.3.2 Profit and loss
Total profit before taxation of reportable segments 999,297 706,823 Adjustment of unrealized profit and intra group transactions (6,087) 6,702 Consolidated profit before taxation 993,210 713,525 39.3.3 Assets Total assets of reportable segments 5,873,426 5,927,114 Elimination of intra group balances (493,373) (554,606) Reclassification for consolidation purposes (1,603) (1,603) Consolidated assets 5,378,450 5,370,905 39.3.4 Liabilities Total liabilities of reportable segments 2,037,679 2,599,893 Elimination of intra group balances (185,512) (252,832) Consolidated liabilities 1,852,167 2,347,061
------------------------- Rupees in thousands -------------------------
Segment assets 3,895,326 3,944,629 1,978,100 1,982,485 (494,976) (556,209) 5,378,450 5,370,905
Unallocated corporate assets - - - - - - - -
Total assets 3,895,326 3,944,629 1,978,100 1,982,485 (494,976) (556,209) 5,378,450 5,370,905
Segment liabilities 1,454,706 1,869,660 582,973 730,233 (185,512) (252,832) 1,852,167 2,347,061
Unallocated corporate liabilities - - - - - - - -
Total liabilities 1,454,706 1,869,660 582,973 730,233 (185,512) (252,832) 1,852,167 2,347,061
Capital expenditure 34,055 146,540 13,451 16,079 - - 47,506 162,619
Depreciation 143,669 111,255 35,214 29,868 - - 178,883 141,123
Non-cash expenses other than
depreciation 7,141 18,639 - - - - 7,141 18,639
Power Consolidated
20162017 20162017 20162017 2016
Cement
2017
Intra groupadjustment
------ Rupees in thousands ------
Consolidated
2017 2016
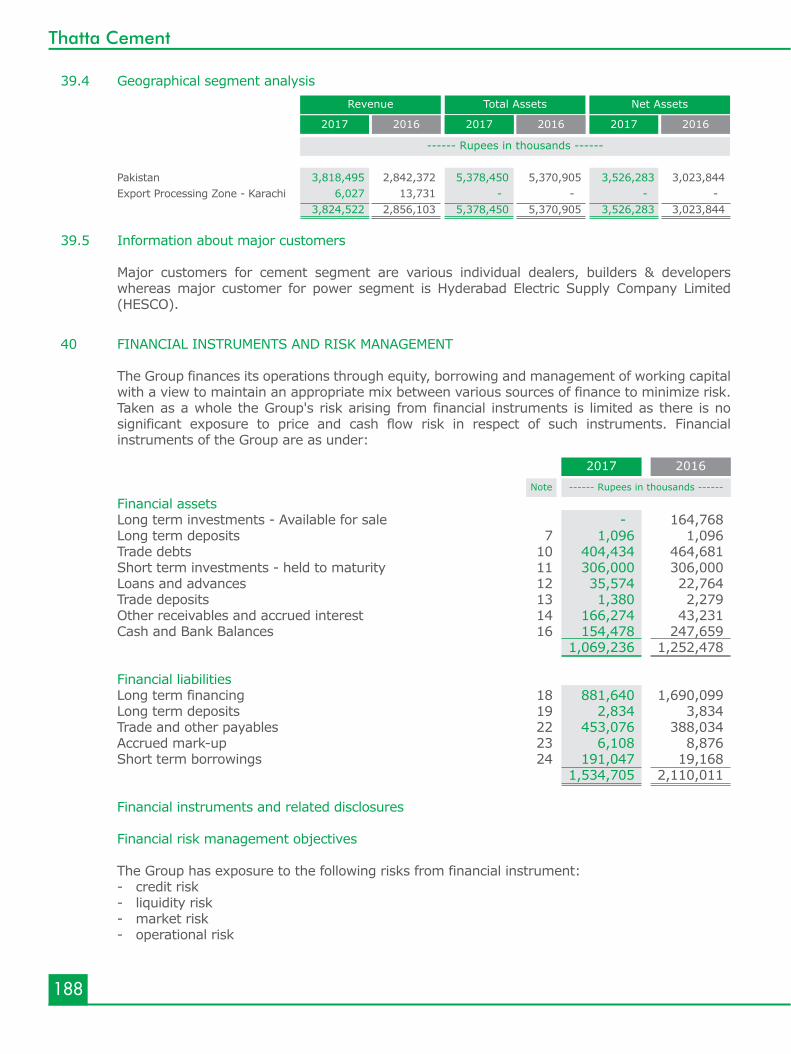
188
Thatta Cement
40 FINANCIAL INSTRUMENTS AND RISK MANAGEMENT The Group finances its operations through equity, borrowing and management of working capital
with a view to maintain an appropriate mix between various sources of finance to minimize risk. Taken as a whole the Group's risk arising from financial instruments is limited as there is no significant exposure to price and cash flow risk in respect of such instruments. Financial instruments of the Group are as under:
Financial assets Long term investments - Available for sale - 164,768 Long term deposits 7 1,096 1,096 Trade debts 10 404,434 464,681 Short term investments - held to maturity 11 306,000 306,000 Loans and advances 12 35,574 22,764 Trade deposits 13 1,380 2,279 Other receivables and accrued interest 14 166,274 43,231 Cash and Bank Balances 16 154,478 247,659 1,069,236 1,252,478
Financial liabilities Long term financing 18 881,640 1,690,099 Long term deposits 19 2,834 3,834 Trade and other payables 22 453,076 388,034 Accrued mark-up 23 6,108 8,876 Short term borrowings 24 191,047 19,168 1,534,705 2,110,011
Financial instruments and related disclosures Financial risk management objectives The Group has exposure to the following risks from financial instrument: - credit risk - liquidity risk - market risk - operational risk
39.4 Geographical segment analysis
Pakistan 3,818,495 2,842,372 5,378,450 5,370,905 3,526,283 3,023,844 Export Processing Zone - Karachi 6,027 13,731 - - - - 3,824,522 2,856,103 5,378,450 5,370,905 3,526,283 3,023,844
39.5 Information about major customers Major customers for cement segment are various individual dealers, builders & developers
whereas major customer for power segment is Hyderabad Electric Supply Company Limited (HESCO).
------ Rupees in thousands ------Note
2017 2016
------ Rupees in thousands ------
Net Assets
2017 2016
Total Assets
2017 20162017 2016
Revenue
2017 2016
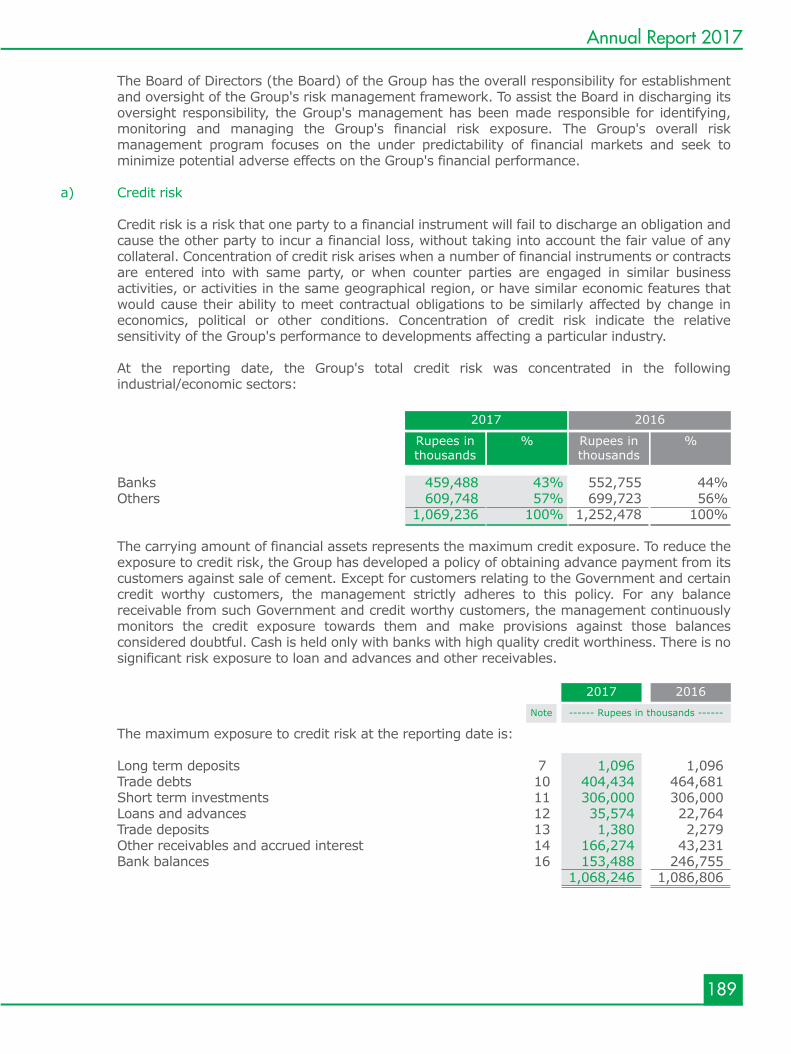
189
Annual Report 2017
The Board of Directors (the Board) of the Group has the overall responsibility for establishment and oversight of the Group's risk management framework. To assist the Board in discharging its oversight responsibility, the Group's management has been made responsible for identifying, monitoring and managing the Group's financial risk exposure. The Group's overall risk management program focuses on the under predictability of financial markets and seek to minimize potential adverse effects on the Group's financial performance.
a) Credit risk Credit risk is a risk that one party to a financial instrument will fail to discharge an obligation and
cause the other party to incur a financial loss, without taking into account the fair value of any collateral. Concentration of credit risk arises when a number of financial instruments or contracts are entered into with same party, or when counter parties are engaged in similar business activities, or activities in the same geographical region, or have similar economic features that would cause their ability to meet contractual obligations to be similarly affected by change in economics, political or other conditions. Concentration of credit risk indicate the relative sensitivity of the Group's performance to developments affecting a particular industry.
At the reporting date, the Group's total credit risk was concentrated in the following
industrial/economic sectors:
%Rupees inthousands
%Rupees inthousands
2017 2016
Banks 459,488 43% 552,755 44% Others 609,748 57% 699,723 56% 1,069,236 100% 1,252,478 100% The carrying amount of financial assets represents the maximum credit exposure. To reduce the
exposure to credit risk, the Group has developed a policy of obtaining advance payment from its customers against sale of cement. Except for customers relating to the Government and certain credit worthy customers, the management strictly adheres to this policy. For any balance receivable from such Government and credit worthy customers, the management continuously monitors the credit exposure towards them and make provisions against those balances considered doubtful. Cash is held only with banks with high quality credit worthiness. There is no significant risk exposure to loan and advances and other receivables.
------ Rupees in thousands ------Note
2017 2016
The maximum exposure to credit risk at the reporting date is: Long term deposits 7 1,096 1,096 Trade debts 10 404,434 464,681 Short term investments 11 306,000 306,000 Loans and advances 12 35,574 22,764 Trade deposits 13 1,380 2,279 Other receivables and accrued interest 14 166,274 43,231 Bank balances 16 153,488 246,755 1,068,246 1,086,806
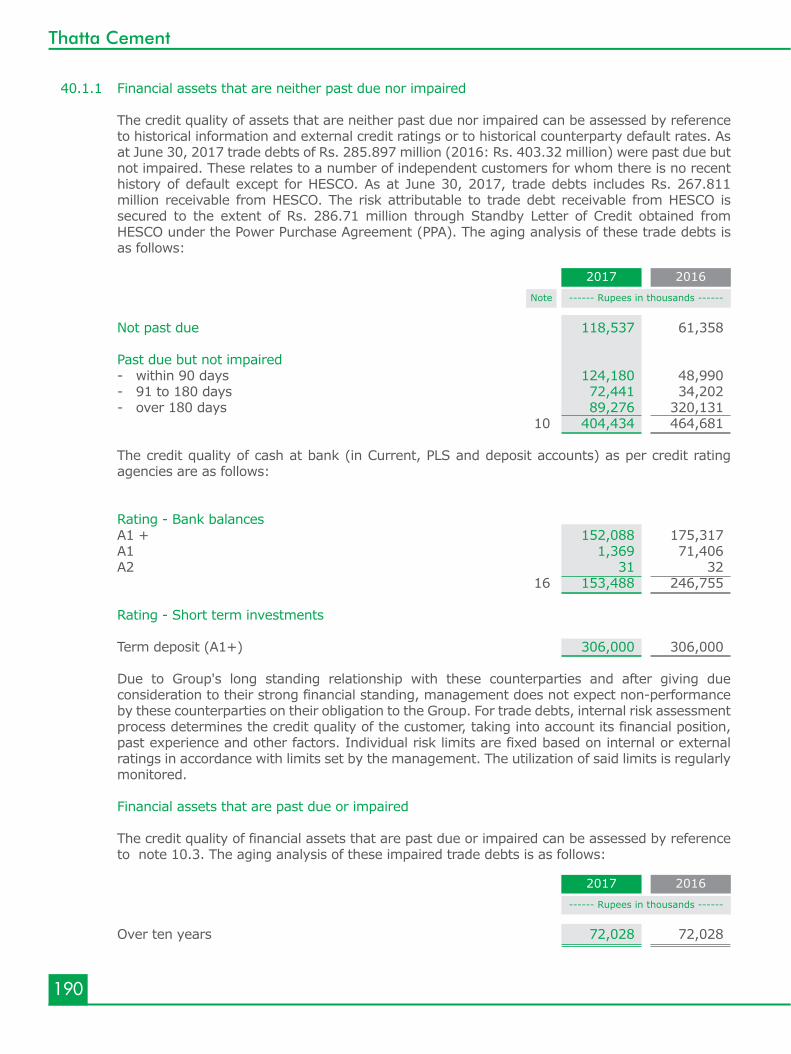
190
Thatta Cement
40.1.1 Financial assets that are neither past due nor impaired The credit quality of assets that are neither past due nor impaired can be assessed by reference
to historical information and external credit ratings or to historical counterparty default rates. As at June 30, 2017 trade debts of Rs. 285.897 million (2016: Rs. 403.32 million) were past due but not impaired. These relates to a number of independent customers for whom there is no recent history of default except for HESCO. As at June 30, 2017, trade debts includes Rs. 267.811 million receivable from HESCO. The risk attributable to trade debt receivable from HESCO is secured to the extent of Rs. 286.71 million through Standby Letter of Credit obtained from HESCO under the Power Purchase Agreement (PPA). The aging analysis of these trade debts is as follows:
Not past due 118,537 61,358 Past due but not impaired - within 90 days 124,180 48,990 - 91 to 180 days 72,441 34,202 - over 180 days 89,276 320,131 10 404,434 464,681 The credit quality of cash at bank (in Current, PLS and deposit accounts) as per credit rating
agencies are as follows: Rating - Bank balances A1 + 152,088 175,317 A1 1,369 71,406 A2 31 32 16 153,488 246,755 Rating - Short term investments Term deposit (A1+) 306,000 306,000 Due to Group's long standing relationship with these counterparties and after giving due
consideration to their strong financial standing, management does not expect non-performance by these counterparties on their obligation to the Group. For trade debts, internal risk assessment process determines the credit quality of the customer, taking into account its financial position,
past experience and other factors. Individual risk limits are fixed based on internal or external ratings in accordance with limits set by the management. The utilization of said limits is regularly monitored.
Financial assets that are past due or impaired The credit quality of financial assets that are past due or impaired can be assessed by reference
to note 10.3. The aging analysis of these impaired trade debts is as follows: Over ten years 72,028 72,028
------ Rupees in thousands ------Note
2017 2016
------ Rupees in thousands ------
2017 2016
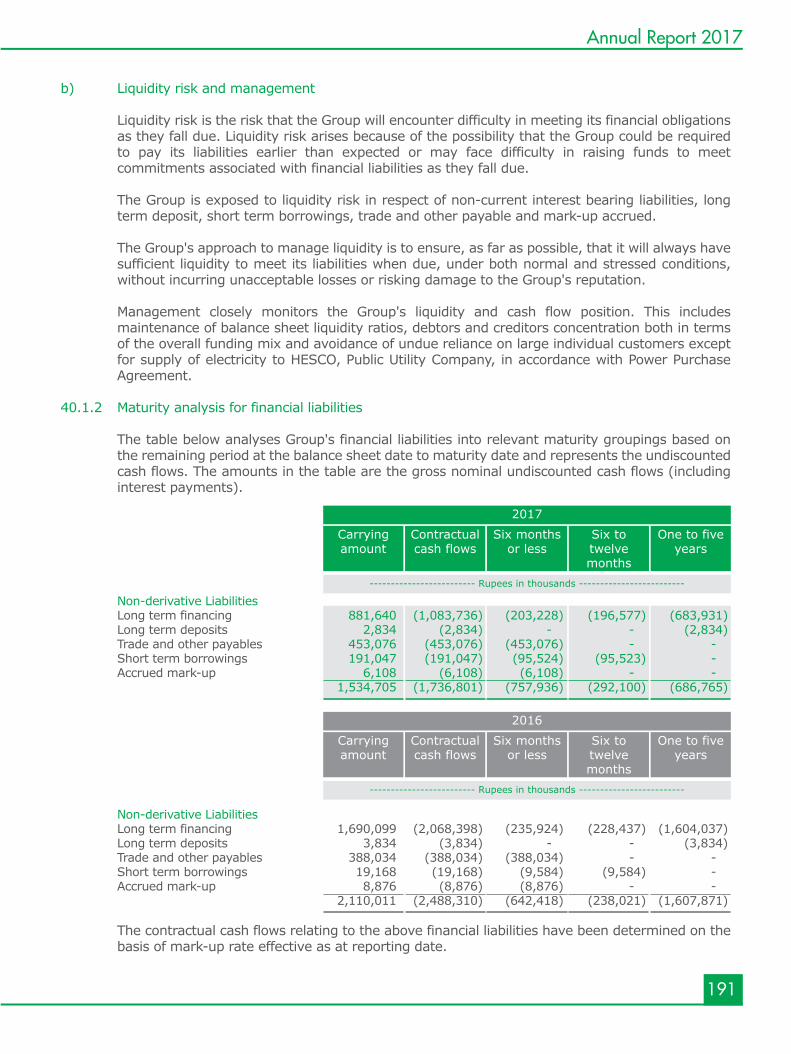
b) Liquidity risk and management Liquidity risk is the risk that the Group will encounter difficulty in meeting its financial obligations
as they fall due. Liquidity risk arises because of the possibility that the Group could be required to pay its liabilities earlier than expected or may face difficulty in raising funds to meet commitments associated with financial liabilities as they fall due.
The Group is exposed to liquidity risk in respect of non-current interest bearing liabilities, long
term deposit, short term borrowings, trade and other payable and mark-up accrued. The Group's approach to manage liquidity is to ensure, as far as possible, that it will always have
sufficient liquidity to meet its liabilities when due, under both normal and stressed conditions, without incurring unacceptable losses or risking damage to the Group's reputation.
Management closely monitors the Group's liquidity and cash flow position. This includes
maintenance of balance sheet liquidity ratios, debtors and creditors concentration both in terms of the overall funding mix and avoidance of undue reliance on large individual customers except for supply of electricity to HESCO, Public Utility Company, in accordance with Power Purchase Agreement.
40.1.2 Maturity analysis for financial liabilities The table below analyses Group's financial liabilities into relevant maturity groupings based on
the remaining period at the balance sheet date to maturity date and represents the undiscounted cash flows. The amounts in the table are the gross nominal undiscounted cash flows (including interest payments).
191
Annual Report 2017
------------------------- Rupees in thousands -------------------------
2017
One to fiveyears
Six totwelvemonths
Six monthsor less
Contractualcash flows
Carryingamount
Non-derivative Liabilities Long term financing 881,640 (1,083,736) (203,228) (196,577) (683,931) Long term deposits 2,834 (2,834) - - (2,834) Trade and other payables 453,076 (453,076) (453,076) - - Short term borrowings 191,047 (191,047) (95,524) (95,523) - Accrued mark-up 6,108 (6,108) (6,108) - - 1,534,705 (1,736,801) (757,936) (292,100) (686,765)
------------------------- Rupees in thousands -------------------------
2016
One to fiveyears
Six totwelvemonths
Six monthsor less
Contractualcash flows
Carryingamount
Non-derivative Liabilities Long term financing 1,690,099 (2,068,398) (235,924) (228,437) (1,604,037) Long term deposits 3,834 (3,834) - - (3,834) Trade and other payables 388,034 (388,034) (388,034) - - Short term borrowings 19,168 (19,168) (9,584) (9,584) - Accrued mark-up 8,876 (8,876) (8,876) - - 2,110,011 (2,488,310) (642,418) (238,021) (1,607,871)
The contractual cash flows relating to the above financial liabilities have been determined on the
basis of mark-up rate effective as at reporting date.
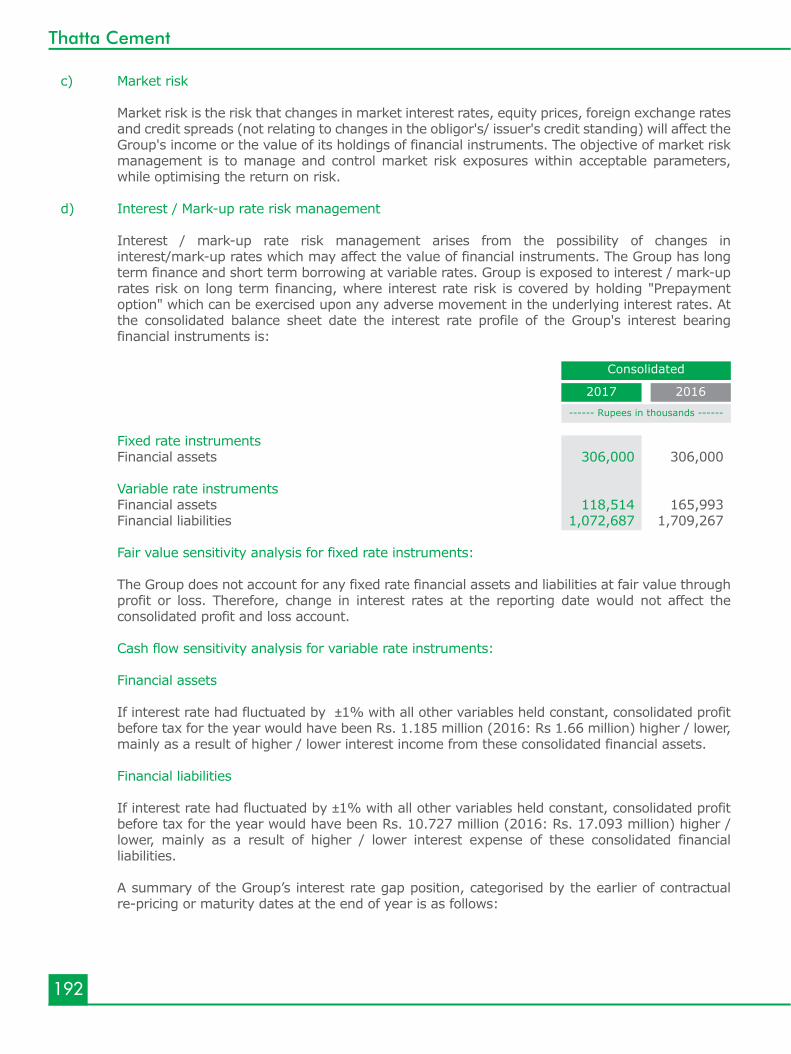
192
Thatta Cement
c) Market risk Market risk is the risk that changes in market interest rates, equity prices, foreign exchange rates
and credit spreads (not relating to changes in the obligor's/ issuer's credit standing) will affect the Group's income or the value of its holdings of financial instruments. The objective of market risk management is to manage and control market risk exposures within acceptable parameters, while optimising the return on risk.
d) Interest / Mark-up rate risk management Interest / mark-up rate risk management arises from the possibility of changes in
interest/mark-up rates which may affect the value of financial instruments. The Group has long term finance and short term borrowing at variable rates. Group is exposed to interest / mark-up rates risk on long term financing, where interest rate risk is covered by holding "Prepayment option" which can be exercised upon any adverse movement in the underlying interest rates. At the consolidated balance sheet date the interest rate profile of the Group's interest bearing financial instruments is:
------ Rupees in thousands ------
Consolidated
2017 2016
Fixed rate instruments Financial assets 306,000 306,000 Variable rate instruments Financial assets 118,514 165,993 Financial liabilities 1,072,687 1,709,267 Fair value sensitivity analysis for fixed rate instruments: The Group does not account for any fixed rate financial assets and liabilities at fair value through
profit or loss. Therefore, change in interest rates at the reporting date would not affect the consolidated profit and loss account.
Cash flow sensitivity analysis for variable rate instruments:
Financial assets If interest rate had fluctuated by ±1% with all other variables held constant, consolidated profit
before tax for the year would have been Rs. 1.185 million (2016: Rs 1.66 million) higher / lower, mainly as a result of higher / lower interest income from these consolidated financial assets.
Financial liabilities If interest rate had fluctuated by ±1% with all other variables held constant, consolidated profit
before tax for the year would have been Rs. 10.727 million (2016: Rs. 17.093 million) higher / lower, mainly as a result of higher / lower interest expense of these consolidated financial liabilities.
A summary of the Group’s interest rate gap position, categorised by the earlier of contractual re-pricing or maturity dates at the end of year is as follows:
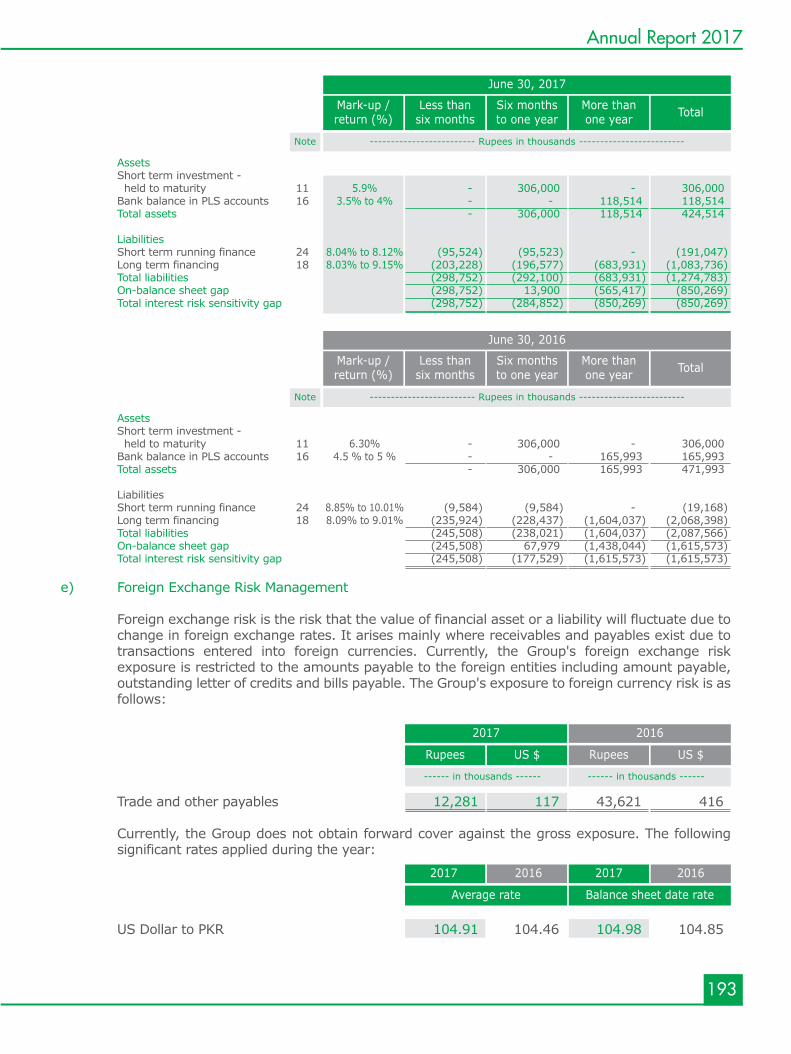
193
Annual Report 2017
Assets Short term investment - held to maturity 11 5.9% - 306,000 - 306,000 Bank balance in PLS accounts 16 3.5% to 4% - - 118,514 118,514 Total assets - 306,000 118,514 424,514 Liabilities Short term running finance 24 8.04% to 8.12% (95,524) (95,523) - (191,047) Long term financing 18 8.03% to 9.15% (203,228) (196,577) (683,931) (1,083,736) Total liabilities (298,752) (292,100) (683,931) (1,274,783) On-balance sheet gap (298,752) 13,900 (565,417) (850,269) Total interest risk sensitivity gap (298,752) (284,852) (850,269) (850,269)
------------------------- Rupees in thousands -------------------------
June 30, 2017
TotalMore thanone year
Six monthsto one year
Less thansix months
Mark-up /return (%)
Note
Assets Short term investment - held to maturity 11 6.30% - 306,000 - 306,000 Bank balance in PLS accounts 16 4.5 % to 5 % - - 165,993 165,993 Total assets - 306,000 165,993 471,993 Liabilities Short term running finance 24 8.85% to 10.01% (9,584) (9,584) - (19,168) Long term financing 18 8.09% to 9.01% (235,924) (228,437) (1,604,037) (2,068,398) Total liabilities (245,508) (238,021) (1,604,037) (2,087,566) On-balance sheet gap (245,508) 67,979 (1,438,044) (1,615,573) Total interest risk sensitivity gap (245,508) (177,529) (1,615,573) (1,615,573)
------------------------- Rupees in thousands -------------------------
June 30, 2016
TotalMore thanone year
Six monthsto one year
Less thansix months
Mark-up /return (%)
Note
e) Foreign Exchange Risk Management Foreign exchange risk is the risk that the value of financial asset or a liability will fluctuate due to
change in foreign exchange rates. It arises mainly where receivables and payables exist due to transactions entered into foreign currencies. Currently, the Group's foreign exchange risk exposure is restricted to the amounts payable to the foreign entities including amount payable, outstanding letter of credits and bills payable. The Group's exposure to foreign currency risk is as follows:
Trade and other payables 12,281 117 43,621 416 Currently, the Group does not obtain forward cover against the gross exposure. The following
significant rates applied during the year: US Dollar to PKR 104.91 104.46 104.98 104.85
2017 2016
US $RupeesUS $Rupees
2017 20172016 2016
Balance sheet date rateAverage rate
------ in thousands ------------ in thousands ------
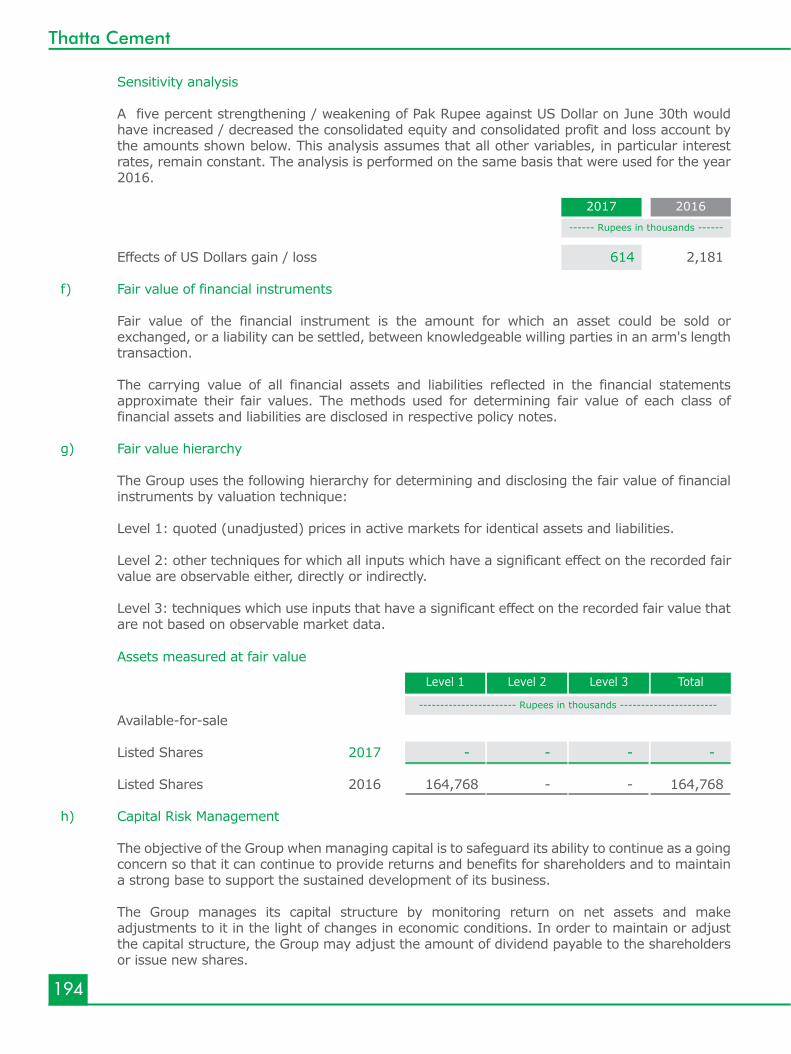
194
Thatta Cement
------ Rupees in thousands ------
2017 2016
Effects of US Dollars gain / loss 614 2,181 f) Fair value of financial instruments Fair value of the financial instrument is the amount for which an asset could be sold or
exchanged, or a liability can be settled, between knowledgeable willing parties in an arm's length transaction.
The carrying value of all financial assets and liabilities reflected in the financial statements
approximate their fair values. The methods used for determining fair value of each class of financial assets and liabilities are disclosed in respective policy notes.
g) Fair value hierarchy The Group uses the following hierarchy for determining and disclosing the fair value of financial
instruments by valuation technique: Level 1: quoted (unadjusted) prices in active markets for identical assets and liabilities.
Level 2: other techniques for which all inputs which have a significant effect on the recorded fair
value are observable either, directly or indirectly. Level 3: techniques which use inputs that have a significant effect on the recorded fair value that
are not based on observable market data.
Sensitivity analysis A five percent strengthening / weakening of Pak Rupee against US Dollar on June 30th would
have increased / decreased the consolidated equity and consolidated profit and loss account by the amounts shown below. This analysis assumes that all other variables, in particular interest rates, remain constant. The analysis is performed on the same basis that were used for the year 2016.
Assets measured at fair value
Available-for-sale Listed Shares 2017 - - - - Listed Shares 2016 164,768 - - 164,768 h) Capital Risk Management
The objective of the Group when managing capital is to safeguard its ability to continue as a going concern so that it can continue to provide returns and benefits for shareholders and to maintain a strong base to support the sustained development of its business.
The Group manages its capital structure by monitoring return on net assets and make adjustments to it in the light of changes in economic conditions. In order to maintain or adjust the capital structure, the Group may adjust the amount of dividend payable to the shareholders or issue new shares.
----------------------- Rupees in thousands -----------------------
TotalLevel 3Level 2Level 1
195
Annual Report 2017
The Group's objective is to manage operational risk so as to balance limiting of financial losses and damage to its reputation while achieving its objectives of becoming a profitable organisation, producing high quality cement and uninterrupted power generation to generate returns for investors. Primary responsibility for the development and implementation of controls over operational risk rests with the Board of Directors. This responsibility encompasses the controls in the following areas: - requirements for appropriate segregation of duties between various functions, roles and
responsibilities; - requirements for reconciliation and monitoring of transactions; - compliance with regulatory and other legal requirements;
- documentation of controls and procedures;
- requirements for periodic assessment of operational risks faced, and the adequacy of controls
and procedures to address the risks identified;
- ethical and business standards;
- risk mitigation, including insurance where this is effective; and
- operational and qualitative track record of the plant and equipment supplier and related service providers.
The Group finances its expansion projects through equity, borrowings and management of its working capital with a view to maintain an appropriate mix between various sources of finance to minimize risk.
i) Operational risk
Operational risk is the risk of direct or indirect loss arising from a wide variety of causes associated with the processes, technology and infrastructure supporting the Group's activities, either internally within the Group or externally at the Group's service providers, and from external factors other than credit, market and liquidity risks such as those arising from legal and regulatory requirements and generally accepted standards of operation behaviour. Operational risks arise from all the Group's activities.
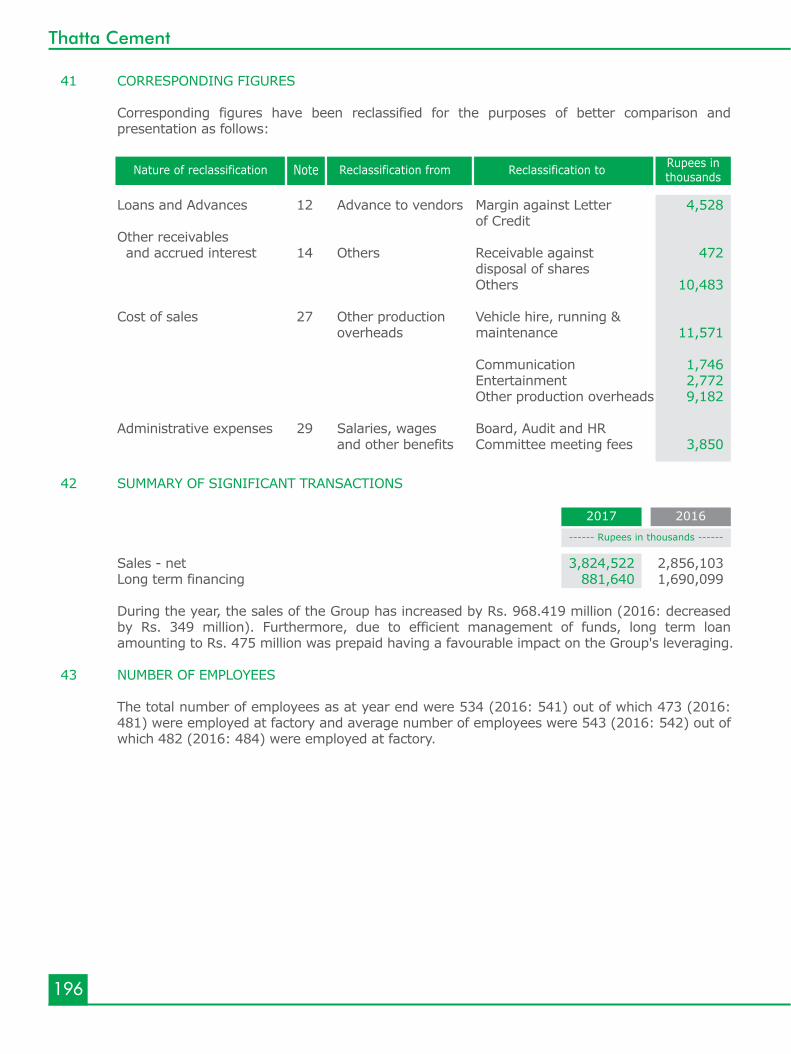
196
Thatta Cement
41 CORRESPONDING FIGURES
Corresponding figures have been reclassified for the purposes of better comparison and presentation as follows:
42 SUMMARY OF SIGNIFICANT TRANSACTIONS
Sales - net 3,824,522 2,856,103 Long term financing 881,640 1,690,099 During the year, the sales of the Group has increased by Rs. 968.419 million (2016: decreased
by Rs. 349 million). Furthermore, due to efficient management of funds, long term loan amounting to Rs. 475 million was prepaid having a favourable impact on the Group's leveraging.
43 NUMBER OF EMPLOYEES The total number of employees as at year end were 534 (2016: 541) out of which 473 (2016:
481) were employed at factory and average number of employees were 543 (2016: 542) out of which 482 (2016: 484) were employed at factory.
Loans and Advances 12 Advance to vendors Margin against Letter 4,528 of Credit Other receivables and accrued interest 14 Others Receivable against 472 disposal of shares Others 10,483 Cost of sales 27 Other production Vehicle hire, running & overheads maintenance 11,571 Communication 1,746 Entertainment 2,772 Other production overheads 9,182 Administrative expenses 29 Salaries, wages Board, Audit and HR and other benefits Committee meeting fees 3,850
Nature of reclassification Note Reclassification from Reclassification to Rupees inthousands
------ Rupees in thousands ------
2017 2016
197
Annual Report 2017
44 NON-ADJUSTING EVENT AFTER THE BALANCE SHEET DATE The Board of Directors of the Holding Company in their meeting held on August 19, 2017, have
proposed for the year ended June 30, 2017, final cash dividend of Rs. 2.35 per share i.e. 23.5% (2016: Rs. 1.5 per share i.e. 15%) amounting to Rs. 234.33 million (2016: Rs. 149.577 million) for approval by the members of the Holding Company in the Annual General Meeting to be held on September 18, 2017. These consolidated financial statements for the year ended June 30, 2017 do not include the effect of the proposed cash dividend, which will be recognized in the consolidated financial statements for the year ending on June 30, 2018.
45 DATE OF AUTHORIZATION These consolidated financial statements were authorized for issue on August 19, 2017 by the
Board of Directors of the Holding Company. 46 GENERAL Figures have been rounded off to the nearest thousand of Rupees.
CHIEF EXECUTIVE DIRECTOR

This page is intentionally left blank
198
Thatta Cement
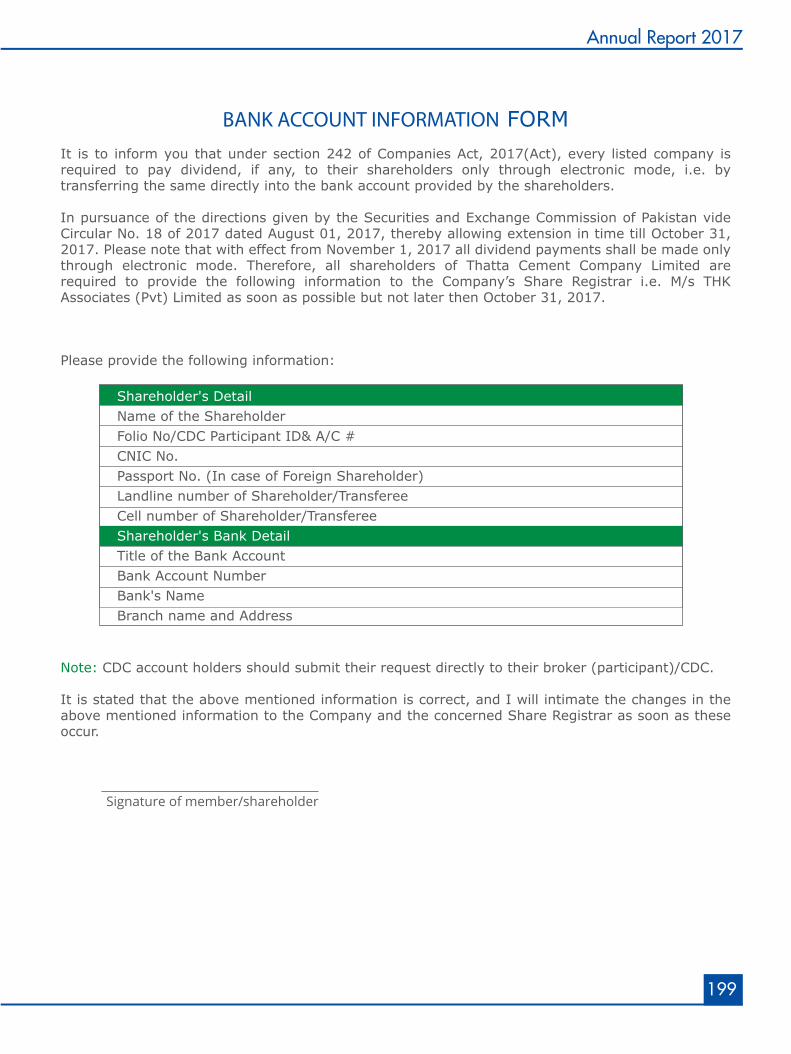
199
Annual Report 2017
To: All Shareholders of the Company
BANK ACCOUNT INFORMATION FORMIt is to inform you that under section 242 of Companies Act, 2017(Act), every listed company is required to pay dividend, if any, to their shareholders only through electronic mode, i.e. by transferring the same directly into the bank account provided by the shareholders.
In pursuance of the directions given by the Securities and Exchange Commission of Pakistan vide Circular No. 18 of 2017 dated August 01, 2017, thereby allowing extension in time till October 31, 2017. Please note that with effect from November 1, 2017 all dividend payments shall be made only through electronic mode. Therefore, all shareholders of Thatta Cement Company Limited are required to provide the following information to the Company’s Share Registrar i.e. M/s THK Associates (Pvt) Limited as soon as possible but not later then October 31, 2017.
Please provide the following information:
Shareholder's Detail Name of the Shareholder Folio No/CDC Participant ID& A/C # CNIC No. Passport No. (In case of Foreign Shareholder) Landline number of Shareholder/Transferee Cell number of Shareholder/Transferee Shareholder's Bank Detail Title of the Bank Account Bank Account Number Bank's Name Branch name and Address
Note: CDC account holders should submit their request directly to their broker (participant)/CDC.
It is stated that the above mentioned information is correct, and I will intimate the changes in the above mentioned information to the Company and the concerned Share Registrar as soon as these occur.
Signature of member/shareholder
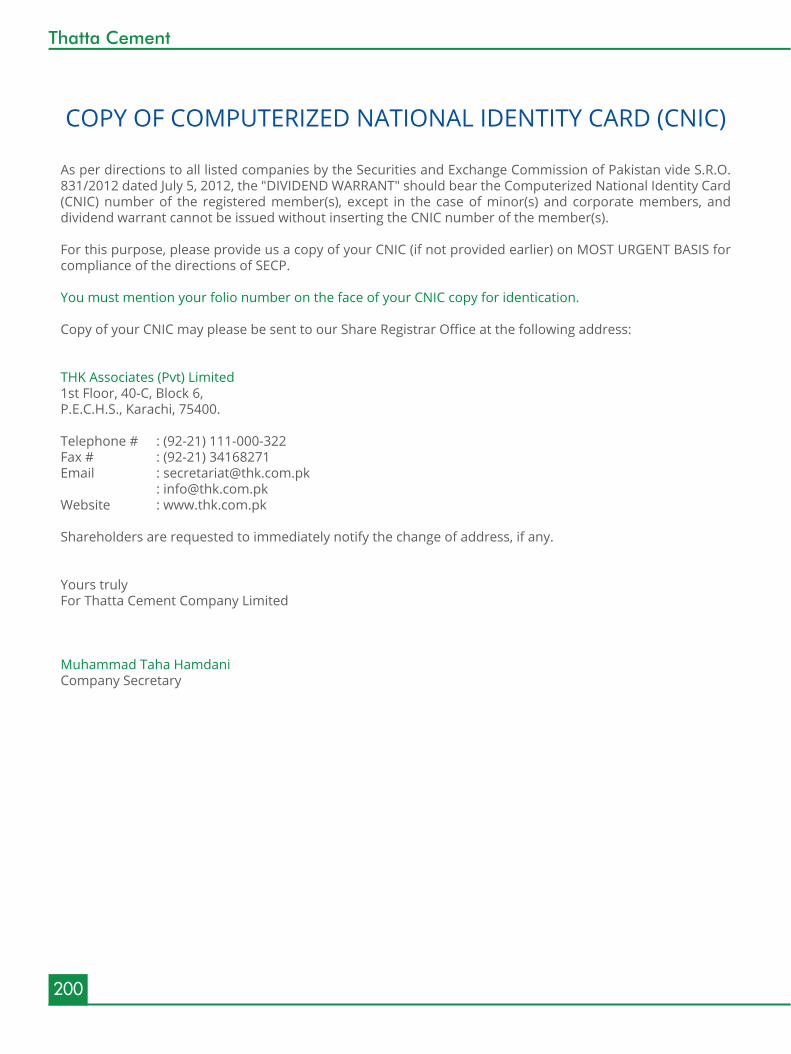
200
Thatta Cement
To: All Shareholders of the Company
COPY OF COMPUTERIZED NATIONAL IDENTITY CARD (CNIC)
As per directions to all listed companies by the Securities and Exchange Commission of Pakistan vide S.R.O. 831/2012 dated July 5, 2012, the "DIVIDEND WARRANT" should bear the Computerized National Identity Card (CNIC) number of the registered member(s), except in the case of minor(s) and corporate members, and dividend warrant cannot be issued without inserting the CNIC number of the member(s).
For this purpose, please provide us a copy of your CNIC (if not provided earlier) on MOST URGENT BASIS for compliance of the directions of SECP.
You must mention your folio number on the face of your CNIC copy for identication.
Copy of your CNIC may please be sent to our Share Registrar Office at the following address:
THK Associates (Pvt) Limited1st Floor, 40-C, Block 6,P.E.C.H.S., Karachi, 75400.
Telephone # : (92-21) 111-000-322Fax # : (92-21) 34168271Email : [email protected] : [email protected] : www.thk.com.pk
Shareholders are requested to immediately notify the change of address, if any.
Yours trulyFor Thatta Cement Company Limited
Muhammad Taha HamdaniCompany Secretary
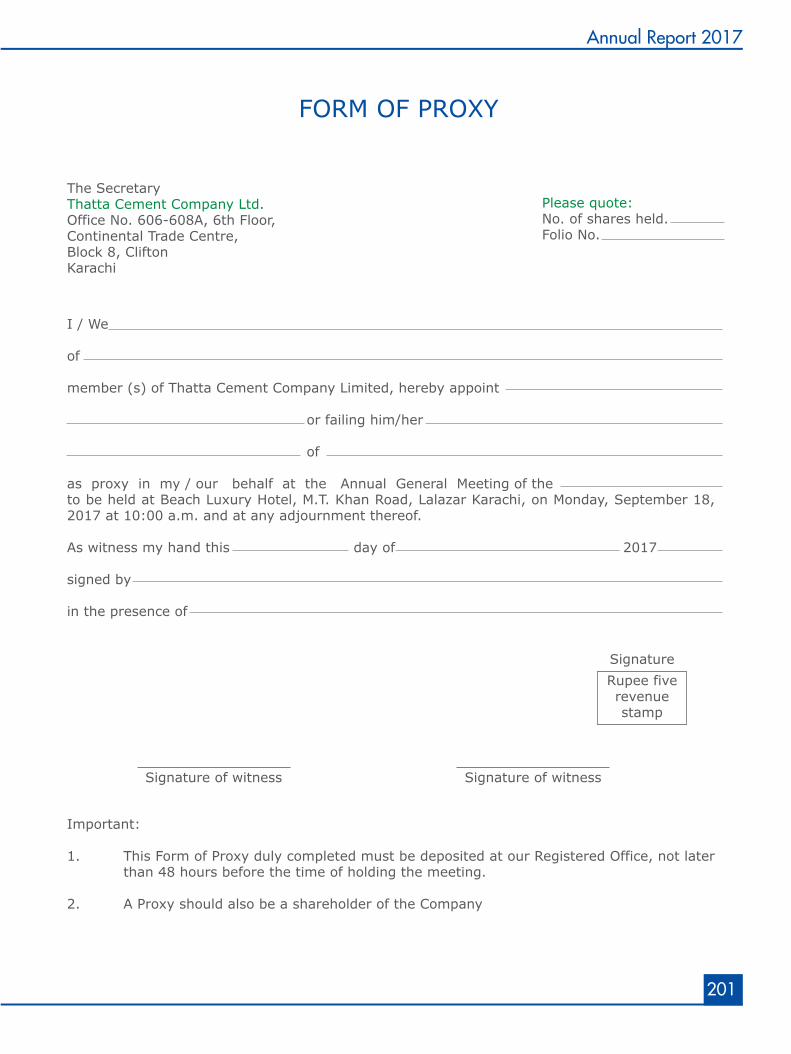
FORM OF PROXY
The SecretaryThatta Cement Company Ltd.Office No. 606-608A, 6th Floor,Continental Trade Centre,Block 8, Clifton Karachi
Please quote:No. of shares held.Folio No.
I / We
of
member (s) of Thatta Cement Company Limited, hereby appoint
or failing him/her
of
as proxy in my / our behalf at the Annual General Meeting of the to be held at Beach Luxury Hotel, M.T. Khan Road, Lalazar Karachi, on Monday, September 18, 2017 at 10:00 a.m. and at any adjournment thereof.
As witness my hand this day of 2017
signed by
in the presence of
Signature Rupee five revenue stamp
Important:
1. This Form of Proxy duly completed must be deposited at our Registered Office, not later than 48 hours before the time of holding the meeting.
2. A Proxy should also be a shareholder of the Company
Signature of witness Signature of witness
201
Annual Report 2017
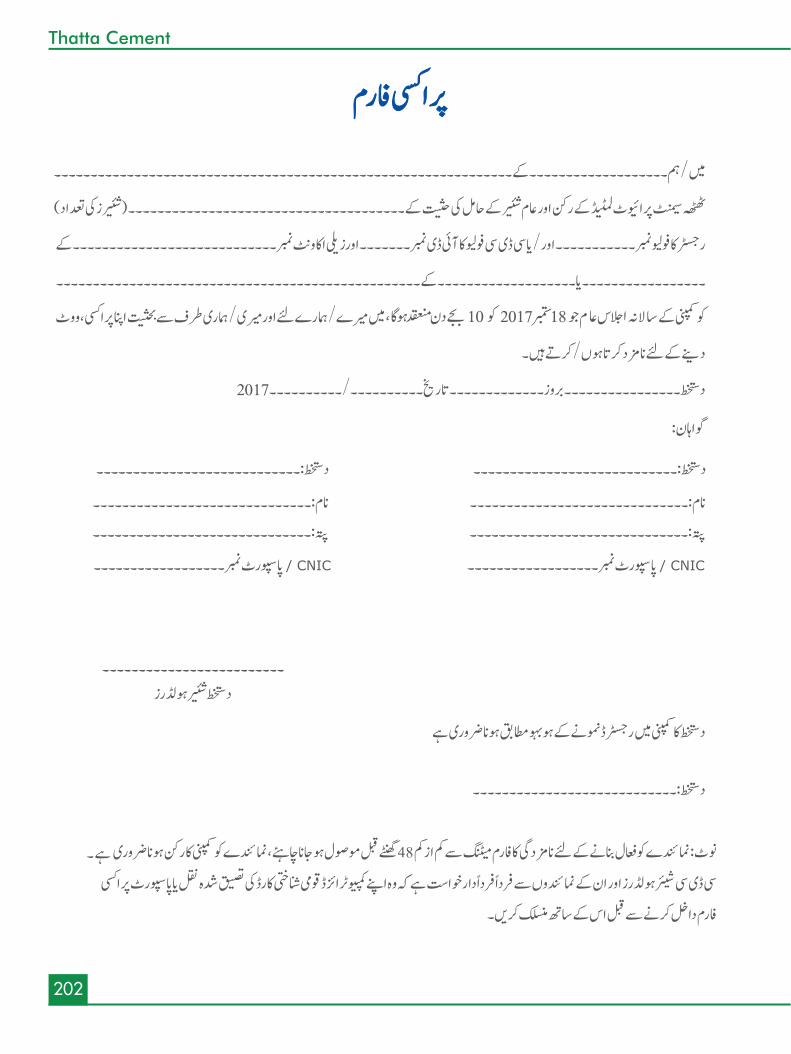
202
Thatta Cement
2017
201710 18
/ CNIC / CNIC
203
Annual Report 2017

This page is intentionally left blank
204
Thatta Cement

Head OfficeOffice # 606-608A, 6th Floor,
Continental Trade Center, Block 8, Clifton, Karachiwww.thattacement.com
FactoryGhulamullah Road, Makli,
District Thatta, Sindh


