29
1
| Date post: | 09-Jan-2017 |
| Category: |
Food |
| Upload: | asian-food-regulation-information-service |
| View: | 295 times |
| Download: | 1 times |

1
“Key Findings of Recent Food Consumption and Nutrition Surveys in ASEAN” -
Malaysian Adult Nutrition Survey (MANS)2014
2
Presenter : Mohamad Hasnan Bin Ahmad
Nutritionist Institute For Public Health
Ministry of Health 50590 Jalan Bangsar, Kuala Lumpur
3
• An understanding of common types of food consumed is crucial to identify the population’s food choices
• Food consumption data provide an estimation on the
quantity of each prepared food consumed by individuals • The food consumption data vary considerably from country
to country and even within a country due to variations in sociodemographic and socioeconomic status such as ethnicity, geographical areas, age, sex and income (Malik et al., 2013)
Introduction
4
• The World Health Organization (WHO) recommends that each countries should estimate their own food consumption pattern data.
• This is because the data can be used for a variety of
purposes such as examining the dietary pattern, evaluating the frequency of food intake, assessing adequacy of nutrient intake, as well as establishing policies and recommendation.
• In Malaysia, nationwide food consumption data have
been collected in Malaysian Adult Nutrition Survey (MANS) in 2003 and 2014.
Introduction

5
General objectives
To evaluate the food consumption intake of the Malaysian adult population
Specific objectives
1.To determine the top ten foods frequently or regularly consumed by Malaysian adult population 2.To determine the changes in top ten foods frequently or regularly consumed with the previous study (MANS 2003) 3.To determine daily intake of energy, macro- and micro- nutrients 4.To determine the changes in daily intake of energy, macro- and micro- nutrients with the previous study (MANS 2003)
Objectives
6
• MANS was a nationwide cross-sectional study conducted in March until June 2014.
• Multistage stratified sampling design was used to select a
representative sample of Malaysian adult population, aged 18 to 59 years old.
• Data on food consumption were derived from :
1. Food Frequency Questionnaire (FFQ) which contains 165 common consumed foods/ beverages
2. One day 24-hour diet recall.
• NutriPro and Statistical Package for Social Science (SPSS) softwares were used for nutrient and statistical analyses.
Methodology
7
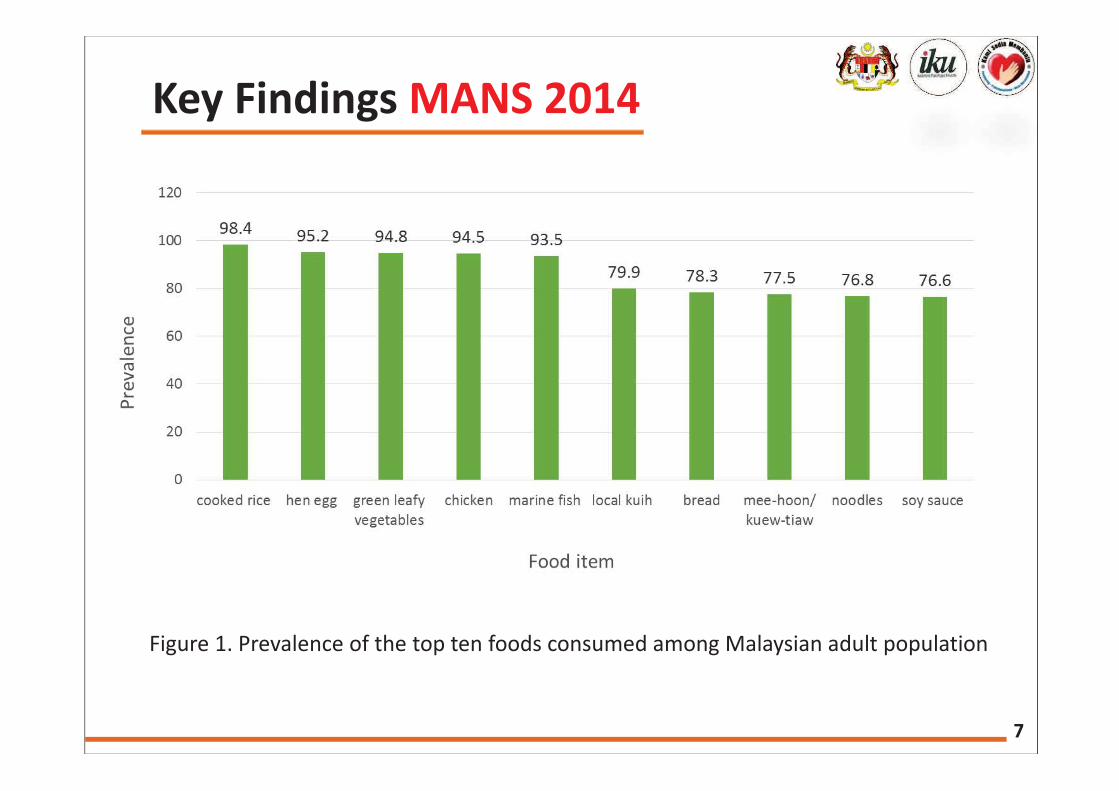
Key Findings MANS 2014
Figure 1. Prevalence of the top ten foods consumed among Malaysian adult population
8
Key Findings
Table 1. Comparison of prevalence and mean intake of the top ten foods consumed among Malaysian adult between MANS 2003 and MANS 2014
MANS 2003 MANS 2014
Food Items Prevalence
(%)
Mean intake
(g/day) Food Items
Prevalence
(%)
Mean intake
(g/day)
Cooked rice 97.5 289.7 Cooked rice 98.4 279.6 Green leafy vege. 95.7 50.7 Hen egg 95.2 31.0
Marine fish 94.7 60.7 Green leafy vege. 94.8 69.7
Hen egg 93.4 25.2 Chicken 94.5 35.0
Chicken 92.8 31.7 Marine fish 93.5 50.1
Local kuih 92.5 21.6 Local kuih 79.9 28.2
Noodles 92.1 66.3 Bread 78.3 36.6 Mee-hoon/ kuew-tiaw 90.6 66.6 Mee-hoon/ kuew-
tiaw 77.5 84.3
Bean vege. 89.7 16.4 Noodles 76.8 84.0 Cabbage 88.5 18.2 Soy sauce 76.6 7.7
Coo
Meetia
Loc
5
General objectives
To evaluate the food consumption intake of the Malaysian adult population
Specific objectives
1.To determine the top ten foods frequently or regularly consumed by Malaysian adult population 2.To determine the changes in top ten foods frequently or regularly consumed with the previous study (MANS 2003) 3.To determine daily intake of energy, macro- and micro- nutrients 4.To determine the changes in daily intake of energy, macro- and micro- nutrients with the previous study (MANS 2003)
Objectives
6
• MANS was a nationwide cross-sectional study conducted in March until June 2014.
• Multistage stratified sampling design was used to select a
representative sample of Malaysian adult population, aged 18 to 59 years old.
• Data on food consumption were derived from :
1. Food Frequency Questionnaire (FFQ) which contains 165 common consumed foods/ beverages
2. One day 24-hour diet recall.
• NutriPro and Statistical Package for Social Science (SPSS) softwares were used for nutrient and statistical analyses.
Methodology
7
Key Findings MANS 2014
Figure 1. Prevalence of the top ten foods consumed among Malaysian adult population
8
Key Findings
Table 1. Comparison of prevalence and mean intake of the top ten foods consumed among Malaysian adult between MANS 2003 and MANS 2014
MANS 2003 MANS 2014
Food Items Prevalence
(%)
Mean intake
(g/day) Food Items
Prevalence
(%)
Mean intake
(g/day)
Cooked rice 97.5 289.7 Cooked rice 98.4 279.6 Green leafy vege. 95.7 50.7 Hen egg 95.2 31.0
Marine fish 94.7 60.7 Green leafy vege. 94.8 69.7
Hen egg 93.4 25.2 Chicken 94.5 35.0
Chicken 92.8 31.7 Marine fish 93.5 50.1
Local kuih 92.5 21.6 Local kuih 79.9 28.2
Noodles 92.1 66.3 Bread 78.3 36.6 Mee-hoon/ kuew-tiaw 90.6 66.6 Mee-hoon/ kuew-
tiaw 77.5 84.3
Bean vege. 89.7 16.4 Noodles 76.8 84.0 Cabbage 88.5 18.2 Soy sauce 76.6 7.7
Coo
Meetia
Loc
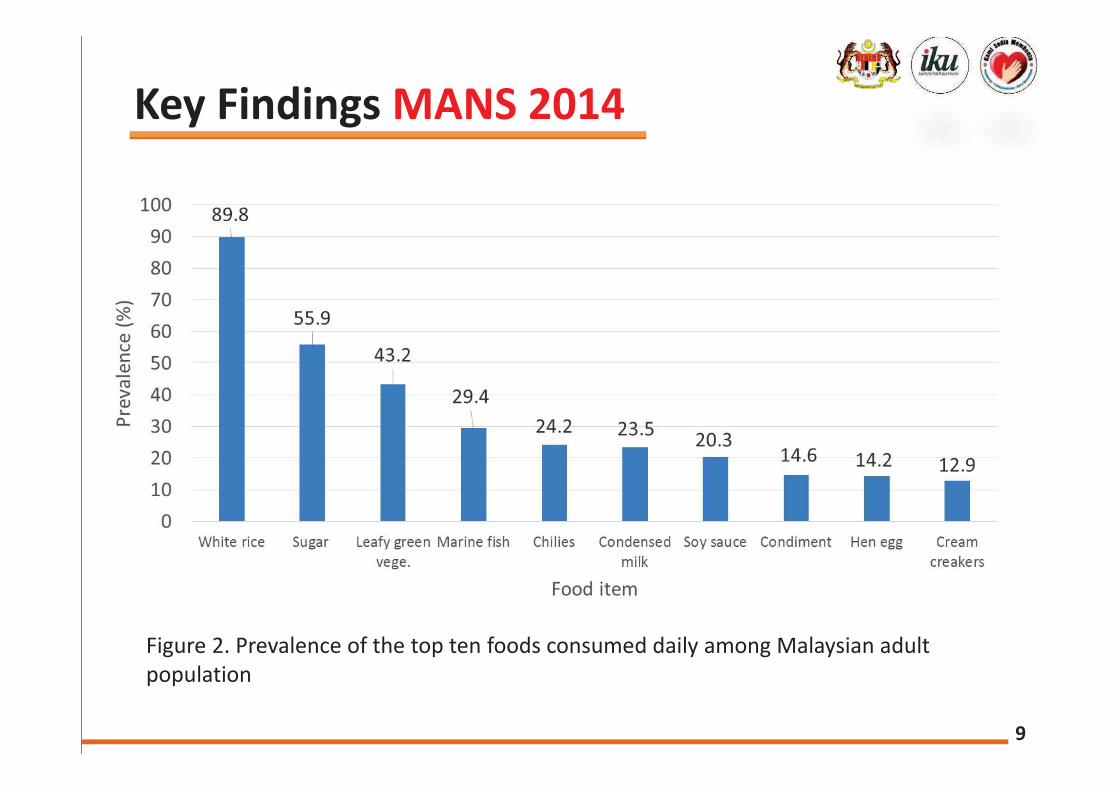
9
Figure 2. Prevalence of the top ten foods consumed daily among Malaysian adult population
Key Findings MANS 2014
10
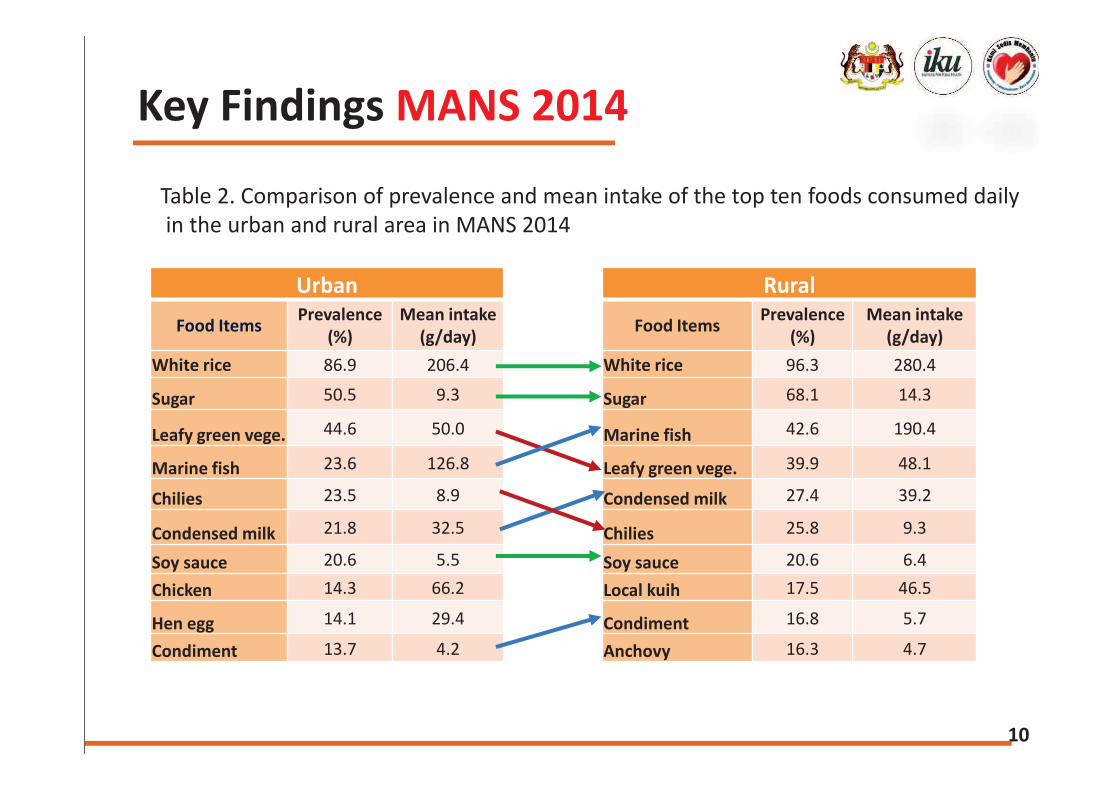
Urban Rural Food Items Prevalence
(%) Mean intake
(g/day) Food Items Prevalence (%)
Mean intake (g/day)
White rice 86.9 206.4 White rice 96.3 280.4
Sugar 50.5 9.3 Sugar 68.1 14.3
Leafy green vege. 44.6 50.0 Marine fish 42.6 190.4
Marine fish 23.6 126.8 Leafy green vege. 39.9 48.1
Chilies 23.5 8.9 Condensed milk 27.4 39.2
Condensed milk 21.8 32.5 Chilies 25.8 9.3
Soy sauce 20.6 5.5 Soy sauce 20.6 6.4 Chicken 14.3 66.2 Local kuih 17.5 46.5
Hen egg 14.1 29.4 Condiment 16.8 5.7
Condiment 13.7 4.2 Anchovy 16.3 4.7
Table 2. Comparison of prevalence and mean intake of the top ten foods consumed daily in the urban and rural area in MANS 2014
Key Findings MANS 2014
11
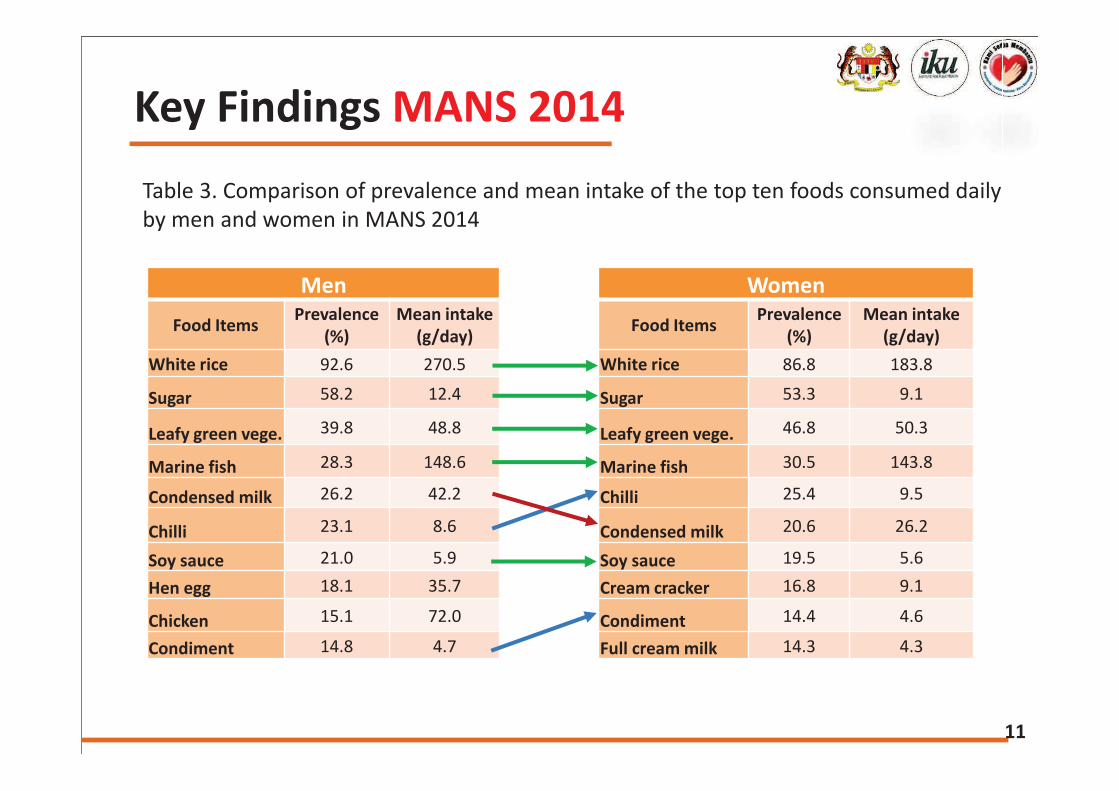
Men Women Food Items Prevalence
(%) Mean intake
(g/day) Food Items Prevalence (%)
Mean intake (g/day)
White rice 92.6 270.5 White rice 86.8 183.8
Sugar 58.2 12.4 Sugar 53.3 9.1
Leafy green vege. 39.8 48.8 Leafy green vege. 46.8 50.3
Marine fish 28.3 148.6 Marine fish 30.5 143.8
Condensed milk 26.2 42.2 Chilli 25.4 9.5
Chilli 23.1 8.6 Condensed milk 20.6 26.2
Soy sauce 21.0 5.9 Soy sauce 19.5 5.6 Hen egg 18.1 35.7 Cream cracker 16.8 9.1
Chicken 15.1 72.0 Condiment 14.4 4.6
Condiment 14.8 4.7 Full cream milk 14.3 4.3
Table 3. Comparison of prevalence and mean intake of the top ten foods consumed daily by men and women in MANS 2014
Key Findings MANS 2014
12
Key Findings
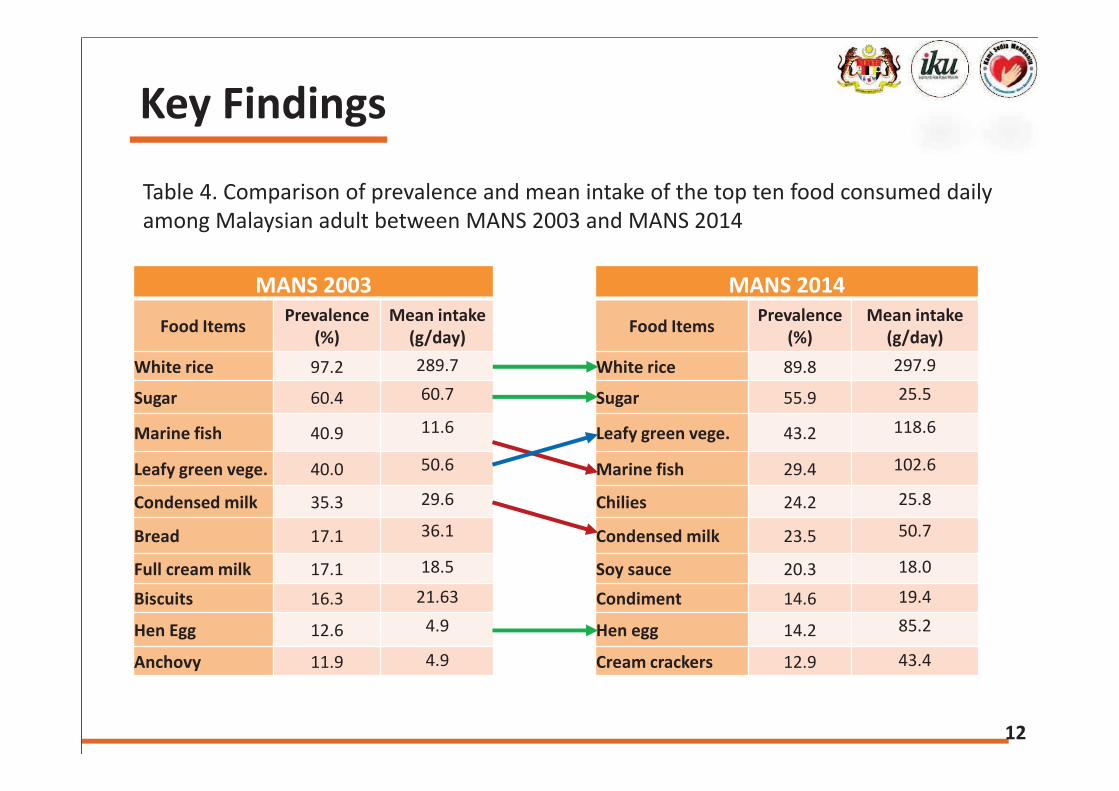
MANS 2003 MANS 2014
Food Items Prevalence (%)
Mean intake (g/day) Food Items Prevalence
(%) Mean intake
(g/day) White rice 97.2 289.7 White rice 89.8 297.9
Sugar 60.4 60.7 Sugar 55.9 25.5
Marine fish 40.9 11.6 Leafy green vege. 43.2 118.6
Leafy green vege. 40.0 50.6 Marine fish 29.4 102.6
Condensed milk 35.3 29.6 Chilies 24.2 25.8
Bread 17.1 36.1 Condensed milk 23.5 50.7
Full cream milk 17.1 18.5 Soy sauce 20.3 18.0
Biscuits 16.3 21.63 Condiment 14.6 19.4
Hen Egg 12.6 4.9 Hen egg 14.2 85.2
Anchovy 11.9 4.9 Cream crackers 12.9 43.4
Table 4. Comparison of prevalence and mean intake of the top ten food consumed daily among Malaysian adult between MANS 2003 and MANS 2014
9
Figure 2. Prevalence of the top ten foods consumed daily among Malaysian adult population
Key Findings MANS 2014
10
Urban Rural Food Items Prevalence
(%) Mean intake
(g/day) Food Items Prevalence (%)
Mean intake (g/day)
White rice 86.9 206.4 White rice 96.3 280.4
Sugar 50.5 9.3 Sugar 68.1 14.3
Leafy green vege. 44.6 50.0 Marine fish 42.6 190.4
Marine fish 23.6 126.8 Leafy green vege. 39.9 48.1
Chilies 23.5 8.9 Condensed milk 27.4 39.2
Condensed milk 21.8 32.5 Chilies 25.8 9.3
Soy sauce 20.6 5.5 Soy sauce 20.6 6.4 Chicken 14.3 66.2 Local kuih 17.5 46.5
Hen egg 14.1 29.4 Condiment 16.8 5.7
Condiment 13.7 4.2 Anchovy 16.3 4.7
Table 2. Comparison of prevalence and mean intake of the top ten foods consumed daily in the urban and rural area in MANS 2014
Key Findings MANS 2014
11
Men Women Food Items Prevalence
(%) Mean intake
(g/day) Food Items Prevalence (%)
Mean intake (g/day)
White rice 92.6 270.5 White rice 86.8 183.8
Sugar 58.2 12.4 Sugar 53.3 9.1
Leafy green vege. 39.8 48.8 Leafy green vege. 46.8 50.3
Marine fish 28.3 148.6 Marine fish 30.5 143.8
Condensed milk 26.2 42.2 Chilli 25.4 9.5
Chilli 23.1 8.6 Condensed milk 20.6 26.2
Soy sauce 21.0 5.9 Soy sauce 19.5 5.6 Hen egg 18.1 35.7 Cream cracker 16.8 9.1
Chicken 15.1 72.0 Condiment 14.4 4.6
Condiment 14.8 4.7 Full cream milk 14.3 4.3
Table 3. Comparison of prevalence and mean intake of the top ten foods consumed daily by men and women in MANS 2014
Key Findings MANS 2014
12
Key Findings
MANS 2003 MANS 2014
Food Items Prevalence (%)
Mean intake (g/day) Food Items Prevalence
(%) Mean intake
(g/day) White rice 97.2 289.7 White rice 89.8 297.9
Sugar 60.4 60.7 Sugar 55.9 25.5
Marine fish 40.9 11.6 Leafy green vege. 43.2 118.6
Leafy green vege. 40.0 50.6 Marine fish 29.4 102.6
Condensed milk 35.3 29.6 Chilies 24.2 25.8
Bread 17.1 36.1 Condensed milk 23.5 50.7
Full cream milk 17.1 18.5 Soy sauce 20.3 18.0
Biscuits 16.3 21.63 Condiment 14.6 19.4
Hen Egg 12.6 4.9 Hen egg 14.2 85.2
Anchovy 11.9 4.9 Cream crackers 12.9 43.4
Table 4. Comparison of prevalence and mean intake of the top ten food consumed daily among Malaysian adult between MANS 2003 and MANS 2014
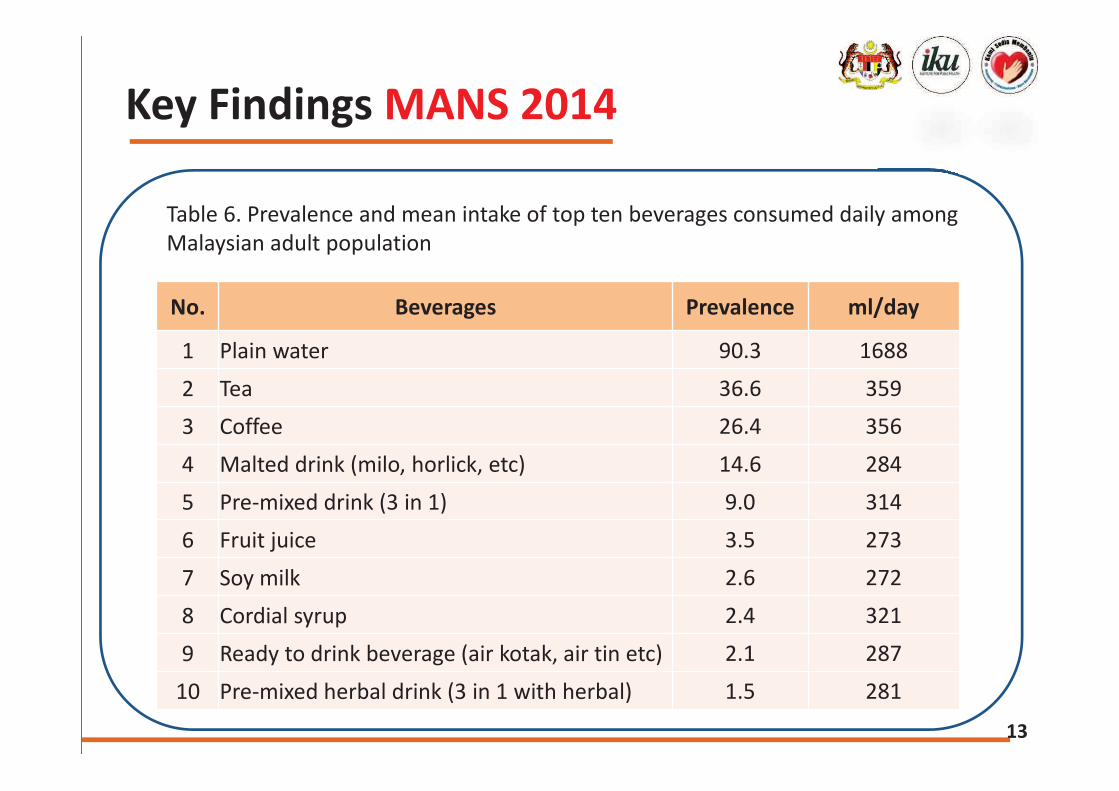
13
Table 6. Prevalence and mean intake of top ten beverages consumed daily among Malaysian adult population
No. Beverages Prevalence ml/day
1 Plain water 90.3 1688 2 Tea 36.6 359 3 Coffee 26.4 356 4 Malted drink (milo, horlick, etc) 14.6 284 5 Pre-mixed drink (3 in 1) 9.0 314 6 Fruit juice 3.5 273 7 Soy milk 2.6 272 8 Cordial syrup 2.4 321 9 Ready to drink beverage (air kotak, air tin etc) 2.1 287
10 Pre-mixed herbal drink (3 in 1 with herbal) 1.5 281
Key Findings MANS 2014
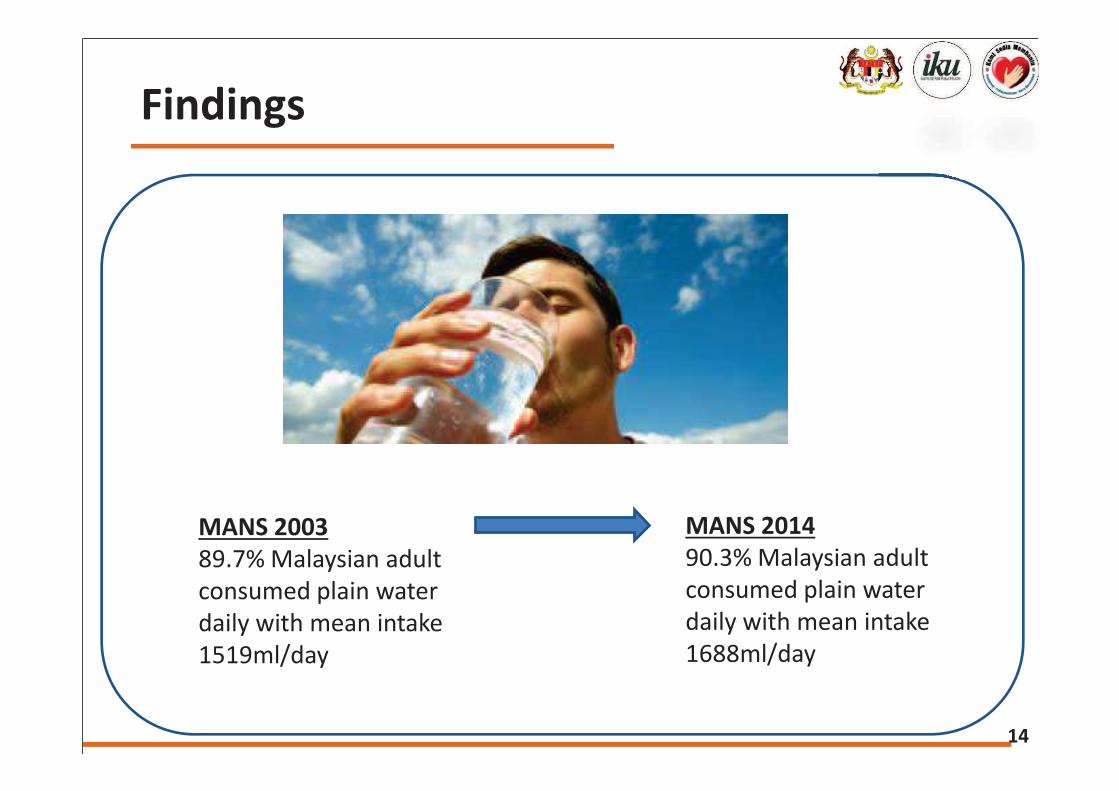
14
Findings
MANS 2003 89.7% Malaysian adult consumed plain water daily with mean intake 1519ml/day
MANS 2014 90.3% Malaysian adult consumed plain water daily with mean intake 1688ml/day
15
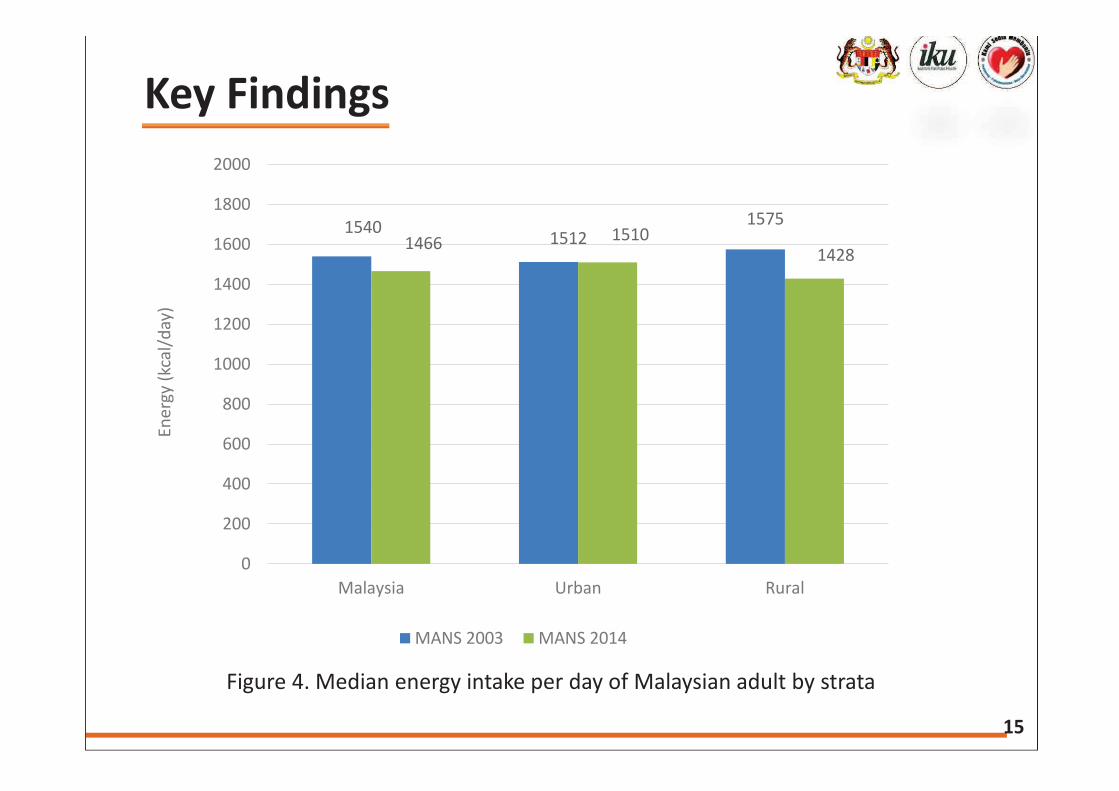
Key Findings
Figure 4. Median energy intake per day of Malaysian adult by strata
1540 1512 1575
1466 1510 1428
0
200
400
600
800
1000
1200
1400
1600
1800
2000
Malaysia Urban Rural
Ener
gy (k
cal/d
ay)
MANS 2003 MANS 2014
16
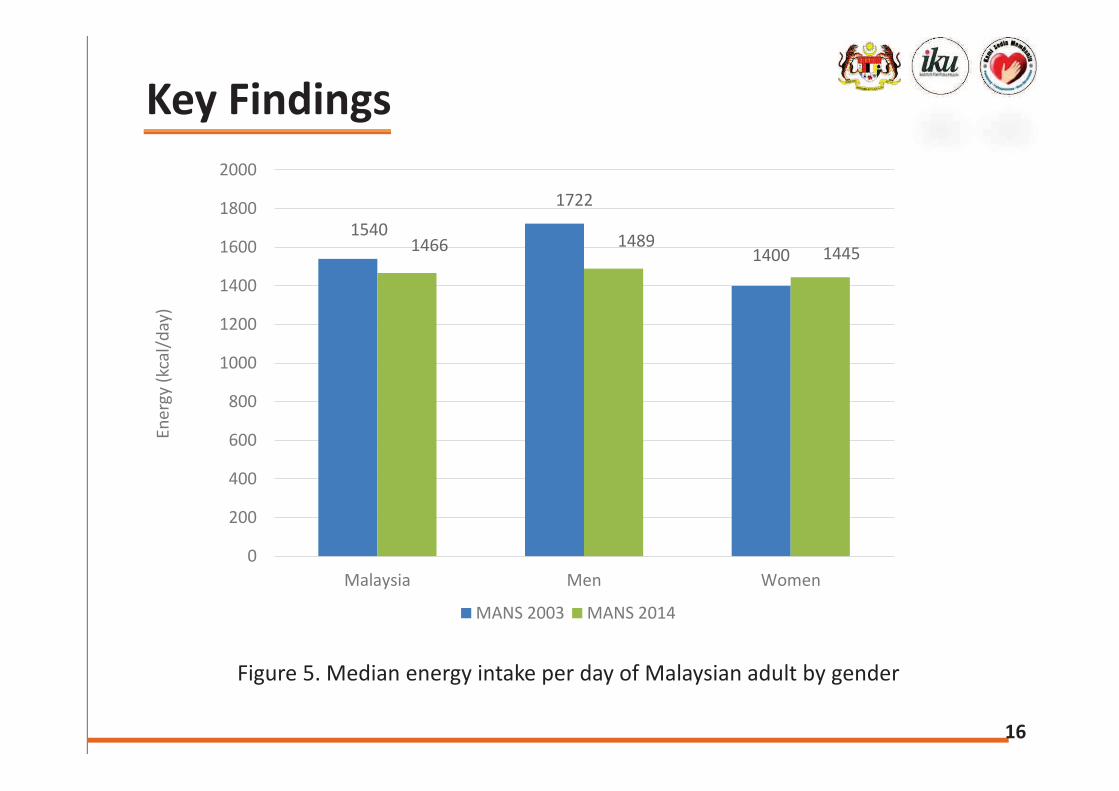
Key Findings
Figure 5. Median energy intake per day of Malaysian adult by gender
1540 1722
1400 1466 1489 1445
0
200
400
600
800
1000
1200
1400
1600
1800
2000
Malaysia Men Women
Ener
gy (k
cal/d
ay)
MANS 2003 MANS 2014
13
Table 6. Prevalence and mean intake of top ten beverages consumed daily among Malaysian adult population
No. Beverages Prevalence ml/day
1 Plain water 90.3 1688 2 Tea 36.6 359 3 Coffee 26.4 356 4 Malted drink (milo, horlick, etc) 14.6 284 5 Pre-mixed drink (3 in 1) 9.0 314 6 Fruit juice 3.5 273 7 Soy milk 2.6 272 8 Cordial syrup 2.4 321 9 Ready to drink beverage (air kotak, air tin etc) 2.1 287
10 Pre-mixed herbal drink (3 in 1 with herbal) 1.5 281
Key Findings MANS 2014
14
Findings
MANS 2003 89.7% Malaysian adult consumed plain water daily with mean intake 1519ml/day
MANS 2014 90.3% Malaysian adult consumed plain water daily with mean intake 1688ml/day
15
Key Findings
Figure 4. Median energy intake per day of Malaysian adult by strata
1540 1512 1575
1466 1510 1428
0
200
400
600
800
1000
1200
1400
1600
1800
2000
Malaysia Urban Rural
Ener
gy (k
cal/d
ay)
MANS 2003 MANS 2014
16
Key Findings
Figure 5. Median energy intake per day of Malaysian adult by gender
1540 1722
1400 1466 1489 1445
0
200
400
600
800
1000
1200
1400
1600
1800
2000
Malaysia Men Women
Ener
gy (k
cal/d
ay)
MANS 2003 MANS 2014
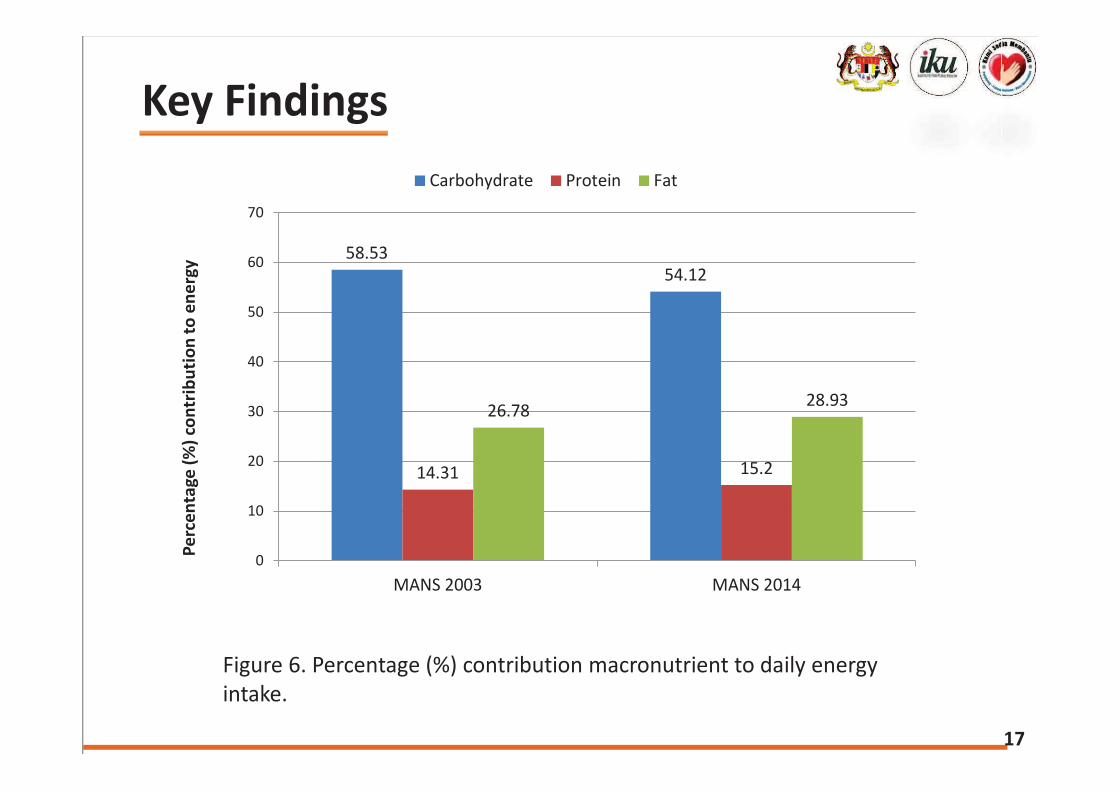
17
Key Findings
58.53 54.12
14.31 15.2
26.78 28.93
0
10
20
30
40
50
60
70
MANS 2003 MANS 2014
Perc
enta
ge (%
) con
trib
utio
n to
ene
rgy
Carbohydrate Protein Fat
Figure 6. Percentage (%) contribution macronutrient to daily energy
intake.
18
Key Findings
Figure 7. Percentage achievement of selected nutrient to Malaysia Recommended
Nutrient Intake
70
95
43 40
55
68 64
98
44
78
56
89
0
20
40
60
80
100
120
Energy Protein Calcium Iron Vit C Vit A
% R
NI
Nutrient
MANS 2003 MANS 2014
19
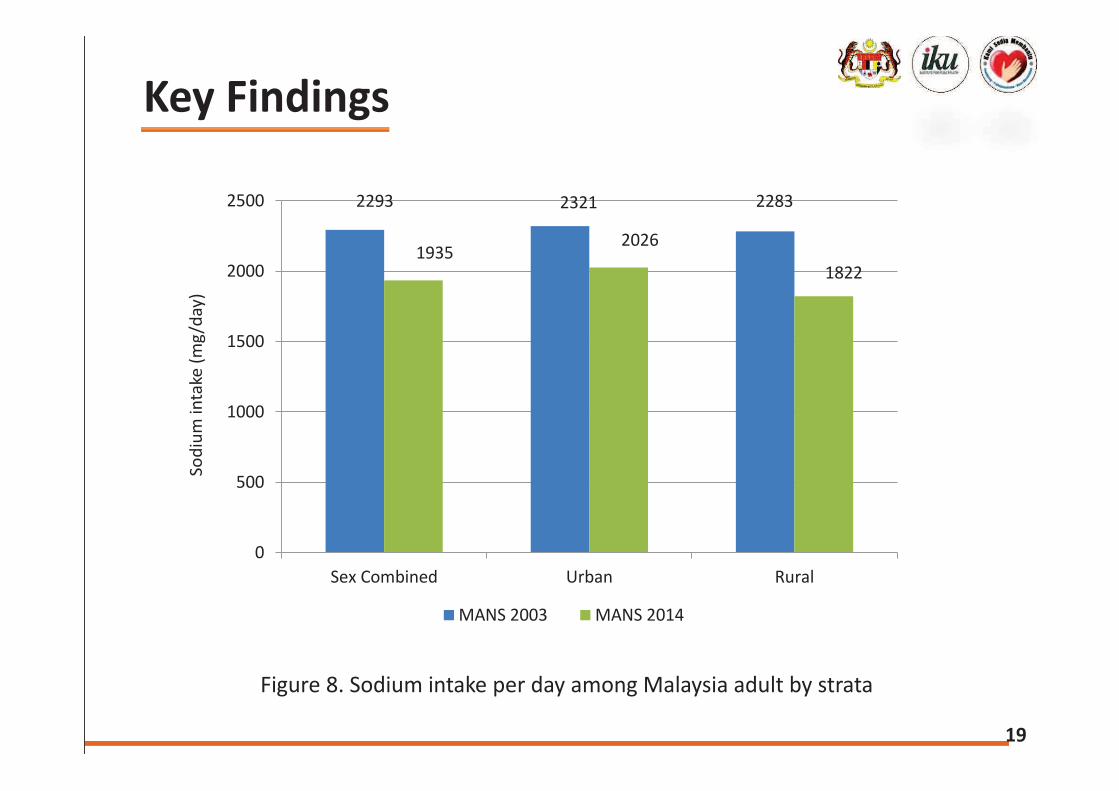
Key Findings
2293 2321 2283
1935 2026
1822
0
500
1000
1500
2000
2500
Sex Combined Urban Rural
Sod
ium
inta
ke (
mg
/day
)
MANS 2003 MANS 2014
Figure 8. Sodium intake per day among Malaysia adult by strata
20
Key Findings
2293
2584
2072 1935 1970
1914
0
500
1000
1500
2000
2500
3000
Sex Combined Men Women
Sodi
um in
take
(mg/
day)
MANS 2003 MANS 2014
Figure 9. Sodium intake per day among Malaysia adult by gender

17
Key Findings
58.53 54.12
14.31 15.2
26.78 28.93
0
10
20
30
40
50
60
70
MANS 2003 MANS 2014
Perc
enta
ge (%
) con
trib
utio
n to
ene
rgy
Carbohydrate Protein Fat
Figure 6. Percentage (%) contribution macronutrient to daily energy
intake.
18
Key Findings
Figure 7. Percentage achievement of selected nutrient to Malaysia Recommended
Nutrient Intake
70
95
43 40
55
68 64
98
44
78
56
89
0
20
40
60
80
100
120
Energy Protein Calcium Iron Vit C Vit A
% R
NI
Nutrient
MANS 2003 MANS 2014
19
Key Findings
2293 2321 2283
1935 2026
1822
0
500
1000
1500
2000
2500
Sex Combined Urban Rural
Sod
ium
inta
ke (
mg
/day
)
MANS 2003 MANS 2014
Figure 8. Sodium intake per day among Malaysia adult by strata
20
Key Findings
2293
2584
2072 1935 1970
1914
0
500
1000
1500
2000
2500
3000
Sex Combined Men Women
Sodi
um in
take
(mg/
day)
MANS 2003 MANS 2014
Figure 9. Sodium intake per day among Malaysia adult by gender

21
• Several food items were consumed daily and weekly by
Malaysian adult population, which consists of diversity of types of food consumed
• There was almost similar food patterns reported in current
MANS 2014 with previous MANS 2003’s food consumption pattern, but an increase consumption of “processed foods” such as soy sauce & condiments was observed
• Higher consumption of “processed foods” added with salts and unhealthy condiments increases the likelihood of unhealthy eating pattern such as higher intake of food consumed (Brondel et al., 2009)
Discussion
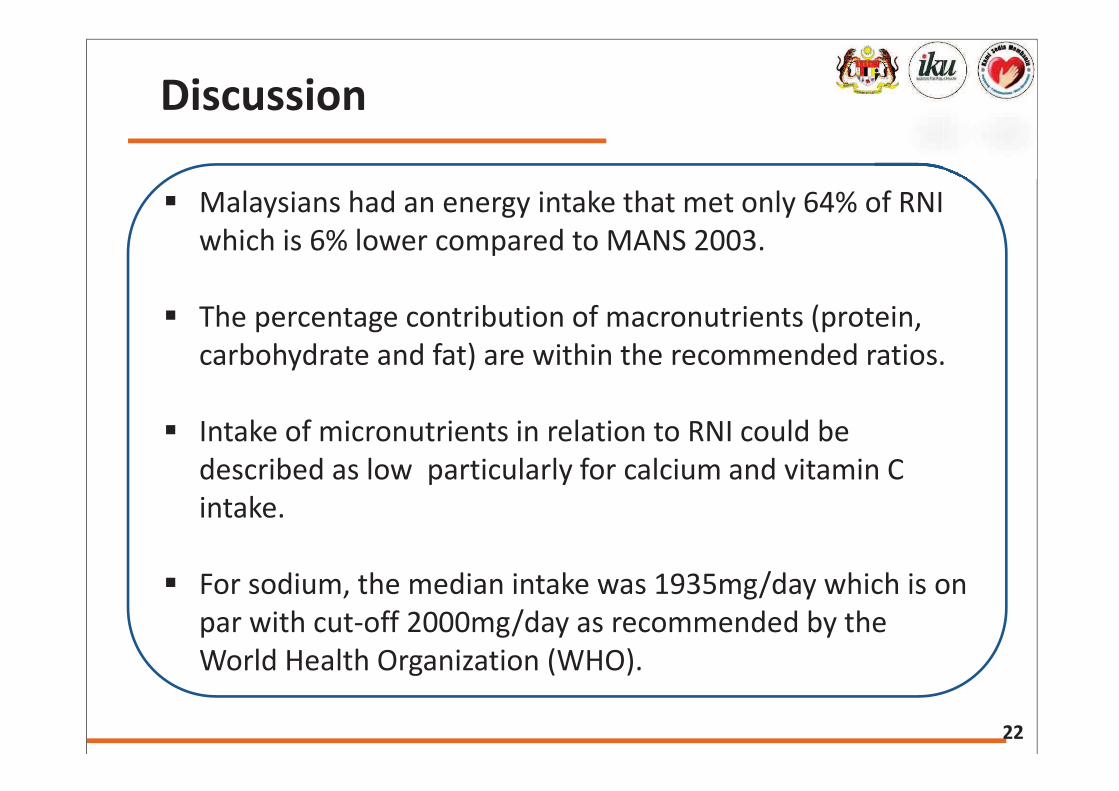
22
ß Malaysians had an energy intake that met only 64% of RNI
which is 6% lower compared to MANS 2003.
ß The percentage contribution of macronutrients (protein, carbohydrate and fat) are within the recommended ratios.
ß Intake of micronutrients in relation to RNI could be described as low particularly for calcium and vitamin C intake.
ß For sodium, the median intake was 1935mg/day which is on
par with cut-off 2000mg/day as recommended by the World Health Organization (WHO).
Discussion
23
• Majority of the Malaysian adults consumed white rice daily with an average intake 2 ½ plates per day
• Compared with MANS 2003, consumption of “processed
foods” added with salt and condiments had increased and it is appear among the top ten most consumed foods.
• Generally, most of nutrient intake by Malaysian adult show the positive trend in term of achievement to RNI except for energy.
Conclusion
24
• An increasing trend of “processed foods” added with salts and condiments among adults in Malaysia is of concern and alternative healthier condiments and low salt processed foods should be recommended
• Regular nutrition surveys should be carried out to provide valuable information on trends in food and nutrient intake among Malaysian population.
Recommendation
21
• Several food items were consumed daily and weekly by
Malaysian adult population, which consists of diversity of types of food consumed
• There was almost similar food patterns reported in current
MANS 2014 with previous MANS 2003’s food consumption pattern, but an increase consumption of “processed foods” such as soy sauce & condiments was observed
• Higher consumption of “processed foods” added with salts and unhealthy condiments increases the likelihood of unhealthy eating pattern such as higher intake of food consumed (Brondel et al., 2009)
Discussion
22
ß Malaysians had an energy intake that met only 64% of RNI
which is 6% lower compared to MANS 2003.
ß The percentage contribution of macronutrients (protein, carbohydrate and fat) are within the recommended ratios.
ß Intake of micronutrients in relation to RNI could be described as low particularly for calcium and vitamin C intake.
ß For sodium, the median intake was 1935mg/day which is on
par with cut-off 2000mg/day as recommended by the World Health Organization (WHO).
Discussion
23
• Majority of the Malaysian adults consumed white rice daily with an average intake 2 ½ plates per day
• Compared with MANS 2003, consumption of “processed
foods” added with salt and condiments had increased and it is appear among the top ten most consumed foods.
• Generally, most of nutrient intake by Malaysian adult show the positive trend in term of achievement to RNI except for energy.
Conclusion
24
• An increasing trend of “processed foods” added with salts and condiments among adults in Malaysia is of concern and alternative healthier condiments and low salt processed foods should be recommended
• Regular nutrition surveys should be carried out to provide valuable information on trends in food and nutrient intake among Malaysian population.
Recommendation

25
1. Malik, V. S., Pan, A., Willett, W. C., & Hu, F. B. (2013). Sugar-sweetened beverages and
weight gain in children and adults: a systematic review and meta-analysis. The American journal of clinical nutrition, 98(4), 1084-1102.
2. Wessex Institute of Public Health Medicine, 1993. Software Package for Food Frequency Questionnaire.
3. A Karim, N., Mohd Yusof, S., Hashim, J. K., Din, M., Haslinda, S., Harun, Z., ... & Sulong, F. (2008). Food consumption patterns: findings from the Malaysian Adult Nutrition Survey (MANS). Malaysian Journal of Nutrition, 14(1), 25-39.
4. Habitual Food Intake od Adults Aged 18 to 59 Years. Report Malaysian Adult Nutrition Survey 2003. Ministry of Health Malaysia.
5. Tee, E. (2011). Development and promotion of Malaysian dietary guidelines.Asia Pacific journal of clinical nutrition, 20(3), 455.
6. Brondel, L., Romer, M., Van Wymelbeke, V., Pineau, N., Jiang, T., Hanus, C., & Rigaud, D. (2009). Variety enhances food intake in humans: role of sensory-specific satiety. Physiology & Behavior, 97(1), 44-51.
References
26
I would like to thank the Director General of Health of Malaysia for permission to present this finding. Our special appreciation goes to all the respondents their willingness to participate in this study. Not forget many thanks to all data collectors and team members for Malaysian Adult Nutrition Survey (MANS) 2014.
MANS 2014
General Finding
Food Security
Meal Pattern
Food Intake by Food GROUP
Habits to Relation to Food
Consumption
Food Labelling
Nutrient
Intake
Nutritional Status
Vitamin & Mineral
Suplements
Food Habit
Acknowledgment
27
For the details data and information in every scope, kindly refer to the MANS 2014 report available in IKU website (http://www.iku.gov.my/).
MANS 2014
General Finding
Food Security
Meal Pattern
Food Intake by Food GROUP
Habits to Relation to Food
Consumption
Food Labelling
Nutrient
Intake
Nutritional Status
Vitamin & Mineral
Suplements
Food Habit
MANS 2014
28
THANK YOU
MANS 2014
General Finding
Food Security
Meal Pattern
Food Intake by Food GROUP
Habits to Relation to Food
Consumption
Food Labelling
Nutrient
Intake
Nutritional Status
Vitamin & Mineral
Suplements
Food Habit

Asian Food Regulation Information Service is a resource for the food industry. We have the largest database of Asian food regulations in the world – and it’s FREE to use. We publish a range of communication services (free and paid), list a very large number of food events and online educational webinars and continue to grow our Digital Library. Feel free to contact us anytime to talk about your specific requirements, offer comments, complaints or to compliment us.
We look forward to hearing from you soon!
www.asianfoodreg.com [email protected]


