Symposium on Market Liberalization and its Relationship with Market Structure Conduct and Performance of Selected Food Processing Industries of APEC Member Economies Kuala Lumpur, Malaysia 12-14 December 2007 APEC Agricultural Technical Cooperation Working Group December 2007
Transcript
Symposium on Market Liberalization and its Relationship with Market Structure Conduct and
Performance of Selected Food Processing Industries of APEC Member Economies
Kuala Lumpur, Malaysia
12-14 December 2007
APEC Agricultural Technical Cooperation Working Group
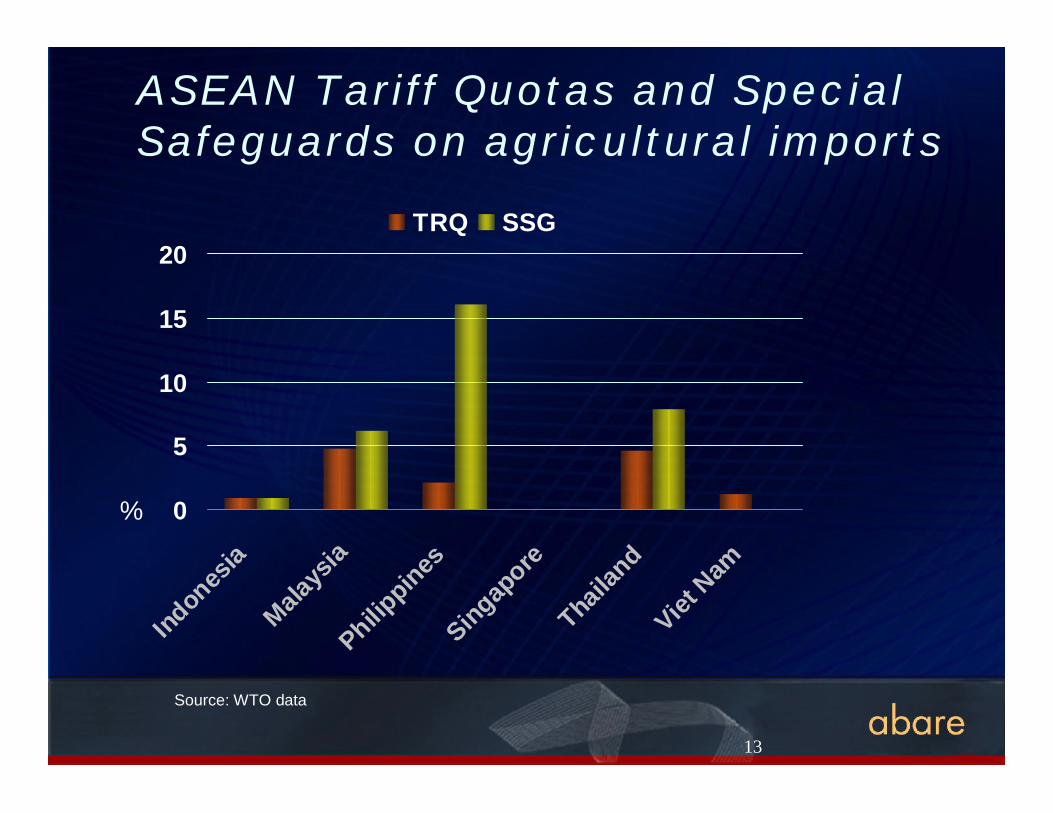
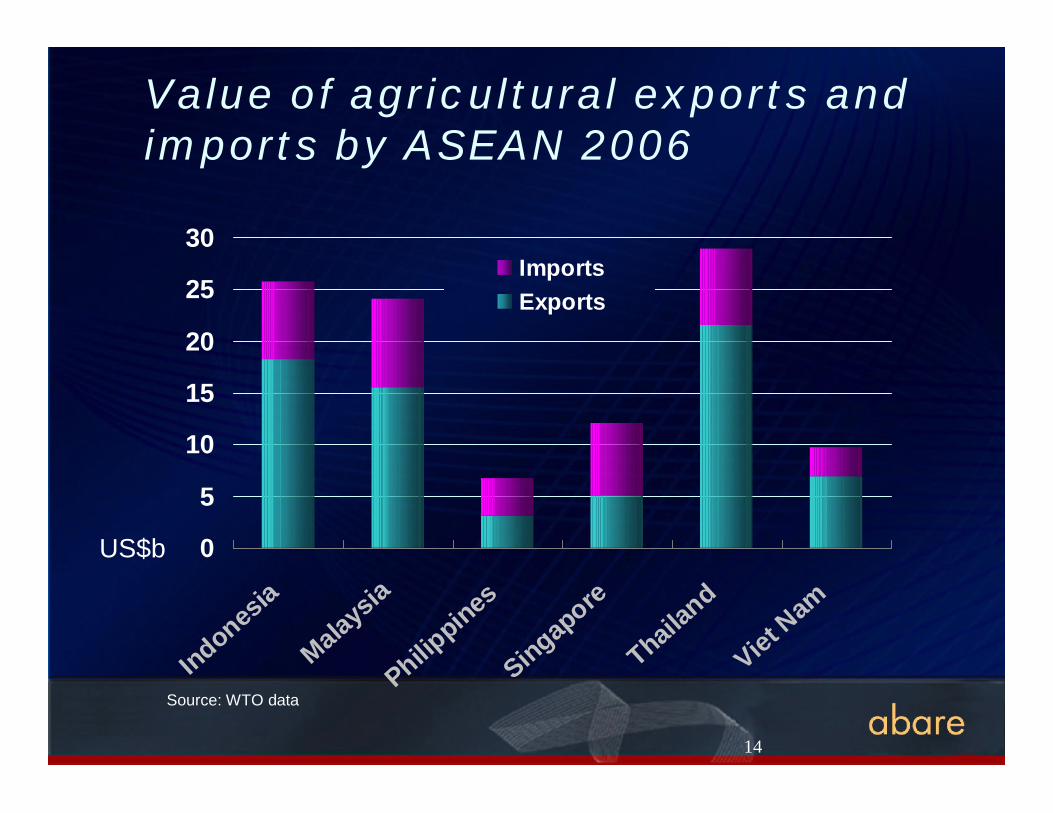
Economic Impacts of Trade Liberalization– A Global perspective
Yeon Kim, PhDSenior Research Economist
Australian Bureau of Agricultural and Resource Economics (ABARE), Canberraemail: [email protected]
AbstractA successful outcome in the Doha Round of multilateral trade negotiations under the auspices ofthe World Trade Organisation (WTO) would stimulate the growth of new markets created byevolving consumption patterns internationally, particularly in rapidly growing developing countries.For many of these countries, accelerating consumer demand for agricultural products will be metthrough international trade because the resources required to produce goods domestically are notalways located in areas where markets are expanding, and where consumption is growing at a fasterpace than domestic production.
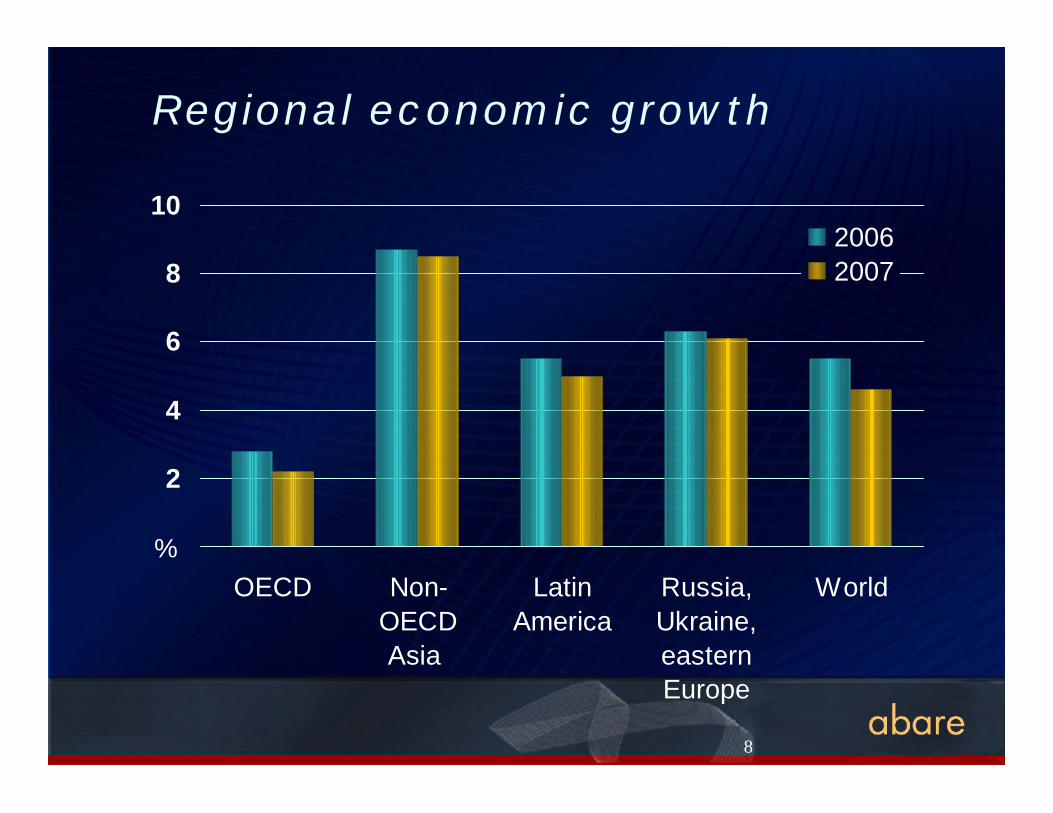
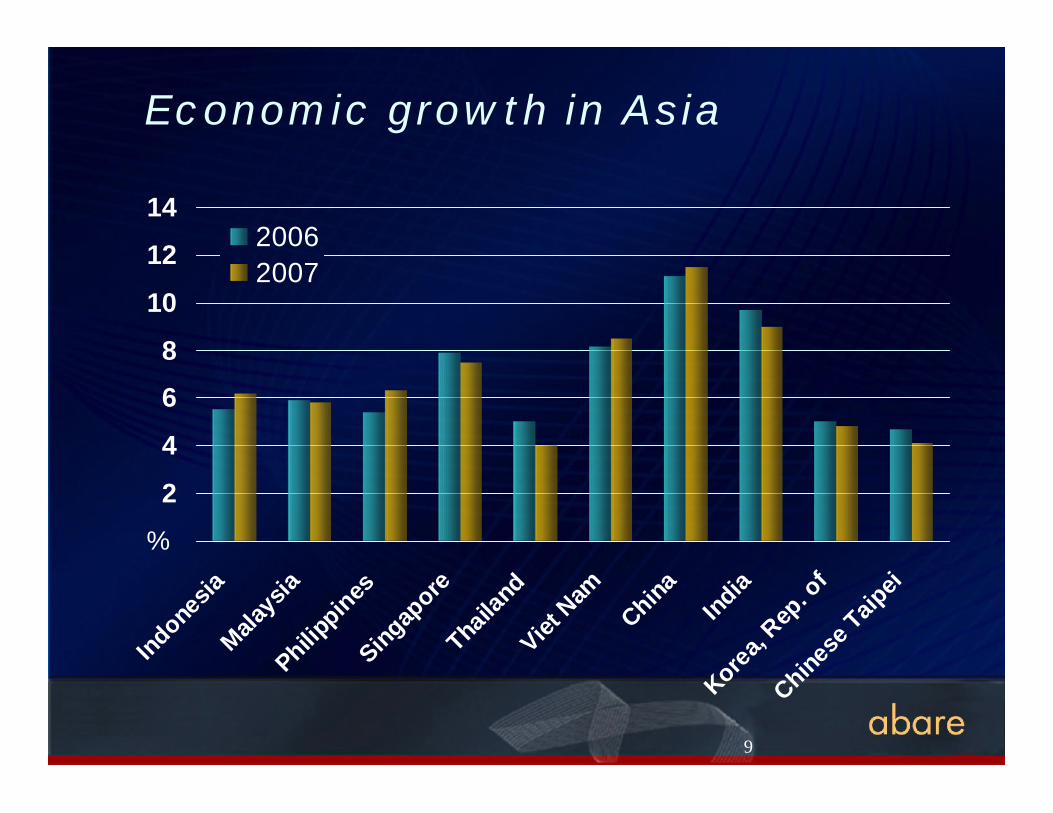
In China and India, the world’s most populous countries, rates of economic growth in 2006 were 11per cent and 8 per cent respectively. By 2020, GDP growth rates are predicted to be around 5 percent in China and 6 per cent in India. One recent trend that deserves emphasis is the robusteconomic performance of prominent South East Asian countries: the resurgence of Indonesia,Malaysia, the Philippines and Thailand, and the emergence of Viet Nam, as they integrate into theworld economy.
The potential benefits of freer agricultural trade motivated WTO member countries to initiate theDoha Round of trade negotiations and to revise and expand the trade rules that were established inthe Uruguay Round. It is important that the Doha Round outcome offers the prospect for greatlyexpanded trade, and opportunities for ASEAN agriculture industries to position them to benefitfrom major changes in the world economy in coming decades.
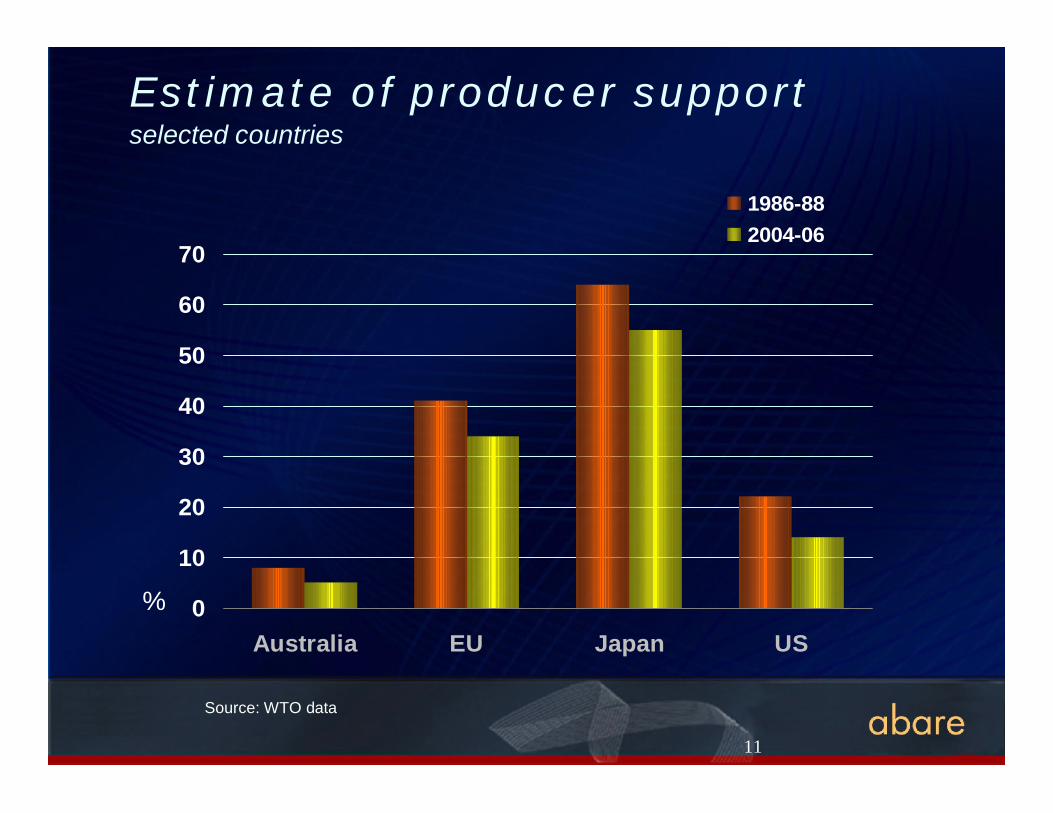
It is essential that the major players in the multilateral trade negotiations move to break the currentimpasse, and return to the negotiating table with improved offers. The European Union anddeveloping countries have to accept high cuts to agricultural tariffs, and the United States needs todo more by way of both increased cuts and meaningful disciplines on agricultural subsidies.
Genuine policy reform improves the allocations of resources, spurs enterprises toward theircompetitive advantage, and strengthens incentives to respond to market signals and take steps thatgenerate benefits associated with improved industry competitiveness. Managing the transitionaladjustment pressures from policy reform is an important issue for many countries, most notably indeveloping countries that have had limited experience in dealing with the domestic consequencesof policy reform; partly because of inadequate governance, infrastructure and institutions. However,it is the case that open economies grow faster and are more dynamic.
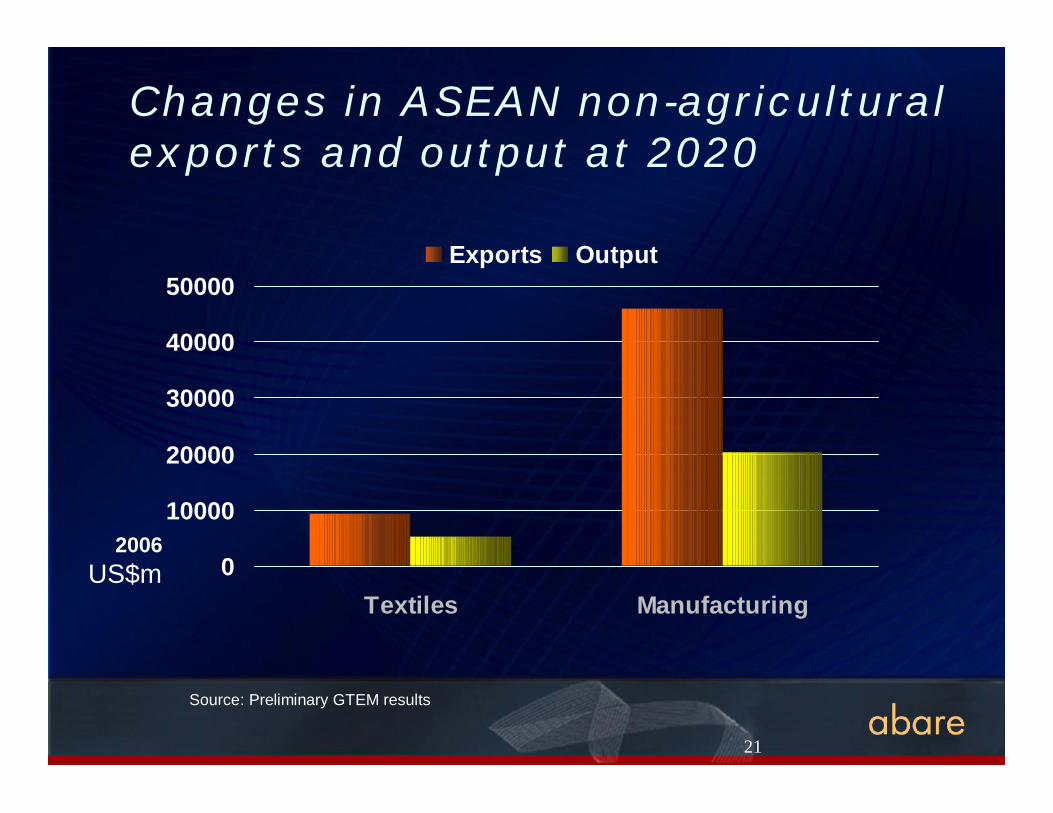
Additional benefits are likely to flow from liberalising barriers to trade in other merchandiseproducts, typically manufactured goods. Non-agricultural market access liberalisation has animportant role in partially offsetting losses borne in regions dependent on low international foodprices or preferential access to agricultural markets. Agricultural trade liberalisation, in conjunction
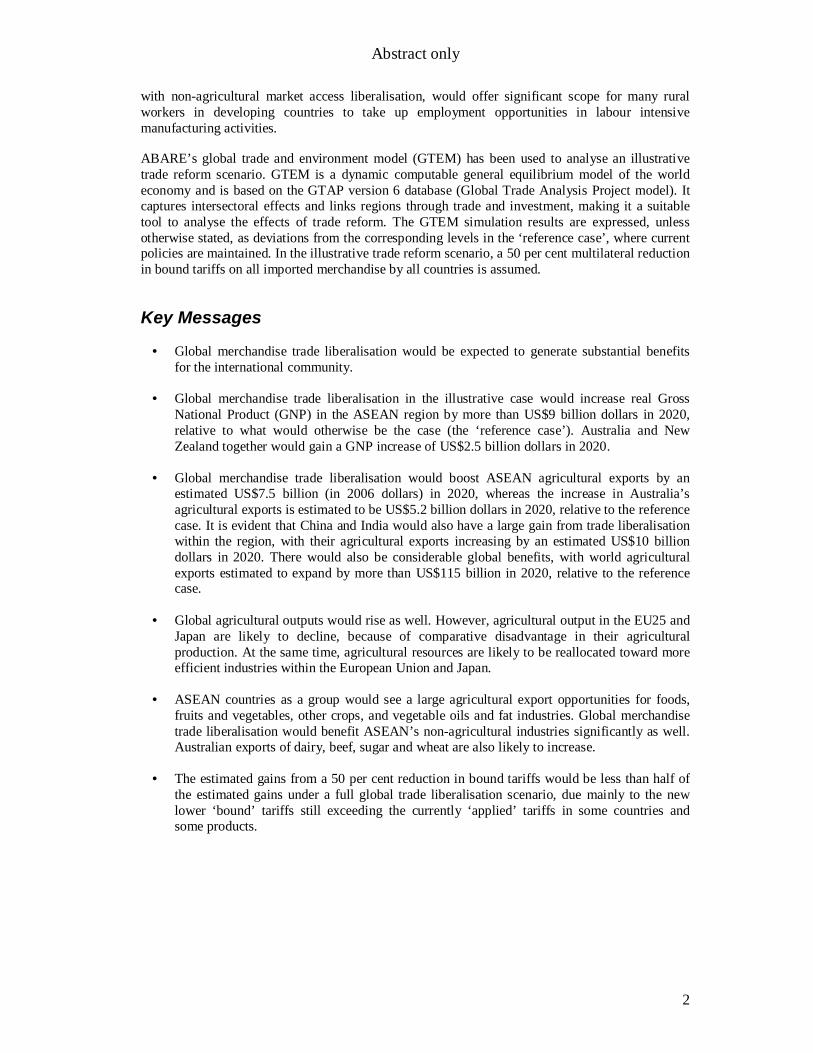
Abstract only
2
with non-agricultural market access liberalisation, would offer significant scope for many ruralworkers in developing countries to take up employment opportunities in labour intensivemanufacturing activities.
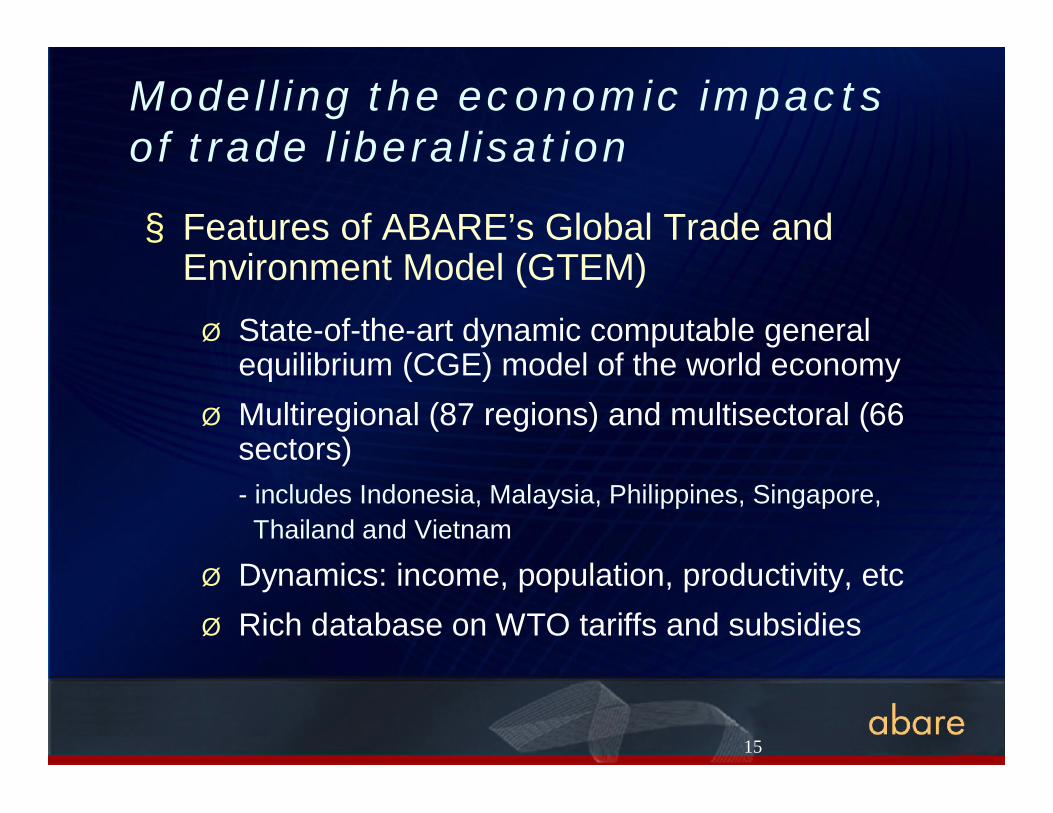
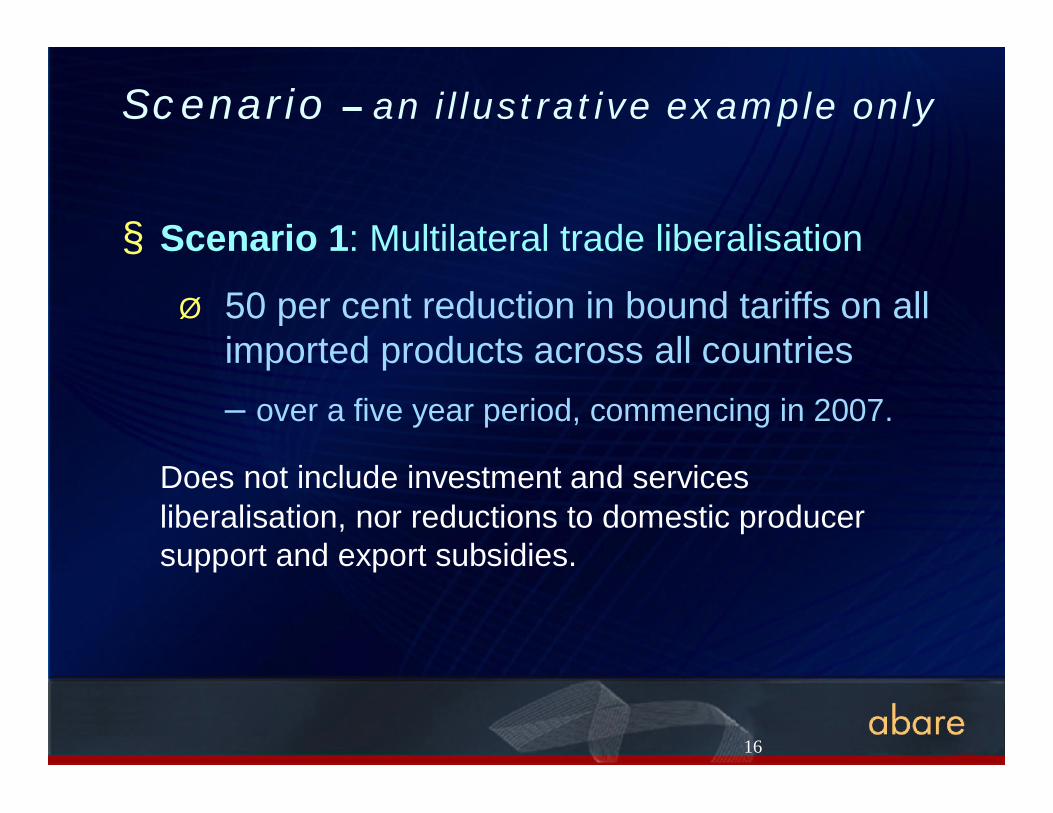
ABARE’s global trade and environment model (GTEM) has been used to analyse an illustrativetrade reform scenario. GTEM is a dynamic computable general equilibrium model of the worldeconomy and is based on the GTAP version 6 database (Global Trade Analysis Project model). Itcaptures intersectoral effects and links regions through trade and investment, making it a suitabletool to analyse the effects of trade reform. The GTEM simulation results are expressed, unlessotherwise stated, as deviations from the corresponding levels in the ‘reference case’, where currentpolicies are maintained. In the illustrative trade reform scenario, a 50 per cent multilateral reductionin bound tariffs on all imported merchandise by all countries is assumed.
Key Messages
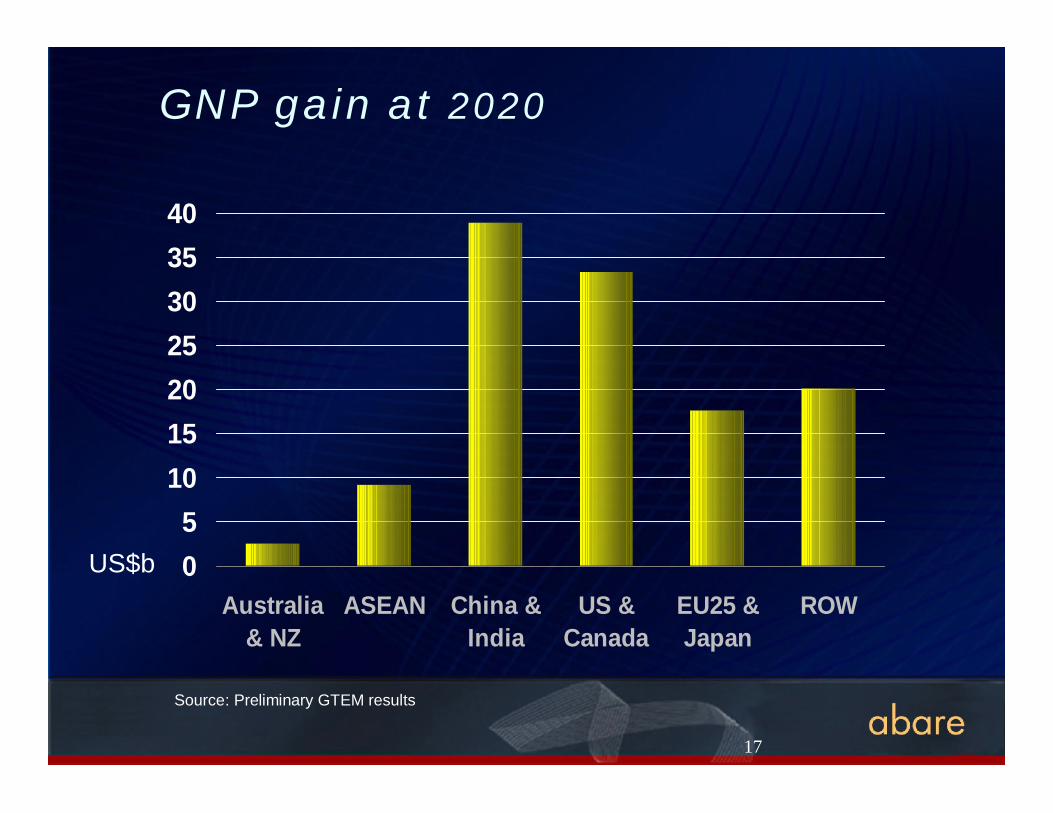
• Global merchandise trade liberalisation would be expected to generate substantial benefitsfor the international community.
• Global merchandise trade liberalisation in the illustrative case would increase real GrossNational Product (GNP) in the ASEAN region by more than US$9 billion dollars in 2020,relative to what would otherwise be the case (the ‘reference case’). Australia and NewZealand together would gain a GNP increase of US$2.5 billion dollars in 2020.
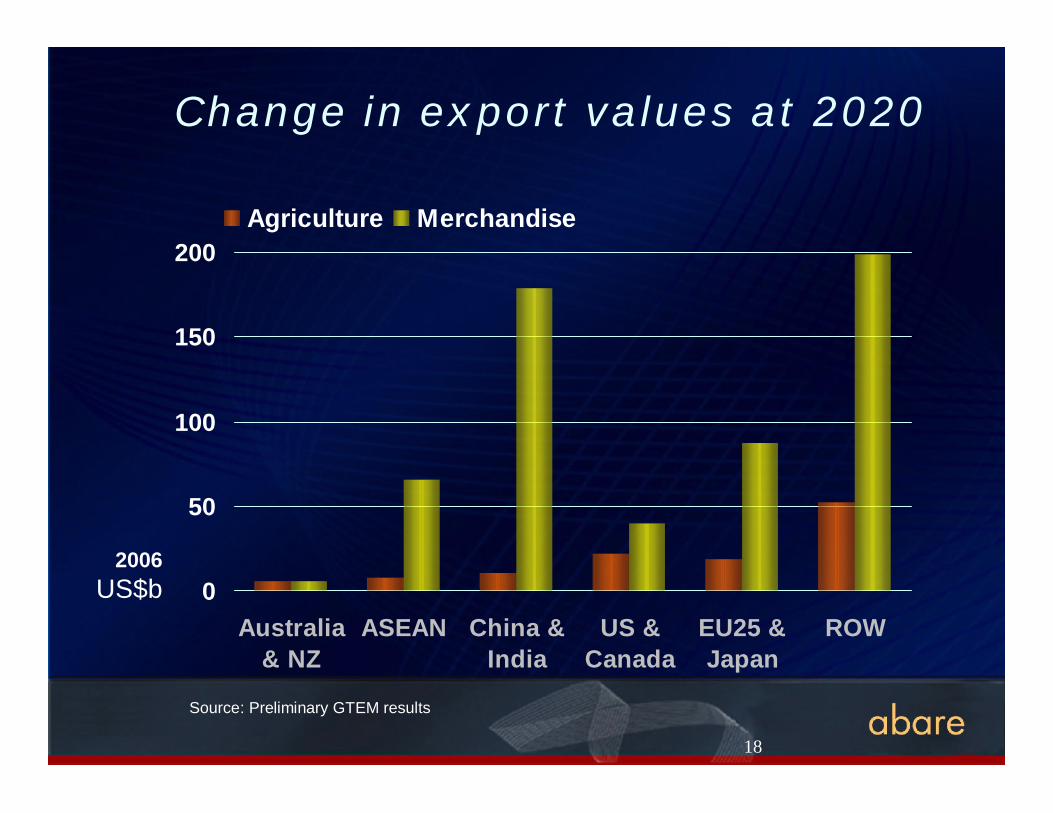
• Global merchandise trade liberalisation would boost ASEAN agricultural exports by anestimated US$7.5 billion (in 2006 dollars) in 2020, whereas the increase in Australia’sagricultural exports is estimated to be US$5.2 billion dollars in 2020, relative to the referencecase. It is evident that China and India would also have a large gain from trade liberalisationwithin the region, with their agricultural exports increasing by an estimated US$10 billiondollars in 2020. There would also be considerable global benefits, with world agriculturalexports estimated to expand by more than US$115 billion in 2020, relative to the referencecase.
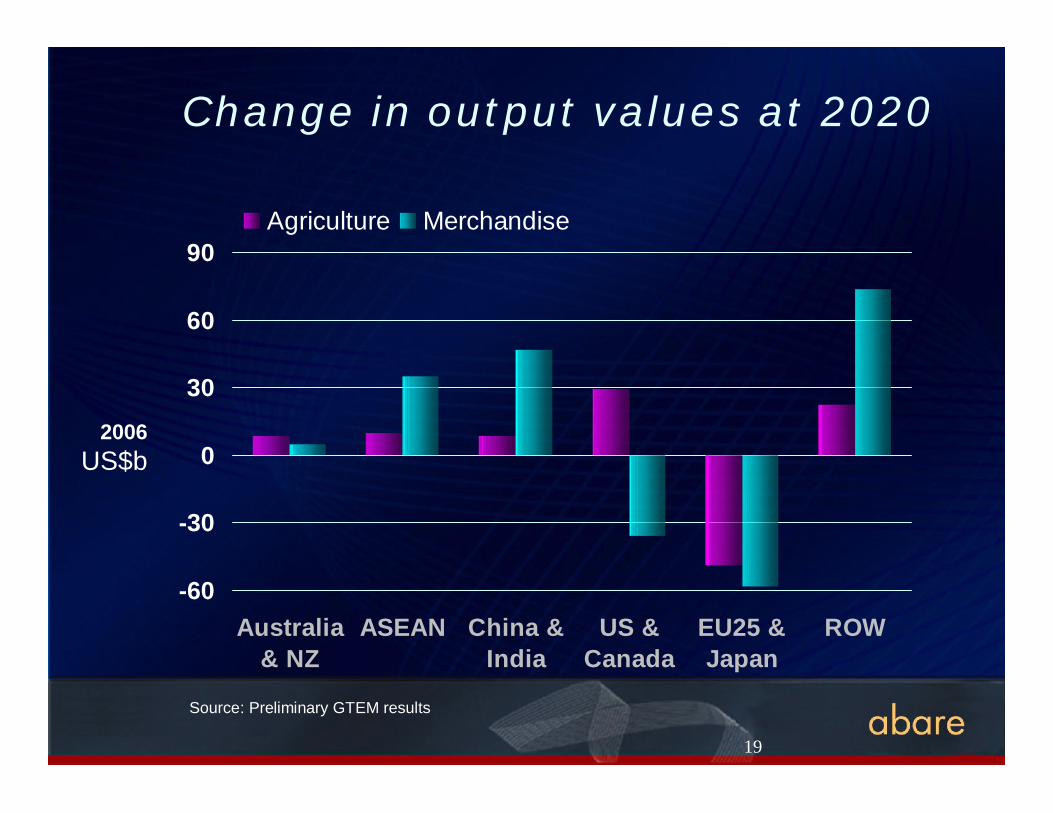
• Global agricultural outputs would rise as well. However, agricultural output in the EU25 andJapan are likely to decline, because of comparative disadvantage in their agriculturalproduction. At the same time, agricultural resources are likely to be reallocated toward moreefficient industries within the European Union and Japan.
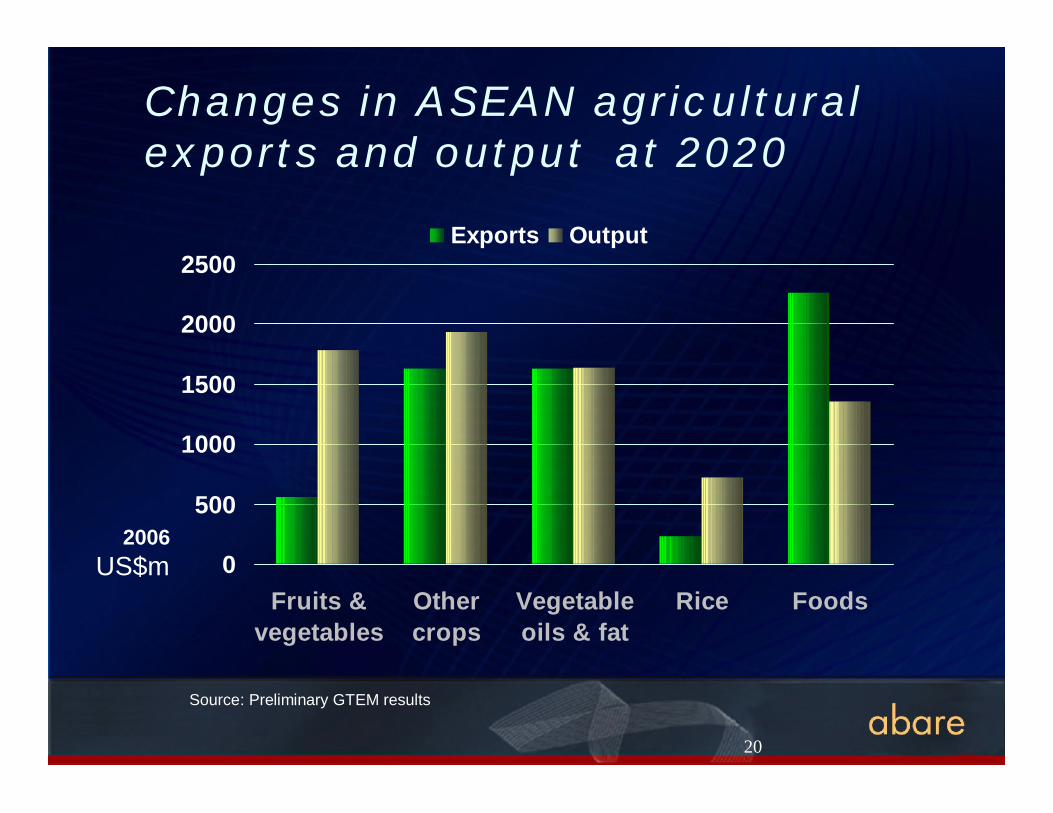
• ASEAN countries as a group would see a large agricultural export opportunities for foods,fruits and vegetables, other crops, and vegetable oils and fat industries. Global merchandisetrade liberalisation would benefit ASEAN’s non-agricultural industries significantly as well.Australian exports of dairy, beef, sugar and wheat are also likely to increase.
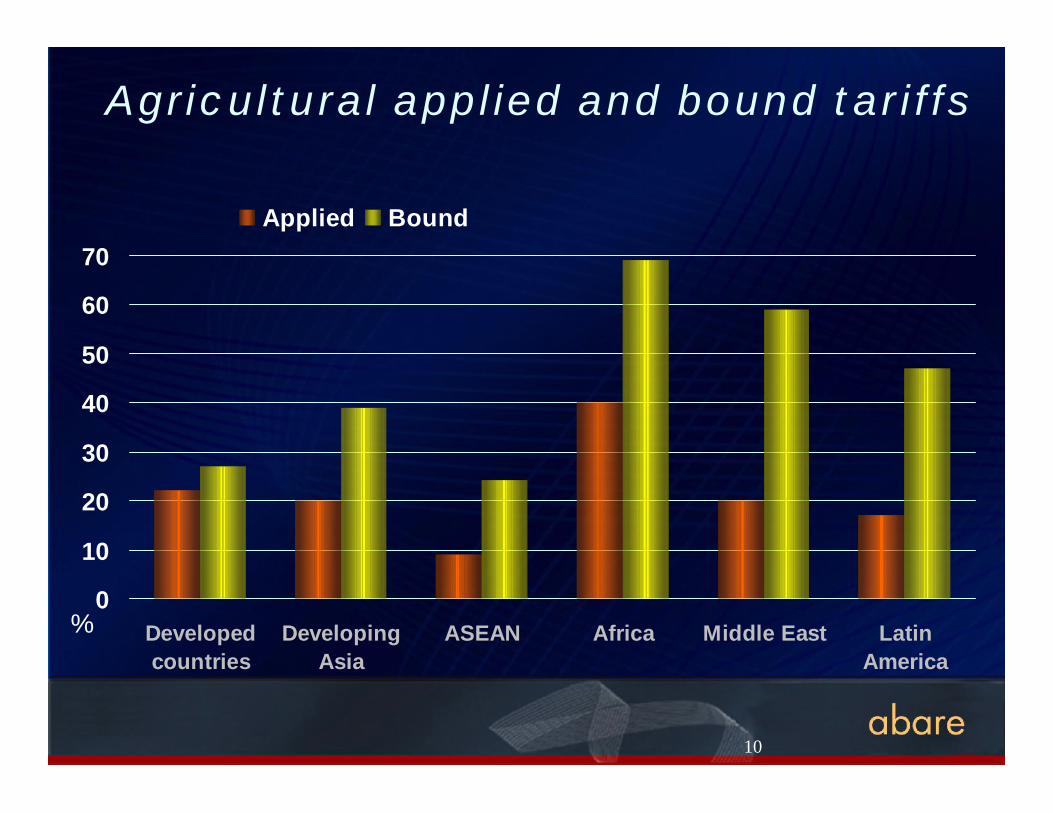
• The estimated gains from a 50 per cent reduction in bound tariffs would be less than half ofthe estimated gains under a full global trade liberalisation scenario, due mainly to the newlower ‘bound’ tariffs still exceeding the currently ‘applied’ tariffs in some countries andsome products.
1
APEC SymposiumAPEC Symposium12-14 December 2007, Kuala Lumpur Malaysia
Yeon Kim,Yeon Kim, PhDPhDSenior Research Economist
The Australian Bureau of Agricultural andResource Economics
Canberra
Economic impacts of trade liberalizationA Global Perspective
2
§ Staff 160§ Location Canberra§ Funding Federal Government,
R&D corporations & private sector§ ABARE research themesØ AgricultureØ Trade liberalisation & the WTO
8 Provide advice to Australian trade negotiatorsØ Minerals and energyØ Natural resources
ABARE profile
3
ABARE s recent research on trade-related issues
§ Recently completedØ Korean agricultureØ Indonesian agricultureØ Global trade liberalizationØ Agriculture in JapanØ Agriculture in China : developments and significance
for Australia
4
ABARE s recent research on trade-related issues
§ Currently in progressØ China agriculture and the WTOØ India projectØ Agriculture in MalaysiaØ China modeling capacity building projectØ Viet Nam project
5
ObjectiveObjective
§ World trade and current status of WTOnegotiations
§ Economic impacts of trade liberalization– an illustrative example
§ Conclusion
6
Current status of WTO negotiationsCurrent status of WTO negotiations
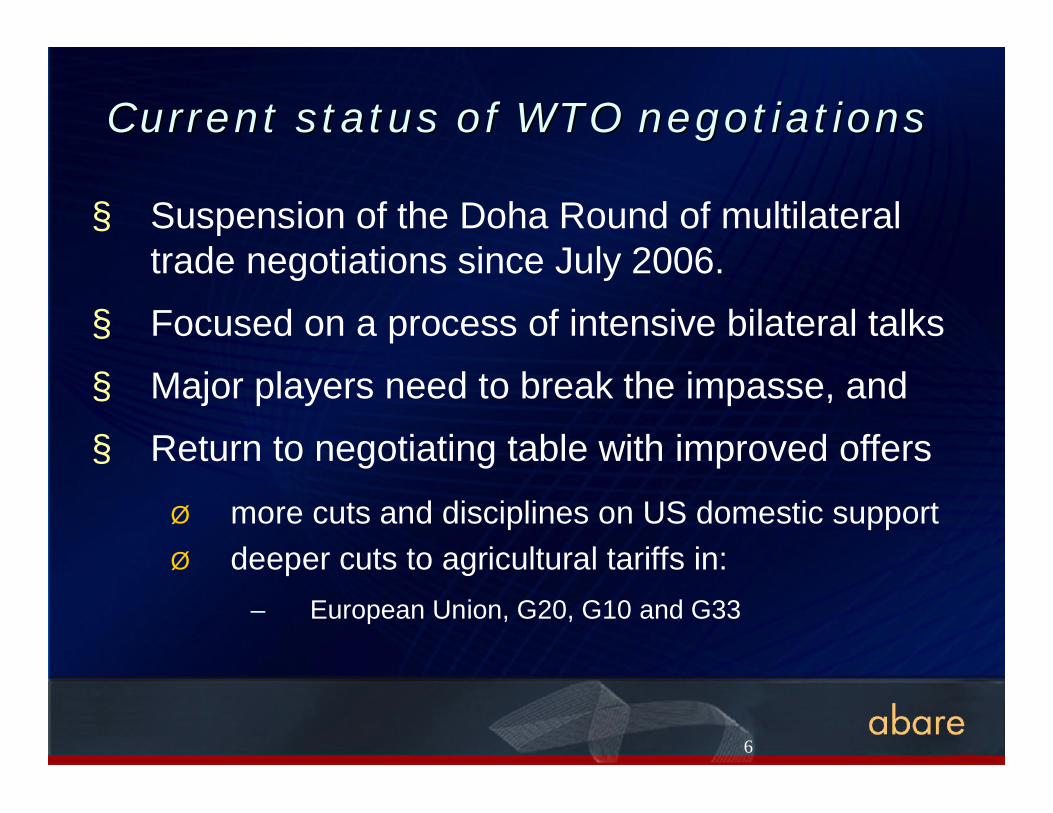
§ Suspension of the Doha Round of multilateraltrade negotiations since July 2006.
§ Focused on a process of intensive bilateral talks
§ Major players need to break the impasse, and
§ Return to negotiating table with improved offers
Ø more cuts and disciplines on US domestic supportØ deeper cuts to agricultural tariffs in:
Korea’s economic development has been based on development plans since 1962and an export-oriented strategy for economic growth. Korean agriculture has alsoprogressed in line with economic development. The objective of agriculturaldevelopment was to increase production as Korea had suffered from a chronicfood deficiency. However, the importance of the agricultural sector in the Koreaneconomy has been shrinking as industrialization progresses, and the role ofagriculture has been slowly decreasing. Since 1980s, food consumption patterns have substantially changedtowards consumption of more high-quality food. As income has grown, the foodconsumption patterns have shifted from grains to high-quality products such asprocessed products, meats, vegetables, fats and fruits. The importance of agri-business in the agricultural sector has been gradually increasing according tochanges in economic environment. Specially, food processing industry in agri-business has a role to enhance the income of farm households. Food processing industry enhances the derived demand for agricultural rawmaterials through processing and increases added value by extending themarketing period of agricultural raw materials through processing and storage.Large scale purchase of agricultural raw materials sent out during harvestingseason raises the price of agricultural raw materials during harvest season. Suchgeneration of derived demand and price support effect contribute for increase offarm income. Furthermore, the processing manufactures employ workers, whichadd to increase of non-farm income, making a potent influence on developmentof agricultural sector. However, since the current liberalization for import of agricultural andprocessed food raises the import dependency on agricultural and semi-processedfood, the spreading effect on domestic agriculture by development of foodindustry becomes smaller. In order to strengthen the linkage between food
industry and domestic agriculture, necessity of fostering the food processingprojects, highly using domestic agricultural materials becomes larger. In Korea,the Governmental policies planned to encourage the food processing industry aredirected to vitalize local economy and increase farm income. Considering thatthe agricultural raw materials are used and workers take the initiative in thisindustry, the food processing industry contributes for development of rural areasas it expands the production infrastructure and maintains agricultural communitythrough developing agri-business.
2. Agricultural trade liberalization
Agricultural trade liberalization and its ratioUntil recently, major agricultural products have been under import
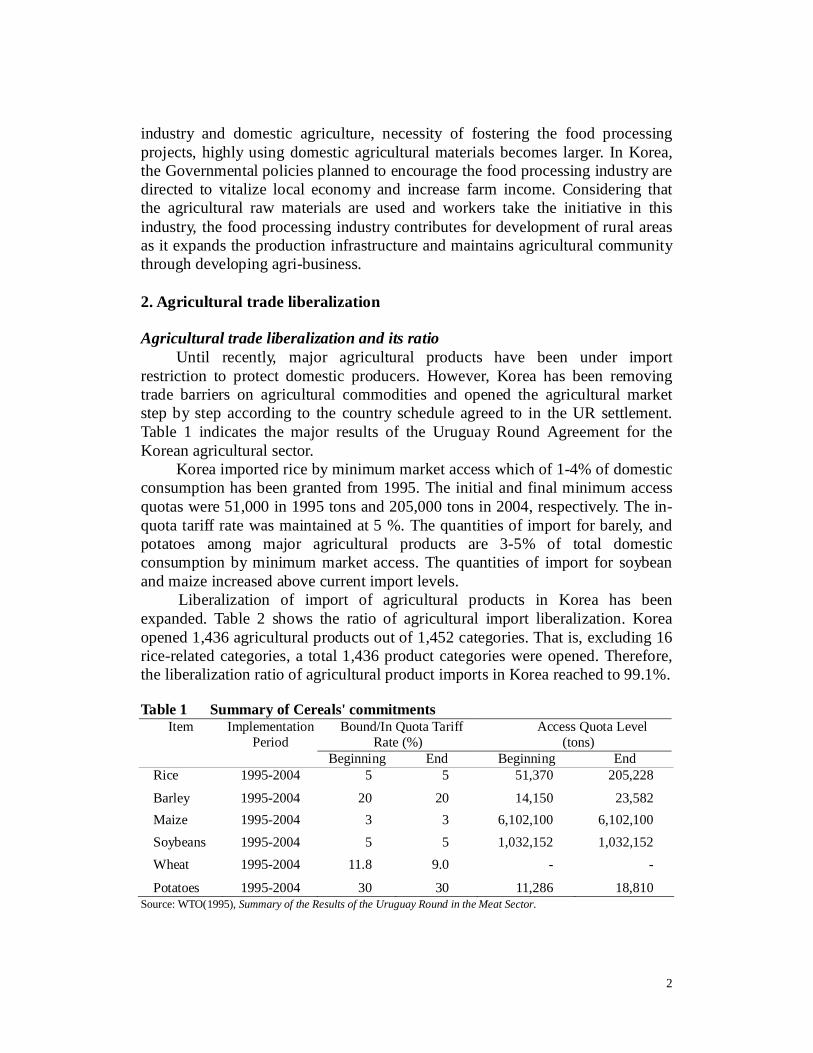
restriction to protect domestic producers. However, Korea has been removingtrade barriers on agricultural commodities and opened the agricultural marketstep by step according to the country schedule agreed to in the UR settlement.Table 1 indicates the major results of the Uruguay Round Agreement for theKorean agricultural sector.
Korea imported rice by minimum market access which of 1-4% of domesticconsumption has been granted from 1995. The initial and final minimum accessquotas were 51,000 in 1995 tons and 205,000 tons in 2004, respectively. The in-quota tariff rate was maintained at 5 %. The quantities of import for barely, andpotatoes among major agricultural products are 3-5% of total domesticconsumption by minimum market access. The quantities of import for soybeanand maize increased above current import levels.
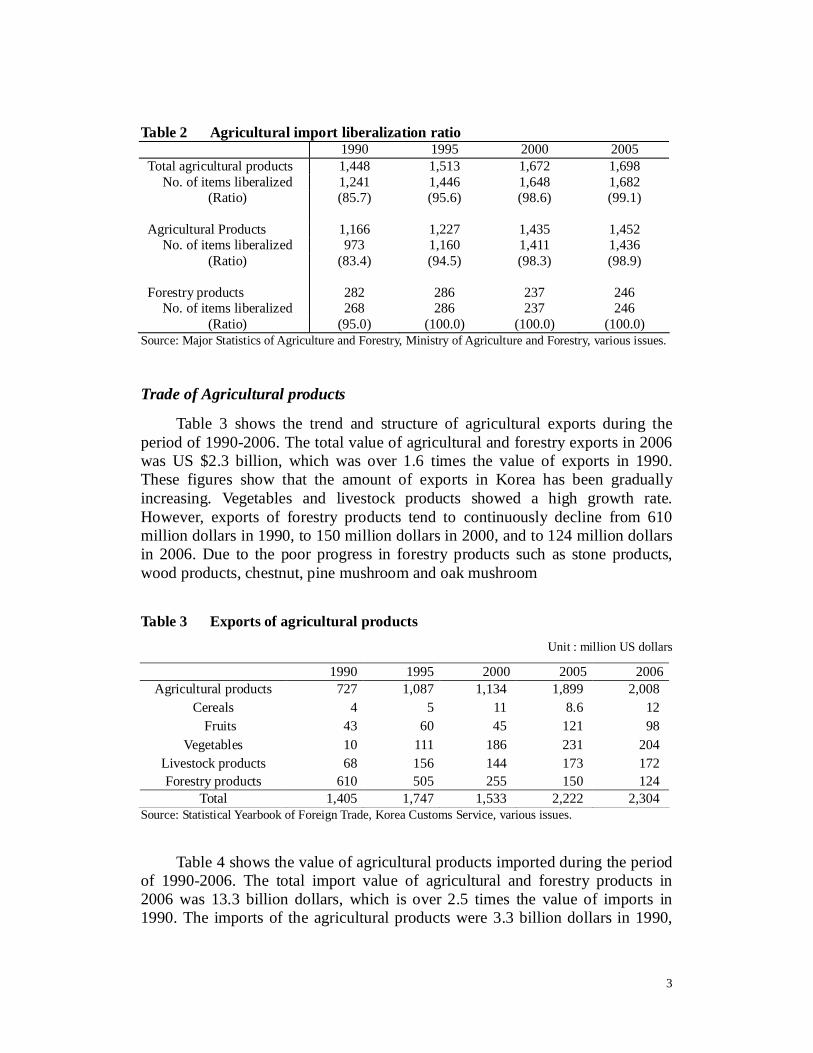
Liberalization of import of agricultural products in Korea has beenexpanded. Table 2 shows the ratio of agricultural import liberalization. Koreaopened 1,436 agricultural products out of 1,452 categories. That is, excluding 16rice-related categories, a total 1,436 product categories were opened. Therefore,the liberalization ratio of agricultural product imports in Korea reached to 99.1%.
Table 1 Summary of Cereals' commitmentsItem Implementation
(Ratio) (95.0) (100.0) (100.0) (100.0)Source: Major Statistics of Agriculture and Forestry, Ministry of Agriculture and Forestry, various issues.
Trade of Agricultural products
Table 3 shows the trend and structure of agricultural exports during theperiod of 1990-2006. The total value of agricultural and forestry exports in 2006was US $2.3 billion, which was over 1.6 times the value of exports in 1990.These figures show that the amount of exports in Korea has been graduallyincreasing. Vegetables and livestock products showed a high growth rate.However, exports of forestry products tend to continuously decline from 610million dollars in 1990, to 150 million dollars in 2000, and to 124 million dollarsin 2006. Due to the poor progress in forestry products such as stone products,wood products, chestnut, pine mushroom and oak mushroom
Table 3 Exports of agricultural productsUnit : million US dollars
Total 1,405 1,747 1,533 2,222 2,304Source: Statistical Yearbook of Foreign Trade, Korea Customs Service, various issues.
Table 4 shows the value of agricultural products imported during the periodof 1990-2006. The total import value of agricultural and forestry products in2006 was 13.3 billion dollars, which is over 2.5 times the value of imports in1990. The imports of the agricultural products were 3.3 billion dollars in 1990,
4
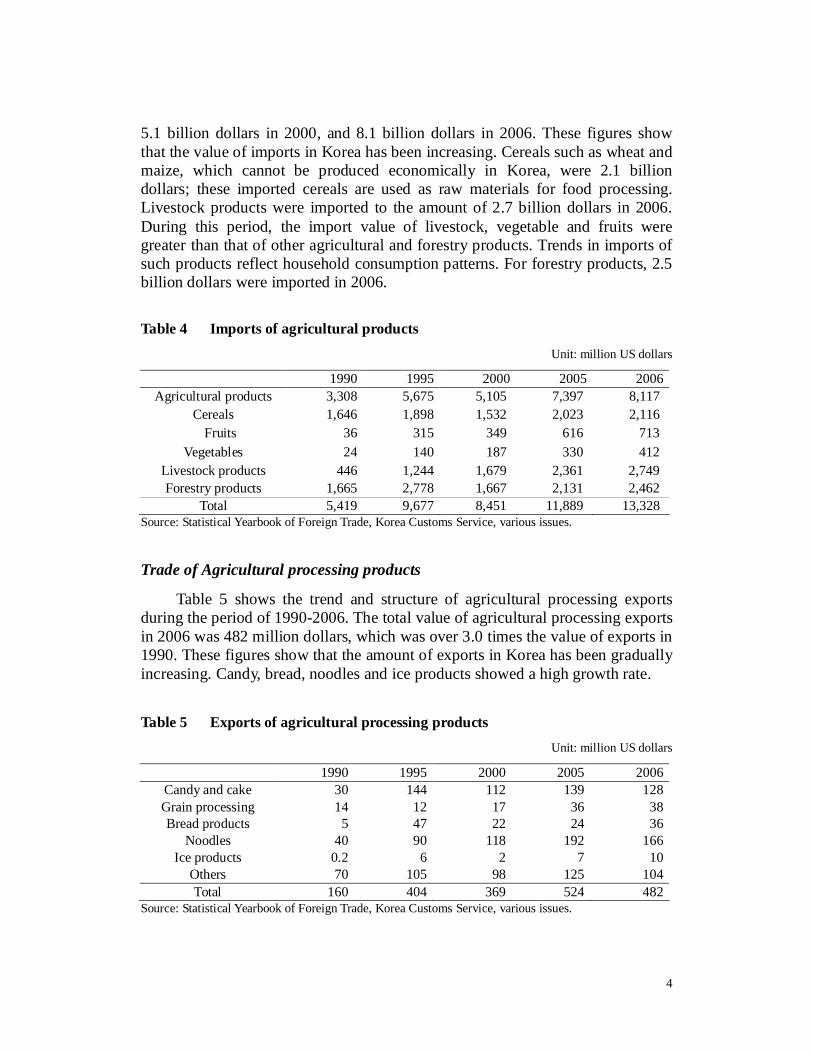
5.1 billion dollars in 2000, and 8.1 billion dollars in 2006. These figures showthat the value of imports in Korea has been increasing. Cereals such as wheat andmaize, which cannot be produced economically in Korea, were 2.1 billiondollars; these imported cereals are used as raw materials for food processing.Livestock products were imported to the amount of 2.7 billion dollars in 2006.During this period, the import value of livestock, vegetable and fruits weregreater than that of other agricultural and forestry products. Trends in imports ofsuch products reflect household consumption patterns. For forestry products, 2.5billion dollars were imported in 2006.
Table 4 Imports of agricultural productsUnit: million US dollars
Total 5,419 9,677 8,451 11,889 13,328Source: Statistical Yearbook of Foreign Trade, Korea Customs Service, various issues.
Trade of Agricultural processing products
Table 5 shows the trend and structure of agricultural processing exportsduring the period of 1990-2006. The total value of agricultural processing exportsin 2006 was 482 million dollars, which was over 3.0 times the value of exports in1990. These figures show that the amount of exports in Korea has been graduallyincreasing. Candy, bread, noodles and ice products showed a high growth rate.
Table 5 Exports of agricultural processing productsUnit: million US dollars
Source: Statistical Yearbook of Foreign Trade, Korea Customs Service, various issues.
5
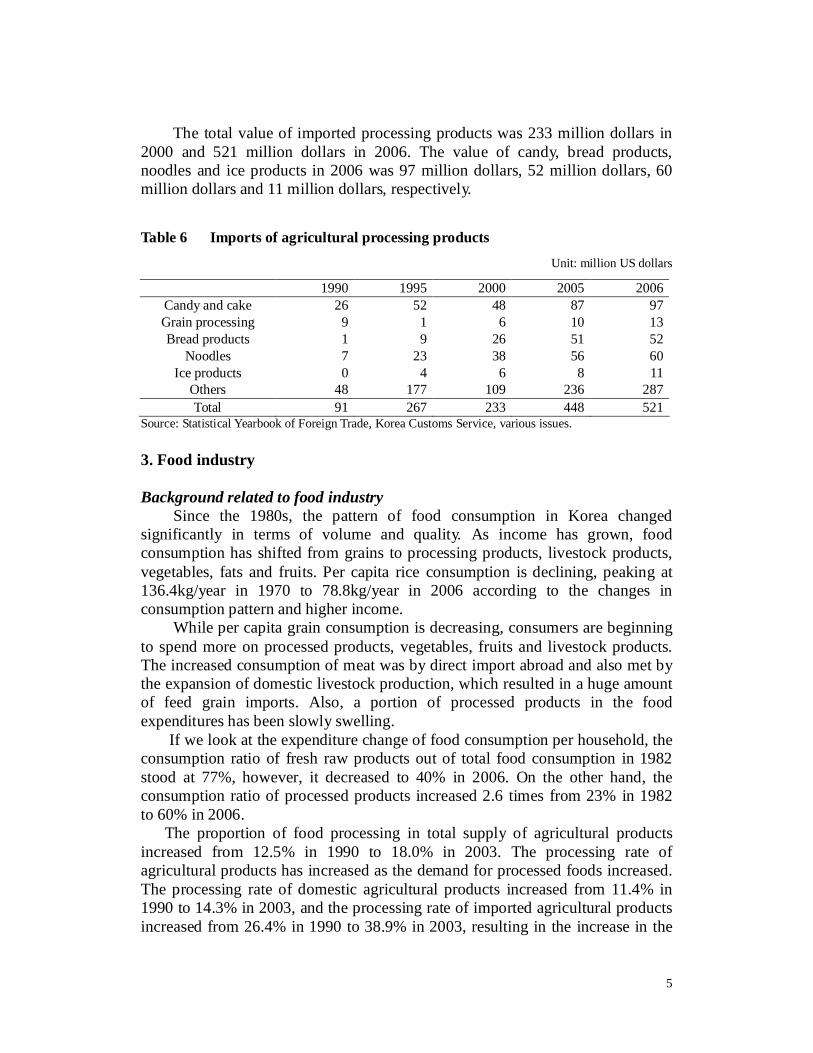
The total value of imported processing products was 233 million dollars in2000 and 521 million dollars in 2006. The value of candy, bread products,noodles and ice products in 2006 was 97 million dollars, 52 million dollars, 60million dollars and 11 million dollars, respectively.
Table 6 Imports of agricultural processing products
Source: Statistical Yearbook of Foreign Trade, Korea Customs Service, various issues.
3. Food industry
Background related to food industry Since the 1980s, the pattern of food consumption in Korea changedsignificantly in terms of volume and quality. As income has grown, foodconsumption has shifted from grains to processing products, livestock products,vegetables, fats and fruits. Per capita rice consumption is declining, peaking at136.4kg/year in 1970 to 78.8kg/year in 2006 according to the changes inconsumption pattern and higher income. While per capita grain consumption is decreasing, consumers are beginningto spend more on processed products, vegetables, fruits and livestock products.The increased consumption of meat was by direct import abroad and also met bythe expansion of domestic livestock production, which resulted in a huge amountof feed grain imports. Also, a portion of processed products in the foodexpenditures has been slowly swelling.
If we look at the expenditure change of food consumption per household, theconsumption ratio of fresh raw products out of total food consumption in 1982stood at 77%, however, it decreased to 40% in 2006. On the other hand, theconsumption ratio of processed products increased 2.6 times from 23% in 1982to 60% in 2006.
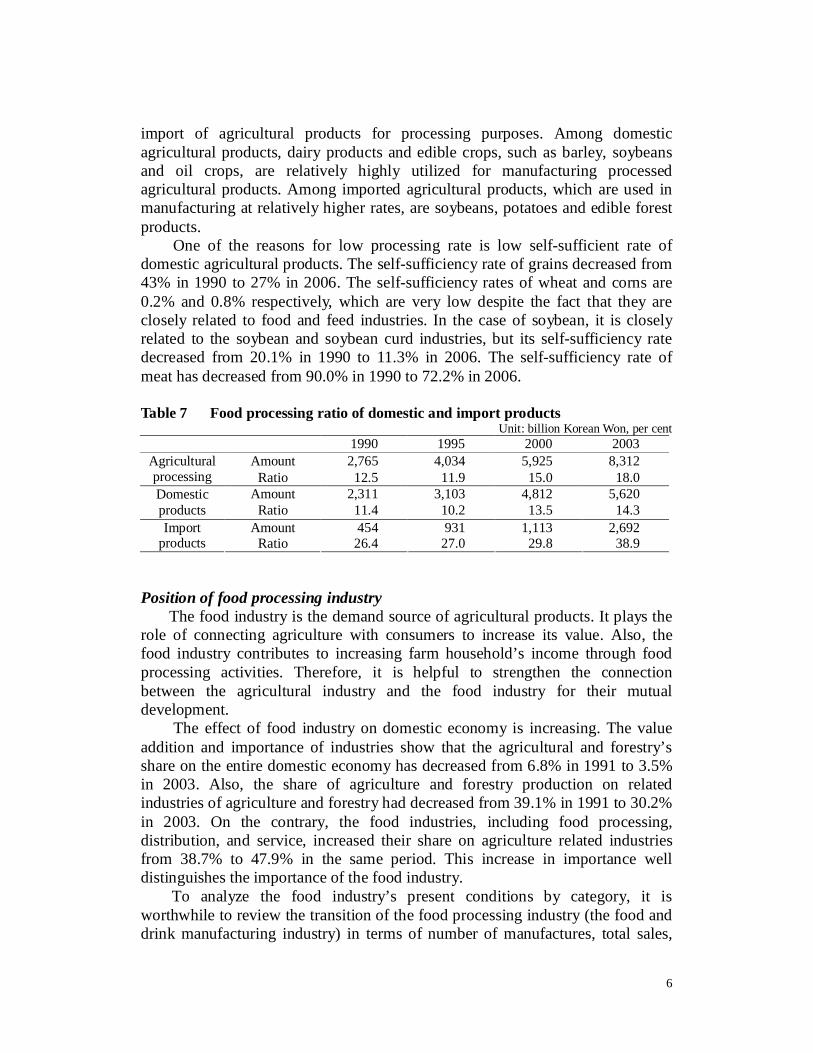
The proportion of food processing in total supply of agricultural productsincreased from 12.5% in 1990 to 18.0% in 2003. The processing rate ofagricultural products has increased as the demand for processed foods increased.The processing rate of domestic agricultural products increased from 11.4% in1990 to 14.3% in 2003, and the processing rate of imported agricultural productsincreased from 26.4% in 1990 to 38.9% in 2003, resulting in the increase in the
6
import of agricultural products for processing purposes. Among domesticagricultural products, dairy products and edible crops, such as barley, soybeansand oil crops, are relatively highly utilized for manufacturing processedagricultural products. Among imported agricultural products, which are used inmanufacturing at relatively higher rates, are soybeans, potatoes and edible forestproducts.
One of the reasons for low processing rate is low self-sufficient rate ofdomestic agricultural products. The self-sufficiency rate of grains decreased from43% in 1990 to 27% in 2006. The self-sufficiency rates of wheat and corns are0.2% and 0.8% respectively, which are very low despite the fact that they areclosely related to food and feed industries. In the case of soybean, it is closelyrelated to the soybean and soybean curd industries, but its self-sufficiency ratedecreased from 20.1% in 1990 to 11.3% in 2006. The self-sufficiency rate ofmeat has decreased from 90.0% in 1990 to 72.2% in 2006.
Table 7 Food processing ratio of domestic and import productsUnit: billion Korean Won, per cent
processing Ratio 12.5 11.9 15.0 18.0Amount 2,311 3,103 4,812 5,620Domestic
products Ratio 11.4 10.2 13.5 14.3Amount 454 931 1,113 2,692Import
products Ratio 26.4 27.0 29.8 38.9
Position of food processing industryThe food industry is the demand source of agricultural products. It plays the
role of connecting agriculture with consumers to increase its value. Also, thefood industry contributes to increasing farm household’s income through foodprocessing activities. Therefore, it is helpful to strengthen the connectionbetween the agricultural industry and the food industry for their mutualdevelopment.
The effect of food industry on domestic economy is increasing. The valueaddition and importance of industries show that the agricultural and forestry’sshare on the entire domestic economy has decreased from 6.8% in 1991 to 3.5%in 2003. Also, the share of agriculture and forestry production on relatedindustries of agriculture and forestry had decreased from 39.1% in 1991 to 30.2%in 2003. On the contrary, the food industries, including food processing,distribution, and service, increased their share on agriculture related industriesfrom 38.7% to 47.9% in the same period. This increase in importance welldistinguishes the importance of the food industry.
To analyze the food industry’s present conditions by category, it isworthwhile to review the transition of the food processing industry (the food anddrink manufacturing industry) in terms of number of manufactures, total sales,
7
and production amount. For instance, the number of food processing businesseshas increased from 4,595 in 1980 to 8,389 in 2005. Similarly, total sales amounthas increased from 3.9 trillion Korean won to 48.3 trillion Korean won during thesame period. The industrial size of food processing has increased dramaticallythrough this. Such enlargement in scale can be noticed from the food processingindustry of 2005. Manufactures with more than 500 employees accounted foronly 0.2% share of the industry, but their total sales amount accounted for asmuch as 8.9%. The reason behind the food processing industry’s enlargement inscale is that it is easier to finance the development of new products andmarketing costs and it has the advantage of increasing the efficiency inmanufacturing process.
Structure of tariff rate in food processing productsThe import methods of the minimum market access and current market access
are state-operated trade, import concession auction, and actual user assignment.Private imports which do not rely upon such methods can be freely imported bypaying a high tariff (an ad valorem tax or specific commercial tariff). State-operated trade and import concession auction are methods for a designatedorganization to import agricultural products for domestic consumption. Actualuser assignment is a method for private manufactures to import agriculturalproducts for domestic consumption, such as feeding, breeding, provision ofmedical supplies, and other purposes at a low tax rate.
Industry protection and consumer protection are reflected in the currenttariff rate system. Soybeans, corns, and other market access products which areimported in large amounts have a 5% lower tariff rate, but other productsimported besides the market access products have a higher tariff rate. Amongagricultural products, items with a lower tariff rate are mostly items that are notproduced in Korea, such as seeds, agricultural raw materials for industrialpurposes, and items the supply of which is absolutely insufficient. In the case ofcrops, most of the crops and grain processed products except wheat have acharacteristic showing de-escalation. In order to protect the livestock industry, inparticular, feed crops and meals are imposed with a low tariff rate.
Due to the tariff reduction policy in the mid 1980s, most processed foodswere not only treated as general industrial products but the tariff on suchproducts were also lower than those of agricultural raw materials since they wereused as raw materials for other industrial products. The items where a highertariff was imposed were dairy processed products, meat processed products, andfruit juice with a high domestic production share. The tariff rates of processedproducts utilizing dairy products, fruit, vegetables, nuts, and other rawagricultural products is lower than their raw agricultural products; therefore, it isshowing a de-escalation system.
8
4. Soybean processing industry
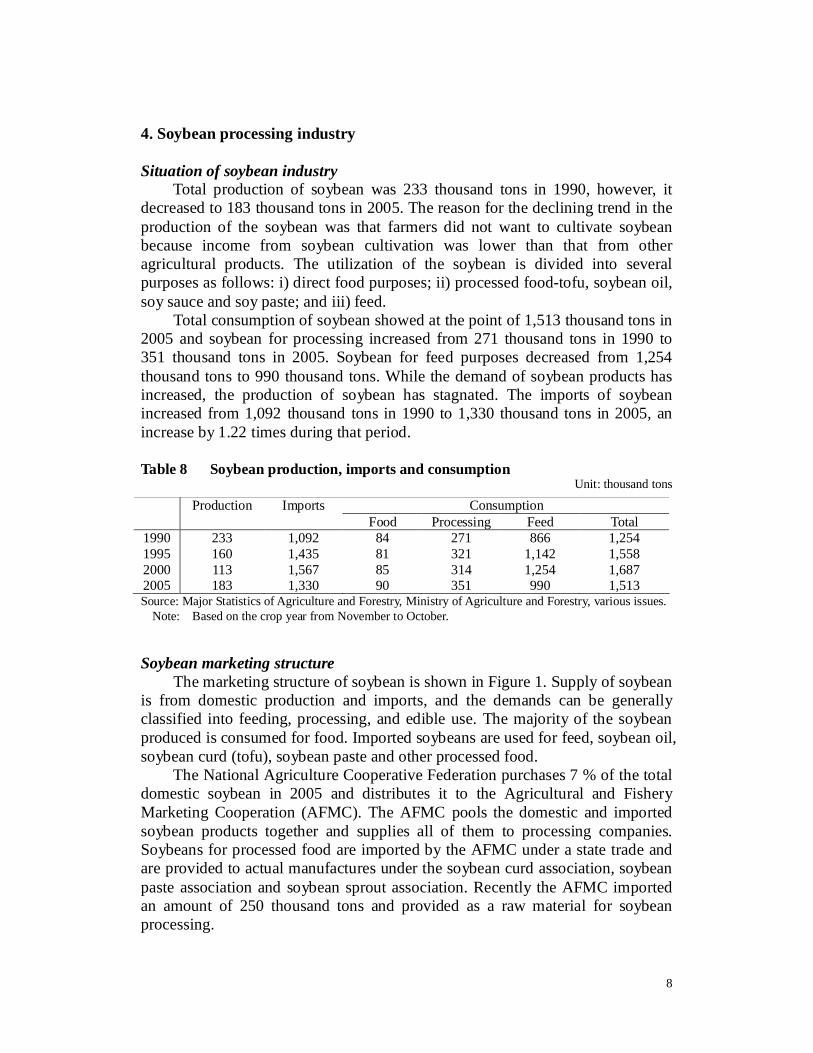
Situation of soybean industryTotal production of soybean was 233 thousand tons in 1990, however, it
decreased to 183 thousand tons in 2005. The reason for the declining trend in theproduction of the soybean was that farmers did not want to cultivate soybeanbecause income from soybean cultivation was lower than that from otheragricultural products. The utilization of the soybean is divided into severalpurposes as follows: i) direct food purposes; ii) processed food-tofu, soybean oil,soy sauce and soy paste; and iii) feed.
Total consumption of soybean showed at the point of 1,513 thousand tons in2005 and soybean for processing increased from 271 thousand tons in 1990 to351 thousand tons in 2005. Soybean for feed purposes decreased from 1,254thousand tons to 990 thousand tons. While the demand of soybean products hasincreased, the production of soybean has stagnated. The imports of soybeanincreased from 1,092 thousand tons in 1990 to 1,330 thousand tons in 2005, anincrease by 1.22 times during that period.
Table 8 Soybean production, imports and consumptionUnit: thousand tons
Source: Major Statistics of Agriculture and Forestry, Ministry of Agriculture and Forestry, various issues.Note: Based on the crop year from November to October.
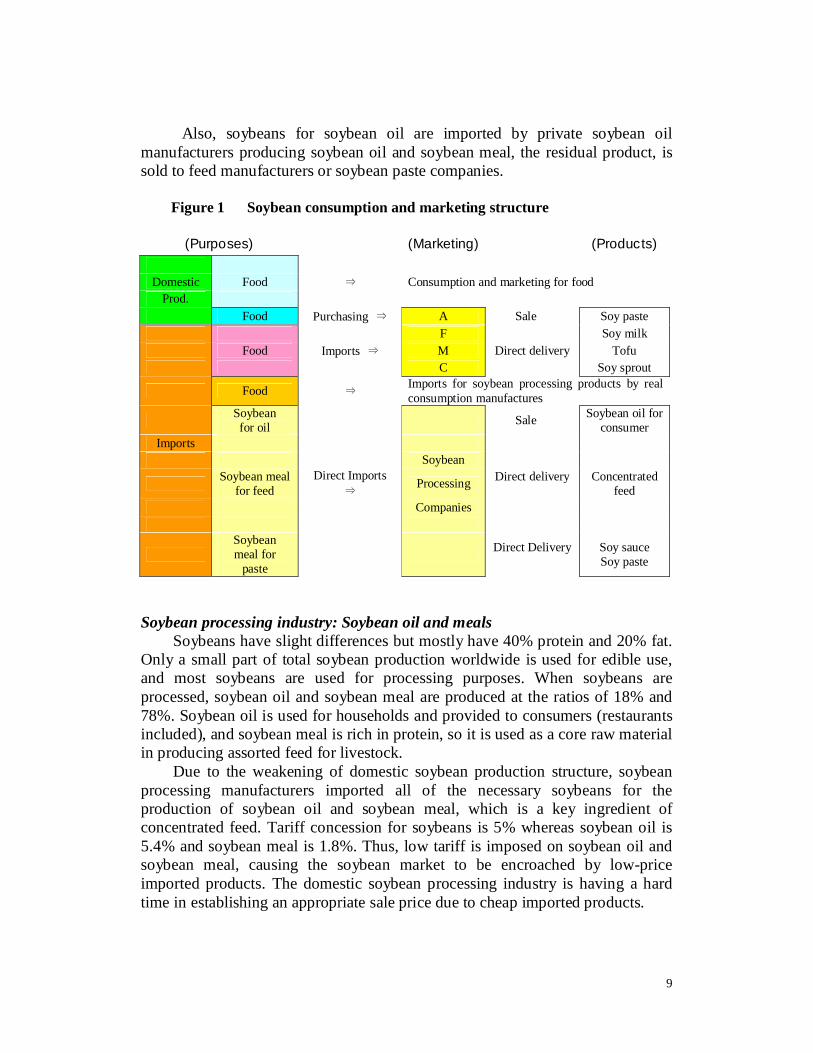
Soybean marketing structureThe marketing structure of soybean is shown in Figure 1. Supply of soybean
is from domestic production and imports, and the demands can be generallyclassified into feeding, processing, and edible use. The majority of the soybeanproduced is consumed for food. Imported soybeans are used for feed, soybean oil,soybean curd (tofu), soybean paste and other processed food.
The National Agriculture Cooperative Federation purchases 7 % of the totaldomestic soybean in 2005 and distributes it to the Agricultural and FisheryMarketing Cooperation (AFMC). The AFMC pools the domestic and importedsoybean products together and supplies all of them to processing companies.Soybeans for processed food are imported by the AFMC under a state trade andare provided to actual manufactures under the soybean curd association, soybeanpaste association and soybean sprout association. Recently the AFMC importedan amount of 250 thousand tons and provided as a raw material for soybeanprocessing.
Consumption Production ImportsFood Processing Feed Total
Also, soybeans for soybean oil are imported by private soybean oilmanufacturers producing soybean oil and soybean meal, the residual product, issold to feed manufacturers or soybean paste companies.
Figure 1 Soybean consumption and marketing structure
(Purposes) (Marketing) (Products)
Domestic Food Consumption and marketing for foodProd.
Food Purchasing A Sale Soy pasteF Soy milk
Food Imports M Direct delivery TofuC Soy sprout
Food Imports for soybean processing products by realconsumption manufactures
Soybeanfor oil Sale Soybean oil for
consumerImports
SoybeanSoybean meal
for feedDirect Imports Processing Direct delivery Concentrated
feedCompanies
Soybeanmeal for
paste
Direct Delivery Soy sauceSoy paste
Soybean processing industry: Soybean oil and mealsSoybeans have slight differences but mostly have 40% protein and 20% fat.
Only a small part of total soybean production worldwide is used for edible use,and most soybeans are used for processing purposes. When soybeans areprocessed, soybean oil and soybean meal are produced at the ratios of 18% and78%. Soybean oil is used for households and provided to consumers (restaurantsincluded), and soybean meal is rich in protein, so it is used as a core raw materialin producing assorted feed for livestock.
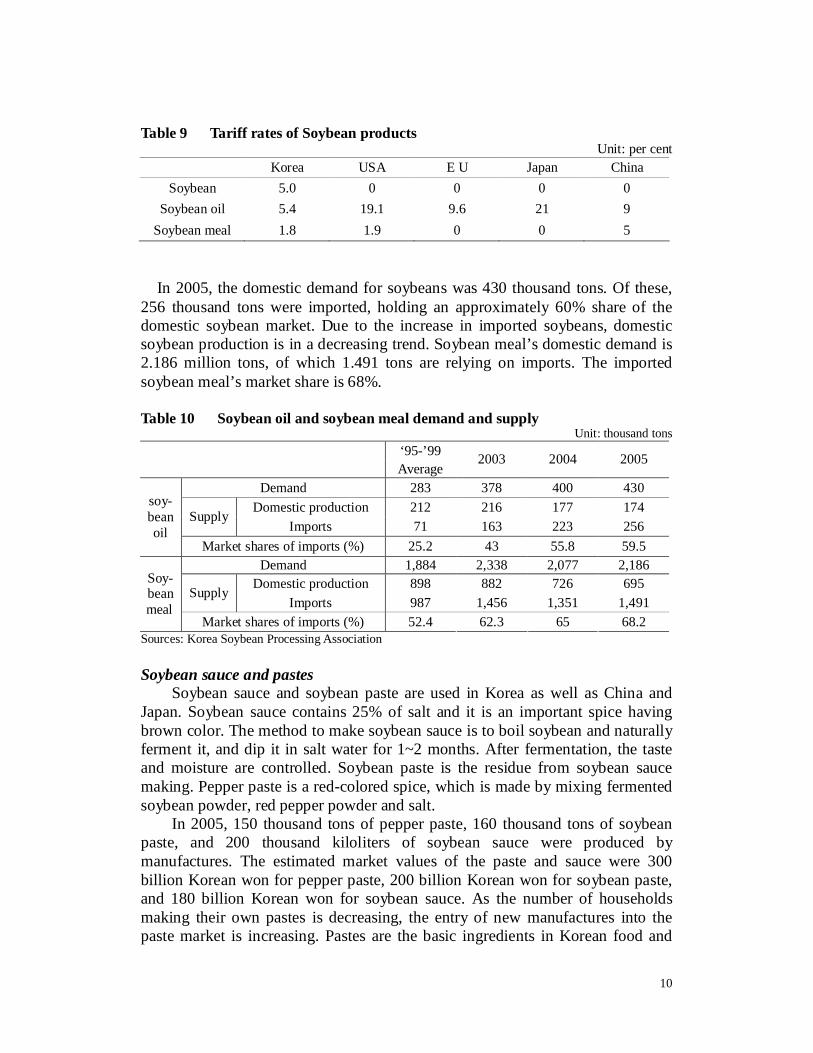
Due to the weakening of domestic soybean production structure, soybeanprocessing manufacturers imported all of the necessary soybeans for theproduction of soybean oil and soybean meal, which is a key ingredient ofconcentrated feed. Tariff concession for soybeans is 5% whereas soybean oil is5.4% and soybean meal is 1.8%. Thus, low tariff is imposed on soybean oil andsoybean meal, causing the soybean market to be encroached by low-priceimported products. The domestic soybean processing industry is having a hardtime in establishing an appropriate sale price due to cheap imported products.
10
Table 9 Tariff rates of Soybean productsUnit: per cent
In 2005, the domestic demand for soybeans was 430 thousand tons. Of these,256 thousand tons were imported, holding an approximately 60% share of thedomestic soybean market. Due to the increase in imported soybeans, domesticsoybean production is in a decreasing trend. Soybean meal’s domestic demand is2.186 million tons, of which 1.491 tons are relying on imports. The importedsoybean meal’s market share is 68%.
Table 10 Soybean oil and soybean meal demand and supplyUnit: thousand tons
‘95-’99Average
2003 2004 2005
Demand 283 378 400 430Domestic production 212 216 177 174
Market shares of imports (%) 52.4 62.3 65 68.2Sources: Korea Soybean Processing Association
Soybean sauce and pastesSoybean sauce and soybean paste are used in Korea as well as China and
Japan. Soybean sauce contains 25% of salt and it is an important spice havingbrown color. The method to make soybean sauce is to boil soybean and naturallyferment it, and dip it in salt water for 1~2 months. After fermentation, the tasteand moisture are controlled. Soybean paste is the residue from soybean saucemaking. Pepper paste is a red-colored spice, which is made by mixing fermentedsoybean powder, red pepper powder and salt.
In 2005, 150 thousand tons of pepper paste, 160 thousand tons of soybeanpaste, and 200 thousand kiloliters of soybean sauce were produced bymanufactures. The estimated market values of the paste and sauce were 300billion Korean won for pepper paste, 200 billion Korean won for soybean paste,and 180 billion Korean won for soybean sauce. As the number of householdsmaking their own pastes is decreasing, the entry of new manufactures into thepaste market is increasing. Pastes are the basic ingredients in Korean food and
11
therefore severe competition among businesses to occupy the market is expected.However, the paste market is expected to expand gradually.
Soybean curdsSoybean curd is made by grinding boiled soybeans and squeezing the juice
from the grinded soybean, and the process is followed by the boiling of the juiceand adding brine to the curds. As of the end of 2006, there were 1,600 soybeancurd manufacturers. However in 1995, there were only 500 soybean curdmanufacturers, but as the regulations and policies concerning businessregistration and food sanitation were eased, street vendors and other smallbusinesses were established in great numbers.
The soybean curd manufacturers using 2.5 tons or more raw soybeans perday, considered as a fairly large business, took up 2.2% of the total business.Such large businesses consisted of 35 manufacturers, and the large manufacturersused more than 20% of the total raw soybeans for soybean curds. Themanufacturers using soybeans of 0.25 tons or less per day took up more than80% of the business. In 2006, a total of 142 thousand tons of raw soybeans (123thousand tons of soybeans and 19 thousand tons of powder) were used forsoybean curd production.
General small manufacturers produce unpackaged soybean curds, but mostlarge manufacturers produce packaged soybean curds. The soybean curd marketis estimated to have stood at 440 billion Korean won in 2006; and 57% of it, or250 billion Korean won, is for the packaged soybean curds, signaling a growth ofthe packaged soybean curd market. Due to the decrease in soybean cultivation bydomestic farms, the supply of soybeans has shrunk and the price has increased.Most of the soybeans supplied to soybean curd manufacturers are replaced byimported soybeans. Currently, soybeans for soybean curds are strictly importedand provided with non generically modified organic soybeans.
Effects of import price changes on soybean product pricesThe import price effects on domestic prices can be divided into changes in
import prices imported and changes in exchange rates. Exchange rates amongcurrencies are simply the prices of a country’s money in terms of other currencies.Domestic prices of products are translated by exchange rates. Like other prices,exchange rates are subject to change. When a country’s currency rises in valuerelative to those of other countries, exports tend to decrease and imports tend toincrease. When a country’s currency falls in relative value, exports tend to beincreased and import decreased. When a currency’s value is rising internationally,domestic prices of imported products tend to decrease and foreign prices of thesame products tend to increase. When a currency’s value is falling, domesticprices of imported products tend to increase, while international prices tend todecrease. To analyze import and exchange rate effects, the following equation isapplied:
12
(7.5) EPP md lnlnln 210 βββ ++=
where Pd is the domestic price in importing country, Pm is the import price of thecommodity imported from a country, and E is the exchange rate expressed inunits of domestic currency per unit of the exporting country’s currency. The 1
and 2 mean price transmission and exchange rate pass-through elasticity. β1
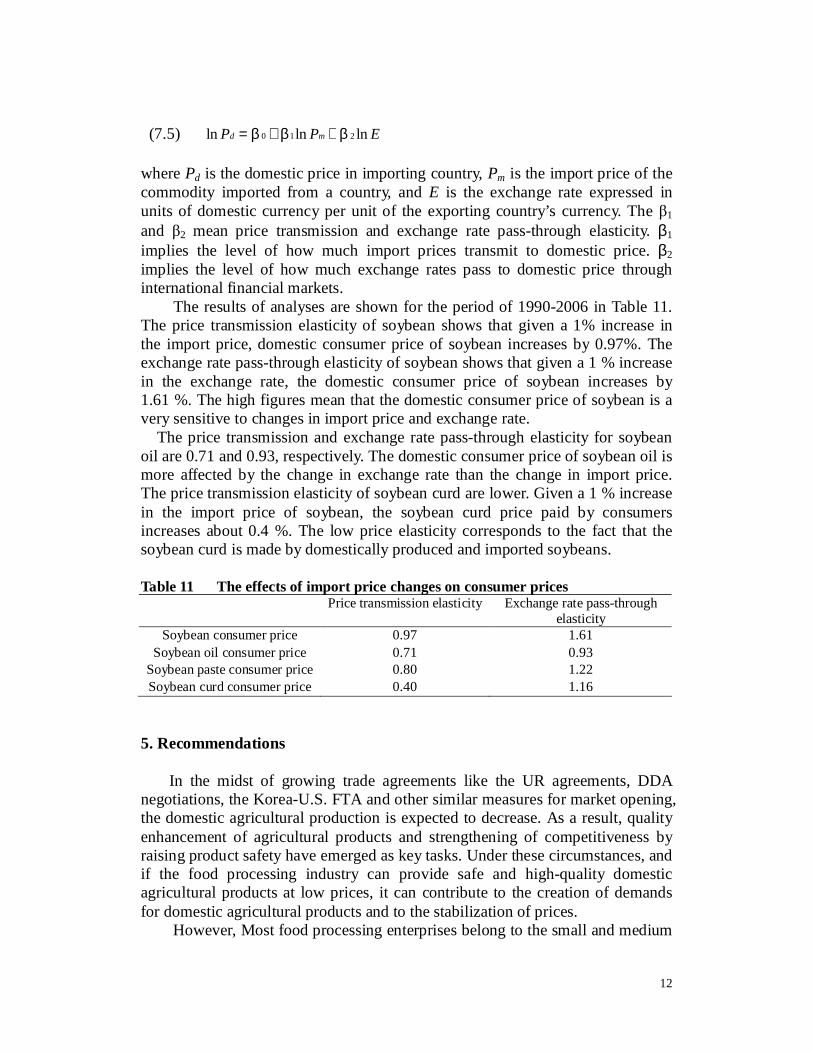
implies the level of how much import prices transmit to domestic price. β2implies the level of how much exchange rates pass to domestic price throughinternational financial markets. The results of analyses are shown for the period of 1990-2006 in Table 11.
The price transmission elasticity of soybean shows that given a 1% increase inthe import price, domestic consumer price of soybean increases by 0.97%. Theexchange rate pass-through elasticity of soybean shows that given a 1 % increasein the exchange rate, the domestic consumer price of soybean increases by1.61 %. The high figures mean that the domestic consumer price of soybean is avery sensitive to changes in import price and exchange rate.
The price transmission and exchange rate pass-through elasticity for soybeanoil are 0.71 and 0.93, respectively. The domestic consumer price of soybean oil ismore affected by the change in exchange rate than the change in import price.The price transmission elasticity of soybean curd are lower. Given a 1 % increasein the import price of soybean, the soybean curd price paid by consumersincreases about 0.4 %. The low price elasticity corresponds to the fact that thesoybean curd is made by domestically produced and imported soybeans.
Table 11 The effects of import price changes on consumer pricesPrice transmission elasticity Exchange rate pass-through
In the midst of growing trade agreements like the UR agreements, DDAnegotiations, the Korea-U.S. FTA and other similar measures for market opening,the domestic agricultural production is expected to decrease. As a result, qualityenhancement of agricultural products and strengthening of competitiveness byraising product safety have emerged as key tasks. Under these circumstances, andif the food processing industry can provide safe and high-quality domesticagricultural products at low prices, it can contribute to the creation of demandsfor domestic agricultural products and to the stabilization of prices.
However, Most food processing enterprises belong to the small and medium
13
enterprises and usually lack in technology and capital required for continuousdevelopment of new products. In order to encourage the food processing industry,specially, soybean processing industry, the following points are to be considered:
The import system should be changed from a collective import methodimposed by the government to one that facilitates actual user groups to directlyimport soybeans of different qualities consumers demand.
Due to changes in the consumer and circulation environments,diversification and desire for high-quality products are increasing in the edible oilmarket. Now there are needs to turn from low variety mass production to diverseproduction and expand the line of products to stimulate consumer’s desire topurchase. After the market opening, there were many instances where theincrease in the number of businesses and the subsequent deepening ofcompetition among distribution firms resulted in both soybean oil producers andsellers not making enough profits. It is necessary for the businesses to turn theirattention from price competition to quality-based competition.
Soybean sauce and paste products are traditionally handed down fromgeneration to generation, and as Korea’s basic spices, these will continue to beused as beloved spices. However, unlike the food industry in general, flooding ofsmall businesses, low quality, excessive competition, and dilapidation ofmachines are some of the problems that need to be solved. For the overall pasteindustry’s development, diverse product development, facilities investment,experts training, and research and development should be promoted positively. The food processing enterprises have close relation with regional agricultureand they generate considerable added value through employing the regionalagricultural products for raw materials. However, they are still many stiffproblems for the success of promotion policy for the food processing industry.Management improvement and sales promotion should be achieved both ways.
References
Korea Customs Service. Statistical Yearbook of Foreign Trade (in Korean).Ministry of Agriculture and Forestry. Major Statistics of Agriculture and Forestry (in
Korean).Sung, Myung-Hwan. 2000. “Promotion of Food Processing Industry in Rural Areas to
Enhance the Income of Farm Households in the Republic of Korea.” Journal ofRural Development. 33(2): 43-55.
Sung, Myung-Hwan. 1999. Effects of Trade Liberalization on Agriculture in theRepublic of Korea: Commodity Aspects. Working Paper No. 47. CGPRT Centre.
Sung, Myung-Hwan. 1998. Effects of Trade Liberalization on Agriculture in theRepublic of Korea: Institutional and Structural Aspects. Working Paper No. 35.CGPRT Centre.
WTO. 1995. Summary of the Results of the Uruguay Round.
Agricultural Markets Liberalization in Chile:Outcomes in the Horticultural Industry
The country’s economic growth since the restoration of democracy in 1990 has been the fastest inthe region, although it has not been as prodigious as the rates recorded in East Asia.
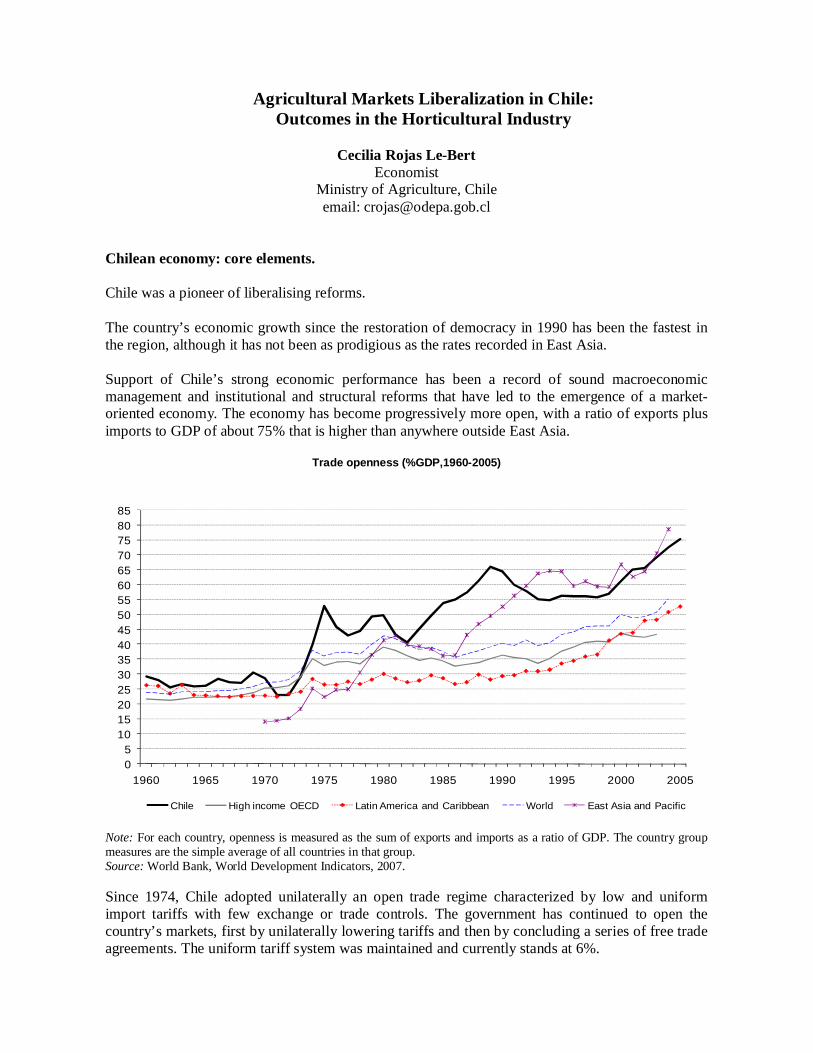
Support of Chile’s strong economic performance has been a record of sound macroeconomicmanagement and institutional and structural reforms that have led to the emergence of a market-oriented economy. The economy has become progressively more open, with a ratio of exports plusimports to GDP of about 75% that is higher than anywhere outside East Asia.
Trade openness (%GDP,1960-2005)
05
10152025303540455055606570758085
1960 1965 1970 1975 1980 1985 1990 1995 2000 2005
Chile High income OECD Latin America and Caribbean World East Asia and Pacific
Note: For each country, openness is measured as the sum of exports and imports as a ratio of GDP. The country groupmeasures are the simple average of all countries in that group.Source: World Bank, World Development Indicators, 2007.
Since 1974, Chile adopted unilaterally an open trade regime characterized by low and uniformimport tariffs with few exchange or trade controls. The government has continued to open thecountry’s markets, first by unilaterally lowering tariffs and then by concluding a series of free tradeagreements. The uniform tariff system was maintained and currently stands at 6%.
2
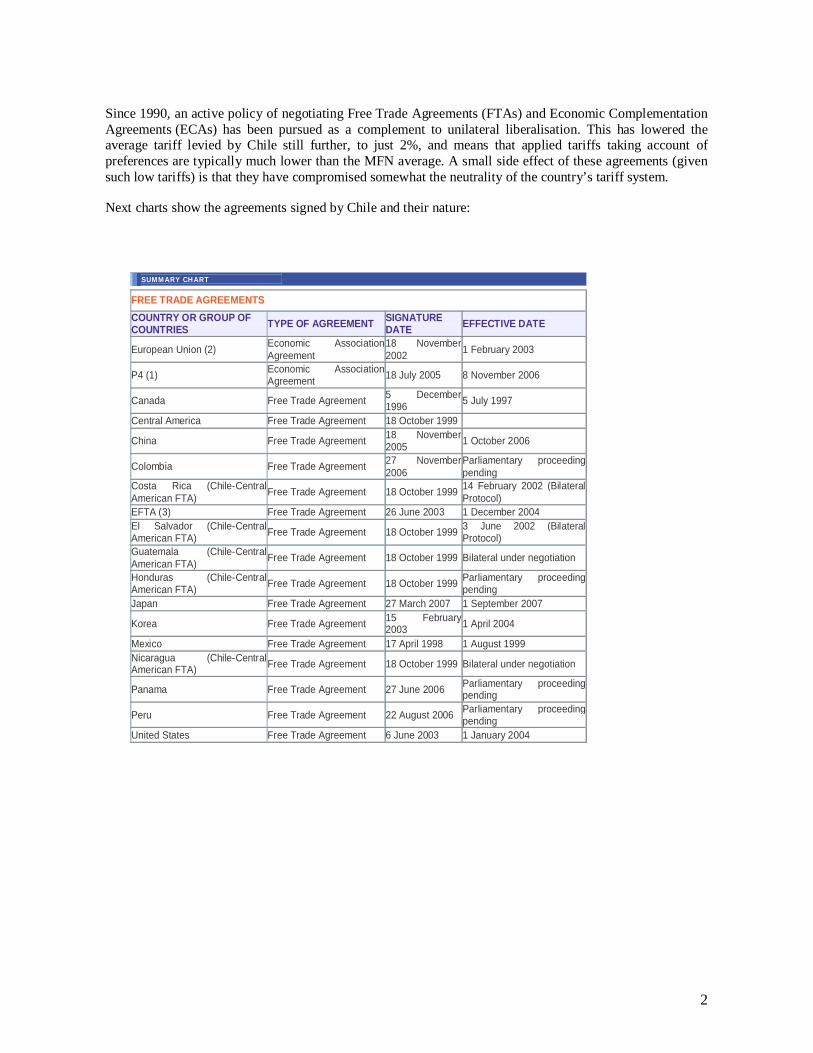
Since 1990, an active policy of negotiating Free Trade Agreements (FTAs) and Economic ComplementationAgreements (ECAs) has been pursued as a complement to unilateral liberalisation. This has lowered theaverage tariff levied by Chile still further, to just 2%, and means that applied tariffs taking account ofpreferences are typically much lower than the MFN average. A small side effect of these agreements (givensuch low tariffs) is that they have compromised somewhat the neutrality of the country’s tariff system.
Next charts show the agreements signed by Chile and their nature:
SUMMARY CHART
FREE TRADE AGREEMENTSCOUNTRY OR GROUP OFCOUNTRIES TYPE OF AGREEMENT SIGNATURE
DATE EFFECTIVE DATE
European Union (2) Economic AssociationAgreement
18 November2002 1 February 2003
P4 (1) Economic AssociationAgreement 18 July 2005 8 November 2006
Canada Free Trade Agreement 5 December1996 5 July 1997
Central America Free Trade Agreement 18 October 1999
China Free Trade Agreement 18 November2005 1 October 2006
Colombia Free Trade Agreement 27 November2006
Parliamentary proceedingpending
Costa Rica (Chile-CentralAmerican FTA) Free Trade Agreement 18 October 1999 14 February 2002 (Bilateral
Protocol)EFTA (3) Free Trade Agreement 26 June 2003 1 December 2004El Salvador (Chile-CentralAmerican FTA) Free Trade Agreement 18 October 1999 3 June 2002 (Bilateral
Protocol)Guatemala (Chile-CentralAmerican FTA) Free Trade Agreement 18 October 1999 Bilateral under negotiation
pendingJapan Free Trade Agreement 27 March 2007 1 September 2007
Korea Free Trade Agreement 15 February2003 1 April 2004
Mexico Free Trade Agreement 17 April 1998 1 August 1999Nicaragua (Chile-CentralAmerican FTA) Free Trade Agreement 18 October 1999 Bilateral under negotiation
Panama Free Trade Agreement 27 June 2006 Parliamentary proceedingpending
Peru Free Trade Agreement 22 August 2006 Parliamentary proceedingpending
United States Free Trade Agreement 6 June 2003 1 January 2004
3
S SUMMARY CHARTSUMMARY CHART UMMARY CHART
ECONOMIC COMPLEMENTATION AGREEMENTSCOUNTRY OR GROUP OFCOUNTRIES TYPE OF AGREEMENT SIGNATURE DATE EFFECTIVE DATE
Bolivia Economic ComplementationAgreement Nº 22 6 April 1993 7 July 1993
Ecuador Economic ComplementationAgreement Nº 32 20 December 1994 1 January 1995
Mercosur (4) Economic ComplementationAgreement Nº 35 25 June 1996 1 October 1996
Venezuela Economic ComplementationAgreement Nº 23 2 April 1993 1 July 1993
Cuba Partial Scope Agreement 21 August 1998 (5) Parliamentary proceedingpending
India Partial Scope Agreement 8 March 2006 Parliamentary proceedingpending
.(1) Pacific 4 is formed by Brunei Darussalam, Chile, New Zealand, and Singapore.(2) The countries that participate as members of the European Union are: Austria, Belgium, Denmark,Finland, France, Germany, Greece, Ireland, Italy, Luxembourg, Portugal, Spain, Sweden, theNetherlands, and the United Kingdom. As from May 1, 2004, the new member countries are: Cyprus,Czech Republic, Estonia, Hungary, Latvia, Lithuania, Malta, Poland, Slovakia, and Slovenia. The newmembers as from January 2007 are: Rumania and Bulgaria.(3) The European Free Trade Association (EFTA) is formed by: Iceland, Liechtenstein, Norway andSwitzerland.(4) Mercosur is formed by Argentina, Brazil, Paraguay and Uruguay. Chile participates as countryassociated to the Agreement.(5) The date refers only to the end of the Negotiations.
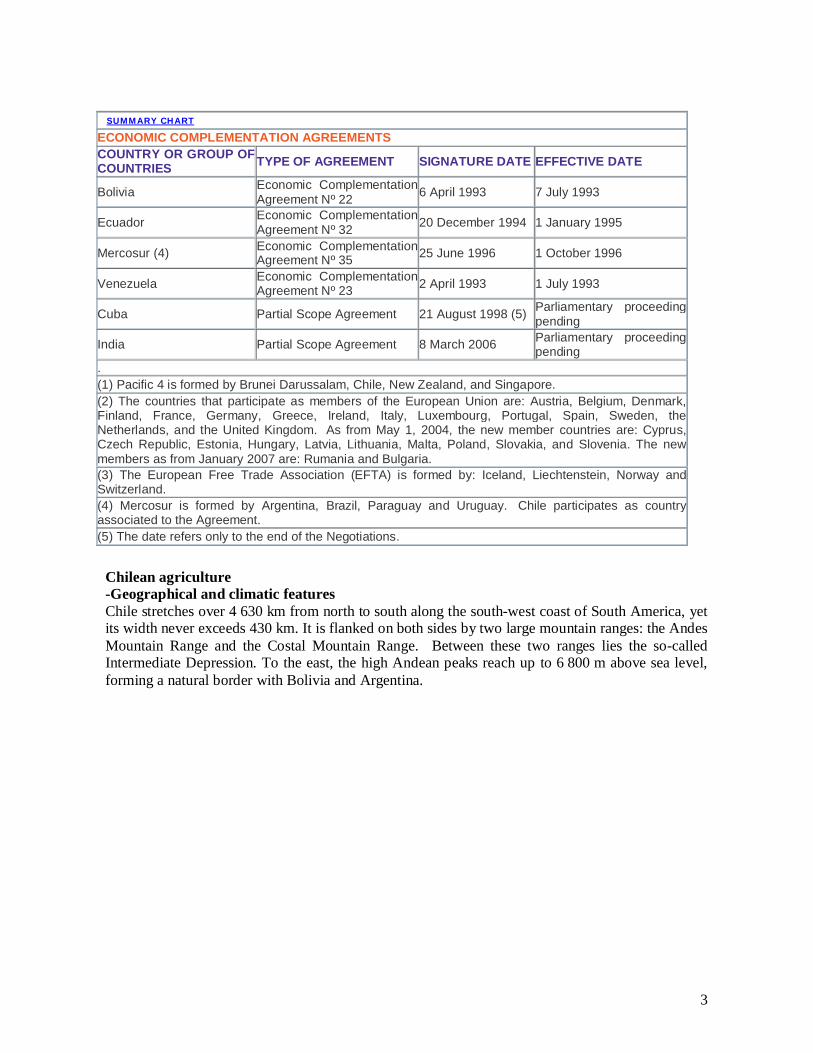
Chilean agriculture-Geographical and climatic featuresChile stretches over 4 630 km from north to south along the south-west coast of South America, yetits width never exceeds 430 km. It is flanked on both sides by two large mountain ranges: the AndesMountain Range and the Costal Mountain Range. Between these two ranges lies the so-calledIntermediate Depression. To the east, the high Andean peaks reach up to 6 800 m above sea level,forming a natural border with Bolivia and Argentina.
4
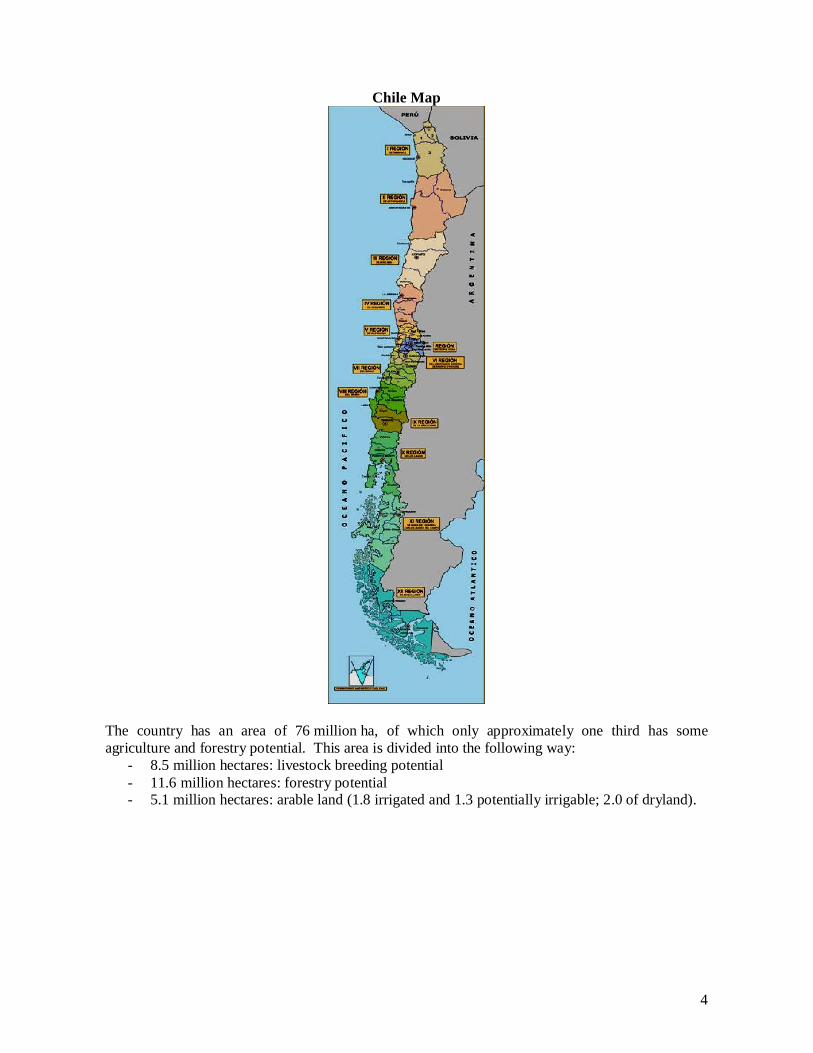
Chile Map
The country has an area of 76 million ha, of which only approximately one third has someagriculture and forestry potential. This area is divided into the following way:
- 8.5 million hectares: livestock breeding potential- 11.6 million hectares: forestry potential- 5.1 million hectares: arable land (1.8 irrigated and 1.3 potentially irrigable; 2.0 of dryland).
5
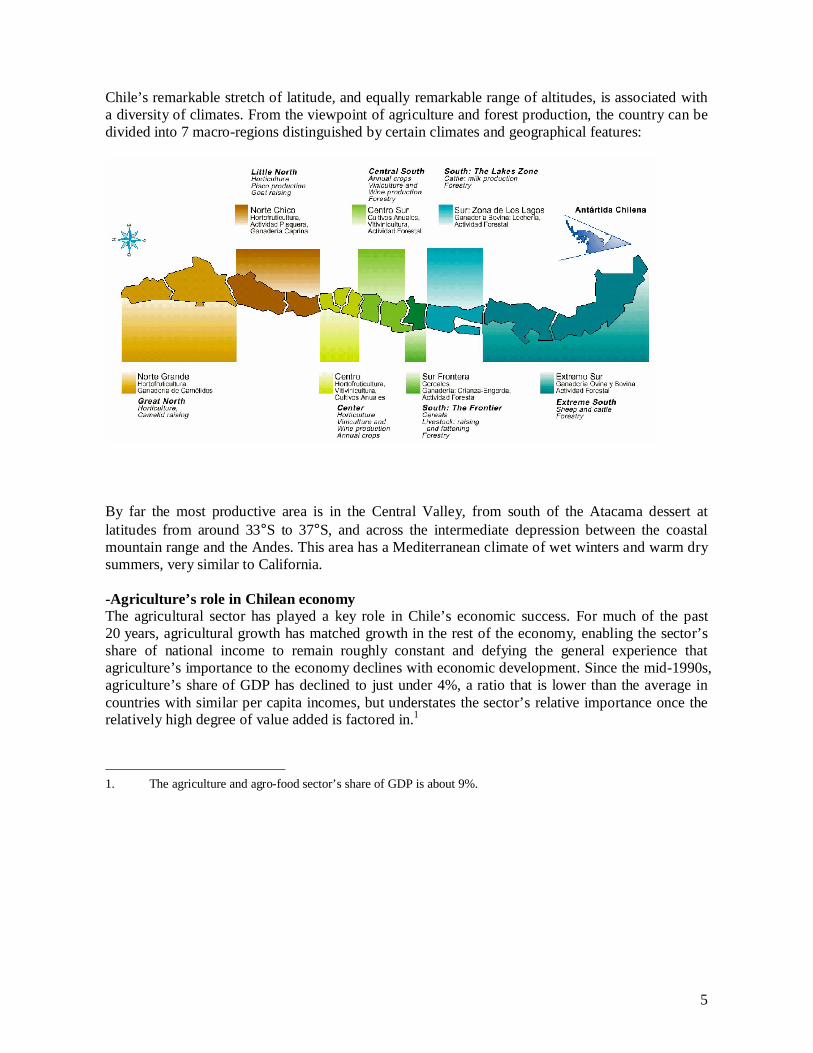
Chile’s remarkable stretch of latitude, and equally remarkable range of altitudes, is associated witha diversity of climates. From the viewpoint of agriculture and forest production, the country can bedivided into 7 macro-regions distinguished by certain climates and geographical features:
By far the most productive area is in the Central Valley, from south of the Atacama dessert atlatitudes from around 33°S to 37°S, and across the intermediate depression between the coastalmountain range and the Andes. This area has a Mediterranean climate of wet winters and warm drysummers, very similar to California.
-Agriculture’s role in Chilean economyThe agricultural sector has played a key role in Chile’s economic success. For much of the past20 years, agricultural growth has matched growth in the rest of the economy, enabling the sector’sshare of national income to remain roughly constant and defying the general experience thatagriculture’s importance to the economy declines with economic development. Since the mid-1990s,agriculture’s share of GDP has declined to just under 4%, a ratio that is lower than the average incountries with similar per capita incomes, but understates the sector’s relative importance once therelatively high degree of value added is factored in.1
1. The agriculture and agro-food sector’s share of GDP is about 9%.
6
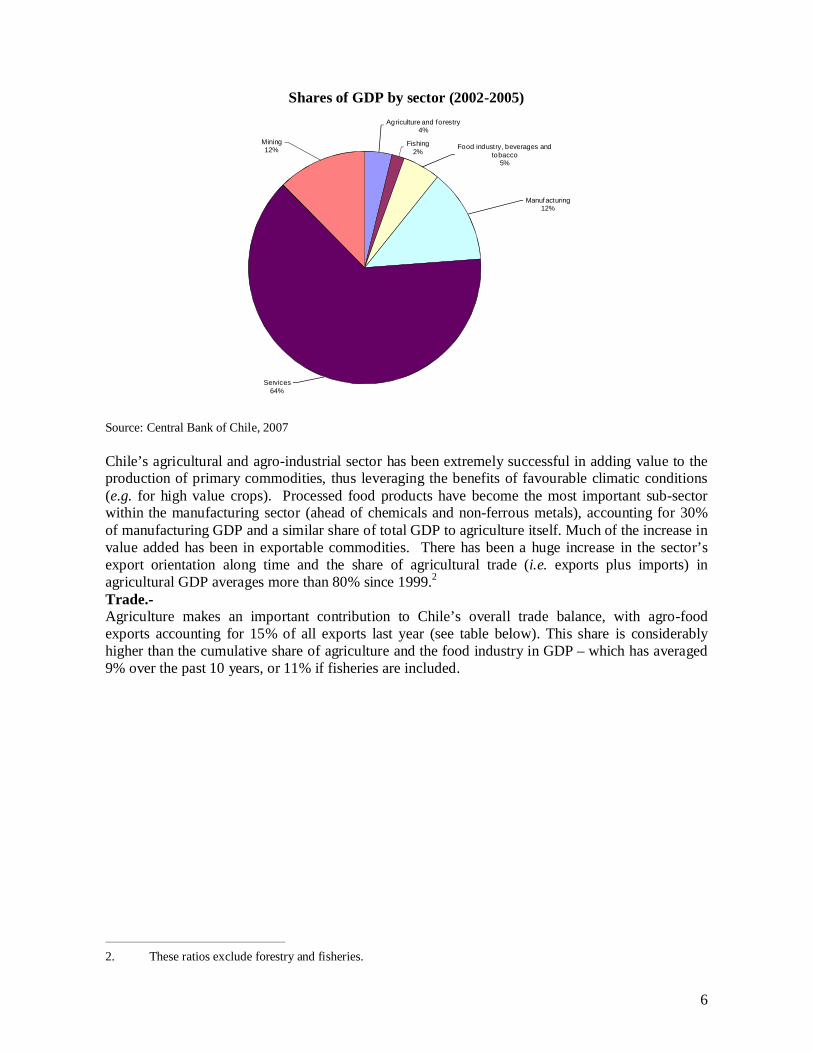
Shares of GDP by sector (2002-2005)Agriculture and forestry
4%
Fishing2%
Food industry, beverages andtobacco
5%
Manufacturing12%
Services64%
Mining12%
Source: Central Bank of Chile, 2007
Chile’s agricultural and agro-industrial sector has been extremely successful in adding value to theproduction of primary commodities, thus leveraging the benefits of favourable climatic conditions(e.g. for high value crops). Processed food products have become the most important sub-sectorwithin the manufacturing sector (ahead of chemicals and non-ferrous metals), accounting for 30%of manufacturing GDP and a similar share of total GDP to agriculture itself. Much of the increase invalue added has been in exportable commodities. There has been a huge increase in the sector’sexport orientation along time and the share of agricultural trade (i.e. exports plus imports) inagricultural GDP averages more than 80% since 1999.2Trade.-Agriculture makes an important contribution to Chile’s overall trade balance, with agro-foodexports accounting for 15% of all exports last year (see table below). This share is considerablyhigher than the cumulative share of agriculture and the food industry in GDP – which has averaged9% over the past 10 years, or 11% if fisheries are included.
2. These ratios exclude forestry and fisheries.
7
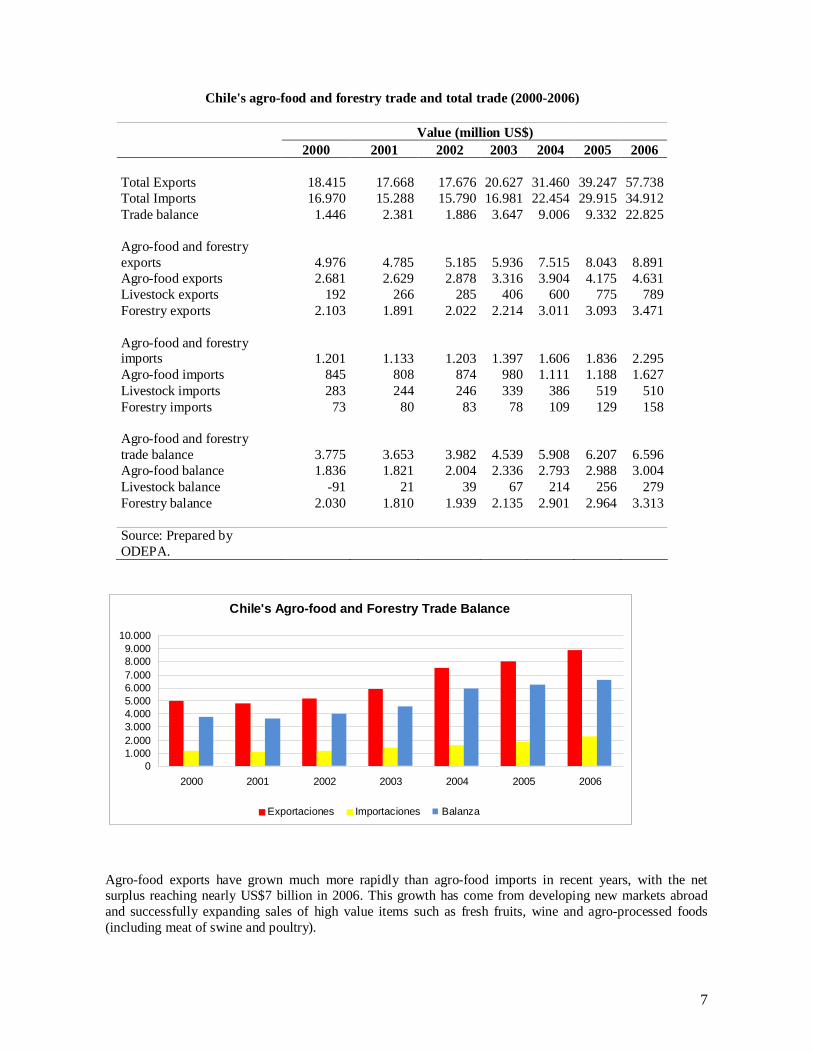
Chile's agro-food and forestry trade and total trade (2000-2006)
Value (million US$)2000 2001 2002 2003 2004 2005 2006
Agro-food exports have grown much more rapidly than agro-food imports in recent years, with the netsurplus reaching nearly US$7 billion in 2006. This growth has come from developing new markets abroadand successfully expanding sales of high value items such as fresh fruits, wine and agro-processed foods(including meat of swine and poultry).
8
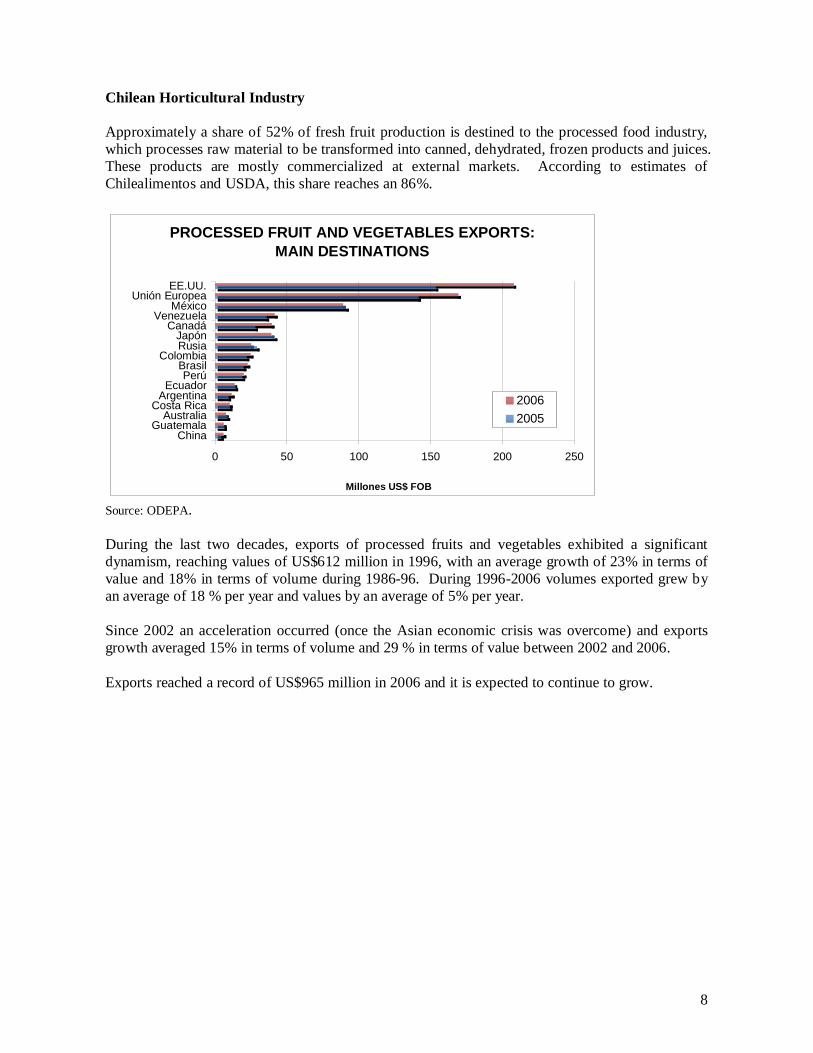
Chilean Horticultural Industry
Approximately a share of 52% of fresh fruit production is destined to the processed food industry,which processes raw material to be transformed into canned, dehydrated, frozen products and juices.These products are mostly commercialized at external markets. According to estimates ofChilealimentos and USDA, this share reaches an 86%.
PROCESSED FRUIT AND VEGETABLES EXPORTS:MAIN DESTINATIONS
0 50 100 150 200 250
ChinaGuatemala
AustraliaCosta Rica
ArgentinaEcuador
PerúBrasil
ColombiaRusiaJapón
CanadáVenezuela
MéxicoUnión Europea
EE.UU.
Millones US$ FOB
20062005
Source: ODEPA.
During the last two decades, exports of processed fruits and vegetables exhibited a significantdynamism, reaching values of US$612 million in 1996, with an average growth of 23% in terms ofvalue and 18% in terms of volume during 1986-96. During 1996-2006 volumes exported grew byan average of 18 % per year and values by an average of 5% per year.
Since 2002 an acceleration occurred (once the Asian economic crisis was overcome) and exportsgrowth averaged 15% in terms of volume and 29 % in terms of value between 2002 and 2006.
Exports reached a record of US$965 million in 2006 and it is expected to continue to grow.
9
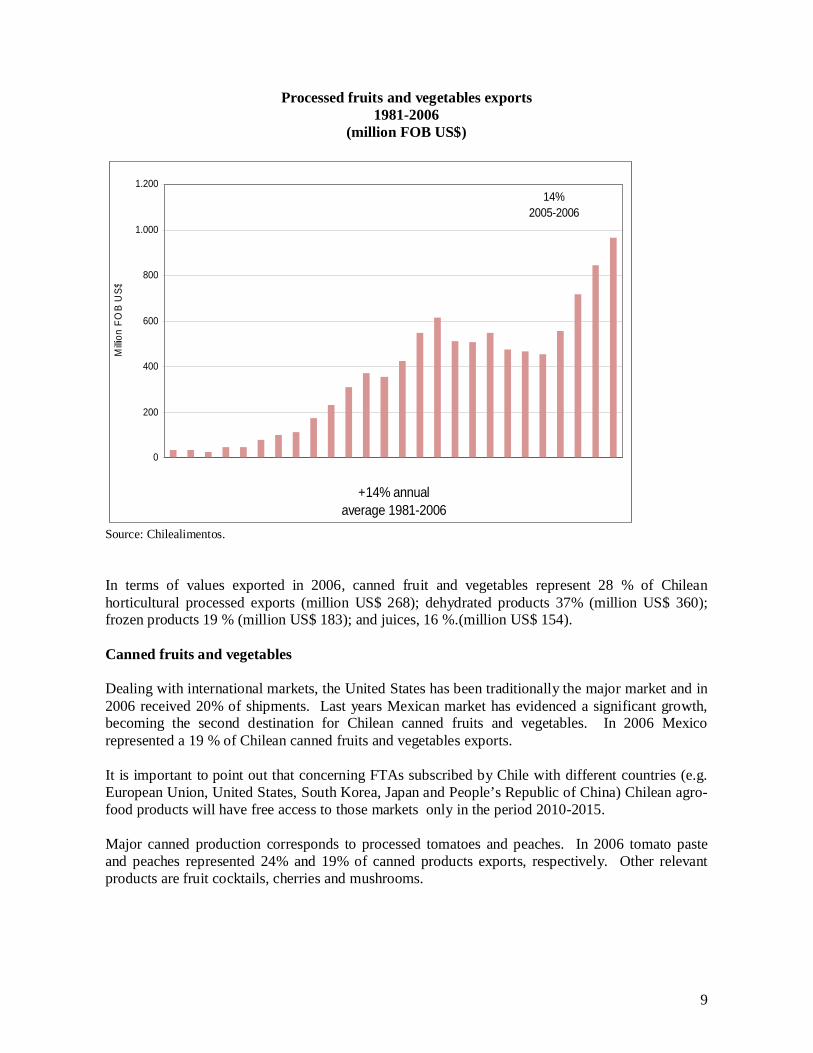
Processed fruits and vegetables exports1981-2006
(million FOB US$)
14%2005-2006
0
200
400
600
800
1.000
1.200
+14% annualaverage 1981-2006
Milli
on F
OB
US$
Source: Chilealimentos.
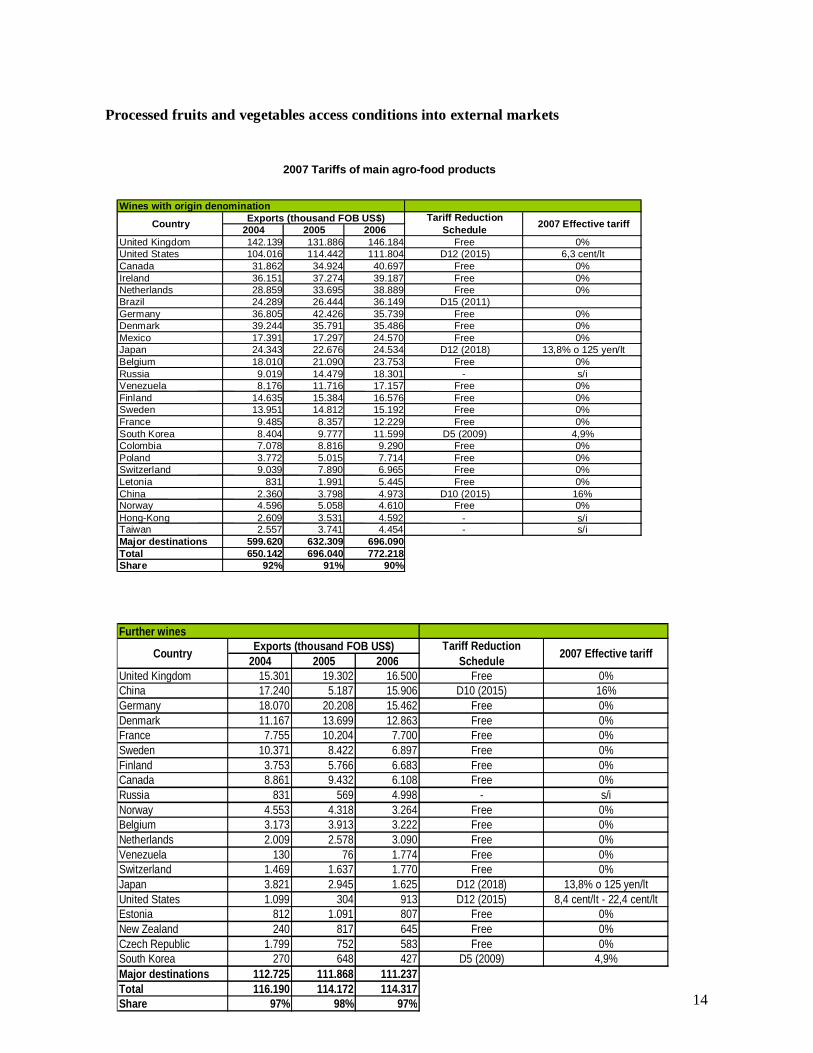
In terms of values exported in 2006, canned fruit and vegetables represent 28 % of Chileanhorticultural processed exports (million US$ 268); dehydrated products 37% (million US$ 360);frozen products 19 % (million US$ 183); and juices, 16 %.(million US$ 154).
Canned fruits and vegetables
Dealing with international markets, the United States has been traditionally the major market and in2006 received 20% of shipments. Last years Mexican market has evidenced a significant growth,becoming the second destination for Chilean canned fruits and vegetables. In 2006 Mexicorepresented a 19 % of Chilean canned fruits and vegetables exports.
It is important to point out that concerning FTAs subscribed by Chile with different countries (e.g.European Union, United States, South Korea, Japan and People’s Republic of China) Chilean agro-food products will have free access to those markets only in the period 2010-2015.
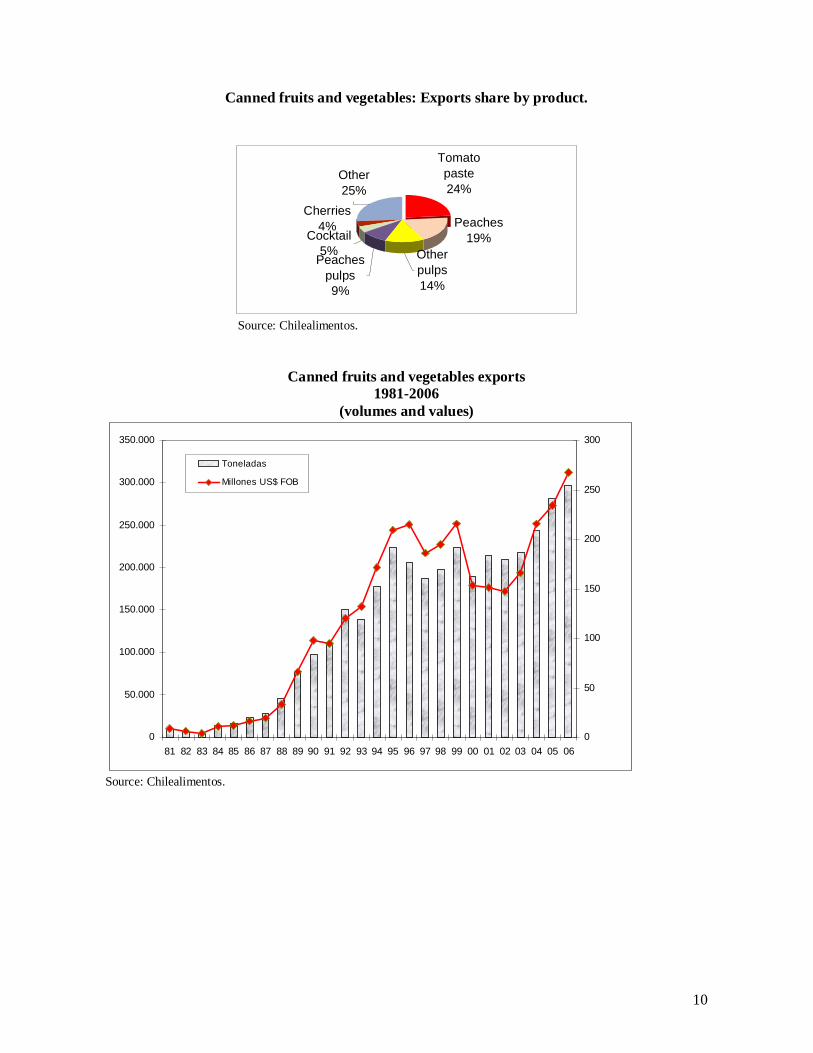
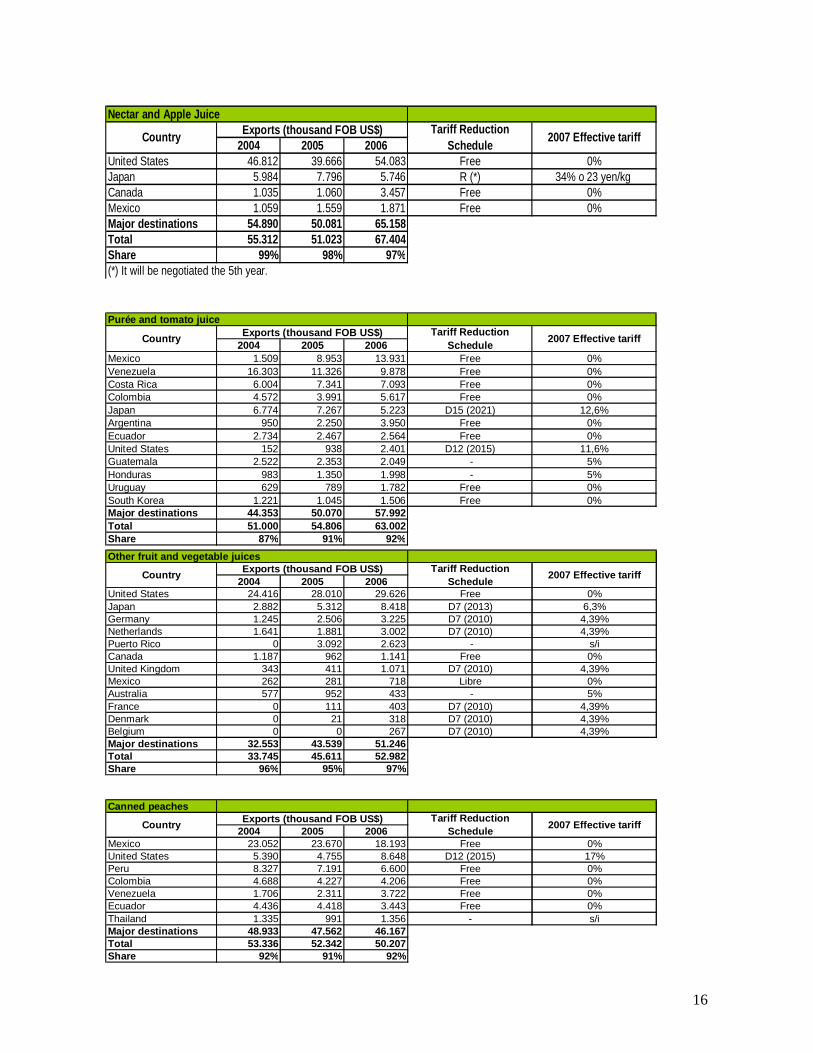
Major canned production corresponds to processed tomatoes and peaches. In 2006 tomato pasteand peaches represented 24% and 19% of canned products exports, respectively. Other relevantproducts are fruit cocktails, cherries and mushrooms.
10
Canned fruits and vegetables: Exports share by product.
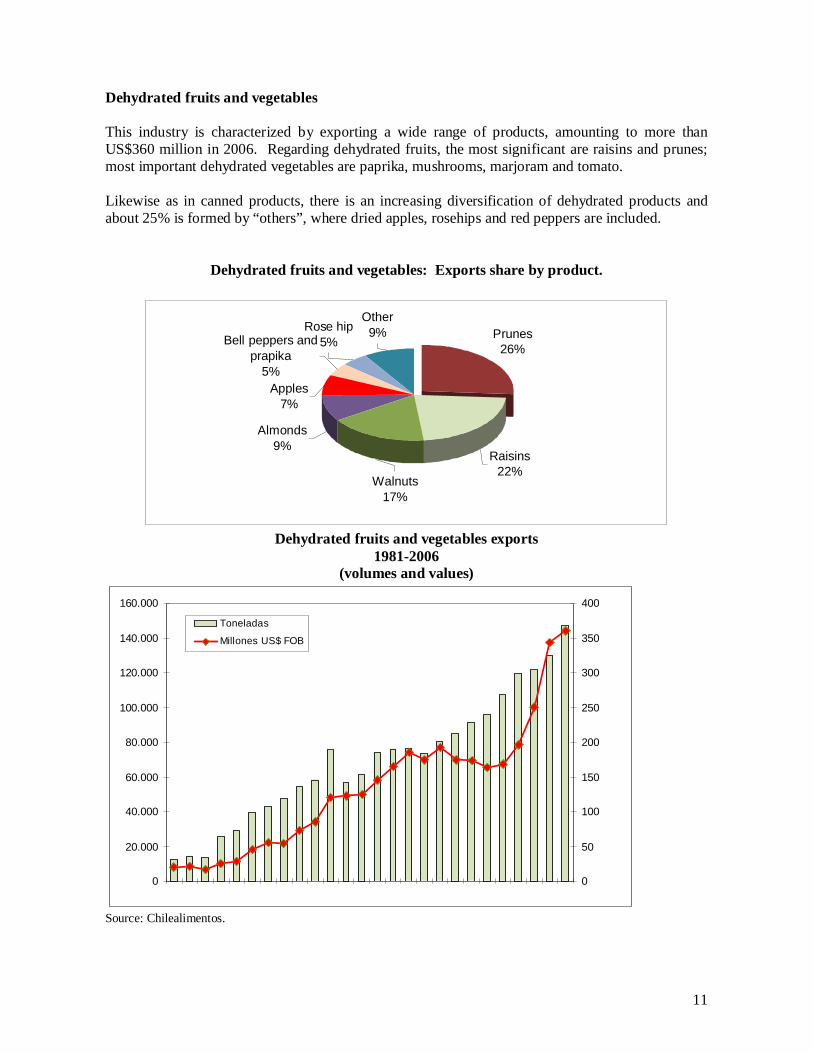
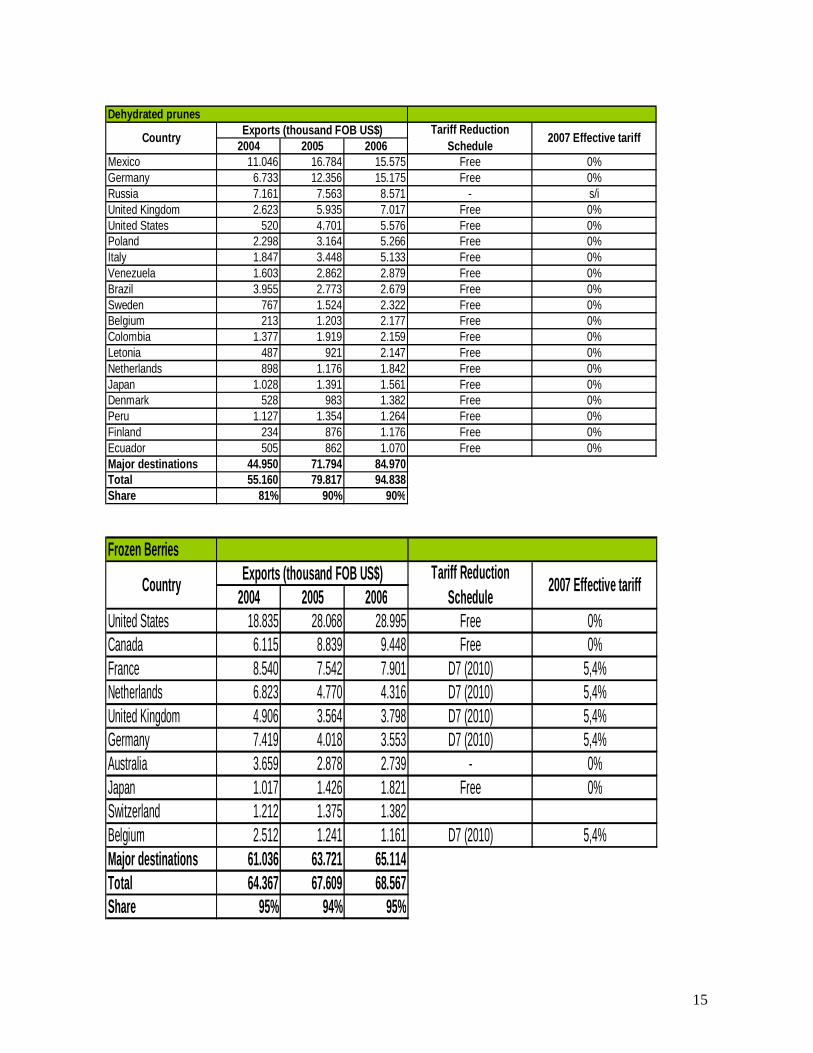
This industry is characterized by exporting a wide range of products, amounting to more thanUS$360 million in 2006. Regarding dehydrated fruits, the most significant are raisins and prunes;most important dehydrated vegetables are paprika, mushrooms, marjoram and tomato.
Likewise as in canned products, there is an increasing diversification of dehydrated products andabout 25% is formed by “others”, where dried apples, rosehips and red peppers are included.
Dehydrated fruits and vegetables: Exports share by product.
Other9%Rose hip
5%Bell peppers andprapika
5%Apples
7%
Almonds9%
Walnuts17%
Raisins22%
Prunes26%
Dehydrated fruits and vegetables exports1981-2006
(volumes and values)
0
20.000
40.000
60.000
80.000
100.000
120.000
140.000
160.000
0
50
100
150
200
250
300
350
400
Toneladas
Millones US$ FOB
Source: Chilealimentos.
12
Frozen products
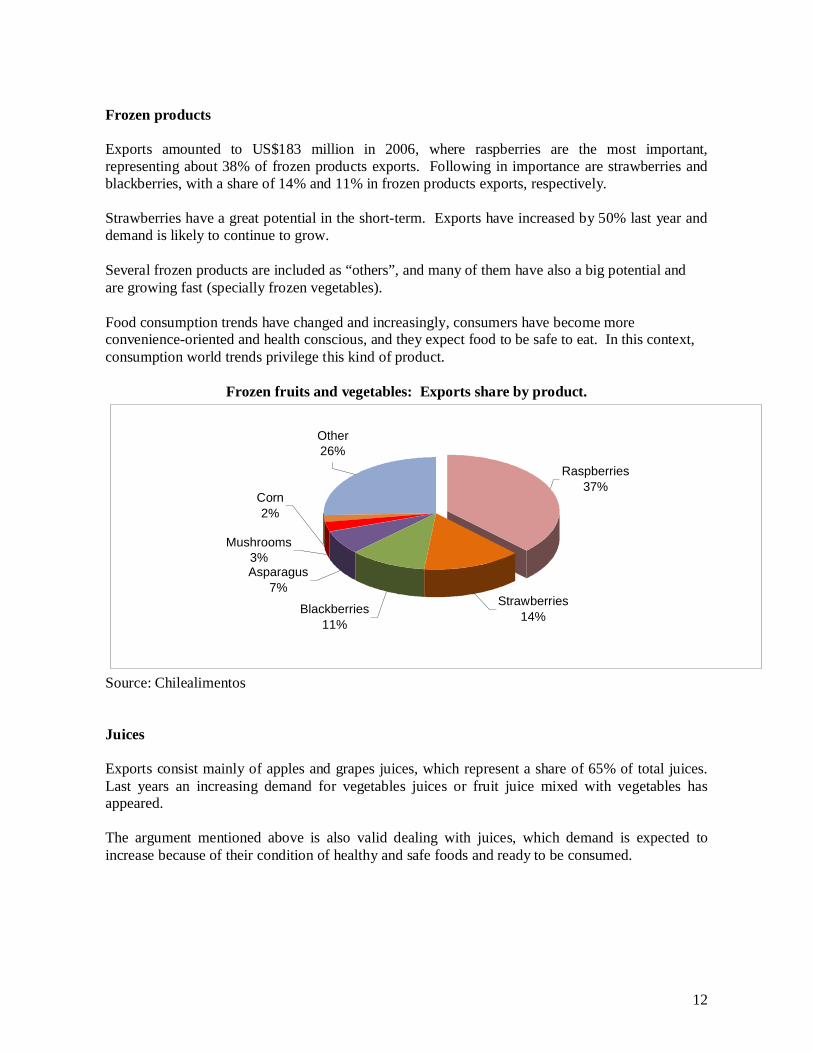
Exports amounted to US$183 million in 2006, where raspberries are the most important,representing about 38% of frozen products exports. Following in importance are strawberries andblackberries, with a share of 14% and 11% in frozen products exports, respectively.
Strawberries have a great potential in the short-term. Exports have increased by 50% last year anddemand is likely to continue to grow.
Several frozen products are included as “others”, and many of them have also a big potential andare growing fast (specially frozen vegetables).
Food consumption trends have changed and increasingly, consumers have become moreconvenience-oriented and health conscious, and they expect food to be safe to eat. In this context,consumption world trends privilege this kind of product.
Frozen fruits and vegetables: Exports share by product.
Other26%
Corn2%
Mushrooms3%Asparagus
7%
Blackberries11%
Strawberries14%
Raspberries37%
Source: Chilealimentos
Juices
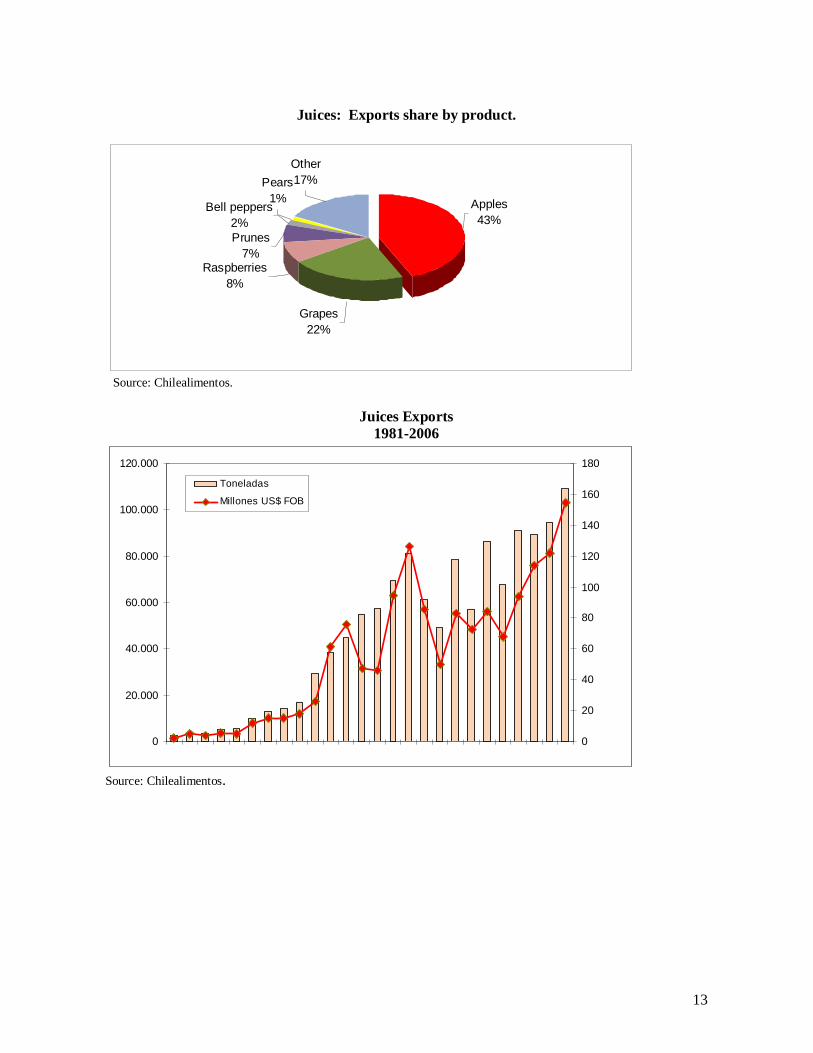
Exports consist mainly of apples and grapes juices, which represent a share of 65% of total juices.Last years an increasing demand for vegetables juices or fruit juice mixed with vegetables hasappeared.
The argument mentioned above is also valid dealing with juices, which demand is expected toincrease because of their condition of healthy and safe foods and ready to be consumed.
13
Juices: Exports share by product.
Other17%Pears
1%Bell peppers
2%Prunes
7%Raspberries
8%
Grapes22%
Apples43%
Source: Chilealimentos.
Juices Exports1981-2006
0
20.000
40.000
60.000
80.000
100.000
120.000
0
20
40
60
80
100
120
140
160
180
Toneladas
Millones US$ FOB
Source: Chilealimentos.
14
Processed fruits and vegetables access conditions into external markets
Country Exports (thousand FOB US$) Tariff ReductionSchedule 2007 Effective tariff
Country Exports (thousand FOB US$) Tariff ReductionSchedule 2007 Effective tariff
17
Perspectives.-
To estimate perspectives of the export-oriented horticultural industry, some relevant aspects shouldbe taken into account:On the one hand, current Government posed a challenge to agricultural sector: to transform Chileinto an emerging international agro-food and forestry superpower, that means to be placed withinthe top ten suppliers in the world.
To address this challenge the Ministry of Agriculture has called a series of experts, academics,entrepreneurs and public officials, and they are working at present to formulate an agro-food agendaidentifying the necessary steps to reach said goal.
On the other hand, dealing with demand, world trends in food consumption will introduce moredynamism to demand for these products. Food consumers are health-aware, mindful of nutrition,and enjoying healthier and more balanced diets. They are looking for prepared attractive food aswell, because the number of working women is increasing and families are smaller. Worldpopulation is also increasing, with forecasts of 7,186 million people in 2015, according UN Widerand the World Bank.
Chile is the world’s largest exporter of bell peppers and dried apples and South America’s largestsupplier of tomato paste, raisins, walnuts and almonds. The country still ranks 17th among foodexporting countries but by making the necessary efforts both private and public sector, we couldleap forward to come up to expectations.
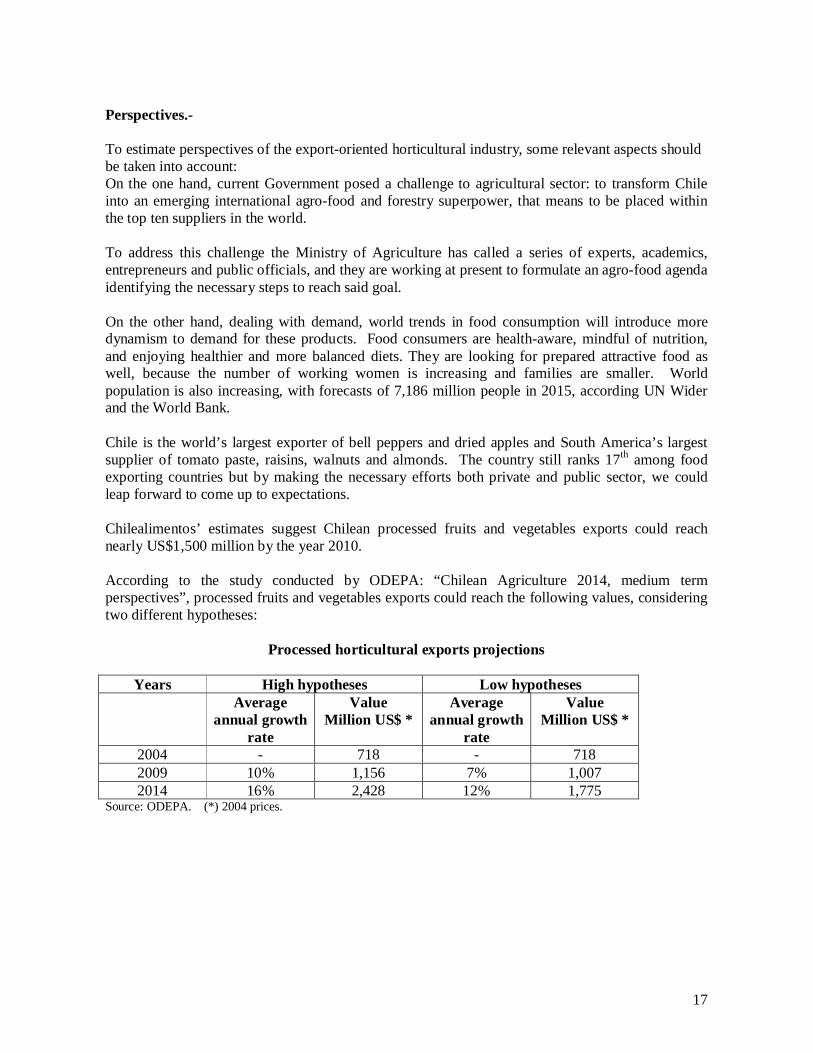
Chilealimentos’ estimates suggest Chilean processed fruits and vegetables exports could reachnearly US$1,500 million by the year 2010.
According to the study conducted by ODEPA: “Chilean Agriculture 2014, medium termperspectives”, processed fruits and vegetables exports could reach the following values, consideringtwo different hypotheses: