Synchrotron X-ray Diffraction in Mineralogy and Materials Chemistry. Possibilities and Applications Ángeles G. De la Torre, a M. Carmen Martín-Sedeño, a Laura León-Reina, b José M. Compaña, a and Miguel A. G. Aranda a a Departamento de Química Inorgánica, Cristalografía y Mineralogía, Universidad de Málaga, 29071 Málaga. b Servicios Centrales de Apoyo a la Investigación, Universidad de Málaga, 29071 Málaga. Abstract The average crystal structure of minerals and materials is needed in order to explain/predict their properties. Furthermore, the microstructure of the samples may allow explaining the performances of materials in working conditions. Synchrotron diffraction is an invaluable technique for characterizing the structures and microstructures of minerals and inorganic compounds. Here, we will show examples of synchrotron studies for characterizing both polycrystalline materials with powder diffraction techniques and single crystals with single crystal diffraction techniques. Powder diffraction is adequate for carrying out very demanding experiments including the accurate quantitative mineralogical analysis at very high temperatures up to 1500 ºC. In this case, samples must be contained within Pt tubes and a very energetic wavelength must be used, λ=0.30Å, in order to penetrate the Pt capillaries. Furthermore, the border between powder diffraction and single crystal diffraction is becoming very diffuse. Polycrystal samples are being already studied by single crystal- type diffraction by indexing the reflection arising from different grains with the appropriate algorithms. Powders may be also studied by single-crystal diffraction by selecting a single microcrystal since the intensity in some third generation synchrotron source beamlines allows obtaining useful data from submicrometric individual grains. This technique is exemplified by two cases: i) the study of a kaolinite microcrystal; and
Transcript
Synchrotron X-ray Diffraction in Mineralogy and Materials
Chemistry. Possibilities and Applications
Ángeles G. De la Torre,a M. Carmen Martín-Sedeño,a Laura León-Reina,b José M.
Compaña,aand Miguel A. G. Arandaa
a Departamento de Química Inorgánica, Cristalografía y Mineralogía, Universidad de Málaga, 29071 Málaga.
b Servicios Centrales de Apoyo a la Investigación, Universidad de Málaga, 29071 Málaga.
Abstract
The average crystal structure of minerals and materials is needed in order to
explain/predict their properties. Furthermore, the microstructure of the samples may
allow explaining the performances of materials in working conditions. Synchrotron
diffraction is an invaluable technique for characterizing the structures and
microstructures of minerals and inorganic compounds. Here, we will show examples of
synchrotron studies for characterizing both polycrystalline materials with powder
diffraction techniques and single crystals with single crystal diffraction techniques.
Powder diffraction is adequate for carrying out very demanding experiments including
the accurate quantitative mineralogical analysis at very high temperatures up to 1500
ºC. In this case, samples must be contained within Pt tubes and a very energetic
wavelength must be used, λ=0.30Å, in order to penetrate the Pt capillaries.
Furthermore, the border between powder diffraction and single crystal diffraction is
becoming very diffuse. Polycrystal samples are being already studied by single crystal-
type diffraction by indexing the reflection arising from different grains with the
appropriate algorithms. Powders may be also studied by single-crystal diffraction by
selecting a single microcrystal since the intensity in some third generation synchrotron
source beamlines allows obtaining useful data from submicrometric individual grains.
This technique is exemplified by two cases: i) the study of a kaolinite microcrystal; and
Miguel A. G. Aranda et al. ¯¯¯¯¯¯¯¯¯¯¯¯¯¯¯¯¯¯¯¯¯¯¯¯¯¯¯¯¯¯¯¯¯¯¯¯¯¯¯¯¯¯¯¯¯¯¯¯¯¯¯¯¯¯¯¯¯¯¯¯¯¯¯¯¯¯¯¯¯¯¯¯¯¯¯¯¯¯
30
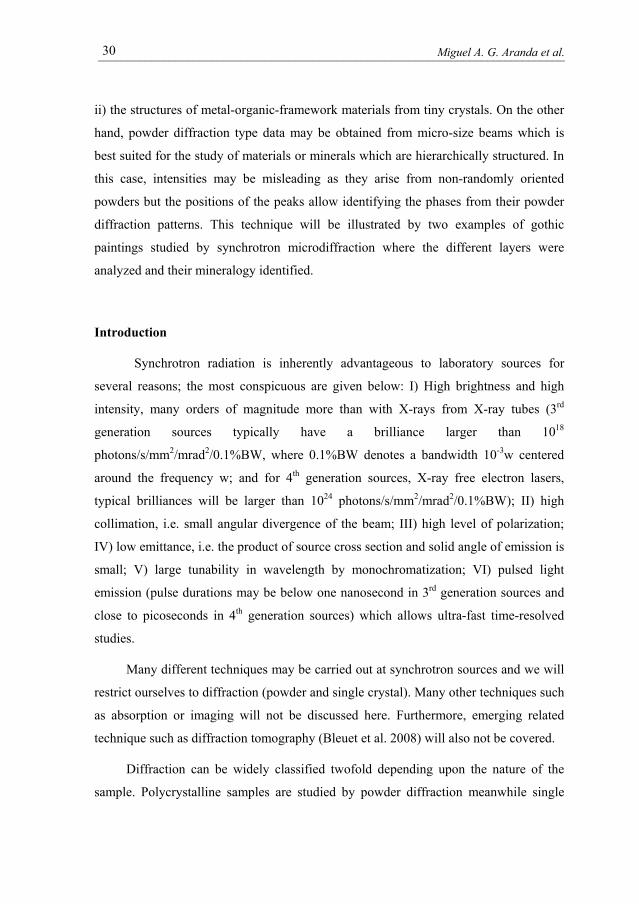
ii) the structures of metal-organic-framework materials from tiny crystals. On the other
hand, powder diffraction type data may be obtained from micro-size beams which is
best suited for the study of materials or minerals which are hierarchically structured. In
this case, intensities may be misleading as they arise from non-randomly oriented
powders but the positions of the peaks allow identifying the phases from their powder
diffraction patterns. This technique will be illustrated by two examples of gothic
paintings studied by synchrotron microdiffraction where the different layers were
analyzed and their mineralogy identified.
Introduction
Synchrotron radiation is inherently advantageous to laboratory sources for
several reasons; the most conspicuous are given below: I) High brightness and high
intensity, many orders of magnitude more than with X-rays from X-ray tubes (3rd
generation sources typically have a brilliance larger than 1018
photons/s/mm2/mrad2/0.1%BW, where 0.1%BW denotes a bandwidth 10-3w centered
around the frequency w; and for 4th generation sources, X-ray free electron lasers,
typical brilliances will be larger than 1024 photons/s/mm2/mrad2/0.1%BW); II) high
collimation, i.e. small angular divergence of the beam; III) high level of polarization;
IV) low emittance, i.e. the product of source cross section and solid angle of emission is
small; V) large tunability in wavelength by monochromatization; VI) pulsed light
emission (pulse durations may be below one nanosecond in 3rd generation sources and
close to picoseconds in 4th generation sources) which allows ultra-fast time-resolved
studies.
Many different techniques may be carried out at synchrotron sources and we will
restrict ourselves to diffraction (powder and single crystal). Many other techniques such
as absorption or imaging will not be discussed here. Furthermore, emerging related
technique such as diffraction tomography (Bleuet et al. 2008) will also not be covered.
Diffraction can be widely classified twofold depending upon the nature of the
sample. Polycrystalline samples are studied by powder diffraction meanwhile single
Synchrotron X-ray Diffraction in Mineralogy and Materials Chemistry. Possibilities and Applications ¯¯¯¯¯¯¯¯¯¯¯¯¯¯¯¯¯¯¯¯¯¯¯¯¯¯¯¯¯¯¯¯¯¯¯¯¯¯¯¯¯¯¯¯¯¯¯¯¯¯¯¯¯¯¯¯¯¯¯¯¯¯¯¯¯¯¯¯¯¯¯¯¯¯¯¯¯¯
31
crystals are studied by single crystal diffraction. However, this classification is
becoming obsolete as new techniques and methodologies are appearing where such
distinction is not so clear. For instance, single crystal diffraction is being applied to
polycrystals where new algorithms allow indexing the reflections arising from
individual grains and the (non-overlapped) intensities are extracted as in a single crystal
experiment. On the other hand, ab-initio structure solution from powder diffraction is
being defied by single crystal diffraction from microbeam on even of submicrometric
crystals. Finally, powder diffraction using micrometer size beams give data where only
several grains are colleted on two-dimensional detectors.
In this work, several examples of synchrotron diffraction are given highlighting
when appropriate the advantages of synchrotron data over laboratory studies. We will
start with high resolution synchrotron powder diffraction for structural and analytical
studies. The superior nature of the synchrotron radiation is best suited for in-situ studies
at high and low temperatures, high-pressures and to follow chemical reactions. Several
examples of in-situ studies will be discussed. Then, we will move forward to powder
diffraction from micro-beams. This type of studies is very important to characterize
inhomogeneous / hierarchical-structured samples. We will illustrate this technique with
two examples of paintings studied with synchrotron microdiffraction. The different
layers within gothic paintings are analyzed and the mineralogy of the layers is identified
from their powder patterns.
Single crystal diffraction is also used at synchrotron for several purposes.
Microcrystals (or disordered or weakly-diffracting crystals) can be studied. Larger
crystal can be analyzed for obtaining very accurate structures, i. e. charge-density
studies. Finally, one example of polycrystals study by single crystal-like method is
HR-SXRPD is obtained by placing a crystal analyzer (or a set of analyzers) in the
diffracted beam. Since the acceptance of a Si 111 crystal (or Ge 111) is very small (a
Miguel A. G. Aranda et al. ¯¯¯¯¯¯¯¯¯¯¯¯¯¯¯¯¯¯¯¯¯¯¯¯¯¯¯¯¯¯¯¯¯¯¯¯¯¯¯¯¯¯¯¯¯¯¯¯¯¯¯¯¯¯¯¯¯¯¯¯¯¯¯¯¯¯¯¯¯¯¯¯¯¯¯¯¯¯
32
few arcsec), an analyzer crystal stringently defines the second angle of diffraction.
Since the analyzer determines a true angle of diffraction, the use of an analyzer crystal
renders the positions of diffraction peaks immune to aberrations, such as specimen
transparency and misalignment of the sample with respect to the axis of the
diffractometer, that commonly affect laboratory X-ray powder diffractometers. Figure 1
(left) shows a scheme of the first ultra-high resolution detector system (ID31 at ESRF,
formerly located at a bending magnet: BM16). The analyzer system yields peaks very
narrow, with a nominal instrumental contribution to the full width at the half maximum
(FWHM) of around 0.003º 2θ for the patterns from ID31 diffractometer. Figure 1
(right) displays a single diffraction peak of LaB6. These data and figures are gathered
from ESRF web pages (www.esrf.eu) and (Wright et al. 2003).
a)
b)
Figure 1:. a) Scheme of the detector system in ID31 high-resolution powder diffractometer of ESRF showing the 9 Si(111) analyzer crystals and the 9 point detectors. This system produces extremely sharp peaks. b) Figure shows one peak of LaB6 NIST 660a reference material with λ=0.8Å displaying a FWHM close to 0.005º (2θ), (Wright et al. 2003).
Synchrotron X-ray Diffraction in Mineralogy and Materials Chemistry. Possibilities and Applications ¯¯¯¯¯¯¯¯¯¯¯¯¯¯¯¯¯¯¯¯¯¯¯¯¯¯¯¯¯¯¯¯¯¯¯¯¯¯¯¯¯¯¯¯¯¯¯¯¯¯¯¯¯¯¯¯¯¯¯¯¯¯¯¯¯¯¯¯¯¯¯¯¯¯¯¯¯¯
33
Comparison of peak widths between ‘in-house’ and synchrotron powder diffraction.
We will illustrate this comparison with data taken on rare earth oxy-apatites
which are attracting considerable interest due to their high oxide ion conductivities and
low activation energies (Kharton et al. 2004) that are making these materials promising
electrolytes for solid oxide fuel cells, SOFCs (Singhal and Kendall, 2003). The
combined use of powder diffraction (Rietveld method with neutron, laboratory and
synchrotron X-ray data) has allowed locating the interstitial oxide anions responsible of
the conduction mechanism (León-Reina et al. 2004, 2005a, 2005b and 2006). A
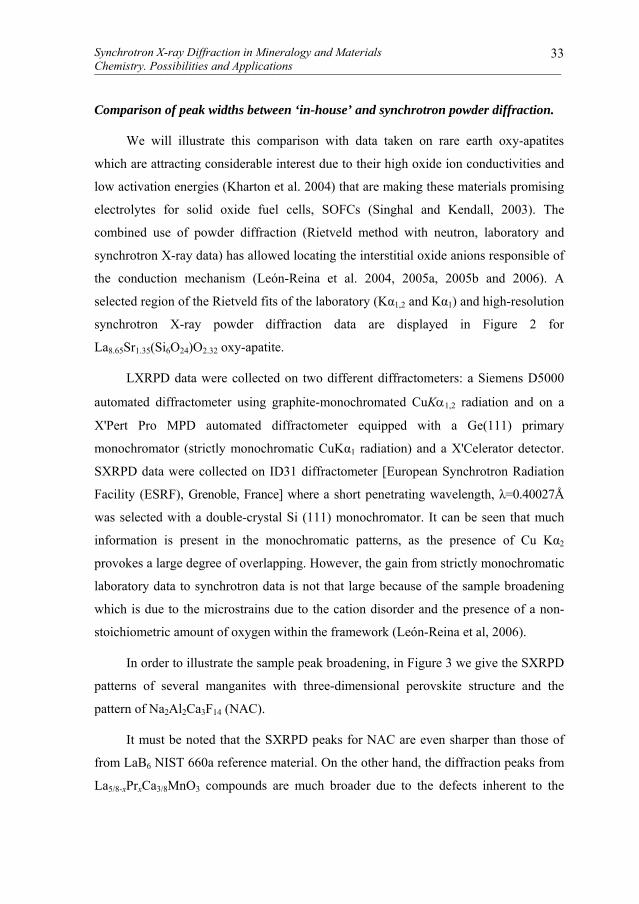
selected region of the Rietveld fits of the laboratory (Kα1,2 and Kα1) and high-resolution
synchrotron X-ray powder diffraction data are displayed in Figure 2 for
La8.65Sr1.35(Si6O24)O2.32 oxy-apatite.
LXRPD data were collected on two different diffractometers: a Siemens D5000
automated diffractometer using graphite-monochromated CuKα1,2 radiation and on a
X'Pert Pro MPD automated diffractometer equipped with a Ge(111) primary
monochromator (strictly monochromatic CuKα1 radiation) and a X'Celerator detector.
SXRPD data were collected on ID31 diffractometer [European Synchrotron Radiation
Facility (ESRF), Grenoble, France] where a short penetrating wavelength, λ=0.40027Å
was selected with a double-crystal Si (111) monochromator. It can be seen that much
information is present in the monochromatic patterns, as the presence of Cu Kα2
provokes a large degree of overlapping. However, the gain from strictly monochromatic
laboratory data to synchrotron data is not that large because of the sample broadening
which is due to the microstrains due to the cation disorder and the presence of a non-
stoichiometric amount of oxygen within the framework (León-Reina et al, 2006).
In order to illustrate the sample peak broadening, in Figure 3 we give the SXRPD
patterns of several manganites with three-dimensional perovskite structure and the
pattern of Na2Al2Ca3F14 (NAC).
It must be noted that the SXRPD peaks for NAC are even sharper than those of
from LaB6 NIST 660a reference material. On the other hand, the diffraction peaks from
La5/8-xPrxCa3/8MnO3 compounds are much broader due to the defects inherent to the
Miguel A. G. Aranda et al. ¯¯¯¯¯¯¯¯¯¯¯¯¯¯¯¯¯¯¯¯¯¯¯¯¯¯¯¯¯¯¯¯¯¯¯¯¯¯¯¯¯¯¯¯¯¯¯¯¯¯¯¯¯¯¯¯¯¯¯¯¯¯¯¯¯¯¯¯¯¯¯¯¯¯¯¯¯¯
34
formation of solid solutions. It must be noted that these compounds were heated at 1450
°C for 12 h in order to increase the crystallinity (Collado et al. 2003). Furthermore, the
microstructures of the samples were investigated through the Williamson-Hall
methodology. The sample broadening is markedly anisotropic and strongly dominated
by microstrains with average values of the Δd/d term of about 10×10-4.
CuKα1,2
CuKα1
synchrotron
CuKα1,2
CuKα1
synchrotron
Figure 2. Observed (crosses), calculated (full line) and difference (bottom) laboratory X-ray diffraction data (Kα1,2 and Kα1) and synchrotron diffraction data for La8.65Sr1.35(Si6O24)O2.32.
Synchrotron X-ray Diffraction in Mineralogy and Materials Chemistry. Possibilities and Applications ¯¯¯¯¯¯¯¯¯¯¯¯¯¯¯¯¯¯¯¯¯¯¯¯¯¯¯¯¯¯¯¯¯¯¯¯¯¯¯¯¯¯¯¯¯¯¯¯¯¯¯¯¯¯¯¯¯¯¯¯¯¯¯¯¯¯¯¯¯¯¯¯¯¯¯¯¯¯
35
16.0 16.1 16.2 16.3 16.4 16.5 16.6
(0 4
0)
(2 0
2)
(2 0
2)
(0 4
0)
NAC
x=0
x=0.35x=0.2
x=5/8
Inte
nsity
(a.u
)
2θ (degrees)
x La5/8-xPrxCa3/8MnO3
Figure 3. Evolution of the (202) and (040) SXRPD peak doublet along the La5/8-xPrxCa3/8MnO3 series. A peak for Na2Al2Ca3F14 (free of sample-broadening) at the same scale is shown for comparison (Collado et al. 2003).
Influence of the radiation in the Rietveld quantitative phase analysis (RQPA).
X-ray techniques have been employed widely throughout the course of
advancement of Archaeological Science. However, it is only relatively recently
synchrotron radiation has been utilized for measurements on archaeological material
(Harbottle et al. 1986; Dillmann et al. 1997). Terra sigillata is certainly the most
famous fine ware of the Roman period showing cast decors achieved with the help of
stamps (sigilla). Several Terra Sigillata pottery samples from different sites have been
characterized by means of X-ray diffraction data, and associated techniques, in order to
know their mineralogical composition.
Phase quantification of the crystalline phases of ancient ceramics is difficult due
to the complexity of phases. Powder diffraction methods using Rietveld refinement
have been used and allowed some polymorphic assay; however results from X-ray
analysis can vary. The quantitative phase analysis of SXRPD data is both precise and
accurate (De la Torre et al. 2003). The precision in the SXRPD data analyses is very
high and also considered to be accurate with the weight fraction. However, SXRPD is
an expensive technique to characterize/certify standard mixtures and routine
Miguel A. G. Aranda et al. ¯¯¯¯¯¯¯¯¯¯¯¯¯¯¯¯¯¯¯¯¯¯¯¯¯¯¯¯¯¯¯¯¯¯¯¯¯¯¯¯¯¯¯¯¯¯¯¯¯¯¯¯¯¯¯¯¯¯¯¯¯¯¯¯¯¯¯¯¯¯¯¯¯¯¯¯¯¯
36
quantitative phase analysis using powder diffraction has to be carried out in-house with
laboratory X-ray devices.
LXRPD
SXRPD
LXRPD
SXRPD
LXRPD
SXRPD
Figure 4. (Left) Observed (crosses), calculated (full line) and difference (bottom) laboratory X-ray diffraction (Kα1) and synchrotron diffraction patterns for TSC001. The inset show a selected region of both patterns. (Top right) Enlarged view of SXRPD data of Terra Sigillata showing the irregular background due to the quasi-crystalline components. (Bottom left) Photograph of the archaeological ceramic.
The existence of glass or amorphous component in Terra Sigillata is
unquestionable (Comodi et al. 2006). The raw mineralogical materials were heated at
moderate temperatures. The decomposition and neo-formation of minerals take place at
these temperatures but surely, the time and/or temperature were not enough to
crystallize all the reactive compositions.
In order to quantify the amorphous content by using the Rietveld method, a
standard with a negligible (or at least well determined) amorphous content is needed.
We use α-Al2O3 as internal standard. De la Torre et al. (2001) reported a protocol to
Synchrotron X-ray Diffraction in Mineralogy and Materials Chemistry. Possibilities and Applications ¯¯¯¯¯¯¯¯¯¯¯¯¯¯¯¯¯¯¯¯¯¯¯¯¯¯¯¯¯¯¯¯¯¯¯¯¯¯¯¯¯¯¯¯¯¯¯¯¯¯¯¯¯¯¯¯¯¯¯¯¯¯¯¯¯¯¯¯¯¯¯¯¯¯¯¯¯¯
37
carry out these types of analyses. Taking into account this protocol we have carried out
a comparison between the amorphous content obtained by SXRPD and LXRPD
Rietveld refinements. Figure 4 shows the fit of SXRPD and LXRPD Rietveld
refinements of a Terra Sigillata sample (TSC001) mixed with α-Al2O3 as internal
standard.
Both fits are very similar, the alumina dilutes the other phases percentage,
however, the high resolution of the SXRPD data and the experimental setup of both
configurations determine different results for the quantitative analysis. From the
overestimation of the α-Al2O3 internal standard, the amount of amorphous / non-
diffracting phase(s) are obtained, see Table 1.
Phase LXRPD / wt% SXRPD / wt%
Quartz 36.0(1) 49.2(3)
Calcite 1.4(1) 0.3(1)
Moscovite 3.8(3) 0.7(2)
Microcline 2.5(2) 2.0(2)
Anortite 1.6(2) -
Hematite 1.3(1) 0.5(1)
Non-diffracting phases 53.2(3) 47.2(6)
Table 1. Rietveld mineralogical compositions including the amorphous content (wt%) obtained by Rietveld quantitative phase analysis of LXRPD and SXRPD data for TSC001 according to De la Torre et al. (2001) methodology for amorphous content determination.
The amorphous content values obtained by both methods are not quite far but
significantly different. The main advantages of a synchrotron source are high brilliance
Miguel A. G. Aranda et al. ¯¯¯¯¯¯¯¯¯¯¯¯¯¯¯¯¯¯¯¯¯¯¯¯¯¯¯¯¯¯¯¯¯¯¯¯¯¯¯¯¯¯¯¯¯¯¯¯¯¯¯¯¯¯¯¯¯¯¯¯¯¯¯¯¯¯¯¯¯¯¯¯¯¯¯¯¯¯
38
(higher flux of photons), very low spectral dispersion, small vertical divergence and
higher energy (smaller radiation length). As a result, absorption effects are minimized
and the improved resolution reduces correlation between parameters. It must be noted
that SXRPD data for TSC001 were collected on ID31 diffractometer with a short
penetrating wavelength, λ=0.2998Å. The sample was loaded in a borosilicate glass
capillary (Ø=1 mm) and rotated during data collection. This experimental setup increases
the irradiated volume and improves the particle statistics.
High-resolution SXRPD for structural analysis.
In the last ten years there has been a great increase in the application of LXRPD
and the Rietveld method to characterize complex systems (Madsen et al. 2001; Scarlett
et al. 2002). Knowledge of appropriate structural description for all the phases
containing a mixture is mandatory in order to fulfill RQPA. Gypsum, CaSO4.2H2O, is a
mineral of great importance since is commonly used as a retarder of cement hydration
process (Taylor, 1997) and is also a by-product from several industrial processes
including gas desulfurisation (Laperche and Bigham, 2002). Gypsum crystallizes in a
unique crystal structure but there are several reported structural descriptions, with
differences focused mainly on thermal parameters. Thus, a revision of the atomic and
thermal parameters of gypsum by Synchrotron X-Ray Powder Diffraction (SXRPD)
was reported by De la Torre et al. (2004). The main aim of that work was to study the
influence of the different structural descriptions for gypsum in RQPA. Single crystal
diffraction is supposed to be the appropriate technique for crystal structure
determination and natural single crystals of gypsum were studied in a diffractometer
equipped with a CCD two-dimensional detector. The microstructure of the crystals gave
wide poorly shaped spots showing sometimes curved streaks around the spots, which
made the integration process very difficult, yielding a low quality structure. These
results were mainly due to both intrinsic structural disorder and difficulty of obtaining
good single crystal samples. These difficulties were solved by using a ground single
crystal of gypsum and high resolution SXRPD.
Synchrotron X-ray Diffraction in Mineralogy and Materials Chemistry. Possibilities and Applications ¯¯¯¯¯¯¯¯¯¯¯¯¯¯¯¯¯¯¯¯¯¯¯¯¯¯¯¯¯¯¯¯¯¯¯¯¯¯¯¯¯¯¯¯¯¯¯¯¯¯¯¯¯¯¯¯¯¯¯¯¯¯¯¯¯¯¯¯¯¯¯¯¯¯¯¯¯¯
39
Polycrystalline CaSO4.2H2O was prepared by carefully grinding a piece of an
Italian single crystal obtained from the Natural History Museum of Florence. The
SXRPD pattern for this powdered gypsum was collected on the BM16 diffractometer of
ESRF, on transmission configuration. The sample was loaded in a borosilicate glass
capillary (Ø=1.0 mm) and rotated during data collection which enhance particle
statistics. The wavelength λ=0.540092(1) Å (22.96 keV) was selected with a double-
crystal Si (111) monochromator.
The Rietveld refinement of gypsum pattern was carried out with the ICSD-27221
structure as starting model. This model was determined by neutron powder diffraction.
The intensities in the synchrotron powder pattern can be reliable fitted although the
peak shape displays anisotropic peak broadening which was corrected. The Rietveld
results for gypsum were a=5.67546(3) Å, b=15.19763(9) Å, c=6.52291(3) Å,
β=118.479(1) º, V=494.536(5) Å3 and Z=4 (s.g. I 2/c) with RWP=5.39% and RF=1.64%.
The SXRPD Rietveld plot for gypsum is shown in Figure 5. The inset shows the fit of
high angle range of this pattern.
High resolution synchrotron X-ray thermodiffraction.
The vast majority of XRPD studies are conducted on samples at ambient
temperature. However, high temperature XRPD measurements are of great interest for
some applications, such as following thermal expansion of solids or structural changes
with temperature. These studies can be fulfilled on synchrotrons gaining high resolution
and high flux. For instance, samples can be loaded in glass capillaries and heated using
a hot-air blower up to 1200 K. Figure 6 shows a photograph of the experimental setup
placed on ID31 diffractometer of ESRF, used to study thermal behavior of an inorganic
solid, i.e. La9.750.25(Ge6O24)O2.62 oxy-apatite. The wavelength, λ=0.620745 Å (20.0
KeV), was selected with a double-crystal Si(111) monochromator.
La9.75 0.25(Ge6O24)O2.62 oxy-apatite shows a phase transition from triclinic to
hexagonal symmetry at approximately 1020 K that has been characterized by high
temperature SXRPD data. The patterns for this sample did not change significantly up
Miguel A. G. Aranda et al. ¯¯¯¯¯¯¯¯¯¯¯¯¯¯¯¯¯¯¯¯¯¯¯¯¯¯¯¯¯¯¯¯¯¯¯¯¯¯¯¯¯¯¯¯¯¯¯¯¯¯¯¯¯¯¯¯¯¯¯¯¯¯¯¯¯¯¯¯¯¯¯¯¯¯¯¯¯¯
40
to 800 K but from 873 to 1073 K the degree of peak-splitting decreases and the
apparent intensity of the very sharp peaks notably increases.
CaSO42H2O SXRPD Hist 1Lambda 0.5401 A, L-S cycle 736 Obsd. and Diff. Profiles
2-Theta, deg
Coun
ts
10.0 20.0 30.0
X10E
4
0.0
0.
5
1.0
1.
5
2.0
CaSO42H2O SXRPD Hist 1Lambda 0.5401 A, L-S cycle 736 Obsd. and Diff. Profiles
2-Theta, deg Co
unts
15.0 20.0 25.0 30.0 35.0 X1
0E 3
0.
0
0.5
1.
0
1.5
2.
0
CaSO42H2O SXRPD Hist 1Lambda 0.5401 A, L-S cycle 736 Obsd. and Diff. Profiles
2-Theta, deg
Coun
ts
10.0 20.0 30.0
X10E
4
0.0
0.
5
1.0
1.
5
2.0
CaSO42H2O SXRPD Hist 1Lambda 0.5401 A, L-S cycle 736 Obsd. and Diff. Profiles
2-Theta, deg Co
unts
15.0 20.0 25.0 30.0 35.0 X1
0E 3
0.
0
0.5
1.
0
1.5
2.
0
Figure 5. SXRPD Rietveld plot (θ=0.54 Å) for CaSO4.2H2O. The inset shows the high
angle range of this pattern (De la Torre et al. 2004).
Figure 6. Experimental setup for High Resolution Synchrotron X-Ray Thermodiffraction using a hot-air blower at ID31 diffractometer of ESRF (Grenoble, France).
Synchrotron X-ray Diffraction in Mineralogy and Materials Chemistry. Possibilities and Applications ¯¯¯¯¯¯¯¯¯¯¯¯¯¯¯¯¯¯¯¯¯¯¯¯¯¯¯¯¯¯¯¯¯¯¯¯¯¯¯¯¯¯¯¯¯¯¯¯¯¯¯¯¯¯¯¯¯¯¯¯¯¯¯¯¯¯¯¯¯¯¯¯¯¯¯¯¯¯
41
To illustrate that, Figure 7 shows a selected region (18-19.6º /2θ) of the SXRPD
patterns between 873 and 1173 K for this sample where a phase transition is clearly
visible between 973 and 1073 K. Below that transition, the SXRPD patterns were
indexed on a triclinic cell, with edges at 873 K: a=9.9764(2) Å, b=9.9696(1) Å and
c=7.3313(1) Å. Above the transition, the SXRPD patterns were indexed on a hexagonal
cell, with edges at 1073 K: a=b=9.9855(1) Å and c=7.3466(1) Å. However, the
triclinic-to-hexagonal phase transition on heating at ~1020 K is not the only effect
observed in the thermal evolution of the cell parameters of this compound, Figure 7. At
temperatures close to 600 K, an anomaly is also observed in all unit cell parameters.
This was firstly reported by León-Reina et al. (2007) and the lack of resolution of the
laboratory powder diffraction data made impossible to report this tiny anomalous from
LXRPD data.
250 500 750 1000 1250
620
624
628
632
636
V/Å
3
T/K18.0 18.4 18.8 19.2 19.6
873
973
1073
1173
2θ/º
T/K
(a) (b)
250 500 750 1000 1250
620
624
628
632
636
V/Å
3
T/K18.0 18.4 18.8 19.2 19.6
873
973
1073
1173
2θ/º
T/K
(a) (b)
Figure 7. (a) Selected HT-SXRPD patterns for La9.75 0.25(Ge6O24)O2.62. (b) Variation of the unit cell volume with temperature for the same. Adapted from León-Reina et al. (2007).
High resolution synchrotron X-ray thermodiffraction and microstructure.
Another example of synchrotron powder thermodiffractometry may be the
thermal evolution of biogenic inorganic compounds. Not only thermal expansion but
microstructural details can be investigated as function of temperature including both the
Miguel A. G. Aranda et al. ¯¯¯¯¯¯¯¯¯¯¯¯¯¯¯¯¯¯¯¯¯¯¯¯¯¯¯¯¯¯¯¯¯¯¯¯¯¯¯¯¯¯¯¯¯¯¯¯¯¯¯¯¯¯¯¯¯¯¯¯¯¯¯¯¯¯¯¯¯¯¯¯¯¯¯¯¯¯
42
coherent diffraction domain sizes and the microstrains. Figure 8 shows the three
polymorphs of calcium carbonate: calcite, aragonite and vaterite.
Figure 8. Upper: Overview of macrocyclic polyacids employed in investigations of the growth of calcium carbonate beneath monolayers. Polyacids are arranged according to increasing (negative) charge density, which is expressed here as the number of carboxylate residues per unit area. Experimental ranges of charge density leading to a characteristic calcium carbonate crystal habit are indicated with braces. Lower: Scheme of charge density controlling the inorganic crystal polymorph that forms beneath the monolayer. For calcium carbonate, a switch from thermodynamically stable calcite to less-stable aragonite or vaterite occurs at a charge density ranking from 3.5 to 4.5 COO-/nm2. From Volkemer (2007).
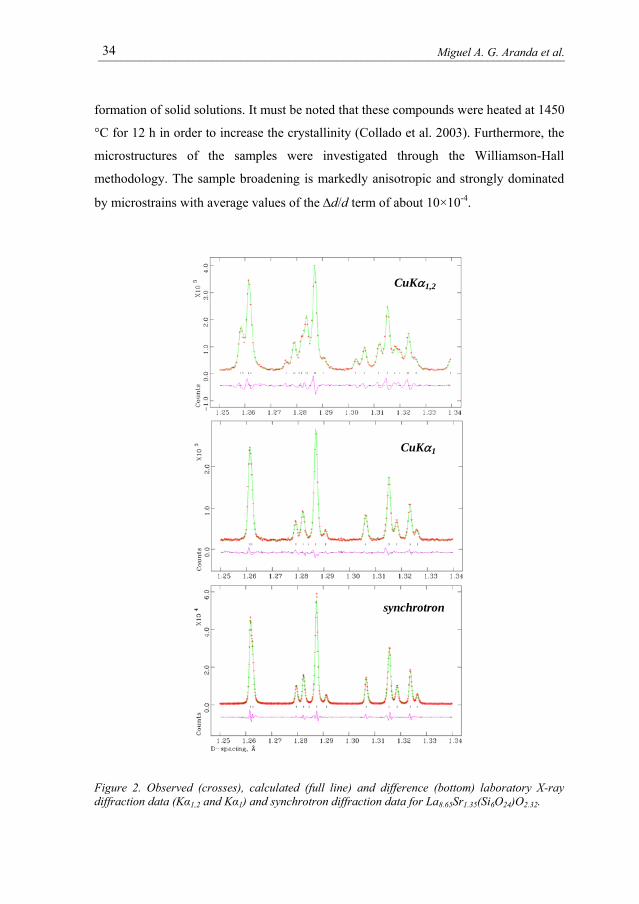
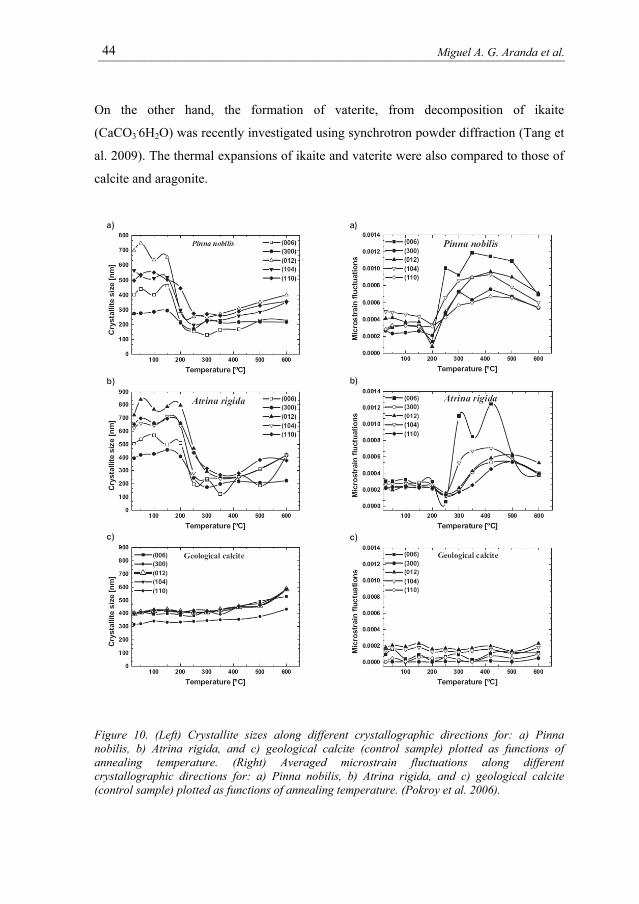
The thermal evolution of these polymorphs is quite different and furthermore, the
thermal evolution of a given polymorph is also dependent of the organism that
produced the material as the organic fraction binding the inorganic crystals plays a key
role in the thermal evolution.
A intriguing result of a SXRPD study is the observation of a remarkable
broadening of diffraction peaks in both biogenic calcite crystals annealed at
Synchrotron X-ray Diffraction in Mineralogy and Materials Chemistry. Possibilities and Applications ¯¯¯¯¯¯¯¯¯¯¯¯¯¯¯¯¯¯¯¯¯¯¯¯¯¯¯¯¯¯¯¯¯¯¯¯¯¯¯¯¯¯¯¯¯¯¯¯¯¯¯¯¯¯¯¯¯¯¯¯¯¯¯¯¯¯¯¯¯¯¯¯¯¯¯¯¯¯
43
temperatures above 200 °C, and a correlation of this broadening with a substantial
relaxation of the anisotropic lattice distortions An example of the broadening effect is
given in Figure 9, in which the (012) diffraction profiles taken from Pinna nobilis
powders subjected to isochronous annealing at elevated temperatures are plotted. The
broadening effect is strong enough to be appreciated by the naked eye. The analysis of
the SXRPD peak widths with temperature yielded the crystal sizes and the microstrains
displayed in Figure 10 (Pokroy et al. 2006).
Figure 9. The high resolution (012) SXRPD profiles taken from the Pinna nobilis powder samples subjected to isochronous annealing at elevated temperatures (Pokroy et al. 2006).
Atomic positions in geological aragonite and biogenic aragonite, obtained from
several mollusk shells, were also measured by the same research group (Pokroy et al.
2007). In this case, high-resolution neutron diffraction allows the accurate
determination of the positions of C and O, in the aragonite structure (Pokroy et al.
2007).
Comparable analysis of atomic positions revealed changes in some bond lengths
and atomic configurations in biogenic specimens with respect to geological aragonite.
Miguel A. G. Aranda et al. ¯¯¯¯¯¯¯¯¯¯¯¯¯¯¯¯¯¯¯¯¯¯¯¯¯¯¯¯¯¯¯¯¯¯¯¯¯¯¯¯¯¯¯¯¯¯¯¯¯¯¯¯¯¯¯¯¯¯¯¯¯¯¯¯¯¯¯¯¯¯¯¯¯¯¯¯¯¯
44
On the other hand, the formation of vaterite, from decomposition of ikaite
(CaCO3.6H2O) was recently investigated using synchrotron powder diffraction (Tang et
al. 2009). The thermal expansions of ikaite and vaterite were also compared to those of
calcite and aragonite.
Figure 10. (Left) Crystallite sizes along different crystallographic directions for: a) Pinna nobilis, b) Atrina rigida, and c) geological calcite (control sample) plotted as functions of annealing temperature. (Right) Averaged microstrain fluctuations along different crystallographic directions for: a) Pinna nobilis, b) Atrina rigida, and c) geological calcite (control sample) plotted as functions of annealing temperature. (Pokroy et al. 2006).
Synchrotron X-ray Diffraction in Mineralogy and Materials Chemistry. Possibilities and Applications ¯¯¯¯¯¯¯¯¯¯¯¯¯¯¯¯¯¯¯¯¯¯¯¯¯¯¯¯¯¯¯¯¯¯¯¯¯¯¯¯¯¯¯¯¯¯¯¯¯¯¯¯¯¯¯¯¯¯¯¯¯¯¯¯¯¯¯¯¯¯¯¯¯¯¯¯¯¯
45
High-resolution very high-temperature synchrotron X-ray powder diffraction.
The motivation behind an in-situ XRPD experiment may be to study phase
reactivity or stability. The clinkerisation of standard Portland clinkers has been
extensively investigated over the years (Taylor, 1997). This is a complex process as it
transformations on heating, and polymorphic stabilization and crystallization on
cooling. Main reactions/processes occur at high temperature, from 1400 to 1800 K.
Figure 11. CaO unit cell volume vs. temperature from the Rietveld refinements of high temperature SXRPD study (from De la Torre et al. 2007). Top inset, illustration of the mirror furnace where L stands for halogen lamps and C for the Pt capillary. Bottom inset, photograph of some components of the heating system.
The use of high resolution SXRPD is highly desirable for studying such reactions.
Using highly energetic X-rays minimizes the absorption, which allows the use of Pt
capillaries to perform high temperature in-situ studies (Moussa et al. 2003).
Transmission geometry and rotating capillary lead to the illumination of the full sample
avoiding poor particle statistics that is key when liquid phase appears. De la Torre et al.
(2007) reported an in-situ SXRPD study on clinkerisation of high-belite clinkers. They
collected SXRPD patterns in transmission geometry on ID31 diffractometer of ESRF,
Miguel A. G. Aranda et al. ¯¯¯¯¯¯¯¯¯¯¯¯¯¯¯¯¯¯¯¯¯¯¯¯¯¯¯¯¯¯¯¯¯¯¯¯¯¯¯¯¯¯¯¯¯¯¯¯¯¯¯¯¯¯¯¯¯¯¯¯¯¯¯¯¯¯¯¯¯¯¯¯¯¯¯¯¯¯
46
(Grenoble, France) using a high energetic wavelength of λ=0.300715(9) Å (41.22 keV)
selected with a double-crystal Si (111) monochromator. Preheated raw materials were
introduced in Pt tubes. These Pt capillaries were rotated during data collection..
1200 1300 1400 1500 1600 17000
10
20
30
40
50
60
70
80
wt%
T / K1200 1300 1400 1500 1600 1700
0
10
20
30
40
50
60
70
80
wt%
T / K1200 1300 1400 1500 1600 1700
0
10
20
30
40
50
60
70
80
wt%
T / K1200 1300 1400 1500 1600 1700
0
10
20
30
40
50
60
70
80
wt%
T / K1200 1300 1400 1500 1600 1700
0
10
20
30
40
50
60
70
80
wt%
T / K1200 1300 1400 1500 1600 1700
0
10
20
30
40
50
60
70
80
wt%
T / K1200 1300 1400 1500 1600 1700
0
10
20
30
40
50
60
70
80
wt%
T / K1200 1300 1400 1500 1600 1700
0
10
20
30
40
50
60
70
80
wt%
T / K
Figure 12. Rietveld quantitative phase analysis results versus temperature on heating for a high belite clinker. Symbols: CaO (square), �'L-C2S (rhombus), �'H-C2S (open triangle), C4AF (star), C3A (open circle), �-C2S (solid circle), C3S (solid triangle) and liquid phase (solid square). Adapted from de la Torre et al. (2007).
The data acquisition strategy was to collect four patterns for 15 minutes each
(overall counting time 60 min) at the selected temperature to have very good statistics
over the angular range 1.0-20o (in 2θ). A parabolic mirror furnace, inset in Figure 4,
with three halogen lamps, was used to heat the samples between 1200 K and 1700 K
(Moussa et al. 2003). A variable voltage applied to the halogen lamps coarsely
controlled the temperature. The real (reported) temperatures were obtained from the
analysis of Pt peak diffraction positions (Edwards et al. 1951), and corroborated by
inspecting the unit cell of CaO in the high-temperature patterns. It must be noted that
this phase does not accept a large amount of dopants, which would also modify the unit
cell volume. Figure 4 displays the CaO unit cell volumes as a function of the
temperature. The volumetric lattice thermal expansion coefficient obtained, under the
isotropic thermal expansion approximation, agrees well with the reported bulk linear
Synchrotron X-ray Diffraction in Mineralogy and Materials Chemistry. Possibilities and Applications ¯¯¯¯¯¯¯¯¯¯¯¯¯¯¯¯¯¯¯¯¯¯¯¯¯¯¯¯¯¯¯¯¯¯¯¯¯¯¯¯¯¯¯¯¯¯¯¯¯¯¯¯¯¯¯¯¯¯¯¯¯¯¯¯¯¯¯¯¯¯¯¯¯¯¯¯¯¯
47
expansion for CaO (Grain and Campbell, 1962). The data scattering in Figure 11 is
small, which reflects that the refinements have good precision and temperatures have
been properly determined
In-situ reactivity followed by synchrotron X-ray powder diffraction.
Using this experimental setup, it was possible to follow the clinkerisation process
of a high-belite clinker up to 1673 K. RQPA were obtained for selected compositions at
a wide range of temperatures. Figure 12 displays the RQPA results as a function of the
temperature on heating for a high-belite clinker, as an example. This study yielded to
determined, the temperature of full clinkerization, i.e. following the complete
disappearance of CaO percentage (open square). On the other hand, the formation and
melt (on heating) of aluminate phases [cement nomenclature, C3A (open circle) and
C4AF (star)] were also quantified, as well as recrystallization of these phases from the
melt on cooling. Polymorphic transformations of dicalcium silicate at high temperature
were also studied. In this work, a methodology to infer the amount of liquid/melted
phase that appeared at high temperature was presented.
The characterization of chemical reactions by using X-ray diffraction techniques
is not a easy task, as between the reagents and products can exist differences related to
crystallinity and chemical nature. As an example of these features, the hydration of
cement pastes can be mentioned. The cements are complex materials due to the
presence of many crystalline phases and, moreover, some of these components display
polymorphism. Attempts to characterize the hydration processes of cements using
XRPD have been published in the last few years (Scrivener et al. 2004; Clark et al.
1995). The results obtained have shown the complexity of the hydration reactions
mechanism even for pure synthetic phases (Jupe et al. 1996). This complexity does not
derive solely from the great variety of hydrated compounds, amorphous and crystalline,
but also because certain products which are difficult to identify due to their low
crystallinity, polytypism and variations in composition (e.g. hydration degree) with the
corresponding changes in their powder patterns (both in the position and intensity of the
Miguel A. G. Aranda et al. ¯¯¯¯¯¯¯¯¯¯¯¯¯¯¯¯¯¯¯¯¯¯¯¯¯¯¯¯¯¯¯¯¯¯¯¯¯¯¯¯¯¯¯¯¯¯¯¯¯¯¯¯¯¯¯¯¯¯¯¯¯¯¯¯¯¯¯¯¯¯¯¯¯¯¯¯¯¯
48
peaks). The application of laboratory X-ray powder diffraction (LXRPD) to this system
is not straightforward for the following reasons: (a) there are many phases, usually
more than five; (b) the small mean penetration of X-ray (~ 30μm for Cu Kα) implies
that a thin layer only is analyzed in the Bragg-Brentano θ/2θ geometry leading to poor
particle statistics; (c) some phases crystallize as plaquets which show preferred
orientation effects; and (d) some phases can crystallize as several polymorphs (Taylor,
1997) that must be indentified a priori.
Penetrating SXRPD overcomes most of these drawbacks. As the X-rays are
highly energetic, the absorption is minimized, which helps points (a) and (b) above
mentioned. On the other hand, working in transmission (rotating capillary geometry),
the full sample is analyzed and preferred orientation effects, point (c), is not a problem.
High-resolution data also help to minimize the problems stated in (d).
Furthermore, hydration process is time dependent so the use of synchrotron
radiation is very valuable. The initial works were energy-dispersive (Jupe et al. 1996)
but these studies have low d-spacing resolution (meanwhile, high d-spacing resolution
is needed for analyzing quantitatively complex mixtures) and the Rietveld methodology
could not be fulfilled. However, the new detectors, i.e. area detectors, let to perform in
situ diffraction experiments with very good angular and time resolutions (Merlini et al.
2007; Jupe et al. 2007). Following with the previous example, SXRPD in-situ hydration
study was performed at BM08 [Italian CRG “GILDA”] beamline of ESRF (Grenoble,
France) in Debye-Scherrer (transmission) configuration for an aluminum-rich belite
sulfoaluminate cements. An image plate (IP) detector (Meneghini et al. 2001) was used
working in two configurations: i) Translating mode (for the first four hours of
hydration): the IP moves behind two slits with a constant speed and the diffraction
pattern is recorded as a function of time, see Figure 13
The slits select a vertical slice of the diffraction rings. The translation speed and
the slit size can be chosen to fit the experimental requirements. ii) 2D pattern (for later
ages, i.e. >4 hours): the slits are removed and the whole diffraction rings are collected
during 5 min, see Figure 13b. The images recorded (in both configurations) in the IP
detector were recovered using a Fuji BAS2500 laser scanner (16 bit/pixel with a
Synchrotron X-ray Diffraction in Mineralogy and Materials Chemistry. Possibilities and Applications ¯¯¯¯¯¯¯¯¯¯¯¯¯¯¯¯¯¯¯¯¯¯¯¯¯¯¯¯¯¯¯¯¯¯¯¯¯¯¯¯¯¯¯¯¯¯¯¯¯¯¯¯¯¯¯¯¯¯¯¯¯¯¯¯¯¯¯¯¯¯¯¯¯¯¯¯¯¯
49
minimum pixel size of 50×50 μm). The SXRPD patterns obtained in translating mode
were extracted in 5 min slices using original software available at BM08. Powder
patterns from 2D images were obtained by integration of the rings using FIT2D
software (Hammersley et al. 1996).
Using this experimental setup, phase assemblage evolution with time for belite
cements was determined by normalization of Rietveld results which takes into account
free water and amorphous phases that were appearing during the hydration. RQPA of
synchrotron diffraction data for these cement allowed establishing reactivity the
hydration behavior of different phases (Cuberos et al. 2009).
Figure 13. Illustrations of the SXRPD experimental setups. The scanned images recorded at the image plate detector in a) translating mode and b) 2D full pattern. On the right, raw SXRPD patterns after the two type of integrations.
μ-SR-XRPD in transmission geometry with squared or rectangular spot sizes is
best suited for the study of the layered structure of the paint layers. Cross sections of the
Miguel A. G. Aranda et al. ¯¯¯¯¯¯¯¯¯¯¯¯¯¯¯¯¯¯¯¯¯¯¯¯¯¯¯¯¯¯¯¯¯¯¯¯¯¯¯¯¯¯¯¯¯¯¯¯¯¯¯¯¯¯¯¯¯¯¯¯¯¯¯¯¯¯¯¯¯¯¯¯¯¯¯¯¯¯
50
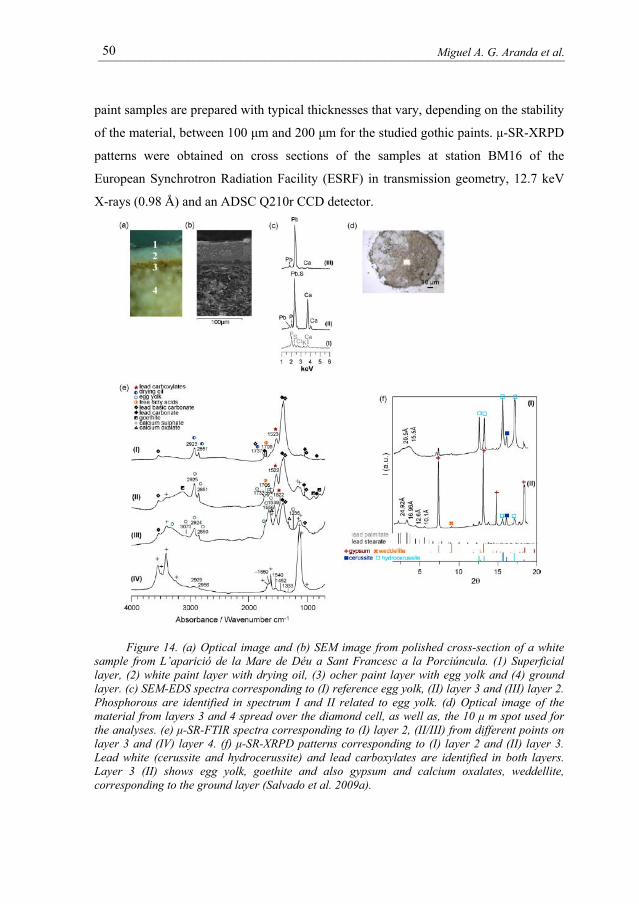
paint samples are prepared with typical thicknesses that vary, depending on the stability
of the material, between 100 μm and 200 μm for the studied gothic paints. μ-SR-XRPD
patterns were obtained on cross sections of the samples at station BM16 of the
European Synchrotron Radiation Facility (ESRF) in transmission geometry, 12.7 keV
X-rays (0.98 Å) and an ADSC Q210r CCD detector.
Figure 14. (a) Optical image and (b) SEM image from polished cross-section of a white sample from L’aparició de la Mare de Déu a Sant Francesc a la Porciúncula. (1) Superficial layer, (2) white paint layer with drying oil, (3) ocher paint layer with egg yolk and (4) ground layer. (c) SEM-EDS spectra corresponding to (I) reference egg yolk, (II) layer 3 and (III) layer 2. Phosphorous are identified in spectrum I and II related to egg yolk. (d) Optical image of the material from layers 3 and 4 spread over the diamond cell, as well as, the 10 μ m spot used for the analyses. (e) μ-SR-FTIR spectra corresponding to (I) layer 2, (II/III) from different points on layer 3 and (IV) layer 4. (f) μ-SR-XRPD patterns corresponding to (I) layer 2 and (II) layer 3. Lead white (cerussite and hydrocerussite) and lead carboxylates are identified in both layers. Layer 3 (II) shows egg yolk, goethite and also gypsum and calcium oxalates, weddellite, corresponding to the ground layer (Salvado et al. 2009a).
Synchrotron X-ray Diffraction in Mineralogy and Materials Chemistry. Possibilities and Applications ¯¯¯¯¯¯¯¯¯¯¯¯¯¯¯¯¯¯¯¯¯¯¯¯¯¯¯¯¯¯¯¯¯¯¯¯¯¯¯¯¯¯¯¯¯¯¯¯¯¯¯¯¯¯¯¯¯¯¯¯¯¯¯¯¯¯¯¯¯¯¯¯¯¯¯¯¯¯
51
A beam size of about 10-50 micrometers is an adequate compromise between the
typical size of crystals and the thickness of the layers. A smaller beam may lead to a
spotty single crystal-like X-ray diffraction pattern, dominated by only some of the
compounds, a bigger beam may not be able to separate the compounds present in the
different layers. For obtaining thin cuts of cross sections of the samples, a slice of about
200 µm thick was cut from the polished resin block. Figures 14 and 15 show two
examples of the type of analyses that can be carried out.
Figure 15. (a) Optical image and (b) SEM image from polished cross-section of a painting by Luis Dalmau. (c) μ-SR-XRPD patterns corresponding to the azurite and lapis lazuli layers in (b). The paint layer is formed by a sequence of layers containing particles of increasing particle size from the surface to the ground. The first two layers (25 µm and 65 µm thick respectively) contain lapis lazuli particles and drying oil; the third layer contain coarser lapis lazuli particles mixed with some particles of lead white, drying oil and lead carboxylates. Below, a fourth layer (50 µm thick) containing coarse angular azurite -Cu3(CO3)2(OH)2- particles, lead white, drying oil and some lead and copper carboxylates; (Salvado et al. 2009b).
Miguel A. G. Aranda et al. ¯¯¯¯¯¯¯¯¯¯¯¯¯¯¯¯¯¯¯¯¯¯¯¯¯¯¯¯¯¯¯¯¯¯¯¯¯¯¯¯¯¯¯¯¯¯¯¯¯¯¯¯¯¯¯¯¯¯¯¯¯¯¯¯¯¯¯¯¯¯¯¯¯¯¯¯¯¯
52
Synchrotron X-ray single crystal diffraction (SXR-SCD).
Scientist focused on material science must straightforward the intriguing
fundamental problem of understanding the structures of new inorganic materials. For
this goal, very precise crystal structures including charge density studies are needed.
Hence, very accurate single crystal data collected up to very small d-spacing are needed
and synchrotron radiation is best suited for this purpose.
Synchrotron X-ray single crystal diffraction (λ=0.724434 Å; 17.1 KeV)
experiments were performed at BM01A beamline of ESRF, using a multipurpose
single-crystal diffractometer KUMA KM6-CH with a 135 mm CCD area detector
(Oxford Diffraction, ONYX) and with a crystal-to-detector distance of 100 mm. Data
were collected at 90 K by means of an Oxford Cryostream cold nitrogen blower. The
benefits of using synchrotron radiation are highlighted by quality of data and low
temperature setup minimized the thermal vibration contributions to anisotropic atomic
displacement parameters.
We illustrate this application with the accurate crystal structure of stable
inorganic electrides. In these materials, electrons are occupying anionic sites. Electrides
derived from nanoporous mayenites present interesting properties (Matsuishi et al.
2003) including electrical conductivity and transparency. Palacios et al. (2008) reported
an accurate structural study for three members of the series [Ca12Al14O32]O1-δe2δ (δ = 0,
0.15, and 0.45), from low-temperature SXR-SCD
The electride structural description reported by Palacios et al. (2007) was based
on 422 reflections (393 observed with I > 2σ(I); 0.71 Å resolution limit) from
laboratory X-ray data (Mo Kα). Structure based on synchrotron single crystal
diffraction (Palacios et al. 2008) was determined with 1640 unique reflections
(averaged out from more than 30000 measured reflections), with more than 1600 being
considered as observed (criterion: I > 4σ(I); 0.45 Å resolution limit). The crystal
structures for three electron-loaded nanoporous mayenite samples, Ca12Al14O33,
Ca12Al14O32.85e0.3, and Ca12Al14O32.55e0.9, were reported from the data obtained with the
above experimental setup. The complex structural disorder imposed by the presence of
Synchrotron X-ray Diffraction in Mineralogy and Materials Chemistry. Possibilities and Applications ¯¯¯¯¯¯¯¯¯¯¯¯¯¯¯¯¯¯¯¯¯¯¯¯¯¯¯¯¯¯¯¯¯¯¯¯¯¯¯¯¯¯¯¯¯¯¯¯¯¯¯¯¯¯¯¯¯¯¯¯¯¯¯¯¯¯¯¯¯¯¯¯¯¯¯¯¯¯
53
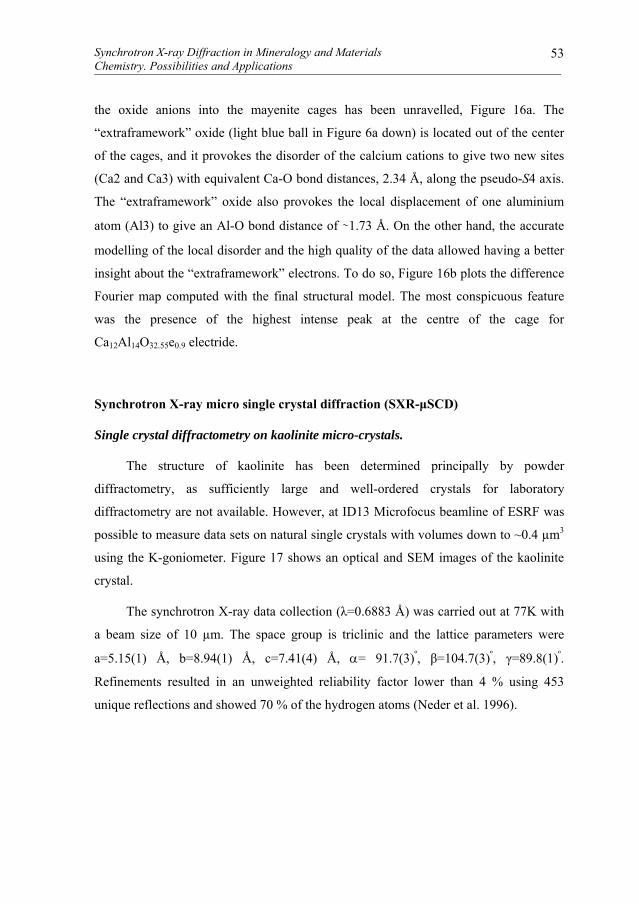
the oxide anions into the mayenite cages has been unravelled, Figure 16a. The
“extraframework” oxide (light blue ball in Figure 6a down) is located out of the center
of the cages, and it provokes the disorder of the calcium cations to give two new sites
(Ca2 and Ca3) with equivalent Ca-O bond distances, 2.34 Å, along the pseudo-S4 axis.
The “extraframework” oxide also provokes the local displacement of one aluminium
atom (Al3) to give an Al-O bond distance of ∼1.73 Å. On the other hand, the accurate
modelling of the local disorder and the high quality of the data allowed having a better
insight about the “extraframework” electrons. To do so, Figure 16b plots the difference
Fourier map computed with the final structural model. The most conspicuous feature
was the presence of the highest intense peak at the centre of the cage for
Ca12Al14O32.55e0.9 electride.
Synchrotron X-ray micro single crystal diffraction (SXR-μSCD)
Single crystal diffractometry on kaolinite micro-crystals.
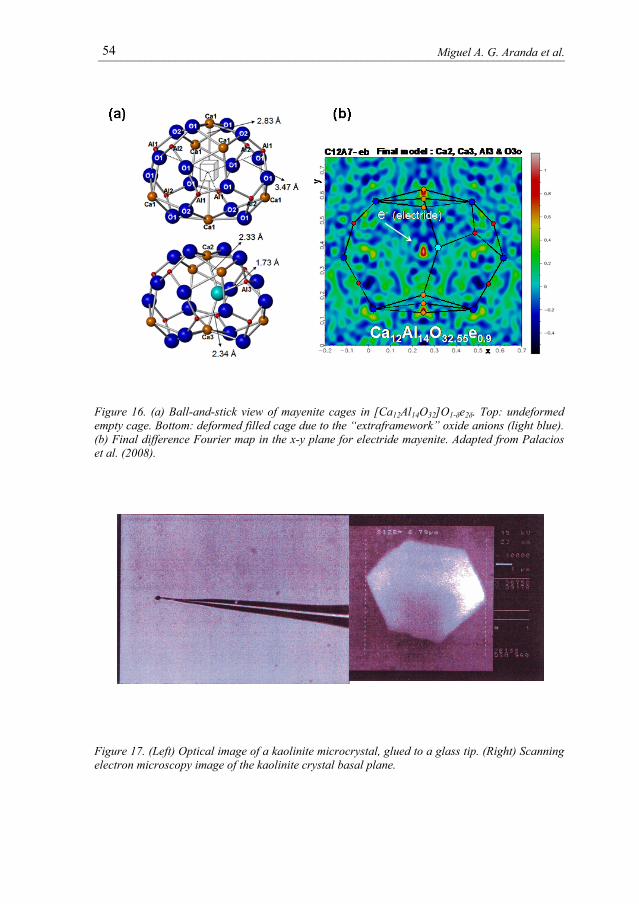
The structure of kaolinite has been determined principally by powder
diffractometry, as sufficiently large and well-ordered crystals for laboratory
diffractometry are not available. However, at ID13 Microfocus beamline of ESRF was
possible to measure data sets on natural single crystals with volumes down to ~0.4 µm3
using the K-goniometer. Figure 17 shows an optical and SEM images of the kaolinite
crystal.
The synchrotron X-ray data collection (λ=0.6883 Å) was carried out at 77K with
a beam size of 10 µm. The space group is triclinic and the lattice parameters were
Refinements resulted in an unweighted reliability factor lower than 4 % using 453
unique reflections and showed 70 % of the hydrogen atoms (Neder et al. 1996).
Miguel A. G. Aranda et al. ¯¯¯¯¯¯¯¯¯¯¯¯¯¯¯¯¯¯¯¯¯¯¯¯¯¯¯¯¯¯¯¯¯¯¯¯¯¯¯¯¯¯¯¯¯¯¯¯¯¯¯¯¯¯¯¯¯¯¯¯¯¯¯¯¯¯¯¯¯¯¯¯¯¯¯¯¯¯
54
Figure 16. (a) Ball-and-stick view of mayenite cages in [Ca12Al14O32]O1-δe2δ. Top: undeformed empty cage. Bottom: deformed filled cage due to the “extraframework” oxide anions (light blue). (b) Final difference Fourier map in the x-y plane for electride mayenite. Adapted from Palacios et al. (2008).
Figure 17. (Left) Optical image of a kaolinite microcrystal, glued to a glass tip. (Right) Scanning electron microscopy image of the kaolinite crystal basal plane.
Synchrotron X-ray Diffraction in Mineralogy and Materials Chemistry. Possibilities and Applications ¯¯¯¯¯¯¯¯¯¯¯¯¯¯¯¯¯¯¯¯¯¯¯¯¯¯¯¯¯¯¯¯¯¯¯¯¯¯¯¯¯¯¯¯¯¯¯¯¯¯¯¯¯¯¯¯¯¯¯¯¯¯¯¯¯¯¯¯¯¯¯¯¯¯¯¯¯¯
55
Single crystal diffractometry on metal-organic-framework micro-crystals.
This methodology has been adapted for the full analysis of tiny crystals in a
microdiffraction set-up for the collection of Bragg intensities, which pushes down the
limit to the micrometer scale by using a microfocused X-ray beam of 1 μm. Figure 18
shows the microcrystals of porous metal–organic frameworks (MOFs). From a
microcrystal, the full structure was obtained using SHELXTL by direct methods in the
space group P -62c (a=b=21.520(5) Å, c=13.021(1) Å, V=5222.3(1) Å3; Volkringer et
al. 2007).
a)
b)
Figure 18. a) Scanning electron micrograph of hexagonal needle-like single crystals of MIL-110 (MOF). A crystal of 3×3×10 μm size was used for synchrotron-radiation microdiffraction. b) View along the c axis of the resulting crystal structure of MIL-110 showing the channels.
Miguel A. G. Aranda et al. ¯¯¯¯¯¯¯¯¯¯¯¯¯¯¯¯¯¯¯¯¯¯¯¯¯¯¯¯¯¯¯¯¯¯¯¯¯¯¯¯¯¯¯¯¯¯¯¯¯¯¯¯¯¯¯¯¯¯¯¯¯¯¯¯¯¯¯¯¯¯¯¯¯¯¯¯¯¯
In material science and mineralogy exists many examples where obtaining a
single-crystal specimen is a very difficult or impossible task. In such cases structural
refinement may be impossible. However, several methods for non-destructive structural
characterization of the individual grains inside bulk materials have been developed
(Schmidt et al. 2003 and references inside). As an example, a method for simultaneous
structural refinement of up to several hundred grains inside powders or polycrystals is
presented.
The method is based on the use of hard X-rays and on indexing algorithms, where
grain orientations are found by scanning in Euler space. Here, we have selected an
example where the specimen was a sintered plate of pure Al2O3, which had been
annealed at 1773 K for 24 h to produce a material with virtually no texture, an average
grain diameter of 20 μm, as determined by SEM. The plate was 180 μm thick.
Conventional experimental setups and refinement programs for single-crystal work
could be applied, Figure 19 (left) shows one of the images taken at the θ range 30.55º to
30.65º. 57 of the largest grains were refined with respect to the Al z and O x positions
as well as the isotropic atomic displacement parameters, Figure 19 (right).
Figure 19. (Left) Photograph of raw data obtained (θ range 30.55º to 30.65º). (Right) Table 1: from the original paper where the refined atomic parameters were given; (Schmidt et al. 2003).
Synchrotron X-ray Diffraction in Mineralogy and Materials Chemistry. Possibilities and Applications ¯¯¯¯¯¯¯¯¯¯¯¯¯¯¯¯¯¯¯¯¯¯¯¯¯¯¯¯¯¯¯¯¯¯¯¯¯¯¯¯¯¯¯¯¯¯¯¯¯¯¯¯¯¯¯¯¯¯¯¯¯¯¯¯¯¯¯¯¯¯¯¯¯¯¯¯¯¯
57
References
Bleuet, P., Welcomme, E., Dooryhee, E., Susini, J., Hodeau, J.L. and Walter, P. (2008).
Nature Mater. 7, 468-472.
Clark, S.M. and Barnes, P. (1995). Cem. Concr. Res. 25, 639-646.
Comodi, P., Nazzareni, S., Perugini, D. and Bergamini, M. (2006). Periodico di
Mineralogia, LXXVI (2) 95-112.
Collado, J.A., Frontera, C., Garcia-Muñoz, J.L., Ritter, C., Brunelli, M. and Aranda,
M.A.G. Series. Chem. Mater. 15, 167-174.
Cuberos, A.J.M., De la Torre, A.G., Carmen Martín-Sedeño, M., Moreno-Real, L.,
Merlini, M., Ordónez, L.M. and Aranda, M.A.G. (2009).. Cem. Concr. Res., in
press.
De la Torre, A. G., Bruque, S. and Aranda, M.A.G. (2001).. J. Appl. Crystallog. 34,
196-202
De la Torre, A.G. and Aranda M.A.G. (2003).. J. Appl. Crystallog. 36, 1169-1176.
De la Torre, A.G., López-Olmo, M.G., Álvarez-Rua, C., García-Granda, S. and Aranda,
M.A.G. (2004). Powder Diffraction 19, 240-246.
De la Torre, A.G., Morsli, K., Zahir, M. and Aranda, M.A.G. (2007). J. Appl.
Crystallog. 40, 999-1007.
Dillmann, P., Populus, P., Chevallier, P., Fluzin, P., Beranger, G. and Firsov, A. (1997).
J. Tech. 15, 251-262.
Edwards, J. W., Speiser, R. and Johnston H. L. (1951). J. Applied Phys. 22, 424-428.
Grain, C. F. and Campbell, W. J. (1962). Bureau Mines Report Investigation 5982, pp
21.
Hammersley, A.P., Svensson, S.O., Hanfland, M., Fitch, A.N. and Häusermann, D.
(1996). High Pressure Res 14, 235-248.
Harbottle, G., Gordon, B.M. and Jones, K.W. (1986). Nucl. Instr. and Meth. B 14, 116-
122.
Jupe, A.C., Turrillas, X., Barnes, P., Colston, S.L., Hall, C., Häusermann, D. and
Handfland, M. (1996). Phys. Rev. B 53, R14697-R14700.
Miguel A. G. Aranda et al. ¯¯¯¯¯¯¯¯¯¯¯¯¯¯¯¯¯¯¯¯¯¯¯¯¯¯¯¯¯¯¯¯¯¯¯¯¯¯¯¯¯¯¯¯¯¯¯¯¯¯¯¯¯¯¯¯¯¯¯¯¯¯¯¯¯¯¯¯¯¯¯¯¯¯¯¯¯¯
58
Jupe, A.C., Wilkinson, A.P., Luke, K. and Funkhouser, G.P. (2007). Slurry Consistency
and In Situ Synchrotron X-Ray Diffraction during the early hydration of
portland cements with calcium chloride. J. Am. Ceram. Soc. 90 (8), 2595-2602.
Kharton, V. V., Marques, F.M.B. and Atkinson A. (2004). Solid State Ionics 174, 135-
149.
Laperche, V. and Bigham, J.M. (2002). J. Environmental Quality 31, 979-988.
León-Reina, L., Losilla, E.R., Martínez-Lara, M., Bruque, S. and Aranda, M.A.G.
(2004). J. Mater. Chem. 14, 1142-1149.
León-Reina, L., Losilla, E.R., Martínez-Lara, M., Martín-Sedeño, M.C., Bruque, S.,
León-Reina, L., Porras-Vázquez, J.M., Losilla, E.R. and Aranda, M.A.G. (2007). J.
Solid State Chem. 180, 1250-1258.
Madsen, I. C., Scarlett, N. V. Y., Cranswick, L. M. D., and Lwin, T. (2001). J. Appl.
Crystallogr. 34, 409-426.
Matsuishi, S., Toda, Y., Miyakawa, M., Hayashi, K., Kamiya, T., Hirano, M., Tanaka I.
and Hosono, H. (2003). Science 301, 626-629.
Meneghini, C., Artioli, G., Balerna, A., Gualtieri, A.F. and Norby, P. (2001). J.
Synchrotron Rad. 8, 1162-1166.
Merlini, M., Artioli, G., Meneghini, C., Cerulli, T., Bravo, A. and Cella, F. (2007).
Powder Diffr. 22 (3), 201-208.
Moussa, S. M., Ibberson, R. M., Bieringer, M., Fitch, A. N. and Rosseinsky, M. J.
(2003). Chem. Mater. 15, 2527-2533.
Neder, R.B., Burghammer, M., Grasl. T., Schulz, H., Bram, A., Fiedler, S. and Riekel,
C. (1996). Zeitschrift fur Kistallographie, 211, 763-765.
Palacios, L., De la Torre, A. G., Bruque, S., García-Muñoz, J. L., García-Granda, S.,
Sheptyakov, D. and Aranda, M. A. G. (2007).. Inorg. Chem. 46, 4167-4176.
Synchrotron X-ray Diffraction in Mineralogy and Materials Chemistry. Possibilities and Applications ¯¯¯¯¯¯¯¯¯¯¯¯¯¯¯¯¯¯¯¯¯¯¯¯¯¯¯¯¯¯¯¯¯¯¯¯¯¯¯¯¯¯¯¯¯¯¯¯¯¯¯¯¯¯¯¯¯¯¯¯¯¯¯¯¯¯¯¯¯¯¯¯¯¯¯¯¯¯
59
Palacios, L., Cabeza, A., Bruque, S., García-Granda, S. and Aranda, M. A. G. (2008).
Structure and Electrons in Mayenite Electrides. Inorg. Chem. 47, 2661-2667.
Pokroy, B., Fitch, A.N. and Zolotoyabko, E. (2006). Adv. Mater. 18, 2363-2368.
Pokroy, B., Fieramosca, J.S., Von Dreele, R.B., Fitch, A.N., Caspi, E.N. and
Zolotoyabko, E. (2007). Chem. Mater. 19, 3244-3251.
Salvadó, N., Butí, S., Nichoson, J., Emerich, H., Labrador, A. and Pradell T. (2009a).
Talanta 79, 419-428.
Salvadó, N., Butí, S., Emerich, H., Labrador, A., Aranda, M.A.G. and Pradell T.
(2009b). Manuscript in preparation.
Scarlett, N. V. Y., Madsen, I. C., Cranswick, L. M. D., Lwin. T., Groleau, E.,
Stephenson, G., Aylmore, M., and Agron-Olshina, N. (2002).. J. Appl.
Crystallogr. 35, 383-400.
Schmidt, S., Poulsen, H. F. and Vaughan, G. B. M. (2003). J. Appl. Crystallogr. 36,
326-332.
Scrivener, K.L., Fullmann, T., Gallucci, E., Walenta, G. and Bermejo, E. (2004)., Cem.
Concr. Res. 34 (9), 1541-1547.
Singhal, S. C. and Kendall, K. High Temperature Solid Oxide Fuel Cells:
Fundamentals. Design and Applications, Elsevier Ltd., Kidlington-Oxford
(2003).
Taylor, H.F.W. Cement Chemistry. Thomas Telford. London (1997).
Tang, C.C., Thompson, S.P., Parker, J.E., Lennie, A.R., Azough, F. and Kato, K.
(2009). J. Appl. Crystallogr. 42, 225-233.
Volkemer, D. (2007). In Handbook of Biomineralization. Biomimetic and bioinspired
chemistry. Beherens, P., and Baeuerlein E. (Eds). Wiley, pages 65-87.
Volkringer, C., Popov D., Loiseau, T., Guillou, N., Férey, G., Haouas, M., Taulelle, F.,
Mellot-Draznieks, C., Burghammer, M. and Riekel, C. (2007). Nature Materials
6, 760-764.
Wright J. Vaughan G. Fitch A. (2003). Computing Commission Newsletter, No. 1, p.