1 Synergy and Synthesis: integrating qualitative and quantitative data. Jane Fielding Nigel Fielding 1. The development of social science perspectives on methodological inter-relation 1.1 The origins of multiple-method research Research designs systematically relating multiple methods originated in the context of mainstream psychology (Campbell and Fiske 1959), initially being termed >triangulation=. Multiple method research designs (‘MMRD’) remain prominent amongst mainstream methodological practices (Campbell and Russo 1999). Heuristics for relating results from substantially different methods were a theme from the outset. Campbell wrote that, when he decided to study psychology, while working on a turkey ranch for the summer, >my notion of science was already of the experimental physics sort, whereas [a magazine article that inspired his choice of discipline] was solely about humanistic psychology= (Campbell 1981: 456). Discussing his initial elaboration of triangulation by way of the >multitrait- multimethod matrix= technique, Campbell wrote that it grew from lectures at Berkeley on measurement artefacts in the study of individual differences. Campbell used correlational matrices crossing different methods in his dissertation and thus had found his way to what he dubbed >methodological triangulation= before his collaboration with Fiske. The original conception was that triangulation would enhance validity, understood as agreement in the outcomes of more than one independent measurement procedure, relative to studies employing a single procedure. The position assumes that there are realities that exist independently of the observer, that have stable properties that can be measured, and that can be mutually related as the basis of internally-consistent explanations of social phenomena. These assumptions are necessary because in relating findings from different methods, triangulation must assume that variations in findings arise from the phenomenon or the particularities of the methods being combined rather than methods haphazardly producing
Transcript
1
Synergy and Synthesis: integrating qualitative and
quantitative data. Jane Fielding
Nigel Fielding
1. The development of social science perspectives on methodological inter-relation
1.1 The origins of multiple-method research
Research designs systematically relating multiple methods originated in the context of
mainstream psychology (Campbell and Fiske 1959), initially being termed >triangulation=.
Multiple method research designs (‘MMRD’) remain prominent amongst mainstream
methodological practices (Campbell and Russo 1999). Heuristics for relating results from
substantially different methods were a theme from the outset. Campbell wrote that, when he
decided to study psychology, while working on a turkey ranch for the summer, >my notion of
science was already of the experimental physics sort, whereas [a magazine article that
inspired his choice of discipline] was solely about humanistic psychology= (Campbell 1981:
456). Discussing his initial elaboration of triangulation by way of the >multitrait-
multimethod matrix= technique, Campbell wrote that it grew from lectures at Berkeley on
measurement artefacts in the study of individual differences. Campbell used correlational
matrices crossing different methods in his dissertation and thus had found his way to what he
dubbed >methodological triangulation= before his collaboration with Fiske.
The original conception was that triangulation would enhance validity, understood as
agreement in the outcomes of more than one independent measurement procedure, relative to
studies employing a single procedure. The position assumes that there are realities that exist
independently of the observer, that have stable properties that can be measured, and that can
be mutually related as the basis of internally-consistent explanations of social phenomena.
These assumptions are necessary because in relating findings from different methods,
triangulation must assume that variations in findings arise from the phenomenon or the
particularities of the methods being combined rather than methods haphazardly producing
2
different findings on different occasions, or there being no predictable consistencies in the
working of given methods. The latter is especially important in the convergent validation
approach to triangulation, as it is premised on the combined methods having different and
distinctive biases; if methods are susceptible to the same biases, combining them may simply
multiply error. Further implied is that these sources of error can be anticipated and their
effects can be traced during analysis. It is in this sense that Levins= (1966, p. 423)
declaration that >our truth is the intersection of independent lies= is so apt.
The doctrine of convergent validation therefore requires agreement of results from
diverse but systematic uses of methods, data sources, theories and investigators (Denzin
1989). Some maintain that combining methods or drawing on different data sources only
enhances validity where each is associated with compatible ontological and epistemological
perspectives (Blaikie 1991). Post-positivists have somewhat sidestepped the
ontological/epistemological critique with the argument that datasets are open to interpretation
from a range of theories. Another perspective is that combining different methodologies does
not necessarily enhance validity but can extend the scope and depth of understanding
(Fielding and Fielding 1986; Denzin and Lincoln 2000; Fielding and Schreier 2001).
Triangulation has also been informed by rationales for the methodological >division
of labour= (Sieber 1979). For Sieber, qualitative work can assist quantitative work in
providing a theoretical framework, validating survey data, interpreting statistical relationships
and deciphering puzzling responses, selecting survey items to construct indices, and
providing case studies. Quantitative data can identify individuals, groups and settings for
qualitative fieldwork and indicate representative and unrepresentative cases. Quantitative data
can counteract the >holistic fallacy= that all aspects of a situation are congruent, and can
demonstrate the generalisability of limited-sample observations. Qualitative research
sometimes succumbs to >elite bias=, concentrating on respondents who are articulate,
strategically placed, and have a status that impresses researchers. Quantitative data can
compensate by indicating the full range that should be sampled. Qualitative data can
contribute depth to quantitative research, and suggest leads that the more limited kinds of
quantitative data cannot address.
As well as combining methods, triangulation can also involve using a number of data
sources (self, informants, other commentators), several accounts of events, or several
researchers. Denzin’s (1970) original conceptualization, which was related to Webb et al=s
3
(1966) work on >unobtrusive measures=, not only involved multiple methods (>data
triangulation=) but multiple investigators (>investigator triangulation=) and multiple
methodological and theoretical frameworks (>theoretical and methodological triangulation=).
Each main type has a set of sub-types. Data triangulation may include time triangulation,
exploring temporal influences by longitudinal and cross-sectional designs; space
triangulation, taking the form of comparative research; and person triangulation, variously at
the individual level, the interactive level among groups, and the collective level. In
investigator triangulation, more than one person examines the same situation. In theory
triangulation, situations are examined from different theoretical perspectives. Methodological
triangulation has two variants, >within-method=, where the same method is used on different
occasions (without which one could hardly refer to >method= at all), and >between-
method=, where different methods are applied to the same subject in explicit relation to each
other.
While the classical approach represented by Campbell=s work seeks convergence or
confirmation of results across different methods, the triangulation term has accumulated so
many renderings that it is now clearer to use the terms >convergence= or >confirmation=
when seeking cross-validation between methods. In reality the classic goal of seeking
convergence has always been relatively unusual. One reason is the difficulties caused when
results fail to converge, but another is the effort required to pursue the goal of producing
convergent findings. Morgan (1998) argues that researchers often cannot afford to put so
much effort into finding the same thing twice. Moreover, the complex topics of social
research make apparent the different strengths of different methods, supporting a more
flexible approach to methodological combination than in classic triangulation.
The fact that there are different constructions of triangulation implies there are
varying degrees of rigour in operationalising triangulation. We might, for example, regard as
relatively weak the idea that validity will be enhanced simply by drawing on data collected
by different researchers using the same method, while approaches based on combining
different methods might be regarded as more rigorous. For triangulation to be credibly
founded and implemented, we must identify in advance the characteristic weaknesses or
types of error associated with the chosen methods so that we can discount the danger that
they might be susceptible to the same threats to validity. Thus, much depends on the logic by
4
which researchers derive and mesh together data from different methods. >What is involved
in triangulation is not the combination of different kinds of data per se, but rather an attempt
to relate different sorts of data in such a way as to counteract various possible threats to the
validity of (their) analysis= (Hammersley and Atkinson 1995: 199).
Triangulation in itself is no guarantee of internal and external validity. Its real value is
not that it guarantees conclusions about which we can be confident but that it prompts in
researchers a more critical stance towards their data. Too often, research attracts the criticism
that its conclusions simply confirm what everyone already knew. Evaluative criteria for
qualitative methods are particularly problematic, with much recourse to >ethnographic
authority= (Hammersley and Atkinson 1995), the defence of interpretations not by adherence
to systematic, externally-tested analytic procedures but because the researcher >was there=
and so must have the best sense of what the data mean. Validity queries may be met by
reference to the amount of time spent in fieldwork, the rapport achieved and so on. Such
criteria contrast sharply with the warrant for inferences from quantitative data, where
statistical procedures are used whose steps are standardised, so that adherence to each stage
can be checked, and whose criteria for drawing a particular conclusion are not only explicit
but precisely define the conditions under which it can be expected to hold. Triangulation
enables qualitative researchers to adopt the stance often characteristic of the quantitative
researcher, for whom conclusions are always >on test=, hold only under specified conditions,
and whose relationship to the data is not uncritical >immersion= but measured detachment.
It is not suggested that qualitative researchers should transform their approach to
resemble that of quantitative researchers, but we can certainly argue that the value of
triangulation lies more in >quality control= than any guarantee of >validity=. The approach
promotes more complex research designs that oblige researchers to be more clear about what
relationships they seek to study, what they will take as indicators of these relationships, and
so on. Diffusely-focussed exploratory research will always have a place but as qualitative
research tackles more precisely-specified topics and becomes more prominent in policy-
related research its audiences want to know how confident in the findings they can be. Even
in exploratory work researchers cannot be indifferent to accuracy.
Moreover, when findings from independent methods converge, it is not simply a
matter of identifying points of agreement. We also have to identify the conditions under
5
which findings are invariant, explain failures of invariance, and determine why given
conditions apply. The differences between findings from different knowledge sources can be
as illuminating as their points of agreement. Triangulation helps address the tendency to
focus on data fitting preconceptions or that is conspicuous at the expense of less exotic, but
possibly more indicative, data. While the rigidity of quantitative methods helps researchers
resist such faults, their work is not immune to such problems either. However, such faults can
more readily be traced because quantitative methodologies necessitate clarity about
hypotheses, make the researcher=s assumptions more explicit, and sediment these
assumptions in research instruments that cannot generally be adjusted after they are deployed.
Deploying qualitative methods alongside quantitative methods in multiple-method research
designs helps qualitative research gain some of these benefits. Similarly, it can bring to
quantitative elements of the research more refinement and analytic depth.
1.2 From convergent validation to the celebration of diversity.
As well as taking a convergent validation perspective, the original literature on combining
methods usually involved one method taking precedence (Creswell 2003). Qualitative
components rarely held this role and were mostly used for pilot work or follow-up with a
sub-sample. More recent approaches suggest more even-handed combinations, as in Caracelli
and Green=s (1997) classification of mixed method research into component designs (such as
>complementary= or >comparative= designs) and integrated designs, which include iterative
designs, nested designs and holistic designs. Caracelli and Greene (1993) identify four
different strategies through which qualitative and quantitative data might be integrated. The
first, data transformation, requires data of one type being converted into that of another so
they may be analysed together. Typological development, the second strategy, involves the
use of conceptual categories emergent from the analysis of one type of data to the analysis of
a contrasting data type. Third, extreme case analysis requires the researcher to focus on
exceptional examples found in one type of data and refine their explanation of it via analysis
of data of another type. The final strategy, data consolidation, extends the data transformation
strategy in that data are converted into another form, but the emphasis is on assimilating
multiple forms of data to produce a new dataset.
6
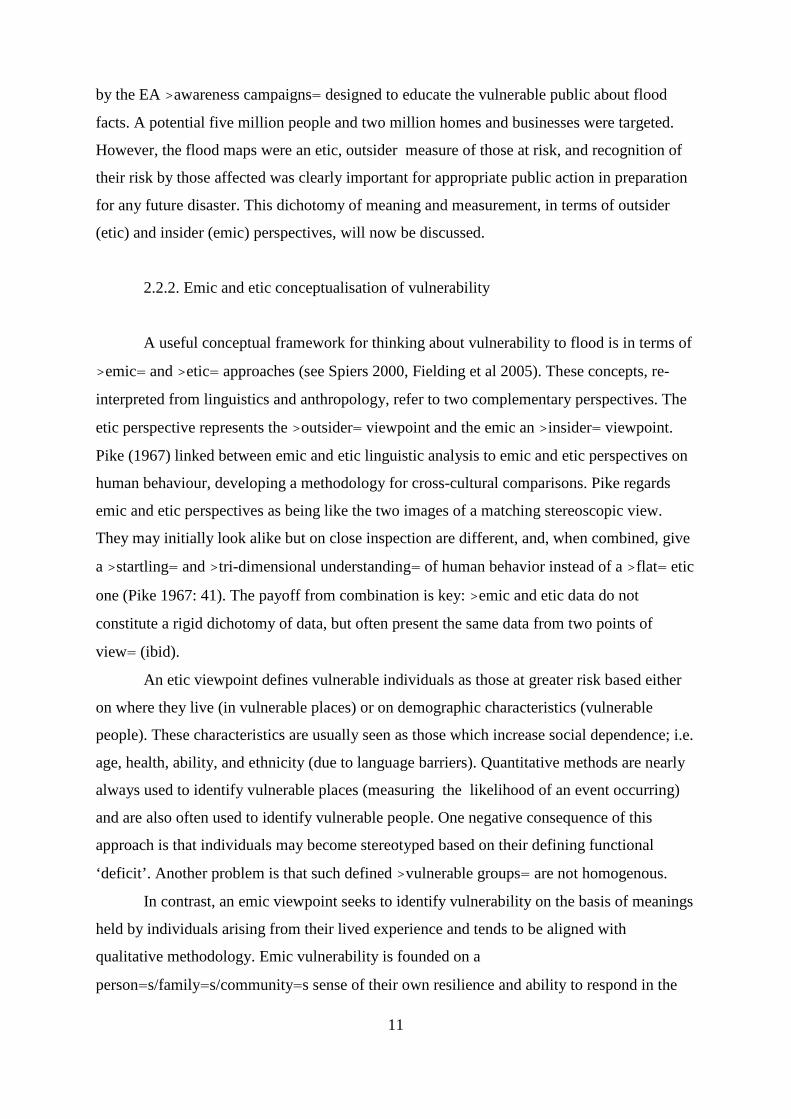
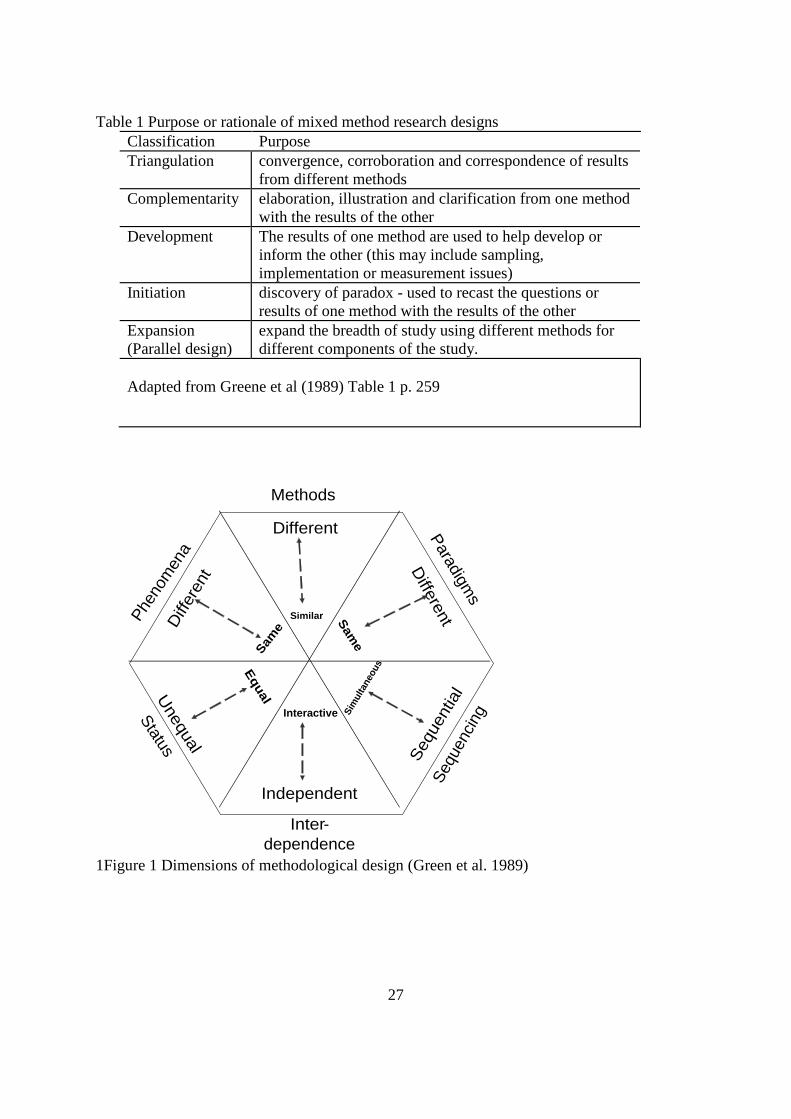
These strategies enable numerous types of multiple method research design. Green et
al (1989) identified six main dimensions of methodological design. When combining two
methods the nature of the relationship between the methods can be categorised along each
dimension [see Figure 1]. Thus, combining a survey with qualitative interviewing - two
distinct methods - can be categorised as using different paradigms to explore different
aspects of the same phenomenon, in sequence (e.g., first the survey, then the interviews);
with the methods being independent but with each method having equal status.
Figure 1 here
Moreover, the research designs must be distinguished from the reported rationale or practical
purpose of the research (see Table 1).
Table 1 here
Other attempts at definitive typologies arrive at different numbers of main types of
methodological combination (Creswell 2003; Niglas 2004; Tashakkori and Teddlie 1998),
some of which proliferate to the point of intellectual indigestion (Johnson and Onweugbuzie
2004). The most exhaustive typology can never capture all potential combinations; the
essential thing is having a considered but open stance in deriving a design that captures the
research question. Over-concentration on choosing exactly the right permutation at the outset
can make for an unhelpfully rigid approach, but this is not to sideline preliminary reflection.
Rather, it is to say that precisely specifying the research question is the key thing, and from
this a sense of the best methodological combination will emerge, with the proviso that
researchers must always be ready to adjust the design in light of what is found. Research
design is not a stage, it is a process.
Broadly, strategies for interrelating findings from multiple methods fall into two
types, ‘combination’ and ‘conversion’ (Bazeley 2006). An instance of combination is when
categorical or continuous variables are the basis both of statistical analysis and for
comparison of coded qualitative data. Textual and numerical data may have been collected
7
together, as where questionnaires mix fixed and open response items, or in sequence, such as
where surveys are followed by interviews. Conversion involves changing one type of data to
another, such as where the coding applied to qualitative data is used in statistical analysis, or
where quantitative data contributes to narrative analyses or a life history (Elliott 2005).
Bazeley (2006) notes that strategies involving the consolidation, blending or merging of data
tend to involve both conversion and combination.
A well-established case for inter-relating quantitative and qualitative methods is that
the qualitative element can suggest types of adaptation or experience for which the
quantitative element can then test, thus enabling conclusions concerning the statistical
frequency of types in a population. Qualitative research is good at identifying types but is
seldom sufficiently comprehensive to indicate for what share of the sample a given type may
account. In combination, qualitative and quantitative methods can reveal more about the
extent of regularities and the dimensions of the types. Numerous hybrid techniques interrelate
quantitative and qualitative procedures. Where codes derived from qualitative data are
recorded separately for each case, the presence/absence of each code can be used to create
variables, from which case-by-variable matrices can be derived. Such matrices enable
hypothesis testing, predictive modeling and exploratory analyses.
Statistical techniques like cluster analysis, correspondence analysis and
multidimensional scaling can be applied to such ‘quantitized’ qualitative data. For example,
nonstandardised interviews documenting types of adaptation to labour force position can be
used as the basis of a probabilistic cluster analysis. The proximity and probability of
classification of each respondent towards the centre of the relevant cluster (i.e. type) can thus
be visualised and categories reduced to fewer dimensions by multiple correspondance
analysis. Kuiken and Miall (2001) used this technique to specify experiential categories
derived from interview response in a study comparing different readers’ impressions of the
same short story. Having identified attributes qualitatively, categories were specified by a
quantitative cluster analysis that systematically varied the presence of individual attributes.
Subsequent qualitative inspection of the clusters further differentiated the types. In her study
of mixed methods projects, Niglas (2004) used scales to capture variation amongst them on
various characteristics of research design. Cluster analysis of variables from her quantitative
content analysis produced eight distinctive groups and identified the characteristics best
differentiating them. The findings were compared to discursive notes from her initial reading
8
of the study to produce summary descriptions of each group. The descriptions were used to
make the final assignment of studies into categories representing variables for further
statistical analysis. These alternating quantitative and qualitative procedures do not challenge
the essential integrity of the quantitative and qualitative components of the method. They
represent moves to interrelation rather than juxtaposition of different forms of data.
2. Core principles of multiple-method research design
2.1 Epistemology and pragmatism
The advantages of combining methods do not require that we ignore that different approaches
are supported by different epistemologies. Accepting the case for interrelating data from
different sources is to accept a moderate relativistic epistemology, one that justifies the value
of knowledge from many sources, rather than elevating one source. Taking a triangulation or
multiple-method approach is to accept the continuity of all data-gathering and analytic
efforts. Proponents are likely to regard all methods as both privileged and constrained: the
qualities that allow us to access and understand one kind of information close off other kinds.
A full understanding flows from tackling the research question in several ways.
Results from different methods founded on different assumptions may, then, be
combined for different purposes than that associated with convergent validation. Theoretical
triangulation does not necessarily reduce bias, nor does methodological triangulation
necessarily increase validity. Combining results from different analytic perspectives or
methods may offer a fuller picture but not a necessarily more >objective= or >valid= one.
When we combine theories and methods we do so to add breadth or depth to our analysis, not
because we subscribe to a single and >objective= truth. In the social realm it is beyond our
capacities to achieve absolute objectivity or axiomatic truth, but this is not the same as
rejecting the attempt to be objective or the standard of truth. It is merely to accept that our
knowledge is always partial and incomplete. We can make it less so by expanding the sources
of knowledge on which we draw. When we accept an empirically-based conclusion with
identifiable and defined limits, such as that educational achievement is generally related to
social class but the relationship is more pronounced for ethnic minority people (discussed in
9
Becker 1986), we implicitly accept the >constant and unevadable necessity for interpretation
and change of aspect= (Needham1983: 32). That is the ultimate warrant for the triangulation
paradigm.
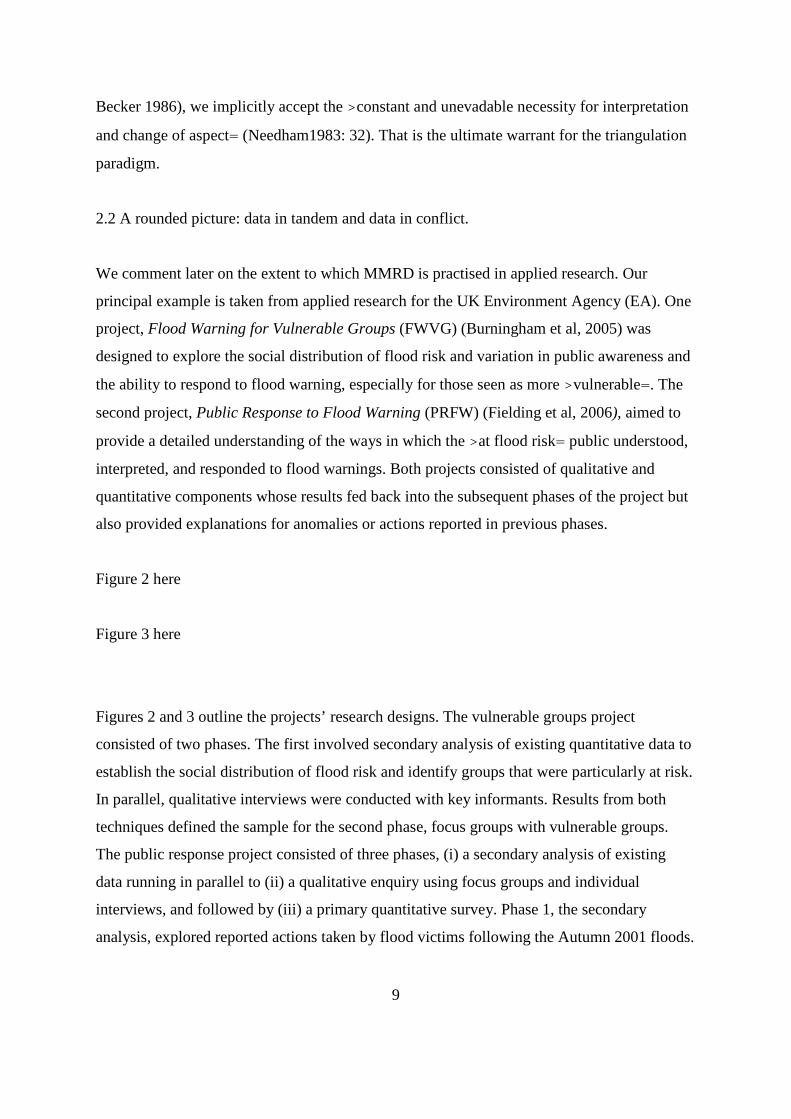
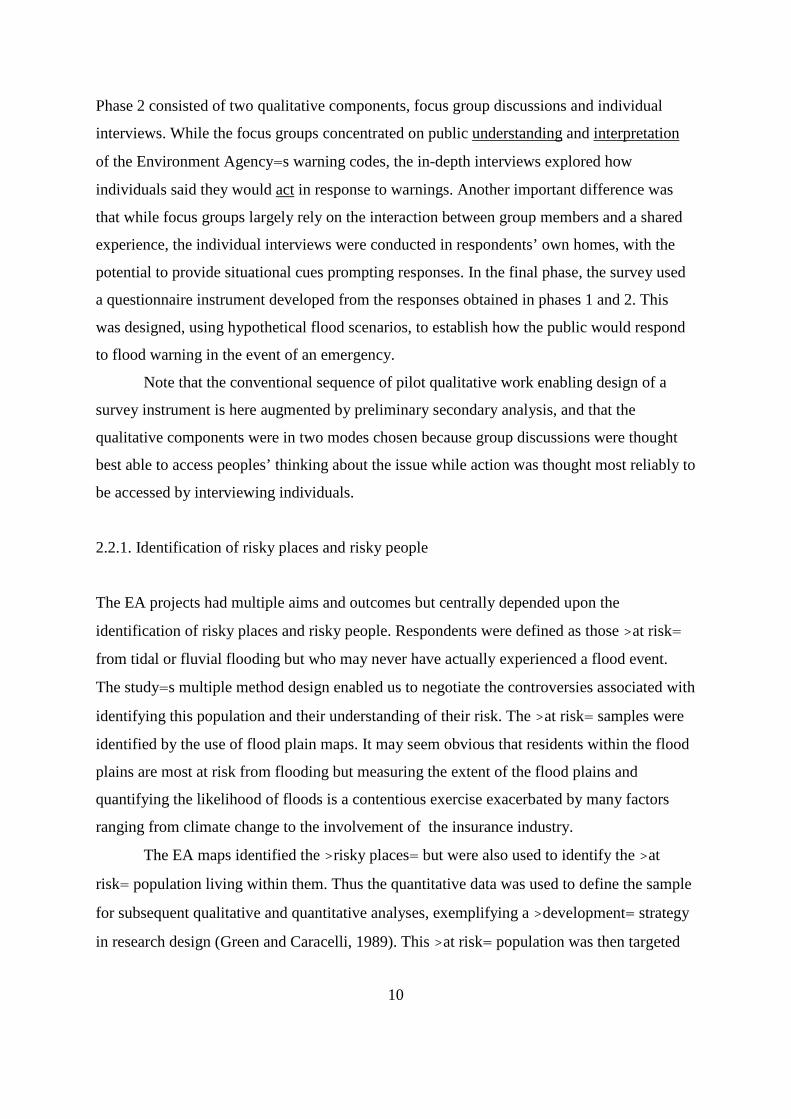
2.2 A rounded picture: data in tandem and data in conflict.
We comment later on the extent to which MMRD is practised in applied research. Our
principal example is taken from applied research for the UK Environment Agency (EA). One
project, Flood Warning for Vulnerable Groups (FWVG) (Burningham et al, 2005) was
designed to explore the social distribution of flood risk and variation in public awareness and
the ability to respond to flood warning, especially for those seen as more >vulnerable=. The
second project, Public Response to Flood Warning (PRFW) (Fielding et al, 2006), aimed to
provide a detailed understanding of the ways in which the >at flood risk= public understood,
interpreted, and responded to flood warnings. Both projects consisted of qualitative and
quantitative components whose results fed back into the subsequent phases of the project but
also provided explanations for anomalies or actions reported in previous phases.
Figure 2 here
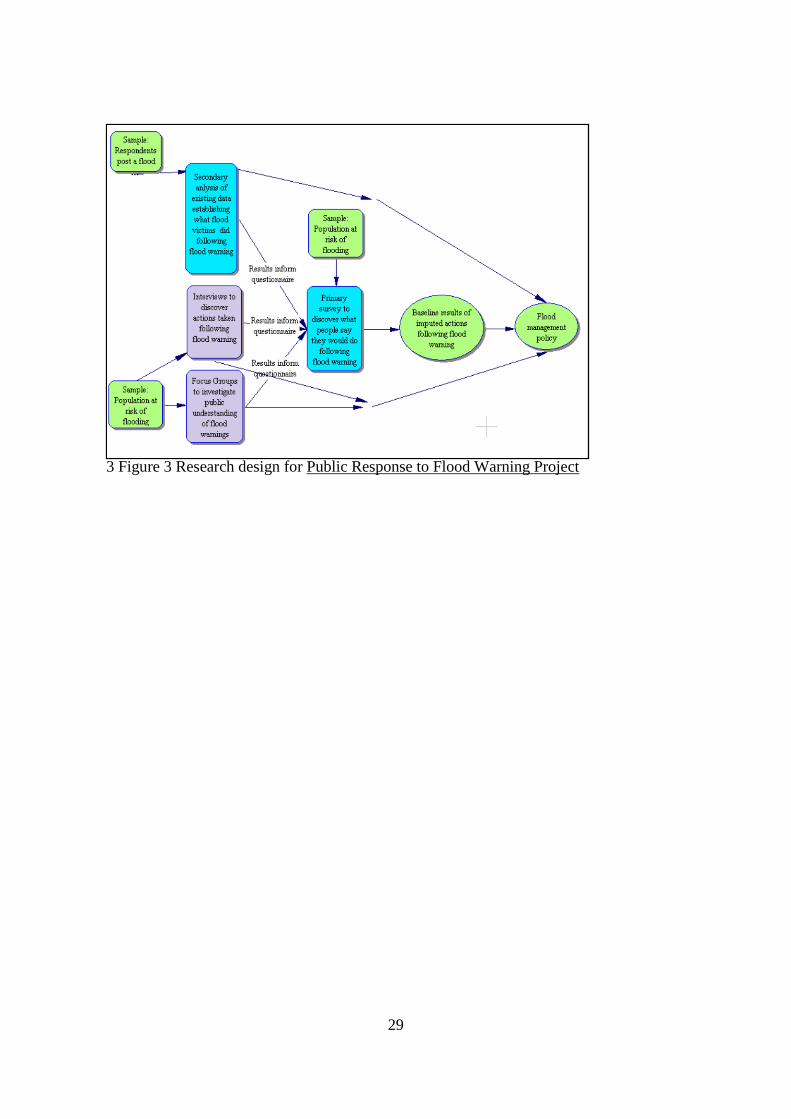
Figure 3 here
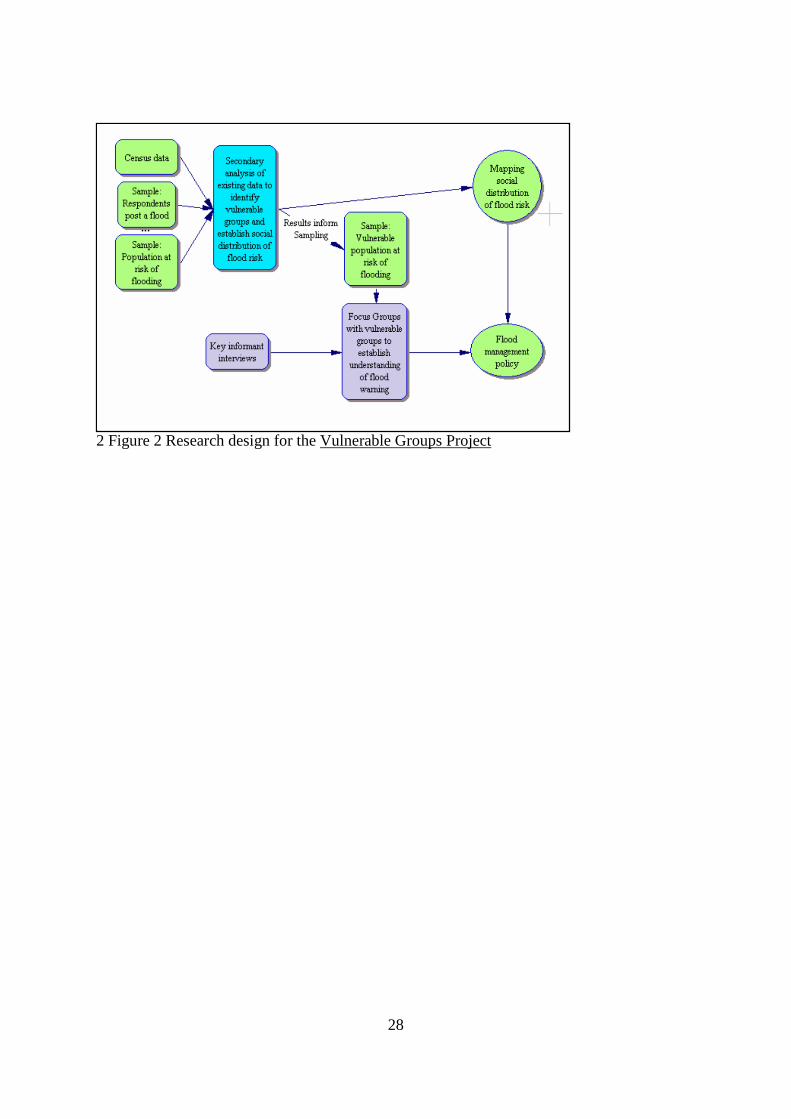
Figures 2 and 3 outline the projects’ research designs. The vulnerable groups project
consisted of two phases. The first involved secondary analysis of existing quantitative data to
establish the social distribution of flood risk and identify groups that were particularly at risk.
In parallel, qualitative interviews were conducted with key informants. Results from both
techniques defined the sample for the second phase, focus groups with vulnerable groups.
The public response project consisted of three phases, (i) a secondary analysis of existing
data running in parallel to (ii) a qualitative enquiry using focus groups and individual
interviews, and followed by (iii) a primary quantitative survey. Phase 1, the secondary
analysis, explored reported actions taken by flood victims following the Autumn 2001 floods.
10
Phase 2 consisted of two qualitative components, focus group discussions and individual
interviews. While the focus groups concentrated on public understanding and interpretation
of the Environment Agency=s warning codes, the in-depth interviews explored how
individuals said they would act in response to warnings. Another important difference was
that while focus groups largely rely on the interaction between group members and a shared
experience, the individual interviews were conducted in respondents’ own homes, with the
potential to provide situational cues prompting responses. In the final phase, the survey used
a questionnaire instrument developed from the responses obtained in phases 1 and 2. This
was designed, using hypothetical flood scenarios, to establish how the public would respond
to flood warning in the event of an emergency.
Note that the conventional sequence of pilot qualitative work enabling design of a
survey instrument is here augmented by preliminary secondary analysis, and that the
qualitative components were in two modes chosen because group discussions were thought
best able to access peoples’ thinking about the issue while action was thought most reliably to
be accessed by interviewing individuals.
2.2.1. Identification of risky places and risky people
The EA projects had multiple aims and outcomes but centrally depended upon the
identification of risky places and risky people. Respondents were defined as those >at risk=
from tidal or fluvial flooding but who may never have actually experienced a flood event.
The study=s multiple method design enabled us to negotiate the controversies associated with
identifying this population and their understanding of their risk. The >at risk= samples were
identified by the use of flood plain maps. It may seem obvious that residents within the flood
plains are most at risk from flooding but measuring the extent of the flood plains and
quantifying the likelihood of floods is a contentious exercise exacerbated by many factors
ranging from climate change to the involvement of the insurance industry.
The EA maps identified the >risky places= but were also used to identify the >at
risk= population living within them. Thus the quantitative data was used to define the sample
for subsequent qualitative and quantitative analyses, exemplifying a >development= strategy
in research design (Green and Caracelli, 1989). This >at risk= population was then targeted
11
by the EA >awareness campaigns= designed to educate the vulnerable public about flood
facts. A potential five million people and two million homes and businesses were targeted.
However, the flood maps were an etic, outsider measure of those at risk, and recognition of
their risk by those affected was clearly important for appropriate public action in preparation
for any future disaster. This dichotomy of meaning and measurement, in terms of outsider
(etic) and insider (emic) perspectives, will now be discussed.
2.2.2. Emic and etic conceptualisation of vulnerability
A useful conceptual framework for thinking about vulnerability to flood is in terms of
>emic= and >etic= approaches (see Spiers 2000, Fielding et al 2005). These concepts, re-
interpreted from linguistics and anthropology, refer to two complementary perspectives. The
etic perspective represents the >outsider= viewpoint and the emic an >insider= viewpoint.
Pike (1967) linked between emic and etic linguistic analysis to emic and etic perspectives on
human behaviour, developing a methodology for cross-cultural comparisons. Pike regards
emic and etic perspectives as being like the two images of a matching stereoscopic view.
They may initially look alike but on close inspection are different, and, when combined, give
a >startling= and >tri-dimensional understanding= of human behavior instead of a >flat= etic
one (Pike 1967: 41). The payoff from combination is key: >emic and etic data do not
constitute a rigid dichotomy of data, but often present the same data from two points of
view= (ibid).
An etic viewpoint defines vulnerable individuals as those at greater risk based either
on where they live (in vulnerable places) or on demographic characteristics (vulnerable
people). These characteristics are usually seen as those which increase social dependence; i.e.
age, health, ability, and ethnicity (due to language barriers). Quantitative methods are nearly
always used to identify vulnerable places (measuring the likelihood of an event occurring)
and are also often used to identify vulnerable people. One negative consequence of this
approach is that individuals may become stereotyped based on their defining functional
‘deficit’. Another problem is that such defined >vulnerable groups= are not homogenous.
In contrast, an emic viewpoint seeks to identify vulnerability on the basis of meanings
held by individuals arising from their lived experience and tends to be aligned with
qualitative methodology. Emic vulnerability is founded on a
person=s/family=s/community=s sense of their own resilience and ability to respond in the
12
face of a flood. Emic vulnerability can only be determined by the person experiencing it. So,
a person who may be defined as belonging to an at-risk group (etic vulnerability) may only
feel vulnerable if they consider some threat to their self to exceed their capacity to adequately
respond, despite 'rationally' acknowledging their possession of vulnerable characteristics.
They need to recognise that they are at risk before they can effectively prepare.
2.2.3. Public awareness of risk
Quantitative analysis of the >at risk= population based on a survey administered in 2001
(Fielding et al 2005) and more recently reported by the EA1, where 49 percent of residential
respondents (41 percent in 2005) were not aware that their property was in a flood risk area,
made apparent that the EA’s message was not getting through. Nearly half those defined as
>at risk= were not aware of their risk. Thus, while the quantitative measurement of the extent
of the flood plains had been used to identify the >at risk= population, other quantitative
analysis identified a differing perception of reality. The imposed, outsider view defining risky
places was at odds with the lived experience of those defined >at risk=. The fact that an emic
perspective (risk awareness) was captured using an etic measure illustrates that the etic/emic
perspectives are not simply questions of method.
Why were those who are vulnerable according to etic measures not aware of their
risk? This was initially explored using the survey data relating other variables to >explain=
variation in the dependant variable, awareness. However, the other variables chosen,
generally those indicating, in line with the literature, a social or financial dependency, drew
on etic, or outsider, analysis to explain lack of awareness. This did establish a clear social
class gradient, with the lower social classes, the young and the old least aware of their flood
risk (see Table 2). One use made of the focus groups and interviews was to establish whether
these most vulnerable groups feel most at risk, and to see whether there were other
explanations for lack of awareness. Thus the qualitative data was used to complement and
>explain= the findings from the quantitative analysis, an example of >complementarity= in
the Green and Caracelli typology.
Table 2 here
13
Flood researchers regularly encounter respondents who deny that they live within the
flood plains identified by the EA. Indeed, some actively campaign against their properties
being included (possibly because it affects their insurance premiums and thus house prices).
In their experience, and possibly their parents’ experience, they may not have suffered
flooding and therefore feel perfectly safe. EA public safety materials, including targetted
letters and leaflet drops about the >objective= risk, simply reinforce a belief that the
authorities do not know what they are talking about. Analysis of response to flood warnings
and of relevant survey data (Fielding et al 2005) found that the most influential factor on
flood awareness and likely action in the event of a flood was previous flood experience.
Evidence of scepticism based on local knowledge and experience was found not only in
verbatim responses in the survey but in elaborated form in the individual interviews:
In response to why no action was taken upon receiving a flood warning, verbatim
responses in the survey included:
‘Lived in [town] all my life and know where it floods and where it doesn't’.
‘We were not flooded the first time so we did not expect to be flooded again’.
"I don't want to be ignorant but it is absolute trash to say that this property is at risk of
being flooded. I have lived in [riverside town] all of my life and I am 84 years old,
and this area has never been flooded in that time, and I am saying that with 30 years
experience in the fire brigade. Whoever put this address on the at risk register was
very wrong, if the flooding ever got to this area [town] would not exist.’
Post Events Survey 2001 verbatim responses
While interviews yielded similar responses, e.g., TD: No, I=ve lived >ere thirteen years and
I’ve never felt [at risk], never (Parent Interview, FWVG Project), the finer-grained data also
contained indications that ignorance was a factor.
I knew about floodplains but I didn=t imagine for one minute that where we=re
located was on a [floodplain], in fact I didn=t even know […] there was a bloody
river, that was a surprise, I knew the hump back bridge [I] go over [it] every day but I
didn=t know there was a river in that proximity.
New residents focus group (FWVG Project)
14
Interviews suggested that experience could negate >objective= awareness:
F: I don=t actually feel at risk. I mean I=m quite kind of aware that I live on
[a floodplain because], ... we have had leaflets through saying you=re in a blue zone
and ... knowing environmentally I could see there was a rise and you know floods that
happened like ... Lewes and Cornwall.
Owner occupier focus group (PRFW Project)
This respondent was aware of the flood risk but discounted it from lack of experience of
flooding.
F: I think that=s it, I think because I haven=t actually experienced anything either.
Several respondents recognised their lack of awareness but blamed it on lack of official
warning when they moved into the area, which in turn was blamed on the long time lapse,
and therefore reduced risk, since the last flood:
...It=s just ignorance on all of our parts because nobody had told us in the first place
you know, if you only get flooded in the last time in 1968 everyone sort of forgets
about it and if we=d have probably known that there was a chance that we were going
to get flooded you might have done something about it sooner.
F: And [property] searches ... you only have to give the last twenty years history.
Families focus group (FWVG Project)
[Second participant] I looked for it you know because I phoned my solicitor up and
gave him a piece of my mind and he said well ... it does show up in your search and
he told me the page it was on but he said it is 1968, it=s quite a long time ago so he
said I never really mentioned it to you because I thought that ... perhaps [because] that
was a long time ago it=s not worth worrying about ... Which I could understand.
New residents interview (FWVG Project)
15
There is indeed >objective= cause for scepticism about flood risk information. Flood plain
maps underestimate risk in the case of flooding caused by inadequate storm-drains or
groundwater and surface water runoff, and overestimate where flood defences or local
topography have not been accounted for. In addition, the EA=s own literature concedes the
maps >... cannot provide detail on individual properties2=. There was evidence of disbelief
in the integrity of the maps among >at risk= respondents, who had taken no action when
warned:
"Being on first floor flat didn't worry"
"Because property is not in flood area"
Post Events Survey 2001 verbatim
There were hints of conspiracy between the EA and insurers from respondents:
But as soon as you give your postcode they immediately know you=re in a high risk
flood area.
[...]
Participant 1: Even if you=re not, I mean I notice on the list of roads that you gave us
one of those was ... Hill, well I mean that=s literally up on the Downs, how can you
possibly flood up there? [Laughter] [...] And yet as far as ... the insurance companies
are concerned, all they have is your postcode [...] The Environment Agency=s stated
that you are in that area.[...] Participant 3: And in the harbour there are seven storey
blocks ... so if you live in the top of the storey [...]
You=re still going to be penalised.
Owner occupier focus group (PRFW Project)
Depending on personal circumstances, recognition of vulnerability to flood risk, according to
the ‘etic’ flood maps, may either be accepted and acted upon, a situation where the emic and
etic perspective coincide, or rejected where etic and emic viewpoints are at variance. In the
latter case there are two possibilities. Firstly, the respondent is not actually at risk - due either
16
to an error in the flood maps (the respondent lives on a hill or recent flood defences have not
been taken into account) or personal circumstance (the respondent lives above the ground
floor). Secondly, the respondent is at risk but does not perceive this risk to be significant.
Reasons for this are diverse: they may lack information about the risk; through past
experience and local knowledge their perception of their coping ability may outweigh
perceived risk; acknowledging the risk may have negative impacts (psychological and/or
economic); or they may distrust the flood maps.
So, while there is value in identifying those 'at-risk' to target awareness campaigns or
to explore the environmental justice agenda, it must also be recognised that vulnerability is a
quality of experience and produces different responses in different individuals. Rather than
regard emic and etic perspectives as competing versions, complex social phenomena require
coordination of the perspectives and their associated methodologies. The principal social
science tool enabling such an approach is a mixed method design that assigns different roles
to different methods.
3. The standing, uses and future of methodological combination
3.1 The contemporary practice of multiple-method research
The status of MMRD contrasts in the academic and applied research spheres. MMRD
remains controversial in the academic sphere. Since the canonical formulation of
>triangulation= in the 1950s, the social sciences have developed a range of considered
objections on grounds of epistemology and incommensurability of methods. The situation
contrasts with that in applied research, where many regard MMRD as a practical necessity.
Bryman (2005) compared planned research design and actual practice in studies claiming
MMRD, finding substantial divergence from the kind of planned use of MMRD that we
might expect if the concept of MMRD was firmly established as part of the methodological
canon. Researchers sometimes employed multiple methods without any rationale for why this
was superior to using a single method, other researchers who declared such a rationale did not
use multiple methods in the study itself, and yet other researchers who declared both a
rationale and followed it through by using multiple methods actually relied on a single
17
method for their analysis. These divergences reflect the fact that MMRD is not a technique,
like calculating tests of significance or running a cross tabulation, but an attitude of inquiry,
an approach to quality standards, and to what constitutes adequate explanations of social
phenomena.
The policy community - government, voluntary organisations, and interest groups - is
a growing consumer of social science research. In the UK and USA those engaged in
commissioning research have increasingly construed adequate research as multiple-method
research. At root, MMRD is a growing orthodoxy because of the >common sense= appeal of
the underlying logic (combined with either a measure of ignorance or indifference to the
epistemological differences between methods), but the trend is also related to the increasing
promotion of >evidence-based policy=, which has engendered significant institutional moves
towards standardisation of research methods, manifest in professional reviews of research
capacity, such as the Rhind Report (2003).
To overcome what are regarded as the constraints on the representativeness and
generalisability of qualitative research, government has initiated both topic-specific reviews
of quality standards for research (such as in health) and generic reviews of quality standards
for particular methods, such as qualitative research (e.g., the Spencer Review for the UK=s
Cabinet Office; Spencer et al 2003). Such reviews tend to result in checklists of ingredients
for reliable and valid research, and are uncomfortable reading for those who do not construe
social research as a matter of following recipes, but there is no doubting the significance of
such developments. In particular, qualitative research may have >arrived=, but it is welcome
at the platform only provided its findings can be associated with findings from research using
other methods.
Long before checklists emerged for qualitative research they were already a familiar
part of the environment for quantitative researchers. Criteria in that area reflect the tidier
characteristics of quantitative methodology and benefit from the benchmark standards that
are intrinsic to work with statistical data, such as expected sample sizes, accepted tests of
association, and standard measures of effect size. So the checklist approach emerged earlier
in relation to quantitative research and attracted less controversy. A major application of
large-scale quantitative research is to health research and much of the heuristic associated
with quality standards for quantitative research was laid down in the context of
epidemiological research, which is associated with large samples and experimental/control
18
designs. This approach is sufficiently embedded in the apparatus of policy-making that it has
taken institutional form in organisations like the >Campbell collaboration3= in criminal
justice and the >Cochrane collaboration4= in health. Membership represents a kind of
official seal of approval to conduct research in this area and members must produce research
that adheres to inflexible quality standards.
Ill-considered multiple method research can lead to real methodological traps. We
might take an example from the health field, concerning the UK controversy over the
Measles, Mumps and Rubella (MMR) vaccine, a combined vaccination against common
childhood diseases. A small sample study conducted by a medical researcher suggested a link
between the vaccine and autism, and received considerable publicity. During the 1990s
parental resistance to MMR vaccination grew, and many parents demanded that the National
Health Service instead provide single vaccines against the various diseases. Other parents
refused all vaccination. Both forms of parental resistance increased the incidence of the
diseases. Health policy researchers were asked to address these problems. They wanted to
add qualitative understanding to epidemiological and survey data. They proposed a >meta-
analysis= of qualitative studies. Initially their idea was to simply add together the samples
from a number of qualitative studies of parental resistance until they had what they regarded
as a large enough sample size from which to draw inferences. These researchers had no direct
expertise in qualitative research. Their background was in epidemiology. It had to be
explained that simply >adding together= a cluster of qualitative studies would be to ignore
the different modes of eliciting parental views, different analytic techniques, different degrees
of experience of vaccination amongst the respondents, and so on. >Adding together= would
do little more than multiply error.
3.1 Technological transformations
While the institutional frames within which multiple-method research is conducted cast a
strong influence over what is understood as legitimate methodological practice, social
research methodology is also responsive to new techniques, particularly those emergent from
the computational field. In this section we consider some current and potential
>transformative technologies= for their potential impact on the future of multiple-method
19
research.
A recent means of interrelating qualitative and quantitative data that embraces
Caracelli and Green=s integrated approach has emerged largely by stealth. This is the
development of quantification routines within computer-assisted qualitative data analysis
(‘CAQDAS’). Most qualitative software counts ‘hits’ from specified retrievals (e.g., all single
female interviewees who commented on divorce), and encourages triangulation by offering a
port to export data to SPSS and import quantitative data tables. Some argue that such
facilities represent a hybrid methodology transcending the quantitative/qualitative distinction
(Bazeley 1999; Bourdon 2000). These claims relate to software that enables statistical
information to be imported into qualitative databases and used to inform coding of text, with
coded information then being exported to statistical software for further quantitative analysis.
For example, NUD*IST's table import and export functions enable manipulation of exported
data either as information about codes that have been applied to the text or a matrix built
from cross-tabulated coded data. Some packages also have a command language for
automating repetitive or large-scale processes, allowing autocoding of data. Quantitative data
can be imported to inform interpretation before detailed coding, such as divisions within the
sample that emerged from survey response.
Possibilities for interrelating data range from sorting qualitative comments by
categorical or scaled criteria to incorporating the results of qualitative coding in
correspondance analysis, logistic regression or other multivariate techniques. Categorised
response sets exported to a statistics package for analysis are still linked to the qualitative
data from which they were developed. For example, a table in N-Vivo provides access to
qualitative data from each cell of the matrix produced when a cross tabulation-type search is
performed across data files. This enables users to show any number of socio-demographic
characteristics against any number of selected codes. Supplementing counts of hits, color-
graduation of table cells flags the density of coding in each cell. Analytic searches can thus
be composed of combinations of interpretive coding and coding representing socio-
demographic details.
Since the emergence of Grid and High Performance computing in the late 1990s, a
suite of new research tools has become available to social scientists (see Fielding 2003).
Large gains in computing resource offer new data-handling capacities and analytic
procedures, and new facilities to archive, curate and exploit social science data. A
20
development relevant to methodological integration is in >scaling up= findings from small-
scale studies, which often have small sample sizes, non-standardised definitions, and non-
cumulative patterns of inquiry, in such a way that inquiries by cognate qualitative researchers
can build on each other, and so that findings from integrated qualitative studies can in turn be
related to findings from quantitative research, exploiting meta-analysis strategies. Studies of
family formation, the household economy and health-related behaviour are amongst areas
where a number of qualitative studies, rich in themselves, have proved unable to >talk to
each other= due to varying conceptualisations addressing fundamentally rather similar
characteristics. XML protocols provide the basis of a meta-data model to integrate individual
analyses from cognate small-scale studies. In other words, we increasingly have just the tools
the medical researchers wanted in the MMR example above. By creating a translation
protocol between researchers, data, contexts and interpretations, using an XML data model
and wrappers around each individual study, the meta-data model can access and query
individual data sets. An ontology is used to specify a common vocabulary for both
methodological and substantive facets. The ontology is in effect a practical conciliation of
quantitative and qualitative epistemology. Defining it draws out and reconciles different
constructions of the features of the same phenomenon. The procedure of matching up the
disparate terminologies employed by different researchers in a number of independent studies
enables a ‘scaling up’ of findings without the problem of multiplying error. The ontology
‘translates’ between projects (so that what study A calls ‘conflict over shared space’ is
matched to ‘kids fight over bathroom rights’ in study B etc.), enabling generalisations and
heuristics derived from the different studies to be reliably combined while genuine
differences are identified and highlighted.
Another e-Research tool relates to the under-exploitation of archival data, particularly
in the qualitative field. The capacity to link data is a key issue in exploiting archived data:
linking qualitative and quantitative data, and linking material like personal biographies to
census data, maps, and so on. ‘Data Grids’ enable researchers to share annotations of data and
access multi-modal, distributed archival material with a view to producing multiple, inter-
linked analytic narratives. A given data event can be represented by multiple streams and
------. and Mary Jean Russo. (1999). Social experimentation. Thousand Oaks CA: Sage
24
Caracelli, Valerie and Jennifer Green (1993). ‘Data analysis strategies for mixed-method
evaluation designs’ Educational Evaluation and Policy Analysis 15: 195-207.
-----. (1997) >Crafting mixed method evaluation designs=, in J. Green and V. Caracelli, eds.,
Advances in mixed method evaluation, San Francisco CA: Jossey Bass
Creswell, John W. (2003). Research designs. Thousand Oaks, Ca., Sage. Second edition.
Denzin, Norman (1970) The Research Act, Chicago: Aldine
-----. (1989). The Research Act. New York, McGraw Hill. Second edition.
------ and Yvonna S. Lincoln. (2000). ‘Introduction: the discipline and practice of qualitative
research’, in N. Denzin and Y. Lincoln, eds., Handbook of qualitative research. Thousand
Oaks, CA: Sage, 1-28
Elliott, John (2005) Using narrative in social research, London: Sage
Fielding, Jane, Kerry Gray, Kate Burningham and Diana Thrush (2005). ‘Flood Warning for
Vulnerable Groups: Secondary analysis of flood data’. Bristol: Environment Agency.
-----. and Jo Moran-Ellis (2005) >Synergies and tensions in using multiple methods to study
vulnerability’. Presented at >Mixed-methods: identifying the issues’; Manchester, 26-27
October 2005
-----. and Kate Burningham, Diana Thrush and Rob Catt (2006). ‘Public Response to Flood
Warning’. Bristol, Environment Agency.
Fielding, Nigel. (2003) >Qualitative research and E-Social Science: appraising the
potential=, Swindon: ESRC, 43 pp.
-----. and Jane Fielding (1986) Linking Data, Beverly Hills: Sage
25
-----. and Ray Lee (2000) >Patterns and potentials in the adoption of qualitative software=,
Social Science Methodology in the New Millennium: Proceedings of the Fifth International
Conference on Logic and Methodology, Köln: Zentralarchiv fur Empirische Sozialforschung,
2000
----- and Margrit Schreier (2001). ‘Introduction: On the Compatibility between Qualitative
and Quantitative Research Methods’ Forum: Qualitative Social Research) 2(1).
Green, Jennifer, Valerie Caracelli and W. Graham (1989). ‘Towards a conceptual framework
for mixed-method evaluation design.’ Educational Evaluation and Policy Analysis 11(3):
255-274.
Hammersley, Martin and Paul Atkinson (1995) Ethnography: principles in practice, 2nd ed,
Tavistock
Johnson, Richard B. and A. John Onweugbuzie (2004) ‘Mixed methods research’,
Educational Researcher, 33 (7), 14-26
Kelle, Udo. (2001). ‘Sociological Explanations between Micro and Macro and the Integration
of Qualitative and Quantitative Methods’ Forum: Qualitative Social Research, 2 (1).
Koch, Sabine and Jorg Zumbach (2002) ‘The use of video analysis software in behavioural
observation research’, Forum: Qualitative Social Research, 3 (2)
Kuiken, Don and David Miall (2001). ‘Numerically-aided phenomenology’ Forum:
Qualitative Social Research, 2 (1).
Levins, Robert (1966) >The strategy of model building in population biology=, American
Scientist, 54, 420-440
26
Morgan, David (1998) >Practical strategies for combining qualitative and quantitative
methods= Qualitative Health Research, 8(3), 362-76
Needham, Rodney (1983) The tranquillity of axiom, Los Angeles: University of California
Press
Niglas, Katrin (2004) ‘The combined use of qualitative and quantitative methods in
educational research’, Tallinn, Estonia: Tallinn Pedagogical University
Rhind, David (2003) Great Expectations. London: Academy of Learned Societies in the
Social Sciences
Sieber, Sam (1979) >The integration of fieldwork and survey methods= American Journal of
Sociology, 78 (6)
Spencer, L., J. Ritchie, J. Lewis and L. Dillon (2003). ‘Quality in Qualitative Evaluation: a
framework for assessing research evidence’. Government Chief Social Research Office
Occasional Paper 2. London, Cabinet Office.
Spiers, J. (2000) ‘New perspectives on vulnerability using emic and etic approaches’, Journal
of Advanced Nursing 31(3): 715-721.
Tashakkori, Abbas and Charles Teddlie (1998) Mixed Methodology, Thousand Oaks CA:
Sage
Webb, Elizabeth, Donald Campbell, Robert Schwartz and Lee Sechrest (1966) Unobtrusive
measures, Chicago: Rand McNally
27
Table 1 Purpose or rationale of mixed method research designs Classification Purpose Triangulation convergence, corroboration and correspondence of results
from different methods Complementarity elaboration, illustration and clarification from one method
with the results of the other Development The results of one method are used to help develop or
inform the other (this may include sampling, implementation or measurement issues)
Initiation discovery of paradox - used to recast the questions or results of one method with the results of the other
Expansion (Parallel design)
expand the breadth of study using different methods for different components of the study.
Adapted from Greene et al (1989) Table 1 p. 259
Methods
Phen
omen
a
Status
Inter-dependence
Sequ
encin
g
Paradigms
Different
Unequal
Diffe
rent
Different
Sequ
entia
l
Independent
Same
Similar Same
Interactive Sim
ulta
neou
sEqual
1Figure 1 Dimensions of methodological design (Green et al. 1989)
28
2 Figure 2 Research design for the Vulnerable Groups Project
29
3 Figure 3 Research design for Public Response to Flood Warning Project