24
Buy Pitch Nathan Li & Jason Chen

Buy Pitch
Nathan Li & Jason Chen

Disclaimer
The analyses and conclusions of the Western Investment Club (“WIC") contained in this presentation are based on publicly available information. WIC recognizes that there may be confidential information in the possession of the companies discussed in the presentation that could lead these companies to disagree with WIC’s conclusions. This presentation and the information contained herein is not a recommendation or solicitation to buy or sell any securities.
The analyses provided may include certain statements, estimates and projections prepared with respect to, among other things, the historical and anticipated operating performance of the companies, access to capital markets and the values of assets and liabilities. Such statements, estimates, and projections reflect various assumptions by WIC concerning anticipated results that are inherently subject to significant economic, competitive, and other uncertainties and contingencies and have been included solely for illustrative purposes. No representations, express or implied, are made as to the accuracy or completeness of such statements, estimates or projections or with respect to any other materials herein. Actual results may vary materially from the estimates and projected results contained herein.
The sole responsibility for the content of this publication lies with the authors. Its contents do not reflect the opinion of the University Students’ Council of the University of Western Ontario (“USC”). The USC assumes no responsibility or liability for any error, inaccuracy, omission or comment contained in this publication or for any use that may be made of such information by the reader.

Table of Contents
Business Overview Investment Thesis Internal Analysis External Analysis Valuation Catalysts Risks Recommendation

Business Overview
Ticker NASDAQ: SYNT
Market Cap $3.80B
Current Price $45.03
52 Week Range $41.07 – $52.99
EV / EBITDA LTM 10.3x
Insider Ownership 62%
Syntel is a provider of outsourced IT & KPO services to North American and European non-industry companies (i.e. companies that are not IT companies).
Key Financials 1 Year Performance & Volume
Syntel provides clients with outsourced services that act as alternatives to hiring domestic employees. All services provided play a role in the client’s core operations.
– IT services: technology related job tasks and services with emphasis on software and system integration.
– KPO (Knowledge Processing Services): include job tasks that require professional expertise and formally educated personnel outside of IT. Usually includes middle and back office tasks:
• Risk management
• Data management
• Records management
Operations
Mar-15 Jun-15 Sep-15 Dec-1535
40
45
50
55
60
Volume Close

90.0%
9.3% 0.7%
North America Europe India and Other
Business OverviewSyntel generates revenue from all economic sectors through specializing in IT and KPO services exclusively.
Competitive Advantage: Global Delivery System Revenue by Economic Sector
Revenue by Geographic Region
On Site
Off SiteOffshore
49.0%
16.0%
14.0%
4.0%
17.0%
Banking & Financial ServicesHealthcare & Life SciencesInsuranceManufacturingRetail, Logistics & Telecom

Business Overview
IT Services– Software applications development,
maintenance, and testing
– IT infrastructure, cloud, and migration services
– Development of automation capabilities
– Social media, web and mobile applications, and analytics
Knowledge Processing Services (KPO)– Outsourced solutions for client’s knowledge and
business processes
– Middle and back-office processes
– E.g. Financial:
• Brokerage operations, fund accounting, trade processing, data management
– E.g. Insurance:
• Records management, claims processing and solutions, policy administration
Syntel delivers IT and KPO services through their global delivery system.
On Site– Services performed at the client’s location
Off Site– Services performed at Syntel’s US locations
Offshore– Services performed at Syntel’s Indian
locations Offers greater flexibility as the company can deliver
a unique mix that matches the client’s needs
Services Global Delivery System

Investment ThesisSYNT is unfairly punished due to the low valuation of its 3 largest clients, all of which have experienced downtrends in the past year.
3 Largest Clients Stock Performance (1 year)
21% of Syntel’s revenue• Poor quarterly performances and lost
a partnership with Costco• Financial performance regressed in
fiscal 2015 compared to 2014
15% of Syntel’s revenue• Derives a small amount of revenue
from interest spreads and is likely not going to benefit from rate hike
• Aggressive share repurchases without generating shareholder value
12% of Syntel’s revenue• All large cap transportation and
logistics companies are down due to a negative outlook on global macroeconomic factors
Mar-15 Jun-15 Sep-15 Dec-155055606570758085
Mar-15 Jun-15 Sep-15 Dec-155055606570758085
Mar-15 Jun-15 Sep-15 Dec-15120130140150160170180190

Investment Thesis
IT and KPO services are alternatives to domestic employees for core operations.
Syntel can generate revenue from struggling clients that have:
– Weak margins
– Cost reduction plans External factors that cannot be solved or eased
with cost reduction remain the only genuine threat.
The market overestimates the risks associated with large underperforming clients and overlooks existing growth potential.
AmEx confirmed approximately 4,000 job cuts during January 2015 in an effort to reduce costs and expand margins.
State Street confirmed around 600 job cuts around October – November 2015.
– They are implementing a $500 million cost reduction plan across the next 4 years.
– Reduction of jobs in the pursuit of digital transformation.
Deriving Revenue From Out of Favor Clients Opportunities for Growth
Large Clients Increased Purchases from Syntel in from 2014 to 2015 (in millions of USD)
2013 2014 20150
50
100
150
200
250
68.1105 120.1129.3 126.4 140.6
205.5 201.6 204
FDX STT AXP

SYNT offers discounted entry to the optimal segments of the growing offshore outsourced services industry, which is driven by global trends.
Syntel is Poised to Grow from the Momentum of the Offshore Outsourced Services Industry
Investment Thesis
Fixed Costs, fixed assets, investments, commitment to raise employees, in-house
operations
Variable-costs, consumption based models, external third
party services
Syntel Operates Only in the High-Margin Low-Risk Segments of the Industry
Globalization and the development of the Indian economy has established worldwide infrastructure for offshore service providers to sell to American clients.
Trends in operations management drive global trends to favour outsourced services.
KPO Professional services that
require educated labour outside of technology.
Statistics, risk management, actuarial roles.
Integrated into clients’ core operations.
IT Processing & hosting of client
data. IT consulting for client networks. Assorted software oriented job
roles. Integrated into clients’ core
operations.
BPO Basic tasks that require no
education. Customer support through
call centers. Administrative tasks. Simple bookkeeping. Considered to be non-
essential operations.
Genpact Wipro Syntel0%5%
10%15%20%25%30%35% Net Profit Margin Operating Margin 0 % of Revenues
Derived from BPO
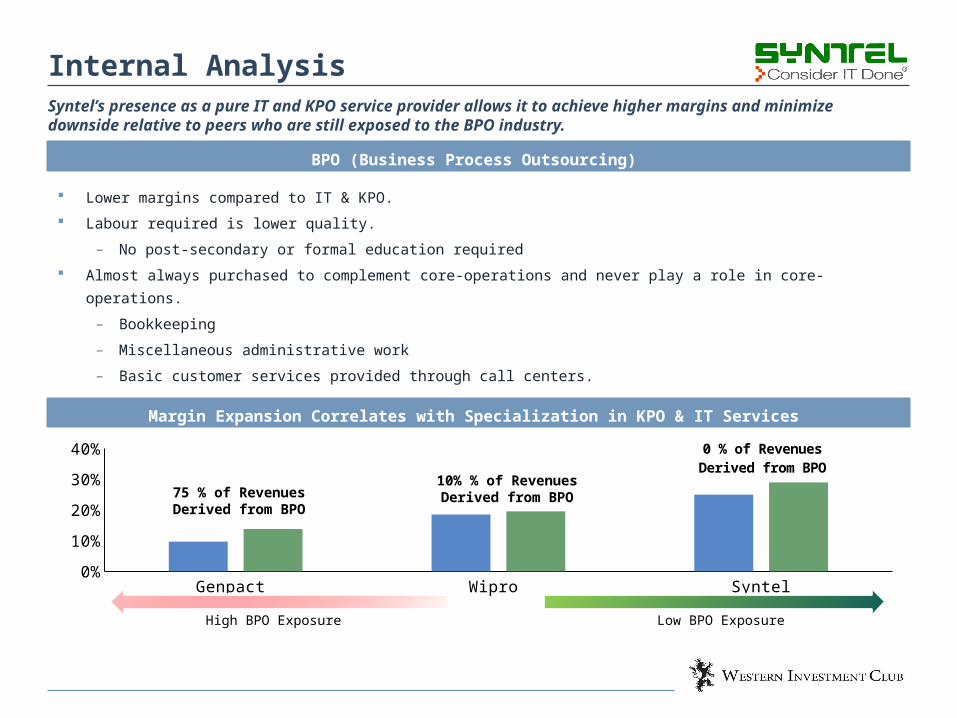
Lower margins compared to IT & KPO. Labour required is lower quality.
– No post-secondary or formal education required Almost always purchased to complement core-operations and never play a role in core-operations.
– Bookkeeping
– Miscellaneous administrative work
– Basic customer services provided through call centers.
Syntel’s presence as a pure IT and KPO service provider allows it to achieve higher margins and minimize downside relative to peers who are still exposed to the BPO industry.
BPO (Business Process Outsourcing)
Internal Analysis
Margin Expansion Correlates with Specialization in KPO & IT Services
Low BPO ExposureHigh BPO Exposure
10% % of Revenues Derived from BPO75 % of Revenues
Derived from BPO

Bharat Desai (right) and his spouse Neerja Sethi co-founded Syntel in 1980
Together they own 56% of common shares Both sit on the Board of Directors with
Bharat as Chairman No dividends since 2012 and no share
repurchases as management determined it was more valuable to reinvest cash into the business
Management’s goals are well-aligned with shareholders as they own over 56% of all shares
Bharat Desai and Neerja Sethi
Internal Analysis

External Analysis – Industry OutlooksAll 3 industries in which Syntel operates are expected to outpace the US economy in coming years.
2010-2015 2015-20200.00%
1.00%
2.00%
3.00%
4.00%
5.00%
6.00%
7.00%
2.60%3.20%
6.10%
4.10%
2% 2%
IT Consulting Data Processing & Hosting US Economy
The IT Services Industry is in a Stable Growth Stage
The KPO services industry is projected to grow at 23% CAGR from 2015-2019.
Syntel is in a strong position to gain from industry growth as they have established material KPO operations during the emerging stages of the industry.
Management last reported that 15% of revenue was derived from KPO services in fiscal 2013.
All 3 industries mentioned derive more revenue from the financial services sector than any other distinct economic sector.
Financial services is arguably the most technology reliant, non-technology sector.
This sector is looking to improve operational efficiency through increased usage of technology in years to come.
KPO Services is an Emerging Industry Ties to the Financial Services Sector

External Analysis – HeadcountIndia’s current economic state and economic outlook allows offshore outsourced service providers to continue employing educated Indian personnel at a huge discount to American graduates.
India is to Remain Competitive for Years to Come
Consistent Historical Headcount Growth
2010 2011 2012 2013 2014 20150
2,0004,0006,0008,000
10,00012,00014,00016,00018,00020,000
American Indian Total
India currently remains a huge service provider relative to other newly industrializing countries.
• Most newly industrializing countries rely on manufacturing to stimulate economic growth. Rapid GDP and GDP per capita growth allows India to maintain a healthy supply chain for the offshore
outsourced services industry. The Indian government implements stimulus to benefit MNC’s that employ Indian labour in services sector
through SEZ’s (Special Economic Zones).
• Syntel’s Indian offices operate almost exclusively within SEZ’s to receive governmental benefits.

Market Enterprise Net Income P/E EBITDA EV/EBITDA Top 5 Clients Adjusted BPO IT KPO$ in billions, except ratios Cap Value Margin LTM 2016E 2017E Margin LTM 2016E 2017E % of Revenue Beta % % %
Cognizant Technology $ 34.07 $ 30.41 13.1% 21.1x 16.5x 14.6x 19.9% 12.3x 10.6x 9.4x 11.0% 1.13 42% 58% 0%Infosys Limited 39.78 35.23 21.9% 19.6x 20.2x 17.7x 27.8% 13.7x 14.1x 12.3x N/A 0.73 N/A N/A N/AGenpact Limited 5.64 5.99 9.7% 24.6x 18.9x 16.8x 16.9% 14.7x 13.2x 11.9x 28.5% 0.89 75% 25% 0%Wipro Ltd. 19.94 16.84 17.9% 14.9x 14.7x 13.5x 21.6% 10.4x 10.0x 9.0x 13.0% 0.67 10% 90% 0%WNS Holdings Ltd. 1.48 1.33 10.6% 26.3x 24.7x 23.6x 17.3% 13.9x 11.2x 10.6x 33.0% 0.83 N/A N/A N/A
Low $ 1.48 $ 1.33 9.7% 14.9x 14.7x 13.5x 16.9% 10.4x 10.0x 9.0xMean 20.18 17.96 14.6% 21.3x 19.0x 17.2x 20.7% 13.0x 11.8x 10.6xMedian 19.94 16.84 13.1% 21.1x 18.9x 16.8x 19.9% 13.7x 11.2x 10.6xHigh 39.78 35.23 21.9% 26.3x 24.7x 23.6x 27.8% 14.7x 14.1x 12.3x
Syntel $ 3.80 $ 2.90 26.1% 15.1x 15.6x 14.7x 29.0% 10.3x 9.4x 8.6x 50% 0.81 0% 85% 15%
Valuation – Comparable CompaniesSyntel’s competitors operate primarily in the BPO and IT segments of the industry

Valuation – DCF
($ in USD thousands) 2013A 2014A 2015A 2016E 2017E 2018E 2019E 2020E
Unlevered Free Cash Flow $ 186,690 $ 180,946 $ 205,592 $ 213,982 $ 231,101 $ 244,967 $ 254,766 $ 264,956
Discount Factor 0.93 0.87 0.81 0.75 0.70 PV of Free Cash Flows $ 199,292 $ 200,459 $ 197,899 $ 191,685 $ 185,666 WACC 7.4%
Exit Multiple 11.0x 2020E EBITDA $ 394,107 Sensitivity Analysis – Implied UpsidePV of Terminal Value $ 3,037,841
Implied Perpetuity Growth Rate 1.19% Exit MultipleTotal Enterprise Value $ 4,012,842 26% 9.00x 10.00x 11.00x 12.00x 13.00x
Debt $ 130,000
WACC
7.4% 11.2% 18.5% 25.8% 33.1% 40.4%
Minority Interest - 7.9% 9.7% 16.8% 23.9% 31.1% 38.2%
Cash 875,722 8.4% 8.2% 15.2% 22.1% 29.1% 36.1%
Total Equity Value $ 4,758,564 8.9% 6.8% 13.6% 20.4% 27.2% 34.0%Fully Diluted Shares Outstanding 83,950 9.4% 5.4% 12.0% 18.7% 25.4% 32.0%
Fair Value Per Share $ 56.68 Current Price $ 45.03 Implied Upside 25.9%
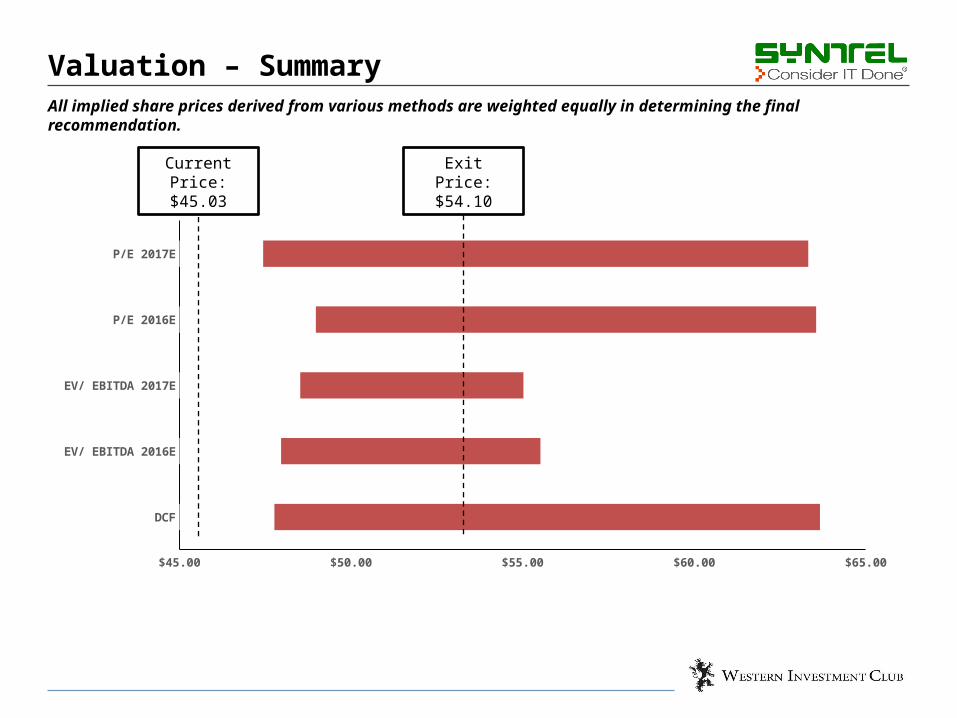
DCF
EV/ EBITDA 2016E
EV/ EBITDA 2017E
P/E 2016E
P/E 2017E
$45.00 $50.00 $55.00 $60.00 $65.00
Valuation – SummaryAll implied share prices derived from various methods are weighted equally in determining the final recommendation.
Current Price: $45.03
Exit Price: $54.10

Catalysts – European Market Penetration
If Syntel targets the British market, they can capitalize on the already established relationship between the UK and India.
The UK has a number of notable financial institutions with similar operations to STT.
The GBP has historically appreciated against the INR, offering margin relief if Syntel earns revenue from British clients.
Management has expressed interest in increasing penetration in the European market. Syntel has strong cash reserves, making M&A activity or expansion of infrastructure viable methods to increase market presence.
Pessimism towards SYNT can largely be attributed to risks associated with having a concentrated clientele with 3 large American clients.
In the long run, if Syntel diversifies their clientele with notable European clients, the stock will receive less punishment from investors who are concerned about such risks.
Integration of Services into European Companies Market Mispricing
Cash & Short Term Investments: 1.04B USD
48%
12%
40%
Cash Mutual Funds Term Deposits
European Sales Outpace American Sales
2013 2014 20150%
5%
10%
15%
20%
25%
30%
Europe US

Catalyst – Appreciation of USD to INR
Syntel records sales in USD as most of their clients are American and because they are an American company headquartered in the United States.
The great majority of their labour expenses are paid in INR as the vast majority of their headcount work at their Indian Global Development Centers.
As this trend continues, the quality of earnings reports will likely follow.
The USD has become stronger against a basket of foreign currencies due to the notable downtrend of commodity prices.
Operating Margin Relief Headcount Breakdown
USD Appreciation to INR
20%
78%
US Based India Based Other
Jan-10 Jan-11 Jan-12 Jan-13 Jan-14 Jan-15 Jan-1640
45
50
55
60
65
70
75
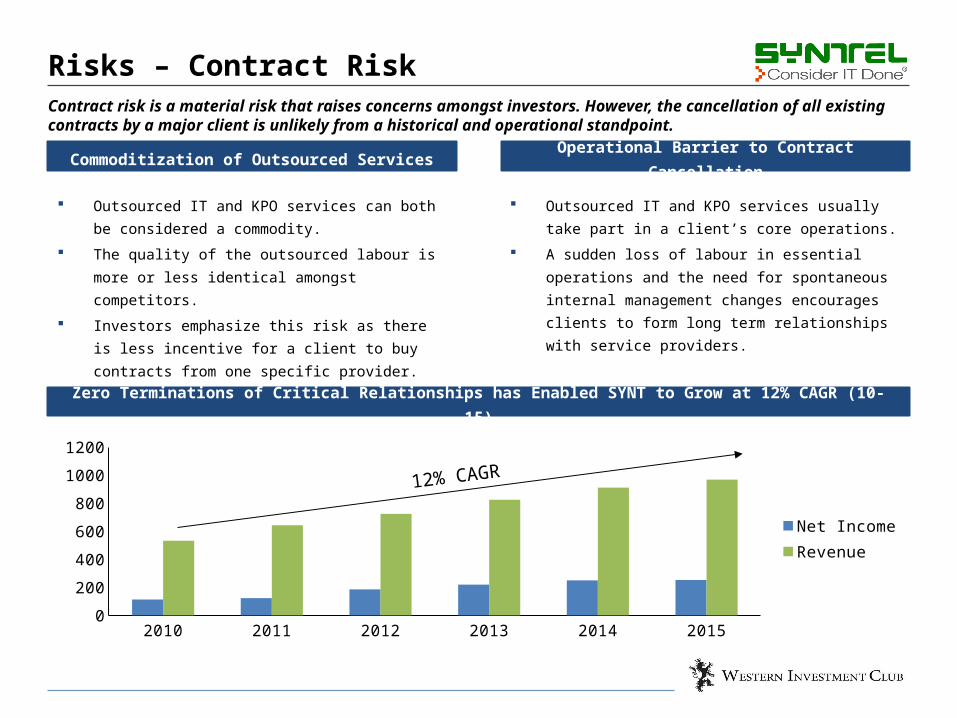
Risks – Contract Risk
Outsourced IT and KPO services can both be considered a commodity.
The quality of the outsourced labour is more or less identical amongst competitors.
Investors emphasize this risk as there is less incentive for a client to buy contracts from one specific provider.
Contract risk is a material risk that raises concerns amongst investors. However, the cancellation of all existing contracts by a major client is unlikely from a historical and operational standpoint.
Outsourced IT and KPO services usually take part in a client’s core operations.
A sudden loss of labour in essential operations and the need for spontaneous internal management changes encourages clients to form long term relationships with service providers.
Commoditization of Outsourced Services Operational Barrier to Contract Cancellation
Zero Terminations of Critical Relationships has Enabled SYNT to Grow at 12% CAGR (10-15)
2010 2011 2012 2013 2014 20150
200
400
600
800
1000
1200
Net IncomeRevenue
12% CAGR

Risks – General
The American government may place limitations on the amount of labour American companies can outsource to protect America’s working population.
– No regulations have historically impeded outsourced service providers in a material manner.
– There are not any notable regulations that are in the process of being implemented or are expected to be implemented
By increasing penetration in the European market, Syntel can diversify and reduce political risk generated from the American government.
Government Interference
If the current trend reverses and the rupee appreciates against the USD, Syntel could face inflated labour expenses and weakened revenue figures
India’s economic growth can raise living standards to a point where labour is too expensive for Syntel to rely on their Global Development Centers.
– Forcing Syntel to switch mass quantities of operations to other newly industrializing countries.
Foreign Exchange Risk Increases in Costs of Labour

Recommendation
Buy at: $45.03
Target Price: $54.10
Implied Upside: 20%
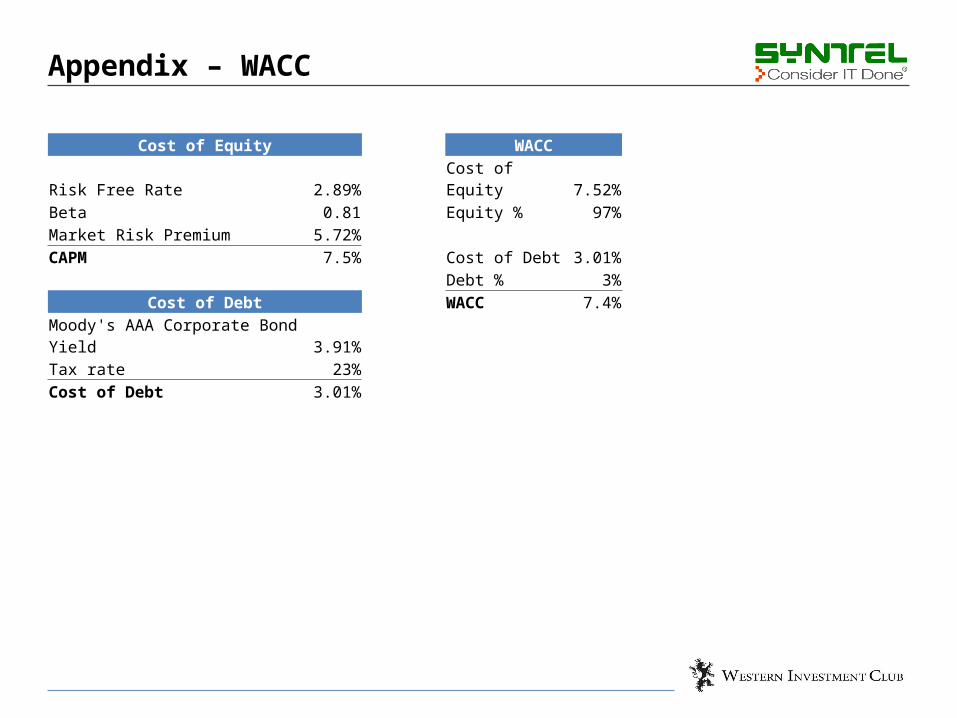
Appendix – WACC
Cost of Equity WACCRisk Free Rate 2.89% Cost of Equity 7.52%Beta 0.81 Equity % 97%Market Risk Premium 5.72%CAPM 7.5% Cost of Debt 3.01%
Debt % 3%Cost of Debt WACC 7.4%
Moody's AAA Corporate Bond Yield 3.91%Tax rate 23%Cost of Debt 3.01%
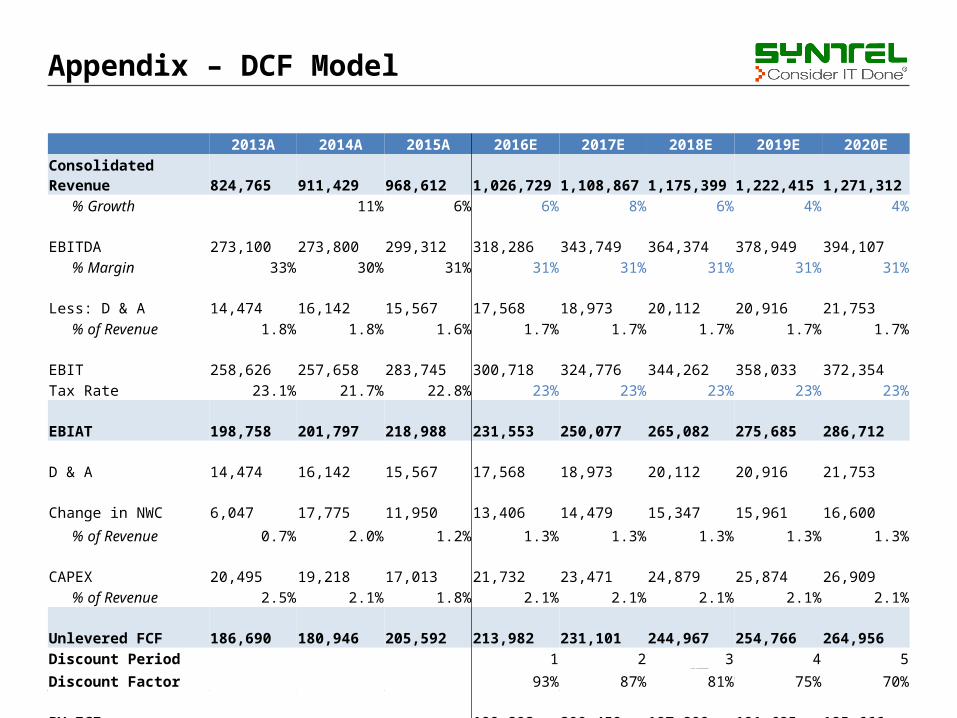
Appendix – DCF Model
2013A 2014A 2015A 2016E 2017E 2018E 2019E 2020EConsolidated Revenue 824,765 911,429 968,612 1,026,729 1,108,867 1,175,399 1,222,415 1,271,312
% Growth 11% 6% 6% 8% 6% 4% 4%EBITDA 273,100 273,800 299,312 318,286 343,749 364,374 378,949 394,107
% Margin 33% 30% 31% 31% 31% 31% 31% 31%Less: D & A 14,474 16,142 15,567 17,568 18,973 20,112 20,916 21,753
% of Revenue 1.8% 1.8% 1.6% 1.7% 1.7% 1.7% 1.7% 1.7%EBIT 258,626 257,658 283,745 300,718 324,776 344,262 358,033 372,354 Tax Rate 23.1% 21.7% 22.8% 23% 23% 23% 23% 23%EBIAT 198,758 201,797 218,988 231,553 250,077 265,082 275,685 286,712 D & A 14,474 16,142 15,567 17,568 18,973 20,112 20,916 21,753 Change in NWC 6,047 17,775 11,950 13,406 14,479 15,347 15,961 16,600
% of Revenue 0.7% 2.0% 1.2% 1.3% 1.3% 1.3% 1.3% 1.3%
CAPEX 20,495 19,218 17,013 21,732 23,471 24,879 25,874 26,909 % of Revenue 2.5% 2.1% 1.8% 2.1% 2.1% 2.1% 2.1% 2.1%
Unlevered FCF 186,690 180,946 205,592 213,982 231,101 244,967 254,766 264,956 Discount Period 1 2 3 4 5Discount Factor 93% 87% 81% 75% 70%PV FCF 199,292 200,459 197,899 191,685 185,666

Appendix – Revenue Breakdown
2012 2013 2014 2015Banking & Financial Services 397,801 423,238 455,100 474,943
Growth % - 6% 8% 4%Gross Profit 178,329 192,902 193,916 188,152
Margin % 45% 46% 43% 40%Healthcare & Life Sciences 126,863 138,578 147,424 157,970
Growth % - 9% 6% 7%Gross Profit 58,671 65,828 67,289 68822
Margin % 46% 48% 46% 44%Insurance 101,076 122,089 137,447 133,519
Growth % - 21% 13% -3%Gross Profit 40,936 49,609 50,050 494.97
Margin % 41% 41% 36% 0%Manufacturing 32,223 30,322 27,622 41,154
Growth % - -6% -9% 49%Gross Profit 12,915 10,844 8,136 13,111
Margin % 40% 36% 29% 32%Retail, Logistics & Telecom 65,940 110,538 143,836 161,026
Growth % - 68% 30% 12%Gross Profit 27,280 48,805 63,262 69,505
Margin % 41% 44% 44% 43%Consolidated Revenue 723,903 824,765 911,429 968,612
Consolidated Growth % - 14% 11% 6%


