3
2 1-x x 2-x/2 1-x x 2-x/2 x 1-x 2-x/2 x =0.1 ◦ ◦ ◦ ◦ ◦ 3+ 3+ 3+ 3 · 2 3 · 2 0.9 0.1 1.95 2θ ◦ α ◦ ◦ ◦ D D = W ρ/W 1 - W 2, W W 1
Vol. 127 (2015) ACTA PHYSICA POLONICA A No. 4
Proceedings of the 4th International Congress APMAS2014, April 24-27, 2014, Fethiye, Turkey
Synthesis and Characterization of Samarium-Doped CeO2
Powders as a Solid Electrolyte by Using Pechini Method
A. Arabac�
Istanbul University, Faculty of Engineering, Department of Metallurgical Engineering,
Avcilar 34320, Istanbul, Turkey
In the trivalent rare-earth doped ceria electrolyte for SOFC applications, the highest conductivities are observedfor Ce1−xSmxO2−x/2 and Ce1−xGdxO2−x/2. In this study, fully dense samarium doped ceria ceramics (SDC),SmxCe1−xO2−x/2 (x = 0.1) have been synthesized via Pechini method. The phase identi�cation, microstructuralproperties and bond structure of SDC samples were studied by using X-ray di�raction (XRD), scanning electronmicroscopy (SEM) and Fourier Transform- Infrared Spectroscopy (FTIR). The XRD results indicate that a single-phase �uorite structure has formed at relatively low calcination temperature of 500 ◦C. This method yields highpurity ultra�ne powders which can form dense electrolyte at relatively low sintering temperatures. The SEMresults show that a complete solid solution between ceria and samarium was obtained at the sintering temperatureof 1400 ◦C.
DOI: 10.12693/APhysPolA.127.888
PACS: 88.30.M-
1. Introduction
Solid oxide fuel cells (SOFCs) have a great potentialto be the cleanest, most e�cient, and versatile materialfor the chemical-to-electrical energy conversion. SOFCshave the advantage of fuel �exibility, and the capabil-ity of working with hydrogen, hydrocarbon reformateand, in some circumstances, directly with hydrocarbonfuels [1]. In general, traditional SOFC systems use yttria-stabilized zirconia (YSZ) as the electrolyte material [2, 3].This typical material requires a high operation tempera-ture (1000 ◦C). Such a high operation temperature intro-duces many practical problems, such as high costs, mate-rials degradation, thermal expansion mismatch, reactionsbetween the cell components, slow start-up and shut-o�,etc. [4, 5]. It is thus necessary to lower the operating tem-perature of the SOFCs. Ceria doped with alkaline earthoxides or rare earth oxides, has been considered as one ofthe most promising candidate materials for low operatingtemperature SOFCs because of its much higher ionic con-ductivity at lower temperatures in comparison with thatof stabilized zirconia. The ionic conductivity of ceria in-creases signi�cantly with the oxygen vacancies createdby the doping of rare earth cations into the ceria lattice.The ionic conductivity at 750 ◦C of doped ceria is simi-lar to that of YSZ at 1000 ◦C [6�8]. Among the variousdopants used, Sm3+, Dy3+, and Gd3+ are favorable forincreasing the ionic conductivity [6, 7, 9]. To obtain theceria based electrolyte materials, various techniques havebeen used such as sol�gel, combustion, mechanochemicaland homogeneous precipitation [10�13].In this study, high purity cerium and samarium salts
e-mail: [email protected]
were used to form ceria-based solid solution through thePechini method. Crystal structure and microstructurewere characterized by means of XRD and SEM. More-over, bond characterization of the SDC samples was per-formed by using Fourier Transform Infrared Spectroscopy(FT-IR) technique. The ionic conductivity of ceria dopedwith samarium was also determined via electrochemicalimpedance spectroscopy as a function of temperature byusing A.C. impedance spectroscopy in air.
2. Experimental Procedure
2.1. SDC Preparation
Cerium (III) nitrate hexahydrate (Ce(NO3)·6H2O,99.9%, Aldrich), samarium (III) nitrate hexahydrate(Sm(NO3)·6H2O, 99.9%, Aldrich) were used as metalprecursors and ethylene glycol (R.P. Normopur), citricacid (Boehringer Ingelheim) were selected for the poly-merization treatment. Ce0.9Sm0.1O1.95 was synthesizedby the Pechini method. More details about the Pechinimethod are reported in our earlier work [14].
2.2. Powder Characterization
XRD technique was used to determine the crystalstructure and phase purity. The X-ray spectra ofsamarium-doped ceria particles were obtained over the2θ range of 10�90◦ by using Rigaku D/max-2200 PCX-ray di�ractometer with Cu-Kα radiation at a scan of2 ◦/min. The calcined powders were pressed into a diskat 200 MPa with CIP. The compact disk of SDC powderswas then sintered at 1400 ◦C for 6 h with a heating rateof 5 ◦C/min. The densities of the sintered discs (Dpellet)were determined by using the well- known Archimedes'smethod ( Eq. 1):
Dpellet =Wρ/W1−W2, (1)
where W is the dry weight, W1 is the wet weight (water
(888)
Synthesis and Characterization of Samarium-Doped CeO2 Powders. . . 889
in body), W2 is the body's submerged weight without�ne wire and ρ is the density of the solvent (water at25 ◦C, 0.997 g cm−3). The value of theoretical density(Dth) was calculated as 7.16 g cm−3.The structural features of the gel SDC precursor (dried
at 110 ◦C) and reactants were characterized by Perkin-Elmer FT-IR (Spectrum 100) spectroscopy using KBrpellet method in the range of 400�4000 cm−1. The mi-crostructure of the sintered samples was characterized bymeans of SEM using FEI Quanta FEG 450 microscope.The ionic conductivity measurements of the sintered pel-lets were obtained with an AC impedance analyzer (So-lartron 1260 FRA and 1296 interface) in the temperaturerange of 250�550 ◦C in air atmosphere.
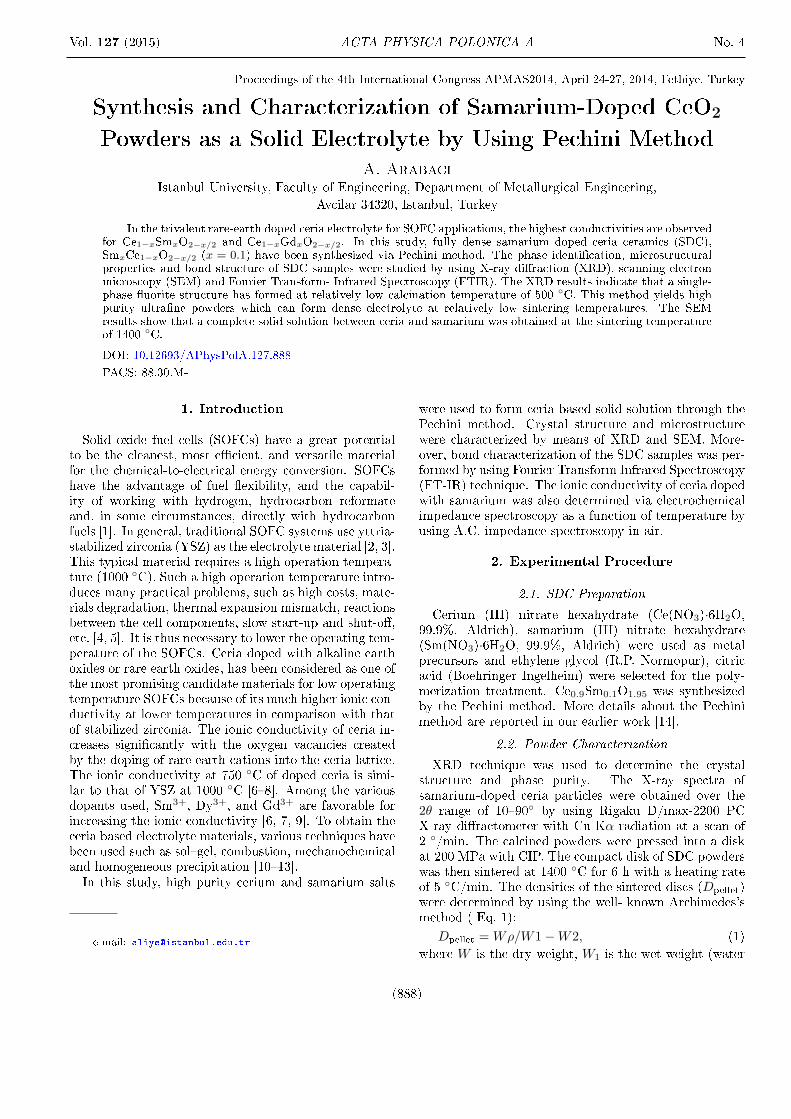
Fig. 1. XRD patterns of the SDC powders calcined at300, 500, 700 and 1000 ◦C, 2 h.
3. Results and Discussion
3.1. X-ray Analysis
The XRD patterns for the SDC powders are shownin Fig. 1. According to the results of XRD, all pow-ders had a single-phase �uorite structure, even when cal-cined at 300 ◦C. It can be clearly seen that characteristicdi�raction peaks related to �uorite-like structure werearound 300 ◦C. This indicates that a relatively low cal-cination temperature is needed to prepare SDC powdersby the Pechini method. The crystallite size of the pow-ders calcined at 300 ◦C is 10.8 nm. These peaks gradu-ally sharpen with increasing heat treatment temperature,which indicates the increase of the crystallite size. Thesamarium oxide was not detected. The results indicatethat the dopant ion was fully substituted in the CeO2
lattice.3.2. FT-IR Analysis
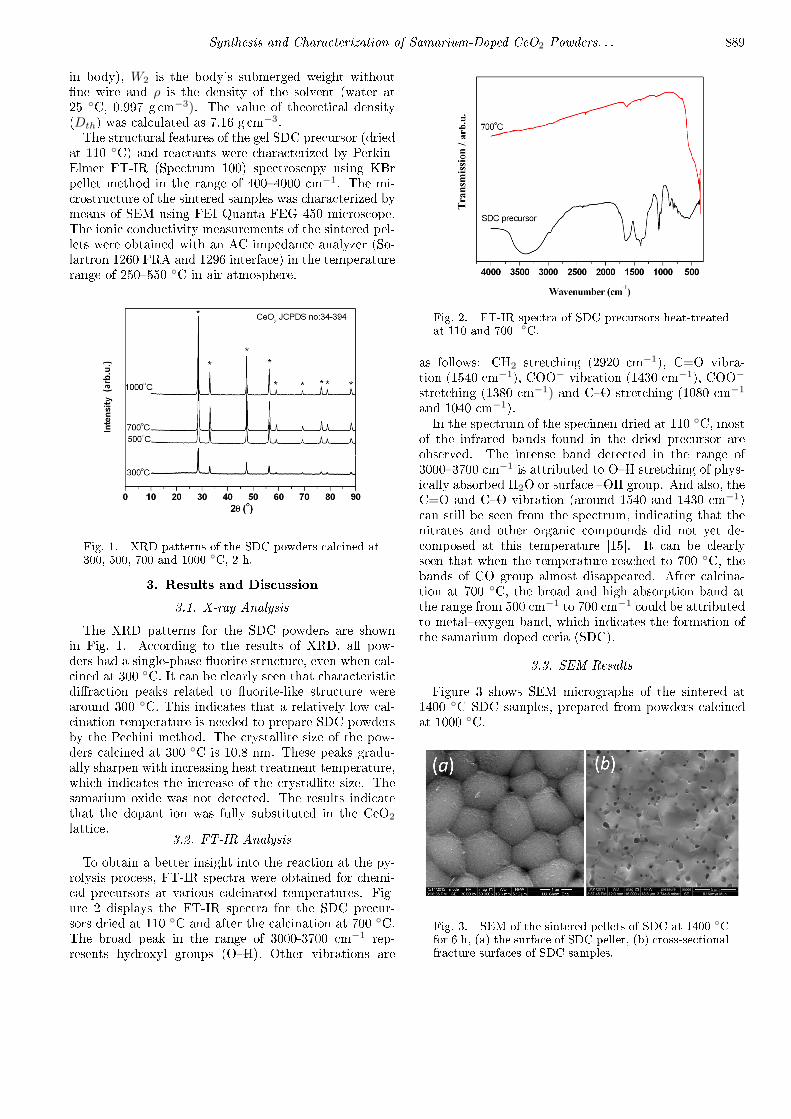
To obtain a better insight into the reaction at the py-rolysis process, FT-IR spectra were obtained for chemi-cal precursors at various calcinated temperatures. Fig-ure 2 displays the FT-IR spectra for the SDC precur-sors dried at 110 ◦C and after the calcination at 700 ◦C.The broad peak in the range of 3000-3700 cm−1 rep-resents hydroxyl groups (O�H). Other vibrations are
Fig. 2. FT-IR spectra of SDC precursors heat-treatedat 110 and 700 ◦C.
as follows: CH2 stretching (2920 cm−1), C=O vibra-tion (1540 cm−1), COO− vibration (1430 cm−1), COO−
stretching (1380 cm−1) and C�O stretching (1080 cm−1
and 1040 cm−1).In the spectrum of the specimen dried at 110 ◦C, most
of the infrared bands found in the dried precursor areobserved. The intense band detected in the range of3000�3700 cm−1 is attributed to O�H stretching of phys-ically absorbed H2O or surface �OH group. And also, theC=O and C�O vibration (around 1540 and 1430 cm−1)can still be seen from the spectrum, indicating that thenitrates and other organic compounds did not yet de-composed at this temperature [15]. It can be clearlyseen that when the temperature reached to 700 ◦C, thebands of CO group almost disappeared. After calcina-tion at 700 ◦C, the broad and high absorption band atthe range from 500 cm−1 to 700 cm−1 could be attributedto metal�oxygen band, which indicates the formation ofthe samarium doped ceria (SDC).
3.3. SEM Results
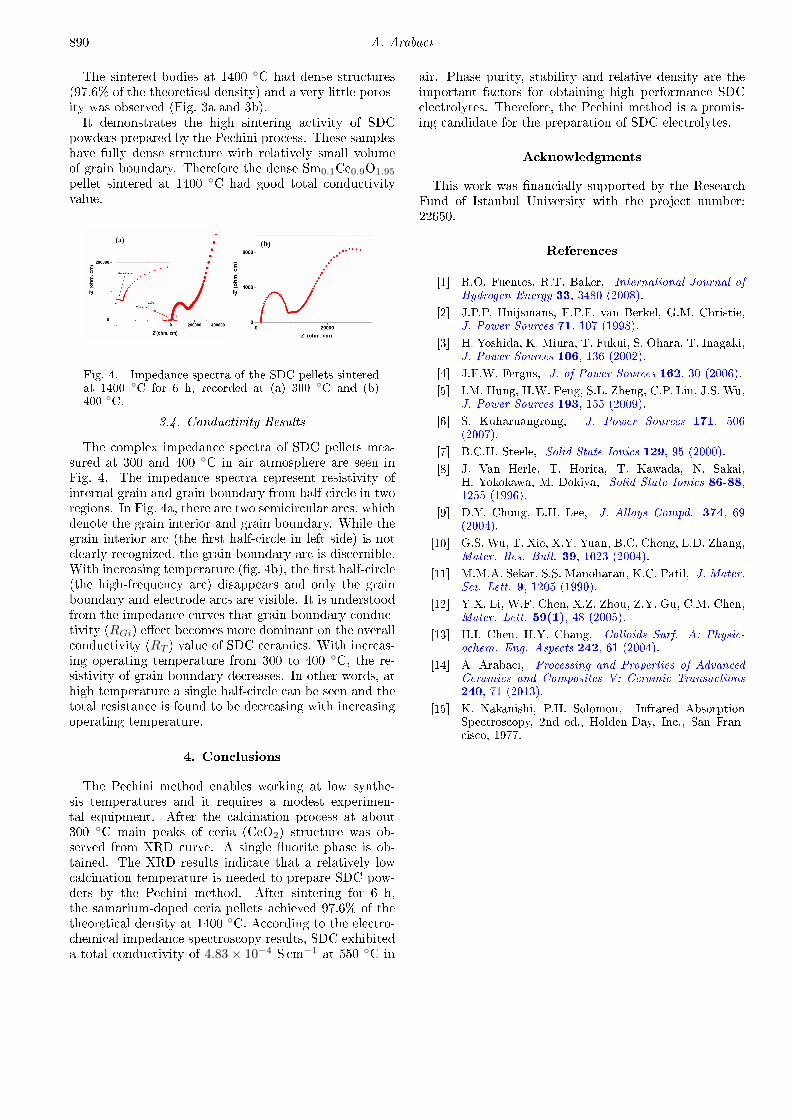
Figure 3 shows SEM micrographs of the sintered at1400 ◦C SDC samples, prepared from powders calcinedat 1000 ◦C.
Fig. 3. SEM of the sintered pellets of SDC at 1400 ◦Cfor 6 h, (a) the surface of SDC pellet, (b) cross-sectionalfracture surfaces of SDC samples.
890 A. Arabac�
The sintered bodies at 1400 ◦C had dense structures(97.6% of the theoretical density) and a very little poros-ity was observed (Fig. 3a and 3b).It demonstrates the high sintering activity of SDC
powders prepared by the Pechini process. These sampleshave fully dense structure with relatively small volumeof grain boundary. Therefore the dense Sm0.1Ce0.9O1.95
pellet sintered at 1400 ◦C had good total conductivityvalue.
Fig. 4. Impedance spectra of the SDC pellets sinteredat 1400 ◦C for 6 h, recorded at (a) 300 ◦C and (b)400 ◦C.
3.4. Conductivity Results
The complex impedance spectra of SDC pellets mea-sured at 300 and 400 ◦C in air atmosphere are seen inFig. 4. The impedance spectra represent resistivity ofinternal grain and grain-boundary from half-circle in tworegions. In Fig. 4a, there are two semicircular arcs, whichdenote the grain interior and grain boundary. While thegrain interior arc (the �rst half-circle in left side) is notclearly recognized, the grain boundary arc is discernible.With increasing temperature (�g. 4b), the �rst half-circle(the high-frequency arc) disappears and only the grainboundary and electrode arcs are visible. It is understoodfrom the impedance curves that grain boundary conduc-tivity (RGi) e�ect becomes more dominant on the overallconductivity (RT ) value of SDC ceramics. With increas-ing operating temperature from 300 to 400 ◦C, the re-sistivity of grain boundary decreases. In other words, athigh temperature a single half-circle can be seen and thetotal resistance is found to be decreasing with increasingoperating temperature.
4. Conclusions
The Pechini method enables working at low synthe-sis temperatures and it requires a modest experimen-tal equipment. After the calcination process at about300 ◦C main peaks of ceria (CeO2) structure was ob-served from XRD curve. A single �uorite phase is ob-tained. The XRD results indicate that a relatively lowcalcination temperature is needed to prepare SDC pow-ders by the Pechini method. After sintering for 6 h,the samarium-doped ceria pellets achieved 97.6% of thetheoretical density at 1400 ◦C. According to the electro-chemical impedance spectroscopy results, SDC exhibiteda total conductivity of 4.83 × 10⁻⁴ S cm−1 at 550 ◦C in
air. Phase purity, stability and relative density are theimportant factors for obtaining high performance SDCelectrolytes. Therefore, the Pechini method is a promis-ing candidate for the preparation of SDC electrolytes.
Acknowledgments
This work was �nancially supported by the ResearchFund of Istanbul University with the project number:22650.
References
[1] R.O. Fuentes, R.T. Baker, International Journal ofHydrogen Energy 33, 3480 (2008).
[2] J.P.P. Huijsmans, F.P.F. van Berkel, G.M. Christie,J. Power Sources 71, 107 (1998).
[3] H. Yoshida, K. Miura, T. Fukui, S. Ohara, T. Inagaki,J. Power Sources 106, 136 (2002).
[4] J.F.W. Fergus, J. of Power Sources 162, 30 (2006).
[5] I.M. Hung, H.W. Peng, S.L. Zheng, C.P. Lin, J.S. Wu,J. Power Sources 193, 155 (2009).
[6] S. Kuharuangrong, J. Power Sources 171, 506(2007).
[7] B.C.H. Steele, Solid State Ionics 129, 95 (2000).
[8] J. Van Herle, T. Horita, T. Kawada, N. Sakai,H. Yokokawa, M. Dokiya, Solid State Ionics 86-88,1255 (1996).
[9] D.Y. Chung, E.H. Lee, J. Alloys Compd. 374, 69(2004).
[10] G.S. Wu, T. Xie, X.Y. Yuan, B.C. Cheng, L.D. Zhang,Mater. Res. Bull. 39, 1023 (2004).
[11] M.M.A. Sekar, S.S. Manoharan, K.C. Patil, J. Mater.Sci. Lett. 9, 1205 (1990).
[12] Y.X. Li, W.F. Chen, X.Z. Zhou, Z.Y. Gu, C.M. Chen,Mater. Lett. 59(1), 48 (2005).
[13] H.I. Chen, H.Y. Chang, Colloids Surf. A: Physic-ochem. Eng. Aspects 242, 61 (2004).
[14] A. Arabac�, Processing and Properties of AdvancedCeramics and Composites V: Ceramic Transactions240, 71 (2013).
[15] K. Nakanishi, P.H. Solomon, Infrared AbsorptionSpectroscopy, 2nd ed., Holden-Day, Inc., San Fran-cisco, 1977.


