ORIGINAL ARTICLE Synthesis and characterization of zeolite A by hydrothermal transformation of natural Jordanian kaolin Mousa Gougazeh a, * , J.-Ch. Buhl b a Natural Resources and Chemical Engineering Department, Faculty of Engineering, Tafila Technical University, P.O. Box 179 Tafila 66110, Jordan b Institute of Mineralogy, Leibniz University Hannover, Callinstr. 3, D-30167 Hannover, Germany Received 6 March 2012; revised 4 March 2013; accepted 31 March 2013 Available online 29 April 2013 KEYWORDS Zeolite A; Kaolin; Metakaolin; Hydrothermal synthesis; Hydroxysodalite Abstract The synthesis of zeolite materials by hydrothermal transformation of natural Jordanian kaolin in NaOH solutions of various concentrations was investigated at 100 °C for 20 h. A mix- ture of zeolite A, quartz and hydroxysodalite (HS) was obtained. Zeolite A was the main product with the NaOH concentrations of 1.50–3.50 M, which was confirmed by XRD, IR and SEM. Zeolite A can be obtained from natural kaolin under the conditions applied showing that metakaolinization can be observed at 650 °C which is much lower than the temperatures given in the previous works, 700–950 °C. The products obtained from the experiments were characterized by X-ray diffraction (XRD), Fourier transform infrared spectroscopy (FTIR) and scanning electron microscopy (SEM). ª 2013 Production and hosting by Elsevier B.V. on behalf of University of Bahrain. 1. Introduction Zeolites are crystalline, microporous, hydrated aluminosili- cates of alkaline or alkaline earth metals. The frameworks are composed of [SiO 4 ] 4and [AlO 4 ] 5tetrahedra, which corner-share to form different open structures. Negative charge of lattice is compensated by the positive charge of cat- ions located at specific positions of zeolite framework (Bek- kum et al., 1991; Breck, 1974). In most of zeolites the compensating cations are usually mono- and bi-valent metal ions and/or their combinations (Engelhardt and Michel, 1987; Takaishi et al., 1995; Earl and Deem, 2006). In accor- dance with the Loewenstein’s rule (Loewenstein, 1954), Al– O–Al bonds do not exist in aluminosilicate frameworks of zeo- lite. Instead of the tetrahedrally bonded atoms Si and Al, so- called ‘‘T-atoms’’, others such as P, Ga, Ge, B, Be, etc. can ex- ist in the framework as well (McCusker and Baerlocher, 2001; Takaishi et al., 1995). The synthesis of zeolites in forms suitable for industrial applications is of great importance. The first synthesis of * Corresponding author. Tel.: +962 776731158. E-mail addresses: [email protected](M. Gougazeh), [email protected](J.-Ch. Buhl). Peer review under responsibility of University of Bahrain. Production and hosting by Elsevier Journal of the Association of Arab Universities for Basic and Applied Sciences (2014) 15, 35–42 University of Bahrain Journal of the Association of Arab Universities for Basic and Applied Sciences www.elsevier.com/locate/jaaubas www.sciencedirect.com 1815-3852 ª 2013 Production and hosting by Elsevier B.V. on behalf of University of Bahrain. http://dx.doi.org/10.1016/j.jaubas.2013.03.007
Transcript
Journal of the Association of Arab Universities for Basic and Applied Sciences (2014) 15, 35–42
University of Bahrain
Journal of the Association of Arab Universities for
Basic and Applied Scienceswww.elsevier.com/locate/jaaubas
Peer review under responsibility of University of Bahrain.
Production and hosting by Elsevier
1815-3852 ª 2013 Production and hosting by Elsevier B.V. on behalf of University of Bahrain.
http://dx.doi.org/10.1016/j.jaubas.2013.03.007
Mousa Gougazeha,*, J.-Ch. Buhl
b
a Natural Resources and Chemical Engineering Department, Faculty of Engineering, Tafila Technical University, P.O. Box 179Tafila 66110, Jordanb Institute of Mineralogy, Leibniz University Hannover, Callinstr. 3, D-30167 Hannover, Germany
Received 6 March 2012; revised 4 March 2013; accepted 31 March 2013Available online 29 April 2013
KEYWORDS
Zeolite A;
Kaolin;
Metakaolin;
Hydrothermal synthesis;
Hydroxysodalite
Abstract The synthesis of zeolite materials by hydrothermal transformation of natural Jordanian
kaolin in NaOH solutions of various concentrations was investigated at 100 �C for 20 h. A mix-
ture of zeolite A, quartz and hydroxysodalite (HS) was obtained. Zeolite A was the main product
with the NaOH concentrations of 1.50–3.50 M, which was confirmed by XRD, IR and
SEM. Zeolite A can be obtained from natural kaolin under the conditions applied showing that
metakaolinization can be observed at 650 �C which is much lower than the temperatures given in
the previous works, 700–950 �C. The products obtained from the experiments were characterized
by X-ray diffraction (XRD), Fourier transform infrared spectroscopy (FTIR) and scanning
electron microscopy (SEM).ª 2013 Production and hosting by Elsevier B.V. on behalf of University of Bahrain.
1. Introduction
Zeolites are crystalline, microporous, hydrated aluminosili-cates of alkaline or alkaline earth metals. The frameworks
are composed of [SiO4]4� and [AlO4]
5� tetrahedra, which
corner-share to form different open structures. Negativecharge of lattice is compensated by the positive charge of cat-ions located at specific positions of zeolite framework (Bek-kum et al., 1991; Breck, 1974). In most of zeolites the
compensating cations are usually mono- and bi-valent metalions and/or their combinations (Engelhardt and Michel,1987; Takaishi et al., 1995; Earl and Deem, 2006). In accor-
dance with the Loewenstein’s rule (Loewenstein, 1954), Al–O–Al bonds do not exist in aluminosilicate frameworks of zeo-lite. Instead of the tetrahedrally bonded atoms Si and Al, so-
called ‘‘T-atoms’’, others such as P, Ga, Ge, B, Be, etc. can ex-ist in the framework as well (McCusker and Baerlocher, 2001;Takaishi et al., 1995).
The synthesis of zeolites in forms suitable for industrialapplications is of great importance. The first synthesis of
Chemical constituents in wt.% [X-ray fluorescence analysis (XRF)]
SiO2 53.86
TiO2 0.74
Al2O3 32.45
Fe2O3 0.65
MnO 0.01
MgO 0.08
CaO 0.13
Na2O 0.06
K2O 0.54
P2O5 0.12
Loss on ignition (LOI) 11.21
Total 99.85
SiO2/Al2O3 ratio 1.65
Particle size distribution in wt.% [Atterberg method]
Microns 63–45 lm 1.2
Microns �45+6 lm 5.2
Microns �6+2 lm 20.6
Microns �2 lm 73.0
Quantitative analysis in wt.% [using XRD (Rietveld method with
DIFFRACplus TOPAS software) + XRF]
Kaolin 72.0
Quartz 27.0
Others 1 .0
Brightness (% ISO) 82.73
36 M. Gougazeh, J.-Ch. Buhl
zeolite was attempted by St. Claire-Deville in 1862. Barrer’spioneering work in 1948 demonstrated that a wide range ofzeolites could be synthesized from aluminosilicate gels.
At present, synthetic zeolites are used commercially moreoften than natural zeolites due to the purity of crystallineproducts and the uniformity of particle sizes (Breck, 1974;
Szoztak, 1998). However, the preparation of synthetic zeolitesfrom chemical sources of silica and alumina is expensive. Suchcosts may be reduced by the use of clay minerals, volcanic
glasses (perlite and pumice), rice husks, diatoms, fly ash or pa-per sludge ash as starting materials (Adamczyk and Bialecka,2005; Querol et al., 1997; Saija et al., 1983; Tanaka et al.,2004; Walek et al., 2008; Wang et al., 2008). Zeolite has also
been developed by the transformation of one zeolite type intoother zeotypes (Rios et al., 2007; Sandoval et al., 2009).
Previous work has shown that kaolin is not stable under
highly alkaline conditions and different zeolitic materials canform, and that kaolin is usually used after calcinations to ob-tain a more reactive phase (metakaolin). After dehydration
(endothermic dehydroxylation), kaolin is transformed intoamorphous metakaolin (Fialips, 1999; Gougazeh and Buhl,2010; Smykatz-Kloss, 1975). Raw kaolin and metakaolin have
been used as the Al and Si sources for synthesis of zeolite Lin-de Type A, X, Y, P, 4A, NaA, KI, cancrinite, sodalite,hydroxysodalite, faujasite, phillipsite, chabazite and severalother types of zeolites (e.g., Akolekar et al., 1997; Alberti
et al., 1994; Barnes et al., 1999a, 1999b, 1999c; Bauer and Ber-ger, 1998; Bauer et al., 1998; Buhl, 1991; Buhl et al., 2000a,b;Buhl and Loens, 1996; Covarrubias et al., 2006; Dudzik and
Kowalak, 1974; Gualtieri et al., 1997; Lin et al., 2004; Loiolaet al., 2012; Marcelo et al., 2007; Mon et al., 2005; Rees andChandrasekhar, 1993; Sanhueza et al., 1999; Vilma et al.,
1999; Zhao et al., 2004.NaA Zeolite is of great industrial importance due to its
molecular sieving, ion exchange and water adsorption proper-
ties. With the molar ratio Si/Al nearly equal to one, kaolin isan ideal raw material for preparing NaA zeolite. Kaolin wasone of the most versatile industrial minerals and was usedextensively for many applications (Murray, 1991). The synthe-
sis of NaA zeolite from kaolin source was started from the1970s (Breck, 1974; Barrer, 1978) by the hydrothermal reactionof dehydroxylated kaolin with sodium hydroxide solution.
No attempt has been made previously to produce zeolitetype A from natural Jordanian kaolin. In this work, ZeoliteA was hydrothermally synthesized from Jordanian kaolin,
and the effect of NaOH concentration (1.0, 1.5, 2.0, 2.5, 3.5and 4 M NaOH) was investigated. The synthesized productswere characterized by X-ray diffraction (XRD) scanning elec-tron microscopy (SEM) and Fourier transform infrared (FT-
IR) spectroscopy.
2. Experimental
2.1. Raw materials and chemical reagent
The natural well crystallized kaolin (a combined source for sil-ica and alumina), from the kaolin deposits in south Jordan(Gougazeh and Buhl, 2010) was used for the present study.
The sodium hydroxide used was of analytical grade. Propertiesof Jordanian kaolin are shown in Table 1. Metakaolin was ob-tained by calcining kaolin in a muffle furnace at 650 �C for 2 h.
2.2. Hydrothermal synthesis
Metakaolins were separately mixed with NaOH solutions ofvarious concentrations, 1.0, 1.5, 2.0, 2.5, 3.0, 3.5 and 4.0 M.The samples were initially gently stirred for 10 min at room
temperature for homogenization. The solid/liquid ratio ofmetakaolin to alkaline solution was 1.0 g/25 ml. The reactionmixtures were prepared separately with gentle stirring and then
distributed among the required number of autoclaves. Theautoclaves were kept in a conventional air oven at 100 �C for20 h at autogenous pressure. The synthesized products were
washed with distilled water three times and then dried at80 �C for 24 h.
2.3. Characterization techniques
The original kaolin sample was dispersed in deionized waterand shaken mechanically and then sieved through a 63 lmsieve. The portion of the <63 lm fraction (�98 wt.% of the
original kaolin sample) was allowed to settle in an Atterbergcylinder according to Stock’s law (Jachson, 1975) to separatethe size fractions of 63–45 lm, 45–6 lm, 6–2 lm and <2 lm(Gougazeh and Buhl, 2010).
The chemical composition of kaolin was determined using aBruker S4 wavelength X-ray dispersive fluorescence spectrom-
eter (WDXRFS), with a Rh X-ray tube. Phase characterizationwas carried out by X-ray diffraction (XRD) using a BrukerAXS D4 ENDEAVOR diffractometer using Ni filtered Cu
Ka radiation at 40 kV and 40 mA. The measurements werecarried out with a step width of 0.03� 2h and scan rate of 1 sper step. The diffraction data were analyzed by the Rietveldmethod using DIFFRACplus TOPAS software. Fourier trans-
form infrared spectra (FTIR) were obtained by using a BrukerIFS66v FTIR spectrometer in 4000–400 cm�1 regions by theKBr wafer technique. The morphology was characterized by
5 10 15 20 25 30 35 40 45 50 55 60
Inte
nsit
y
o2θ (CuKα)
K K
Qz
Qz
K
K
KK
Qz KQz K
K
Qz
a
b
K KKK
KFsM
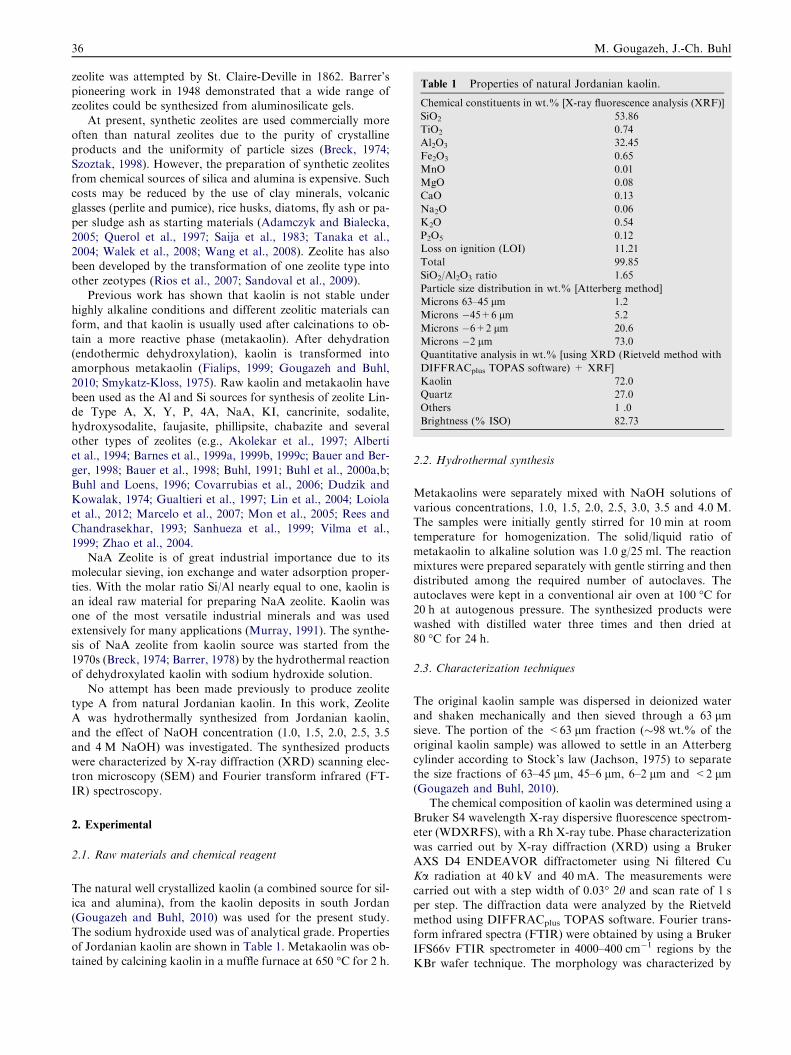
Figure 1 XRD patterns of Jordanian kaolin (a) and metakaolin at 650 �C (b).
Table 2 Phase composition of the obtained zeolite products
(wt.%) was performed using the Rietveld method with DIF-
FRACplus TOPAS software.
NaOH(M) Quartz Hydroxysodalite
(HS)
Zeolite
A
Metakaolin
(amorphous)
Total
1.0 30.2 0.0 39.7 30.1 100.0
1.5 25.6 4.2 70.2 0.0 100.0
2.0 24.3 3.8 71.9 0.0 100.0
2.5 18.0 7.8 74.2 0.0 100.0
3.0 16.9 8.5 74.6 0.0 100.0
3.5 16.3 15.4 68.2 0.0 100.0
4.0 15.4 33.8 50.8 0.0 100.0
Synthesis and characterization of zeolite A byhydrothermal transformation of natural Jordanian
a scanning electron microscope (SEM) at 20 kV, using a JEOLJSM-6390A model.
3. Results and discussion
The kaolin used was fully characterized (mineralogical and
chemical composition, thermal behavior, particle size distribu-tion, and so on) in previous study (Gougazeh and Buhl, 2010).The grain size analysis of bulk kaolin sample was separated by
Atterberg methods. The quantitative analysis of the mineralcontent of the natural Jordanian kaolin has been worked outby a combination of XRD (Rietveld method using DIF-
FRACplus TOPAS software) and XRF investigations (Gou-gazeh and Buhl, 2010).
The physical, chemical and mineralogical properties of thekaolin under study are presented in Table 1.
The SiO2/Al2O3 ratio is found to be 1.65. The properties ofthe reaction intermediates and products were determined byvarious techniques to give the following results.
3.1. X-ray diffraction analysis
The XRD patterns of the natural (unheated) kaolin and
metakaolin are shown in Fig. 1. In accordance with XRD data,the starting material contains 72 wt.% of kaolin, 27 wt.% ofquartz and minor amount (about 1 wt.%) of other compo-
nents (see Table 1). Kaolinite is identified by its characteristicX-ray diffraction peaks at 12.34� and 24.64� 2h as has been re-ported in previous studies (Gougazeh and Buhl, 2010; Zhaoet al., 2004). The XRD pattern of metakaolin obtained by
heating the kaolin for 3 h at 650 �C resembled others, exceptfor the peaks due to admixed impurities. After thermal treat-
ment, the XRD patterns exhibit a significant change in com-parison to the pattern of untreated kaolin, which was
characterized by disappearance of the diffraction peaks of kao-lin, accompanied by the appearance of amorphous aluminosil-icate. Metakaolin is of amorphous structure and the highest
diffraction peaks correspond to the presence of quartz(SiO2), which is very common (Fig. 1b). The only crystallinephase in metakaolin is quartz. Therefore, the activation of
kaolin produces structural changes of this mineral, promotingits reactivity to synthesize zeolitic materials.
The phase composition of the synthesized zeolite materialwhich was obtained from the activated kaolin samples reacted
with 1.0, 1.5, 2.0, 2.5, 3.0, 3.5 and 4.0 NaOH solutions wasanalyzed by X-ray diffractometry (XRD). Quantitative analy-sis of the obtained zeolite products was performed using the
Rietveld method with DIFFRACplus TOPAS software andthe exact percentage of each phase was calculated (Table 2).The results suggest that the synthesized zeolite products con-
tain zeolite A as the major constituent phase, whereas
5 10 15 20 25 30 35 40 45 50 55 60
Inte
nsity
o2θ (Cu Kα)
AA
AS
A Qz A
SA
AA A
AS AS Qz
A A A A A A A A A A
a
b
c
d
e
f
g
h
i
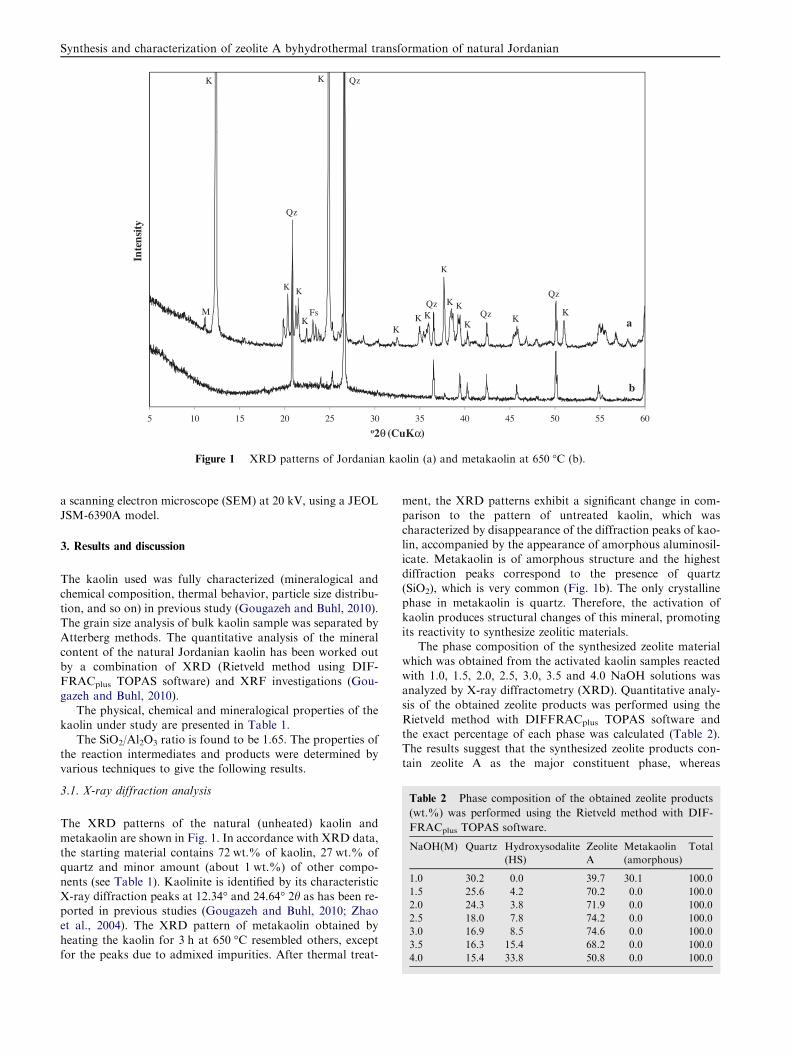
Figure 2 XRD patterns of zeolite A and associated phases obtained by hydrothermal synthesis (a) unreacted metakaolin, (b) 1.0 M
NaOH, (c) 1.5 M NaOH, (d) 2.0 M NaOH, (e) 2.5 M NaOH, (f) 3.0 M NaOH, (g) 3.5 M NaOH, and (h) 4.0 M NaOH, (i) commercial
zeolite A. A: zeolite A, S: hydroxysodalite, Qz: quartz.
38 M. Gougazeh, J.-Ch. Buhl
hydroxysodalite (HS) and quartz were found as minor phases
(Table 2).Fig. 2 illustrates the X-ray powder diagrams of metakaolin
and the reaction products which were obtained from the acti-vated kaolin samples reacted with 1.0, 1.5, 2.0, 2.5, 3.0, 3.5 and
4.0 M NaOH solutions at 100 �C for 20 h and the commercialzeolite A sample (Fluka No. 69836) given for comparison. Theformation of synthesized zeolite A in the products was
detected, by comparing the d-values of the products obtainedwith JCPDS (Joint Committee on Powder DiffractionStandards) data of card No.: 39-222 and d-values of commer-
cial zeolite A sample. The most important change observed inthe XRD patterns is the appearance of the characteristic peaksof zeolite A. The synthesized products matched the character-
istic peaks of zeolite A at 2h values of 7.2�, 10.3�, 12.6�, 16.2�,21.8�, 24�, 26.2�, 27.2�, 30�, 30.9�, 31.1�, 32.6�, 33.4� and 34.3�that were reported by Treacy and Higgins (2001). Fig. 2bshows the XRD pattern of the reaction product which was ob-
tained from the thermally activated kaolin sample with 1.0 MNaOH solution, zeolite A and quartz were determined as thedominant mineral phases with a significant amount of metaka-
olin (amorphous) and no hydroxysodalite was observed (Ta-ble 2). The results indicated that the synthesized zeoliteproducts obtained from 1.5–3.5 M NaOH concentrations con-
tain zeolite A as the major constituent phase, whereashydroxysodalite (HS) and quartz were found as minor phases(Fig. 2c–h). According to the experimental results and theXRD data, intensities of the HS peaks in the pattern increase
with increasing NaOH concentration (Table 2 and Fig. 2).Fig. 2 and Table 2 show that the greatest quantities of formedzeolite A are essentially the same for the samples reacted with
NaOH concentration between 1.5 and 3.5 M (zeolite A per-
sisted as the dominant phase) (Fig. 2c–g), with a sudden de-
crease at higher base concentrations (>3.5 M) (Fig. 2h),during this reaction some zeolite A was converted intohydroxysodalite. Similar observations were made by Singerand Berkgaut, 1995, Lin and His, 2004, Querol et al., 1997
who found that zeolite A was formed at low base concentra-tions (<3.5 M) and HS at higher base concentrations.Hydroxysodalite shows several common peaks located at
13.96�, 19.98�, 24.42�, and 35.00�. Our results showed thatquartz was also observed in the synthesized zeolitic materialin a minor amount (Table 2).
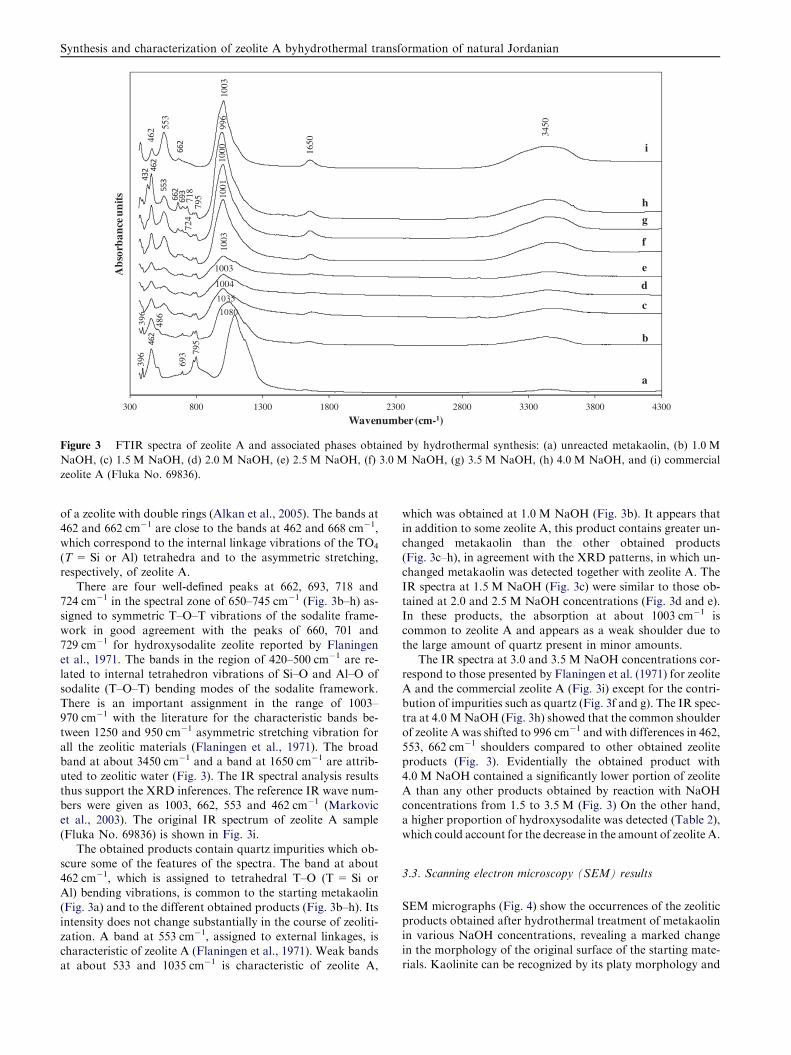
3.2. FTIR analysis
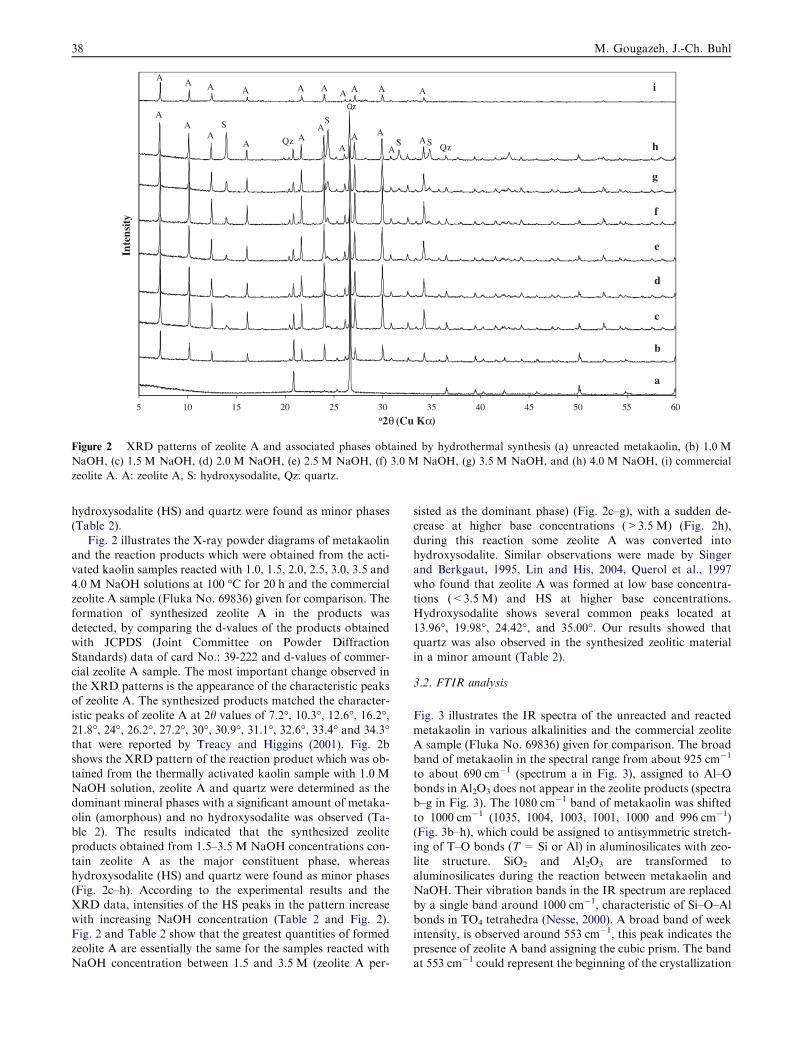
Fig. 3 illustrates the IR spectra of the unreacted and reacted
metakaolin in various alkalinities and the commercial zeoliteA sample (Fluka No. 69836) given for comparison. The broadband of metakaolin in the spectral range from about 925 cm�1
to about 690 cm�1 (spectrum a in Fig. 3), assigned to Al–O
bonds in Al2O3 does not appear in the zeolite products (spectrab–g in Fig. 3). The 1080 cm�1 band of metakaolin was shiftedto 1000 cm�1 (1035, 1004, 1003, 1001, 1000 and 996 cm�1)
(Fig. 3b–h), which could be assigned to antisymmetric stretch-ing of T–O bonds (T = Si or Al) in aluminosilicates with zeo-lite structure. SiO2 and Al2O3 are transformed to
aluminosilicates during the reaction between metakaolin andNaOH. Their vibration bands in the IR spectrum are replacedby a single band around 1000 cm�1, characteristic of Si–O–Al
bonds in TO4 tetrahedra (Nesse, 2000). A broad band of weekintensity, is observed around 553 cm�1, this peak indicates thepresence of zeolite A band assigning the cubic prism. The bandat 553 cm�1 could represent the beginning of the crystallization
300 800 1300 1800 2300 2800 3300 3800 4300
Abs
orba
nce
units
Wavenumber (cm-1)
1003
996
1000
1001
1003
1003
1004
1035
1080
462 553
718
795
724
396
396
486
693 795
1650
3450
a
b
c
d
e
f
g
h
i
Figure 3 FTIR spectra of zeolite A and associated phases obtained by hydrothermal synthesis: (a) unreacted metakaolin, (b) 1.0 M
NaOH, (c) 1.5 M NaOH, (d) 2.0 M NaOH, (e) 2.5 M NaOH, (f) 3.0 M NaOH, (g) 3.5 M NaOH, (h) 4.0 M NaOH, and (i) commercial
zeolite A (Fluka No. 69836).
Synthesis and characterization of zeolite A byhydrothermal transformation of natural Jordanian
of a zeolite with double rings (Alkan et al., 2005). The bands at462 and 662 cm�1 are close to the bands at 462 and 668 cm�1,
which correspond to the internal linkage vibrations of the TO4
(T = Si or Al) tetrahedra and to the asymmetric stretching,respectively, of zeolite A.
There are four well-defined peaks at 662, 693, 718 and724 cm�1 in the spectral zone of 650–745 cm�1 (Fig. 3b–h) as-signed to symmetric T–O–T vibrations of the sodalite frame-work in good agreement with the peaks of 660, 701 and
729 cm�1 for hydroxysodalite zeolite reported by Flaningenet al., 1971. The bands in the region of 420–500 cm�1 are re-lated to internal tetrahedron vibrations of Si–O and Al–O of
sodalite (T–O–T) bending modes of the sodalite framework.There is an important assignment in the range of 1003–970 cm�1 with the literature for the characteristic bands be-
tween 1250 and 950 cm�1 asymmetric stretching vibration forall the zeolitic materials (Flaningen et al., 1971). The broadband at about 3450 cm�1 and a band at 1650 cm�1 are attrib-uted to zeolitic water (Fig. 3). The IR spectral analysis results
thus support the XRD inferences. The reference IR wave num-bers were given as 1003, 662, 553 and 462 cm�1 (Markovicet al., 2003). The original IR spectrum of zeolite A sample
(Fluka No. 69836) is shown in Fig. 3i.The obtained products contain quartz impurities which ob-
scure some of the features of the spectra. The band at about
462 cm�1, which is assigned to tetrahedral T–O (T = Si orAl) bending vibrations, is common to the starting metakaolin(Fig. 3a) and to the different obtained products (Fig. 3b–h). Its
intensity does not change substantially in the course of zeoliti-zation. A band at 553 cm�1, assigned to external linkages, ischaracteristic of zeolite A (Flaningen et al., 1971). Weak bandsat about 533 and 1035 cm�1 is characteristic of zeolite A,
which was obtained at 1.0 M NaOH (Fig. 3b). It appears thatin addition to some zeolite A, this product contains greater un-
changed metakaolin than the other obtained products(Fig. 3c–h), in agreement with the XRD patterns, in which un-changed metakaolin was detected together with zeolite A. The
IR spectra at 1.5 M NaOH (Fig. 3c) were similar to those ob-tained at 2.0 and 2.5 M NaOH concentrations (Fig. 3d and e).In these products, the absorption at about 1003 cm�1 iscommon to zeolite A and appears as a weak shoulder due to
the large amount of quartz present in minor amounts.The IR spectra at 3.0 and 3.5 M NaOH concentrations cor-
respond to those presented by Flaningen et al. (1971) for zeolite
A and the commercial zeolite A (Fig. 3i) except for the contri-bution of impurities such as quartz (Fig. 3f and g). The IR spec-tra at 4.0 MNaOH (Fig. 3h) showed that the common shoulder
of zeolite A was shifted to 996 cm�1 and with differences in 462,553, 662 cm�1 shoulders compared to other obtained zeoliteproducts (Fig. 3). Evidentially the obtained product with4.0 M NaOH contained a significantly lower portion of zeolite
A than any other products obtained by reaction with NaOHconcentrations from 1.5 to 3.5 M (Fig. 3) On the other hand,a higher proportion of hydroxysodalite was detected (Table 2),
which could account for the decrease in the amount of zeolite A.
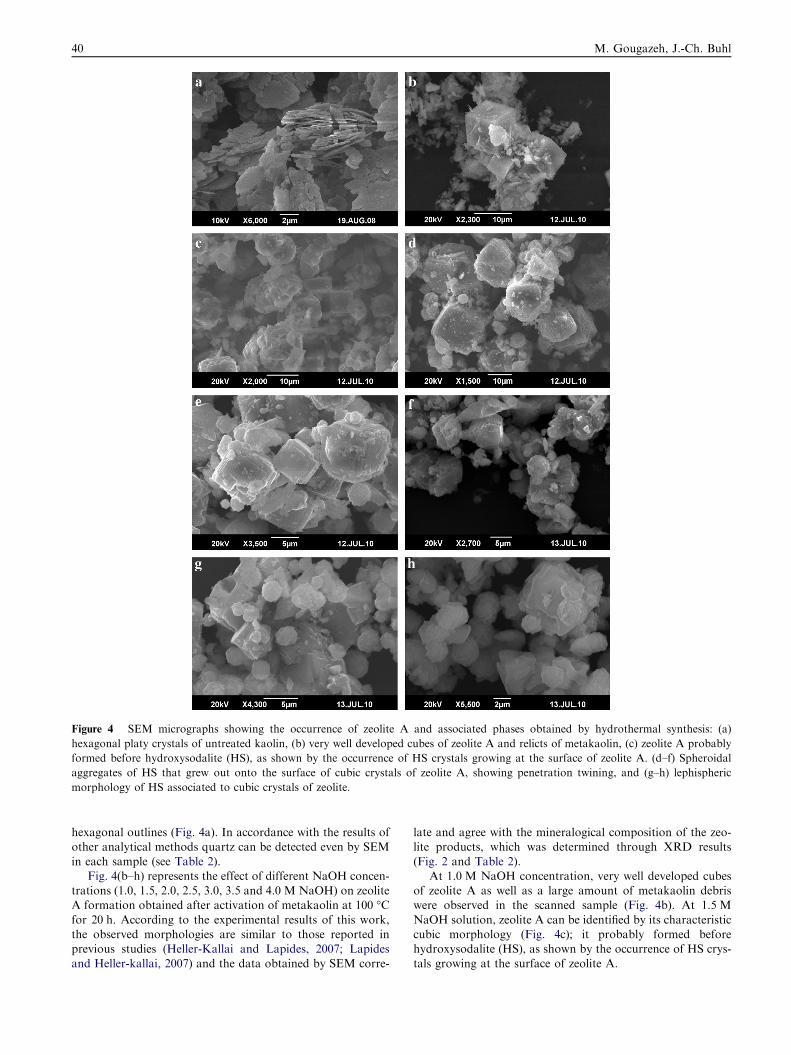
3.3. Scanning electron microscopy (SEM) results
SEM micrographs (Fig. 4) show the occurrences of the zeoliticproducts obtained after hydrothermal treatment of metakaolinin various NaOH concentrations, revealing a marked change
in the morphology of the original surface of the starting mate-rials. Kaolinite can be recognized by its platy morphology and
Figure 4 SEM micrographs showing the occurrence of zeolite A and associated phases obtained by hydrothermal synthesis: (a)
hexagonal platy crystals of untreated kaolin, (b) very well developed cubes of zeolite A and relicts of metakaolin, (c) zeolite A probably
formed before hydroxysodalite (HS), as shown by the occurrence of HS crystals growing at the surface of zeolite A. (d–f) Spheroidal
aggregates of HS that grew out onto the surface of cubic crystals of zeolite A, showing penetration twining, and (g–h) lephispheric
morphology of HS associated to cubic crystals of zeolite.
40 M. Gougazeh, J.-Ch. Buhl
hexagonal outlines (Fig. 4a). In accordance with the results ofother analytical methods quartz can be detected even by SEM
in each sample (see Table 2).Fig. 4(b–h) represents the effect of different NaOH concen-
trations (1.0, 1.5, 2.0, 2.5, 3.0, 3.5 and 4.0 M NaOH) on zeoliteA formation obtained after activation of metakaolin at 100 �Cfor 20 h. According to the experimental results of this work,the observed morphologies are similar to those reported inprevious studies (Heller-Kallai and Lapides, 2007; Lapides
and Heller-kallai, 2007) and the data obtained by SEM corre-
late and agree with the mineralogical composition of the zeo-lite products, which was determined through XRD results
(Fig. 2 and Table 2).At 1.0 M NaOH concentration, very well developed cubes
of zeolite A as well as a large amount of metakaolin debriswere observed in the scanned sample (Fig. 4b). At 1.5 M
NaOH solution, zeolite A can be identified by its characteristiccubic morphology (Fig. 4c); it probably formed beforehydroxysodalite (HS), as shown by the occurrence of HS crys-
tals growing at the surface of zeolite A.
Synthesis and characterization of zeolite A byhydrothermal transformation of natural Jordanian
Lephispheric morphologies corresponding to HS grew outonto the surface of cubic crystals of zeolite A, which sometimesdisplay interpenetrating twining (Fig. 4d–f), which were ob-
tained at 2.0–3.0 M NaOH concentrations. Generally, it is pos-sible to observe the following relationships between thesephases: crystal of HS growing at the surface of a cubic crystal
of zeolite A, aggregates of spheroidal ‘‘cotton-ball’’ structureof HS along with cubic crystals of zeolite A.
By increasing the NaOH concentrations from 3.5 to 4.0 M,
SEM micrographs of treated metakaolin show that a predom-inantly lephispheric morphology is typically observed in theobtained zeolitic products with spheroidal ‘‘cotton-ball’’ mor-phologies for HS (Fig. 4g and h).
4. Conclusions
Based on the results of XRD, IR and SEM of zeolite A pro-duced by treating the activated metakaolin from natural Jorda-nian kaolin with various concentrations of NaOH at 100 �C for20 h, some observations could be summarized as follows:
� The results indicated that the obtained zeolite products con-tain zeolite A as the major constituent phase, whereas
hydroxysodalite (HS) and quartz were found as minorphases. With one exception untransformed metakaolinoccurred only in considerable amounts at 1.0 M NaOH
(Table 2). Although the amount of untransformed metaka-olin probably decreases with increasing NaOH concentra-tion. On the other hand, amount of HS increases with theincreasing NaOH concentration, which could account for
the decrease in the amount of zeolite A.� The synthesized products were found to contain quartzphases as impurities coming from the natural kaolin sam-
ples (see XRD pattern in Fig. 1a).� Zeolite A was hydrothermally synthesized using kaolin asthe raw material. The XRD analysis confirmed an excellent
relative crystallinity. The surface morphology was provento be cubic by SEM. Kaolin was suggested to be a feasibleand economical raw material for the practical industrial
production of zeolite A.� For a future research we are going to evaluate the efficiencyof such zeolite materials in selective cation exchange as ionexchangers, adsorbents and catalysts.
Acknowledgments
The authors are grateful to the Tafila Technical University(TTU) and the German Sciences Foundation ‘‘Deutsche Fors-
chungsgemeinschaft’’ (DFG) for financially supporting thisstudy. Special thanks to Prof. C. Ruscher and Dr. Lars Rob-ben for assistance with the acquisition of FTIR, and SEMdata, respectively, as well as three anonymous reviewers for
constructive comments on the manuscript.
References
Adamczyk, Z., Bialecka, B., 2005. Hydrothermal synthesis of zeolites
from polish coal fly ash. Pol. J. Environ. Stud. 14 (6), 713–719.
Akolekar, D., Chaffee, A., Howe, R., 1997. The Transformations of
Kaolin to Low-Silica X Zeolite. Zeolites 19 (5), 359–365.
Alberti, A., Colella, C., Oggiano, G., Pansini, M., Vezzalini, G., 1994.
Zeolite production from waste kaolin containing materials. Mater.
Eng. (Modena, Italy) 5, 145–158.
Alkan, M., Hopa, C., Yilmaz, Z., Guler, H., 2005. The effect of alkali
concentration and solid/liquid ratio on the hydrothermal synthesis
of zeolite NaA from natural kaolin. Microporous Mesoporous
Mater. 86, 176–184.
Barnes, M.C., Addai-Mensah, J., Gerson, A.R., 1999a. The mecha-
nism of the sodalite-to- cancrinite phase transformation in