Cleveland State University Cleveland State University
EngagedScholarship@CSU EngagedScholarship@CSU
Chemical & Biomedical Engineering Faculty Publications Chemical & Biomedical Engineering Department
10-2019
Synthesis and Secretome Release by Human Bone Marrow Synthesis and Secretome Release by Human Bone Marrow
Mesenchymal Stem Cell Spheroids within Three-dimensional Mesenchymal Stem Cell Spheroids within Three-dimensional
Collagen Hydrogels: Integrating Experiments and Modelling Collagen Hydrogels: Integrating Experiments and Modelling
Jyotsna Joshi Cleveland State University
Mohammadreza Dehghan Abnavi Cleveland State University
Chandrasekhar R. Kothapalli Cleveland State University
Follow this and additional works at: https://engagedscholarship.csuohio.edu/encbe_facpub
Part of the Molecular, Cellular, and Tissue Engineering Commons
How does access to this work benefit you? Let us know! How does access to this work benefit you? Let us know!
Publisher's Statement This is the accepted version of the following article: Joshi, J, Abnavi, MD, Kothapalli, CR.
Synthesis and secretome release by human bone marrow mesenchymal stem cell spheroids
within three‐dimensional collagen hydrogels: Integrating experiments and modelling. J Tissue
Eng Regen Med. 2019; 13, 1923– 1937. https://doi.org/10.1002/term.2943 , which has been
published in final form at https://doi.org/10.1002/term.2943
Repository Citation Repository Citation Joshi, Jyotsna; Abnavi, Mohammadreza Dehghan; and Kothapalli, Chandrasekhar R., "Synthesis and Secretome Release by Human Bone Marrow Mesenchymal Stem Cell Spheroids within Three-dimensional Collagen Hydrogels: Integrating Experiments and Modelling" (2019). Chemical & Biomedical Engineering Faculty Publications. 164. https://engagedscholarship.csuohio.edu/encbe_facpub/164
This Article is brought to you for free and open access by the Chemical & Biomedical Engineering Department at EngagedScholarship@CSU. It has been accepted for inclusion in Chemical & Biomedical Engineering Faculty Publications by an authorized administrator of EngagedScholarship@CSU. For more information, please contact [email protected].
Synthesis and secretome release by human bone marrowmesenchymal stem cell spheroids within three‐dimensionalcollagen hydrogels: Integrating experiments and modelling
Jyotsna Joshi , Mohammadreza Dehghan Abnavi , Chandrasekhar R. Kothapalli
Abstract
Myocardial infarction results in loss of cardiac cell types, inflammation, extracellular
matrix (ECM) degradation, and fibrotic scar. Transplantation of bone marrow‐
derived mesenchymal stem cells (BM‐MSCs) is being explored as they could differen-
tiate into cardiomyocyte‐like cells, integrate into host tissue, and enhance resident
cell activity. The ability of these cells to restore lost ECM, remodel the inflammatory
scar tissue, and repair the injured myocardium remains unexplored. We here eluci-
dated the synthesis and deposition of ECM (e.g., elastin, sulfated glycosaminoglycans,
hyaluronan, collagen type III, laminin, fibrillin, lysyl oxidase, and nitric oxide
synthases), matrix metalloproteinases (MMPs) and their inhibitors (TIMPs), and othersecretome (cytokines, chemokines, and growth factors) in adult human BM‐MSC
spheroid cultures within three‐dimensional collagen gels. The roles of species‐
specific type I collagen and 5‐azacytadine were assessed over a 28‐day period.
Results revealed that human collagen (but not rat‐derived) suppressed MSC prolifer-
ation and survival, and MSCs synthesized and released a variety of ECM proteins and
secretome over the 28 days. Matrix deposition is at least an order of magnitude lower
than their release levels at every time point, most possibly due to elevated MMP
levels and interleukins with a concomitant decrease in TIMPs. Matrix synthesis overthe 28‐day period was fitted to a competitive inhibition form of Michaelis–Menten
kinetics, and the production and decay rates of ECM, MMPs, and TIMPs, along with
the kinetic model parameters quantified. Such an integrated experimental and model-
ling approach would help elucidate the critical roles of various parameters (e.g., cell
encapsulation and delivery vehicles) in stem cell‐based transplantation therapies.
KEYWORDS
cardiomyocytes, competitive‐inhibition model, matrix synthesis, mesenchymal stem cells,Michaelis–Menten kinetics, protein degradation, secretome release
Abbreviations:QBM‐MSCs, bone marrow‐derived mesenchymal stem cells; VSMCs, vascular smooth muscle cells; MI, myocardial infarction; sGAGs, sulfated glycosaminoglycans; LOX, lysyl oxidase; NO, nitric oxide; NOS, nitric oxide synthase; NOS1, neuronal nitric oxide synthase; iNOS, inducible nitric oxide synthase; eNOS, endothelial nitric oxide synthase; bFGF/FGF‐2, basic fibroblast growth factor; EGF, epithelial growth factor; TGF‐α, transforming growth factor‐alpha; TGF‐β, transforming growth factor‐beta; HGF, hepatocyte growth factor; IGF‐1, insulin‐like growth factor‐1; VEGF, vascular endothelial growth factor; MMPs, matrix metalloproteases; TIMPs, tissue inhibitor of metalloproteinase; ILs, interleukins; M‐CSF, macrophage colony stimulating factor; TNF‐α, tumour necrosis factor‐alpha; MCP‐1, monocyte chemoattractant protein; MIP‐1α, macrophage inflammatory protein; RANTES, regulated on activation, normal T‐cell expressed and secreted; MCP‐3 MCP‐3/CCL7, monocyte‐specific chemokine 3; IP‐10, interferon‐γ inducible protein; TSG‐6, TNFα stimulated gene/protein 6
1 | INTRODUCTION
Adult mammalian myocardium comprises cardiomyocytes, fibroblasts,
endothelial cells, smooth muscle cells, stem and progenitor cells, nerve
endings, and blood cells, with cardiomyocytes alone occupying almost
75% of myocardial volume (Bowers, Banerjee, & Baudino, 2010;
Kapelko, 2001). Myocardial tissue also houses matrix components that
contribute to the maintenance of tissue functions during develop-
ment, haemostasis, and disease (Lockhart, Wirrig, Phelps, & Wessels,
2011). Myocardial cells uniquely contribute to the turnover of extra-
cellular matrix (ECM), with cardiac fibroblasts producing collagens I
and III, fibronectin, matrix metalloproteinases (MMPs), tissue inhibitors
of MMPs (TIMPs), interleukins (ILs), TGF‐β, TNF‐α, and endothelin,
and cardiomyocytes contributing to collagens IV and VI, laminins,
and proteoglycans (Bowers et al., 2010; Fan, Takawale, Lee, & Kassiri,
2012). Collagens are the most abundant myocardial matrix compo-
nents, with type I being the major myocardial structural protein consti-
tuting 75–80% of the total collagen (LeGrice, Pope, & Smaill, 2005).
Apart from type I, type III collagen constitutes 15–20% and forms fine
pericellular network, whereas minor amounts of other collagen types
form basement membrane (e.g., collagen IV) or found in the cardiac
interstitium with linkages to other collagens (collagens V and VI;
LeGrice et al., 2005). In addition to collagens, proteoglycans, glycopro-
teins, elastin, fibronectin, and laminin also play a major role in cell
matrix organization (Bowers et al., 2010). Elastin is found in the walls
of blood vessels and in the cardiac interstitium and plays a role in tis-
sue organization, strength, and elasticity (Fomovsky, Thomopoulos, &
Holmes, 2010). Elastin biosynthesis involves release of soluble
tropoelastin monomers that aggregate and mature on microfibrillar
scaffolds composed mainly of fibrillin, with LOX mediating the cross‐
linking, stability, and assembly of tropoelastin monomers (Kielty,
Sherratt, & Shuttleworth, 2002).
Other glycoproteins (thrombospondins and tenascins), proteogly-
cans (versican and biglycan), and GAGs (hyaluronan, heparin, heparin
sulfate, chondroitin sulfate, dermatan sulfate, and keratin sulfate) con-
tribute to the nonstructural component of the myocardial matrix.
GAGs and proteoglycans also aid in matrix hydration and tissue plas-
ticity needed for cell migration, proliferation, and cardiac contractility
(Pelouch, Dixon, Golfman, Beamish, & Dhalla, 1993; Rienks,
Papageorgiou, Frangogiannis, & Heymans, 2014). Nitric oxide (NO)
generated from NO synthase (NOS) plays crucial role in cardiac muscle
contraction, and all three isoforms of NOS (NOS1, NOS2 [iNOS], and
NOS3 [eNOS]) are present distinctly within cardiomyocytes
(Förstermann & Sessa, 2011). Thus, myocardial ECM is a dynamic
and intricate assembly of multiple matrix components and a rich store-
house of bioactive molecules that essentially mediate cell signalling,
matrix synthesis, and degradation processes via autocrine or paracrine
mechanisms (Spinale, 2007).
In severe cases of myocardial infarction (MI), there could be loss of
up to 50 g of cardiac tissue with a concomitant loss of millions of
cardiomyocytes per gram of tissue (Zimmermann et al., 2006). To mit-
igate such loss, the cardiac intrinsic repair follows soon after cardio-
myocyte death, but the outcome is usually adverse and varies with
the extent of injury (Altara et al., 2016; Frangogiannis, 2014). Thus,
cardiac tissue regeneration approaches utilizing stem cells, biomaterial
scaffolds, and growth factors are being explored to replace the lost cell
populations and restore the structure‐function properties of the dis-
eased tissue. Human bone marrow‐derived mesenchymal stem cells
(HBM‐MSCs) are gaining attention in cardiac therapy due to their abil-
ity to release a wide repertoire of paracrine factors (termed secretome;
Ranganath, Levy, Inamdar, & Karp, 2012), which enhances survival and
function of cardiomyocytes, enables activation, proliferation, and dif-
ferentiation of endogenous cardiac progenitor cells, and inhibits tissue
fibrosis (Cashman, Gouon‐Evans, & Costa, 2013; Williams & Hare,
2011). We had earlier reported that a combination of rat tail‐derived
type I collagen, 5‐azacytidine, and spheroid formation provides an
optimal 3D milieu for the evolution of cardiomyocyte‐like cells from
HBM‐MSCs (Joshi, Mahajan, & Kothapalli, 2018). However, ECM pro-
tein expression and synthesis and matrix remodelling capabilities of
these cells remain relatively unknown, which is critical for their appli-
cations in situ post‐MI.
This study is based on the hypothesis that HBM‐MSC survival,
proliferation, ECM synthesis, and secretome release is regulated by
3D scaffold source (rat vs. human collagen), aza exposure (10 μM),
and culture duration (over 28 days). This study is also partially driven
by immune concerns over the utility of animal‐derived collagen gels
for clinical applications (Gorgieva & Kokol, 2011). Finally, the time‐
dependent evolution of protein synthesis and degradation (i.e., remod-
elling) within these cultures, mediated by MMPs (enzyme) and TIMPs
(inhibitor), was fitted to a competitive inhibition form of Michaelis–
Menten reaction kinetics and the model parameters elucidated.
2 | MATERIALS AND METHODS
2.1 | Preparation of collagen hydrogels
Type 1 rat collagen extracted and purified from rat tail tendon
(Corning®) and type 1 human collagen extracted and purified from
neonatal foreskin derived‐fibroblast cultures (Vitrocol®; Advanced
Biomatrix) were used to form 2 mg/mL gels, by adjusting the amounts
of stock collagen, NaOH, 10× PBS, and culture media, as per vendor's
protocol.
2.2 | Human BM‐MSC culture and spheroidformation
Cryopreserved Poietics™ normal HBM‐MSCs (PT‐2501), isolated from
adult human bone marrow of the posterior iliac crests, were obtained
from Lonza (Walkersville, MD, USA). The cells were cryopreserved
after the second passage and had ≥90% of CD105, CD166, CD90,
CD44, and CD73. HBM‐MSC spheroids were formed using a hanging
drop method, from three to six passage cells, using Gibco™ DMEM. In
brief, loose cells were trypsinized, neutralized, centrifuged at 500 rcf
for 5 min, and suspended in DMEM culture media. Cell suspensions
(~1,000 cells/20 μl) were pipetted into the lids of Petri plates that
were inverted and placed over Petri dishes containing PBS, followed
by a 24‐hr incubation under standard aseptic culture conditions. After
1 day of incubation, hanging drops were gently transferred on tissue
culture plastic (TCP) or sandwiched within rat or human collagen
hydrogels. Cell‐loaded hydrogels were incubated under standard cul-
ture conditions to induce their gelation prior to adding culture media
supplemented with and without 10 μM aza. Rat collagen took ~30
min, whereas human collagen took ~90 min to gel, matching the ven-
dor's specifications. Media was changed in all cultures every 48 hr
over the 28‐day period, including replenishing fresh aza. TCP cultures
did not receive aza and act as a baseline for each quantified measure
and for comparing with 3D cultures.
2.3 | Biochemical assays for matrix quantification
Proteins released into the pooled media and those deposited in the
cell layers at Days 1, 12, and 28 of cultures were quantified in all test
conditions. The pooled spent culture media was collected and stored
at −20°C, transferred to Eppendorf safe‐lock tubes, and centrifuged
at 14,000 rpm for 15 min at 4°C. The supernatant was discarded,
and the pellet homogenously suspended in distilled deionized water
for biochemical analyses. The deposited matrix proteins within the cell
layers were harvested from the cultures at various time points. The
cultures were first rinsed with 1× PBS, trypsinized for cell‐laden gel
detachment from the plates, neutralized with culture media, pipetted
into Eppendorf safe‐lock tubes, and centrifuged at 500 rcf for 5 min.
The supernatant was discarded, and the cell pellet was homogenously
suspended in distilled deionized water and stored at −20°C for bio-
chemical analyses.
2.3.1 | DNA assay
The total double‐stranded DNA was quantified using DNA quantifica-
tion kit (Sigma‐Aldrich), which is based on a fluorescent dye
bisbenzimide H33258 (Hoechst 33258). Samples were excited at
360 nm, and the fluorescence emissions at 460 nm were recorded
using a microplate reader (Biotek Synergy H1m). A calibration curve
was prepared using DNA concentration of the standards provided
with the kit versus their respective fluorescence intensities. The least
squares regression equation was fitted for this curve, which was used
to determine the DNA amounts in the samples. Total cell density in
each sample was calculated assuming 8.5 pg DNA per cell (Wang,
Tran, Seshareddy, Weiss, & Detamore, 2009).
2.3.2 | BCA assay
Total protein released into pooled media and deposited within cell cul-
tures was quantified using PierceTM BCA protein assay kit. The absor-
bance in processed samples was read at 562 nM using a microplate
reader, and the total protein in samples was determined using the least
squares regression equation from standard curve generated from BSA
standards provided in the kit. Total protein in cell‐free hydrogels was
determined to account for the baseline of protein amounts within cell
pellet samples in respective hydrogels.
2.3.3 | sGAG assay
The total sGAGs deposited within the cell layers and that released in
the pooled media were quantified using a quantitative dye‐binding
sGAG assay (Kamiya Biomedical Company), and the processed sam-
ples were read at 610 nm using a microplate reader. A standard curve
generated from the sGAG samples provided with the kit was used to
calculate sGAG amounts in each test sample.
2.3.4 | HA assay
The hyaluronic acid amounts deposited within cell layers and in the
pooled media were quantified using a quantitative enzyme‐linked
immunoassay (HA‐ELISA assay kit, Echelon, Salt Lake City, UT). Absor-
bance was measured at 403 nm using a microplate reader, and the
standard curve generated was used to find HA levels in the test
samples.
2.3.5 | Fastin assay for elastin protein
The total elastin deposited within the cell layers (i.e., matrix elastin)
and that released in the pooled media (i.e., tropoelastin) was quantified
using a Fastin™ elastin assay (Accurate Chemical and Scientific Corp;
Westbury, NY). The assay is based on the principle that the dye
reagent, TPPS (5,10,15,20‐teraphenyl‐21H,23H‐porphyrine), has an
affinity to bind with solubilized elastin. Absorbance was measured
using the microplate reader at 513 nm, and a standard curve was gen-
erated to quantitate elastin in the samples.
2.3.6 | LOX functional activity
LOX activity in the cell matrix and in the pooled media was deter-
mined using a sensitive fluorescence‐based assay (Amplex® Red
Hydrogen Peroxide/Peroxidase assay kit, Molecular Probes) that uses
the Amplex Red reagent (10‐acetyl‐3,7‐dihydroxyphenoxazine) to
detect H2O2. This assay is based on the principle that LOX amount
is proportional to the released H2O2 because LOX oxidatively deami-
nates alkyl monoamines and diamines (Palamakumbura & Trackman,
2002; Simmers, Gishto, Vyavahare, & Kothapalli, 2015). Absorbance
was read at 560 nm, and a linear standard curve was derived to find
H2O2/LOX in the samples.
2.4 | Secretome release
The cytokine/chemokine/growth factor cocktail pertinent to cardio-
myocyte differentiation and cardiac tissue regeneration was quantified
using Discovery Assays® (Eve Technologies, Alberta, Canada) accord-
ing to the manufacturer's protocol. Briefly, the collected pooled media
from cell cultures was thawed on ice, centrifuged, and required vol-
umes aliquoted into 0.5‐ml polypro snap‐cap tubes. Nine essential
metalloproteases and their inhibitors (MMPs and TIMPs, respectively)
were quantified using human MMP and TIMP panel assay (assay sen-
sitivity: 0.5–14 pg/ml); 42 essential cytokines/chemokines quantified
using human cytokine array/chemokine array assay (assay sensitivity:
0.5–10 pg/ml); and TGFβ‐1, 2, and 3 quantified using TGF‐β array
(assay sensitivity: 2–6 pg/ml). These assays utilize multiplexing LASER
bead technology where fluorophore beads provide a platform for mul-
tiple cytokine and chemokine detection from a single assay using the
bead analyser (Bio‐Plex 200).
2.5 | IF labelling and imaging
Primary antibodies (Santa Cruz Biotechnology) for collagen type III,
laminin, fibrillin, NOS2, and NOS3 deposited by the MSC spheroids
were assessed in 28‐day culture conditions. Cell‐laden hydrogels were
fixed and stained with antibodies and DAPI at the end of each culture
period (Joshi et al., 2018). Live/Dead® Viability/Cytotoxicity Kit
(Molecular Probes) was used to determine the cell viability and toxicity
at various culture conditions (Gishto, Farrell, & Kothapalli, 2015). All
fluorescence images were acquired using Zeiss Axiovert A1 flores-
cence microscope equipped with Hamamatsu camera and an image
acquisition software. Multiple images from at least three independent
wells were analysed for each case.
2.6 | Western blots
SDS/PAGE western blot analysis was performed for semiquantitative
analysis of collagen type III, laminin, fibrillin, NOS2, and NOS3 proteins
(Simmers et al., 2015). Blots were performed for both the released
proteins in pooled media and that deposited within the cell layers,
using samples specified in Section 2.3. Band intensities were normal-
ized to total protein amounts (BCA assay) and further to cell densities
within respective culture conditions.
2.7 | Statistical analysis
All data were represented as mean ± standard error of n ≥ 3 wells per
condition, with at least three independent replicates. Statistical analy-
sis was performed using GraphPad Prism 5 for Student's t test, one‐
way analysis of variance (ANOVA) followed by Tukey's test, or two‐
way ANOVA followed by Bonferroni post hoc test, to find the statis-
tical significance and determine the pairs of groups that were signifi-
cantly different (p < .05).
3 | RESULTS
3.1 | Cell viability in rat and human collagen gels
Cell viability within rat collagen cultures were ≥80% in all culture con-
ditions and were not influenced by aza treatment (Figure 1). On the
contrary, viability ranged between 50% and 60% in human collagen
cultures and was significantly lower compared with that in rat collagen
cultures at all corresponding time points (p < .05). However, aza pres-
ence did not impact cell viability in human collagen cultures.
3.2 | Cell proliferation and matrix synthesis in 2Dcultures
The average cell density increased from 3,100 to 7,800 (p < .05;
Figure 2a), with a simultaneous increase in average normalized total
matrix protein deposition (~6,300 pg to ~26 ng; p = .0002; Figure 2
c), from Days 12 to 28. Although average normalized total protein
release in media increased from Days 1 to 12 (~280 to 990 ng; p < .05;
Figure 2d), it decreased from Days 12 to 28 (~990 to 380 ng, p =
.0029). The normalized LOX deposition increased from Days 1 to 12
(~150 to 270 pM) and lowered by Day 28 (~100 pM, p < .05); similarly,
normalized LOX activity in pooled media increased from Days 1 to 12
(~8 to 11 nM; p < .05) but reduced from Days 12 to 28 (~11 to 4.7 nM;
p < .0001; Figure 2b). Although normalized sGAG and elastin matrix
deposition slightly increased from Days 1 to 12, it reduced from Days
12 to 28 (~365 and 280 pg to ~30 and 90 pg; p = .01; Figure 2c). On
the other hand, normalized sGAG and tropoelastin release into media
increased from Days 1 to 12 (~650 and 880 pg to ~3,300 and 2,700
pg, respectively; p = .004; Figure 2d) and plateaued from Days 12 to
28. Normalized HA in matrix reduced from Days 1 to 12 (~36 to 18
pg; p < .001; Figure 2c) and from Days 12 to 28 (~18 to 7 pg; p <
.0001); however, HA release into pooled media increased with culture
duration from Days 1 to 12 (~38 to 65 pg; p = .0225; Figure 2d). In gen-
eral, levels of total protein, LOX, elastin, and GAGs were orders of
magnitude higher in pooled media compared with that deposited as
matrix. Moreover, elastin and sGAG levels were similar in matrix or in
pooled media and orders of magnitude higher than HA levels. These
values establish the baseline for various ECM proteins synthesized
and released within 2DMSC cultures in the absence of exogenous aza.
3.3 | MSC proliferation, protein release, anddeposition within rat collagen gels
Within rat collagen, the average cell density in controls (0 μM aza)
increased steadily with culture duration (~3,000, 7,500, and 1,700
for Days 1, 12, and 28, respectively; p = .04; Figure 2e). Normalized
LOX deposition in matrix increased in controls over time (from ~150
to 400 pM; p = .02 for Day 1 vs. Day 28; Figure 2f), although LOX
release in pooled media steadily reduced with culture duration
(~7,900 to 1,900 pM; p < .05). Normalized total protein and sGAG
deposition in controls increased from Days 1 to 12 but decreased by
Day 28 (~55 ng and 325 pg on Day 12 to ~12 ng and 83 pg on Day
28, respectively; p < .001; Figure 2g), whereas the total protein and
sGAG release into media stayed steady throughout the culture period
(Figure 2h). HA deposition in matrix and release into pooled media, on
a per cell basis, lowered by Day 12 (~8 and 20 pg) and Day 28 (~5 and
16 pg) in control cultures, compared with Day 1 (~36 and 38 pg; p <
.001 in both cases). Although normalized elastin matrix deposition
reduced in controls from Day 1 (~140 pg) to Day 12 (~65 pg) and from
Days 12 to 28 (undetectable; p < .0001; Figure 2g), tropoelastin
release increased steadily over the culture duration (p = .001 for
D12 [~1,000 pg] vs. D28 [~1,500 pg]; Figure 2h).
The overall average cell density in aza‐treated cultures increased
from Days 1 to 28 (p < .1 for D1 with ~3,400 vs. D28 with ~10,000;
Figure 2e). Normalized total protein matrix deposition in aza‐treated
samples (Figure 2g) increased from Days 1 to 12 (~6 to 14 ng; p <
.05) and furthermore from Days 12 to 28 (~14 to 50 ng; p < .0001).
The normalized total protein release in pooled media reduced from
Days 1 to 12 (~275 to 117 ng; p < .01; Figure 2h) but increased from
Days 12 to 28 (~117 to 480 ng; p < .001). Normalized sGAG deposi-
tion in aza‐treated cultures reduced with culture duration (Figure 2
g), although sGAG release into pooled media remained constant over
the culture duration (Figure 2h). Similarly, an overall reduction in HA
deposition as matrix and release into pooled media was noted in
aza‐treated cultures over the 28‐day period (Figure 2g,h). Although
elastin matrix amounts decreased with culture duration in aza‐treated
samples (~140 pg on Day 1 to ~25 pg on Days 12 and 28; p < .05; Fig-
ure 2g), tropoelastin release improved with culture duration (p < .0001
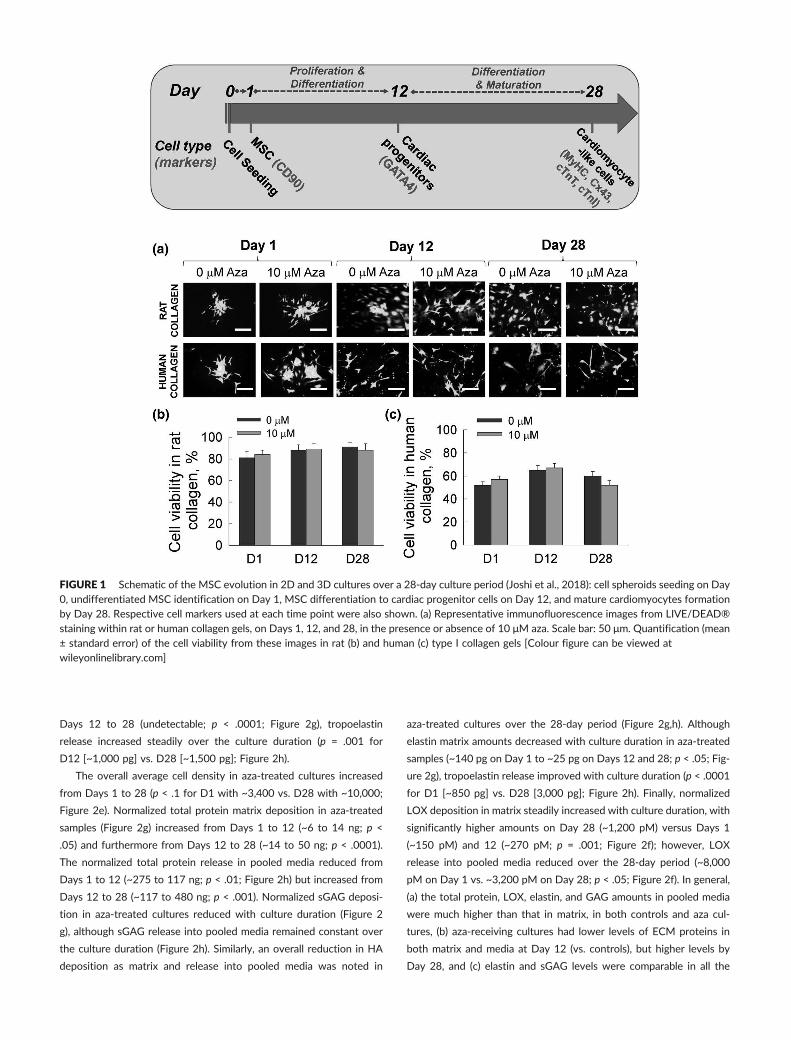
for D1 [~850 pg] vs. D28 [3,000 pg]; Figure 2h). Finally, normalized
LOX deposition in matrix steadily increased with culture duration, with
significantly higher amounts on Day 28 (~1,200 pM) versus Days 1
(~150 pM) and 12 (~270 pM; p = .001; Figure 2f); however, LOX
release into pooled media reduced over the 28‐day period (~8,000
pM on Day 1 vs. ~3,200 pM on Day 28; p < .05; Figure 2f). In general,
(a) the total protein, LOX, elastin, and GAG amounts in pooled media
were much higher than that in matrix, in both controls and aza cul-
tures, (b) aza‐receiving cultures had lower levels of ECM proteins in
both matrix and media at Day 12 (vs. controls), but higher levels by
Day 28, and (c) elastin and sGAG levels were comparable in all the
FIGURE 1 Schematic of the MSC evolution in 2D and 3D cultures over a 28‐day culture period (Joshi et al., 2018): cell spheroids seeding on Day0, undifferentiated MSC identification on Day 1, MSC differentiation to cardiac progenitor cells on Day 12, and mature cardiomyocytes formationby Day 28. Respective cell markers used at each time point were also shown. (a) Representative immunofluorescence images from LIVE/DEAD®staining within rat or human collagen gels, on Days 1, 12, and 28, in the presence or absence of 10 μM aza. Scale bar: 50 μm. Quantification (mean± standard error) of the cell viability from these images in rat (b) and human (c) type I collagen gels [Colour figure can be viewed atwileyonlinelibrary.com]
culture conditions at all time points, and significantly higher than cor-
responding HA amounts.
3.4 | MSC proliferation, ECM release, and depositionwithin human collagen gels
The average cell density decreased with culture duration in controls
(~3,000, 2,000, and 1,500 on Days 1, 12, and 28, respectively); how-
ever, the differences were not statistically significant (Figure 2i). Com-
pared with Day 1 levels, overall LOX amounts improved with culture
duration, in both matrix and pooled media (p = .04 and p = .001,
respectively; Figure 2j). The normalized total protein deposition as
matrix increased in controls from Day 1 to Day 12 (~6.3 to 250 ng;
p < .001; Figure 2k) but reduced from Day 12 to Day 28 (~250 to
100 ng; p < .05). Normalized total protein release in controls increased
progressively from Day 1 to Day 28 (~270 ng to 6 μg; p = .0062;
Figure 2l). sGAG deposition and release in control cultures was only
detectable at Day 28 (Figure 2k,l). Although HA deposition as matrix
did not significantly change with culture duration in controls, its
presence in pooled media progressively increased over the 28 days
(~40 pg on Day 1 to ~420 pg on Day 28; p = .0003; Figure 2l). Normal-
ized elastin deposition as matrix steadily and significantly decreased
with culture duration in controls (~140 pg on Day 1 and undetectable
on Day 28; p = .0004; Figure 2k), but elastin release progressively
increased with culture duration (~900 pg on Day 1, 6,500 pg by Day
12, and 23 ng by Day 28; p < .0001; Figure 2l).
Average cell density in aza‐treated cultures increased initially (p <
.05 for D1 with ~3,000 vs. D12 with ~6,700) but reduced to Day 1
levels by Day 28 (p < .001 for D12 vs. D28) within human collagen
gels (Figure 2i). Normalized total protein deposition and release into
pooled media within aza cultures increased progressively during the
culture period (p < .001 in all cases; Figure 2k,l). Normalized sGAG
amounts were undetectable in matrix at Days 12 and 28 within aza
cultures but increased in pooled media from Day 12 to Day 28 (470
to 2,500 pg; p < .001; Figure 2l). HA deposition in matrix remained
unchanged by Day 28 (p > .05 for D1 vs. D28; Figure 2k), whereas
its release in pooled media increased multifold (p < .0001 for D1 with
~40 pg vs. D28 with 256 pg) within aza cultures. Normalized elastin
deposition dropped in aza‐treated samples with culture duration (p <
FIGURE 2 (a) Average cell density in TCP cultures over 28 days. (b) Normalized amounts of LOX activity in matrix and pooled media within TCPcultures over 28 days. Normalized levels of total protein, elastin, sGAG, and HA deposited as matrix (c) or released into pooled media (d), over 28days inTCP cultures. All TCP cultures were in the absence of aza. Data were represented as average ± standard error. (e) Average cell density in rattail‐derived 3D collagen gels, over 28 days, with and without 10 μM aza. (f) Normalized amounts of LOX activity in matrix and pooled media withinrat tail‐derived 3D collagen gels over 28 days, with and without aza. The proteins deposited in matrix (g) or released into pooled media (h) over 28days within rat tail‐derived 3D collagen gels, with and without aza. Data were represented as mean ± standard error. (i) Average cell density in typeI human collagen gels, over 28 days, with and without 10 μM aza. (j) Normalized amounts of LOX activity in matrix and pooled media within humancollagen gels over 28 days, with and without aza. The proteins deposited in matrix (k) or released into pooled media (l), at various time points over28 days, in the absence or presence of 10 μM aza, in human 3D collagen gels. Data were represented as mean ± standard error [Colour figure canbe viewed at wileyonlinelibrary.com]
.0001 for D1 [140 pg] vs. D28 [undetectable]), whereas elastin release
increased with culture duration (p < .0001 for D1 [~870 pg] vs. D28
[16.5 ng]; Figure 2l). LOX deposition and release increased with cul-
ture duration till Day 12 (p = .0445 and p = .0003, respectively) in
aza cultures, after which it plateaued (Figure 2j). Taken together, (a)
the total protein, LOX, elastin, and GAG amounts in pooled media
were much higher than that in matrix, in both controls and aza cul-
tures, (b) aza‐receiving cultures had lower levels of ECM proteins in
both matrix and media at Day 12 (vs. controls), but similar levels by
Day 28 (vs. controls), and (c) elastin and sGAG levels were comparable
in all the culture conditions at all time points, and significantly higher
than corresponding HA amounts.
3.5 | Immunofluorescence labelling and western blotanalysis of ECM proteins
The presence of type III collagen, laminin, fibrillin, NOS2, and NOS3 in
2D and 3D controls and aza‐receiving cultures, at various time points,
was qualitatively visualized from immunofluorescence images
(Figure 3) and quantified from western blot analysis (Figure 4). The
western blot band intensities were first normalized to total protein
amounts (BCA assay) and further to cell densities within respective
cultures. All five proteins were detectable in cell matrix within rat or
human collagen gels from Day 12, with none detectable in Day 1 cul-
tures from images and western blots. Human collagen gels (both
FIGURE 3 Representative immunofluorescence images of cardiac extracellular matrix proteins (collagen type III, laminin, and fibrillin) and nitricoxide synthases (NOS2 and NOS3) in cultures within 2D TCP and 3D rat or human collagen gels, at various time points over 28 days, in thepresence or absence of 10 μM aza. Scale: 100 μm [Colour figure can be viewed at wileyonlinelibrary.com]
FIGURE 4 Quantification of bands from western blot analysis of ECM proteins (collagen type III, laminin, and fibrillin) and nitric oxide synthases(NOS2 and NOS3), isolated from (a) cell matrix and (b) pooled media. The intensity from western blot bands was normalized to the intensity oftotal protein expressed and further to the cell count in respective cases. Representative gel bands were shown for each protein at respective timepoints (D1, D12, and D28) [Colour figure can be viewed at wileyonlinelibrary.com]
FIGURE 5 Heat maps showing the amounts of various MMPs, TIMPs, and cytokines quantified using LASER bead technology (Eve Technology)within (a) TCP, (b) 3D type I rat collagen cultures, and (c) 3D type I human collagen cultures, under different conditions over 28 days [Colour figurecan be viewed at wileyonlinelibrary.com]
controls and aza‐exposed) promoted deposition of collagen type III,
NOS2, fibrillin, and laminin within matrix layers (Figure 4a), by Day
28, compared with other gel types. The presence of aza did not pro-
mote significant deposition of any of these proteins compared with
control cultures, in both human and rat collagen gels. Qualitatively,
the percentage of cells that stained positive for NOS3 in all culture
conditions was significantly higher compared with those for other pro-
teins (Figure 3). Interestingly, western blot analysis of these proteins
from pooled media aliquots (Figure 4b) suggested that collagen type
III, laminin, and fibrillin release improved by Day 12 in only TCP and
human collagen gel cultures, and the amounts of these proteins either
remained stable or reduced by Day 28 in most of the culture condi-
tions except in human collagen gels.
3.6 | Secretome analysis
Out of the 42 cytokines quantified (Figure 5; Data S1), eotaxin‐1 and
IL‐15 were not expressed at all; EGF, TGF‐α, Flt‐3L, GM‐CSF, IFN‐α2,
IL‐10, IL‐12 (p40), IL‐12 (p70), PDGF‐AA, IL‐13, PDGF‐BB, CD154,
IL‐17A, IL‐1RA, IL‐1α, IL‐1β, IL‐2, IL‐3, IL‐5, IL‐7, MIP‐1B, RANTES,
TNF‐α, TNF‐β, IL18, and IL‐4 were the least expressed (≤5 pg/ml);
FGF‐2 (bFGF), Fractalkine/CX3CL1, GRO‐α, MCP‐3/CCL7, CCL22,
IP‐10/CXCL10, and MIP‐1α were moderately expressed (≤100
pg/ml); IL‐6, IL‐8, and VEGF‐α were highly expressed (100‐600
pg/ml); and MCP‐1 was profusely expressed (<2,000 pg/ml). Similarly,
of the three cytokines quantified using TGF‐β‐Plex Discovery Assay,
TGF‐β1 was highly expressed (350–450 pg/ml), TGF‐β2 was moder-
ately expressed (≤100 pg/ml), and TGF‐β3 was the least expressed
(≤2 pg/ml) in all culture conditions. Finally, of the 13 cytokines quanti-
fied using MMP 9‐Plex and TIMP 4‐Plex Discovery Assays, MMPs 1, 3,
7, 8, 9, 10, and 12 were mostly within 0–200 pg/ml range, MMPs 2 and
13 were within 1,000–12,000 pg/ml range, TIMP‐4 was less than 50
pg/ml, and TIMPs 1, 2, and 3 were in a broad range (0–80,000 pg/ml).
We further interpreted the release of these cytokines based on
culture conditions as well as categorized into growth factors,
chemokines, and proteases/inhibitors. TGF‐β1, β2, and β3 levels did
not vary significantly with culture conditions. VEGF‐α amount was
the highest in loose MSCs that reduced in spheroids on TCP by Day
28 but increased upon aza exposure in 3D rat or human collagen cul-
tures. Fibrotic cytokine FGF‐2 amount was also the highest in loose
MSCs on TCP, followed by spheroids in TCP, but lower within 3D col-
lagen cultures (Figure 5). Potent inflammatory cytokine MCP‐1 levels
drastically reduced in rat and human collagen gels by Day 12 but
increased within rat collagen by Day 28 in the presence or absence
of aza. However, MCP‐1 amount in human collagen cultures stayed
the same from Day 12 to Day 28 and was further reduced by aza‐
treatment. IL‐6 and MCP‐1 levels significantly reduced within rat col-
lagen by Day 12, but increased by Day 28; however, their levels
reduced by Day 28 within human collagen cultures. IL‐8 release dras-
tically increased by Day 28 within rat collagen cultures compared with
2D or human collagen cultures, and aza further enhanced these levels.
IP‐10 (CXCL10) was not expressed in any culture, except by spheroids
cultured onTCP for 28 days. MIP‐1α was not expressed within rat col-
lagen gels but was faintly released in TCP and human collagen gels.
Finally, CX3CL1 and MDC (CCL22) were not significantly influenced
by scaffold type, aza exposure, or culture duration. These results sug-
gest that spheroid formation, 3D collagen gels, collagen source (human
vs. rat), and aza strongly influenced the release of MCP‐1, VEGF, IL‐6,
IL‐8, and FGF‐2.
The basal MMP‐1 levels in TCP were increased in 3D collagen (rat
or human), although the amounts were lowered by more than half
with aza‐treatment. MMP‐2 was profusely expressed in all cultures,
with the highest in TCP and the lowest within human collagen cul-
tures. Interestingly, within rat collagen gels, MMP‐2 levels reduced
by Day 12 (with or without aza) but increased by Day 28. MMP‐3
levels remained low in all cultures, MMP‐7 levels varied based on sub-
strate type (TCP < rat collagen gel < human collagen gel), whereas
MMP‐8 levels were the least in human collagen gels followed by rat
collagen gels and TCP. Although MMP‐9 levels were low in all cultures,
they significantly varied depending on culture conditions and duration.
MMP‐10 levels were low, whereas MMP‐12 was not expressed in all
cultures. Finally, MMP‐13 amounts were highly influenced by sub-
strate type, aza treatment, and culture duration.
TIMP‐1 expression was abundant in all cultures, and the amounts
were almost 10‐fold higher in 2D compared with 3D cultures. TIMP‐
2 levels were also high in all cultures (TCP > rat collagen > human col-
lagen) by Day 28. Although TIMP‐3 was high in TCP cultures (loose or
spheroids) at all time points, it was in intermediate levels in rat colla-
gen gels and surprisingly was almost non‐existent in human collagen
gels. In general, aza showed inhibitory effect on TIMPs‐1, 2 and 3
released within rat and human collagen gels. Taken together, these
results suggest that 3D spheroid formation, 3D cultures, collagen
source, and aza exposure directly influence levels of MMPs‐1, 2, 3,
7, 8, 9, and 13 and TIMPs‐1, 2, 3, and 4 releases (Figure 5).
3.7 | Global analysis of protein deposition anddegradation
Thus far, the levels of matrix proteins and secretome synthesized and
released by cells were quantified and compared based on the culture
conditions (aza presence, 2D vs. 3D culture, collagen species source,
and culture duration). However, it would be more beneficial to gain
a generalized mechanistic understanding of the relationship between
matrix synthesis/deposition and factors contributing to that (role of
matrix degrading and protecting enzymes). Thus, we pooled the nor-
malized protein (total protein, elastin, GAGs, and LOX) amounts
deposited as matrix or released into media, as quantified from various
assays (Figure 2), from all culture conditions (2D and 3D, 0 and 10 μM
aza) tested in our study to identify respective time‐dependent global
trends. A modest decrease in matrix deposition of these proteins
(Figure 6a) with a significant increase in their release into pooled
media (Figure 6b), on a per cell basis, was noted over the 28‐day cul-
ture period. We further investigated the underlying mechanisms for
this paradox, that is, a time‐dependent reduction in protein deposition
as matrix despite their accumulation in pooled media (Figure 6a vs.
Figure 6b). It turns out that the levels of matrix degrading enzymes
(i.e., MMPs) increased significantly with time (Figure 6c), whereas the
availability of matrix‐protecting enzymes (i.e., TIMPs) decreased in
these cultures (Figure 6d). The two groups of enzymes in this system
(MMPs and TIMPs) were produced by cells, and although MMPs
degrade matrix proteins, TIMPs supposedly inhibit them from
degrading matrix proteins.
As shown in Figure 6e, we assumed that (a) the production rate of
enzymes by cells is constant over time; (b) binding of MMPs to TIMPs
is reversible, as is binding of matrix protein molecules to MMPs; (c)
TIMPs and matrix protein substrate are homologous in binding affinity
and sites, and therefore compete to bind to free MMPs, leading to
competitive inhibition; (d) either TIMP or matrix protein substrate
could bind effectively to MMPs, but not both together; and (e)
because matrix protein amounts are significantly higher than that of
TIMPs (Figure 6), they might easily overcome the competition with
TIMPs. Equations 1 and 2 show the time‐dependent concentration
changes in MMPs and TIMPs over the 28‐day culture period:
dEMMPs
dt¼ αMMPs − βMMPs EMMPs; (1)
dETIMPs
dt¼ αTIMPs − βTIMPs ETIMPs; (2)
where EMMPs and ETIMPs are the concentrations of MMPs and TIMPs
in nM respectively, t is the time in days, αMMPs and αTIMPs are produc-
tion rates (nM·day−1), and βMMPs and βTIMPs are the decay rate coeffi-
cients of MMPs and TIMPs respectively (day−1). MMPs, released in an
inactive form by eukaryotic cells, are usually activated and deactivated
by other MMPs and TIMPs respectively (e.g., MMPs 2 or 9 binds to
TIMP‐1 in 1:1 stoichiometry).
To model the protein concentration in this system, we used the
competitive inhibition form of Michaelis–Menten equation to estimate
the degradation rate of protein:
dpdt
¼ αp −kcat EMMPs p
Km 1þ ETIMPs½ �kTIMPs
� �þ p
; (3)
where p is the protein concentration, αp is the protein production rate
(nM·day−1), kcat is the turnover number (day−1), Km is the Michaelis–
Menten constant (nM), and kTIMPs is the binding constant (nM) of
inhibitive enzyme (i.e., TIMPs). Again, we have assumed that the aver-
age cellular production rate of protein, and other parameters in Equa-
tion 3, is constant over the 28 days of experiment. It should be noted
that such measured matrix protein amounts also include the intracellu-
lar proteins in respective cultures at these time points.
Experimental data from three time points, that is, Days 1, 12, and
28, were used to predict the protein concentration at intermediate
FIGURE 6 Scatter plots showing mean and standard error of pooled ECM (total protein, sGAG, HA, and elastin) proteins deposited as matrix (a)or released into pooled media (b), as quantified using various quantitative assays. Values were normalized to cell counts under respective cultureconditions, as indicated. Similarly, the levels of MMPs (c) and TIMPs (d) released by cells into pooled media and quantified by immuno‐beadingassays. Values were normalized to cell count in respective cases. From these plots, a significant negative linear correlation (R2 = .86) betweenmatrix protein deposition and culture duration, a significant positive linear correlation (R2 = .98) between protein release into pooled media andculture duration, a significant positive linear correlation (R2 = .8) between MMPs released into pooled media and duration of culture, and asignificant downregulation (R2 = .8) of TIMPs release over the culture duration were noted. Schematic representation of the proposed competitiveinhibition mechanism (Alberts, 2004). (e) TIMPs block the binding site of MMPs and prevent it from binding with substrate (matrix protein). (f)Equations (1)–(3) were fitted to the cumulative total protein deposition at each time point (experimental data pooled from across the cases) andthe resulting curve fitting of the model. Symbols represent the mean ± standard error of experimental data whereas dotted lines are the fittedmodels [Colour figure can be viewed at wileyonlinelibrary.com]
time points. All simulations and optimization methods have been done
in Python using the numpy, lmfit, and scipy libraries and leastsq as a
fitting method. Curve‐fitting results (Table 1 and Figure 6f) suggest
an excellent match between the fitted model and the experimental
data. The fitted curves for MMPs, TIMPs, and protein concentrations
exhibited R2 ≥ 0.96 indicating the success of this model in describing
the experimental data.
4 | DISCUSSION
Recently, MSCs have emerged as a primary candidate for cell‐based
therapies, with around hundreds of clinical trials already conducted
to test their suitability in treating various ailments, including cardiovas-
cular diseases (~14% of the total trials; Squillaro, Peluso, & Galderisi,
2016). The immense clinical potential of MSCs has been attributed
to their differentiability, immune‐suppression, anti‐apoptotic and
anti‐inflammatory roles, trophic and migration abilities to the
injured/diseased tissues, and their ability to secrete multiple paracrine
factors essential for tissue regeneration (Murphy, Moncivais, & Caplan,
2013). These soluble paracrine factors serve as crucial mitogenic, pro‐
angiogenic, anti‐apoptotic, immunomodulatory, anti‐scarring, chemo‐
attractive, and supportive factors during tissue regeneration
(Meirelles, Fontes, Covas, & Caplan, 2009). Besides these cytokines,
MSCs also secrete various ECM proteins, proteases (MMPs), and their
inhibitors (TIMPs) that play crucial role in matrix rebuilding and remod-
elling (Williams & Hare, 2011). Thus, in recent years, there has been an
immense interest to unveil the vast repertoire of MSC secretome,
their mechanisms to induce tissue repair and regeneration, and
approaches to modulate such outcomes.
MSC secretome exerts both positive and negative effects on car-
diac regeneration. For instance, eotaxins 1, 2, and 3 (CCL11, CCL24,
and CCL26, respectively) are involved in vascular diseases and endo-
thelial dysfunction; MCP‐1 and IL‐1, 6, and 8 are pro‐inflammatory;
MMPs contribute to matrix degradation, whereas TGF‐β could lead
to cardiac fibrosis (Williams & Hare, 2011). Thus, it is important to
not only promote beneficial paracrine factors release by MSCs but
also explore mechanisms to minimize the release of inhibitory factors
for better tissue regeneration outcomes. MSC secretome is also
responsive to the local micro‐environment cues; that is, inflammatory
cytokines stimulate MSCs to secrete higher amounts of growth factors
(Ma et al., 2014). Extrinsic techniques such as physiological precondi-
tioning, gene manipulation, molecular and pharmaceutical precondi-
tioning, cell–cell interactions, and physical pre‐conditioning are
needed to improve MSC survival post‐transplantation and achieve
controlled, predictable, and durable MSC secretome (Ranganath
et al., 2012).
Spheroid formation is important as MSCs within spheroids pre-
serve phenotype and innate properties and lead to enhanced cell sur-
vival, differentiation, and regenerative potential, compared with loose
MSCs (Sart, Tsai, Li, & Ma, 2013). Cells in spheroids coordinate with
each other and with the released secretome to result in higher cell–
cell and cell‐ECM interactions. In addition, cells also experienceTABLE
1Mode
lparam
etersobtaine
dfrom
curvefittingofEqu
ations
(1)–(3)to
expe
rimen
tald
ata
Culture
period
α p(nM/d
ay)
α MMPs(nM/d
ay)
α TIM
Ps(nM/d
ay)
β MMPs(day
−1)
β TIM
Ps(da
y−1)
k cat(day
−1)
k m(nM)
k TIM
Ps(nM)
28da
ys53.3657±1.1863
0.0042±4E−11
1.9301±1E−10
1.5034±2E−08
2.6165±2E−10
20388.4
±107.9
0.1357±0.0063
105.0607±1.943
gradients of physical tension, cytokines, nutrients, and oxygen tension
(e.g., mild hypoxia in the interior), and all these factors are hypothe-
sized to precondition MSCs for enhanced secretion of pro‐angiogenic
and anti‐inflammatory factors and ECM molecules (Sart et al., 2013).
Specifically, the hypoxic core of MSC spheroids upregulates hypoxia‐
associated genes, which are principally regulated by hypoxia inducible
factor (HIF) master transcription factors (Cesarz & Tamama, 2016; Sart
et al., 2013). In hypoxic conditions, HIF‐1α and HIF‐2α exert crucial
roles in MSC stemness and paracrine secretion, and the protein
expression of both these transcription factors is observed in MSC
spheroids (Cesarz & Tamama, 2016; Sart et al., 2013). Thus, the hyp-
oxic environment within MSC spheroids enhance pro‐angiogenic
growth factors (e.g., VEGF and HGF), upregulates anti‐inflammatory
molecules (e.g., PGE2, TSG‐6), and confers higher differentiation and
matrix synthesis ability of MSC spheroids, when compared with their
loose counterparts (Bartosh et al., 2010; Cesarz & Tamama, 2016; Sart
et al., 2013). Apart from HIF, anti‐apoptotic molecules such as Bcl‐2
are upregulated in MSC spheroids that provide higher cell survival
benefits post‐transplantation and higher regeneration ability to MSC
spheroids (Bartosh et al., 2010; Cesarz & Tamama, 2016; Sart et al.,
2013). In this context, our prior study examined time‐dependent
cardiomyogenic evolution from human BM‐MSCs when MSC spher-
oids were cultured within 2 mg/ml (rat tail‐derived) collagen hydrogel
and treated with 10 μM aza for 28 days (Joshi et al., 2018). Delivering
such MSC‐loaded hydrogels to the infarct myocardium will influence
cardiac regeneration because they (a) provide immediate micro‐
environment for the transplanted cells and other newly infiltrated
endogenous progenitor cells to home in and improve their cell survival,
(b) deliver regenerative paracrine cargo that will awaken endogenous
regeneration capability, and (c) replace the native lost cardiomyocytes
with cardiomyocyte‐like cells. However, it was not clear till now how
this 3D milieu modulates the time‐dependent secretome release and
ECM deposition by the BM‐MSC spheroids relevant for cardiac tissue
regeneration.
Two‐way ANOVA analysis suggested that culture condition (scaf-
fold type and aza treatment, p < .0001), culture duration (p = .0004),
and the interaction of these two factors (p < .0001) exerted significant
roles on cell proliferation. In addition, significant effects of culture
condition (p < .0001) and culture duration (p = .002) on cell viability
were noted, with rat collagen gels supporting significantly higher via-
bility compared with human collagen gels at each culture duration, in
the presence or absence of aza (p < .001 for all cases). Taken together,
results indicate benefits of rat collagen gels for cell proliferation and
viability compared with human collagen gels. Normalized total protein,
elastin, LOX, HA, and sGAG amounts, either deposited as matrix or
released into pooled media, were significantly influenced by culture
conditions, duration, and interaction of these two factors (p < .0001,
for all). For reasons beyond the scope of this work, human collagen
appeared to promote significantly higher release of most of these pro-
teins compared with 2D cultures or rat collagen, whereas aza sup-
pressed the amounts of these proteins in most cases.
On a per cell basis, the matrix amounts in 2D MSC spheroid cul-
tures (Figure 2d) noted in our study were significantly higher than that
reported in 2D cultures of loose MSCs. In this study, the normalized
released amounts of total protein, sGAG, HA, and elastin on 2D sub-
strates by Day 12 were 106, 3,500, 60, and 2,700 pg, respectively,
and by Day 28 were 35 × 104, 2,800, 52, and 3,600 pg, respectively.
Amable, Teixeira, Carias, Granjeiro, and Borojevic (2014) reported that
control BM‐MSCs in 2D cultures released <5 pg of collagen I, <50 pg
of collagen II, <1,250 pg of collagen III, ~120 pg of elastin, ~300 pg of
heparin sulfate, <3 pg of decorin, <0.5 pg of aggrecan, and 4 pg of lam-
inin, per million cells per day. These amounts are much lower com-
pared with the matrix protein levels noted in our study in 2D cultures
(Figure 2), which could be attributed to differences in loose (in their
study) versus spheroid cultures here.
Although cell proliferation and survival were compromised in 3D
human collagen gels in our study, the normalized matrix amounts on
a per cell basis were significantly higher than in 2D TCP or 3D rat col-
lagen gels, even in aza‐free conditions. Similar trends were noted for
collagen III, laminin, fibrillin, NOS2 (iNOS), and NOS3 (eNOS) levels
in human collagen gel cultures. These native myocardial components
contribute to provide specific micro‐environment niche that influ-
ences the endogenous progenitor cell differentiation process (Bayomy,
Bauer, Qiu, & Liao, 2012). Thus, higher myocardial matrix components
deposition by BM‐MSC spheroids, within 3D collagen gels and specif-
ically within human collagen, infer their higher potential in recovering
lost tissue following MI. Aza exposure reduced the expression of most
of the myocardial proteins within rat and human collagen gels that
could boost its application in the treatment of cardiac fibrosis, as
DNA hypermethylation (for which aza is normally used) has been asso-
ciated with many forms of cardiac fibrosis (Neary, Watson, & Baugh,
2015). Thus, 3D collagen gels, specifically from human collagen, pro-
moted synthesis of cardiac matrix components; however, reduced
matrix synthesis with aza may refer to its anti‐fibrotic role.
We noted that release of chemokines (IL‐6, MCP‐1, MCP‐3, and
GRO‐α) and growth factors (FGF‐2 and VEGF‐α) reduced with spher-
oid formation and collagen cultures; human collagen and aza lowered
chemokines release but promoted higher iNOS expression, a potent
immunomodulatory factor. Because higher levels of chemokines in
serum was detected in patients with heart diseases (Dusi, Ghidoni,
Ravera, De Ferrari, & Calvillo, 2016), the reduced levels of chemokines
noted in our study could be beneficial in limiting the tissue inflamma-
tion of an inflamed myocardial micro‐environment. Thus, collagen cul-
tures and specifically human collagen led to reduced expression of
chemokines and pro‐inflammatory cytokines but caused concomitant
higher expression of immunomodulatory factor; such tuned MSC pro-
file could be beneficial when administered to inflamed myocardium.
Significant reduction in the deposition of elastin, sGAG, and HA
proteins within 2D cultures, from Day 12 to Day 28, could be due to
concomitant increases in MMP‐2 release over this duration. Com-
pared with 2D cultures, 3D collagen gels appear to have promoted
higher secretion of cardiac tissue‐relevant ECM proteins over the 28
days. We earlier reported that MSC spheroids within 2 mg/ml rat col-
lagen gels (with 10 μm aza) expressed early cardiomyocyte‐like pheno-
type by Day 12 and late cardiomyocyte‐like phenotype by Day 28
(Joshi et al., 2018). Thus, the differentiated cells within 3D collagen
gels could be synthesizing and depositing more ECM proteins than
their undifferentiated counterparts in 2D cultures. Although spheroid
cultures in human collagen gels (with 10 μM aza) promoted synthesis
and release of sGAG, tropoelastin, HA, and LOX from Days 12 to 28,
their deposition as matrix proteins was not proportionally realized. In
general, 2D cultures promoted release of cardiac matrix proteins
mostly until Day 12, whereas 3D collagen gels (rat or human) pro-
moted release of such matrix proteins by differentiated cells, espe-
cially from Days 12 to 28.
Collagen from different tissues undergo a series of unique post‐
translational modifications that will govern the spatial organization,
diameter, cross‐linking, and D‐spacing of the collagen fibrils (Fang &
Holl, 2013). In addition, the processing conditions, such as tempera-
ture, pH, ionic strength, enzyme treatment, and the initial raw material,
are known to influence collagen functional properties such as gelation
rate, viscosity, and water retention capacity (Schmidt et al., 2016).
Because collagen from rat‐tail tendon is less cross‐linked and more
pure, dilute acid extraction is typically performed that retains the
molecular domains of the collagen molecules. On the other hand, for
collagens with higher cross‐links, including human collagen
(Vitrocol®), enzymatic treatment is done, which cleaves telopeptides
of collagen molecules (Kanta, 2015; Schmidt et al., 2016).
Telopeptides principally participate in the intermolecular cross‐links
and impact the physical, biochemical, and mechanical properties of
the hydrogels (Kanta, 2015; Schmidt et al., 2016). In addition,
telopeptides are major antigenic determinants (Gorgieva & Kokol,
2011); removal of telopeptides in human collagen eliminates the
chances of immunogenic responses, if any, with the allogeneic colla-
gen usage. Thus, differences in their extraction process could influ-
ence gelation time of human‐ and rat‐derived collagens, possibly
inducing variations in cell‐collagen anchorage and adhesion and
thereby proliferation. Although human collagen showed better biolog-
ical properties (e.g., higher prosurvival factors), their physical charac-
teristics such as higher gelation time might have impeded cell
anchorage, survival, and proliferation compared with those in rat colla-
gen. Thus, the unique 3D micro‐environment governed by nano‐
morphological cues, fibril geometry, antigenic cues, and post‐
processing states for rat and human collagens could have uniquely
contributed to the observed MSC survival and functional responses.
We report here (for the first time) on the utility of a competitive
inhibition form of Michaelis–Menten equation to estimate the degra-
dation rate of a mixture of proteins in long‐term stem cell cultures.
Such mathematical treatment captures the dynamics of protein accu-
mulation over time (deposition vs. degradation) and the underlying
turnover mechanisms. Protein synthesis and degradation kinetics by
bacteria and yeast cells have been widely reported using theoretical
and experimental approaches (e.g., Li, Burkhardt, Gross, & Weissman,
2014; Rothman, 2010), but such analysis in eukaryotic cell cultures is
lacking, possibly due to the differences in time scales, complexity,
and thermodynamics involved (Cohen et al., 2009). Prior studies
reported on the association and dissociation constants of specific
MMP/TIMP pairs; however, such data are not readily available for
synthesis and decay rates of MMPs and TIMPs. MMP decay rate
was reported to be 5 × 10⁻⁵/s (Kim & Friedman, 2010), which closely
match the degradation rate (βMMPs) derived in our simulations (Table 1). Because our model was trained on experimental observa-tions, and there is a lack of pertinent literature on absolute values of production and decay rates of proteins and enzymes by mammalian cells (not their rate constants) or kinetics model parameters (Km, Kcat, and KTIMPs), our modelling results need to be verified independently by others. Although several important parameters were deduced by developing a mathematical model that represents the experiments, more work is needed to elucidate the variability in protein production dynamics in stem cell versus mature cardiomyocyte cultures and across various time segments.
In conclusion, our study reports for the first time on secretome release and ECM deposition and turnover in human BM‐MSC spher-oids within 3D collagen (rat and human), even in the presence of aza, over 28 days. We developed a mathematical model to understand the protein synthesis and deposition dynamics within these 28‐day cultures and quantitatively assessed the critical role of MMP‐TIMP nexus. Successful clinical application of autologous BM‐MSCs for MI treatment is contingent not only on maximizing efficiency of cardio-myocyte differentiation and maturation but also on modulating cell secretome and MMPs‐mediated ECM turnover. For effective clinical translation, further studies are needed to examine and compare the matrix synthesis and paracrine secretion ability of human MSCs, MSC spheroids, differentiated cardiomyocyte‐like MSCs, and mature cardiomyocytes, over longer culture durations within both in vitro and in vivo conditions.
ACKNOWLEDGEMENTS
C. K. expresses his gratitude to the Cleveland State University Office of Research funds, and J. J. thanks the financial support from the Cel-lular and Molecular Medicine Specialization Fellowship and Disserta-
tion Research Award from Cleveland State University.
CONFLICTQOFQINTEREST
The authors have declared that there is no conflict of interest.
REFERENCES
Alberts, B. (2004). Essential cell biology. New York, NY: Garland Science
Pub.
Altara, R., Manca, M., Sabra, R., Eid, A. A., Booz, G. W., & Zouein, F. A.
(2016). Temporal cardiac remodeling post‐myocardial infarction:
Dynamics and prognostic implications in personalized medicine.
Heart Failure Reviews, 21(1), 25–47. https://doi.org/10.1007/s10741‐015‐9513‐8
Amable, P. R., Teixeira, M. V., Carias, R. B., Granjeiro, J. M., & Borojevic, R.
(2014). Protein synthesis and secretion in human mesenchymal cells
derived from bone marrow, adipose tissue and Wharton's jelly. Stem
Cell Research & Therapy, 5(2), 53. https://doi.org/10.1186/scrt442
Bartosh, T. J., Ylöstalo, J. H., Mohammadipoor, A., Bazhanov, N., Coble, K.,
Claypool, K., … Prockop, D. J. (2010). Aggregation of human mesenchy-
mal stromal cells (MSCs) into 3D spheroids enhances their
antiinflammatory properties. Proceedings of the National Academy of
Sciences of the United States of America, 107(31), 13724–13729.https://doi.org/10.1073/pnas.1008117107
Bayomy, A. F., Bauer, M., Qiu, Y., & Liao, R. (2012). Regeneration in heart
disease—Is ECM the key? Life Sciences, 91(17‐18), 823–827. https://doi.org/10.1016/j.lfs.2012.08.034
Bowers, S. L. K., Banerjee, I., & Baudino, T. A. (2010). The extracellular
matrix: At the center of it all. Journal of Molecular and Cellular Cardiol-
ogy, 48(3), 474–482. https://doi.org/10.1016/j.yjmcc.2009.08.024
Cashman, T. J., Gouon‐Evans, V., & Costa, K. D. (2013). Mesenchymal stem
cells for cardiac therapy: Practical challenges and potential mecha-
nisms. Stem Cell Reviews, 9(3), 254–265. https://doi.org/10.1007/
s12015‐012‐9375‐6
Cesarz, Z., & Tamama, K. (2016). Spheroid culture of mesenchymal stem
cells. Stem Cells International, 2016, 9176357.
Cohen, A. A., Kalisky, T., Mayo, A., Geva‐Zatorsky, N., Danon, T., Issaeva, I.,
… Alon, U. (2009). Protein dynamics in individual human cells: Experi-
ment and theory. PLoS ONE, 4(4), e4901. https://doi.org/10.1371/
journal.pone.0004901
Dusi, V., Ghidoni, A., Ravera, A., De Ferrari, G. M., & Calvillo, L. (2016).
Chemokines and heart disease: A network connecting cardiovascular
biology to immune and autonomic nervous systems. Mediators of
Inflammation, 2016(2016), 5902947.
Fan, D., Takawale, A., Lee, J., & Kassiri, Z. (2012). Cardiac fibroblasts, fibro-
sis and extracellular matrix remodeling in heart disease. Fibrogenesis &
Tissue Repair, 5(1), 15. https://doi.org/10.1186/1755‐1536‐5‐15
Fang, M., & Holl, M. M. (2013). Variation in type I collagen fibril
nanomorphology: The significance and origin. BoneKEy reports, 2, 394.
Fomovsky, G. M., Thomopoulos, S., & Holmes, J. W. (2010). Contribution
of extracellular matrix to the mechanical properties of the heart. Jour-
nal of Molecular and Cellular Cardiology, 48(3), 490–496. https://doi.org/10.1016/j.yjmcc.2009.08.003
Förstermann, U., & Sessa, W. C. (2011). Nitric oxide synthases: Regulation
and function. European Heart Journal, 33(7), 829–837.
Frangogiannis, N. G. (2014). The inflammatory response in myocardial
injury, repair, and remodelling. Nature Reviews. Cardiology, 11(5),
255–265. https://doi.org/10.1038/nrcardio.2014.28
Gishto, A., Farrell, K., & Kothapalli, C. R. (2015). Tuning composition and
architecture of biomimetic scaffolds for enhanced matrix synthesis by
murine cardiomyocytes. Journal of Biomedical Materials Research. Part
A, 103(2), 693–708. https://doi.org/10.1002/jbm.a.35217
Gorgieva, S., & Kokol, V. (2011). Collagen‐ vs. gelatine‐based biomaterials
and their biocompatibility: Review and perspectives. In Biomaterials
applications for nanomedicine. London: IntechOpen.
Joshi, J., Mahajan, G., & Kothapalli, C. R. (2018). Three‐dimensional collag-
enous niche and azacytidine selectively promote time‐dependentcardiomyogenesis from human bone marrow‐derived MSC spheroids.
Biotechnology and Bioengineering, 115(8), 2013–2026. https://doi.org/10.1002/bit.26714
Kanta, J. (2015). Collagen matrix as a tool in studying fibroblastic cell
behavior. Cell Adhesion & Migration, 9(4), 308–316. https://doi.org/10.1080/19336918.2015.1005469
Kapelko, V. I. (2001). Extracellular matrix alterations in cardiomyopathy:
The possible crucial role in the dilative form. Experimental and Clinical
Cardiology, 6(1), 41–49.
Kielty, C. M., Sherratt, M. J., & Shuttleworth, C. A. (2002). Elastic fibres.
Journal of Cell Science, 115(14), 2817–2828.
Kim, Y., & Friedman, A. (2010). Interaction of tumor with its micro‐environment: A mathematical model. Bulletin of Mathematical Biology,
72, 1029–1068. https://doi.org/10.1007/s11538‐009‐9481‐z
LeGrice, I., Pope, A., & Smaill, B. (2005). The architecture of the heart:
Myocyte organization and the cardiac extracellular matrix. In F. J.
Villarreal (Ed.), Interstitial fibrosis in heart failure. Developments in cardio-
vascular medicine (Vol. 253) (pp. 3–21). New York, NY: Springer.
Li, G. W., Burkhardt, D., Gross, C., & Weissman, J. S. (2014). Quantifying
absolute protein synthesis rates reveals principles underlying allocation
of cellular resources. Cell, 157(3), 624–635. https://doi.org/10.1016/j.cell.2014.02.033
Lockhart, M., Wirrig, E., Phelps, A., & Wessels, A. (2011). Extracellular
matrix and heart development. Birth Defects Research. Part A, Clinical
and Molecular Teratology, 91(6), 535–550. https://doi.org/10.1002/
bdra.20810
Ma, S., Xie, N., Li, W., Yuan, B., Shi, Y., & Wang, Y. (2014). Immunobiology
of mesenchymal stem cells. Cell Death and Differentiation, 21(2),
216–225. https://doi.org/10.1038/cdd.2013.158
Meirelles, L. S., Fontes, A. M., Covas, D. T., & Caplan, A. I. (2009). Mecha-
nisms involved in the therapeutic properties of mesenchymal stem
cells. Cytokine & Growth Factor Reviews, 20(5‐6), 419–427. https://doi.org/10.1016/j.cytogfr.2009.10.002
Murphy, M. B., Moncivais, K., & Caplan, A. I. (2013). Mesenchymal stem
cells: Environmentally responsive therapeutics for regenerative medi-
cine. Experimental & Molecular Medicine, 45(11), e54. https://doi.org/
10.1038/emm.2013.94
Neary, R., Watson, C. J., & Baugh, J. A. (2015). Epigenetics and the
overhealing wound: The role of DNA methylation in fibrosis.
Fibrogenesis & Tissue Repair, 8(1), 18. https://doi.org/10.1186/
s13069‐015‐0035‐8
Palamakumbura, A. H., & Trackman, P. C. (2002). A fluorometric assay for
detection of lysyl oxidase enzyme activity in biological samples. Analyt-
ical Biochemistry, 300(2), 245–251. https://doi.org/10.1006/
abio.2001.5464
Pelouch, V., Dixon, I. M., Golfman, L., Beamish, R. E., & Dhalla, N. S. (1993).
Role of extracellular matrix proteins in heart function. Molecular and
Cellular Biochemistry, 129(2), 101–120. https://doi.org/10.1007/
BF00926359
Ranganath, S. H., Levy, O., Inamdar, M. S., & Karp, J. M. (2012). Harnessing
the mesenchymal stem cell secretome for the treatment of cardiovas-
cular disease. Cell Stem Cell, 10(3), 244–258. https://doi.org/10.1016/j.stem.2012.02.005
Rienks, M., Papageorgiou, A. P., Frangogiannis, N. G., & Heymans, S. (2014).
Myocardial extracellular matrix. Circulation Research, 114(5), 872–888.https://doi.org/10.1161/CIRCRESAHA.114.302533
Rothman, S. (2010). How is the balance between protein synthesis and
degradation achieved? Theoretical Biology & Medical Modelling, 7, 25.
https://doi.org/10.1186/1742‐4682‐7‐25
Sart, S., Tsai, A. C., Li, Y., & Ma, T. (2013). Three‐dimensional aggregates of
mesenchymal stem cells: Cellular mechanisms, biological properties,
and applications. Tissue Engineering. Part B, Reviews, 20(5), 365–380.https://doi.org/10.1089/ten.TEB.2013.0537
Schmidt, M. M., Dornelles, R. C. P., Mello, R. O., Kubota, E. H., Mazutti, M.
A., Kempka, A. P., & Demiate, I. M. (2016). Collagen extraction process.
International Food Research Journal, 23(3), 913–922.
Simmers, P., Gishto, A., Vyavahare, N., & Kothapalli, C. R. (2015). Nitric
oxide stimulates matrix synthesis and deposition by adult human aortic
smooth muscle cells within three‐dimensional cocultures. Tissue Engi-
neering. Part A, 21(7‐8), 1455–1470. https://doi.org/10.1089/ten.
tea.2014.0363
Spinale, F. G. (2007). Myocardial matrix remodeling and the matrix metal-
loproteinases: Influence on cardiac form and function. Physiological
Reviews, 87(4), 1285–1342. https://doi.org/10.1152/physrev.00012.
2007
Squillaro, T., Peluso, G., & Galderisi, U. (2016). Clinical trials with mesen-
chymal stem cells: An update. Cell Transplantation, 25(5), 829–848.https://doi.org/10.3727/096368915X689622
Wang, L., Tran, I., Seshareddy, K., Weiss, M. L., & Detamore, M. S. (2009). A
comparison of human bone marrow–derived mesenchymal stem cells
and human umbilical cord–derived mesenchymal stromal cells for carti-
lage tissue engineering. Tissue Engineering. Part A, 15(8), 2259–2266.https://doi.org/10.1089/ten.tea.2008.0393
Williams, A. R., & Hare, J. M. (2011). Mesenchymal stem cells. Circulation
Research, 109(8), 923–940. https://doi.org/10.1161/
CIRCRESAHA.111.243147
Zimmermann, W. H., Didié, M., Döker, S., Melnychenko, I., Naito, H., Rogge,
C., … Eschenhagen, T. (2006). Heart muscle engineering: an update on
cardiac muscle replacement therapy. Cardiovascular Research, 71(3),
419–429. https://doi.org/10.1016/j.cardiores.2006.03.023
SUPPORTING INFORMATION
Additional supporting information may be found online in the
Supporting Information section at the end of the article.
Data S1. The actual values of cytokines, chemokines, TGF‐beta,
MMPs and TIMPs released by cells cultured within tissue culture plas-
tic (TCP), rat collagen gels, and human collagen gels.
How to cite this article: Joshi J, Abnavi MD, Kothapalli CR.
Synthesis and secretome release by human bone marrow mes-
enchymal stem cell spheroids within three‐dimensional colla-
gen hydrogels: Integrating experiments and modelling. J
Tissue Eng Regen Med. 2019;13:1923–1937.
10.1002/term.2943
https://doi.org/
Post-print standardized by MSL Academic Endeavors, the imprint of the Michael Schwartz Library at Cleveland State University, 2019