Synthesis, crystal structure, conformational and vibrational properties of 6-acetyl-2,2-dimethyl-chromane Emilio Lizarraga a,1 , Diego M. Gil a,1 , Gustavo A. Echeverría c , Oscar E. Piro c , César A.N. Catalán b , Aída Ben Altabef a,⇑ a INQUINOA, CONICET, Instituto de Química Física, Facultad de Bioquímica, Química y Farmacia, Universidad Nacional de Tucumán, San Lorenzo 456, T4000CAN Tucumán, Argentina b INQUINOA, CONICET, Instituto de Química Orgánica, Facultad de Bioquímica, Química y Farmacia, Universidad Nacional de Tucumán, Ayacucho 471, T4000INI Tucumán, Argentina c Departamento de Física, Facultad de Ciencias Exactas, Universidad Nacional de La Plata and Institute IFLP (CONICET, CCT-La Plata), C.C. 67, 1900 La Plata, Argentina highlights The 6-acetyl-2,2-dimethyl-chromane compound was synthesized and characterized. The crystal structure was determined by single-crystal X-ray diffraction methods. The vibrational frequencies and 1 H NMR chemical shifts have been calculated and compared with the experimental data. HOMO, LUMO and UV–Visible spectral analysis have been used to elucidate the electronic transitions. DSC measurements were performed in order to determine the thermodynamic parameters associated to different transitions. graphical abstract Unit cell content and Infrared and Raman spectra of 6-acetyl-2,2-dimethyl-chromane. article info Article history: Received 19 December 2013 Received in revised form 4 February 2014 Accepted 14 February 2014 Available online 24 February 2014 Keywords: 6-Acetyl-2,2-dimethyl-chromane DFT calculations IR and Raman spectroscopy NBO analysis X-ray crystal structure determination abstract The 6-acetyl-2,2-dimethyl-chromane compound was synthesized and characterized by IR, Raman, UV–Visible and 1 H NMR spectroscopies. Its solid state structure was determined by X-ray diffraction methods. The substance crystallizes in the triclinic P-1 space group with a = 5.9622(5) Å, b = 10.342(1) Å, c = 10.464(1) Å, a = 63.81(1)°, b = 81.923(9)°, c = 82.645(9)°, and Z = 2 molecules per unit cell. Due to extended p-bonding delocalization a substantial skeletal fragment of the molecule is planar. The vibra- tional modes were calculated at B3LYP/6-31G(d,p) level and all of them assigned in the IR and Raman spectra. The DFT calculated 1 H NMR spectrum (chemical shifts) were in good agreement with the exper- imental data. The electronic (UV–Visible) spectrum was calculated using TD-DFT method in gas phase and it was correlated with the experimental data. The assignment and analysis of the frontier HOMO and LUMO orbitals indicate that the absorption bands are mainly originated from p ? p transitions. According to DSC measurements the substance presents a melting point of 93 °C and decomposes at temperatures higher than 196 °C. Ó 2014 Elsevier B.V. All rights reserved. http://dx.doi.org/10.1016/j.saa.2014.02.035 1386-1425/Ó 2014 Elsevier B.V. All rights reserved. ⇑ Corresponding author. Tel.: +54 381 4311044; fax: +54 381 4248169. E-mail address: [email protected](A. Ben Altabef). 1 These two authors contributed equally to this paper. Spectrochimica Acta Part A: Molecular and Biomolecular Spectroscopy 127 (2014) 74–84 Contents lists available at ScienceDirect Spectrochimica Acta Part A: Molecular and Biomolecular Spectroscopy journal homepage: www.elsevier.com/locate/saa
Transcript
Spectrochimica Acta Part A: Molecular and Biomolecular Spectroscopy 127 (2014) 74–84
Contents lists available at ScienceDirect
Spectrochimica Acta Part A: Molecular andBiomolecular Spectroscopy
journal homepage: www.elsevier .com/locate /saa
Synthesis, crystal structure, conformational and vibrational propertiesof 6-acetyl-2,2-dimethyl-chromane
http://dx.doi.org/10.1016/j.saa.2014.02.0351386-1425/� 2014 Elsevier B.V. All rights reserved.
1 These two authors contributed equally to this paper.
Emilio Lizarraga a,1, Diego M. Gil a,1, Gustavo A. Echeverría c, Oscar E. Piro c, César A.N. Catalán b,Aída Ben Altabef a,⇑a INQUINOA, CONICET, Instituto de Química Física, Facultad de Bioquímica, Química y Farmacia, Universidad Nacional de Tucumán, San Lorenzo 456, T4000CAN Tucumán, Argentinab INQUINOA, CONICET, Instituto de Química Orgánica, Facultad de Bioquímica, Química y Farmacia, Universidad Nacional de Tucumán, Ayacucho 471, T4000INI Tucumán, Argentinac Departamento de Física, Facultad de Ciencias Exactas, Universidad Nacional de La Plata and Institute IFLP (CONICET, CCT-La Plata), C.C. 67, 1900 La Plata, Argentina
h i g h l i g h t s
� The 6-acetyl-2,2-dimethyl-chromanecompound was synthesized andcharacterized.� The crystal structure was determined
by single-crystal X-ray diffractionmethods.� The vibrational frequencies and 1H
NMR chemical shifts have beencalculated and compared with theexperimental data.� HOMO, LUMO and UV–Visible
spectral analysis have been used toelucidate the electronic transitions.� DSC measurements were performed
in order to determine thethermodynamic parametersassociated to different transitions.
g r a p h i c a l a b s t r a c t
Unit cell content and Infrared and Raman spectra of 6-acetyl-2,2-dimethyl-chromane.
a r t i c l e i n f o
Article history:Received 19 December 2013Received in revised form 4 February 2014Accepted 14 February 2014Available online 24 February 2014
Keywords:6-Acetyl-2,2-dimethyl-chromaneDFT calculationsIR and Raman spectroscopyNBO analysisX-ray crystal structure determination
a b s t r a c t
The 6-acetyl-2,2-dimethyl-chromane compound was synthesized and characterized by IR, Raman,UV–Visible and 1H NMR spectroscopies. Its solid state structure was determined by X-ray diffractionmethods. The substance crystallizes in the triclinic P-1 space group with a = 5.9622(5) Å, b = 10.342(1)Å, c = 10.464(1) Å, a = 63.81(1)�, b = 81.923(9)�, c = 82.645(9)�, and Z = 2 molecules per unit cell. Due toextended p-bonding delocalization a substantial skeletal fragment of the molecule is planar. The vibra-tional modes were calculated at B3LYP/6-31G(d,p) level and all of them assigned in the IR and Ramanspectra. The DFT calculated 1H NMR spectrum (chemical shifts) were in good agreement with the exper-imental data. The electronic (UV–Visible) spectrum was calculated using TD-DFT method in gas phaseand it was correlated with the experimental data. The assignment and analysis of the frontier HOMOand LUMO orbitals indicate that the absorption bands are mainly originated from p ? p� transitions.According to DSC measurements the substance presents a melting point of 93 �C and decomposes attemperatures higher than 196 �C.
E. Lizarraga et al. / Spectrochimica Acta Part A: Molecular and Biomolecular Spectroscopy 127 (2014) 74–84 75
Introduction
As is well-known, hetero-cycles compounds are widespread innatural products and have attracted considerable attention froma wide area of science, including physical chemistry, medicinalchemistry, natural product chemistry, synthetic organic chemistryand polymer science [1].
4-Hydroxi-3-(3-methyl-2-butenyl)-acetophenone is the mainsecondary matebolite from Senecio nutans, a medicinal plant ofAsteraceae family [2]. Moreover, the prenyled p-hydroxyacetophe-none derivatives are important biogenetic precursors of benzofu-rans and benzochromenes, two significant groups of bioactivemetabolites in the plant kingdom [3].
Chromane and chromene substructures are frequently found innaturally occurring compounds, many of which exhibit useful bio-logical activity [4,5]. Several biologically active chromenes andchromanes have been isolated from several natural sources. Thesecompounds are characterized by different biological propertiessuch as antibacterial [6,7], antifungal [8], trypanocidal [9], apopto-sis-inducing agents [10,11], anti-HIV agents [12,13], and modula-tors of estrogen receptors [14,15].
Here we report the synthesis and crystal structure of 6-acetyl-2,2-dimethyl-chromane by X-ray diffraction methods and its infra-red, Raman and NMR spectra. Differential Scanning Calorimetry(DSC) measurements were also carried out to evaluate the enthal-py (DH) and entropy (DS) variations associated with different tran-sitions. The molecular geometry optimizations were performedusing DFT/B3LYP methods and different basis sets to assist theinterpretation and the assignment of experimental IR and Ramanspectra. Moreover, the crystal structure of the title compoundwas determinate by X-ray diffraction methods, and their experi-mental geometrical parameters were used to validate the theoret-ical results. The study was complemented with natural bondorbitals (NBO) analysis [16] and HOMO–LUMO studies to evaluatethe nature of the rings and the electronic properties of thecompound.
Experimental section
Isolation of 4-hydroxi-3-(3-methyl-2-butenyl)-acetophenone (1)
Compound 1 was obtained from an extract of S. nutans [2].114 g of methylene chloride extract was dissolved in ethyl ether(200 mL) and extracted with 7% NaOH (2 � 100 mL); the alkalinephase was washed with methylene chloride (2 � 10 mL) and then
Scheme 1. Synthesis of 6-acety
31% HCl was added dropwise until pH 3 and extracted with meth-ylene chloride (3 � 60 mL). The CH2Cl2 extracts were reunited andthe solvent evaporated to yield 22.4 g of residue which was chro-matographed on silica gel Merck 70–230 mesh using hexane–ethylacetate 5:1 as elution solvent. Fractions showing a single spot onTLC were reunited and the solvent was evaporated to yield 13.4 gof compound 1 as a crystalline solid which was re-crystallized inethanol–water 1:1, melting point (mp) 95–96 �C. The mp value ob-tained is similar to reported by Marchese et al. [17]; UV, EI-MS, 1Hand 13C NMR spectra: identical to the reported previously [18–20].
Synthesis of 6-acetyl-2,2-dimethyl-chromane (2)
Compound 1 (1.5 g; 7.35 m mol) was dissolved in 40 mL of eth-anol containing 4.5 mL of concentrated HCl (Scheme 1) and re-fluxed for 5 h. After cooling, 50 mL de distilled water was addedand the resulting mixture was extracted with methylene chloride(3 � 50 mL). The organic extracts were reunited, washed withwater (10 mL), 5% NaHCO3 (3 � 20 mL) and brine (20 mL). Afterdrying (Na2SO4) and solvent evaporation, 1.07 g (yield 72%) ofcrude 2 was obtained. Single crystals, adequate for structural X-ray diffraction measurements, were obtained from slow evapora-tion of ethanol–water (1:1) solutions. The melting point and thepurity of the crystals obtained were 94–95 �C and 99.98% (GC),respectively. The purity was determined by capillary gas chroma-tography using both flame ionization detector (FID) and selectivemass detector. EIMS: m/z (rel. int.) [M]+ 204 (52), 189 (82), 161(26), 151 (11), 149 (100), 133 (40), 121 (6), 115 (6), 105 (8), 91(16), 77 (22), 65 (7), 51 (12), 43 (57).
2.2 Instrumentation
Infrared and Raman spectroscopyThe room temperature (RT) infrared absorption spectrum of so-
lid state 6-acetyl-2,2-dimethyl-chromane was recorded in the4000–400 cm�1 frequency range with a Perkin–Elmer GX1 FourierTransform infrared instrument. The Raman dispersion spectrum ofthe solid at RT was measured in the 3500 and 50 cm�1 intervalwith a Thermoscientific DXR Raman microscope. The Raman datawere collected using a diode-pump, solid state laser ofk = 532 nm (at 5 cm�1 spectral resolution), a con-focal aperture of25 lm pinhole and a 10� objective. The sample was placed ongold-coated sample slides. To achieve a sufficient signal to noiseratio, 30 spectral scans of 2 s each were accumulated during themeasurements with the laser power maintained at 10 mW.
l-2,2-dimethyl-chromane.
Table 1Crystal data and structure refinement results for 6-acetyl-2,2-dimethyl chromane.
Empirical formula C13 H16 O2
Formula weight 204.26Temperature 293(2) K
76 E. Lizarraga et al. / Spectrochimica Acta Part A: Molecular and Biomolecular Spectroscopy 127 (2014) 74–84
NMR spectra1H NMR was recorded on a Bruker AC (200 MHz) spectrometer.
Sample was dissolved in CDCl3 and tetramethyl silane (TMS) wasused as internal standard. Chemical shifts were recorded in d(ppm) values relative to TMS and J values are expressed in Hertz.
Wavelength 1.54184 ÅCrystal system TriclinicSpace group P-1Unit cell dimensions a = 5.9622(5) Å a = 63.81(1)�
b = 10.342(1) Å b = 81.923(9)�c = 10.464(1) Å c = 82.645(9)�
Volume 571.65(9) Å3
Z, Density (calculated) 2, 1.187 Mg/m3
Absorption coefficient 0.625 mm�1
F(000) 220
UV–Visible spectroscopyUV–Visible measurements were recorded using quartz cells
(10 mm optical path length) on an Shimadzu 160A spectrophotom-eter. For this purpose, a solution of 9.84 mg/L of compound 2 inethanol 96� was prepared. The spectrum was recorder between800 and 200 nm.
Crystal size 0.502 � 0.277 � 0.179 mm3
2h-range for data collection 4.73–71.96�Index ranges �7 6 h 6 4, �12 6 k 6 11,
Data/restraints/parameters 2227/0/201Goodness-of-fit on F2 1.053Final R indicesa [I > 2r(I)] R1 = 0.0532, wR2 = 0.1534R indices (all data) R1 = 0.0592, wR2 = 0.1657Extinction coefficient 0.059(6)Largest diff. peak and hole 0.242 and �0.179 e �3
a R1 = R||Fo|�|Fc||/R|Fo|, wR2 = [Rw(|Fo|2�|Fc|2)2/Rw(|Fo|2)2]1/2.
GC-MS measurementsThe GC-MS analysis was carried out with a 5973 Hewlett
Packard selective mass detector (quadrupole), source 70 eV,coupled to a HP 6890 GC fitted with a HP-5MS column (5% phen-ylmethyl siloxane, 30 m � 0.25 mm; film thickness 0.25 lm) withhelium as carrier gas (1.0 mL/min; constant flow). The oven wasprogrammed as follows: 150 �C (0 min), 150–180 �C (3 �C/min),180 �C (2 min), 180–234 �C (1.5�/min), 234 �C (2 min). Injection:0.1 lL of a 10% solution of the compound dissolved in methylenechloride. Injector and detector temperatures were maintained at250 �C and 270 �C, respectively. Injection port was maintained at250 �C, GC-MS inter-phase at 275 �C, ion source 230 �C, and MSQuad at 150 �C. The mass spectrum is shown in Fig. S1 (SupportingInformation).
Differential Scanning Calorimetry (DSC)Calorimetric measurements were performed using a differential
scanning calorimeter Perkin Elmer Pyris DSC 6. The experimentswere carried out using 1.150 mg of powdered sample sealed in alu-minum pans with a mechanical crimp. Temperature and heat flowcalibrations were made with standard samples of indium by usingits melting transition. Enthalpy changes associated with the melt-ing point of the sample in study (DH) were directly obtained fromthe DSC data by integrating the anomalous peak in the baselinesubtracted curve. The entropy change relative to the phase transi-tion was finally determined using the relationship DS = DH/T.
X-ray diffraction dataThe measurements were performed on an Oxford Xcalibur
Gemini, Eos CCD diffractometer with graphite-monochromatedCu Ka (k = 1.54184 Å) radiation. X-ray diffraction intensities werecollected (x scans with # and j-offsets), integrated and scaledwith CrysAlisPro [21] suite of programs. The unit cell parameterswere obtained by least-squares refinement (based on the angularsettings for all collected reflections with intensities larger than se-ven times the standard deviation of measurement errors) usingCrysAlisPro. Data were corrected empirically for absorptionemploying the multi-scan method implemented in CrysAlisPro.The structure was solved by direct methods with SHELXS-97 [22]and the corresponding molecular model developed by alternatedcycles of Fourier methods and full-matrix least-squares refinementon F2 with SHELXL-97 [23]. All hydrogen atoms were located in adifference Fourier map phased on the heavier atoms and refinedat their found positions with isotropic displacement parameters.The optimized methyl H-positions converged to staggered confor-mations. Crystal data and structure refinement results are summa-rized in Table 1. Crystallographic structural data have beendeposited at the Cambridge Crystallographic Data Centre (CCDC).Any request to the Cambridge Crystallographic Data Centre for thismaterial should quote the full literature citation and the referencenumber CCDC 977091.
2.3 Computational methods
Theoretical calculations were performed using the programpackage Gaussian 03 [24]. The potential energies associated withthe C(8)C(7)C(1)C(6) dihedral angle were calculated at B3LYP levelusing the 6-31G(d,p) basis sets, with that torsion angle frozen andall other parameters allowed to relax. The total energy curves weresampled in steps of 10� using default convergence criteria asimplemented in the Gaussian program [24]. Final optimizationsand vibration frequency calculations were implemented employ-ing the 6-31G(d,p) and 6-311++G(d,p) basis sets. The computedvibrational properties correspond, in all cases, to potential energyminima with no imaginary values for the frequencies.
A natural bond orbital (NBO) calculation was performed at theB3LYP/6-311++G(d,p) level using the program NBO 3.1 [16] asimplemented in Gaussian 03 package. This analysis was performedto understand various second-order interactions between the filledorbitals of one subsystem and vacant orbitals of another subsys-tem. NBO analysis provides an efficient method for studying intra-and intermolecular interactions and also provides a convenientbasis for investigating charge transfer or conjugative interactionin molecular systems. The calculated chemical shifts of the 1HNMR spectrum was obtained by means of the GIAO method [25]using the B3LYP/6-311++G(d,p) level of theory. The calculationshave been performed using the geometries optimized for this levelof theory and using the TMS as reference.
The electronic properties, such as HOMO–LUMO energies,absorption wavelengths and oscillator strengths were calculatedusing B3LYP method of the time dependent TD-DFT based on theoptimized structure in gas phase.
Results and discussion
Crystal structure
The compound 6-acetyl-2,2-dimethyl-chromane crystallizes inthe triclinic P-1 space group with cell parameters a = 5.9622(5) Å,
Fig. 1. View of the structure of 6-acetyl-2,2-dimethyl-chromane showing thelabeling of non-H atoms and their displacement ellipsoids at the 30% probabilitylevel.
E. Lizarraga et al. / Spectrochimica Acta Part A: Molecular and Biomolecular Spectroscopy 127 (2014) 74–84 77
b = 10.342(1) Å, c = 10.464(1) Å, a = 63.81(1)�, b = 81.923(9)�,c = 82.645(9)� and Z = 2 molecules per unit cell. Fig. 1 shows andORTEP [26] plot of the chromane derivative molecule and theirbond distances and angles are given in Table 2, observed intra-molecular bond distances and angles conforms the organic chem-istry rules. Particularly, the observed aromatic ring CAC bond dis-tances are in the 1.372(2)–1.396(2) Å range as expected for a
Table 2Selected experimental and calculated bond distances, angles and dihedral angles of 6-acetyl-2,2-dimethyl-chromane.
a From structural X-ray diffraction methods.b Computed with 6-311++G(d,p) basis set. See Fig. 1 for the atom numbering
scheme.
resonant bond structure. This delocalized p-bonding structure ex-tends to the attached acetyl group and to the oxygen of the fusedhetero-cycle ring hence stabilizing the planar conformation ob-served for the corresponding molecular fragment [rms deviationof non-H atoms from the best least-squares plane equal to 0.027Å]. Single CAC bond distances in the chromane hetero-cycle arein the 1.506(2)–1.525(3) Å range.
Molecular structure
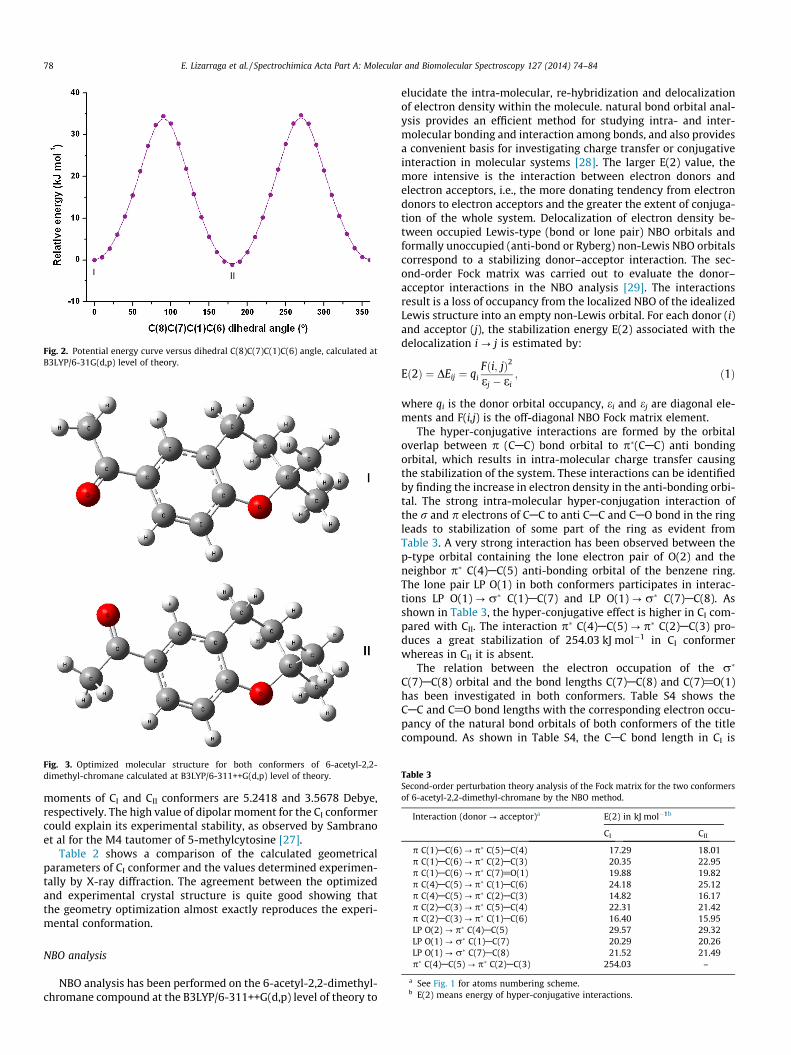
The potential energy surface scans for internal rotation aroundthe C(8)C(7)C(1)C(6) dihedral angle (B3LYP/6-31G(d,p) level) wereperformed to evaluate the minima energy structures adopted bythe title compound as shown in Fig. 2. Two different stable confor-mations were obtained according to the position of C@O groupwith respect to the C(1)@C(2) Bond (See Fig. 3). In conformer I(CI), the C@O group is syn respect to the C@C bond and in con-former II (CII), the carbonyl group is anti respect to the C@C bond.According to the crystal structure described previously, only CI isobserved in the solid. In CII, the acetyl group is in the same planeas the molecular skeleton, moreover, in CI, the C(8)C(7)C(1)C(6)dihedral angle is 0.10� indicating that the acetyl group is deviatedabove the molecular plane.
For both conformers identified above, the free energies calcu-lated using the B3LYP/6-31G(d,p) level of theory were used, alongwith the average temperature of the experiment, to estimate (usingthe Boltzmann distribution) the amount of each conformer thatshould be observed in the gas phase. The difference in free energywas calculated to be 0.29 kJ mol�1; therefore the ratio of CI:CII con-former was predicted to be 0.47:0.53. The difference in total energycalculated at the same level of theory is 1.10 kJ mol�1. The dipolar
Fig. 2. Potential energy curve versus dihedral C(8)C(7)C(1)C(6) angle, calculated atB3LYP/6-31G(d,p) level of theory.
Fig. 3. Optimized molecular structure for both conformers of 6-acetyl-2,2-dimethyl-chromane calculated at B3LYP/6-311++G(d,p) level of theory. Table 3
Second-order perturbation theory analysis of the Fock matrix for the two conformersof 6-acetyl-2,2-dimethyl-chromane by the NBO method.
a See Fig. 1 for atoms numbering scheme.b E(2) means energy of hyper-conjugative interactions.
78 E. Lizarraga et al. / Spectrochimica Acta Part A: Molecular and Biomolecular Spectroscopy 127 (2014) 74–84
moments of CI and CII conformers are 5.2418 and 3.5678 Debye,respectively. The high value of dipolar moment for the CI conformercould explain its experimental stability, as observed by Sambranoet al for the M4 tautomer of 5-methylcytosine [27].
Table 2 shows a comparison of the calculated geometricalparameters of CI conformer and the values determined experimen-tally by X-ray diffraction. The agreement between the optimizedand experimental crystal structure is quite good showing thatthe geometry optimization almost exactly reproduces the experi-mental conformation.
NBO analysis
NBO analysis has been performed on the 6-acetyl-2,2-dimethyl-chromane compound at the B3LYP/6-311++G(d,p) level of theory to
elucidate the intra-molecular, re-hybridization and delocalizationof electron density within the molecule. natural bond orbital anal-ysis provides an efficient method for studying intra- and inter-molecular bonding and interaction among bonds, and also providesa convenient basis for investigating charge transfer or conjugativeinteraction in molecular systems [28]. The larger E(2) value, themore intensive is the interaction between electron donors andelectron acceptors, i.e., the more donating tendency from electrondonors to electron acceptors and the greater the extent of conjuga-tion of the whole system. Delocalization of electron density be-tween occupied Lewis-type (bond or lone pair) NBO orbitals andformally unoccupied (anti-bond or Ryberg) non-Lewis NBO orbitalscorrespond to a stabilizing donor–acceptor interaction. The sec-ond-order Fock matrix was carried out to evaluate the donor–acceptor interactions in the NBO analysis [29]. The interactionsresult is a loss of occupancy from the localized NBO of the idealizedLewis structure into an empty non-Lewis orbital. For each donor (i)and acceptor (j), the stabilization energy E(2) associated with thedelocalization i ? j is estimated by:
Eð2Þ ¼ DEij ¼ qiFði; jÞ2
ej � ei; ð1Þ
where qi is the donor orbital occupancy, ei and ej are diagonal ele-ments and F(i,j) is the off-diagonal NBO Fock matrix element.
The hyper-conjugative interactions are formed by the orbitaloverlap between p (CAC) bond orbital to p�(CAC) anti bondingorbital, which results in intra-molecular charge transfer causingthe stabilization of the system. These interactions can be identifiedby finding the increase in electron density in the anti-bonding orbi-tal. The strong intra-molecular hyper-conjugation interaction ofthe r and p electrons of CAC to anti CAC and CAO bond in the ringleads to stabilization of some part of the ring as evident fromTable 3. A very strong interaction has been observed between thep-type orbital containing the lone electron pair of O(2) and theneighbor p� C(4)AC(5) anti-bonding orbital of the benzene ring.The lone pair LP O(1) in both conformers participates in interac-tions LP O(1) ? r� C(1)AC(7) and LP O(1) ? r� C(7)AC(8). Asshown in Table 3, the hyper-conjugative effect is higher in CI com-pared with CII. The interaction p� C(4)AC(5) ? p� C(2)AC(3) pro-duces a great stabilization of 254.03 kJ mol�1 in CI conformerwhereas in CII it is absent.
The relation between the electron occupation of the r�
C(7)AC(8) orbital and the bond lengths C(7)AC(8) and C(7)@O(1)has been investigated in both conformers. Table S4 shows theCAC and C@O bond lengths with the corresponding electron occu-pancy of the natural bond orbitals of both conformers of the titlecompound. As shown in Table S4, the CAC bond length in CI is
Table 4Experimental and calculated 1H NMR chemical shifts (ppm).
a See Fig. S3 for the atom numbering scheme.b Calculated at B3LYP/6-311++G(d,p) level of theory.c NMR spectrum measured in CDCl3.
E. Lizarraga et al. / Spectrochimica Acta Part A: Molecular and Biomolecular Spectroscopy 127 (2014) 74–84 79
slightly longer than that of CII, which is in agreement with the highoccupancy of the r� C(7)AC(8) in CI. This result accords with thehigher LP O(2) ? r� C(7)AC(8) energy interaction in CI which pro-duces a lengthening of the CAC bond and a shortening of the C@Obond as compared with CII conformer.
NMR analysis
Following geometry optimization of 6-acetyl-2,2-dimethyl-chromane, Gauge-Including Atomic Orbital (GIAO) method wasused to predict 1H NMR chemical shifts using DFT-B3LYP func-tional with 6-311++G(d,p) basis sets.
The relationship between the experimental 1H chemical shifts(dexp) and (GIAO) magnetic isotropic shielding constants (dcalc) isusually linear and described by the following equation: dexp = a + bdcalc [30–32]. The slope and intercept of the least-squares correla-tion are utilized to predict chemical shifts, and the linear correla-tion coefficient (R) is used to verify the precision and theagreement between experimental and theoretical data. Fig. 4shows the linear regression between the experimental and theo-retical 1H NMR chemical shifts. In the present study, the correla-tion coefficient for proton chemical shift is determined as0.98848. This proves fair agreement between the experimentaland their calculated data. According to the comparison betweencalculated data and experimental counterparts, the calculatedchemical shifts are in acceptable agreement with the experimentalresults. Table 4 shows the calculated and experimental chemicalshifts with the corresponding tentative assignment. The experi-mental 1H NMR spectrum is shown in Fig. S2. The aromatic protonsH-9, H-3 and H-8 appear at d 7.74, 7.72 and 6.80 ppm as d(J = 2.2 Hz), dd (J = 8.9 and 2.2 Hz) and broad d (J = 8.9), respec-tively. The triplets (2H each) at d 2.82 and 1.83 ppm are assignedto the 13-CH2 and 16-CH2 of the pyrane ring, respectively (seeFig. S3 for atoms numbering). The singlet of 3H at d 2.53 ppm is as-signed to the protons of the acetyl group while the singlet of 6H atd 1.36 ppm is assigned to the protons of the gem-dimethyl grouplinked to the pyrane ring.
Vibrational study
The 6-acetyl-2,2-dimethyl-chromane molecule lacks of anysymmetry (C1 point group). Therefore, all 87 normal modes of
Fig. 4. Correlation between experimental and calculated 1H NMR chemical shifts.Calculations performed at the B3LYP/6-311++G(d,p) level.
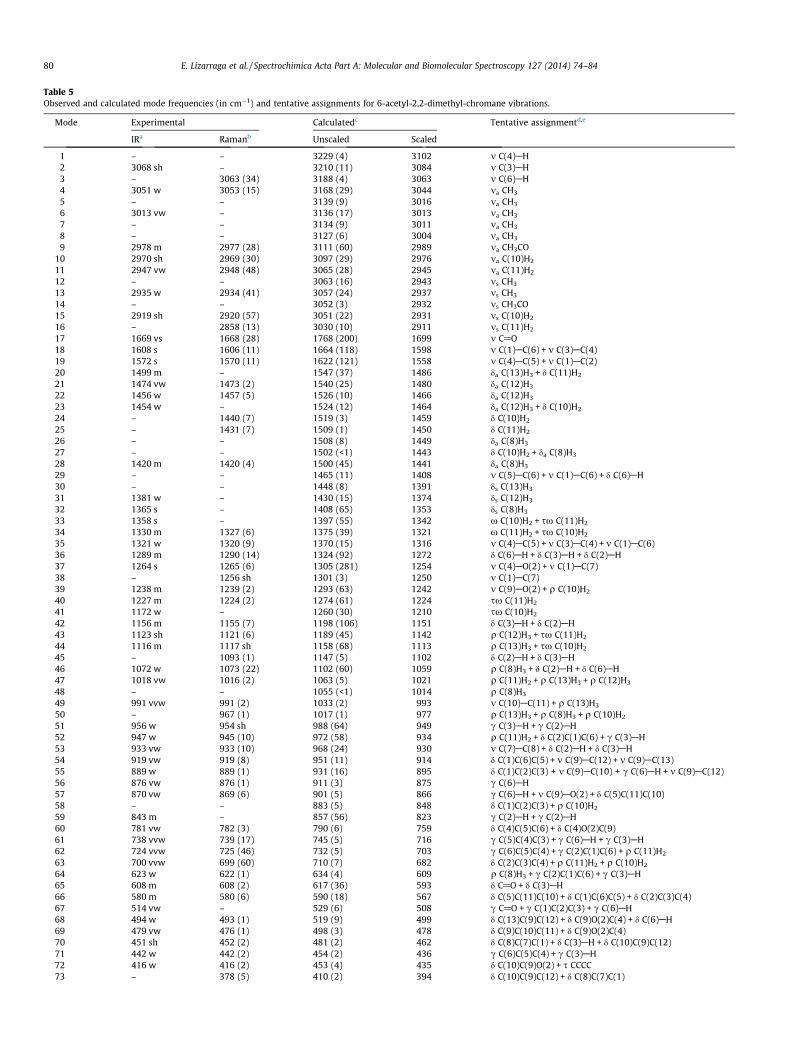
vibrations are both IR- and Raman-active. The assignment ofmodes to observed bands in the solid state FTIR and Raman spectraof the compound was assisted by the theoretically predicted fre-quencies for the modes. These were calculated in the harmonicapproximation at the B3LYP/6-31G(d,p) level of theory. The exper-imental IR and Raman spectra are shown in Fig. 5 whereas the sim-ulated IR and Raman spectra for the CI conformer are presented inFig. S4. The experimental and calculated vibration frequencies arecompared in Table 5 along a tentative mode assignment. It is to benoted some discrepancy between observed and calculated fre-quencies that can in part be due to the fact that the inter-molecularinteractions unavoidably present in the solid state is not taken intoaccount in the gas phase theoretical calculations. Vibration modefrequencies calculated at B3LYP/6-31G(d,p) level of theory werescaled by 0.9608 to correct for theoretical error in this work [33].
CH3 vibrationsThe anti-symmetric and symmetric stretching modes of the
methyl group normally appear at about 3100 and 2880 cm�1. Thebands observed at 3051 and 3013 cm�1 in the IR spectrum and at
Fig. 5. Solid state IR transmission (upper trace) and Raman dispersion spectra(lower trace) of 6-acetyl-2,2-dimethyl-chromane.
Table 5Observed and calculated mode frequencies (in cm�1) and tentative assignments for 6-acetyl-2,2-dimethyl-chromane vibrations.
1 – – 3229 (4) 3102 m C(4)AH2 3068 sh – 3210 (11) 3084 m C(3)AH3 – 3063 (34) 3188 (4) 3063 m C(6)AH4 3051 w 3053 (15) 3168 (29) 3044 ma CH3
5 – – 3139 (9) 3016 ma CH3
6 3013 vw – 3136 (17) 3013 ma CH3
7 – – 3134 (9) 3011 ma CH3
8 – – 3127 (6) 3004 ma CH3
9 2978 m 2977 (28) 3111 (60) 2989 ma CH3CO10 2970 sh 2969 (30) 3097 (29) 2976 ma C(10)H2
11 2947 vw 2948 (48) 3065 (28) 2945 ma C(11)H2
12 – – 3063 (16) 2943 ms CH3
13 2935 w 2934 (41) 3057 (24) 2937 ms CH3
14 – – 3052 (3) 2932 ms CH3CO15 2919 sh 2920 (57) 3051 (22) 2931 ms C(10)H2
16 – 2858 (13) 3030 (10) 2911 ms C(11)H2
17 1669 vs 1668 (28) 1768 (200) 1699 m C@O18 1608 s 1606 (11) 1664 (118) 1598 m C(1)AC(6) + m C(3)AC(4)19 1572 s 1570 (11) 1622 (121) 1558 m C(4)AC(5) + m C(1)AC(2)20 1499 m – 1547 (37) 1486 da C(13)H3 + d C(11)H2
21 1474 vw 1473 (2) 1540 (25) 1480 da C(12)H3
22 1456 w 1457 (5) 1526 (10) 1466 da C(12)H3
23 1454 w – 1524 (12) 1464 da C(12)H3 + d C(10)H2
24 – 1440 (7) 1519 (3) 1459 d C(10)H2
25 – 1431 (7) 1509 (1) 1450 d C(11)H2
26 – – 1508 (8) 1449 da C(8)H3
27 – – 1502 (<1) 1443 d C(10)H2 + da C(8)H3
28 1420 m 1420 (4) 1500 (45) 1441 da C(8)H3
29 – – 1465 (11) 1408 m C(5)AC(6) + m C(1)AC(6) + d C(6)AH30 – – 1448 (8) 1391 ds C(13)H3
31 1381 w – 1430 (15) 1374 ds C(12)H3
32 1365 s – 1408 (65) 1353 ds C(8)H3
33 1358 s – 1397 (55) 1342 x C(10)H2 + sx C(11)H2
34 1330 m 1327 (6) 1375 (39) 1321 x C(11)H2 + sx C(10)H2
35 1321 w 1320 (9) 1370 (15) 1316 m C(4)AC(5) + m C(3)AC(4) + m C(1)AC(6)36 1289 m 1290 (14) 1324 (92) 1272 d C(6)AH + d C(3)AH + d C(2)AH37 1264 s 1265 (6) 1305 (281) 1254 m C(4)AO(2) + m C(1)AC(7)38 – 1256 sh 1301 (3) 1250 m C(1)AC(7)39 1238 m 1239 (2) 1293 (63) 1242 m C(9)AO(2) + q C(10)H2
40 1227 m 1224 (2) 1274 (61) 1224 sx C(11)H2
41 1172 w – 1260 (30) 1210 sx C(10)H2
42 1156 m 1155 (7) 1198 (106) 1151 d C(3)AH + d C(2)AH43 1123 sh 1121 (6) 1189 (45) 1142 q C(12)H3 + sx C(11)H2
44 1116 m 1117 sh 1158 (68) 1113 q C(13)H3 + sx C(10)H2
45 – 1093 (1) 1147 (5) 1102 d C(2)AH + d C(3)AH46 1072 w 1073 (22) 1102 (60) 1059 q C(8)H3 + d C(2)AH + d C(6)AH47 1018 vw 1016 (2) 1063 (5) 1021 q C(11)H2 + q C(13)H3 + q C(12)H3
51 956 w 954 sh 988 (64) 949 c C(3)AH + c C(2)AH52 947 w 945 (10) 972 (58) 934 q C(11)H2 + d C(2)C(1)C(6) + c C(3)AH53 933 vw 933 (10) 968 (24) 930 m C(7)AC(8) + d C(2)AH + d C(3)AH54 919 vw 919 (8) 951 (11) 914 d C(1)C(6)C(5) + m C(9)AC(12) + m C(9)AC(13)55 889 w 889 (1) 931 (16) 895 d C(1)C(2)C(3) + m C(9)AC(10) + c C(6)AH + m C(9)AC(12)56 876 vw 876 (1) 911 (3) 875 c C(6)AH57 870 vw 869 (6) 901 (5) 866 c C(6)AH + m C(9)AO(2) + d C(5)C(11)C(10)58 – – 883 (5) 848 d C(1)C(2)C(3) + q C(10)H2
59 843 m – 857 (56) 823 c C(2)AH + c C(2)AH60 781 vw 782 (3) 790 (6) 759 d C(4)C(5)C(6) + d C(4)O(2)C(9)61 738 vvw 739 (17) 745 (5) 716 c C(5)C(4)C(3) + c C(6)AH + c C(3)AH62 724 vvw 725 (46) 732 (5) 703 c C(6)C(5)C(4) + c C(2)C(1)C(6) + q C(11)H2
64 623 w 622 (1) 634 (4) 609 q C(8)H3 + c C(2)C(1)C(6) + c C(3)AH65 608 m 608 (2) 617 (36) 593 d C@O + d C(3)AH66 580 m 580 (6) 590 (18) 567 d C(5)C(11)C(10) + d C(1)C(6)C(5) + d C(2)C(3)C(4)67 514 vw – 529 (6) 508 c C@O + c C(1)C(2)C(3) + c C(6)AH68 494 w 493 (1) 519 (9) 499 d C(13)C(9)C(12) + d C(9)O(2)C(4) + d C(6)AH69 479 vw 476 (1) 498 (3) 478 d C(9)C(10)C(11) + d C(9)O(2)C(4)70 451 sh 452 (2) 481 (2) 462 d C(8)C(7)C(1) + d C(3)AH + d C(10)C(9)C(12)71 442 w 442 (2) 454 (2) 436 c C(6)C(5)C(4) + c C(3)AH72 416 w 416 (2) 453 (4) 435 d C(10)C(9)O(2) + s CCCC73 – 378 (5) 410 (2) 394 d C(10)C(9)C(12) + d C(8)C(7)C(1)
80 E. Lizarraga et al. / Spectrochimica Acta Part A: Molecular and Biomolecular Spectroscopy 127 (2014) 74–84
74 – 350 (1) 378 (3) 363 d O(12)C(11)C(28) + s CCCC + d C(12)C(9)C(13)75 – 338 (3) 336 (2) 323 s CCCC76 – 322 (6) 320 (1) 307 s COCC + s CCCC77 – 291 (7) 286 (2) 275 s C(13)H3 + s CCCC78 – 264 (5) 271 (<1) 260 s C(12)H3 + s C(13)H3
79 – 249 (4) 258 (<1) 248 s CCCC + s C(11)AC(5)80 – – 239 (1) 229 s C(13)H3 + s C(12)H3
81 – – 211 (<1) 202 s CCCC + s C(12)H3 + s C(13)H3
82 – 173 (100) 157 (1) 151 s CCCC + s C(8)H3
83 – 156 (20) 154 (<1) 148 s C(8)H3
84 – – 140 (1) 135 s CCCC85 – 105 (35) 113 (2) 109 c C(9)O(2)C(4) + s CCCC86 – 82 (60) 58 (2) 55 s C(7)C(1)87 – – 45 (<1) 43 s ring
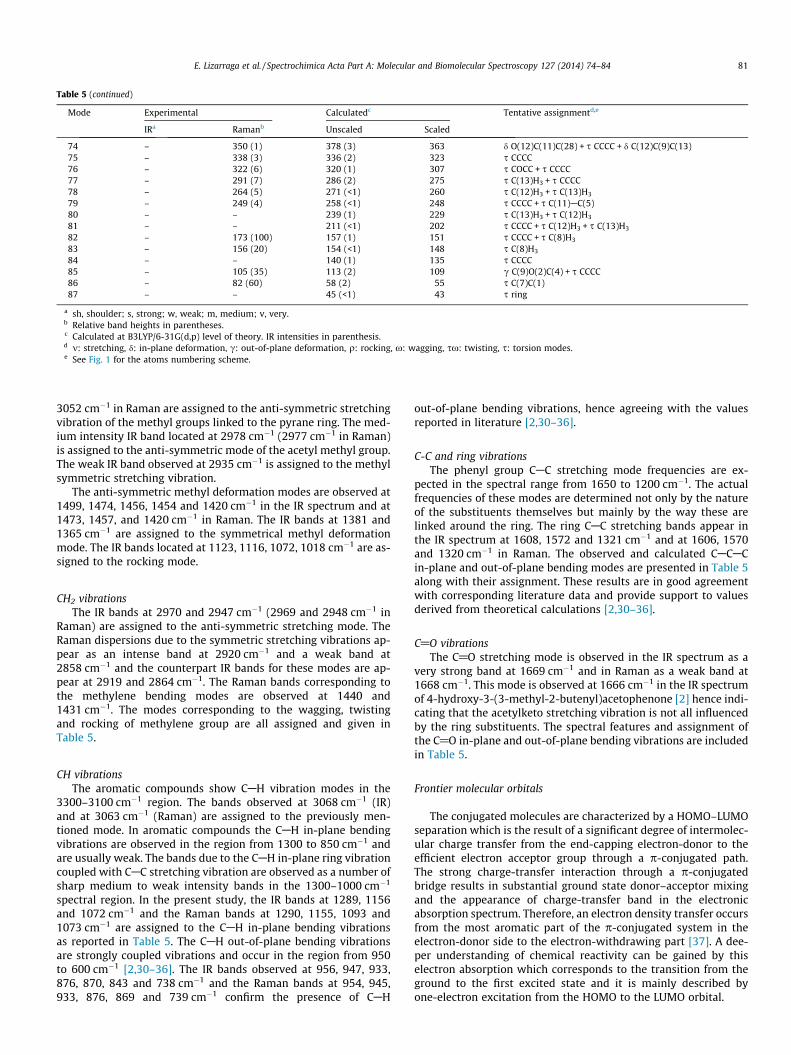
a sh, shoulder; s, strong; w, weak; m, medium; v, very.b Relative band heights in parentheses.c Calculated at B3LYP/6-31G(d,p) level of theory. IR intensities in parenthesis.d m: stretching, d: in-plane deformation, c: out-of-plane deformation, q: rocking, x: wagging, sx: twisting, s: torsion modes.e See Fig. 1 for the atoms numbering scheme.
E. Lizarraga et al. / Spectrochimica Acta Part A: Molecular and Biomolecular Spectroscopy 127 (2014) 74–84 81
3052 cm�1 in Raman are assigned to the anti-symmetric stretchingvibration of the methyl groups linked to the pyrane ring. The med-ium intensity IR band located at 2978 cm�1 (2977 cm�1 in Raman)is assigned to the anti-symmetric mode of the acetyl methyl group.The weak IR band observed at 2935 cm�1 is assigned to the methylsymmetric stretching vibration.
The anti-symmetric methyl deformation modes are observed at1499, 1474, 1456, 1454 and 1420 cm�1 in the IR spectrum and at1473, 1457, and 1420 cm�1 in Raman. The IR bands at 1381 and1365 cm�1 are assigned to the symmetrical methyl deformationmode. The IR bands located at 1123, 1116, 1072, 1018 cm�1 are as-signed to the rocking mode.
CH2 vibrationsThe IR bands at 2970 and 2947 cm�1 (2969 and 2948 cm�1 in
Raman) are assigned to the anti-symmetric stretching mode. TheRaman dispersions due to the symmetric stretching vibrations ap-pear as an intense band at 2920 cm�1 and a weak band at2858 cm�1 and the counterpart IR bands for these modes are ap-pear at 2919 and 2864 cm�1. The Raman bands corresponding tothe methylene bending modes are observed at 1440 and1431 cm�1. The modes corresponding to the wagging, twistingand rocking of methylene group are all assigned and given inTable 5.
CH vibrationsThe aromatic compounds show CAH vibration modes in the
3300–3100 cm�1 region. The bands observed at 3068 cm�1 (IR)and at 3063 cm�1 (Raman) are assigned to the previously men-tioned mode. In aromatic compounds the CAH in-plane bendingvibrations are observed in the region from 1300 to 850 cm�1 andare usually weak. The bands due to the CAH in-plane ring vibrationcoupled with CAC stretching vibration are observed as a number ofsharp medium to weak intensity bands in the 1300–1000 cm�1
spectral region. In the present study, the IR bands at 1289, 1156and 1072 cm�1 and the Raman bands at 1290, 1155, 1093 and1073 cm�1 are assigned to the CAH in-plane bending vibrationsas reported in Table 5. The CAH out-of-plane bending vibrationsare strongly coupled vibrations and occur in the region from 950to 600 cm�1 [2,30–36]. The IR bands observed at 956, 947, 933,876, 870, 843 and 738 cm�1 and the Raman bands at 954, 945,933, 876, 869 and 739 cm�1 confirm the presence of CAH
out-of-plane bending vibrations, hence agreeing with the valuesreported in literature [2,30–36].
C-C and ring vibrationsThe phenyl group CAC stretching mode frequencies are ex-
pected in the spectral range from 1650 to 1200 cm�1. The actualfrequencies of these modes are determined not only by the natureof the substituents themselves but mainly by the way these arelinked around the ring. The ring CAC stretching bands appear inthe IR spectrum at 1608, 1572 and 1321 cm�1 and at 1606, 1570and 1320 cm�1 in Raman. The observed and calculated CACACin-plane and out-of-plane bending modes are presented in Table 5along with their assignment. These results are in good agreementwith corresponding literature data and provide support to valuesderived from theoretical calculations [2,30–36].
C@O vibrationsThe C@O stretching mode is observed in the IR spectrum as a
very strong band at 1669 cm�1 and in Raman as a weak band at1668 cm�1. This mode is observed at 1666 cm�1 in the IR spectrumof 4-hydroxy-3-(3-methyl-2-butenyl)acetophenone [2] hence indi-cating that the acetylketo stretching vibration is not all influencedby the ring substituents. The spectral features and assignment ofthe C@O in-plane and out-of-plane bending vibrations are includedin Table 5.
Frontier molecular orbitals
The conjugated molecules are characterized by a HOMO–LUMOseparation which is the result of a significant degree of intermolec-ular charge transfer from the end-capping electron-donor to theefficient electron acceptor group through a p-conjugated path.The strong charge-transfer interaction through a p-conjugatedbridge results in substantial ground state donor–acceptor mixingand the appearance of charge-transfer band in the electronicabsorption spectrum. Therefore, an electron density transfer occursfrom the most aromatic part of the p-conjugated system in theelectron-donor side to the electron-withdrawing part [37]. A dee-per understanding of chemical reactivity can be gained by thiselectron absorption which corresponds to the transition from theground to the first excited state and it is mainly described byone-electron excitation from the HOMO to the LUMO orbital.
82 E. Lizarraga et al. / Spectrochimica Acta Part A: Molecular and Biomolecular Spectroscopy 127 (2014) 74–84
Molecular orbitals, when viewed in a qualitative graphical rep-resentation, can provide insight into the nature of reactivity, andalso into some of the structural and physical properties of mole-cules. Well-known concepts such as conjugation, aromaticity andlone pairs are well illustrated by molecular orbitals. Molecularorbital coefficients analysis showed that the frontier molecularorbital (FMOs) are composed mainly of p-atomic orbitals. Hence,the electronic spectrum corresponding to electronic transitionsare mainly of p ? p� nature.
The energy levels of the HOMO, LUMO, HOMO-1, HOMO-2 andLUMO + 1 orbitals computed at the B3LYP/6-31G(d,p) level of the-ory for 6-acetyl-2,2-dimethyl-chromane are represented inFig. 6(a). As can be appreciated in the figure, the HOMO is localizedon the benzene ring, OAC@O part, the methylene group of thepyrane ring, and the O atom of the hetero-atomic ring. The LUMOis characterized by a charge distribution on the benzene ring, theacetyl group, and the O located in the pyrane ring.
The HOMO–LUMO energy gap is a relevant value which servesas a stability index. In fact, a large HOMO–LUMO gap implies highmolecular stability in the sense of its lower reactivity in chemicalreactions [37,38,32,39]. The energy values of HOMO and LUMO
Fig. 6. (a) Molecular orbitals involved in the electronic transitions of 6-acetyl-2,2-dimethyl-chromane and (b) atomic orbital composition of the frontier molecularorbital for 6-acetyl-2,2-dimethyl-chromane.
molecular orbitals with the corresponding HOMO–LUMO energygap is shown in Fig. 6(b). The LUMO as an electron acceptor repre-sents the ability to obtain an electron, and HOMO represents theability to donate an electron. The energy gap value of HOMO–LUMO (3.54 eV) explains the eventual charge transfer interactionwithin the molecule, which influences the biological activity ofthe molecule. Consequently, the lowering of the HOMO–LUMOband gap is essentially a consequence of the large stabilization ofthe LUMO due to the strong ability of the electron-acceptor group.
UV–Visible spectra analysis
To understand the nature of electronic transitions within 6-acetyl-2,2-dimethyl-chromane molecule, TD-DFT calculations onelectronic absorption spectra in gas phase were performed. Thekmax values are obtained from the UV–Visible spectra analyzed the-oretically with B3LYP/6-31G(d,p) level of theory. The calculated UVabsorption maxima (which are a function of electron availability),theoretical electronic excitation energies, and oscillator strengthsare detailed in Table 6. The experimental and theoretically pre-dicted UV–Visible spectra are visualized in Fig. 7. As can be seenfrom Table 6, the calculated absorption maxima values for 6-acet-yl-2,2-dimethyl-chromane have been found to be 323, 267 and259 nm. The oscillator strength for the transition at 267 nm ishigher in magnitude compared to other transitions and its corre-sponding experimental value is observed at 281 nm. The maxi-mum absorption at 281 nm is assigned to the transition from
Table 6Theoretical electronic absorption spectra of 6-acetyl-2,2-dimethyl-chromane calcu-lated at B3LYP/6-311++G(d,p) level of theory.
a H = highest occupied molecular orbital; L = lowest unoccupied molecularorbital.
Fig. 7. Experimental and calculated UV–Visible absorption spectra of 6-acetyl-2,2-dimethyl-chromane.
Fig. 8. DSC curve for solid state 6-acetyl-2,2-dimethyl-chromane.
E. Lizarraga et al. / Spectrochimica Acta Part A: Molecular and Biomolecular Spectroscopy 127 (2014) 74–84 83
HOMO orbital to LUMO one. This transition (H ? L) is predicted tobe of p ? p� nature (see Fig. 6(b)).
The absorption band at 323 nm in the calculated spectrum is as-signed to HOMO-1 ? LUMO transition. This band was not ob-served experimentally probably because it is obliterated by themuch more intense absorption band at 281 nm. The observed bandat 227 nm is mainly generated by excitations from HOMO-2 ? LUMO and HOMO ? LUMO + 1 (calculated wavelength of259 nm). Ultraviolet radiation having wavelengths near or lessthan 200 nm is difficult to handle, and is seldom used as a routinetool for structural analysis.
Differential Scanning Calorimetry (DSC) study
The aim of the present DSC study was to examine the possiblestructural transitions and evaluate the thermodynamic parametersassociated to the melting point of the compound. Fig. 8 shows theDSC curve for 6-acetyl-2,2-dimethyl-chromane in solid state. TheDSC scan clearly shows an endothermic transition at 93 �C. Thistransition is attributed to the melting of the sample. The valueagrees reasonably well with that obtained experimentally usingan Ernest Leite microscope (94–95 �C). The estimated DH and DSvariations for the phase transition are 22.1 kJ mol�1 and60.36 J mol�1 K�1, respectively. The endothermic peak located at196 �C can be attributed to the decomposition of the substance.
4. Conclusions
The 6-acetyl-2,2-dimethyl-chromane compound was synthe-sized for the first time by using 4-hydroxi-3-(3-methyl-2-bute-nyl)-acetophenone as precursor. The substance was fullycharacterized by MS spectrometry, 1H NMR, UV–Visible, IR and Ra-man spectroscopy and also by single crystal structural X-ray dif-fraction methods. The solid state molecular fragment is planardue to extended p-bonding delocalization. This arrangement issimilar to that predicted by quantum chemical calculations. IRand Raman, 1H NMR and UV–Vis spectra of the title compoundwas recorded and simulated by DFT approaches. The TD-DFT calcu-lation assisted the assignment of electronic transitions observed inthe UV–Vis absorption spectrum. The HOMO–LUMO energy gap iscalculated to be 3.54 eV wide. The computed 1H NMR chemicalshift values compare well with the experimental values. DSC mea-surements show that the substance melts at 93 �C and decomposesat temperatures higher than 196 �C.
Acknowledgments
D.M.G. and A.B.A. thank CIUNT (Project 26D-411) and CONICET(PIP 0629) for financial support. C.A.N.C and E.L. thank CIUNT (Pro-ject 26D-416) and CONICET (PIP 0225) for financial support. E.L.and D.M.G. thank CONICET for postdoctoral fellowships. This workwas supported by CONICET (PIP 1529), and by ANPCyT (PME062804 and PICT06 2315) of Argentina (O.E.P. and G.A.E.). Authorsthank Mr. Marcelo Arias for Raman and DSC measurements.
Appendix A. Supplementary material
Tables of fractional coordinates and equivalent isotropic dis-placement parameters of the non-H atoms (Table S1), atomicanisotropic displacement parameters (Table S2), and hydrogenatoms positions (Table S3). Supplementary data associated withthis article can be found, in the online version, at http://dx.doi.org/10.1016/j.saa.2014.02.035.
References
[1] G.P. Ellis, Chromenes, Chromanones, and Chromones (In Chemistry ofHeterocyclic Compounds), Wiley, New York, 1977. 11–141.
[2] E. Lizárraga, E. Romano, R.A. Rudyk, C.A.N. Catalán, S.A. Brandán, Spectrochim.Acta Part A 97 (2012) 202.
[3] P. Proksch, E. Rodriguez, Phytochemistry 22 (1983) 2335.[4] R.S. Bowers, T. Ohta, J.S. Cleere, P. Marsella, Science 193 (1976) 542.[5] A.R. Katrikzy, C.W. Rees, E.F.V. Scriven, A. McKillop, A Comprehensive
Heterocyclic Chemistry II, Elsevier, Amsterdam, 1996.[6] M. Kidwai, S. Saxena, M.K.R. Khan, S.S. Thukral, Bioorg. Med. Chem. Lett. 15
(2005) 4295.[7] M.M. Khafagy, A.H.F. Abd El-Wahab, F.A. Eid, A.M. El-Agrody, IL Farmaco 57
[9] J. da Silva Mota, A.C. Leite, J.M. Batista, S.N. López, D.L. Ambrósio, D. DuóPasserini, M.J. Kato, V. da Silva Bolzani, R.M. Barretto Cicarelli, M. Furlan, PlantaMed. 75 (2009) 620.
[10] W. Kemnitzer, S. Kasibhatla, S.C. Jiang, H. Zhang, J.H. Zhao, S.J. Jia, L.F. Xu, C.Crogan-Grundy, R. Denis, N. Barriault, L. Vaillancourt, S. Charron, J. Dodd, G.Attardo, D. Labrecque, S. Lamothe, H. Gourdeau, B. Tseng, J. Drewe, S.X. Cai,Bioorg. Med. Chem. 15 (2005) 4745.
[11] A. Afantitis, G. Melagraki, H. Sarimveis, P.A. Koutentis, J. Markopoulos, O.Igglessi-Markopoulou, Bioorg. Med. Chem. 14 (2006) 6686.
[12] T.A. Engler, K.O. LaTessa, R. Iyengar, W.Y. Chai, K. Agrios, Bioorg. Med. Chem. 4(1996) 1755.
[13] Y. Kashiwada, K. Yamazaki, Y. Ikeshiro, T. Yamagishi, T. Fujioka, K. Mihashi, KMizuki, L.M. Cosentino, K. Fowke, S.L. Morris-Natschke, K.H. Lee, Tetrahedron57 (2001) 1559.
[14] R.F. Kaltenbach, S.P. Robinson, G.L. Trainor, PCTU.S. Pat. 20,050,267,183, 2005.[15] X. Zhang, Z. Sui, Z. PCT U.S. Pat. 20,060,020,018, 2006.[16] E.D. Glendening, J.K. Badenhoop, A.D. Reed, J.E. Carpenter, F.F. Weinhold,
Theoretical Chemistry Institute, University of Wisconsin, Madison, WI, 1996.[17] M.J.A. Marchese, C.S. de Heluani, C.A.N. Catalán, C.A. Griffin, J.B. Vaughn, W.
Herz, Biochem. System. Ecol. 35 (2007) 169.[18] F. Bohlmann, M. Grenz, Chemische Berichte 103 (1970) 90.[19] F. Tomás-Barberán, E. Iniesta-San Martín, F. Tomás-Lorente, A. Rumbero,
Phytochemistry 29 (1990) 1093.[20] M.A. Ponce, E. Gros, An. Asoc. Quim. Argent. 79 (5) (1991) 197.[21] CrysAlisPro, Oxford Diffraction Ltd., version 1.171.33.48 (release 15.09.2009
CrysAlis171.NET).[22] G.M. Sheldrick, SHELXS-97. Program for Crystal Structure Resolution, Univ. of
[23] G.M Sheldrick, SHELXL-97. Program for Crystal Structures Analysis, Univ. ofGöttingen, Göttingen, Germany, 1997;G.M. Sheldrick, Acta Crystallogr. A 64 (2008) 112–122.
[24] M.J. Frisch, J.A. Pople, J.S. Binkley, J. Chem. Phys. 80 (1984) 3265;M.J. Frisch, G.W. Trucks, H.B. Schlegel, G.E. Scuseria, M.A. Robb, J.R. Cheeseman,J.A. Montgomery Jr., T. Vreven, K.N. Kudin, J.C. Burant, J.M. Millam, S.S. Iyengar,J. Tomasi, V. Barone, B. Mennucci, M. Cossi, G. Scalmani, N. Rega, G.A.Petersson, H. Nakatsuji, M. Hada, M. Ehara, K. Toyota, R. Fukuda, J. Hasegawa,M. Ishida, T. Nakajima, Y. Honda, O. Kitao, H. Nakai, M. Klene, X. Li, J.E. Knox,H.P. Hratchian, J.B. Cross, C. Adamo, J. Jaramillo, R. Gomperts, R.E. Stratmann,O. Yazyev, A.J. Austin, R. Cammi, C. Pomelli, J.W. Ochterski, P.Y. Ayala, K.Morokuma, G.A. Voth, P. Salvador, J.J. Dannenberg, V.G. Zakrzewski, S.Dapprich, A.D. Daniels, M.C. Strain, O. Farkas, D.K. Malick, A.D. Rabuck, K.Raghavachari, J.B. Foresman, J.V. Ortiz, Q. Cui, A.G. Baboul, S. Clifford, J.
84 E. Lizarraga et al. / Spectrochimica Acta Part A: Molecular and Biomolecular Spectroscopy 127 (2014) 74–84
Cioslowski, B.B. Stefanov, G. Liu, A. Liashenko, P. Piskorz, I. Komaromi, R.L.Martin, D.J. Fox, T. Keith, M.A. Al-Laham, C.Y. Peng, A. Nanayakkara, M.Challacombe, P.M.W. Gill, B. Johnson, W. Chen, M.W. Wong, C. González, J.A.Pople, Gaussian 03, revision C.02, Gaussian Inc, Wallingford, CT, 2004.
[25] R. Ditchfield, Mol. Phys. 8 (1974) 397.[26] C.K. Johnson, ORTEP-II. A Fortran thermal-ellipsoid plot program. Report
ORNL-5318, Oak Ridge National Laboratory, Tennessee, USA, 1976.[27] J.R. Sambrano, A.R. de Souza, J.J. Queralt, M. Oliva, J. Andrés, Chem. Phys. 264
(2001) 333.[28] M. Shehalatha, C. Ravikumar, I. Huber Joe, N. Sekar, V.S. Jayakumar,
Spectrochim. Acta A 72 (2009) 654.[29] M. Szafran, A. Komasa, E.B. Adamska, J. Mol. Struct. (Theochem.) 827 (2007)
101.[30] V. Arjunan, M. Kalaivani, S. Senthilkumari, S. Mohan, Spectrochim. Acta A 115
(2013) 154.[31] L.P. Avendaño Jiménez, G.A. Echeverría, O.E. Piro, S.E. Ulic, J.L. Jios, J. Phys.
Chem. A 117 (2013) 2169.
[32] C. Sridevi, G. Shanthi, G. Velraj, Spectrochim. Acta A 89 (2012) 46.[33] N. Sundaraganesan, G. Mariappan, S. Manoharan, Spectrochim. Acta A 87
(2011) 67.[34] T.S. Xavier, I. Huber Joe, M.A. Palafox, S. Kumar, V.K. Rastogi, Spectrochim. Acta
A 114 (2013) 502.[35] D. Sajan, Y. Erdogdu, R. Reshmy, Ö. Dereli, K. Kurien Thomas, I. Huber Joe,
Spectrochim. Acta A 82 (2011) 118.[36] K.C. Mariamma, H.T. Varghese, C. Yohannan Panicker, K. John, J. Vinsova, C. Van
Alsenoy, Spectrochim. Acta A 112 (2013) 161.[37] V. Arjunan, S. Sakiladevi, T. Rani, C.V. Mythili, S. Mohan, Spectrochim. Acta A 88
(2012) 220.[38] S.P.V. Chamundeeswari, E.R.J.J. Samuel, N. Sundaraganean, Eur. J. Chem. 2
(2011) 136.[39] P. Prabavathi, A. Nilufer, V. Krishnakumar, Spectrochim. Acta A 114 (2013)