GENERAL PAPERS - POSTER SESSION PRESENTED BEFORE THE DIVISION O F PETROLEUM CHEMISTRY, INC. AMERICAN CHEMICAL SOCIETY WASHINGTON, D. C. MEETING, AUGUST 28 - SEPTEMBER 2, 1983 SYNTHESIS O F ALKYLATED INDANES AND TETRALINS FOR USE IN FOSSIL FUEL ANALYSIS BY D. S. Watt, M. Adamczyk, andD. A. Netzel Department of Chemistry, University of Wyoming and Department of Energy, Laramie Energy Technology Center Laramie, Wyoming 82070 ABSTRACT The availability of authentic hydrocarbon samples in the substituted indane and tetralin families would facilitate the anal- ysis of certain fossil fuel mixtures. We have developed general procedures for the efficient preparation of simple alkylated in- danes 1 tetralins ? from common precursors. We have exam- ined the 13C NMR and mass spectral fragmentation data for hydrocarbons 1 and 2 in detail. R I mR
Transcript
GENERAL PAPERS - POSTER SESSION PRESENTED BEFORE THE DIVISION OF PETROLEUM CHEMISTRY, INC.
AMERICAN CHEMICAL SOCIETY WASHINGTON, D. C. MEETING, AUGUST 28 - SEPTEMBER 2, 1983
SYNTHESIS O F ALKYLATED INDANES AND TETRALINS FOR USE IN FOSSIL FUEL ANALYSIS
BY
D. S. Watt, M. Adamczyk, andD. A. Netzel Department of Chemistry, University of Wyoming
and Department of Energy, Laramie Energy Technology Center Laramie, Wyoming 82070
ABSTRACT
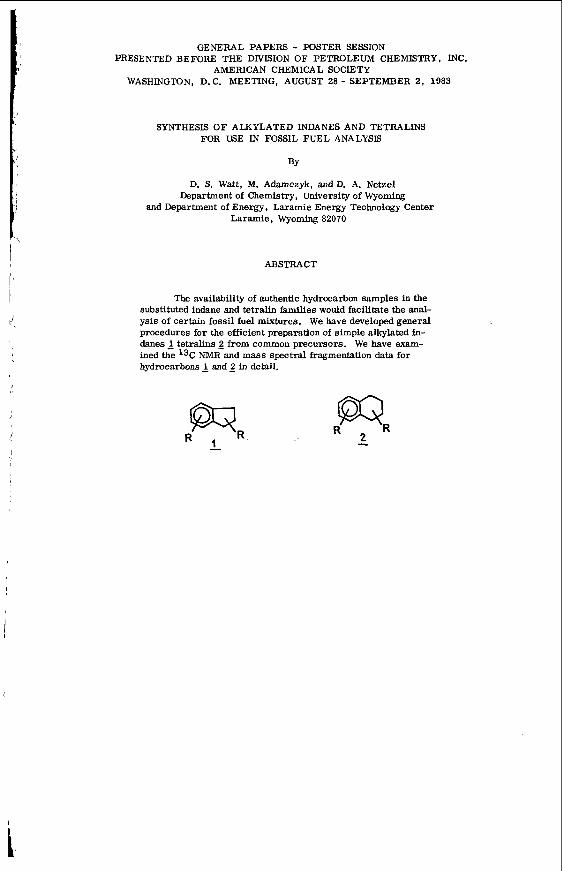
The availability of authentic hydrocarbon samples in the substituted indane and tetralin families would facilitate the anal- ysis of certain fossil fuel mixtures. We have developed general procedures for the efficient preparation of simple alkylated in- danes 1 tetralins ? from common precursors. We have exam- ined the 13C NMR and mass spectral fragmentation data for hydrocarbons 1 and 2 in detail.
R I mR
GENERAL PAPERS - POSTER SESSION PRESENTED BEFORE THE DIVISION OF PETROLEUM CHEMISTRY, INC.
AMERICAN CHEMICAL SOCIETY WASHINGTON, D. C. MEETING, AUGUST 28 - SEPTEMBER 2, 1983
A TIME-TEMPERATURE-CONCENTRATION MATRM FOR INDUCED SEDIMENT FORMATION IN SHALE DIESEL FUEL
BY
J. 77. Cooney, E. J. Beal, and R. N. Hazlett Naval Research Laboratory, Code 6180, Washington, D. C. 20375
INTRODUCTION
Deterioration in fuel quality with time bas been a continuing problem in the utilization of middle distillate fuels. These stability problems will intensify a s we develop alternative sources of fuel, such as shale oil and coal. Present knowledge has suggested that for some fuels, nitrogen heterocycles may play a causative role in the formation of insoluble sediments and gums under con- ditions of ambient and accelerated storage (1). In light of the high costs of fuel processing, sub- stantial savings could be realized if i t were possible to identify those nitrogen heterocycles which are most actively involved in the formation of insoluble material. Currently, i t appears that rela- tively non-basic nitrogen heterocycles, particularly those which contain alkyl groups in certain positions, may be the most troublesome (2). However, in other fuels and under different test con- ditions, basic nitrogen compounds may play a significant role (3).
In addressing this subject, we a r e defining the stability of shale-derived diesel fuel marine (DFM), stressing the sample under accelerated storage conditions, and determining the amoimt ef total insoluble material produced. This report describes rp.sc!t;: o5j'hinea when 2,5-dimethylpyrrole (DMP) was used a s a dopQnt k 2 +&re-iemperature-concentration matrix. Results of a survey of other nitrogen compounds a s fuel additives a r e also presented.
EXPERIMENTAL
Storage Test Techniques
300 ml samples of filtered fuel were stressed in the dark in 500 ml screw-cap borosilicate Erlen- meyer flasks (Teflon-lined caps). Al l samples were run in duplicate. Vented testa were accom- plished by using modified screw caps which were drilled to hold 6 mm glass tubing (with glass wool plugs). After s t ress , test flasks were allowed to cool to room temperature before being filtered under slight vacuum through a double layer of Gelman glass fiber filter paper. F l a s k contents were then rinsed with several ml of g-heptane, with additional sediment being collected on the filter paper. The filter cake w a s rinsed withpheptane to remove adsorbed fuel. The flasks and filter holders were heated (120°C) under vacuum for twelve hours, allowed to equilibrate on a benchtop (several hours), and accurately weighed several times on an analytical balance. Appropriate blank fiasWfilter holder corrections were applied. Filtrable sediment values were Qbtained from the corrected net weight change of the filter holder with adherent gum values determined from the weight change of the test flask (4).
Reagents The base fuel for the present study is DFM refined from Paraho crude shale oil by SOHIO.
This fuel, produced in the U. S. Navy's Shale-11 demonstration, is well-characterized (4). It was available with (sample "D-1'3 and without (sample "D-11") antioxidant added. The antioxidant, 2,4- dimethyl-6s-butylphenol (AO-30), was present a t the 24 mg/l level in fuel D11. No other additives were present in either sample. All nitrogen compounds used as dopants were pure by NMR, capil- lary GC, and/or mp. Fresh DMP was stored frozen under nitrogen so as to prevent autoxidation and i t remained colorless under this storage. The concentration matrix was prepared by appropri- ate dilution of a quantity of stock-doped fuel solution (typically 450 ppm w/v nitrogen).
The experimental procedures used were developed from reported methods (2). In summary,
RESULTS AND DISCUSSION
Accelerated fuel stability tests are important to the producers of fuels and to those perform- ing research on chemical instability phenomena (5). The majority of these tests measure sediment weight in order to estimate fuel instability, and tes t temperatures have varied between ambient and
t. ! ads, the accompanying uncertainty of the significance of the observed conditions may be dominant.
Figure 1 summarizes a time-temperature matrix for several accelerated fuel stability tests which have appeared in the literature. It is noteworthy that a majority of the stability tests depicted fall close to the solid line, which represents a doubling of test time for each 10°C drop in temperature. The line extrapolates to approximately one year of ambient storage. The present study has concen-
CONCLUSIONS
A common reaction pathway appears to exist for DMP-promoted sedimentation in DFM. Re- sults obtained are consistent with those of other workers (2) A high-precision gravimetric method of fuel storage stability determination has been developed.
ACKNOWLEDGMENT
The authors thank Dr. Dennis W. Brinkman of the Bartlesville Energy Technology Center (WE) for sponsoring this work under DOE contract DE-AI-8lBC10525. References to brand names were made for identification only and do not imply endorsement by DOE or NRL.
FIGURE 1 Time-Temperature Correlation f o r Accelerated Fuel Stability Tests
+!!EL, \ ONRL
DuPont
NRL
Daniel
soft glass 0 121OC-168 hrs.
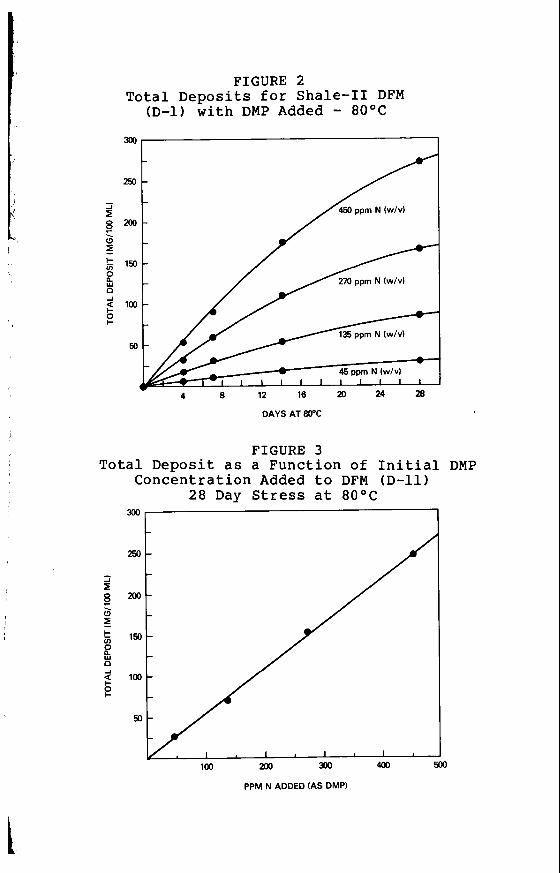
FIGURE 2 Total Deposits for Shale-I1 DFM
(D-1) with DMP Added - 8OoC
250
450 ppm N (w/v) /
4 8 12 16 P 24 28
DAYS AT 80°C
FIGURE 3 Total Deposit as a Function of Initial DMP
I
PPM N ADDED (AS DMP)
FIGURE 4 Peroxide Numbers for DFM
(D-1 and D-11) at 8OoC
0.1 I I I I I I I _
10 20 30 0
DAYS AT 80°C
TABLE I
RELATIONSHIP OF NITROGEN COMPOUND STRUCTURE TO SEDIMENTATION IN DFM (D1)
Frankenfeld, J. W., Taylor, W. F., and Brinkman, D. W., "Fundamental Synthetic Fuel Stability Study", EXXON R and E Co., Rpt. No. WE/BC/10045-12, February 1981 and references therein. Frankenfeld, J. W., Taylor, W. F., and Brinkman, D. W., "Fundamental Synthetic Fuel Stability Study", EXXON R and E Co., Rpt. No. WE/BC/10045-23, March 1982.
For example: a) Dahlin, K. E., Daniel, S. R., and Worstell, J. H., Fuel, E, 477 (1981); b) Worstell, J. H., and Daniel, S. R., Fuel, 2, 481 (1981); c) Worstell, J. H., Daniel, S. R., and Frauenhoff, G . , Fuel, 60, 485 (1981).
For more detail: Hazlett, R. N., Cooney, J. V., and B e d , E . , "Mechanisms of Syncrude/ Synfuel Degradation - First Annual Report: September 15, 1981 - September 30, 1982", Rpt. No. DOE/BC/ (in press), 1983.
For a thorough review: Stavinoha, L. L., Westbrook, S. R. , and Brinkman, D. W., "Accelerated Stability Test Techniques for Middle Distillate Fuels", Southwest Research Institute, Rpt. No. WE/BC/10043-12, October 1980.
GENERAL PAPERS - POSTER SESSION PRESENTED BEFORE THE DIVISION OF PETROLEUM CHEMISTRY, INC.
AMERICAN CHEMICAL SOCIETY WASHINGTON, D.C. MEETING, AUGUST 28 - SEPTEMBER 2, 1983
IGNITION AND COMBUSTION OF COAL PARTICLES
BY
C. 0. Gomez and F. J. Vastola Department of Materials Science and Engineering
The Pennsylvania State University, University Park, Pennsylvania 16802
INTRODUCTION
A fundamental understanding of the coal Combustion process is important not only in the operation of combustion furnaces but also in the design of equipment for efficient burning, especially now when one of the requirements in the recent emphasis on coal utilization is clean burning. Even when the combustion of coal and char particles has been studied for a long time and extensive liter- ature exists in the subject (1-4), this fundamental understanding has not been established. A clear demonstration is the wide variety of assumptions made in the most recent attempts of modeling the phenomenon (5-10).
The combustion of coal particles is a heterogeneous phenomenon involving a relatively un- known material and occurring in two stages: ignition and burn-out. Ignition depends on a balance between the rates of heat gain and loss to the particle; consequently the particle size, the environ- mental conditions, and the reactor geometry that defines the fluid dynamics of the system play im- portant roles. The study of this complex phenomenon is difficult, because in addition to its transient character, i t involves the simultaneous occurrence of a number of transport processes which apply to a system whose dimensions and characteristics change with time.
TWO ignition mechanisms for coal particles are accepted: Tkir C?CCET'C~CC d c ~ n & 011 h e reianve rates of two phenomena: the heating of the particle surface and the rate of volatile release. When the rate of heating of the particle surface is larger than the ra te of volatile6 release, the ignition takes place on the particle surface and the mechanism is called heterogeneous. In this case, the particle surface reaches a temperature high enough for reacting and igniting prior to extensive pyrolysis. On the other hand, when the rate of volatile release is larger than the rate of heating of the particle surface, the ignition occurs in the gas phase surrounding the particle and the mechanism is called homogeneous, In this case, the pyrolysis is so rapid that the particle surface is isolated from the external gaseous mixture by a volatile layer. To investigate the conditions which control the mode of ignition we conducted experiments utilizing single particles of coal.
EXPERIMENTAL
A schematic diagram of the apparatus is in Figure 1. The oxygen-nitrogen mixture is heated in the gas preheater and then sweeps the reaction zone where a single coal particle is introduced by gravity, using a specially designed injector. A light beam a t location 1 is used to detect the time of the particles entry into the reaction zone. The gaseous products a r e rapidly cooled and split to be simultaneously measured by two nondispersive infrared analyzers, one for carbon monoxide and one for carbon dioxide. A photo transitor connected to a light pipe placed within the reaction zone is used to detect combustion generated luminosity. A microcomputer-based data acquisition system re- cords the time of injection, the light generated by the particle's ignition and burnout, a s well as the carban monoxide and carbon dioxide concentration in the product gas stream.
, In addition to the time of entry of the coal particle into the reaction zone the time of tramit of the product gases from the reaction zone to the detector must be determined. This transit time was measured by injecting a short pulse of carbon dioxide into the reaction zone under the same con- ditions as used in an ignition run and measuring the time to detector response. To characterize any deformation of the product pulse as it flows from the reaction zone to the detector a similar short pulse of carbon dioxide was directly injected into the detector cell. The shape of the pulse after its travel through the system was compared with that resulting from the injection of the pulse directly into the detector cell. No appreciable difference was detected, indicating that the conditions used are very effective in reducing the deformation of the gas release curves.
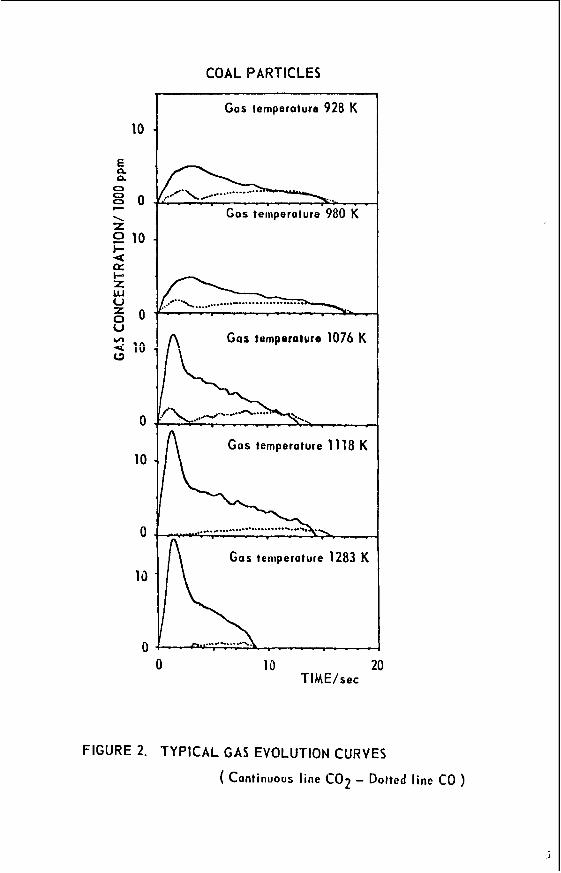
A subbituminous coal (PSOC 648), whose characteristics a r e shown in Table I, was used in this study. Particles from the 850-1000 micron sieve fraction were injected into a reaction furnace Swept with air a t five temperature levels of 928, 980, 1076, 1118 and 1273°K.
Typical results of the gas evolution during combustion are shown in Figure 2 for selected runs at the different temperatures used in this study. The carbon monoxide and carbon dioxide con- centrations a re plotted against time with zero time being that time when product gases a r e f i rs t de- tected. Homogeneous ignition, as evidenced by a peak in the carbon dioxide product curve, is de- tected at temperatures of 1076°K and higher. The integration of the gas evolution curves will give the total mass of carbon in the original particle, if all the carbon is oxidized to carbon monoxide or carbon dioxide, which means in the case of the combustion of a coal particle, the complete burn-out of the volatiles released in the early stages of the combustion. Experimental results suggest that this was the case, because the most difficult hydrocarbon to be oxidized--methane--detected during the pyrolysis of coal particles, was not found during their combustion.
easily determined from the results of the light intensity measurements presented in Figure 3. When a coal particle ignites homogeneously, the combustion in the gaseous phase of the volatile matter released from the particle produces an initial flash of light, followed by the glowing of the remaining particle as the heterogeneous combustion proceeds. On the other hand, when the ignition mechanism is heterogeneous, the initial flash of light is not observed and only the final glowing ia detected.
The ignition mechanisms detected by light intensity and by gas release curves have been sum- marized in Table II. There is complete agreement between the two techniques, except a t the inter- mediate temperature of 1076°K. This discrepancy however, is consequence of an insufficient amount of volatiles released by the particle for burning with enough intensity to generate a flash of light, when the gas temperature is 1076°K. However, the amount released is enough to be detected before the ignition begins on the surface of the particle. This is a clear advantage of the experimental a p proach used in this work and shows how both technQues complement each other.
gas evolution curves. A comparison between the results given by the two techniques is presented in Figure 4, where the combustion time measured by carbon dioxide evolution is plotted against the value obtained from light intensity for coal particles. Carbon dioxide was selected over carbon monox- ide because of the greater sensitivity of the carbon dioxide detector, which allows the measurement of the combustion time more accurately. The combustion times tend to be larger when they are measured by gas evolution than by light intensity. This tendency is not unexpected because light can be detected only after the particle temperature increases to a point at which it is visible from the background. This high temperature is reached after a period in which gases were already evolving.
as the gas temperature increases. If the measured concentrations of carbon monoxide and carbon dioxide a r e the resulta of the chemical reaction on the surface, an increase in the proportion of car- bon monoxide is expected a s the temperature rises. The opposite trend is a consequence of the gas phase oxidation of carbon monoxide to carbon dioxide, which modifies the relation of the primary products of the reaction. In any case, the occurrence of this gas phase reaction does not affect the results previously discussed, because they are based on the total carbon consumed in the particle, and the gas phase reaction only affects the relative distribution of carbon a s carbon monoxide or carbon dioxide, but not the total carbon coming from the particle as the result of the chemical reaction.
The occurrence of either of the two mechanisms of ignition previously described can be
The total combustion time can also be determined from light intensity measurements and from
An unexpected result is the decrease in the proportion of carbon monoxide in the product gmes,
TABLE 11
MECHANISMS OF IGNITION DETECTED BY DIFFERENT TECHNIQUES IN THE COMBUSTION OF COAL PARTICLES
980
1076
1118
1283
Gas
RUn (“K)
928 150 151 152 153 154
115 116 117 118 119
133 134 135 136 137
097 099 100 101 102
081 082 083 084 085
Temperature -
Ignition Mechanism Detected by Light Intensity Gas Evolution
Het Het Het Het Het Het Het Het Het Het
Horn Horn Het Het Het Het Het Het He t Het
Horn Horn Horn Horn Het Horn Het Hom Het Horn
Horn Horn Horn Hom Hom Horn Horn Horn HOrU _--- Horn Horn Horn Hom Horn Horn Horn Horn Horn Horn
Unm
/
CONCLUSIONS
A differential approach has been developed for the study of the combustion process of single coal particles. The experimental technique, based in the simultaneous measure of the carbon monox- ide, carbon dioxide, and intensity of the light generated during the combustion, gives quantitative information about the ignition and the subsequent burn-off of the residual particle. The apparatus de- signed provides the special characteristics required in this study and the transition between the two ignition mechanisms is achieved within the range of operation conditions, for the coal used in this study.
the combustion, a technique commonly used i n the past, but also from the gas evolution curves which allow the quantification of the whole combustion process. The results show the convenience of using both a s complementary techniques in the determination of the ignition mechanism.
The ignition mechanism is determined not only from measurements of light intensity during
ACKNOWLEDGMENTS
This study was made possible by financial support from the Coal Cooperative Pmgram at The Pennsylvania State University. The authors thank the Penn State Coal Sample Bank and Data Base for supplying the sample and the analysis of the coal used in this study.
l
L
e 0)
al
c alL m' If: ,
b.
c 0 U al
0 ' c
- 2 0 " u z
i' b.
e al
u. - .-
b.
c 0 U 0 0)
z
L
e al " 0
0 c1:
E c
.-
COAL PARTICLES
10
E n 0. 0
P 8 0 \ Z
i- 4 e I- z w 0
u
L1
2 10
5 0 2 i o
0
10
0
13
0 0
Gas temperature 928 K
Gas temperature 980 K
A Gas temperature 1076 K
- . _ . . _ _ _ G a s temperature 11 18 K n
' L
Gas teiiiperature 1283 K
10 20 TIME/sec
FIGURE 2. TYPICAL GAS EVOLUTION CURVES
( Continuous line CO2 - Dotted line CO )
J
Heterogeneous ignition
1
0 5 10 I
Homogeneous ignition
TIME/sec
TIME/sec
F I G U R E 3. T Y P I C A L RESULTS OF L I G H T EMISSION MEASUREMENTS DURING COMBUSTION OF COAL P,ND CHAR P A R T I C L E S
COMBUSTION TIME/sec (measured by light)
FIGURE 4. COMPARISON BETWEEN THE DIFFERENT TECHNIQUES USED FOR MEASURING COMBUSTION TIMES
LITERATURE CITED
Essenigh, R. H . , J. Inst. Fuel, 3, 239 (1961). Essenhigh, R. H., "Chemistry of Coal Utilization, Second Supplementary Volume" (Ed. M. A. Elliot), John Wileyandhns , 1981, Ch. 19. Field, M. A. , Gill, D. W., Morgan, B. B . , and Hawksley, P. G. W., "Combustion Of Pulverized Fuel", British Coal Utilization Research Association, Leatherhead, Surrey, 1967. Mulcahy, M. F. R., and Smith, r. W., Rev. Pure and Appl. Chem., 2, 81 (1962). Annamalai, K., and Durbetaki, P., Combust. Ftalpe, 2, 193 (1977). Bandyopadhyaw, S . , and Bhaduri, D., Combust. Flame, 2, 411 (1972). Baum, M. M., and Street, P. J., Combust. Sci. Technol., 3, 231 (1971). Juniper, D. A., and Wall, T. F., Combust. Flame, 2, 69 (1980).
I
GENERAL PAPERS - POSTER SESSION
AMERICAN CHEMICAL SOCIETY PRESENTED BEFORE THE DIVISION O F PETROLEUM CHEMLSTRY, INC.
WASHINGTON, D.C. MEETING, AUGUST 28 - SEPTEMBER 2, 1983
THE EFFECT O F THE MOLECULAR WEIGHT OF ADDITIVE ON THE PROPERTIES OF ANTIMISTING FUELS
BY
A. F. Hadermann, J. C. Trippe General Technology Applications, Inc., Arlington. Virginia 22209
and P. F. Waters
The American University, Washington, D. C. 20016
INTRODUCTION
Antimisting aircraft fuels, when ignited, do not produce the roaring fireball which often ac- companies aircraft crashes (1). This result is attributable to the suppression of the aerosolization of the fuel by added macromolecules which alter the structure of the droplets of fuel emanating from rent fuel tanks after the crash.
The first studies of the antimisting effect of macromolecules on aviation fuel were carried out in Great Britain in 1968 (2). In that early work it was established that there was a qualitative relationship between the suppression of the atomization of the fuel and the molecular weight of the additive above a certain critical concentration; the latter being inverse to the molecular weisht nt the additive. S l l h s e q ~ m t k~~~'&-~t&iii~ have demonstrated a dependence of the antimisting effective- ness of polyisobutylene in diesel fuel on the viscosity average molecular weight to a power exceeding 2 (3), and in jet-A fuel to the 2a! + 1 power (4), where a! is the exponent in the Mark-Houwink equation.
of antimisting effectiveness and flammability reduction with the maximum ductless siphon height supported by the solution. They introduced the ductless siphon to the study of antimisting fuels as a measure of the elongational viscosity imparted by the macromolecules to the fuel. The apparatus does not provide a uniform elongational flow field but there is no device, a t present, for determining the true elongational viscosity of these solutions and the ductless siphon bas the advantage of being easy to assemble and use. The precision of the measurements can be improved by drawing the liquid column in a controlled environment, reading the height optically or with a strain gauge, etc. The principal factor of interest with respect to antimisting fuels, however, is that i t bas been demonstrated that the ductless siphon is a tool for rapidly screening macromolecules for their effectiveness as antimisting agents.
of the molecular weight of megadalton macromolecules.
In their study Chao et al. were able to demonstrate a strong correlation between the extent
In this work i t is suggested that the ductless siphon might also be used for the rapid estimation
EXPERIMENTAL
Three samples of polyisobutylene (BASF: B-100, B-200, B-200-246) were dissolved in is+ octane at room temperature with occasional gentle swirling over several days. The viscosity aver- age molecular weights were determined with a n Ostwald viscometer from the Mark-Houwink equa- tion (5) :
1n1 = 3.06x10⁻⁴Mv 0.65 1)
The values are given in Table I. The height-at-break of seriaI dilutions of the stock SOIU~~O~S of the three samples was meas-
ured in the apparatus of Figure 1. Six measurements were made on each solution and the measure- ments were averaged. The averaged heights were plotted against the concentration and the slope of each line, h/c, was determined by linear regression analysis. The slope values, along with the c o p relation coefficients, r, a re entered in Table I.
antimisting effectiveness and the flammability suppression potential of polyisobuwlene in isooctane is dramatic.
In a 1975 paper Williams (6) proposed a theory which explains why high molecular weight macromolecules in dilute solution exhibit quite large extensional viscosities relative to lower molecular
The effect of the molecular weight on the height-at-break property and, by extension, the
t
3
-
h
-1 1
LA B J A c K
F I G I 1. nUCTLESS S I PHON APPARATUS,
IO 20 30 40 50 60
FIG, 2 . FOLECULAR WEIGHT vs , SLOPE OF BLOTS OF HEIGHT-
AT-BREAK V S , CONCENTRATION OF POLYISOBUTYLENE I N ISO- OCTANE AT 20 C -
weight Species. An extension of the theory applied to the use of the ductless siphon for estimating the extensional viscosity of samples of antimisting fuels was completed last year (7). The working equation is :
where n is the extensional viscosity "0 is the shear viscosity of the solution e is the elongation rate in pure extensional flow c is the concentration in g/dl ns is the shear viscosity of the solvent K and a are the constants of the Mark-Houwink equation.
TABLE I
VISCOSITY AVERAGE MOLECULAR WEIGHT AND SLOPES OF HEIGHT-AT-BREAK VS. CONCENTRATION PLOTS FOR
SAMPLES OF POLYISOBUTYLENE MEASURED IN ISOOCTANE AT 20°C
For a given polymer/solvent, for megadalton samples with the ductless siphon height-at- break measured at the same temperature at which the exponential term in the Mark-Houwink equa- tion is evaluated, we propose the relation:
where k is a constant. For the polyisobutylene/isooctane system at 20°C, (Y = 0.65. A plot of Gv vs h/c appears in Figure 2, where the theoretical curve, evaluated from the measured height-at- break values, is given by:
- M, = 1.05 x lo6 e) 0.44 4)
Inasmuch as interest in antimisting fuels is growing and ultra high molecular weight macro- molecules are markedly superior in their performance in antimisting fuels, this method may be used for rapid estimation of molecular weights when the Mark-ffouwink exponential term is hown.
LITERATURE CITED
(1)
(2)
Weatherford, W. D. , Jr. , and Wright, B. R., AGARD/NATO 45th Meeting, Pmpulsion and Energetics Panel, London, April, 1975. Mossel, J. W., and Waite, F. A. , Roc. of the Aircraft Research md Technology for Anti- misting Kerosene Conf., Feb. 18-19, 1981, p. 4-1 f f , Report No. FAA-CT-81-181, U.S. Dept. of Trans., June, 1981. Investigatlon of the Application of a Cryogenic Blending Process to Roduce Antimisting Diesel Fuels, A. F. Hadermann, P. F. Waters, J. C. Trippe and W. Weitzen, Contract No. DAAK-
(3)
70-81-00134, U.S. Army Mobility Equip. Res. and Dev. Com. , Fort Belvoir, Va. Jan. 15, 1982. chao, K.C., Child, C. A., Grens, E. A., and Wil l iams , M. C., Amer. Inst. Chem. Eng. J., in press. BASF Tech. Leaflet No. M 2353 E/81538, May, 1978. williams, M.C., Amer. Inst. Chem. Eng. J., 21, l(1975). Chao, K. K. K., and Williams, M. c. I J. Rheology, in Press.
(4)
(5) (6) (7)
GENERAL PAPERS - POSTER SESSION PRESENTED BEFORE THE DIVISION OF PETROLEUM CHEMISTRY, INC.
AMERICAN CHEMICAL SOCIETY WASHINGTON, D.C. MEETING, AUGUST 28 - SEPTEMBER 2, 1983
STORAGE STABILITY STUDIES OF U.S. NAVY DIESEL FUEL MARINE
BY
L. Jones, D. R. HardyandR. N. Hazlett Naval Research Laboratory, Code 6180, Washington, D.C. 20375
INTRODUCTION
An increasing trend in recent years is the utilization of heavier crude sources in producing middle distillate fuels. The U. S. Navy's concern about long-term (up to three years) storage stabil- ity of its diesel fuel marine (DFM) from such sources is the driving force for this study. The three major objectives of tllis work are: 1) to improve empirical predictive storage stability tests; 2) to better understand the chemical mechanism involved in middle distillate storage instability; and 3) to examine various commercial and experimental stabilizer additives as possible storage stability improvers suitable to Navy needs.
In this paper we will deal primarily with the first objective and also include some preliminary work and results on the second objective. Some of the problems and severe time restrictions of utilizing empirical predictive storage stability tests will be specifically addressed.
EXPERIMENTAL
Accelerated Storage Stress Test
(2 10% S. E.) of shale-derived diesel fuel marine (DFM) storage stability studies at NRL (1) was adopted for this study. It consists of filtering 300 ml of a fuel through Gelman type A/E glass fiber filters. The filtered fuel is transferred to a clean, dry, borosilicate brawn glass 500 ml bottle weighed to the nearest 0.1 mg. The teflon-lined cap is placed on the bottle but not tightened. bottles are placed in a dark oven held to constant temperatures within +O. 5°C for a specified number of days (3.1 days). Temperatures chosen for the accelerated tests were 43, 65, 80 and 1OO'C. After removal from the oven the bottles are allowed to cool to ambient temperature and relative humidity in the dark for 24 hours (+2 hours). The fuel is filtered through a BUchner funnel with Gelman type A/E glass fiber filters weighed to the nearest 0 . 1 mg. The bottles and filter pads are rinsed with 3 x 50 ml of "hexane aliquota to remove fuel and to ensure transfer of all non-adherent material from the bottle. The bottles and filters plus funnels a re evacuated in a vacuum oven with a mechanical pump and then heated in vacuo for about 18 hours at 120°C. The vacuum oven is turned off and allowed to return to room temperature before removing the bottles and filter funnels. The bottles and filter funnels are weighed to the nearest 0.1 mg on a Mettler H315 (1000 g capacity) balance. Adherent gum is the weight difference per bottle corrected for a blank, divided by 300 and reported as mg/lOo ml of fuel. Filtrable sediment is the weight difference of the filter pads cor- rected for a blank, divided by 300 and reported as mg/lOO ml of fuel. The sum of these two values is reported as total insolubles in m g / l O O ml of fuel. The mean and standard deviation of tripiicate runs is generally reported. A blank determination is made for each time and temperature run. The filtrable sediment blank is a funnel and filter pad subjected to the same post stress handling a samples. All sample values reported herein have been corrected for a blank determination.
Fuels In general, fuels used in this work were received in five-gallon metal containers and trans-
fer& to five one-gallon epoxy-lined metal containers and stored in a cold room at HOC until used. Most fuels were supplied through the Navy Petroleum Office from refineries and storage depots world-wide. All fuels had conformed to military specifications for Navy DFM a t time of receipt by the Navy.
Capillary GCMS was performed on a Hewlett Packard fused silica 0.3 mm I. D. x 50 m c r o s s - h k d methyl silicone column directly inserted into the electron impact source of a Hewlett Packad 5982A mass spectrometer through a modified solids probe inlet. Flow was adjusted to one ml/min of helium and the injector split ratio was approximately 50:l.
carbon, hydrogen, and nitrogen. Oxygen analysis was performed on a Coulometrics Oxygen Analyzer.
An empirical gravimetric test which was shown iu Le very p r ~ i s e fcc L&i~ tj-fi 6: -ys!s
The
-
Elemental analyses were performed on a Perkin Elmer Model 240 Elemental Analyzer for
1'
, .
RESULTS AND DISCUSSION
Stress Tests Four petroleum derived DFM's covering a wide range of storage stability as defined by
ASTM D2774 were selected as the test matrix to determine the statistical variations of the accelerated Storage stability test described above. Typical data are reported in Table I (at 80°C for 14 days) with standard errors ranging from 1 to 11% of the mean. Data for a series of triplicate tests run at 80°C for these four fuels a t 7-21 days are plotted in Figure 1. All four curves are quadratic least squares best fits. Three fuels exhibit a modest acceleration in sediment formation but 82-10 ex- hibits a deceleration. The data are further broken down and plotted as total and filtrable sediment for two fuels (81-5 and 82-10) in Figures 2 and 3. The filtered sediment line generally follows the shape of the total sediment curve but Figure 3 shows the exception. This type of behavior under- scores the importance of fuel dependence on such measurements.
TABLE I
WEIGHT OF TOTAL INSOLUBLES IN Mg/lOO Ml OF FUEL STRESSED FOR 14 DAYS AT 80°C
Filtered Adherent Total Fuel Sediment Gum Insolubles Mean S.D.
Five additional current-use Navy DFM's from petroleum were stress-tested in an effort to 1) broaden the total fuel test matrix and 2) screen for a marginal storage stability type of fuel (one which exhibits relatively high weights of total sediment during short stress tests). Table II gives selected results for four fuels which exhibit different trends in the formation of insolubles a s stress temperature and time are increased. These results emphasize the fact that simultaneous, not neces- sarily related, reactions are proceeding, which form varying amounts of two different types of precipitate in the fuel - adherent and filtrable. The total insolubles formed by any particular fuel increase with increase in stress temperature and stress time. Data from Table II indicate that be- tween 80 and 100°C for the five fuels studied the pseudeArrhenius plot of Figure 4 may be dis- continuous, i. e. , the rate of total sediment formation increases about two to four times faster than expected. This needs to be confirmed by running more fuels and by increasing the number of repli- cate samples. Figure 4 is plotted for one particular fuel, 81-5, and shows the time required at any particular temperature of stressing to form an equivalent weight of total sediment. The expected straight line relationship is not achieved. This may be indicative that accelerated storage stability tests at temperatures above 80°C may not be predicting correctly either the quantitative or the qual- itative aspects of the phenomenon. This is an important consideration in future work in this area involving stabilizer additive studies.
Chemical Characterization of Sediments
fuel dependent i t will be necessary to carefully characterize each type in order to be able to postu- late possible mechanisms of formation. In general the adherent sediment is more soluble than the filtrable sediment. This means that the adherent gum is more amenable to standard gas ch romab graphic and GC/MS characterization. Adherent gums formed by stressing DFM fuel samples at loooc for 21 days were analyzed by GC/MS. Chromatograms of the adherent gum are all quite similar to those of the non-stressed fuel. The most striking feature of the chromatograms is the symmetrical appearance of E-alkanes ranging from C-9 to C 2 0 (in the adherent gum) and C 9 to C24 (in non- stressed fuel). Preliminary work indicates that oxidized hydrocarbons a re co-eluting with the h&her - n-alkanes in adherent gum samples.
Since the predominant type of Sediment formed (adherent or filtrable insoluble) appears to be
TABLE II
ALL WEIGHTS ARE GIVEN IN Mg/lOO M1 OF FUEL, STRESS TEMPERATURES ARE GIVEN IN "C AND STRESS TIMES ARE GIVEN IN DAYS
Fuel/Temp/Time
82-8/43/52
82-8/20/21
81-5/43/52
81-5/80/21
82-36/80/21
82-36/100/6
82-32/80/21
82-32/100/6
82-33/80/21
82-33/100/6
82-35/80/21
82-35/100/6
Filtered Adherent Sediment Gum --
0.0 0.1 0.0
0.8 0.3 0.5
0.2 0.2 0.2
5.7 6.8 6.8
1.3 1.2 1.7
1.1 1.4
1.5 i. 0
1.0 1.0
0.5 0.0 0.5
1.3 1.5
1.1 0.7 0.7
1.0 0.7
0.5 0.6 0.0
4.8 . 5.5 3.3
1.0 1.7 0.9
2.7 2.7 2.2
1.3 1.3 1.1
6.7 6.8
0.9 i. B
7.6 7.2
2.3 0.3 0.2
1.6 1.4
0.5 0.8 0.0
2.4 0.5
TABLE III
Total Insolubles
0.5 0.7 0.0
5.6 5.8 3.8
1.2 1.9 1.1
8.4 9.5 9.0
2.6 2.5 2.8
7.8 8.2
2.4 2.2
8.6 8.2
2.8 0.3 0.7
2.9 2.9
1.6 1.5 0.7
3.4 1.2
Mean
0.4
5.1
1.4
9.0
2.6
8.0
- 9 1."
8.4
1.3
2.9
1.3
2.3
s. D. -
0.4
1.1
0.4
0.6
0.2
0.3
n . W. I
0.3
1.3
0.0
0.5
1.6
ELEMENTAL ANALYSIS OF FILTRABLE SEDIMENT FROM NRL FUEL 82-10 STRESSED FOR 21 DAYS AT 80°C. ALL VALUES IN WEIGHT PERCENT
The filtrable insoluble sediment is much more difficult to solubilize and is not amenable to standard techniques of MS identification. Preliminary VPO measurements indicate that the filtrable
0 rl I
N m
m m m I I 1
m m m r ( N r(
82
19 co
__)_I__- _+ __t_. .. __
5
si V I .
ez
B
vi d
El
6 d
El vi
81
B B B
B B B
N B B
002
S L T
0s 1
sz 1
00 I
S L
0s
sz
insoluble sediment is of higher molecular weight (up to 1500 mu). A typical elemental analysts for filtrable sediment of 82-10 (a particularly unstable DFM) is given in Table La. Oxygen has been directly determined by coulometric measurements. The high heteroatom content is typical for this type of s e h e n t (2). Six major components of a filtered sediment extract in hot THF have been isolated by gas chromatography. Filtered sediments a re usually insoluble in most organic solvents. Further analysis of the major fuel degradation components will establish the identity of the reactive species in fuels.
LITERATURE CITED
(1) Hazlett, R. N., Cooney, J. V. , and Bed , E. J. , First Annual Report, Sept. 15, 1981- Spt . 30, 1982, NRL;Washington, D. C., to be published by USDOE under contract
Nixon, A. C. , "Autoxidation and Antioxidants of Petroleum", Chapter 17 in "Autoxidation and Antioxidants", W. 0. Lundberg, Ed., John Wiley, New York, 1962.
DE-AI-19- 81BC10525. (2)
I
c
GENERAL PAPERS - POSTER SESSION PRESENTED BEFORE THE DIVISION OF PETROLEUM CHEMISTRY, INC.
AMERICAN CHEMICAL SOCIETY WASHINGTON, D.C. MEETING, AUGUST 28 - SEPTEMBER 2, 1983
RADIOACTIVE (I4C) TRACER STUDIES OF METHANOL CONVERSION OVER A Ni-ZSM-5 ZEOLITE
BY
F. S. Hwu* and J. W. Hightower Department of Chemical Engineering, Rice University, Houston, Texas 77251
LNTRODUCTION
within the last few years, researchers at the Mobil Research and Development Corporation (1) have synthesized a novel zeolite catalyst, ZSM-5, which is capable of converting oxygenates, e.g. , methanol, into aliphatics and aromatic hydrocarbons in the gasoline boiling range. Since tech- nology exists for making methanol from coal-derived synthesis gas (2), this new process provides an additional source of chemical feedstocks and transportation fuels.
compounds have been identified (3,4). The major hydrocarbon products can be classified into three categories: olefins, paraffins, and aromatics. There is a strong possibility that some of these products, once formed, react further to produce other products. The objective of this research was to investigate this possibility by labeling some of the products and following the transfer of the label to other products.
In the conversion of methanol to hydrocarbons over such catalysts, more than 100 different
The interconversion of methanol anddimethyl etherover such catalysts has been confirmed in several studies (5,6). At very low conversion of methanol, dimethyl ether is the major product, and the tramformation of methanol into dimethyl ether is 20 to 30 times faster than hydrocarbon formation (6). On the other hand, when dimethyl ether is the starting material, both methanol and hydrocarbons a re formed readily (5,6). The intermediate role of dimethyl ether was also confirmed by wing a 13CH3- 0-13CH3 tracer technique (6).
carried out reactions of C2, C3, and C4 olefins over ZSM-5 catalysts and observed similar aromatic product distributions from both methanol and all the olefins. Therefore, they concluded that light olefins were intarmediates of methanol conversion to gasoline boiling range products.
This research was aimed at identifying some of the major reactions involved in the overall methanol reaction. A 14Clabeled tracer technique was developed to explore the roles played by the various species, including olefins, paraffins, and aromatics. The results a r e described herein.
The roles played by the lightweight olefins were investigated by Dejaifve et al. (7). They
EXPERIMENTAL
Catalyst
tories. This material was in the sodium form and was calcined for 2 hours a t 600'C. It was then soaked in a solution of ammonium nitrate (9 wt%) for. another 2 hours with constant agitation. After the resulting NHq-ZSM-5 had been washed and filtered, it was impregnated with a solution of 0.0439 g nickel acetate/g of dry zeolite and then heated until dry at 120°C. This impregnated Ni-ZSM-5 cata- lyst was subsequently blended with alumina, which served a s a binder, in the proportion 0.3 g alum- ina/g ZSM-5. A l l catalysts used for these reaction studies were pelletized, crushed, and screened to 30/40 mesh.
Chemicals Methanol (99.99% purity) was obtained from Fisher Scientific Company. The radioactive
compounds, along with their suppliers, a re shown in Table I. Both chemical and radiochemical purities of each were checked by the radio-gas chromatograph described later. Since the methanol,
The original ZSM-5 catalyst was prepared at the Exxon Research and Development Labora-
*Present address: Department of Mechanical Engineering, University of Texas, Arlington, Texas 76019.
Propylene, 1-butene, n-hexane, n-heptane, and benzene were satisfactory in both chemical and radio- chemical purities, they were used a s received. However, radioactive impurities were found in the odginal ethylene and iso-butane, which necessitated purification with a preparative GLC co~Umn (30 ft. long 5/18 in. 0. D. Porapak Q at 100-150°C).
Reactor System
helium carr ier gas by a syringe pump. To facilitate rapid vaporization of the liquid reactant, the glass sections immediately before and after the syringe injection port were packed with glass beads and heated by nichrorne wire. A 250 ml mixing volume was installed before the reactor to moderate any pulsations in the reactant concentration.
Figure 1 shows the experimental set-up. Liquid methanol was admitted into a stream of
TABLE I
RADIOACTIVE CHEMICALS
Specific Activity Chemical Compound (mC/mmole) Purity Manufacturer*
*PLC - Pathfinder Laboratories, Inc. CBC - California Bionuclear Corp. ARC - American Radiochemical Corp.
Pulses of radioactive tracers were introduced into the pre-evacuated doser through the
The catalyst bed and a bed of vycor chips, located just upstream from and having the same standard taper ST1. The pressure in the doser was monitored with a mercury manometer.
mesh size a s the catalyst, were sandwiched in the reactor between two glass wool plugs. The vycor chips served a s a preheater and helped develop plug flow in the catalyst bed.
Radio-Gas Chromatograph System A radio-gas chromatograph (FlGC) system, shown schematically in Figure 1 , was integrated
with the reaction system to facilitate periodic sampling and on-line analysis of the products from the reactor. This system consisted of a modified Varian model 3700 gas chromatograph, three differ- ent types of detectors (TCD, FIC, ICD), a separation column, and a changeable sample loop con- nected to a 6-port valve V3.
steel tube packed with 15% squalane on SO/lOO mesh chromosorb P. Connected to the column exit was a stream splitter which divided the effluent stream into two parts in the approximate ratio 1 : l O . The smaller stream went to the FLD (flame ionization detector) and the larger stream was directed into the ICD (ionization chamber). The argon quench gas was used to sweep the radioactive gases out of the 4.5 ml ionization chamber quickly for improved peak resolution (10).
Experimental Procedure The reaction was carried out in a finite-tracer but continuous-reactant flow manner. This
arrangement was used to minimize the consumption of expensive radioactive chemicals and yet to conduct the experiment in the "steady state" so that meaningful Idnetic data could be extracted.
state a t a fixed set of conditions with the effluent bypassing the sample loop. A very small amount of tracer was introduced into the large pre-evacuated doser (50 ml). The tracer was then diluted with a portion of the reactant stream to make the pressure in the doser the same a s that in the re- action system. This made the composition of material in the doser identical to that in the reactant stream except for the small amount of tracer in the doser.
doser, and a liquid nitrogen trap collected all the hydrocarbons (except methane) in the product stream. After all the radioactive materials were trapped in the sample loop (usually about 8 minutes),
The temperature programmed chromatographic column was a 7-ft. by 1/8-in. 0. D. stainless
With methanol and helium flowing through the reactor, the reaction was brought to the steady
Each radio-tracer experiment was begun by diverting the reactant stream to flow through the
the sampling valve was returned to its original position, the liquid nitrogen dewar flask was removed, and the p ' d u c t s were flashed into the GLC column. the FD, and the radioactivity i n each peak was measured by the ICD.
The amount of each product was monitored on
The specific activfty A i in each of the analyzed peaks was calculated by the following equation:
(Radioactivity in product i, mC)
Moles of product i Ai 5 petal radioactivity in all hydrocarbon products, mC)
Total moles of hydrocarbon products
RESULTS
Different types of l4C-labeled tracers -- olefins (ethylene, propylene, 1-butene, paraffins (iso-butane, "-hexane, "-heptane), and aromatics (benzene) -- w e r e used to investigate the roles timt these several species play in the overall methanol-to-hydrocarbon reaction.
h dl experiments, the reaction was carried out over 100 mg of the Ni-ZSM-5 catalyst a t 368°C and 1 atm total pressure. The partial pressure of methanol in the inlet stream was 0.05 atm, and the space time 't was 218 rag cat. sec/cm3-STP. Other reaction conditions for each experiment a r e given in Table 11.
Partial pressure of methanol - 0.05 atm 7 (Space time) - 218 mg cak sec/cm3-STP Reactor temperature - 368°C
Table JII lists the specific activity A i for all the products (or groups of products) when the olefins, ethylene, propylene, and 1-butene, were used as tracers. For propylene and 1-butene, the radioactivity was almost uniformly spread among all the products, even including the compound ini- tially labeled. However, for ethylene less than 50%of the radioactivity was incorporatbd into other products with the majority remaining in the ethylene. For this reason, the radioactivity in the ethyl- ene was excluded from the normalization of the radioactivity in each of the products. In other words, the distribution of radioactivity among the various products was based only on the ethylene that re- *, and not on the total radioactive ethylene admitted.
TABLE JII
RADIOACTIVITY DISTRIBUTION AMONG HYDROCARBON PRODUCTS
Specific Activity in hoducts Tracer a & C& Q+ Toluene Xylenes
c2Hq ----* 1.29 1.03 1.43 1.00 2.18 1.62
c3H6 0.39 1.15 1.00 1.38 0.95 2.27 1.81
I - C ~ H ~ 0.35 0.91 1.35 1.52 1.18 2.06 1.64
*Since more than 50% of the added radioactivity remained in the ethylene, its radioactivity was not included in calculating the specific activity of the other products. Thus, the specific activities given a r e based only on the ethylene that reacted, not the amount added.
The paraffins were much less reactive than the olefins. For example, in the runs with is- butane a s the tracer, essentially no radioactivity was found in any reaction products other than in the iso-butane. Wheng-hexane and"-heptane were used a s tracers, most (ca. 80% of the radioactivity
remained in the starting labeled tracer compound. There was a small amount of radioactivity in the C2 to C4 &&tics. Significantly, no radioactivity was detected in the aromatic products.
When labeled benzene was used as a tracer, no radioactivity was found in any of the products except certain aromatics, i. e. there was no measurable radioactivity in the aliphatics. The major- ity (52% of the radioactivity remained in the benzene. Considerable radioactivity was in the toluene (263, followed by @+*-xylene (184&), ?xylene (3%), and trimethylbenzene (1%). Since the products contained about 6 times a s much @+@-xylene as =-xylene, the "specific activity" for these
factor of 3.4) than the xylenes, while trimethylbenzene had less (about 0.2) relative to the xylenes. i dimethyl ammatics must be the same. Toluene had a higher specific activity (approximately by a
Olefin Tracers
labeled ethylene, propylene, or 1-butene were used a s tracers clearly indicates that these three The observation of radioactivity in all the hydrocarbons from methanol conversion when [!
light olefins play i e r y -hnportant roles in the overall methanol-to-hydrocarbon reaction. Especially, the results have verified that even ethylene is involved in the reactions (as postulated by Dejaifve e t al. (7) and suspected by Anderson et al. (8)), although ethylene is much less active than are the larger olefins.
radioactivity in itself than occurred with the labeled propylene and 1-butene, we suggest that the de- sorption Of ethylene is faster than its reactive chemisorption. Moreover, the appearance of radio- active propylene from the initial ethylene tracer supports the claim that the surface reaction of chemisorbed ethylene with methanol is relatively fast. Such a facile reaction of surface ethylene with methanol and/or dimethyl ether, viewed a s an autocatalytic step, has been described by Chen and Reagan (9).
of the same order of magnitude. This strongly suggests that the formation of aliphatics proceeds mainly via a C1 step addition, o r more specifically through alkylation with methanol or dimethyl ether.
and in the C2 - C3 aliphatics when 1-butene was the tracer implies that these small olefins a re not cracked substantially but a r e rather incorporated into higher molecular weight products. These larger hydrocarbons may then be cracked into lower molecular weight compounds.
Similar specific radioactivities were found in both toluene and in the xylenes, regardless of which olefinic tracer was used. This observation illustrates the common role played by these light olefins in the formation of aromatics during methanol conversion of the Ni-ZSM-5 catalyst. Further- more, since the specific radioactivities in the aromatics a r e 1.5 to 2.0 times greater than those in the C3 and C4 products, it is reasonable to infer that a major pathway of toluene and xylene forma- tion is the reaction between one C3 and one C4 or two C4 species. This conclusion was also drawn by Derouane and co-workers (7).
In view of the lower reactivity of gaseous ethylene a s evidenced by the retention of much more
The data in Table III show that specific radioactivities of C2, C3, C4, and C5 aliphatics a r e
The detection of much less specific radioactivity in the C2 diphatics from the propylene tracer
Paraffin Tracers
that 14C-tagged iso-butane retains essentially @J i ts radioactivity within itself among the hydrocar- bon products shows that neither isomerization of butanes nor alkylation of iso-butane with prevailing olefins is occurring at 368°C.
dominate over their straight-chain counterparts (5,8). The same was obsented with our Ni-ZSM-5 catalyst. In general, this is consistent with thermodynamic equilibrium (the methyl paraffins a r e more stable than the corresponding straight chain molecules), except for the butanes. At 368°C thermodynamics predicts tbat ;-butane is more stable than iso-butane (57% vs. 43%. Since these two paraffins a r e not interconverted under reaction conditions, they a r e probably formed mainly by hydrogen transfer to the respective "butenes or iso-butene.
Aromatic Tracers Benzene is a very thermodynamically stable compound. However, its low concentration among
the reaction products causes one to question its function in the overall methanol conversion reactions. The radioactivity distribution among the aromatic products when benzene was used a s a tracer re- veals that alkylation of benzene to form toluene, the xylenes, and trimethylbenzene is a major route for their formation.
Benzene may be alkylated with methanol or with dimethyl ether to produce toluene, which in turn reacts with more methanol o r ether molecules to form first the xylenes and then the trimethyl- benzenes. This is consistent with the specific activity ratio following the order toluene > xylenes >
Paraffins a r e relatively stable final products in the methanol conversion system. The fact
In methanol conversion over ZSM-5-trpe zeolites, monomethyl paraffins and olefins pre-
t
r- I I I I I I I I I I I I I I I I I I 1,
0 0 0 I
FIGURE 2. ALKYLATION OF AROMATICS + -
CH30H + H-Z CH3OH2---Z
CH3
i
trimethylbenzenes when benzene was used a s the tracer. It is worth noting that the role played by benzene in the formation of alkylated benzenes is quite
similar to that of ethylene in the production of higher aliphatics. AS observed for the ethylene tracer, 14C-labeled benzene retains most of its radioactivity intact, again indicating that reactive chemisorption is relatively slow. However, the formation of radioactive toluene suggests that the surface reaction of the chemisorbed benzene with methanol o r dimethyl ether occurs readily. These results also seem to point out that the nature of this reaction is autocatalytic, a s proposed by Chen and Reagan (9) for ethylene reaction with methanol or dimethyl ether to account for the low concentration of ethylene in the product.
proposed for the formation of alkylated benzenes from benzene a s indicated in Figure 2. In light of the acidic properties of the ZSM-5 catalyst, a carbenium ion mechanism can be
CONCLUSIONS
Through the use of 14C-labeled t racer compounds, some important secondary reactions have been identified in the overall conversion of methanol to hydrocarbons over a Ni-ZSM-5 catalyst. The major €indings are:
formation of larger olefins with one more carbon atom.
olefins, i. e. , ones having the same carbon skeleton.
stable products; isomerization among paraffin isomers does not take place at 368°C.
aromatics formation.
benzene and subsequent alkylated benzenes.
1. The alkylation of light olefins with methanol o r dimethyl ether is a major pathway for the
2. Paraffins a r e mainly produced by hydrogen transfer reactions to their corresponding
3. Except for minor cracking reactions, paraffins with up to a t least 7 C atoms a r e final
4. Light olefins, e.g. , ethylene, propylene, and butenes, a r e reactive intermediates for
5. Aromatic compounds can also be produced by methanol- or di-methyl ether-alkylation of
APKNOWLE DGMENTS
The authors a r e grateful to Dr. H. E. Robson at the W o n Research and Developmeni W s for providing a sample of the ZSM-5 zeolite and to the Robert A. Welch Foundation and Haldor Topsoe A/S (Denmark) for financial support.
LITERATURE CITED
Meisel, S. L. , McCullough, J. P., Lechthaler, C. H., and Weisz, P. B., Chem. Technol., 6, 86 (1976). Danner, C. A., ed. "Methanol Technology and Economics", Chem. Eng. Progr. Symp. Ser. No. 2, 66 (1970). Stockinger, J. H., J. Chromatographic Sci., 15, 198 (1977). Bloch, M. G., Callen, R. B., and Stockinger, J. H . , J. Chromatography Sci., 5, 504 (1977). Chang, C. D., and Silvestri, A. J., J. Catal., 9, 249 (1977). Perot, G., Cormerais, F., and Guisnet, M., J. Chem. Res. (S), 58 (1982). Dejaifve, P., Vedrine, J. C., Bolis, V., and Derouane, E. G., J. Catal., 3, 331 (1980). Anderson, J. R., Foger, K., Mole, T., Rajadhyaksha, R. A., andSanders, J. V., J. Catal., 58, 114 (1979). Chen, N. Y., and Reagan, W. J., J. Catal., 59, 123 (1979). Hwu, F. S., "Conversion of Methanol and Light Olefins to Gasoline over a Shape Selective Catalyst, ZSM-5", Ph. D. Dissertation, Rice University, 1981. Stull, D. R . , Westrum, E. F., and Sinke, G. C., "The Chemical Therm@ynamics of Organic Compounds", John Wiley and Sons, 1969.
GENERAL PAPERS - POSTER SESSION
AMERICAN CHEMICAL SOCIETY WASHINGTON, D. C. MEETING, AUGUST 28 - SEPTEMBER 2, 1983
PRESENTED BEFORE THE DIVISION OF PETROLEUM C H E M ~ T R Y , INC.
NATURAL GAS BASED TECHNOLOGIES AS REVEALED IN POSSIBLE NEW ZEAIAND ENERGY PROGRAMS
BY
P. Jawetz Independent Consultant on policy, 415 East 64th Street, New York, New York 10021
INTRODUCTION
New Zealand is an exporter of commodities and thus completely dependent on world market conditions. Its large resources of hydro-electricity, forests, natural gas and fish give i t the possi- bility of industrializing. US $ 1,052 per head of population - just about a s high a s the per capita debt of Argentina - a coun- try mentioned when the world banking system started to worry about possible defaults. In the words of Foreign Minister Warren Cooper before the U. N. General Assembly on October 6, 1982 - "As a small trading nation, New Zealand is acutely sensitive to fluctuations in the health of our major trading partners. New Zealand is classed a s a developed country, but we share many of the problems of developing countries".
New Zealand has no oil resources and when the country was hit by the Energy Crisis i t de- cided to develop the gas fields a t Kapuni and a t Maui in the Taranaki province (in the western part of the North Island) in order to collect associated liquid condensates. The gas was first used to fire electrical plants and later readied for reticulation via pipelines in the Northern bland. Eventually, when the condensate became so much more valuable than the gas - despite its quantity being much smaller - it actually led to flaring the gas to waste in order to obtain the condensate. A "takeor- pay" system was negotiated under which the government is contracted to take a given amount of gas per year from the producing partnership. Assuming that future oil prices will r ise only a few per- cent per year in real terms and performing a standard Discount Cash Flow analysis with a 10% discount rate, the conclusion reached was that there was a higher financial value to be obtained from using the condensate - leading to a zero value for the gas and to a financial justification for flaring it. O n the other hand, the gas could be used 1) for reticulation, 2) for promoting a CNG industry (compressed natural gas) or 3) for use in petrochemical industries to produce chemicals o r further liquid fuels. Following this logic, and attempting to produce the least change in the transportation system, the New Zealand Ministry of Energy went along with a plan to produce synthetic gasoline from what was then seemingly unwanted gas.
The present paper argues that it would be rather to the long range advantage of New Zealand for the Government to stop at the methanol stage and use methanol a s a new liquid fuel in addition to CNG motor fuel rather than go all the way to produce the synthetic gasoline from natural gas.
The off-shore debt on March 31, 1982, stood at US $ 3 , 2 6 3 million or about
A MJSUSED INNOVATION
Mobil Research and Development Corporavon laboratories in Paulsboro, New Jersey, de- veloped spongy, shape-selective catalysts to promote a reaction that transforms alcohol into hydro- carbons by excising water molecules. The catalysts are different pore sized aluminum silicates o r clays called zeolites (the Greek word for boiling stones - this because the ancient Greeks observed that certain stones when thrown into fire appeared to boil, thus indicating that the interior structure was hollow enough to contain water and that the pore openings were large enough to allow the water to escape). ZSM-5 is a synthetic zeolite whose uniform pore size and shape is such that when treated in a Mobil-developed process will make possible the chemical reactions involved in the elimination of water molecules from the methanol feedstock. (Z stands for Zeolite; S stands for Socony, and M stands for Mobil a s 7tsoCony" o r Standard Oil Company of New York was an old name for todayis Mobil Oil; 5 is a key for the class of the catalyst.)
When producing the hydrocarbons we define a s synthetic gasoline, the catalytic process con- sumes 10-15% of the energy content in the methanol feedstock (1) but what should be remembered as equally important is that half of the volume of the liquid feedstock is lost when the water molecules a re eliminated. Then, depending on haw the fuels a r e used, if the energy content as measured in calorimetric units does not express accurately the work yield of the fuel vehicle engine, o r if dif- ferent fuels show different efficiencies when used in the same engine, the fact that we have lost half
the volume m y lead to serious differences in work yield. In other words, reducing the liquid fuel volume of the methanol to approximately one half in order to form the twice higher energy-content synthetic gasoline wastes advantages the alcohol has had per energy unit. This is where the most serious inefficiencies of the Mobil MTG (methanol-to-gasoline) process a re incurred - more 80 than in the energy loss of the process itself (2).
The methanol for the Mobil process can be obtained by passing synthetic gas produced from coal over a copper catalyst or starting with natural gas. Mobil Oil has no proprietory technology for the production of methanol and in New Zealand it will be using an I. C. I. process and 40% of the natural gas feedstock energy content will be lost a t this stage. The Mobil ZSM-5 catalyst's com- peting technology is a ZnClg process that was also looked into by the New Zealanders when making their decision (3). To be sure, one does not expect difficulties in upscaling the Mobil MTG process from the four-barrels-a-day pilot unit in Paulsboro, New Jersey to the 13,000-14,000 b.p.d. plant a t Motunui, New Zealand, and when completed the plant will most probably deliver a s planned but then one could reasonably expect that besides not allowing for a maximum gain to New Zealand from the available natural gas resource, the influx of synthetic gasoline will create an amazing s t ress on the one and only petroleum refinery in New Zealand that will have to continue to operate on imported crude in order to provide the needed diesel fuel, leading to a future when New Zealand will probably have to import expensive petroleum crude and export cheap gasoline. New Zealand will be left in the process totally dependent on petroleum or "Petroleum-alike" fuels while losing the opportunity i t had to move away from petroleum systems by using the natural gas a s an entry to a gas and alcc- hol future to make the two New Zealand islands energy independent indeed. This goal c m o t be achieved by providing fuels to existing systems, but rather by adapting ita fuel uses to fuels avail- able locally i. e. change ita motor vehicle fleets to CNG and methanol cars and opening the future, by establishing now the appropriate end use to biogas, synthetic natural gas from coal, methanol from coal or peat and ethanol from biomass.
New Zealand in answer to i ts energy needs was destined to experiment with new energy de- velopment but i t seemingly chose to stay with the old instead of going the way of true innovation. New Zealand. thanks to its g e ~ a p h p cz? gc it z!cnc. Zy act h V i u g to worry about cross-border traffic it can isolate itself by going CNG and methanol before the rest of us do so (3).
THE PETROLEUM REFINERY
Petroleum refinery design is dictated by the needs of a relatively small number of products, e.g., gasoline, jet fuel, diesel fuel, fuel oil. It is generally recognized that the most important part of any refinery is its gasoline manufacturing facility. A s the demand for gasoline increased, more and more of the lighter kerosene components were included in gasoline but the maximum suit- able portion depended on the kind of crude oil and rarely exceeded 20%. As such, methods more and more complicated were developed to obtain further products that could be blended into the original gasoline fraction. The customary processing in a refinery is thus no more a fractionation process producing relatively pure hydrocarbons, but rather a very complicated system with flows into a general pool of products - the gasoline produced being a mixture of ingredients with different eco- nomic costs. Gasoline blending is thus the combining of components to make up the liquid defined by a given set of properties that enable i t to be a fuel in a motor vehicle internal-combustion engine. One of the most important properties that must be satisfied is the required octane value. To produce higher octane ingredients that when blended with the f i rs t run low octane product, higher temperatures in cracking processes have to be employed. This more severe and energy intensive process, besides being more costly, a s it requires higher energy inputs, also creates less valuable by-products - the upshot being that the economics of production a t the refinery change. Furthermore, with the requirement to eliminate the octane boosting tetra-ethyl lead from the gasoline formulation because of environmental reasons some refineries, in most cases the smaller refineries, do not even pos- sess some of the needed equipment for these processes.
gasoline's octane number by one point (that is the average over motor octane and research octane). With 10% of the alcohol the average octane value is improved by about 3 pin ta and with 20% of the alcohol 5 mints improvement of the average octane value is achieved. Detailed calculation for sav- ings in petroleum crude, when using alcohol octane boosting additives to gasoline, were presented before the Mrst European Communities Conference on Energy from Biomass (4-6). To recapiMate here - i t was found that each Btu of ethanol used this way replaces 3.55 Btu of gasoline o r one liter of ethanol replaces at least 2.5 liters of gasoline. Following a similar path one can calculate that when us- 5% methanol as an additive to gasoline each Btu of methanol used this way replaces 4 Btu of gasoline or one liter of methanol replaces a t least 2 liters of gasoline.
In order to calculate the effective energy balance (in the use a s well a s in the production of the alcohol) the above values have to be multiplied with the energy balance in the manufacture of the alcohol. For the case of biomass ethanol, using a factor calculated by Professor Melvin Calvin - 1.76 each Btu used a s energy input in fertilizers, agricultural machinery or distillation equipment
Both methanol and ethanol when added a t about 3% to low octane gasoline wi l l enhance the
end UP displacing 6.6 Btu of petroleum origin when the ethanol is used a s an octane boosting additive to gasoline. When the ethanol is used instead as a fuel in an ethanol driven engine (no gasoline in- volved) in the effective use of the ethanol the potential gain at the refinery is lost. Also, the Btu content of the engine fuel that in the mixture is decreased only by about 3% will be decreased now by rather 30% while the octane value of the fuel has been increased in the ethanol-alone case to a value higher than required by an unchanged engine. It is expected thus to decrease from the above calculated advantages for the case of the mixed fuels to net gains of only about 20% above the Btu content of the fuel; each liter of ethanol used replaces now only about 0.8 liters of gasoline and each liter of methanol used replaces only 0 .6 liters of gasoline - this leading to higher savings in terms of petroleum resources, but also for economics much more difficult. This alternative becomes a possibility when political decision is taken to avoid dependence on petroleum crude. When mention- ing alcohol-gasoline mixtures, despite the favorable results of the Brazilian program and many other programs, i. e. , in the U. S. , West Germany, South Africa, when a New Zealand journalist visited the Mobil Oil Paulsboro facility he was cautioned against such blends "as liable to cause too many technical and distribution problems". Considering that a second plant in New Zealand was built to produce methanol for export - this in a world market that is already saturated with methanol produc- tion capacity - Mobil that is already expected to supply one third of New Zealand's need for gasoline in 1985 suggests to use the additional output of methanol in its Motunui plant (7) thus resulting in production of synthetic gasoline equal to over 50% of what could reasonably by expected to be the New Zealand need for gasoline by a conventional motor-vehicle fleet. Interestingly Shell and B. P. , the other corporate partners of the New Zealand refining corporation, did not agree to participate in the Mobil Oil project.
POLICY ISSUES
The Marsden Point refinery used, in 1981, 2,300,000 tonnes of crude oil and 440,000 tonnes of gas condensate and produced 1,236,000 tonnes gasoline and 665,000 tonnes of diesel. After the expenditure of over 1 billion for expansion and for building a hydrocracker, the refinery will use 2,884,000 tonnes of crude and 816,000 tonnes of condensate in order to produce 1,050,000 tonnes of gasoline, 430,000 tonnes of aviation fuel, and 1,125,000 tonnes of diesel. This change at the refinery will also double the refinery fue l loss from 165,000 tonnedyear to 330,000 tonnes/year.
On March 31, 1980, New Zealand Motor Vehicle licenses amounted to 1,283,661 passenger cars , 3,134 taxicabs, 3,397 buses and coaches, 176,692 trucks under 2 tonnes, 76,872 trucks Over 2 tomes. When including all other vehicles such as motorcycles, and motor homes, a grand total of 2,157,516 motor vehicles were licensed. New registrations for the year 1981 amounted to a total of 114,842 cars , the majority of which were assembled in New Zealand from parts imported mainly from Japan (73%. Other important countries of origin were the U.K. with 13.6% and Australia with 11.1%. A l l other countries of origin, including the U. S. , amounted to only 2.3% (nevertheless, when analyzing the manufacturing companies i t is clear that Ford and General Motors a re well repre- sented, mainly through their Australian and U.K. affiliates, amounting to about 30%).
Two of the motor vehicle assembly corporations were responsible for over 21,000 vehicles each while four other corporations were in the 10,000-18,000 range. Thus it is reasonable t o assume that a corporation that may not even produce a CNG o r methanol car for i ts own home market may find it advantageous to send such kits to the New Zealand assembly plant. In effect it would just take the cooperation of two such corporations in order to embark on a slow process of changing the motor vehicle fuels system gradually. The funds for such changes could then easily be found from the $1.5 billion that could be saved by eliminating some changes at the refinery and by eliminating the methanol-to-gasoline stage a t the Motunui plant (8).
It is preferable to go to dedicated vehicles - vehicles that were originally built for non- petroleum fuels use - rather than convert vehicles that were originally built to use gasoline fuels. Such conversions, for the CNG case, leave the vehicle with an undesirable seriously decreased trunk space.
CONCLUSIONS
The Mobil MTG process, to be employed in New Zealand, is being scaled up from the Mobil O i l Paulsboro operation to what could be a commercial size plant. Nevertheless, the economics in the New Zealand case a re such that this operation can only prove the technical aspects of the plant but not the economics - the New Zealand economics being figured out on the basis of a practical give-away of the natural gas.
Furthermore, New Zealand being a se t of two islands with very little traffic from the out- side, could have switched to a transportation system based on CNG and methanol with an intermediary stage that uses the existing Whangarei refinery, without changes, and methanol for an octane en- hancer. Such a policy besides having environmental benefits is economically sounder in the long range as 1) it allows for a much larger energy efficiency for the natural gas resource and 2) it prepares
the economy to an eventual switch to other sources of fuel gas and alcohols. New Zealand has large potential for the production of biomass and has a s well coal and peat deposits that will even- tually form the basis for an industrialization of the South Island. The elimination of the dependence on a petroleum system and the development of an indigenous industry a re , reasonably, the real long range interests of New Zealand.
What was said here is in no way an expression of doubt in the technical feasibility of the Mobil MTG process. It is highly possible that for other countries, and in other objective circum- stances, this process can be applied in accordance with national interests. Such circumstances could be envisioned for example for the case a country cannot isolate itself when its roads a re being used or by cars originating in areas that would not participate in a policy of switching from petroleum fuels.
LITERATURE CITED
"Energy Research Reports", ER Publications Inc., P. 0. Box 157, Watertown, MA 02172, U.S.A. (a) December 11, 1978; @) October 29, 1979. Jawetz, P. , "Relative Economics of Alcohol Octane Boosting Additives to Gasoline, Alcohol Fueled Cars, and Synthetic Gasoline from Alcohol". pean Communities Conference, A. Strub, P. Chartier, G. Schlesser, editors, Applied Science Publishers, London, 1983. Jawetz, P. , "Natural Gas Based Energy Systems - How New Zealand Decided to Act Not In Its Own Best Interest", Monograph No. 83-Pet-28 (1983). The American Society of Mechan- ical Engineers, 345 E. 47th St., New York, N, Y. 10017. Jawetz, Pi , "The Economics of Improving Octane Values of Gasoline with Alcohol Additives", Palz, W., Chartier, P . , and Hall, D.O., editors, "EnergyfromBiomass", Applied Science Fublications, London 1981. Jawetz, P. , "Alcohol Additives to Gasoline - An Economic Way for Extending Supplies of Fuels and for Increasing Octane Rations", PREPRINTS, Div. of Petrol. Chem., ACS, - 24, 198 (1979). Jawetz, P., PREPRINTS, Div. of Petrol. Chem., ACS, 25 (1). 99 (1980). New Zealand Press Association correspondent, "The Press", Christchurch, March 18, 1983. Peace, D. J. , Technical Officer for the Aucklmd Gas Association, in submission for "The Environmental Impact Audit Synthetic Petrol Plant", Volume II, April 20, 1981.
Energy from Biomass, Second Euro-
GENERAL PAPERS - FOSTER SESSION PRESENTED BEFORE THE DIVISION OF PETROLEUM CHEMBTRY, INC.
AMERICAN CHEMICAL SOCIETY WASHINGTON, D. C. MEETING, AUGUST 28 - SEPTEMBER 2, 1983
APPLICATION OF THERMAL ANALYTICAL TECHNIQUES TO ENHANCED OIL RECOVERY
BY
K. N. Jha Research and Development, Saskatchewan Oil and Gas Corporation 515 Henderson Drive, Regina, Saskatchewan, Canada SQN 5x1
INTRODUCTION
The world, especially in Canada and Venezuela, has extensive resource of oil sands and heavy oils. These resources are characterized by high viscosity, low API gravity, i. e. , high density, and large sulfur contents (Table I). Recovery of Lloydminster heavy oils in Canada under primary and secondary processes a r e less than 9% of initial oil-in-place, whereas that of bitumen from oil sands is nil.
a. Work done in our laboratory on Lloydminster, Saskatchewan crudes. b. "The Future of Heavy Crude Oils and Tar Sands", Ed. R. F. Meyer and C. T. Steele, McGraw-
Hill, Inc., New York (1981), pp. 168, 187, 237. c. "The Oil Sands of Canada - Venezuela 1977", Ed. D. A. Redford and A. G. Winestock, ClM
Special Volume 17, The Canadian Institute of Mining and Metallurgy, pp. 146, 178, 284. d. Reservoir temperature.
For the development and utilization of these resources, enhanced oil recovery (EOR) processes have to be employed (1-3). EOR refers to all techniques used to increase the amount of oil produced after primary recovery. EOR methods encompass pressure maintenance, water-flooding, gas in- jection, thermal, miscible displacement and chemical processes. The thermal process is most suitable for recovery of heavy oils and oil sand bitumens. In this process oil displacement results from:
in oil, i) viscosity reduction primarily due to heat and secondly due to carbon dioxide dissolution
ii) thermal expansion of the oil resulting in increased relative permeability, iii) distillation and thermal cracking of oil, iv) a solution gas drive from produced gas which facilitates the flow of fluids within the
reservoir toward the production wells, and
1
I
v) increased pressure gradient imposed by the injected air . Heat is transferred to the reservoir either by injection of steam/hot water or by &-e com-
bustion. The latter process, of interest to u s at present, consists of injecting air/oxygen/water in- to an oil reservoir to establish a flow path for the movement of fluids, igniting the crude oil and propagating the combustion front by continued aidoxygen injection (Figure 1).
field test are the fuel (coke) content of the oil being burned, the volume of air/oxygen required to sustain combustion and the efflciency of oxygen utilization. These parameters a r e usually determined by laboratory experiments employing a combustion tube. A sample of the data obtained is presented in Table ll. Most of these parameters could be estimated from TGA/DSC data.
The important factors required to establish the feasibility of initiating an &-E& combustion
TABLE II
TYPE OF DATA GENERATED FROM COMBUSTION TUBE EXPERIMENT^^^ Fuel Concentration, Kg/m3 Air-Fuel Ratio, m3/@ Oxygen Utilization, % Combustion Front Velocity, m/hc Steam Front Velocity, m/h Vaporization Front Velocity, m/b Fuel Required to Sustain
Combustion, @/m3 Maximum Peak Temperature, "C Hydrogen to Carbon Ratio of Fuel OilRecovery, % Produced Gas Analysis, Vol. %
16-48 10. so+ 0.1 0.1 0.1
a. D. W. Bennion e t al., "Proceeding II International Conference on Heavy Crude and Ta r Sands", Caracas, February 7-17, 1982.
b. "The Future oi Heavy Crucie anci Tdiar %an&", Ed. E. F. Xeyer and C. T. Steele, McGraw-Hill, Inc., New York, pp. 413-25, 1981.
c. Meters per hour.
Although combustion tube experiments generate data useful for the design and operation of the field-pilot, it is imperative that the numerical simulation of the &-e combustion process be carried out in making meaningful predictions of the parameters for planning, construction and optimum operation of field pilots.
Numerical &-e combustion simulation usually requires reservoir description, reservoir fluid properties, thermodynamic, chemical kinetics and well data (4). Experimental data for thermodynamic properties and chemical kinetics required in the area of low temperature oxidation, cracking, combustion and coking reactions a r e lacking in order to make meaningful predictions of an &-e combustion project (5-7). To this end, we have employed thermal analytical techniques, thermal gravimetric analysis (TGA) and differential scanning calorimeter (DSC) to generate the re- quiked data such a s energy of activation, pre-exponential factor, rate constant, and heat of reaction for chemical reactions. Thermal techniques can also provide data on minimum ignition temperature of crude oil to sustain combustion, fuel content of the core, fluid-rock interaction, decomposition of the mineral matter present in the core and residue left after heating.
samples under flow of helium, nitrogen and air . This paper presents TGA and DSC results obtained for two Lloydminster heavy oil core
EXPERIMENTAL
Tests were performed using a DuPont 951 Thermogravimetric Analyzer and a 910 Differ- ential Scanning Calorimeter attached to the 1090 Data Analysis System. A sample size of 25-60 mg and a temperature range of 40' to 900°C for TGA, and 1-3 mg and 40" to 58OOC for DSC studies were used. Samples were heated at a rate of 5" o r lO"C/min. in air , nitrogen or ultra pure helium flow- ing at 60 cm3/min. for TGA and 20 cm3/min. for DSC experiments. Thermograms recorded the percentage weight loss as a function of temperature and ita derivative for TGA and heat flow in mW versus temperature for DSC rum. The DSC cell constant was determined to be 1.081 using an indium standard. DSC experiments were performed using hermetic pans.
Samples A and B used for this study had an initial oil saturation of 63 and 85%. a porosity of 29 and 33%, and a permeability of 1.9 and 2.3 Darcies, respectively. Gravity and viscosity of crude oils were 16"API and 236 cp a t 38°C for sample A and 11'API and 46,000 cp at 38OC for sample B.
RESULTS
Thermograms of weight loss versus temperature for Lloydminster core A a re shown in Figure 2. The total weight losses were 6.92% in He, 7.57% in Nz, and 7.79% in air. The higher weight loss under a i r than under He indicates that the coke produced in the process is oxidized by oxygen, resulting in additional weight loss. The results under Nz atmosphere imply that N2 con- tains oxygen as an impurity.
Figures 3, 4 and 5 show weight loss curves and their derivatives (DTG) against rising tem- perature for sample A in He, N2 and air. The derivative curves suggest that there a r e a t least four groups of reactions which can be convoluted in four temperature zones. Kinetics for loss i n weight in each temperature zone is described later.
TGA and DTG thermograms a re presented in Figures 6 and 7 for core sample B. The total weight h3s was 14.8% in He and 15.6% in air in the temperature range 40" to 880°C. The charac- teristics of the TGA and DTG curves are similar to those obtained for sample A. It should be noted, however, that the oil content of sample B is twice a s much a s that of A.
For further understanding of reaction kinetics, differential scanning calorimeter experiments were conducted for samples A and E in He and a i r at a heating rate of lO"C/min. (Figures 8-11). The thermograms produced with He have three peaks, the last one representing the cracking reac- tions. The large exothermic peak produced under air is attributed to combustion reactions. The peak temperatures for these tests range between 453" and 484°C. Arrhenius and thermal parameters obtained by using the Borchardt and Daniels kinetics data analysis program supplied by DuPont a r e discussed later (8-10).
DISCUSSION
Derivatives of TGA thermograms for core samples A and B have demonstrated that there are four temperature regimes for weight loss. The temperature ranges and percentage weight loss for the total material and organic components within each range a r e listed in Table III. The percentage weight loss in the first region (5O'-38O0C) was approximately the same under He and a i r for sample A o r B. This weight representing 40 to 55% of the total loss is attributed largely to volatilization and to some extent to low temperature oxidation. The weight loss in the second temperature regime (34Oe-54O4C) was 19% in He and 43% in air for sample A and 27% in He and 54% in air for sample 3. This indicates that volatilization and thermolysis of heavy oil present in the core is taking place under He whereas more efficient reactions, such as oxidation and subsequent decomposition and volatilization, are involved in the presence of air. The third regime (45O0-630'C) is characterized by cracking, volatilization and combustion reactions whereas the last fraction of the weight loss between 550" and 900°C is assigned to coking, decomposition of mineral matter and oxidation. Oxi- dation and combustion reactions take place when sample is in contact with oxygen.
Weight loss kinetics for pyrolysis and combustion processes is extremely complex for such systems because of the numerous components present and their simultaneous and competing reac- tions. Kinetic treatment of the data is described below.
Solid phase thermal decomposition is described by the rate expression (11-12):
where k is rate constant; n, order of reaction; u0 initial sample weight; Wt sample weight a t time t ; (,j temperature in K. For a linear heating rate, f l , "C/min:
final weight; A , pre-exponential factor; E, activation energy; R , gas constant; and T, absolute
f l = dT/dt 4)
By combining Equations 1, 3 and 4 , rearranging, integrating and taking the natural logarithm and assuming n = 1, we obtain:
A plot of -In[-'"$-") ] versus 1/T should result in a straight line of slope E/R. The value of E obtained graphically is substituted in Equation 5 to calculate the pre-exponential factor, A. Typical plots to obtain apparent activation energies a r e shown in Figures 12-15 for reactions
occurring in the four temperature zones for sample A under He flow. Equation 3 is used to estimate rate constant a t any temperature. Values of E, A , and rate
constant at mean temperature for each reaction zone a re presented in Table III.
TABLE III
THEFOUL DECOMPOSITION PARAMETERS FOR LLOYDMINSTER HEAVY OIL CORES
Sample Reaction Temp. wt. LOSS 96 E A 103kmeanb Fuel (Purge Zone Range, "C Total Organica kcal/mol -1 -1 (Coke)
1.3 x 10⁻¹ 3.3 103 2.5 x 10¹¹ 1.5 x lo1 1.3 x 10⁻¹ 5.0 x 10⁶
1.8 3.3 107
1 . 2 x 10⁻¹ 6 . 7 . ~ 104 1.7 x 10¹⁰ 2.5
6.4 x 10⁻¹ 3.8 x 10⁸ 1.0 x 10¹⁰ 1.2 x 10%
8.8 x 10⁻¹ 1 .8 x 109 2.0 x 10⁵
0.92 1.1 3.3 0.91
0.75 1.8 1.8 1.0
0.62 2.0 4 .1 1.3
1.1 5.8 4.8 1.8
1.0 3.2 7.3
)39.2 29.3)
)49.1 28.0) '
a. Contribution from decomposition of mineral matter was subtracted from % total weight loss to get organic weight loss.
b. Mean temperature.
The apparent activation energy obtained for reaction zone 1, E l , varies between 4.6 and 6.6 kcal/mol for samples A and B under He, N2 and air. E1 values being very close to the latent heat of vaporization for hydrocarbons confirms our suggestion that weight loss in this reaction zone is mostly due to volatilization (13). E2 values for sample A range from 20.2 to 29.3 kcal/mol and for sample B 35.3 to 39.4 kcal/mol. These values a r e similar to those reported for thermolysis and oxidation of hydrocarbons and crude oils (14-16). E3 values of 49.9 and 46.4 kcal/mol for sam- ples A and B in He a re larger than 45.5 and 29.2 kcal/mol for A and B, respectively, in air. Cracking reactions under inert environment a r e known to have higher E values than under oxidizing atmosphere (5-6). Etayashitani e t al. have postulated a series of cracking reactions in helium in- volving light oil, heavy oil and asphaltene components in the pyrolysis of bitumen extracted from the Athabasca oil sand (17). Activation energies for cracking reactions reported by them range between 57.4 and 65.2 kcal/mol. Bennion et al. have reported that these values of activation energies were divided by 1.37 to be used in numerical simulation in order to obtain reasonable values of tempera- ture and fuel lay-down (5). These activation energies divided by 1.37 produce an average value of 44.1 kcal/mol which agrees with 49.9 and 45.5 kcal/mol obtained by us for reactions in zone 3 under He atmosphere. This indicates that the results obtained from TGA are more meaningful for use in the numerical simulation than those obtained from pyrolysis experiments in a closed system. Activation energies for reactions in zone 4 ranging between 14.2 and 21.5 kcal/mol a re typical of reactions involving either coke formation or its axidation (6).
The fuel (coke) contents of samples A and B have been determined to check if the minimum amount of fuel required to sustain combustion front is available. Calculation of fuel lay-down was based upon percentage organic loss in He in reaction zone 4 because coke is formed in this region. Since the maximum combustion temperature of the fire front listed in Table I1 ranges between 450" and 700"C, it is expected that for some fireflood tests, weight loss in zone 3 in He will also contribute to fuel lay-down. The fuel content under both scenarios calculated by assuming the density of the sample 2.2 g/cm3 is included in Table III. Estimated fuel content values under either assumption a r e greater than the value required (20 kg/m3) to sustain combustion.
!
J
!
i
Activation energies, pre-exponential factors, ra te constants a t peak temperatures, and heats of reactions obtained from treating DSC data for the last peak using the Borchardt and Daniels kinetics program are listed in Table IV. Order of reaction was assumed to be 1.0. Activation energies for cracking under He of sample A was 55.9 and of sample B was 61.7 kcal/mol and for combustion under a i r of sample A was 20.5 and of sample B was 28.9 kcal/mol. These values a r e higher for cracking and lower f o r combustion reactions than those obtained from kinetic treatment of TGA data in tem- perature zone 3 (Table rrr). Although inhomogeneity of core samples is always a problem in gener- ating reproducible data, i t is believed that more experimental data is needed before such discrepancy can be resolved. Heats of reaction for testa under air a r e much larger, 147 for A and 240 cal/g for B, thin in He, 38 for A and 91 cal/g for B. It is evident that heat of reaction for sample A is lower than that of B. This is because oxidation reactions a r e much more exothermic than cracking reactions and oil content of sample A is one-half of E. Table IV includes peak and ignition temperatures de- rived from DSC thermograms. Ignition temperature is defined here a s the temperature to which the product must be heated in the presence of air to sustain combustion. Temperature a t the onset point of the combustion peak on DSC thermograms has been assigned to this value. Ignition temperature for sample A is 325'C and for sample B is 345°C.
TABLE IV REACTION PARAMETERS FROM DSC EXPERIMENTS~
Sample Peak Activation A 10% Heat of Ignition (Purge Temp. Energy peak Reaction Temp.
C a l k "C -1 s-1 Gas) "C kcal/mol 6 A. (He) 462 55.9 2.6 x 10¹⁴ 5.7 38
a. Order of reaction was assumed to be 1.0 for estimation of activation energy and pre-exponential factor.
SUMMARY
Thermal degradation of Lloydminster heavy oil core samples has been investigated in He, N2 and a i r using TGA and DSC techniques. TGA and DTG thermograms demonstrated four distinct types of chemical reactions occurring in four different temperature zones. Reactions in zone 1 are attributed to volatilization and low temperature oxidation; in zone 2 to thermolysis of heavy oil frac- tions, volatilization and oxidation; in zone 3 to cracking and combustion; and in zone 4 to coking, de- composition of mineral matter and oxidation of the coke produced. oxidation reactions take place when the sample is in contact with air. Fuel (coke) contents of sample A ranged between 29.3 and 39.2 Kg/m3 and that of B, 28.8 and 49.1 Kg/m3. Arrhenius and thermal parameters obtained for reactions in TGA/DSC studies a re listed in Tables III and IV.
Data generated from TGA/DSC experiments a re essential for running numerical simulation of the &-a combustion process and verifying their match to the laboratory results. In addition, TGA/DSC data can be manipulated to yield air-fuel ratio, oxygen utilization, combustion front velocity, produced gas compxition and hydrogen-bcarbon ratio of the fuel. It is evident that thermal analyti- cal techniques have the potential to produce data which can be used for planning, design and construc- tion of the field &-E& combustion tests and for numerical simulation to predict process variables and economics.
1 , I
ACKNOWLEDGMENTS
I wish to thank G. Perron for technical assistance and A. Leu for calculation of some of the data. Partial financial support from Saskatchewan Energy and Mines is acknowledged for this work.
Figure 1. Schematic diagram of in-situ combustion process.
INJECTION WELL PRODUCTION WELL
AND WATER
PRODUCING FORMATION
1
Figure 2. TGA thermograms of core sample A under the flow of He, N2 and air.
100.-
e.
98- t5 U
m u
96.-
94.-
92.-
102 104 i
L
- -
AIR
92.- ---0.08
90 0 t 100 200 300 400 500 600 700 800 900 1000 1100 Temperature (OC)
Figure 3. TGA and DTG thermograms of core sample A under He.
102 l 0 I
c
Figure 4. TGA and DTG thermograms of core sample A under N2.
Figure 12. Arrhenius plot for sample A under helium between 50' and 34OoC.
0
2.0 2.5
1 0 ~ 1 ~ (K-I)
Figure 13. Arrhenius plot for sample A under helium between 340° and 475OC.
14-
I
12 1.3 1.4 1.5
1 0 ~ 1 ~ ( ~ - 1 )
i
Figure 14. Arrhenius plot for sample A under helium between 475O and 550°C.
0
1.24 1.28 1
103/T (K-’)
Figure 15. Arrhenius plot for sample A under helium between 550° and 800’C.
2
‘ “ I 0
0.97 1 .oo 1.05 1.10 1.15
1 0 3 n ( K - ~ )
I 1 LITERATURE CITED
Jha, K. N., Chemistry in Canada, pp. 19-26, September 1982. Jha, K. N. , and Verma, A . , Proc. Il International Conf. on Heavy Crudes and Tar Sands in Caracas, Venezuela, Vol. IV, Feb. 7-17, 1982. "Fundamentals of Enhanced Oil Recovery", K. H. van Poolen and Assoc. Inc., PennWell Books, Tulsa, Oklahoma, U. S.A., 1980. "Fully ImplicitaS& Combustion and Steam Model", ISCOM User Manual, Version 2 .2 , April, 1981, Computer Modelling Group, Calgary, Alberta, Canada. B e d o n , D. W., Moore, R. G., Donnelly, J. K. , and Erian, A . , Proc. Il International Cod. on Heavy Crudes and Tar Sands in Caracas, Venezuela, Vol. 11, February 7-17, 1982. Lin, C. Y . , Chen, W. H., Lee, S. T., and Culham. W. E., 57th Ann. Fall Tech. Conf., Sot. Pet. Engg. SPE 11074, New Orleans, U.S.A. September 26-29, 1982. Vossoughi, S. , Barlett, G. W., and Willhite, G. P., 57th Ann. Fall Tech. Conf., Soc. Pet. Engg. SPE 11073, New Orleans, U.S.A., September 26-29, 1982. Borchardt, H. J., and Daniels, F., J. Am. Chem. Soc., 3, 41-46 (1957). Grentzer, T. H., Holsworth, R. M . , and Provder, T., National ACS, 3/81, ORPL. "Borchardt and Daniels Kinetics Data Analysis Program", PN994377-912, DuPont, Wilmington, Delaware, U. S. A. , August 1982. Coats, A. W., and Refdern, J. P . , Nature, 201, 68-69 (1964). Thakur, D. S., Nuttal, H. E . , and Cha, C. Y . , Preprint, Div. Fuel Chem., 2 (2), 131 (1982). Yaws, C. L., "Physical Properties", Chem. Engg., McGraw-Hill Co., New York, p. 205 (1977). Baldwin, R. R., Bennett, J. P., and Walker, R. W., 16th International Symp. on Com- bustion, MIT, Cambridge, Mass. , U. S. A. , August 15-20, 1976. Jha, K. N., Rao, P. M., and Stausz, 0. P., Preprint, Div. Fuel Chem., 23 (4), 91 (1978). Campbell, J. H., Koskinas, G. H . , and Stout, N. D., Fuel, 57, 372 (1978). Hayashitani, M., Bennion, D. W., Donnelly, J. K . , and Moore, R. G., "The Oil Sands of Canada-Venezuela 1977". Ed. Redford, D. A . , and Winestock, A. G., Can. Ins. Mining and :Let., pp. 233-2A7 (1977).
GENERAL PAPERS - FOSTER SESSION PRESENTED BEFORE THE DIVISION OF PETROLEUM CHEMISTRY, INC.
AMERICAN CHEMICAL SOCIETY WASHINGTON, D. C. MEETING, AUGUST 28-SEPTEMBER 2 , 1983
DEVELOPMENT OF AN ALTERNATIVE S.A.R.A. METHOD FOR THE CHARACTERIZATION OF COAL-DERIVED LIQUIDS
BY
F. M. Lancas, H. S. Karam and H. M. McNair Department of Chemistry, Virginia Polytechnic Institute and State University
Blacksburg, Virginia 24061
INTRODUCTION
Coal-derived liquids have been studied extensively, because of their potential applications in many fields such as fuel and feedstocks generation (1). One of the most popular methods by which to characterize fossil fuels is by fractionation of the sample into saturates, aromatics, re- sins and asphaltenes (S.A.R.A.). Two different approaches a r e widely used for this purpose: sol- vent extraction and liquid chromatography. Although much work has been done using these two ap- proaches, characterization of fossil fuels is still unsatisfactory and exhaustive research is still re- quired. Solvent extraction methods currently used, though simple and inexpensive, present pro- blems with reproducibility, time consumption, solvent evaporation, co-extraction and loss of vola- tiles (2, 3). In most of the liquid chromatographic methods used, the fossil fuel extract is f irst treated with a non-polar hydrocarbon (such as n-pentane) to precipitate the asphaltenes and the re- maining solution is applied to an Attapulgus clay column to separate resins from oils. Finally, the oils a r e fractionated to saturates and aromatics on alumina and/or silica columns (4). All these steps, in addition to being unnecessary and inconvenient, do not provide the actual group-type dis- tribution in the extract since part of the resins could be co-precipitated with asphaltenes (5). With these problems in mind, we have developed and applled an alternative S.A.R.A. method for the characterization of Brazilian coal-derived liquids.
RESULTS AND DISCUSSION
Fractionation by Solvent Extraction
different solvents for 30 minutes using a magnetic s t i r r e r (100 ml of solvent to 10 g of coal). Re- sults showed that stirring time is not critical. After one hour of stirring with hexane, the unextrac- ted coal was 96.6% of the original sample, while after 12 hours it was 95.6%. Following extraction, the solvent was evaporated and the extract redissolved in 2 ml of solvent. Asphaltenes were preci- pitated by adding 80 ml of n-pentane to the concentrated extract solution (volume ratio of 40 to 1). In all experiments solvents were evaporated by a combination of rotary evaporation for sample con- centration and controlled heating under nitrogen flow until dryness of the extract. the results of a study comparing the relative amounts of asphaltenes and maltenes present in the "Mina do Leao" (high-ash Brazilian coal). The relative amounts extracted by the different solvents a r e displayed in Figure 2. Although pyridine is the best solvent examined, we decided to use te- trahydrofuran (THF) since it has a similar performance and it i s less toxic and less polar.
In a different set of experiments, the fractionation of the THF coal extract into asphaltols, asphaltenes and oils was carried out utilizing the schematic shown in Figure 3. The results of this study appear in Table I.
Coal was finely ground, sieved through a 60 mesh (U. S. Standard) sieve, extracted with
Figure 1 shows
Fractionation by Column Chromatography
packed for comparison purposes. Dry packing was done by constantly tapping the column while adding 2 g of the packing material in small portions. A plug of glass wool and a layer of white sand (ca. 0.5 cm) on the top were used to support the solid adsorbent and to prevent it from washing through the stopcock. Slurry packing was performed by first adding the solid adsorbent a little a t a time to hexane in a beaker, swirling the beaker and pouring the slurry into a draining column (pre- viously filled about 1/3 full with the first eluent, hexane). The results of a comparative study using different packing techniques and materials a r e displayed in Table 11. A set of five identical columns was employed, to determine the reproducibility of each system a s applied to a hexane coal extract. For this study, the hexane soluble materials were filtered following extraction into a 100 ml
A 50 cm (L) x 11 mm (I. D.) glass column fitted with a teflon stopcock was dry o r s l u r r y
I
volumetric flask. 10 ml of this stock solution was loaded into the chromatographic column. The eluents used to generate the fractions were hexane (50 ml), toluene (75 ml) and methanol (50 ml) for saturates, aromatics and resins, respectively, following precipitation of asphaltenes, in accord- ance with the Phillips method (6). The results show that slurry packing with silica is the most re- producible system investigated. (It is well-established in the literabre that asphaltols are highly adsorbed on alumina, while fewer substances a r e adsorbed on silica gel because of its mildly acidic properties (7, a).)
TABLE I
SOLUBILITY CHARACTERISTICS OF HIGH-ASH BRAZILIAN COAL THF EXTRACT
COMPARISON OF DIFFERENT PACKDG STSTEW A S APPLIED TO HEXANE COAL EXTRACT
GroupType Column Typea: 2 - 2 __ 3
wt I 40.4 35.3 24.3 Saturates 0- 8.8 3.4 2.3
R. S. D. 22 9.8 9.5
Aromatics Wt % 30.1 22.4 30.1 6 5.9 3.1 2.2
R. S. D. 20 14 7.1
Wt I 29.4 42.3 45.6 Resins 0- 10 2. 5 1 .8
r’ R.S.D. 35 5.8 4.0
a. l=dry-packed alumina; 2=slurry-packed alumina; S=slurry-packed silica.
Since the best performance was shown with THF as extracting agent and silica gel as an adsorbent for slurry packing technique, w e have applied the whole coal extract (a maximum of 200 mg) to the column to avoid problems associated with the asphaltenes precipitating in non-polar sol- vents. The characteristics of the chromatographic elution utilizing this new system as well as the relative group type distribution of the THF coal extract appear in Table In.
TABLE III
CHROMATOGRAPHIC ELUTION CHARACTERISTICS AND RELATIVE GROUP TYPE DISTRIBUTION O F THF COAL EXTRACT
Eluent Volume of Eluent Color of Eluent Identity - Wt %
Hexane 50 ml Colorless Saturates 3.3 Toluene 75 ml Orange Aromatics 20.2 Methanol 50 ml Red-Wine Resins 51.8 TH F 50 ml Dark Brown Asphaltenes 24.7
100.0
u c 4J w
.. .. .. .. .. .. L
m F - v )
U
E W
0 v)
a
c
.. .. .. O B 0
cw 0 m e . u
/ /
I
W z 4
\
c
& 8 m h L - J &
I- z w n
- 0 rl d
w v ) z w w - I D m - I 2 0 - I I - 0
v) z w-#
\ c
&
x k rd
\
- g - a - 1
n
Q)
3 w 0 0
cd
Q)
rn
.d Y
E 3
CONCLUSION
Compared with methods of characterization of coal extract described in the literature, the method we have developed has the following advantages:
1. Extraction step: Using THF instead of hexane, pyridine, toluene, etc. , gives more reproducible results and avoids extracting very polar compounds and loss of volatiles during the evaporation step. Magnetic stirring instead of manual stirring or Soxhlet extraction is an easier, faster and more reproducible extraction procedure.
2. Column Chromatography: Slurry packing with silica permits a better stationary bed and, at the same time, avoids irreversible adsorption. By fractionating the whole THF coal ex- tract, one avoids the precipitation of asphaltenes prior to column chromatography. In addition, fractionating the whole extract permits collection of the four S .A. R.A. (saturates, aromatics, re- sins and asphaltenes) fractions for further characterization.
ACKNOWLEDGKENTS
F. M. Lancas would like to thank Fundacao de Amparo a Pesquisa do Estado de Sa0 Paulo (FAPESP) for the fellowship (Process0 16-Quimica 81/0557-2) and Universidade de Sa0 Paulo for the free absence.
LITERATURE CITED
Whitehurst, D. D., Mitchell, T. 0. and Farcasiu, M. , "Coal Liquefaction. The Chemis- try and Technology of Thermal Processes", Academic Press, NY (1980). Boduszynski, M. M., Hurtubise, R. J. and Silver, H., Anal. Chem., 54, 372 (1982). Bockrath, B., Schroeder, K. T. and Steffgen, F. W., Anal. Chem., 51, ll6R. Galya, L. G. and Suatoni, J. C. , J. of Liquid Chmmaiogr., - 3, 229 (1980). Bunger: J. Ur. and ii, N. C . , eds. , "Chemistry of Asphaltenes", Advances in Chem. Series, No. 195, AMS (1981). Phillips Petroleum Company, Research and Development, Method 8045-AS (1980). Whitehurst, D. D. , Farcasiu, M. and Mitchell, 0. , "The Nature and Origin of Asphal- tenes in Processed Coals", EPRI Annual Report (1976). Given, P. H., Cronauer, D. C . , Spakman, K . , Lovell, H. L . , Davis, A. and Biswas, B. , Fuel, 54, 34 (1975); 54, 40 (1975).
GENERAL PAPERS - POSTER SESSION PRESENTED BEFORE THE DIVISION O F PETROLEUM CHEMISTRY, INC.
AMERICAN CHEMICAL SOCIETY WASHINGTON, D. C. MEETING, AUGUST 28-SEPTEMBER 2, -983
A CORRELATIVE INVESTIGATION O F THE EFFECTS OF OXIDATION ON THE MINERALS, MA CERA IS AND TECHNOLOGICAL PROPERTIES OF COAL
BY
M. C. Lin, F. E. Huggins, G. P. Huffman and D. E. Lowenhaupt U. S. Steel Corporation, Research Laboratory, 125 Jamison Lane
Monroeville, Pennsylvania 15146
INTRODUCTION
The oxidation of coal by natural weathering processes is well known to degrade those pro- perties important for cokemaking (1, 2). Conversely, the loss of fluidity and enhancement of char reactivity resulting from low-temperature coal oxidation a r e desirable properties for coal gasifica- tion (3). Thus, better understanding of the oxidation mechanisms of coal components and of the ef- fect of such oxidation on technological processes i s highly desirable.
57Fe Mossbauer spectroscopy and diffuse reflectance infrared Fourier trans- form (DRIFT) spectroscopy were used to investigate the oxidation of minerals and macerals, re- spectively, and measurements of the Gieseler plasticity were made as representative of an impor- tant technological property, coal fluidity, that is affected by oxidation. The relative sensitivity of these techniques to coal oxidation were compared by correlating measurements made on a variety of bituminous coals.
SAMPLES AND EXPERIMENTAL TECHNIQUES
The naturally oxidized coal discussed in this paper is a low-volatile bituminous coal ob- tained from a strip mine on the Pocahontas No. 4 seam in West Virginia. Samples were collected from an outcrop (most oxidized) and the mine highwall (least oxidized), and at an intermediate loca- tion to obtain an oxidation profile across the s t r ip pit.
Two high-volatile bituminous coals (Pittsburgh and Harlan seams) were used in long-term, room-temperature oxidation treatments. T h e -60 mesh coals were put into several 100-ml beakers and stored separately in dry, ambient and humid a i r atmospheres at room temperature in the labor- atory for 950 days. The dry environment was simulated by placing the coals in a desiccator con- taining Drierite, whereas the humid environment was simulated by placing the coal in a similar desiccator vessel, but with water present. The ambient samples were stored in beakers open to the laboratory atmosphere.
seam in Pennsylvania and the other from the Pocahontas No. 3 seam in West Virginia, were used in two simulated weathering treatments. In one treatment, -40 mesh coal was placed in a gas-tight oven at 50'C. The moisture level of the air in the oven was maintained a t approximately 65% RH (6.9 5 0.2% HZO). In the other treatment, stockpiled samples of -l/8-inch coal were exposed to the atmosphere in 20-pound aliquots in plywood boxes.
The iron-bearing minerals in the various coals were investigated by 57Fe Mossbauer spec- troscopy. Details of sample preparation and data reduction procedures can be found in previous papers (4, 5, 6). The diffuse reflectance infrared Fourier transform (DRIFT) spectra were mea- sured on a Nicolet 7000 ser ies FI'IR spectrometer with data reduction capability. Samples for FTIR were either -60 mesh or -200 mesh coals without KBr dilution. Typical measurement t imes were 285 seconds and the resolution of the spectra was typically 4 ern-',
coal oxidation was also monitored by an alkali extraction test (7).
RESULTS AND DISCUSSION
Channel samples of two additional bituminous coals, one collected from the Pittsburgh
Standard ASTM methods were used for Gieseler plastometer measurements. The extent of
Gieseler Plastometer Measurements Results of Gieseler plastometer measurements on the strip-mined coal samples are sum-
marized in Table I. The thermal plasticity of the coal samples decreases markedly as a result of oxidation. The softening temperature increases and solidification temperature decreases by ap- proximately 30°C. narrowing the plastlc range from 90'C to 30°C. The maximum ra te of rotatlon,
I
which corresponds to the maximum fluidity of coal samples, decreased by several orders of magni- tude to the level of essentially no fluidity a t all for the outcrop coal.
TABLE I
RESULTS OF LIGHT TRANSMISSION VALUES AND GIESELER PLASTOMETER MEASUREMENTS FOR POCAHONTAS NO. 4 SEAM
The results of the alkali extraction test , also summarized in Table I, correlate fairly well with results of Gieseler plastometer measurements. This test is used in the metallurgical coal in- dustry to detect coal oxidation prior to the coking operation. Usually, a coal with a light transmis- sion value less than 80% is regarded as too oxidized for metallurgical usage (7). I t is noted that the badly oxidized coal taken from the outcrop of the pit has a transmission value of only 30%, while the least oxidized highwall coal has a value of 97%.
Harlan seam coals stored in dry, ambient and wet atmospheres for over 950 days at room tempera- tu re , as summarized in Table 11. These results indicate that the extent of oxidation depends greatly on the humidity of the coal environment, with high humidity accelerating coal oxidation.
Similar plasticity behavior as a result of oxidation was also found for the Pittsburgh and
TABLE II
GIESELER Pl4STOMETER RESULTS OF COALS "WEATHERED" FOR 950 DAYS AT ROOM TEMPERATURE
Max. Max. Soft Fluid Solid. Plastic
Sample ddpm Temp. Temp. Temp. Range
Pittsburgh 22400. 0 347 410 464 117
Pittsburgh 1600.0 365 422 46 7 102
Pittsburgh 580.0 366 420 459 93
car,, (ambient)
(wet)
(dry) Harlan 18.0 365 410 440 75
Harlan 9.0 387 432 459 72
Harlan 5.0 391 427 454 63 (ambient)
(wet)
An extremely rapid decrease of Gieseler plasticity due to oxidation is shown in Figure 1, where the maximum fluidity is plotted versus t ime of oxidation treatment for coals treated at 65% RH and 50°C. Accompanying this rapid reduction of fluidity, there is also a significant decrease of the plastic range. The -l/d-inch stockpiled samples of the same coals show similar but less rapid changes.
57 Fe Mossbauer Spectroscopy
The distribution of iron among minerals obtained by low-temperature Mossbauer spectro- scopy is summarized in Table III for the strip-mined Pocahontas No. 4 samples. The data indicate that the pyrite has been completely converted to iron oxyhydroxide in both the middle and outcrop coals. Additionally, with increasing oxidation, a decrease in the percentage of iron contained in clay minerals and a n increase in the percentage of iron present a s a n unidentified ferric phase (Fe3+) a r e observed. This Fe3+ phase is most probably either a fe r r ic sulfate or Fe3+ in clays.
TABLE ID
MOSSBAUER DATA ON DISTRIBUTION OF IRON AMONG MINERALS FOR POCAHONTAS NO. 4 COAL SAMPLES
Percentage of the Total Sample Iron Contained in:
+3 Sample Clay Siderite Pyrite Jarosite Oxyhydroxide Fe Iron
Results of Mossbauer spectroscopy investigations on the room-temperature oxidation of Pittsburgh and Harlan coals a r e summarized in Tables lV and V. The data indicate that in Harlan coal, the clay and siderite a r e apparently little affected by oxidation, whereas the pyrite is exten- sively oxidized and transformed to jarosite, iron oxyhydroxide and a fe r r ic iron phase. Pittsburgh coal, the pyrite was transformed to ferrous sulfate initially and then to ferric sulfates and iron oxyhydroxide. A s discussed elsewhere(8), this and other differences in mineral oxidation reflect the significantly different sulfur content and mineralogies of the two coals.
For the
TABLE IV
MOSSBAUER DATA ON THE DISTRIBUTION OF IRON AMONG MINERALS FOR PITTSBURGH COAL SAMPLES
Sample Phases -~ Fresh Pyrite 100
Pyrl te 96 Szomolnokite 4
Ambient Pyrl te 76 Szomolnokite 20 Rozenite 4
Wet Pyrite 26 cr-FeOOH 23 Jarosite 4
Fe 25 Unidentified Fef2 22
3+
a. Percentage of the total iron in the sample contained in the indicated phase.
The low-temperature Mossbauer spectra of Pittsburgh coal, treated in the experimental oven (50'C, 65% RH) and coal stockpiled out of doors, are shown in Figure 2. For both Pittsburgh and Pocahontas No. 3 coals treated in the oven, the iron sulfate, szomolnokite, was detected after 40 and 124 days of treatment, respectively. A s the oxidation proceeds, the iron sulfate content con- tinues to increase at the expense of pyrite. However, for the coals stockpiled out of doors, iron oxyhydroxide is the oxidation product of pyrite and no iron sulfate has yet been detected. This in- dicates that different oxidation processes or different rate-determining steps a r e involved in the oxidation of pyrite in the two environments.
obvious trend with increasing oxidation is increases in intensity of various carbonyl bands between 1600 cm-l and 1800 cm-l. These Increases in intensity were also accompanied by an increase in intensity of the region between 1100 cm-' and 1300 cm-', which is associated with the c-0 stretch- ing vibration and 0-H bending modes of phenols, ethers and es te rs (9, 10). Similar increases in intensity can also be found in the absorption bands of hydroxyl groups ranging from 3200 cm-1 to
The infrared spectra of the strip-mined coal samples are shown in Figure 3. The most
3600 cm-'. However, the intensity of absorption bands at 2860, 2920 and 2950 cm-l, which cor- respond to the aliphatic C-H stretching modes, show systematic decreases from the least oxidized to the most oxidized coal samples. Similar decreases in intensity a l so occur for the aromatic C-H stretching mode at 3040 cm-l , and the absorption bands between 700 and 900 cm-l , which corre- spond to the aromatic C-H out-of-plane bending modes.
TABLE V
MOSSBAUER DATA ON THE DISTRIBUTION OF IRON AMONG MINERALS FOR HARLAN COAL SAMPLES
Sample
Fresh
Dry
Ambient
Wet
Phases
Pyrite Clays Siderite
Pyrite Clays Siderite Jarosite
Pyrite
Siderite Jarosite
c lays
Pyrite Clays Siderite Jarosite Iron Oxyhydroxide F c + ~
53 43 4
46 43
5 6
42 43
6 9
1 2 42
6 20 7
13
a. Percentage of the total iron in the sample contained in the indicated phase.
For the laboratory-oxidized Pittsburgh and Harlan coal samples, the carbonyl and carboxy- lic-acid absorption bands between 1600 cm-l and 1800 cm-l, which a r e found in naturally oxidized coals from strip-mines and are closely associated with effects of coal oxidation, were not detected. This suggests that the oxidation of these coal samples is still at a relatively early stage; although both Mossbauer spectroscopy and Gieseler plastometer measurements clearly show changes due to oxidation. This observation is further supported by the DRIFT results obtained after severely oxi- dizing the dry and wet Pittsburgh coal samples in a i r a t 110°C fo r seven days. Figure 4 shows that, in addition to the 1650 cm-' and 1735 cm-l bands observed before, carbonyl and carboxyl bands near 1585, 1680, 1690, 1710 and 1765 cm-l also appear after this rather severe oxidation treat- ment.
DRIFT spectra were also obtained from al l oven-oxidized and stockpiled coal samples. NO significant difference between the treated and f resh coals was found. This indicates that DRIFT spectroscopy is not sufficiently sensitive to detect the early stages of oxidation that cause the large decreases observed in plasticity.
CONCLUSIONS
Mossbauer spectroscopy shows that pyrite in coal is readily altered by low-temperature coal oxidation. The oxidation of pyrite in coals subjected to simulated weathering treatments at constant temperature and humidity in the laboratory gives r i se to a variety of iron sulfates. This i s in contrast to coal samples stockpiled out-of-doors and strip-mined coals, in which the principal pyrite oxidation product is iron oxyhydroxide.
strip-mined coal is detected in DRIFT spectra. These changes accompany the enhancement in in- tensity of certain carbonyl and carboxyl bands. However, these carbonyl bands are not detected in spectra of laboratory oxidized coals until oxidation is qui te extensive.
A reduction in intensity of aliphatic and aromatic bands with increasing oxidation of a
F i a . 2 Low-temperature tmssbauer Spectra of P i t t sburgh coals: (A1 t r e a t e d i n 50-C, 65% RH for 167 days ; IC1 s t o c k p i l e d
Out of doors for 1 3 9 d a y s .
~ i g . 1 v a r i a t i o n s of maximum f l u l d i t y as measured by G i e s e l e r p las tometer w i t h days of o x i d a t l o " a t 50.C. 650 R H .
,
I
The Plastic properties of coal, a s determined by Gieseler plastometer measurements, a r e extremely sensitive to oxidation. The maximum fluidity shows a very rapid reduction with oxida- tion. There is also a significant narrowing of the plastic range. Of t h e three techniques, the Gieseler plasticity measurement i s t h e most sensitive and DRIIT spectroscopy the least sensitive to the initial stages of coal oxidation. This order of sensitivity i s inverse to their applicability to coals as the Gieseler measurements are restricted to coking bituminous coals and Mossbauer tech- iques are best applied to high pyrite coals, whereas DRIFT spectroscopy can be applied to all coals with little or no modification.
The extreme sensitivity of the thermoplastic behavior of coal to initial oxidation a s deter- mined by the Gieseler measurements is in contrast to the insensitivity of DRIFT spectroscopy and the relative minor oxidation of pyrite detected by Mossbauer spectroscopy, both of which a r e bulk- oriented techniques. The explanation must be attributed to the fact that the first stages of coal oxi- dation a r e surface controlled, as a r e most oxidation processes. Even though plasticity is deter- mined by a macroscopic measurement, it is dependent upon the fusing together of separate coal par- ticles. Consequently, it i s likely to be highly sensitive to very thin surface layers on the coal par- ticles. Further investigations involving the characterization of oxidized coal surfaces a r e currently underway.
LITERATURE CITED
Gray, R. J., Rhoades, A. H. andKing, D. L . , Trans. AIME, Soc. Min. Engineers, 260, 334 (1976). Crelling, J. C. , Schrader, R. H. and Benedict, L. G. , Fuel, 2, 542 (1979). Mahajan, 0. P . , Komatsu, M. and Walker, P. L., Jr., Fuel, 59, 3 (1980). Huffman, G. P. and Huggins, F.E., Fuel, 51, 592 (1978). Huggins, F. E. and Huffman, G. P., Analytical Methods for Coal and Coal Products, Clarence Karr , Jr., ed., Academic, New York, Vol. 3, Chapter 50 (1979). Huggins, F. E., Huffman, G. P. and Lee, R. J., Coal and Coal Products: Analytical Characterization Techniques, E. L. Fuller, Jr . , ed . , ACS Symp. Series No. 205, p. 239
Lowenhaupt, D. E. and Gray, F. J. , Interntl. Journal of Coal Geology, 1, 63 (1980). Huggins, F. E. , Huffman, G. P. and Lin, M. C. , to be published in Interntl. Journal of Coal Geology (1983). Painter, P. C . , Snyder, R. W. I StarSiniC, M . , Coleman, M. M . , Keuhn, D. W. and Davis, A. H . , Applied Spectroscopy, 35, 475 (1981). Painter, P. C . , Snyder, R. W. , Pearson, D. E. and Kwong, J . , Fuel, 2. 282 (1980).
(1982).
I
GENERAL PAPERS - POSTER SESSION PRESENTED BEFORE THE DIVISION O F PETROLEUM CHEMISTRY, INC.
AMERICAN CHEMICAL SOCIETY WASHINGTON, D. C. MEETING, AUGUST 28-SEPTEMBER 2, 1983
EFFECT OF FRACTURE MODES ON SHAPE AND SIZE OF COAL PARTICLES AND SEPARATION O F PHASES+
BY
J. M. Lytle and L. R. Bunnell Battelle, Pacific Northwest Laboratory, Richland, Washington 99352
and K. A. Prisbrey
University of Idaho, Moscow, Idaho 83843
INTRODUCTION
Studies of coal grinding a r e becoming one of the most important and interesting areas of coal research. Consequently, the Department of Energy sponsored "Study Group on Research Planning for Coal Utilization and Synthetic Fuel Production" emphasized size-dependent phenomena during coal grinding a s one of the seven most important areas of research needed for development of an advanced coal and synfuels industry (1, 2). Nearly every use of coal involves grinding to some extent and modern processes a r e requiring finer and finer coal powders. Knowledge of the proper- ties of these coal powders is essential in developing these processes. For example, knowledge of shapes and s izes of particles is important in defining the viscosity and transport h c h v i w of coal- liquid slurries for combustion o r pipeline transport. KnmiIcSge of separation of phases is impor- tant in developing beneficiation processes to remove impurities.
Tke ~ i u d y reported in this paper used microscopy, shape, s ize and sulfur analyses to show the influence of fracture modes and mechanisms on shape and size of coal particles and separation of phases. The preferential lines of f racture during coal grinding were identified microstructurally and related to the s ize and shape of particles produced and the Separation of mineral and organic phases. For example, weaker phases that were lean in organic sulfur were observed to concen- t ra te into finer particle size ranges and stronger phases that were rich in organic sulfur concen- trated into coarser particle size ranges.
EXPERIMENTAL
Two coals of widely differing rank were selected for, this study: a lignite from the Fort Union Bed near Savage, Montana and a medium volatile bituminous (MVB) from the Beckley seam near Duo, West Virginia. These two coals (PSOC-837 and PSOC-985) were obtained from the Pennsylvania State University's coal sample bank.
Prior to ball milling, the coals were preground in nitrogen to minus 20 mesh (v. S. stan- dard screen, 8 4 0 ~ opening size) in a wheel-type pulverizer. The coal (350 g) was transferred in the N2 atmosphere to a 1 . 8 L steel ball mill, which was then evacuated and backfilled with helium. During rotation of the mill, coal powders were withdrawn in a long, cylindrical scoop inserted along the axis of rotation through a hole plumbed with a rotary union and ball valves to maintain the at- mosphere.
RESULTS AND DISCUSSION
During coal grinding, particle microstructure affected the fracture modes which in turn affected shape and size of particles and separation of phases. Optical micrographs of polished particle cross-sections (Figure 1) illustrate the tendency for separation of organic phases in the early stages of grinding. With both lignite and MVB, fracture tended to proceed preferentially along organic-to-organic interfaces, as shown by the separate and microstructurally more uniform particles already present after the pregrind s tep and the incomplete but progressing fractures along interfaces in the particles, indicated by arrows.
Fracture a lso tended to preferentially proceed along mineral-to-organic interfaces and
* The Pacific Northwest Laboratory is operated by Battelle Memorial Institute for the Department of Energy. The research was sponsored by the Basic Energy Science, Division of Material Science, under Contract DE-AC06-76RLO 1830.
cracks and pores. This tendency is illustrated by the scanning electron micrographs of particle cross sections shown in Figure 2. In the lignite particles, cracks and pores--highlighted in the photographs by electron microscope edge effects-- were apparent in the pregrind particles but were depleted after 7 h of grinding. In the MVB particles, mineral inclusions were separated from the organic phases during grinding as shown by the presence of separate mineral particles after 7 h.
their own individual rates during subsequent grinding (3). The particles that were microstructural- ly more heterogeneous and contained more cracks and pores were rapidly ground according to the larger Set of particle size-dependent rate constants shown in Table I. The stronger particles were ground more slowly according to the set of smaller rate constants.
Distinct organic phases that were separated during the pregrind step tended to grind a t
TABLE I
-3 -1 min Breakage rate constants, Sia, (10
Were rate controlling for the first 30 min of grinding. After weaker particles were re- duced to fines, the stronger particles controlled the grinding rate.
During lignite grinding, the stronger particles contained more organic sulfur than the weaker particles, as can be seen from the particle-by-particle compositional analysis done previ- ously (4). The weaker, more porous, particles averaged 0.26% organic sulfur whereas the strong- er, less porous, particles averaged 0.46% (4). During grinding, the sulfur content of a given par- ticle size range steadily increased as the weaker particles passed through that s ize range and the stronger particles lingered (see Table II) . Thus, during grinding, sulfur-rich and sulfur-lean particle size ranges developed, depending on the grinding time.
TABLE II
Average organic sulfur content (percent) of lignite particles a s determined by particle-by-particle analysis of particle cross sections using X-ray fluorescence in a scanning electron microscope.
Particle Grinding Time, Minutes Size,- 2 _. 60 - 420
20 - 30 0.37 0.38 0.45 5 - 10 0.11 0.19 0.23
The microstructure of coal is a major factor in the s izes and shapes of particles produced during grinding. One of the best examples of the effect of microstructure on shape is the needle- like and plate-shaped particles produced from the fracture of the weaker particles during the initial stages of grinding (Figure 3). As seen in Figure 3, in the 10 to 1 5 m particle size range, many needle-like or plate-shaped particles were present after 15 min of grinding, but these particles were no longer present in this size range after 60 and 420 min. The microstructure of the stronger particles did not lead to needle-Vie or plate-shapedparticles but instead blocky and rounded parti- cles were produced throughout grinding. The stronger particles of the 20 to 30 size range did, however, become increasingly spherical during grinding, as shown by an increasing shape factor (4 x cross sectional area/perimeter squared) which would be one if the projected shape was a circle.
LIGNITE MEDIUM VOLATILE BITUMINUOUS I I I I
100pm u FIGURE 1. OPTICAL MICROGRAPHS OF POLISHED, PREGRIND PARTICLE
CROSS SECTIONS SHOWING SEPARATION OF ORGANIC PHASES DURING THE EARLY STAGES OF GRINDING. ARROWS INDICATE FRACTURE PROGRESSING ALONG INTERFACES.
LIGNITE MEDIUM VOLATILE BITUMINOUS I
PREGRIND 100 p m u 900 ,urn-
AFTER 7 hrs 100 pm- GRINDING
100 p m U
FIGURE 2. SCANNING ELECTRON MICROGRAPHS OF PARTICLE CROSS SECTIONS SHOWING THE DEPLETION OF PORES AND CRACKS AND THE SEPARATION OF MINERAL INCLUSIONS.
GRINDING TIME
15 min
60 min
420 min
FIGURE 3. OPTICAL MICROGRAPHS OF 10 TO 15 pm LIGNITE PARTICLES AFTER VARIOUS GRINDING TIMES.
The shape factor was 0.47, 0.47 and 0.62 after 15, 60 and 420 min of grinding, respectively.
CONCLUSIONS
During coal grinding, the modes and mechanisms of fracture change with time and particle Fracture tends to proceed preferentially first along organic-to-organic interfaces, then along size.
mineral-to-organic interfaces and cracks and pores: f i r s t , through the largest cracks and pores, then through gradually smaller cracks and pores a s encountered by the s t ress field. Thus, parti- cles with limited porosity and mineral inclusions a r e the stronger particles that tend to grind at lower rates.
Modeling studies indicate. that two sets of comminution rate constants a r e required to mo- del the grinding of lignite because weaker components control the rates initially and stronger com- ponents control the rates later in grinding.
These modes and mechanisms of fracture cause changes in the shape and size of particles and the separation of phases. The shapes and sizes of particles a r e first changed by fracture through organic-to-organic interfaces, then by the microstructure of the weaker phases and finally by the microstructure of the stronger phases. During lignite grinding, the weaker phases produce needle-like or plate-shaped particles that are changed to more blocky and rounded shaped particles a s particle size is decreased. The stronger phases produce blocky and rounded shaped particles that become more rounded with longer grinding times.
In both coals the organic phases a r e separated initially by the tendency for fracturing pre- ferentially through organic-to-organic interfaces. Then the stronger phases a r e ground more slow- ly than the weaker phases. The stronger phases of lignite have greater organic sulfur content than the weaker phases. Thus, there i s a stage in grinding where low-sulfur particles a r e concentrated in the fines and high-sulfur particles a r e concentrated in the larger size ranges.
Mineral phases a r e separated from the organic phases during. grinding. The exiicteni of se- paration depends on the size distrihutl~n ~f %e mineral phases and the extent of grinding.
The size and shape of particles and the separation of phases a r e important factors in mo- dern coal processes. include coal-to-liquid ratio, rheological properties of slurry, particle size distribution and mineral content. marked effect on slurry viscosity as well as the packing density of slurries, thus, it may be advan- tageous to grind a coal more extensively in some cases to produce more rounded particles. The potential for removal of mineral impurities increases with grinding time. However, the potential for removal of organic sulfur may be greater a t an intermediate stage of grinding. Thus, detailed knowledge of the coal grinding arocess can greatly increase the potential for more efficient and en- vironmentally safe ways of using coal.
For example, in producing and using coal-liquid slurries important factors
The results of this study impact all of those factors. The shapes of particles can have a
LITERATURE CITED
(1) (2)
(3)
(4)
Robinson, A. L.; "Can Physicists Clean Up Coal's Act?", Science, 213, 1484 (1981). Study Group on Research Planning for Coal Utilization and Synthetic Fuel Production, B. R. Cooper, Chairman, Rev. Mod. Phys. 53 (4, Part 2) (1981). Lytle, J. M. , Daniel, J. L. and Prisbrey, K. A . , "The Effect of Microstructure on the Size and Shape of Coal Particles During Comminution", submitted to Fuel (1983). Lytle, J. M. , Daniel, 3. L. and Tingey, G. L. , "Concentration of Sulfur and Mineral- Rich Components in Particle Classes m r i n g Coal Comminution", submitted to Fuel (1982).
GENERAL PAPERS - POSTER SESSION PRESENTED BEFORE THE DIVISION OF PETROLEUM CHEMISTRY, INC.
AMERICAN CHEMICAL SOCIETY WASHINGTON, D. C. MEETING, AUGUST 28 - SEPTEMBER 2 , 1983
RAPID DISSOLUTION OF COAL FOR ANALYSIS FOB SULFUR, IRON, AND OTHER ELEMENTS
BY
R. Markuszewski, B. C. Wheeler, andR. S. Johnson Iowa State Mining and Mineral Resources Research Institute
Iowa State University, Ames, Iowa 50011
C. C. Hach Hach Chemical Company, P.O. Box 389, Loveland, Colorado 80537
and
ABSTRACT
Most dissolution methods necessary for the determination of major, minor, and trace constituents in coal are tedious and require unusual procedures. A rapid dissolution method is based on heating 250 mg coal with 10 ml of a 4:3:3 mixture of HNO3, HClO4 (72%$, and &PO4 (85%). In numerous analyses of 8 subbituminous and bi- tuminous coals using a simple digestion apparatus, the entire sample was dissolved in 20-45 min. , leaving silica in a pure form suitable for determination by filtration, ignition, and weighing as BO,. In the clear filtrate, total sulfur was determined by a turbidimetric measure- ment of BaSO4. For the 8 coals, containing 0.41-4.20% S, the results agreed well with those obtained by using a combustion method followed by automatic iodometric titration of the SO2. In other aliquots of the same filtrate, total iron was determined speckophotometrically using FerroZine. For an iron range of 0.113-1.7628, the standard devi- ations were 0.001-0.050. The clear digest can be also used to de- termine other elements by spectrophotometric, atomic absorption, or other procedures.
GENERAL PAPERS - POSTER SESSION PRESENTED BEFORE THE DIVISION OF PETROLEUM CHEMISTRY, INC.
AMERICAN CHEMICAL SOCIETY WASHINGTON, D. C. MEETING, AUGUST 28-SEPTEMBER 2, 1983
GUM AND DEPOSIT FORMATION FROM JET TURBINE AND DIESEL FUELS
BY
F. R. MayoandB. Y. Lan SRI International, Menlo Park, California 94025
INTRODUCTION
The objective of this work is to determine the chemistry of deposit formation in hot parts
Previous work in the field has been extensive (1, 2). but a real understanding of deposit of je t turbine and diesel engines and, thus, to predict and prevent deposit formation.
formation has been elusive. Work at SRI started on the basis that deposit formation from fuels must take place stepwise and is associated with autoxidation and the hydroperoxide produced (3). More recent work (4) showed that in the absence of dissolved oxygen, higher temperatures a r e required for deposit formation. Our recent report (5) indicated that gum and deposit formation proceed mainly through oxidation products of the parent hydrocarbon, coupling of these products to dimeric, tr imeric and higher condensation products (partly or wholly by radicals from hydroperoxides) and precipitation of insoluble products. We know of no information on how these first precipitates a r e converted to the ultimate, very insoluble, carbonaceous materials that cause epglse problems.
in both pure hydrocarbons and mixed hydrscarbon fuels. Some patterns appear that can be largely explained on the basis sf what is known about co-oxidations of hydrocarbon mixtures.
The present paper describes measurements of rates sf oxidation and soluble gum formation
EXPERIMENTAL PROCEDURES
All of our hydrocarbons and fuels were distilled at about 10 torr before use. This step eliminated the highest boiling 2-5% of the fuels, but was essential to eliminate whatever gum had accumulated before the fuel was distilled. The fuels were then stored under nitrogen at -8°C until used. Some of the purchased "pure" hydrocarbons exhibited marked induction periods on oxidation, but in all such cases, chromatography through acidic alumina resulted in faster oxidations at fairly steady rates.
intervals, 7 0 G samples of gas were withdrawn and analyzed for oxygednitrogen ratio by gas chromatography on a 6 ' x 1/8" 0. D. stainless steel column packed with 13X molecular sieve and attached to a thermal conductivity detector. Soluble gum was determined by evzporating a weighed 5-mL sample of fuel in a gentle stream of nitrogen at 160°C (without spattering). The residue 6 0 . 1 mL) was then transferred with 1-2 mL of acetone to a tared aluminum dish weighing about 50 mg. This sample was then brought to constant weight (3-10 h) in a gentle stream of nitrogen in a furnace at 200°C. Weighings were made on a Perkin Elmer AD22 electromicrobalance. This me- thod gave results reproducible within 20% at low levels of gum, usually within 5% at higher levels.
Fuels A and C a r e very stable and very unstable je t turbine fuels supplied by NASA-Lewis Research Center. Fuels 1, 10, 13, 14 and 15 a r e diesel fuels supplied by the U. S. Army Fuels and Lubricants Research Laboratory.
A l l of ou r oxidations were carried out in an oil bath at 130°C, with shaking under air . At
RESULTS
Table I summarizes our work on pure hydrocarbons and several fuels; it shows that gum formation is closely associated with oxidation. Indene and N-methylpyrrole (NMP) a r e listed se- parately at the bottom of the table because they a r e special cases. The other materials a r e listed in the first column of figures according to decreasing rates of oxygen absorption under a i r at 130°C. There is a clear distinction between the pure compounds, which oxidize faster and the fuels, which oxidize slower. The second column of figures lists the same materials in order of decreasing rate of gum formation, which is nearly the same a s the order for oxidation. The figures in the last column a r e the quotients of the rates for the indicated fuels in the previous columns. This column show that the pure, fastest oxidizing compounds usually require the most oxygen to produce a milli- gram of gum, or that the fuels at the bottom of this column produce the most gum for the oxygen absorbed. The quotient i s constant with time for Fuel A ; similar information i s lacking for other fuels.
TABLE I
RATES OF OXIDATION, GUM FORMATION AND RATIOS OF OXYGEN ABSORBED TO GUM FOAMED
Table I shows that the rate of gum formation increases with the rate of oxygen absorption. Although the unstable Fuel C oxidizes and produces gum 80-100 times as fast a s stable Fuel A , the oxygen required to make a milligram of gum is the same for the two fuels.
The special cases of indene and NMP are now considered. The other compounds and fuels in Table I apparently give mostly hydroperoxides as primary oxidation products. Other products are peroxide decomposition products and small yields of condensation products (gum). However, indene (6) and probably NMP copolymerize with oxygen to give alternating polyperoxides that are nonvolatile until they decompose thermally. The rates of oxygen absorption and gum formation a r e very high and more gum is left after decomposition of the polyperoxide and, therefore, less oxygen is required to produce this gum than for any other pure compound or fuel in Table I.
Study of the data in Table I gives rise to the question: Why do all the fuels oxidize slower than all the pure compounds, even though the fuels contain mostly compounds like the models? How does me1 A differ from Fuel C? What are the important minor components in the fuels?
The classic work of Russell (7) on the co-oxidation of cumene and tetralin and the expan- sions by Mayo and coworkers (8) and Sajus (9) provide examples of rates of oxidation of hydrocar- bon mixtures. Figure 1 is a plot of Russell’s data on the rate of oxidation of cumene-tetralin mix- tures at 90°C at a constant rate of chain initiation. Although tetralin alone oxidizes faster than cu- mene alone under these conditions, 4% of tetralin significantly retards the ra te of oxidation of cu- mene. The high reactivity of pure tetralin with tetralylperoxy radicals can offset the high reactivity of tetralylperoxy radicals with each other (chain termination), but in dilute tetralin, which reacts with peroxy radicals much faster than cumene, the effect of fast chain termination predominates. Figure 1 shows that increasing proportions of tetralin may either decrease (at ~ 4 % tetralin) or in- crease (at >4% tetralin) the ra te of oxidation of a mixture that is mostly cumene.
faster) and dodecane. At the lowest concentrations of indene, rates of oxidation are lower than for either pure hydrocarbon, at least until the indene is depleted, but with 1 M indene in dodecane, the rate of oxidation is faster than for dodecane alone and approaches the rate for indene in an inert solvent. NMP has a similar effect. The curves in Figure 3 show that the oxidation of Fuel A is so slow that it is not clear whether the initial oxidation is retarded by a little NMP. But the rate of oxidation increases as more NMP is added. These results a r e qualitatively satisfying, but they cannot be treated quantitatively. The Russell treatment (6) requires a constant ra te of chain initia- tion, which is uncontrolled in our experiments. Our results do not suggest any catalytic effects of impurities or additives; as f a r as we can tell, these accelerators and retarders are consumed when they produce effects.
Several of our distilled fuels have been passed through acidic alumina to remove minor po- la r components, which have sometimes been returned to chromatographed fuel to reconstitute the original fuel. Figure 4 shows triplicate experiments with Fuel 10. The chromatographed fuel oxi- dizes faster initially than the distilled fuel (the usual situation) and the reconstituted fuel behaves
Figure 2 shows how these principles apply in mixtures of indene (which oxidizes much
like the distilled fuel. measurements (numbers a t final points on curves). There is a close parallel in Figure 4 between the oxygen absorbed and the gum found.
The data in Tables Ii and III provide a comparison of Fuel A with Fuel C. By H/C ratio, Fuel c contains more aromatic material than Fuel A. Both fuels were examined by field ionization mass spectroscopy by Dr. S. E. Buttrill, Jr. and Mr. G. A. St. John, with the results shown in Table m. The instrument used could not distinguish between parafftns and akylnaphthalenes, but to be consistent with the differences in H/C ratios in Table II, Fuel C must he higher in alkylnaph- thalenes.
Figure 4 shows the reproducibility of both the oxygen absorption and gum
TABLE II
ANALYSES OF FUELS
% %C %H %N %S H/C
Fuel A 86.4 13.3 CO.02 <0.02 <0.36 1.83 Gum from A +NMP 68.0 5.9 6 . 2 19.9 0 + S 1.03 NMP, calc 74.3 7 . 1 17.3 0 0 1.40
- - - -
Fuel C 87.6 11.9 ~ 0 . 0 2 0.03 <0.19 1 .63
TABLE III
CLASSES OF HYDROCARBONS BY MOLE % IN FUELS A AND C
Hydrocarbon Akanes Ring or C=C Indanes , 1 2 3 phR Tetralina Class- ___ - - - __ ~
lax2 A 20 .0 16.9 15.7 5 . 0 28.3 14.1 Fuel C 45.4 10.3 6 .9 2.9 19.3 15.2
_. 'n
151 159
Table IV l ists analyses of polar concentrates from three fuels. The polar concentrates contain more oxygen, nitrogen and sulfur than Fuels A and C and two of them a r e especially high in oxygen, suggesting that the fuels had undergone some oxidation before they reached us. The polar components of Fuels 10 and 13 were also analyzed by gas chromatography/mass spectroscopy. The Fuel 10 residues were rich in fluorene and phenanthracene/anthracene and their alkyl derivatives. Fuel 13 contained a wider range of products, in which carbazole and alkylcarbazoles were identified.
Our present working hypothesis is that deposits on hot engine parts come mostly from so- luble gum formed on storage but maybe partly during heating of the fuel in the engine. The com- pounds that copolymerize with oxygen to give polyperoxides require the least oxygen to give a milli- gram of gum, but among other pure hydrocarbons and fuels, the rates of gum formation and oxygen absorption decrease together. It appears that the coupling of fuels and their primary oxidation pro- ducts to form products of higher molecular weight, soluble gum and deposits is a small part of the chain termination reaction in which some of the free radicals that a r e involved in oxidation couple (terminate) instead of propagating. The faster the oxidation, the more coupling occurs. The de- pendence of ra te of oxidation on rate constants for initiation, propagation and termination is ex- pressed by the well known equation,
0.25
0.20
z 0.15
I- 0 3 - X 0
8 0.10
G w
a
0.05
0 100 80 60 40 20 0
Mole% Cumene
0 20 40 60 Mole% Tetralin
80 100
JA-2115-18
FIGURE 1 COOXIDATION OF CUMENE AND TETRALIN WITH 0.02 M t-Bu02BZ AT 90°C Data of G. A. Russell (ref. 6)
=i - n m w (r
E a m
z w U > X 0
120
80
40
0
I
Neat n-Dodecane 13.25 gum a t 8.2 hr
0 4 8 12 16 OXIDATION TIME (hours)
JA-2115-16A
FIGURE 2 OXIDATIONS OF n-DODECANE WITH INDENE AND NMP AT 13OoC
Gum i s in mg/100 g fuel, determined a t 100°C except when marked for 2OO0C.
100
90
80
70
60
50
40
30
20
10
0
I To 219 pmole oxygen a t 2.3 hr 1539mg gum/100 g fuel
Mg gum/100 g fu Neat NMP No ppt.
-
0 10 20 30 40 50 60 70 OXIDATION TIME (hours!
JA-2115-22
FIGURE 3 OXIDATION OF FUEL A AND NMP AT 130°C
A 54.91
Gum is in mg/100 g fuel
A 51.85 40.03
3 Precipitates I
0
Reconstituted \\ 0
0 Chromatographed
I A
A
0
I
A
b
3 Precipitates
I ‘a
32.54 26.30,
35.95 o 25.94
29.24 0 A
a
Ir A 25.78 t Distilled
0 0 40 80 120 160 200
OXIDATION TIME (hours) JA-1924-16
FIGURE 4 OXIDATION OF FUEL 10 IN AIR AT 130°C
For fuels that contain mostly paraffins, naphthenes and alkylbenzenes, the kps should be quite similar. We think that is the most susceptible of the three constants to the effect of other fuel components, which may explain why nearly all the fuels oxidize and produce gum slower than the pure hydrocarbons. Although ki can be affected moderately by minor components, any effect on in- creasing the rate of peroxide decomposition will be offset by a decrease in the steady state concen- tration of peroxides. It is known that polynuclear aromatic hydrocarbons and their alkyl derivatives a r e very reactive toward peroxy radicals and that their chain termination constants in oxidation vary over a wide range (lo).
of a radical condensation mechanism a r e lacking, it appears to us now that the most fruitful ap- proach to understanding and reducing gum and deposit formation in fuels is through the effects of condensed aromatic and heterocyclic compounds on the rates of oxidation of fuels.
Other factors that appear to be critical in gum and deposit formation a r e the effects of ox- ygen concentration and metals and the mechanism by which soluble gum evolves into insoluble de- posits. Ourconclusions based on oxidation at 130°C should eventually be confirmed by tests a t storage temperatures, although the relative stabilities of fuels appear not to change much hetween 40 and 150°C (11).
Although a non-radical condensation mechanism has not been excluded and although details
ACKNOWLEDGMENT
This research was supported by the U. S. Army Research Office and NASA-Lewis Re- search Center.
LITERATURE CITED
Nixon, A. C . , Chapter 17 in Autoxidation and Antioxidants, W. 0. Lundberg, ed., Wiley Interscience, NY (1962). CRC Literature Survey on the Thermal Oxidation Stability of Jet Fuel, Report No. 509 of Coordinating Research Council, Inc. , Atlanta (1979). Mayo, F. R. , Rlchardson, H. and Mayorga, G. D., PREPRINTS, Div. of Petrol. Chem., ACS, (l), 33 (1975).
Mayo, F. R . , Buttrill, S. E. , Jr., Lan, B. , St. John, G. A. and Dulin, D., Preprints, Div. of Fuel Chem. , 21 (2), 76 (1982). Russell, G. A . , J. Amer. Chem. Soc., E, 1035, 1041 (1956). Ibid., E, 4583 (1955). Mayo, F. R. , Syz, M. G . , Mill, T. andcastleman, J. K., Adv. Chem. Series, 5, 38 (1968). Sajus, L., Adv. Chem. Series, 75, 59 (1968). Huntington, J. G . , Mayo, F. R. and Kirschen, N. A. , Fuel, g, 31 (1979). Stavinoha, L. L. , Westbrook, S. R. and Brinkman, D. W. , DOE/BC/10043-12 (1980).
(2), pg. 71.
GENERAL PAPERS - POSTER SESSION PRESENTED BEFORE THE DIVISION OF PETROLEUM CHEMISTRY, INC.
AMF,RICAN CHEMICAL SOCIETY WASHINGTON, D.C. MEETING, AUGUST 28 - SEPTEMBER 2, 1983
FT-IR MEASUREMENTS OF ALIPHATIC AND AROMATIC C-H GROUPS IN COAL
BY
B. Riesser, M. Starsinic, A. Davis, and P. C. Painter College of Earth and Mineral Sciences
The Pennsylvania State University, University Park, Pennsylvania 16802
ABSTRACT
The experimental difficulties involved in the study of coal structure are both notorious and well-documented. Nevertheless, recent improvements in spectroscopic instrumentation have al- lowed the determination of what are thought to be reasonably a e curate parameters describing an average coal structure. For example, Fourier transform infrared spectroscopy (FT-IR) has been applied to the determination of aromatic and aliphatic hydro- gen. Unlike measurements of aromaticity by NMR, hoWev.or, hi- frared methwk rely ori caiibrating the intensities of specific bands to the concentration of the appropriate functional groups, using model compounds or other procedures. We have recently found that the values obtained depend heavily on the choice of bands and the methodology employed. In addition, the calibration coefficients vary considerably with rank. We will discuss the various ap- proaches we have employed and the e r rors involved in each. Our results indicate that the best that can be achieved is the definition of a band of values of aromatic and aliphatic hydrogen.
GENERAL PAPERS - POSTER SESSION
AMERICAN CHEMICAL WCIETY WASHINGTON, D. C. MEETING, AUGUST 28-SEPTEMBER 2 , 1983
PRESENTED BEFORE THE DIVISION OF PETROLEUM CHEMISTRY, INC.
SULFUR COMWNENTS ANALYSIS I N HYDROCARBON MATRM BY GAS CHROMATOGRAPHY
BY
0. PUZiC Esso Chemical Canada, P. 0. Box 3004, Sarnia, Ontario, Canada N7T 7M5
INTRODUCTION
Determination of low concentrations of sulfur-containing gases has received considerable attention in recent years (1-6). The need i s particularly acute in the petroleum industry, since the trace amounts of sulfur compounds cause corrosion and poison cataiysts. Because of their reac- tivity and labile nature, a s well a s diversity of stream composition, determination of sulfur com- ponents in hydrocarbon matrix i s a complex and intricate task. This paper presents a method for GC analysis of trace levels (0-200 ppm) of sulfur compounds in gaseous hydrocarbon streams.
EXPERIMENTAL
'Chromatography
Flame Ionization Detector (FPD and FID, respectively) and Vista 401 Dual Channel Data System was employed. Material used for sample transfer lines, 1 cc gas sample loop and the column was high grade, acetone-washed nickel. The gas sample was introduced onto the column via a six port teflon Valco valve. Two certified standard gas blends, compressed in an aluminum gas cylinder from Scott Specialty Gases, were used a s calibration gases. Standard 1 contained: hydrogen sul- fide, methyl mercaptan, ethyl mercaptan, dimethyl sulfide and dimethyl disulfide in nitrogen ma- trix. Standard 2 contained: dimethyl sulfide, methyl ethyl sulfide, diethyl sulfide and diethyl di- sulfide in nitrogen matrix. The concentration of each component was certified within 2 2%. Ultra high purity He was used for the ca r r i e r gas and high purity hydrogen and a i r for the flame gases in the two detectors. The optimal flow rates for the flame photometric detector fuel gases were found to be: H2, 142 ml/min; a i r #1, 80 ml/min; air #2, 170 mI/min. In the f i rs t flame, decomposition of the sample takes place. Combustion products from sulfur-containing compounds wlll produce op- tical emission in the second flame from the S radicals formed. The Varian flame photometric de- tector employs a filter with maximum optical2transmission at 365 nm for sulfur detection. For the flame ionization detector, the fuel gas flow rates were: H2, 30 ml/min; and a i r , 300 ml/min. The car r ie r gas flow ra te was 26 ml/min.
composition and the hydrocarbon concentration. various sulfur species a s well a s resolution between hydrocarbons and sulfur compounds such as H2S, C1 and C2 mercaptans, sulfides and disulfides was achieved using a 6 ' x 1/8" acetone-washed nickel column packed with oxi-propionitrile/Porasil C - Durapak 80-100 mesh. However, when analyzing H2S in propylene rich streams (propylene concentration greater than loo/o), there is no longer a baseline separation between H2S and propylene with this column. A phenomenon referred to as "quenching effect" takes place in the detector, whereby the decrease in sulfur response is ap- parently due to inactivation of the excited S2 species by its combination or collision with a hydrocar- bon and its degradation products (5, 7). Silicone, QF-1 (5%) on Porapak QS column packing materi- al will provide the necessary separation in the H2S region when high propylene concentration is ex- pected (6).
An effluent splitter (ratio 50550) i s placed on the outlet of the column to send identical gas streams to the FPD and the FID, thereby allowing detection of components on both detectors simul- taneously. The temperature programming profile suitable for most applications was: initial tem- perature, 70'C; final temperature, 100°C; hold, 45 min. ; ra te 10'C/min. Retention times for vari- ous sulfur compounds obtained using the chromatographic conditions described above a r e presented in Table I.
Calibration and Analysis For quantitative analysis of Sulfur species, an external standard method was used for Cali-
bration. After the sample loop had been purged with the calibration gas for several minutes, the sample of calibration gas was injected, at atmospheric pressure, by means of a six-port injection
Varian Model 3700 Gas Chromatograph equipped with a Dual Flame Photometric and a
The type of column packing material used for trace sulfur analysis depends on the stream For most applications, a complete separation of
valve. The temperature program and data aquisition were then activated simultaneously. calibration run was completed the response factors were generated or updated (8).
Providing that the flow rates of the fuel gases to the flame photometric detector have not changed; there should be no need for frequent recalibration. However, the calibration blend i s analyzed daily to assure optimal performance of the system. Following calibration, a hydrocarbon sample from a high pressure gas cylinder is purged through the sample loop and injected in the same manner. Figure 1 presents a typical chromatogram for sulfur analysis in a hydrocarbon ma- trix.
Precision data for 10 replicate runs of the two calibration blends is presented in Table II.
TABLE U
Retention Compound Level (ppml Std. Dev. Time (min.1 Std. Sev.
bon s t reams it was observed that the light sulfur compounds (namely hydrogen sulfide and methyl mercaptan) were being depleted in the standard high pressure sampling cylinders.
Figure 2 presents the r a t e of H2S depletion in standard 2250-m1 stainless steel sampling cylinders (Cyls. No. 1 to 3). The cylinders were filled with Matheson certified standard containing 230 ppm H2S in nitrogen. Within four minutes, 70% of the sulfur content was lost (cylinder No. 1). After 20 minutes no H2S could be detected in the sample cylinder. Cylinder No. 1A is actually cy- linder No. 1 that was steam cleaned, dried under house vacuum and refilled with the Matheson standard. A similar sulfur loss was confirmed by the Dohrman Sulfur Analyzer.
to determine ifthe hydrocarbon matrix affects the ra te of sulfur loss. A s illustrated in Figure 3 (curve I), the concentration of H2S decreased 50% in less than 10 minutes. The same cylinder was flushed with helium, evacuated on a high vacuum line and refilled with the same amount of H2S in ethylene. Although the number of active si tes on the inner walls had been reduced, the passivation in this manner did not eliminate the problem entirely (curve U). After the initial drop in sulfur con- centration, the rate of loss had reduced. Eventually, sulfur was lost completely overnight.
filled with 290 ppm H2S in ethylene (Figure 4).
During the course of the quantitative GC analysis of sulfur compounds in gaseous hydrocar-
In another experiment, a clean sampling cylinder was filled with 290 ppm of H2S in ethylene
The same cylinder used in the above experiment was emptied but not cleaned and again re-
\
c
.P
n
L
Figure 2. HYDROGEN SULFIDE IN NITROGEN MATRIX
Figure 1 c-
, s t m
FID. r e sponse n
n l n . - . A
c y 1 in- Cylinder cylinder Cylinder No. 1 No. 2 MI. a No. 1 A * + A a
If29 @Pa) 800
Tim bin.)
~i~~~~ 3. HYDROGEN SULFIDE IN HYDROCARBON MATRIX
I I1
* +
Tim hin .1
Figure 4. EFFECT OF MOISTURE
CnUmER A
A
Figure 5. TEFLON-GRAPHITE COATING
figure6. METHYL MERCAPTAN IN HYDROCARBON MATRIX
Presumably, the walls of the sample cylinder were further passivated, and the sulfur de- pletion rate was very low. After about 4 hours at a sulfur concentration of 210 ppm, the sample was transferred to a cylinder (passivated in the same manner) that contained 0.2 ml of water. A sudden drop in sulfur content (curve A ) i l lustrates the high solubility of H S in water according to the re- action:
2
H2S + H20 -j H30+ + HS-
Provided a moisture-free environment i s assured, adsorption on the metal walls appears
In an attempt to contain light sulfur compounds, a 2250 ml gas sample cylinder was lined to be the predominant cause for the decrease in sulfur concentration.
with 0.0005 inch of teflon-graphlte where the coating was baked onto the metal surface. The cylin- der was tested with the same H2S in ethylene mixture as in previous experiments (Figure 5). There was no apparent decrease in H2S concentration over a period of 48 hours.
Figure 6 presents the comparative study of the two types of sample cylinders, i.e. , teflon- graphite coated and regular (stainless steel) when methyl mercaptan is present In the hydrocarbon environment (ethylene matrix). Rapid oxidation of methyl mercaptan to dimethyl disulfide, reaction probably being catalized by the m tal surface, as well as depletion on the walls i s evident in the "regular" cylinder. However, in the teflon-graphite coated cylinder, the reaction did not take place and mercaptan content was unchanged over the t ime period indicated.
DISCUSSION
The unique and reactive properties associated with sulfur gases have presented difficult obstacles in attempts to contain low levels of these gases in high pressure cylinders (9, 10). Many factors a r e responsible for the apparent loss of sulfur content in the standard sample cylinders, such as , among others: . Chemical reaction with, or promoted by, water molecules.
. Adsorption and/or reaction on the walls of the sampling cylinders.
. Oxidatinn nf merc~pi~cs tc diszlfidcs. The results of this study indicate that gas mixtures containing low concentrations of sulfur
compounds can exhibit stability if proper cylinder material and cylinder treatment techniques are used. Further evaluation of the teflon-graphite coated cylinders for their suitability in sampling of su l fur containing gases in various plant s t reams i s under way. In addition, long term experience is being gathered.
LITERATURE CITED
Ferguson, D. A. and Luke, L. A . , Chromatographia, 12, 197 (1979). Patterson, P. L . , Anal. Chem., 2, 345 (1978). Feeney, M . , DeCood, J. and Warren, E., Pittsburgh Conf., Abstracts, No. 350 (1982). McGaughey, J. F. and Gangwal, S. K., Anal. Chem., 52, 2079 (1980). Fanvell, S. 0. and Gluck, S. J . , Anal. Chem., 51, 609 (1979). Pearson, C. D. and Hines, W. J., Anal. Chem., e, 123 (1977). Fredriksson, S. A. and Cedergren, A . , Anal. Chem., 53, 614 (1981). Vista 401 Chroatography Data System Operators Manual, Varian (1980). Kramer, F. J. and Wechter, S. G . , J. Chrom. Sci., 3, 674 (1980). Shultz, J. F., Karn, F. S. and Anderson, R. B., Ind. Eng. Chem., 54, 44 (1972).
GENERAL PAPERS - POSTER SESSION PRESENTED BEFORE THE DMSION O F PETROLEUM CHEMISTRY, INC.
AMERICAN CHEMICAL SOCIETY WASHINGTON, D. C. MEETING, AUGUST 28-SEPTEMBER 2, 1983
AN ANALYTICAL MODEL OF COMBUSTION OF SPENT OIL SHALE BLOCKS: THE MODEL AND EXPERIMENTS
BY
M-D. Ho, E. M. Suuberga and H. L. Toor Department of Chemical Engineering, Carnegie-Mellon University, Pittsburgh, PeMSylVanh 15213
INTRODUCTION
Oil shale, a potential source of liquid fuel, is a fine-grained, sedimentary rock composed of both organic and inorganic solid compounds. The production of liquid fuel from oil shale requires the retorting of the shale, in which oil and gas a r e destructively distilled from the shale rock, leaving behind a highly carbonaceous char within the spent shale matrix. The amount of char left depends on the richness of the raw shale. Typically, 23% by weight of the organic material origin- ally present in the shale i s left a s char (1).
retorting of the shale (2). behavior of spent shale (2-8). Although char in shale is not pure carbon, most studies have treated it as carbon with reasonable success.
In the combustion of spent oil shale in an environment of a i r with other inert gases, there are three active components to be considered, 02, CO and CO and four major chemical reactions (9 , l o ) , namely:
Combustion of this char could potentially provide all o r part of the heat requirement for There have recently been several studies dealing with the combustion
2 . Direct oxidation of the residual char. a process which is limited by the diffusion of oxy- . .
gen and which creates an "unburned core".
0 + (l+P)C -> 2pco + (l-P)CO,
co + 1/202 -> co
2
Oxidation of CO
2
. CO -C gasification reaction 2
co + c ->2co 2
b . Carbonate decomposition reactions
MgCa(C0 ) -> MgO + CaCO + CO and CaCO -> CaO + CO or 3 2 3 2 3 2
n CaCO + m Si0 -> Ca Si 0 + n CO 3 2 n m m+n 2
Reaction 1
Reaction 2
Reaction 3
Reaction 4
Therefore, the combustion of spent shale consists of two competing schemes: one is the direct oxidation of char; the other is the gasification of the char by C02 released from the carbon- ate decomposition reactions.
There have been several modeling studies of the combustion of spent shale in the presence of oxygen and nitrogen (2-7) which used the classical shrinking core model. This model assumes that the reaction ra te is limited only by the internal diffusion of oxygen; hence, it neglects the other reactions (2, 3 and 4) which may play a major role a t elevated temperature (above 875'K).
Mallon and Braun (7, 11) have included the decomposition and gasification reactions (3 and 4) in their model, but they treated the gasification reaction and the direct oxidation reaction inde- pendently and then superposed the two results. This approximation was inaccurate. Braun et al.
a. Present address: Division of Engineering, Brown University, Providence, Rhode Island 02912. b. For the detail and kinetics of this reaction, see Manor et a1 (8).
(2) modeled gasification of spent oil shale blocks by steam and C02 but did not consider oxidation reactions. Their solution scheme involved solving differential equations numerically.
Our previous publication (Manor et al. (8)) offered a model which successfully predicted thecombustion behavior of shale in nitrogen diluted a i r , but that model also required the numerical solution of differential equations.
The model that we present here is an improvement over the model of Manor et al. The major advantage of the new model l i es in the simplicity of the closed form result which eliminates the necessity of cumbersome numerical solution of the differential equations. Our new model thus allows more convenient use of the single particle (or block) combustion model in the modeling of packed bed retorts. Experiments similar t o those car r ied out earlier were used to extend the data.
DEVELOPMENT O F THE MODEL
Consider the burning sample shown schematically in Figure 1. We will use the assump-
1. Mass transfer processes may be treated a s pseudo-steady. 2. Only radial transport in a cylinder is considered. 3. Temperature is spatially uniform. 4. No significant pressure gradient exists within the shale. 5. The reaction of char with oxygen is fast enough to be lumped at the surface of the
6. The gasification Reaction 3 occurs uniformly within the unburned core. 7. Carbonates decompose uniformly throughout the shale. 8. The bulk flow of all species out ot the shale i s dominated by the release of carbon diox-
9. Fick's law holds for each component and al l effective diffusivities a r e equal. An additional assumption that allows the model to be treated analyticz!!;. is t k t the uxida-
tions that were employed by Manor et al. (8).
unburned core.
ide from the decomposition of carbonates.
tion reaction of cnrhnr? rr.sc--ide is iiisisncaneousd.
Transport Model The formal statement of assumption 8 is:
N = R p-'/Zrr) = R r/2 = G L y t 4 4
where
L = C D /Is
2 G = R r /(2 De C) 4 s
y = r/r
and where rs i s the radius of the cylinder. Other symbols a r e defined in the table of nomenclature. The formal statement of assumption 9 is:
Ni = -C De dXi/dr + X i Nt o r N. = -L dX./dy + X. G L y. i = CO, COz. o2 2)
The species conservation equation for each component can be written as:
1/r d/dr (r Ni) =&.. A. 3) 11 1
w h e r e v . is the stoichiometric coefficient of component i with respect to Rj. At the surface of the cylindrical sample (r=rs or y=l ) , external mass transfer resistance is taken into account by speci- fying:
a. The measured CO/C02 ratio at the surface of the shale never exceeded 20% in the ignition stage and then declined very rapidly to a negligible value, therefore, weassume allCO is burned to CO very quickly in the presence of oxygen. See also Manor et al. (E) for more detail.
2
where Q is the molar flow rate of sweeping gas pe r unit surface area of the sample. The new cor- rection term, 12 Q/(K, + Z Q ) ~ , is used to take into account the change in sweeping gas compositions due to the mass transfer to and from the sample. When the gas flow rate i s very large, the correc- tion term reduces to unity and i s not required.
Define a pseudo-component concentration:
I t follows from Equation 3 and the stoichiometry of the reactions that
l/r d/dr (r N, ) = R 4 1
5)
The substitution of Equation 2 into Equation 5 yields:
6) 2
l / Y d/dy (-Y (dXl/dy) + X1 G Y ) = G
subject to the boundary conditions that, a t the center of the sample, the flux is zero and at the sur- face of the sample, Equation 4 holds for pseudo-component 1.
Thus, Equation 6 can be solved to give:
which eliminates one unknown.
the unburned core region and the product of shell layer. For the sake of convenience, we shall f i r s t consider the two regions of shale separately:
Core Reaction Model The core reaction model i s similar to the one in Manor et al. ( S ) , i t is rederived here for
the convenience of the reader. Within the unburned core section, the conservation equation for CO can be written as:
8) 3 l/r d/dr (r NCo) = 2 R
with boundary conditions:
c ' xco=xco, c r = 0, dXCO/dr = 0; r=r
where rc i s the radius of the edge of the unburned core. Assumption 6 allows R3 to be treated as position independent. core. Therefore, Equation 8 can be integrated to give:
I ts value is evaluted at the average concentrations of reactants within the
2 2 = (xco,c - B) exp[(y -Yc ) G/21 + xco
where
B = 2 R / R = R (4GL/r ) 3 4 3
Note that X = X1 - 1/2Xco in the core region, since X = 0 and the average mole fractions are: co2 O2
91
where
x c o 2 . c = - %o, c
It is assumed that C20-C gasificztion proceeds at a ra te given by the equation suggested by Ergun (13)
3 Ka a, 3 1 +<Xco> /Kex<X >
R = (gmole/cm sec)
c02
7 2 -1 where K a = 4.5 x 10 (as suggested by Campbell and Burnham (9)). Cc is the molar concentration of char(gmole/cm3) and Kex = 138 exp(-7,500/T) ( fmm Ergun and Menster (14)).
exp(-24,500/T) + 3.75 x 10 exp(-16,000/T) sec
Shell Transport and Reaction Model
pseudo-component X2, where In order to eliminate reaction te rms in the conservation equation, let us again create a
X = X - 1/2 Xco, N, 5 Y"
2 2 oi
If follows that in the shell region,
l/r d/dr (r Nx ) = 0 2
and with Equation 2 and dimensionless variables,
2 l /y d/dy [-Y (dX2/dy) + X2 G Y 1 = 0
Equations 12 and 13 can he integrated to give
YN, = M 2
and
where:
and M is an integration constant. A t y= l , Equation 4 is used as the other boundary condition.
follows that the coexistence of carbon monoxide and oxygen is not allowed and the flame front at which al l the oxidation reactions occur is assumed to be infinitely thin.
a t r>rc), i. e. , case 2.
Since we have assumed that the oxidation reaction of carbon monoxide is instantaneous, it
The flame front occurs either a t the core surface, case 1, o r out of the core surface (i. e. ,
Case 1: Flame Front a t the Core Surface
carbon monoxide produced in the core and by the direct oxidation of char, i. e. , In this case, oxygen flux to the core surface will be consumed both by the reaction with
-N = (R1 + R3) rc/2 0 2 ' C
where
R1=K C X 1 c 0 2 ' C
7 -1 and the value Of K1 is provided by Sohn and Kim (10) as 1.503 x 10 exp(-11102/T) sec Manor et al. (8) . K1 was assumed to be infinitely large.)
to be zero, which requires
. (In
c0,c and NCO,C Since oxygen i s present a t the core surface in this case, we can assume X
X2, = Xo2, and M=y N c 02.c.
where
Case 2: Flame Front Out of Core Surface In case 2, the flame front is being pushed outward by carbon monoxide, so oxygen cannot
reach the core surface and X Note that since 'Ic
must be less than zero, since X = 1/2 Sco,c 2.c
a mass balance around the core surface gives:
NCO,c = R3 rc
Using Equations 14 and 17, we can get
2 M = -R3 rs yc /2
Equations 15 and 18 allow us to compute the value of X as: 2.c
2 R3((Kx+2Q)/2Q + (G + KX/U F(l.Yc) aP(G/2))
19) 2
(G L + Kx) exp(G/2 ( l -Yc )) xco ,c=-2x2 ,c -
Model Solution Note that in the core region, if we substitute Equations 9 and 10 into Equation 11, R, can
be solved as a function of X C ~ , ~ , while in the reacted shell region Xco or can be obtained from Equation 19 as a function of R3 in case 2. Simultaneous solution of these two regions gives the following equation:
is either zero in cxse 1,
where
and
or
or
R =[ (K K K 2-2K K K K 2+(K K )2-2K K (K K +K )+4K K K K +K 2, 3 J 3 5 e x 3 4 5 a 4 e x 2 e x 3 5 4 1 4 5 e x 2
+ K -K K K -K K ]/(4K1-4K K ) 2 3 5 e x 4 e x 3 e x
Thus, R3 can be obtained from Equation 20 and all the other quantities desired, such a s
N 02'S
(the oxygen consumption rate) and dy /dt (the rate of shrinkage of the core) can be calculated in a straightforward fashion. A tr ial and'error calculation procedure is used to determine whether case 1 or case 2 is true. This model is then integrated numerically only over time, with the reaction rates and temperature recalculated at each t ime step.
PHYSICAL PROPERTIE
In the model calculation, the temperature is calculated from
ps cp (dTs/dt) = h S AT + 2Ri4Hi
where the heat capacity is:
2 C = 0.72 + 7.7 x T /(T + 300) J/gm-K
P s s
and the heat transfer coefficient a is:
-6 2 h = 9.76x10-~ + 2.48 x 10 (Ts - 755) W/cm K
The temperature difference AT in the heat loss te rm is actually measured i n our experiments, it usually maintains a constant value throughout an experiment due to the configuration of the reactor.
tive diffusivity of spent oil shale as: A general correlation based on a random pore model (15) allows us to estimate the effec-
2 0 , a i r D = E D
2
where E is the porosity and
, a i r 2
is the buut binary diffusivity of oxygen in air . No te that there a r e no adjustable parameters in the above equation. This approach is a modification of that used by Manor et al.
For the purpose of prediction, porosity, char concentration and shale grade can be conven- iently estimated from shale density using correlations i n the l i terature (16, 17).
Smith provided a theoretical relationship between density and oil yield for oil shale (17) and he supported his prediction with experimental results. The correlation was found to be very good in our experiments.
(1) and his result can be correlated as follows: The data on the carbonaceous char contents of spent shales was gathered by Stanfield et al.
, where Wc i s the char density as percentage of the raw shale density (not weight fraction of the spent shale, as DocMer and Turner stated) and A is the shale grade in l i ters of oil per ton. The initial porosity of the spent shale retorted to 750°K can also be estimated with Tisot's data which is cor- related by DocMer and Turner (5):
E =0.111+ 1.55 A + 1.23 x loq5 A~
EXPERIMENTAL VERIFICATION .
The analytical model gives results very close to the numerical model of Manor et al. , which agreed reasonably well with the experimental data reported earlier. In addition, a number of new experiments were car r ied out to further tes t the validity and applicable range of the model. The experimental conditions used were similar to the earlier one (8). Colorado oil shales were machined into cylinders and retorted in a furnace in nitrogen to a maximum temperature of 750°K. The combustion was then initiated by switching the sweep gas fromnitrogen to air or nitrogen dilu- ted air . Heat transfer to and from the furnace wall was minimized by controlling the furnace wall to within two "K of the shale surface temperature.
The effects of shale grades (from 40 to 229 li terhon), cylinder sizes (from 1 cm to 10 cm
a: The heat transfer coefficient sometimes has been adjusted to account for non-ideal temperature distribution in the furnace during rapid temperature rise.
in diameter) and feed gas oxygen concentration (from 5% to 21%) were examined. It was found that this model adequately accounts for these effects in the testing range. Shown in Figure 2 is the com- parison of experimental and model prediction of average temperatures and dimensionless reaction rates of rich shale cylinders (208 liter/ton) of two different sizes (3.5 cm, and 9.3 cm in diameter) in 13.5% oxygen plotted against dimensionless time. A 5 c m sample from the same piece of rock was also tested against the model with s imi la r success but the result was excluded from the figure to avoid crowding. It can be seen from FLgure 2 that the two different size samples give very simi- lar curves on a dimensionless t ime scale (the 5 c m sample gave similar curves), but other grades of shale do not scale this way.
B!SO been used and the model also predicted the combustion behavior successfully. In Table I , we compare measured and predicted total burn out times for these samples.
Various sizes (1 cm. 2.4 CZL, 5 . i c m and 9.7 cm diameters) of 104 liter/ton shale have
TABLE I
BURN OUT TIXE FOR XEDiUIVf GRADE SHALE' (104 LITER/TON) OF FOUR DIFFERENT SIZES: EXPERIMENTS AND MODEL PREDICTION
Shale Burn Out Time Expt. No. Diameter '2% Expt. Model
55 9.7 c m 21% 660 min. 670 min. 65 5 .1 c m 15% 340 min. 330 min. 67 3 .4 cm 15% 160 min. 163 min. 69 1 . 0 cm 15% 20 min. 22 min.
a. Important parameters used are: Initial porosity = 308, carbon density = 0.06 gm/cm3, spent shale density = 1.87 gm/cm3.
CONCLUSION
An analytical model satisfactorily predicts the combustion behavior of spent oil shale blocks. The only additional assumption besides those employed by Manor et al. (8) is that the oxi- dation reaction of carbon monoxide is instantaneous.
ACKNOWLEDGMENTS
We wish to thank Occidental Petroleum Corporation and Rio Blanco Oil Shale Company for supplying the oil shale used in this work.
NOMENCLATURE
A shale grade, liter/ton B
C
constant defined a s 2R3/R4, dimensionless
molar concentration in gas phase, gmole/cm molar concentration of char in shale, gmole/cm
constants, defined below Equation 20
heat capacity of the sha le , J/gm-K
effective diffusivity of gases in the shale, cm2/sec
3 3
cC
'i
Cp
De
G constant=R r /2CDe, dimensionless
h
Ki
Kx mass transfer coefficient, gmole/sec-cm L constant=CD /r gmole/sec-cm'
e s'
2 4 s
2 heat transfer coefficient, W/cm K constants, defined below Equation 20
2
net molar flux anywhere within the sample, gmole/sec-cm 2 Nt
Ni
Q
R2
R3
R4
r r
S
TS
.AT
wC
AHj
X.
<x > i
Y
E
C f i
S
molar flux of any species i , gmole/sec-cm2
the molar feed r a t e of gas per unit surface a rea of the sample molar rate of the direct oxidation of char, gmole/sec-cm3
molar rate of the oxidation reaction of CO, gmole/sec-cm
molar rate of co -C gasification reaction, gmole/sec-cm
molar rate of release of CO from carbonate decomposition reactions, gmole/sec-cm’ 2
radial position within shale sample, cm the radius of the shale sample, cm
surface a rea of sample per unit volume, cm-l shale temperature, K
temperature difference between the shale and the sweeping gas heat of reaction j , J/gm-K
weight fraction of carbonaceous char in raw shale, dimensionless
mole fraction of any species i, i=CO, 02, CO , dimensionless
average mole fraction of species i in the core region, i=C02, CO, dimensionless
=r/rs. normalized radial position within sample, dimensionless
porosity, dimensionless
3
3 2
2
SUBSCRIPTS
value at the core edge value in the feed stream CO, O2 or C02
value at the shale surface
h I
A I
+ 0 V
A I
E
a n +
I '
i
N
LITERATURE CITED
Stanfield, K. E . , Frost , I. E . , Mcauley, W. S. andsmith, W. S., "Propertiesof Colorado Oil Shale", U. S. Bureau of Mines, R I 4825 (1951). B c k t e r , L . , "Combustion of Oil-Shale Carbon Residue", AICHE Symp. Series, Vol. 72, No. 155 , p. 24 (1975). Huang, E. T. S. , "Retorting of Single Oil-Shale Blocks with Nitrogen and Air", SPE Journal, p. 331 (October 1977). Thomson, W. J. and Soni, Y., "Oxidation of Oil Shale Char", In Situ, Vol. 4, No. 1, p. 61 (1980). Bck te r , L. and Turner, T. F. , "Combustion Rates for Oil Shale Carbonaceous Residue", InSitu, Vol. 2 , No. 3, p. 197 (1978). Duvall, J. J. and Tyner, C. E. , "Laboratory and Modeling Studies of the Combustion Retorting of Large Clocks of Oil Shale", Tech. report , Sandia Laborator-ies (1979). Mallon, R. and Braun, R. , "Reactivity of Oil Shale Carbonaceous Residue with Oxygen and Carbon Dioxide", Quarterly of the Colorado School of Mines, Vol. 71, No. 4, Proceedings of the 9th Oil Shale Symp. (1976). Manor, Y., Suuberg, E. M. , Ho, M. andToor, H. L . , "TheIgnitionandCombustion Behavior of Spent Shale Particles", in 19th Interntl. Symp. on Combustion, The Combus- tion Institute, Pittsburgh, PA, p. 1093 (1982). Campbell, J. H. and Brunham, A. K. , "Reaction Kinetics for Modeling Oil Shale Retor- ting", In Situ, Vol. 4, No. l(1980). Sohn, H. Y. and Kim, S. K. , "Intrinsic Kinetics of the Reaction between Oxygen and Car- bonaceous Residue in Retorted Oil Shale", Ind. Eng. Chem., Process Design and Develop- ment, Vol. 19, No. 4, p. 550 (1980). Braun, R . L. , "Mathematim! Node!!ng cf XodSed io-Siiu and Aboveground Oil Shale Re- torting", Tech. report UCRL-53119, Lawrence Livermore Laboratory (1981). Braun, R. L. , Mallon, R . G. and Sohn, H. Y. , "Analysis of Multiple Gas-Solid Reactions during the Gasification of Char in Oil Shale Blocks", Tech. report UCRL-85279, Lawrence Livermore Laboratory (April 1981). Ergun, S. , "Kinetics of Reaction of Carbon Oxidide with Carbon", Journal of Physical Chem., Vol. 60, p. 480 (1956). Ergun, S. and Menster, M., "Reaction of Carbon with Cog and Steam", in Cbem. and Physics of Carbon, P. L. Walker, ed. , p. 203 (1965). Smith, J. M., Chem. Engineering Kinetics, McGraw-Hi11 Co., p. 466, 3rd ed. (1981). Tisot, R. , "Alterations in Structure and Physical Properties of Green River Oil Shale by Thermal Treatment", J. Chem. Eng. Ref. Data, Vol. 12, p. 405 (1967). Smith, J. W. , "Theoretical Relationship Between Density and Oil Yield for Oil Shales", Tech. report R17248, Bureau of Mines (April 1969).
I
GENERAL PAPERS - POSTER SESSION PRESENTED BEFORE THE DMSION OF PETROLEUM CHEMISTRY, INC.
AMERICAN CHEMICAL SOCIETY WASHINGTON, D. C. MEETING, AUGUST 28-SEPTEMBER 2, 1983
THE EFFECT OF CRYOGRINDING ON THE MOLECULAR WEIGHT OF SAMPLES O F POLYISOBUTYLENE
BY
P. F. Waters The American University, Washington, D. C. 20016
and A . F. Hadermann and J. C. Trippe
General Technology Applications, Inc. , Arlington, Virginia 22209
INTRODUCTION
A significant recent development in polymer technology is the discovery that megadalton- molecular-weight macromolecules can be dissolved instantaneously in liquids which a r e normally solvents for the materials. This finding portends increasing development and u s e of ultra high molecular weight macromolecules deriving from the superior effects they exhibit in a variety of ap- plications. Past studies have demonstrated that macromolecules, added in small quantities, (1) en- hance the flow of liquids through pipelines; (2) impart high extensional viscosities to and (3) impede the aerosolization of liquids in which they a re dissolved. The latter is a property of antimisting fuels.
sibility might well be the on-site dissolution of the macromolecules in the fuels. This requirement is occasioned by the high susceptibility of some dissolved macromolecules to shear degradation; a concomitant of fuel transportation and transfer by pumping. The cryogenic comminution and subse- quent blending of macromolecules with the fuels offers a direct route to instantaneous dissolution. The process is described elsewhere (3-5).
Consequently, an understanding of the effect of cryogrinding on the molecular weight of a potential antimisting fuel additive i s required. In this study, samples of polyisobutylene of three different molecular weights were cryofractured and dissolved. break in a ductless siphon (8) of the solutions were compared with those of solutions of unground samples and the comparative values were used a s indicators of the extent of degradation.
In the event that antimisting fuels ga in wide use, a not inconsiderable facilitation of the fea-
The antimisting effect is a strong function of the molecular weight of the additive (2. 6 , 7).
Measurements of the viscosity and height-at-
EXPERIMENTAL
Samples of BASF polyisobutylene of three different molecular weights (B-100, B-200, B-200-246) were fractured in a mill, under nitrogen, at 77%. However, they were not added im- mediately to the solvent a s was the procedure followed in the work reported earlier. Instead, the samples were allowed to warm to rcom temperature under nitrogen and each w a s dissolved in iso- octane in the usual manner, i. e. , with occasional swirling in a flask over a period of several days. Simultaneously, unground samples of the same materials were similarly dissolved.
tions of the samples, because the reduced viscosities become nonlinear a t concentrations near 0.1 wt % in good solvents for the molecular weights used in this study.
The viscosity and ductless siphon measurements were made on relatively low concentra-
The data a r e displayed in Table I.
CONCLUSIONS
The viscosity data show that there was apparently no detectable degradation on cryogrind- ing the sample with the lowest molecular weight. The sample with the intermediate molecular weight suffered a molecular weight decrease of a bit above 5%. It was reported earlier that cryo- grinding reduced the molecular weight of a sample of B-200 by about 6% (5). In that instance, Wv was determined in cyclohexane at 30"C, with the material cryoground directly into the solvent and the concentration measured by weight after precipitation of the macromolecules from solution with acetone. The molecular weight of the sample with the highest molecular weight decreased by about S?+,. The relative decrease in the molecular weight on cryogrinding,
4
I
approaches a limiting value of 1 .5 .
TABLE I
VISCOSITY AVERAGE MOLECULAR WEIGHT^ AND REDUCED HEIGHT-AT-BREAK OF SOLVTIONS OF POLITSOBUTYLENE I N ISOOCTANE AT 20°C
The reduced height-at-break data reveal a strong molecular weight dependency. Whereas the cryogrinding appears to have improved the viscoelastic properties of the sample with interme- diate molecular weight, it causes a decided decrease in the effect in the sample with the highest molecular weight. The latter change is in the expected direction, commensurate with the degrada- tion revealed by the viscosity measurements. In the cryogrinding process free radicals a r e gener- ated (5) and while the viscosity average molecular weight decreases by about 5% for the B-200 sam- ple, the alteration of the molecular weight distribution due to post-grinding free radical coupling might conceivably lead to an increase in the reduced ductless siphon height-at-break because i n the polyisobutylene/isooctane system, the intrinsic viscosity is related to
whereas the helght-at-break is proportional to
A relatively few such coupled molecules would contribute far less t o the shear viscosity than to the extensional viscosity. Indeed, it may well be that only the very largest molecules in a sample con- tribute to the antimtsting effect.
LITERATURE ClTED
Proceedings of the IUTAM Symp. on Structure of Turbulance and Drag Reduction, F. Frenkel, M. Landahl and J. Tumley, eds. , Phys. Fluids 3, No. 10, Part ll (1977). Chao, K. C . , Child, C. A , , Grens, E. A. andWilliams, M. S., Am. Inst. Ch. Eng. J . , in press. Waters, P. F. , Trippe, J. C. and Hadermann, A . F . , Proceeding of the Aircraft Re- search and Technology for Antimisting Kerosene Conf., p. 5-1 ff, Atlantic City, NJ, February 18-19, 1981. Report No. FAA-CT-81-181, U. S. Dept. of Trans. , June, 1981. Trippe, J. C. , Waters, P. F. and Hadermann, A. F., Application of GTA Blending Pro- cess to Antimisting Fuel Additives, Report No. FAA-CT-81-51, U. S. Dept. of T rans . , May, 1981. Waters. P. F., Hadermann, A . F. , Weitzen, W. and Trippe, J. C. , IUPAC 28th Macro- molecular Symp. Proceedings, p. 679, July 12-16, 1982. Hadermann, A. F . , Waters, P. F . , Trippe, J. C. and Weitzen, W., Contract No. DAAK- 70-81-C-0134, U. S. Army Mobility Equip. Res. and Dev. Com., Fort Belvoir, VA, January 15, 1982. Waters, P. F. , Hadermann, A . F. andTrippe, J. C . , Proceedings of the 2nd Jnterntl. Conf. on Reactive Processing of Polymers, pp. 11-22, J. T. Lindt, ed . , University of Pittsburgh, November 2-4, 1982. Chao, K. K. K. andWilliams, M. C . , J. Rheology, in p re s s . BASF Tech. Leaflet No. M 2353 E/81538; May, 1978.
GENERAL PAPERS - POSTER SESSION PRESENTED BEFORE THE DIVISION OF PETROLEUM CHEMISTRY, INC.
AMERICAN CHEMICAL SOCIETY WASHINGTON, D. C. MEETING, AUGUST 28-SEPTEMBER 2 , 1983
CHEMICAL COAL BENEFICIATION WITH AQUEOUS HYDROGEN PEROXIDE/SULFURIC ACID SOLUTIONS
BY
N. P. Vasilakos and C. S. Clinton Department of Chemical Engincerisg, University of Texas, Austin, Texas 78712
INTRODUCTION
There is a pressing need for significant improvement in the effectiveness and the econom- ics of coal desulfurization, especially in the light of the latest, strict air-quality standards set by EPA for coal-fired power plants. The challenge is particularly crucial for the future of chemical (or precombustion) desulfurization of coal, where specific reagents a r e used to attack selectively and to remove both the inorganic and the organic sulfur from coal before combustion. Current chemical desulfurization processes are faced with a serious dilemma: either operate under severe process conditions (high temperatures and pressures , strong- and thus nonselective- desulfurizing media) promoting high sulfur removal from coal but at the expense of higher capital and operating costs a n d o r severe degradation of the coal material, o r utilize mild reaction schemes not affecting the integrity of the coal matrix during processing but displaying low efficiency of sulfur-reduction (especially organic-sulfur reduction) in coal. A low-cost, technically simple, coal-treatment pro- cess that removes the organic a s well as inorganic sulfur in coal effectively without having to de- stroy the carbon matrix would be a majnr hreekthr~~gh in m a l uiiiizarion.
stage (TRW Meyers, Battelli Hydrothermal, KVB, DOE Oxydesulfurization, and J P L Chlorinolysis processes) employ either oxidizing reagents or basic media to reduce the sulfur content in coal. Oddly enough, little consideration has been given s o far in the coal desulfurization literature to the potential benefits from acid systems. Inherent advantages exist in coal treatment by acid systems over alkaline ones, namely:
- Acid systems can extract sodium from the organic phase of the coal, thereby improving the slagging characteristics of the coal during combustion; alkaline systems add alkali.
- Acid systems can attack apatite/phosphorite in the coal a s well a s pyrite (1) and, thus, can free ash and trace elements (including radioactives) from their original association; alkaline systems do not attack the phosphate minerals and tend to immobilize trace elements in the form of hydroxides, etc.
- Acid systems have a potential for extracting nitrogeneous substances such as aniline and pyridine from the coal; alkaline systems can only extract phenols and organic acids, thus, removing fuel value without improving NOx emissions.
Oxidizing systems, on the other hand, can i n principle remove both the pyritic and organic sulfur f rom coal in the form of sulfates, but oxidizing systems suffer from the serious drawback of being unselective, resulting in large losses in heating value of the treated coal. The high cost and scarcity of feed stock the severe conditions required and the lack of effectiveness on organic sulfur of current chemical desulfurization processes has stimulated renewed interest in selective oxidation under mild conditions a s a method for removing sulfur from coal and residual oil. The basic scheme consists of selectively oxidizing the organosulfur compounds to the corresponding sulfones, thus destabilizing the carbon-sulfur bond (2):
All the chemical desulfurization processes that a r e presently in an advanced development
1)
Sulfoxide Sulfone
The sulfones are then oxidized further to sulfonic acids which can, in turn, be hydrolyzed to yield sulfuric acid and completely desulfurized hydrocarbon products (3):
[01/H20 H + / H ~ O RS02R' > RSO H+R'H -2 ROH+R'H+H2S04
3
The f i rs t step in the sequence, i. e. the oxidation of sulfur compounds to sulfones, is ex- tensively documented in the literature. Numerous oxidants have been reported which can effect the conversion of even the most stable organosulfur compounds (thiophenes) to the corresponding S U I -
fones, including NO2 (4), C1 /H 0 (5), H202/acetic acid and hydroperoxides (6).
significant extent and there a re very few references in the literature on the desulfurizing effects Of extended oxidation of organosulfur compounds. Vasilakos (7) has reported the complete desulfuriza- tion of aliphatic sulfides by oxidative chlorination in aqueous systems at low temperatures (60°C) and atmospheric pressure.
course, selectivity. Concurrent oxidation of the remainder of the coal matrix by the sulfur-oxidiz- ing agent should be minimized to prevent excessive loss of the heat content of the coal. A compari- son of half-wave potentials for oxidation of organic substrates of the type found in coal (8) shows that organosulfur compounds as well as alcohols and amines a r e vastly more susceptible to oxida- tion than a re ether and benzene derivatives. Thus, given a mild oxidizing agent, i t may be possible to oxidize the organic sulfur compounds, amines and alcohols without destroying the hydrocarbon portion of the coal molecule.
One of the most promising oxidants in this direction is hydrogen peroxide, particularly in acid solutions, where it has a standard oxidation potential approximately 1 .4 V more positive than that of pyrite and about 1 . 6 V more positive than the S02/S couple (9). Thus, H202 is an oxidizing agent capable of oxidizing effectively the pyritic sulfur to the sulfate form.
aqueous hydrogen peroxide. This treatment was claimed to give nearly quantiative removal of py- ritic sulfur without changing the caking properties of the coal. No data on organic-sulfur reduction were given. Nalwalk and coworkers (11) also reported that decomposition of coal with 30wt % H202 slowly oxidized pyrite to sulfate.
Smith (12) investigated the desulfurization of U. S. coals with 10-15 wt % H 2 0 2 , 0.1-0.3 N H2S04, aqueous solutions. Treatment of several coals at ambient temperature with H202 alone had a noticable effect in removing pyritic sulfur, but the reaction was significantly enhanced when a small amount of sulfuric acid was added to the peroxide solutions. Although pyritic sulfur and ash were effectively removed in this way, organic sulfur remained unaffected. Minimal attack on the organic constituents of the coal matrix was observed. The reaction mechanism was postulated to involve the intermediate formation of peroxysulfuric acid, H2S05 (catalyzed by metal lons and sul- fates present in coal), followed by oxidation of the pyrite, with competing peroxide decomposition by metal ions.
The apparent resistance of the organic sulfur in coal to oxidative desulfurization in this case does not necessarily imply that organic sulfur functionalities a r e not affected by the H202/ H2S0 treatment. A s we will show in the section on model compounds, all the basic organosulfur structures present in coal can be readily converted to the sulfone form under the conditions of the H202/H2S0 attack. In most cases, however, the oxidation does not proceed beyond the sulfone stage, and t%e additional desulfurization steps necessary to free the organic sulfur from the coal matrix (Equation 2) do not take place.
In a recent study (13), Kralik has reported that a hot aq. Na2C03 wash of coal pretreated with a mild oxidizing agent results in significant organic-sulfur reduction, mainly by splitting off relatively low-molecular-weight, oxidized sulfur compounds from the hydrocarbon matrix. It i s feasible that the high selectivity of the peroxide treatment of coal towards sulfur oxidation could be combined with a subsequent alkaline hydrolysis step to leach out a significant portion of the oxidized organosulfur compounds, thus affecting not only pyritic, but also organic-sulfur removal from coal.
The oxidation of sul$ur {eyond the sulfone stage (Reaction 2) has not been studied to any
The key to an economically feasible desulfurization process based on oxidation is, of
Muka i et al. (10) studied the treatment of several Japanese bituminous coals with 3 wt %
EXPERIMENTAL
Chemical beneficiation experiments were carried out in batch mode at ambient temperature and pressure with a Redstone high-volatile A , bituminous coal. The ultimate analysis and sulfur forms for this coal, designated a s PSOC-715, a r e included in Table I. In each r u n , approximately 20 grams of the dried and sized (200x325 mesh) coal was slurried in a 500-ml Pyrex Erlenmeyer flask with 300 ml of a 15 Wt % H202 solution of the desired H2SO4 concentration. At the end of the reaction period the slurry was vacuum-filtered through a fine-porosity fritted glass funnel and the coal was washed several times with water for analytical purposes. Treated coal samples were dried for 24 hours under vacuum at 110°C and then analyzed for proximate and ultimate composition and heating value. A portion of the H 2 0 2 / ~ p 0 4 treated coal was further subjected to an extended
leaching cycle with a hot (50°C) 0 . 1 molar Na2C03 solution, then washed with water and dried as be- fore. method for forms of sulfur were employed in the analysis of the raw and treated coals. The wet method w a s modified to eliminate any ash interference in the determination of the pyritic and, thus, the organic sulfur (14). In this modified method, the pyritic-sulfur content of the coal is determined by oxidation of the pyrite to ferr ic sulfate and subsequent gravimetric analysis of barium sulfate precipitate, rather than by atomic absorption determination of the iron as described in the ASTM method.
Both the Eschka and the Fisher methods for total-sulfur content and the ASTM-D-2492 wet
TABLE I
ULTIMATE ANALYSES AND SULFUR FORMS OF COAL SAMPLES TREATED WITH A 15 WT H202, 1 N H2S04 AQUEOUS SOLUTION AT 25°C FOR VARIOUS LENGTHS OF TIMEa
a. All reported values are wt 5% (on a dry basis), unless otherwise noted. b. For each reaction t ime, the first row of data corresponds to a single-step, H202/
H2S04 treatment. The second row of data corresponds to the ~ a m e H202/H2S04 treatment followed by an aqueous wash of the treated coal with a hot (SO'C) 0.1M NaZCO solution.
c. Deterzined by difference using the Eschka total-sulfur value.
RESULTS AND DISCUSSION
Tables I and II summarize our data on the treatment of the PSOC-715 coal with a 15 wt '% aqueous H202 solution of various H2S04 concentrations, a t 25'C and for various lengths of time. Total Sulfur and pyrite and ash removal from coal a r e depicted in Figures 1 and 2, respectively, as functions of the reaction time. Figure 3 shows the effect of the H 2 m 4 concentration of the peroxide solution on pyritic su l fur removal.
The results indicate that there i s a very significant reduction in total sulfur cmtent for the H 0 /H SO treated coal under the given experimental conditions. This reduction F55% in 4 hours) comes entirely from the almost complete elimination of pyrite and sulfates from coal. While sul- fate Sulfur (and ash) i s leached out at the very early stages of the peroxide treatment, pyritic sulfur removal Continues at a reasonable rate even after 4 hours of reaction. The results confirm earlier observations about the high selectivity of the peroxide reactions towards sulfur, the res t of the or- ganic coal matrix being affected to a minimal extent. Carbon, hydrogen, nitrogen and oxygen con- tents of the treated coal remain at approximately the raw coal levels. moved in these room temperature experiments. On the other hand, pyritic sulfur reduction is ac- companied by a significant reduction in the ash content of the coal (=47% in 4 hours), and by a slight but noticeable increase in its heating value. This increase of about 5% is most probably due to the removal of low-heat-content inorganic matter from coal.
result in additional ash reduction, or, a s was expected, in any organic sulfur removal. However, a small but consistent decrease in the total sulfur content i s observed in all cases, due to further removal of pyritic su l fur from the coal. The exact mechanism of this alkaline pyrite desulfuriza- tion i s not clear at this point.
of the peroxide solution. The data in Table II show that aqueous hydrogen peroxide alone is quite efficient in removing a substantial portion of the pyrite and the ash from coal. At the other ex- treme, treatment of the coal with a 1N sulfuric acid solution has absolutely no effect on pyritic sul- f u r , although some ash i s actually removed. The combination of H202 and H2S04 in aqueous solu- tion results in a synergistic effect, where pyrite and ash reduction in coal significantly exceed the corresponding reduction brougllt about by each reagent alone. The effect is pronounced at low acid concentrations, but above a concentration of approximately 0.2N H 2 m 4 the trend is reversed. Con- centrated sulfuric acid seems to have an adverse effect on the oxidation of pyrite by hydrogen per- oxide, so that, for example, the level of pyritic sulfur.remova1 for a 2N H2SO peroxide solution falls below even that for pure hydrogen peroxide. A s Smith (12) has pointed oh, the H SO -assis- ted oxidation of iron pyrite by hydrogen peroxide involves a complex system of parallefan%conse- cutive reactions that may be strongly catalyzed by metal ions and sulfates present in coal. A sim- plified reaction mechanism can be schematically represented as follows:
2 2 2 . 4
No organic sulfur is re-
Subsequent wash of the H202/H2S04 treated coal with a sodium carbonate solution does no1
Pyritic sulfur removal also displays an interesting dependence on the H2S04 concentration
FeS2
H2O2
H SO - 2 5
The concentration of sulfuric acid in the peroxide solution may affect the kinetics and/or the equilibrium of any of these reactions (14). but the extent of the specific contribution of each step to the overall concentration effect that was observed experimentally i s very difficult to esti- mate.
Model Compound Studies
trolled conditions, a series of kinetic experiments was carried out with three organosulfur com- pounds modeling possible sulfur functionalities in coal, namely dibenzothiophene, phenyl sulfide and t-butyl sulfide.
In each run with phenyl sulfide or dibenzothiophene, a n aqueous phase consisting of 5ml 30 wt % H202 and 3.3 ml 36N H2S04 was emulsified under intense st irring with 100 ml of a hexane phase containing 0.006 moles of the sulfide. The sulfide/peroxide-acid proportion corresponds to a 2. 5 fold excess of the oxidant (assumed to be the intermediate peroxysulfuric acid) over the stoichi- ometric requirement for complete conversion (oxidation) of the sulfidic sulfur to sulfate
To investigate the effect of the H20!/H2S04 treatment on organic sulfur under more con-
(Equations 1 and 2). All the reactions were carr ied out a t 25°C. Samples of the hexane phase were withdrawn every 15 minutes and analyzed quantitatively on a Tracor 565 capillary-column gas chro- matograph equipped with a Hall Electrolytic Conductivity Detector se t at the sulfur detection mode. The corresponding sulfone was found to be the &final product of oxidation of phenyl sulfide and dibenzothiophene, with small amounts of the sulfoxide formed intermediately. Due to the very low solubility of the sulfoxides and the sulfones i n hexane, these products were obtained mostly a s solid crystals separating from the reaction mixture. The crystals were filtered, dissolved in tetrahydro- furon and analyzed on the gas chromatograph. Under the given reaction conditions, a 25% conver- sion of phenyl sulfide to the sulfone was obtained in 8 hours and 75% in 24 hours. For dibenzothio- phene, the 24-hour conversion level was 42%. The oxidation ra te was strongly dependent on the concentration of the sulfuric acid and complete conversion of the sulfide to sulfone could be achieved in a few minutes of reaction with a much higher excess of the H20,/HgS04 oxidant.
tense stirring in an aqueous phase consisting of 140 ml 30 wt % H 2 0 2 and 96 ml 36N H SO (- 5 fold excess of oxidant). The oxidation reaction was carr ied out at 25'C for various lengths of time. A t the end of each run, the reaction mixture was exhaustively extracted with hexane. phase was separated and analyzed for total S042- content by the BaCl2 method. The difference in sulfate contents between this phase and the initial aqueous phase (before reaction) was used to determine the S042- yield of the sulfide oxidation reaction. The hexane phase was analyzed for sulfur species on the gas chromatograph. After 8 hours of reaction, the t-butyl sulfide had been completely converted, t-butyl sulfone and So42- being the only reaction products that were detected. The sulfone yield (based on the sulfide) was approximately 2090, the remaining 80% appeared a s sulfate.
The results with t-butyl sulfide are very encouraging, because they demonstrate the ability of the H 0 /€I SO system to promote complete oxidative desulfurization of aliphatic sulfide struc- tures un%er ambient reaction conditions. The fact that no organic sulfur removal was observed un- der similar conditions with the PSOC-715 coal may simply be an indication that most of the organic sulfur in this coal is in stable phenyl and thiophenic forms that can survive the oxidative peroxide attack. Vasilakos (7) has reported a similar case in his studies of the selective desulfurization of two bituminous coals with aqueous chlorine solutions. The coals displayed completely different or- ganic-sulfur-reduction characteristics despite the almost identical extent ,and pattern of the chlori- nolysis reactions.
The effect was attributed to the different distribution of the organic sulfur in the two coals in aliphatic and aromatic structures. We a r e currently conducting a ser ies of H 2 0 2 / ~ 2 y , experi- ments with two high organic-sulfur coals, a Texas Darco lignite and an IlIinois 85 bituminous coal, to test this hypothesis and to study further the removal of sulfur functionalities from the coal ma- trix.
In the t-butyl sulfide r u n s , 14 ml of the (liquid) sulfide was directly dispersed under in-
2 4
The aqueous BaS04 precipitation
2 2 4
SUMMARY
The removal of sulfur and ash from coal treated with aqueous hydrogen peroxide/sulfuric acid solutions at ambient temperature was studied under a variety of experimental conditions. Al- most complete elimination of the sulfate and the pyritic sulfur was observed in most cases, as well as substantial reduction in the ash content. The res t of the organic coal matrix was not affected to any significant extent, indicating a high selectivity of the H202/H2S04 system towards sulfur oxida- tion. An optimal H2S04 concentration level w a s established, beyond which sulfuric acid was found to have an adverse effect on the oxidation of pyrite by hydrogen peroxide. The oxidative desulfuri- zation of model organosulfur compounds, such as t-butyl sulfide, phenyl sulflde and dibenzothio- phene, by the H 0 /H So system was also investigated.
2 2 2 4
ACKNOWLEDGMENTS
This work was supported by the Texas Energy and Natural Resources Advisory Council under Grant No. 82-UCRC-2. The support is gratefully acknowledged.
TABLE I1
ULTIMATE ANALYSES AND SULFUR FORMS OF COAL SAMPLES TREATED WITH A 15 WT % H202 SOLUTION (OF VARYING HZS04 CONCENTRATION) AT 25°C FOR TWO HOURSa
a. A l l reported values are wt '% (on a dry basis), unless otherwise noted. b. For each concentration, the first row of data corresponds e0 a single-step, H202/H2S04
treatment. The second raw of data corresponds to the same H202/H2S04 treatment followed by an aqueous wash of the treated coal with a hot (80OC) 0.1M Na2C0 solution. Determined by difference using the Eschka total-sulfur value.
3
c.
0 ul ul N
N N
0 0
N
!
i” i
I J i
I >
I
0 0 0 0 N ,-I
Nonmam %
m 0
(d z
t e - $ $ <e N
P I rd 0 u 3 (d ffi
I
I I I I I
I I
I t
I
I I
f I
I I
I t
I I
f I
0 In 0 In 0 In 0 In N 0 P In N
rl 4 4 0 0 0
LITERATURE CITED
DU Fresne, E. R. , "Coal Cleaning Versus Flue-Gas Desulfurization in Meeting New Pro- prosed Air Pollution Standards", Assessment Report, J e t Propulsion Lab. , Pasadena, CA (1979). Attar, A. andCorcoran, W . H . , Ind. Eng. Chem. Prod. Res. Dev., 11, 102 (1978). Kalvinskas, J. J . , et al. , "Final Report for Phase II - Coal Desulfurization by Low Tem- perature Chlorinolysis", Jet Propulsion Lab. Publication 80/15, Pasadena, CA (1980). Friedman, S. , Lacount, R. B. and Warzinski, R . P. , "Oxidative Desulfurization of Coal", in "Coal Desulfurization", ACS Symp. Series No. 64, Washington, DC (1977). Vasilakos, N. P . , Bone, A. L. andcoworan , W. H . , Ind. Eng. Chem. Prod. Res. Dev., - 20, 376 (1981). Reid, E. E., "Organic Chemistry of Bivalent Sulfur", Chemical Publishing Co., Inc. , NY (1960). Vasilakos, N. P. , "Coal Desulfurization by Selective Chlorinolysis", Ph. D. Thesis, California Inst. of Tech. , Pasadena, CA (1980). Ross, S. D., Finkelstein, M . and Rudd, E. J. , "Anodic Oxidation", Academic Press, Inc., NY (1975). Meyers, R. A . , "Coal Desulfurization", Marcel Dekker, Inc., NY (1977). Mukai, S. , A r a k i , Y. , Konish, M. and Otomura, K. , Nenryo Kyoka-shi 48, 905 (1969); Chem. Abstr. 72, 123720d (1970). Nalwalk, A. J. , Friedel, R.A. and Queiser, J. A. , Energy Sources 1, 179 (1974). Smith, E. B. , "Lowering the Sulfur and Ash Contents of High-Sulfur Coals by Peroxide- Acid Treatment", ACS, Div. of Fuel Chem., Preprints, g, 140 (1975). Kralik, J. G. , "An Investigation of the Applied Chemistry of the Reactions of Coal and Nitrogen Dioxide with Particular Emphasis on Oxidative Desulfurization", Ph. D. Thesis, California Inst. of Tech., Pasadena, CA (1982). Monger, J. M. and Redlick, O . , J. Phys. Chem., 60, 797 (1956).