1 Synthesis of Design Concepts from a Design for Assembly Perspective Wynne Hsu Department of Information Systems and Computer Science Jerry Y. H. Fuh, Yunfeng Zhang Department of Mechanical and Production Engineering National University of Singapore Singapore 119260 Abstract Assembly is often a labor intensive and costly process. Techniques such as design for assembly, and automatic assembly planning have been reported in an attempt to lower the high cost of assembly. Automatic assembly planning is concerned with finding the optimal sequence of assembly for a given design. On the other hand, design for assembly (DFA) examines the given design to evaluate its “fitness” for assembly, and where appropriate, to provide high -level suggestions to redesign the components so that they are easy to be assembled. Usually, DFA analysis is performed only when the design details are known (the number, types, and shapes of components and their mating relationships). As a result, designers tend to view this as an extra step/burden. To change this perspective, we investigate a new approach whereby DFA analysis is used to guide the designer in the search for a “good” initial design. In this paper, we propose an architecture that incorporates design for assembly analysis into the conceptual design phase. With this incorporation, timely suggestions are made available to guide the designer in his/her search for a feasible assembly-oriented design. A system has been developed (in the National University of Singapore) to realize this architecture. The system is written in C using the Pro/Engineer platform. The system takes as input a description of the product’s functional requirements in the form of state transition diagram. A library of past design cases in the domain of chair has been created. A simple example of chair redesign has been presented to demonstrate the feasibility of the proposed scheme. Keywords: Design for Assembly, Conceptual Design, State Transition Graph
Transcript
1
Synthesis of Design Concepts from a Design for Assembly Perspective
Wynne Hsu
Department of Information Systems and Computer Science Jerry Y. H. Fuh, Yunfeng Zhang
Department of Mechanical and Production Engineering National University of Singapore
Singapore 119260
Abstract
Assembly is often a labor intensive and costly process. Techniques such as design for assembly, and automatic assembly planning have been reported in an attempt to lower the high cost of assembly. Automatic assembly planning is concerned with finding the optimal sequence of assembly for a given design. On the other hand, design for assembly (DFA) examines the given design to evaluate its “fitness” for assembly, and where appropriate, to provide high-level suggestions to redesign the components so that they are easy to be assembled. Usually, DFA analysis is performed only when the design details are known (the number, types, and shapes of components and their mating relationships). As a result, designers tend to view this as an extra step/burden. To change this perspective, we investigate a new approach whereby DFA analysis is used to guide the designer in the search for a “good” initial design. In this paper, we propose an architecture that incorporates design for assembly analysis into the conceptual design phase. With this incorporation, timely suggestions are made available to guide the designer in his/her search for a feasible assembly-oriented design. A system has been developed (in the National University of Singapore) to realize this architecture. The system is written in C using the Pro/Engineer platform. The system takes as input a description of the product’s functional requirements in the form of state transition diagram. A library of past design cases in the domain of chair has been created. A simple example of chair redesign has been presented to demonstrate the feasibility of the proposed scheme.
Keywords: Design for Assembly, Conceptual Design, State Transition Graph
2
1. Introduction Increasing productivity through automation is one avenue to achieving competitiveness. Classical production technologies, such as metal cutting and forming, have achieved a high level of automation. As a result, parts are now produced at a relatively low cost. On the other hand, assembly remains largely a manual operation with interplay between many different functions. Since then, many studies have been conducted and it was found that more than 40% of the total production costs are due to assembly (Hird et al. 1988). In the automotive industry, considered by many to be highly automated, approximately one third of the total work force is known to be engaged in assembly (Holbrook and Sackett 1988). Consequently, reducing assembly cost becomes an urgent and potentially rewarding area to look into. Design for assembly research is motivated by this desire to lower assembly cost. The basic approach in DFA is to bring assembly considerations into the design phase since design is responsible for 75% of the final product costs. A survey of 355 companies in the Federal Republic of Germany (Schraft and Bassler 1984) shows that the most important obstacles against automation in the field of assembly are: (1) product designs are generally not “assembly-oriented” and (2) most parts cannot be handled automatically without problems. This is because few designers have the expertise in designing assembly-oriented products and even if they have the expertise, they are reluctant to perform DFA analysis due to the amount of effort involved. Though computer-aided DFA tools (Boothroyd 1992) are now available, they are typically used as a post-analysis design tools. As a result, designers generally view them as an additional burden and are slow in accepting them. To change this perspective, we propose a new approach whereby DFA analysis is being incorporated into the conceptual design phase to guide the designer in his/her search for a “good” initial design solution. A system is being developed at the National University of Singapore. The main characteristics of the system are:
a) No prior knowledge of DFA analysis is needed in order to derive an assembly-friendly product. All that is required is for the user to be familiar with the platform on which the system is built, in this case, the Pro/Engineer feature-based solid modeling platform.
b) Minimum user interaction is required. We have constructed a pre-built design concept library to provide the basic building blocks for any new designs. The geometric information of these design concepts in the library can be extracted automatically.
c) Quick evaluations and instant feedback. The system provides quick and early evaluation of the design (at the conceptual phase) and instantly gives feedback to the designer for necessary design changes.
The system consists of five modules:
1) The construction of an assembly-oriented design concepts library.
2) The DFA analysis of each individual design concept.
3) A graphical user interface for inputting the functional requirements.
4) A searching algorithm to enumerate all feasible design concepts that can realize the set of functional requirements.
5) An integration process to combine the various design concepts into an assembly-oriented product.
2. Related Work Design for assembly (DFA) has been one of the technologies used to improve product design so that it can be manufactured with minimum cost. DFA was initiated at the University of Massachusetts (USA) (Boothroyd and Dewhurst 1989) with the aim of designing components that are good for assembly. Current DFA evaluation technique in industry uses a worksheet approach which is tedious and time consuming. The goal of reduction in the evaluation-process
3
time has driven the encoding of the various DFA techniques (Boothroyd 1992) in software. Software systems facilitate the dissemination of DFA methodology to a wider client base. Furthermore, it may enhance the analysis process itself by enforcing some consistency and objectivity in the evaluations, and by reminding the user to carry out all the relevant analyses.
Artificial intelligence techniques such as the knowledge-based approach have also been applied to the DFA problem. The work by Swift (Swift 1987) is oriented towards advising the designer of difficulties in the automatic handling of components, suggesting remedies, and estimating the cost of the required handling equipment. Jakiela and Papalambros (Jakiela and Papalambros 1986) are more concerned with the integration of a knowledge-based DFA consultant system in a conventional CAD environment. As soon as the designer adds a feature to the part, their system numerically estimates the corresponding ease of assembly, and is capable of suggesting improvements in an optimized manner. However, these systems work on the detailed-level design rather than the conceptual-level design. Another work by Hernani J. T. and Scarr A. J. (Hernani and Scarr 1987) suggests improving the qualitative approach by using an expert system for the introduction of relevant DFA rules to designers. In a system called REV-ENGE (Lee et al. 1993), which stands for reverse engineering, designs are analyzed to determine the necessity for redesign based on certain criteria, chief among them is DFA. In this system, much time and effort would have been expanded by the time the product is analyzed as it is performed only after the detailed design is completed.
In terms of conceptual level design supports, many work have been reported ranging from modeling representations (Top et al. 1991, Kusiak and Szczerbicki 1992, Rao 1992, Ohki et al. 1994, Radcliffe and Lee 1990) to reasoning techniques that are able to support function-form and form-function mappings (Hung and Adeli 1994, Archiszewski et al. 1994, Koski 1993, Kolb and Bailey 1993, Smith and Boulanger 1994, Williams and Kleer 1991, Schwartz and Chen 1995, Kalagnanam et al. 1994). In particular, a case-based design system called CADET (Sycara and Nacinchandra 1992) has been developed. CADET has a memory of previous designs and components that guide the design process in producing new designs. Cases are represented using a multi-layered representation and are retrieved from memory using a variety of indices. In the later work, qualitative reasoning methods have been incorporated to evaluate and guide the generation of conceptual designs. In another approach by M. S. Hundal (Hundal 1990), a function is viewed as the processing of its input(s) to produce certain output(s). The inputs and outputs are defined by their type - material, energy or signal along with any further descriptors which might be known at the initial stage. A function data base is created which contains a comprehensive list of task specific functions, categorized according to a list of basic functions, where it is matched with that of the one specified by the user. The program is able to generate variants by arranging sub-functions, within the system, and thus suggests solutions for each of the functions given in the function data base. However, it is limited to only six primary categories of basic functions.
Advanced techniques for describing parts and products have also been separately studied. Many researchers concede that a feature-based representation of geometry is most appropriate for engineering applications (Walske 1988). The idea of specifying high-level relationships among components has been described by Wesley et al. (Wesley et al. 1980). Lee and Gossard (Lee and Gossard 1985) have suggested the use of mating conditions such as “against” and “fits” to express the relationships inside an assembly. Rocheleau and Lee (Rocheleau and Lee 1987) have shown how assemblies could be represented in a hierarchical tree structure, and each component’s location and orientation computed, after mating conditions have been determined.
3. System Overview Bringing design for assembly considerations to the conceptual design phase involves a number of issues. First and foremost is the apparent disparity between the types of information needed for the two activities. In conceptual design, the designer only has a vague idea of how the final product/component should look like. Typical description at this level of activity is “I want a
4
round coil as the heating element for my kettle”. Such description is too abstract to enable automatic DFA analysis to be carried out. Second, introducing DFA analysis at the conceptual design phase means that we will have to deal with the difficult issues ranging from functional requirements specification to function-form mappings techniques. Third, using DFA analysis to guide the search of a good initial design solution is, in theory, a NP-complete problem (a class of problems that has no known polynomial-time solution). To make the problem practically feasible, we use a heuristic algorithm to search for an approximate solution rather than the optimal solution. The architecture of our system is shown in Figure 1. Details of each block are described in the subsequent subsections. First, the user is required to input the functionality of a product in the form of a state transition diagram (STD) (Hsu et. al. 1996). A search algorithm is then invoked. This search algorithm accesses a library of stored design concepts (basic building blocks of feasible function-form mappings) to find possible combinations of such mappings that can satisfy the stated functional requirements. Each of these design concepts (mappings) is associated with a DFA index to indicate the "ease of assembly" of that concept. The combination of design concepts that results in the best DFA index is selected and displayed. At this point, the user has the choice of modifying or re-selecting any other available design concepts. Once the user has confirmed a set of selected design concepts, these design concepts are passed on to a design synthesis procedure. The synthesis procedure searches systematically for pairs of feasible mating features on two separate design concepts. When such pairs are found, the procedure simulates an automatic assembly of the two design concepts. At the end of the procedure, all the selected design concepts will be “assembled” into one product and a Global DFA Index is calculated to give an indication of the ease for assembling the product.
3.1. State Transitions Diagram As mentioned, one issue to be considered in bringing the design for assembly analysis to the conceptual design phase is to find an appropriate functional behavior representation. Many researchers have looked into various modeling techniques for specifying the functional behavior of mechanical/electro-mechanical products. These techniques include grammar-based (Rinderle 1991, Mullins and Rinderle 1991), rule-based (Archiszewski et al. 1994), object-based (Kolb and Bailey 1993, Nacaneethakrishnan et al. 1993, Yoshioka et al. 1993), case-based (Sycara and Nacinchandra 1992) and others. Some of the techniques deal only with the specification of the perceived use of the product (function) while others deal with the behavior of the product (the sequence of states in which the product goes through to achieve the function). In this paper, our focus is in the latter. We wish to find a representation that is able to model the behavior of the product without dictating a preferred design concept for realizing that behavior. To this end, we propose the state transitional model representation. A product may be viewed as a system that converts inputs to outputs through a few stages. Each stage is called a state and is characterized by its input and output variables, as well as a list of constraints associated with it. For example, a washing machine is a system that accepts dirty clothes as input and outputs the clean clothes. To achieve the conversion, the washing machines goes through a soak state, a rinse state, and a spin state. We define a state as S = (I|O|C) where S is the name of the state, I is the set of input objects, O is the set of output objects, and C is the set of constraints. Graphically, we represent the states as vertices of a graph. The state transition from state s to state t is represented by a directed edge from s to t. This network of feasible transitions from one state to the next is called a state transition diagram. A set of domain-specific oncology has been defined for describing the input, output, and constraint variables. Using state transition diagram to specify functional requirements has two advantages: it allows us to (1) describe the behavior of the product without dictating a preferred physical mechanism/structure for realizing the behavior and, (2) make use of the many existing graph algorithms in our problem. Let us have an example. Suppose we want a product that allows an object to be supported at some vertical displacement from the floor and, at the same time, let the object incline at some angle. Then, the corresponding state transitional diagram for this product is given in Figure 2.
5
3.2. Design Concept Library Having modeled the functional requirements in the form of state transition diagram, the next step is to search for some physical forms that are able to realize the specified state transition diagram. This process is commonly known as the function-to-form mapping. Note that it is entirely possible that some function may be realized by more than one form, and one form may realize several functions. The decision for selecting one form over another is very much dependent on the designer's experience. From past design experiences, the designer forms a mental library of useful function-to-form mappings. When he/she encounters a new design problem, suitable function-to-form mappings are retrieved and adapted in order to solve the new design problem. This is the approach we have adopted in this paper. A library of useful function-to-form mappings (we called them design concepts) has been constructed. Our initial design concept library contains approximately 30 design concepts for the domain of ``chair’’. Each design concept in the library consists of three parts: a functional behavior representation in the form of state transition diagram, a geometric representation of the physical components in the form of feature-based model, and a set of physical properties associated with the design concept. Figure 3 shows an example of the design concept modeled in the library. Obviously, in real-life design problem, the design requirements are usually not exactly met by the stored design concepts. In such cases, adaptation of the stored design concepts is necessary. For example, if we are to design a chair for a person whose height is 210cm, we require the chair to have a vertical height of at least 80cm (in other words, the vertical displacement for supporting the weight of person must be greater or equal to 80). Suppose closest match design concept in the library is Design Concept 20. This means that Design Concept 20 need to be adapted. The adaptation proceeds as follow. All design concepts related to vert_disp are retrieved. In this case, we found Design Concept 30 (see Figure 4). Both concepts are displayed to the user. The user can then proceed to specify the mating relationships between the two concepts to form a new concept or reject them entirely. The new concept is then incorporated back into the library for future retrieval. In this way, the library learns and grows with time.
3.3. The Search Algorithm It is seldom that one design concept or an adaptation of the design concept is able to realize the whole state transitional diagram. In the above example, the adaptation of Design Concept 20 is unable to achieve the state transition S2. To realize all the stated functional requirements, our system needs to be able to find a subset of the design concepts that (1) covers all the desired state transitions and (2) has low design for assembly index. We call this problem the Design Concept Selection Problem. It is formally stated as follows.
Given a state transitional graph G = (V, E) where V is the set of vertices and E is the set of edges, and a set of design concepts D = {d1,d2,…,dn} with design for assembly index of w1,w2,…,wn respectively. Let gdi denote the state transitional graph of design concept di. Find a subset of D, D*, such that ∪(gj: j ∈ D*) = G and cost of D* is minimum.
This problem can be decomposed into two subproblems: (1) For each gdi, determine whether it is a subgraph of G. (2) Let D' be the set of design concepts whose associated state transitional graphs are subgraphs of G. Find a subset of D' such that it covers the entire graph G with minimum cost.
Subproblem (1) us a well-studied subgraph isomorphism problem (Eppstein, 1994). To solve subproblem (2), we transform the problem into the well-known set-covering problem (Chvatal 1979):
In the set-covering problem, the data consists of finite sets P1,P2, …,Pn and positive numbers c1,c2,…,cn. We denote ∪(Pj: 1≤ j≤ n) by I and write I = {1,2,…,m}, J = {1,2, …,n}. A subset J* of J is called a cover if ∪(Pj: j∈J*) = I; the cost of this cover is (cj: j∈ J*). The problem is to find a cover of minimum cost.
6
To transform subproblem (2) into the set-covering problem, we construct a bipartite graph in the following manner. A bipartite graph is one whose vertex set can be partitioned into two subsets, X and Y, so that each edge has one end in X and one end in Y. For each state transitional edge in graph G, a vertex v is created and placed in partition X. For each Di in the set D', a vertex w is created and placed in partition Y. An edge connects the node x in partition X to node y in partition Y if and only if the state transition associated with node x is isomorphic to an edge in the state transition graph of the design concept associated with node y. Let the nodes in partition Y be the finite sets P1,P2, …,Pn in the set-covering problem, c1,c2,…,cn be the corresponding assembly costs of the design concept associated with each node in partition Y, and each node in partition X corresponds to an element in the set I. With this mapping, we see that a solution to the set-covering problem implies a solution to the design concept selection problem and vice versa. Figure 5 shows the transformation process. The user input’s state transition diagram is shown in Figure 5(i). Figure 5(ii) shows the design concept library with the respective state transitions that they can realize. A transformation mapping is shown in Figure 5(iii). The problem is reduced to finding the smallest subset of the nodes in X that covers all the edges with minimal cost. A heuristic algorithm is used to find this subset (Baker, 1981) (see Figure 6). This subset is then displayed to the user. If the user is satisfied with the selected design concepts, the design synthesis procedure is invoked to automatically search for a good way to “assemble” the selected design concepts into a product based on the principles of DFA (see Appendix A). Suppose the user decides to make minor modifications to the design concepts, the system is placed in an “edit” mode. At the completion of the modification, the DFA Index is recalculated and the modified design concepts are added to the library of design concepts.
3.4. DFA INDEX Calculation The DFA Index that is associated with each design concept is calculated based on the ranking system developed by H. K. Rampersad (Rampersad 1995). Quantification of the properties is partly based on the classification system of Boothroyd and Dewhurst (Boothroyd and Dewhurst 1989). Appendix A shows the list of criteria used in the evaluation of DFA Index. The index is calculated by analyzing the extracted features of the design concepts or models. Features like dimensions, symmetry and whether the model is a round object are all extracted automatically. Section 4 describes the implementation details on the automatic extraction of features from models.
The formula for computing the DFA Index is as follows:
DFA Index = 10 ( Σ Pi - Σ Vmin, i)/( Σ Vmax, i - Σ Vmin,i),
where Pi = point value for a criterion (i = 1..14), Vmin, i = minimum point for each criterion,
Vmax, i = maximum point for each criterion.
Each criterion will have a range of points, the minimum value being one and the maximum either four or six depending on the criteria. There are altogether fourteen criteria classified under assembly, component and process properties. The calculated DFA Index has a range from zero to ten with zero being the best value for ease of assembly and ten being the worst value for ease of assembly.
3.5. Design Synthesis
Having obtained a subset of design concepts that cover the state transitional graph with minimum DFA index, an automatic design synthesis process is then carried out. Note that until
7
now, we have ignored the mating conditions of the design concepts. This is because we assume that the functionality of a design concept is independent of its mating features. This assumption allows the system to make design recommendations without taking into consideration the mating conditions. As a result, the system is free to generate interesting and perhaps even creative design solutions. Once the set of design concepts has been selected, it is the designer's responsibility to ensure that the set of design concepts has the appropriate mating features to be assembled into one final product. All the selected design concepts are displayed on screen and the designer is able to modify any of the design concepts so that they can be assembled into one final product. To simplify the design synthesis task, the designer is asked to select a starting component for assembly. With that, the system performs a systematic search for possible pairs of mating-features. If only one mating pair is found, the associated design concepts are synthesized together. However, if there exists more than one mating pair, the system will prompt the designer to select an appropriate pair to be synthesized together. The process is repeated until all the selected design concepts have been synthesized into an integrated whole.
4. System Implementation A prototype system was implemented on Pro/Engineer using Pro/Develop module as an interface to the CAD/CAM system. The two main tasks of the system are: (i) to compute the DFA index of the design concepts, and (ii) to perform automatic synthesis of the selected design concepts.
4.1. Determine the DFA index of the Design Concept The DFA index of a design concept is influenced by the components’ shapes and symmetry, their material properties, sizes and dimensions, and the availability of a base component. Appendix A gives an outline of the DFA evaluation criteria.
4.1.1. Shape and Symmetry The shape of a component and its symmetry have a direct impact on the ease for assembly as they influence feeding and composing (Rampersad 1995). Typically, component shapes are divided into round and not round as shown in Figure 7.
As for the symmetry of the component, two kinds of symmetry are considered here (see Figure 8). Alpha symmetry is the rotation symmetry of a component around an axis that is perpendicular to the assembly direction. The value of alpha is the smallest angle through which the component must rotate about that axis to return to a correct assembly position. Beta symmetry is the rotation symmetry of a component around the axis in the assembly direction. The value of beta is the smallest angle through which the component must be rotated to return to a correct assembly position. An α-β-symmetric component is easier to orient and to handle.
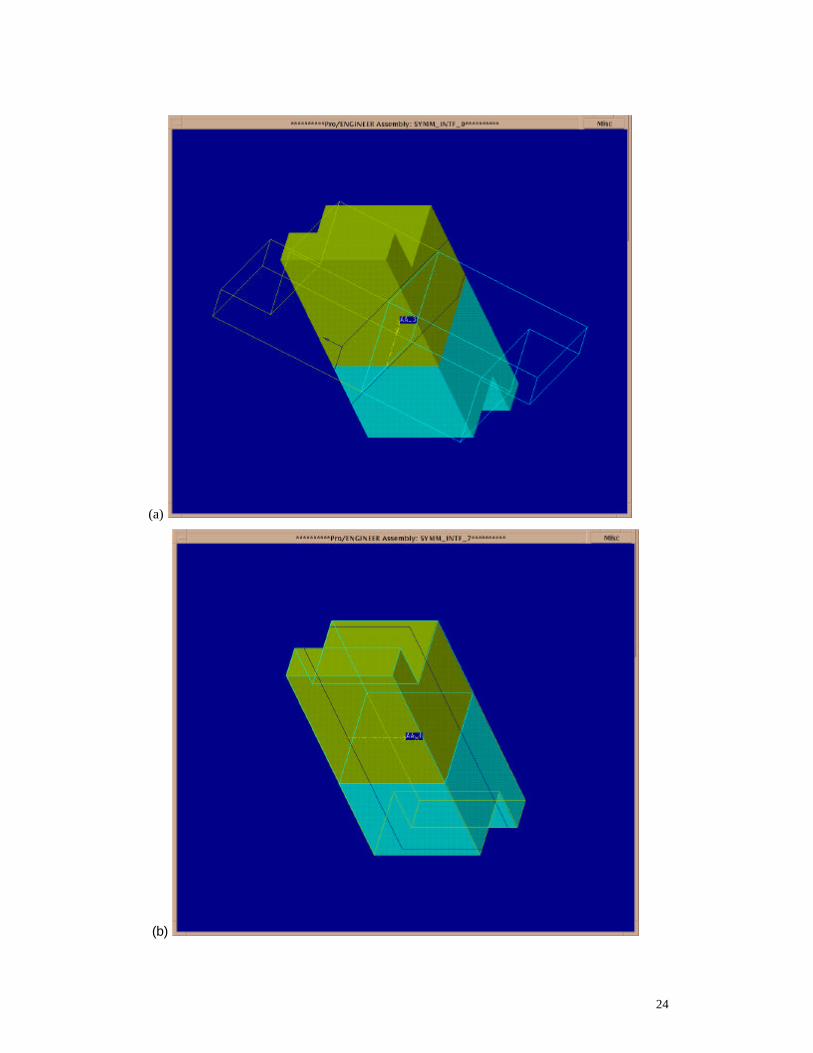
To automatically determine the shape and symmetry of a component on the Pro/Engineer system, we first create an identical copy of component to be evaluated. Figure 9 shows the original CAD model of the component in the shaded solid form while the created copy is shown in wire frame representation. The created copy is oriented at various angles before being joined to the original CAD model at the center of gravity. If the component is not symmetry at that angle, the joining will result in some volume interference that is less than 100% (see Figure 9(a)) If the interference is 100%, it means that the model has a rotational symmetry at that angle (see Figure 9(b)).
4.1.2. Assign Materials and Obtain Material Properties A database of material properties is prepared with information like density (g/mm3), Young’s modulus (Pa), and hardness (Brinell - kgf/mm2). These information can then be used to obtain properties such as weights, stiffness and vulnerability, which in turn, affect the DFA index (Rampersad 1995). Weight is determined by multiplying the density with the volume of the
8
component. Stiffness of a material is described by its elasticity modulus, E. A material with a high elasticity modulus is described as stiff and a material with a low elasticity modulus is described as flexible. Stiff components are more assembly friendly than flexible components. Vulnerability is defined as the damage or wear that can be caused in a component by dynamic loads such as dropping, vibration and bumping. In this paper, we say a component is vulnerable (either deform or damage) if its hardness is between 80kgf/mm2 and 150 kgf/mm2. For design concepts which consist of more than one component and thus more than one type of material, we simple take an average of the number of materials used.
4.1.3. Determine Size and Primary Dimensions The size and thickness of components are another two major factors that influence feeding as well as handling time. In determining the size of a component, the envelope values are obtained which provide the maximum and minimum values in terms of the x, y and z coordinates.
4.1.4. Determine Availability of Base Components A good base component is necessary because it can function as a product carrier, both during composition and during transport between various assembly cells. The user is prompted to input whether a base component is used in the assembly of the design concept.
4.2. Synthesis of Design Concepts
During the synthesis of design concepts, the system automatically searches for potential mating-pairs in order to assemble the selected design concepts into one final product. In this paper, only two of the most common assembly types are considered: the cylindrical surface assembly and the plane surface assembly.
4.2.1. Cylindrical surface assembly To determine whether two cylindrical surfaces can be mated together, we need to know the types of features to which the surfaces belong. For example, the cylindrical surface of a hole is ideal to be mated to the cylindrical surface of a rod in an insertion operation. In Pro/Engineer, mating features are not represented directly, hence special technique is needed to detect the types of features to which the surfaces belong. A ray-shooting technique is proposed. The technique works by shooting a ray out from the origin (center of the cylinder) of the cylindrical surfaces along the axis as shown in Figure 10. Whenever a surface is hit by the ray, the hit is recorded.
If no hit has been recorded, the cylindrical surface belongs to a hole. If there is a hit on both the ray directions, this means the surface belongs to the cylindrical rod. If there are two hits on one of the ray directions, it implies that it is a blind hole. After the hole and rod features have been extracted, the diameters of the mating features are compared to verify their suitability for assembly within a pre-specified tolerance. If they are found to be suitable, mating constraints are generated as shown in Figure 11. These mating constraints are then used by Pro/Engineer to perform automatic assembly.
4.2.2. Plane surface assembly The most ideal assembly operation for plane surfaces is 3-perpendicular-plane mating. This is because the alignment and orientation of the component would have been fixed. But, 3-perpendicular-plane surfaces are not unique. Figure 12 shows the various possible shapes of 3-perpendicular surfaces.
Once again, to distinguish between these shapes, rays are shot out from the midpoints of all the three planar surfaces in four directions (see Figure 12). A hit is indicated by an arrow in Figure 12. If no hit is recorded, it is type (i). If the number of hits equals to 6, it is type (ii). If the number of hits equals to 2, then it is type (iii). For planar surfaces of type (i), additional
9
constraint of alignment at the midpoint of the planar surface is imposed to fully constraint the mating conditions thereby making automatic assembly feasible.
4.2.3. Process Properties Computation In an assembly, the assembly operations are categorized into feeding, handling, composing, checking, adjusting and special process. In this paper, we consider only the composing assembly operations. Composing means bringing two or more parts together (in such a manner that the number of degrees of freedom diminishes) by applying connections which are more or less fixed. The complexity of composing is strongly determined by the following factors:
• The manner of approach: a rectilinear movement will cause less problem in assembly operation than a non-rectilinear movement.
• The composing direction: vertical top-down composing is favored over sideways or bottom-up directions.
• The stability of the part after it has been assembled.
• Relative faults in dimensions and mutual positions in the assembly (alignment).
The composing direction is analyzed by a simulation program. Figure 13 shows the flow and the various scenarios encountered during the simulation process. From these simulations, it is possible to determine whether the composing movement is one straight movement or requires more complex movements. The simulation starts by moving the component in a positive x direction. When it encounters an obstacle, it backs off one step and starts moving in a positive y direction. On encountering another obstacle, it starts to move in a negative y direction until it clears the bounding box of the mating components.
5. Simulations and Test Runs
The system is tested using the functional specification given in Figure 2. Three design concepts (Figure 14), i.e., seat, leg, and backrest, were selected by the system. The DFA index of the selected design concepts are displayed. The seat design concept (Figure 14(i)) is chosen to be the base component and is introduced to the Pro/Engineer environment first as a root assembly. The leg with cylinder rod (Figure 14(ii)) is assembled using planer surfaces assembly. Finally, the backrest with the spine (Figure 14(iii)) is assembled to the assembly through a hole and rod cylindrical surfaces combination. The final product is then shown in Figure 15.
6. Conclusions In this paper, we have proposed a feasible approach to integrate the DFA analysis with the conceptual design activity. A prototype system has been implemented on the Pro/Engineer platform. The prototype system consists of a design concept library, a user interface component, a search procedure to find feasible, assembly-oriented design concepts, and a synthesis procedure for “putting” everything together. Initial results seem promising. Future work includes the incorporation of a hypermedia user interface to enhance the accuracy of user’s specification, the improvement of the search algorithm to enable more powerful reasoning, and the exploration of other feasible automatic assembly methods.
Acknowledgment
We would like to thank Albert Loh and Kok Peng Liow for the implementation of the system. This project is funded by the National University of Singapore under the research grant RP940644.
10
References
Archiszewski, T., Bloedorn, E., Michalski, R. S., Mustafa, M., and Wnek, J. (1994). “Machine Learning of Design Rules: Methodology and Case Study.” Journal of Computing in Civil Engineering , 8(3), 286-308.
Baker, W. K. (1981). "Efficient Heuristic Algorithms for the Weighted Set Covering Problem." Comput. And Operations Research , 8(4), 303-310.
Boothroyd, G. (1992). Assembly Automation and Product Design, Marcel Dekker Inc., New York.
Boothroyd, G., and Dewhurst, P. (1989). Product Design for Assembly Handbook, Boothroyd and Dewhurst Inc.
Chvatal, V. (1979). “A Greedy Heuristic for the set-covering problem.” Mathematics of Operations Research , 4(2), 233-235.
Eppstein, D. (1994). "Subgraph Isomorphism in Planar Graphs and Related Problems." Technical Report 94-25 , Dept. of Information and Computer Science, University of California, Irvine.
Hernani, J. T., and Scarr, A. J. (1987). “An Expert System Approach to the Choice of Design Rules for Automated Assembly.” Proceedings of the 8th International Conference on Assembly Automation, Copenhagen, Denmark, 52-59.
Hird, G., Swift, K. G., Bassler, R., and Seidel, U. (1988). “Possibilities for Integrated Design and Assembly Planning.” Assembly Automation: Proceedings of the 9th International Conference, 155-166.
Holbrook, A. E. K., and Sackett, P. J. (1988). “Positive Design Advice for High Precision Robotically Assembled Product.” Assembly Automation: Proceedings of the 9th International Conference, 181-190.
Hsu, W., Lim, A., and Lee, C. S. G. (1996). “Conceptual Level Design for Assembly Analysis Using State Transitional Approach.” Proceedings of the IEEE International Conference of Robotics and Automation , 3355-3361.
Hundal, M. S. (1990). “A Systematic Method for Developing Function Structures, Solutions and Concept Variants.” Mech. Mach. Theory, 25(3), 243-256.
Hung, S. L., and Adeli, H. (1994). “Object-Oriented Backpropagation and Its Application to Structural Design.” Neurocomputing, 6, 45-55.
Jakiela, M. J., and Papalambros, P. Y. (1986). “A Design for Assembly Optimal Suggestion Expert System.” Proceedings of the 7th International Conference on Assembly Automation, Zurich, Switzerland, 341-350.
Kalagnanam, J., Henrion, M., and Subrahmanian, E. (1994). “The Scope of Dimensional Analysis in Qualitative Reasoning.” Computational Intelligence, 10(2), 117-133.
Kolb, M. A., and Bailey, M. W. (1993). “FRODO: Constraint-Based Object-Modeling for Preliminary Design.” Advances in Design Automation, 307-318.
Koski, J. (1993). “Multicriteria Optimization in Structural Design: State of the Art.” Advances in Design Automation, 621-929.
Kusiak, A., and Szczerbicki, E. (1992). “A Formal Approach to Specifications in Conceptual Design.” Journal of Mechanical Design , 114, 659-666.
Lee, K., and Gossard, D. C. (1985). “A Hierarchical Data Structure for Representing Assemblies Part 1.” Computer-Aided Design, 17, 15-19.
11
Lee, S., Kim, G. J., and Bekey, G. A. (1993). “Combining Assembly Planning with Redesign: An Approach for More Effective DFA.” IEEE International Conference on Robotics and Automation , 319-325.
Mullins, S., and Rinderle, J. R. (1991). “Grammatical Approaches to Engineering Design Part I: An Introduction and Commentary.” Research in Engineering Design , 2, 121-135.
Nacaneethakrishnan, R., Wood, K. L., and Crawford, R. H. (1993). “An Object-Oriented Formalism for Geometric Reasoning in Engineering Design and Manufacture.” Advances in Design Automation , 301-313.
Ohki, M., Shinjo, H., Oohira, E., and Abe, M. (1994). “Design Support to Determine the Range of Design Parameters by Qualitative Reasoning.” IEEE Transactions on Systems, Man and Cybermetics , 24(5), 813-819.
Radcliffe, D. F., and Lee, T. Y. (1990). “Models of Visual Thinking by Novice Designers.” Design Theory and Methodology, 145-152.
Rampersad, H. K. (1995). Integrated and Simultaneous Design for Robotic Assembly, John Wiley and Sons, England.
Rao, P. (1992). “Technical Note-- BEAS: Expert System for the Preliminary Design of Bearings.” Advances in Engineering Software, 14, 163-166.
Rinderle, J. (1991). “Grammatical Approaches to Engineering Design, Part II: Melding Configuration and Parametric Design Using Attribute Grammars.” Research in Engineering Design, 2, 137-146.
Rocheleau, D. N., and Lee, K. (1987). “System for Interactive Assembly Modeling.” Computer-Aided Design, 19, 65-72.
Schraft, R. D., and Bassler, R. (1984). “Possibilities to Realize Assembly Oriented product Design.” Assembly Automation: Proceedings of the 5th International Conference , 245-261.
Schwartz, D. I., and Chen, S. S. (1995). “A Constraint-Based Approach for Qualitative Matric Structural Analysis.” Artificial Intelligence for Engineering Design, Analysis and Manufacturing, 9, 23-36.
Smith, I. F. C., and Boulanger, S. (1994). “Knowledge Representation for Preliminary Stages of Engineering Tasks.” Knowledge-Based Systems, 7(3), 161-168.
Swift, K. G. (1987). Knowledge-based Design for Manufacture, Kogan Page, UK.
Sycara, K. P., and Navinchandra, D. (1992). “Retrieval Strategies in a Case-Based Design System.” Artificial Intelligence in Engineering Design, Academic Press Inc., 145-163.
Top, J. L., Akkermans, J. M., and Breedveld, P. C. (1991). “Qualitative Reasoning About Physical Systems: an Artificial Intelligence Perspective.” Journal of the Franklin Institute , 328(5), 1047-1065.
Walske, S. (1988). “Solid Models Link Design and Manufacturing.” Mach. Des., 60, 52-55.
Wesley, M. A., Lozano-Perez, T., Lieberman, L., Lavin, M. A., and Grossman, D. D. (1980). “A Geometric Modeling System for Automated Mechanical Assembly.” IBM Journal Res. Dev., 24, 64-71.
Williams, B. C., and Kleer, J. d. (1991). “Qualitative Reasoning About Physical Systems: a Return to Roots.” Artificial Intelligence, 51, 1-9.
Yoshioka, M., Nakamura, M., Tomiyama, T., and Yoshikawa, H. (1993). “A Design Process Model With Multiple Design Object Models.” Design Theory and Methodology, 7-14.
12
Appendix A
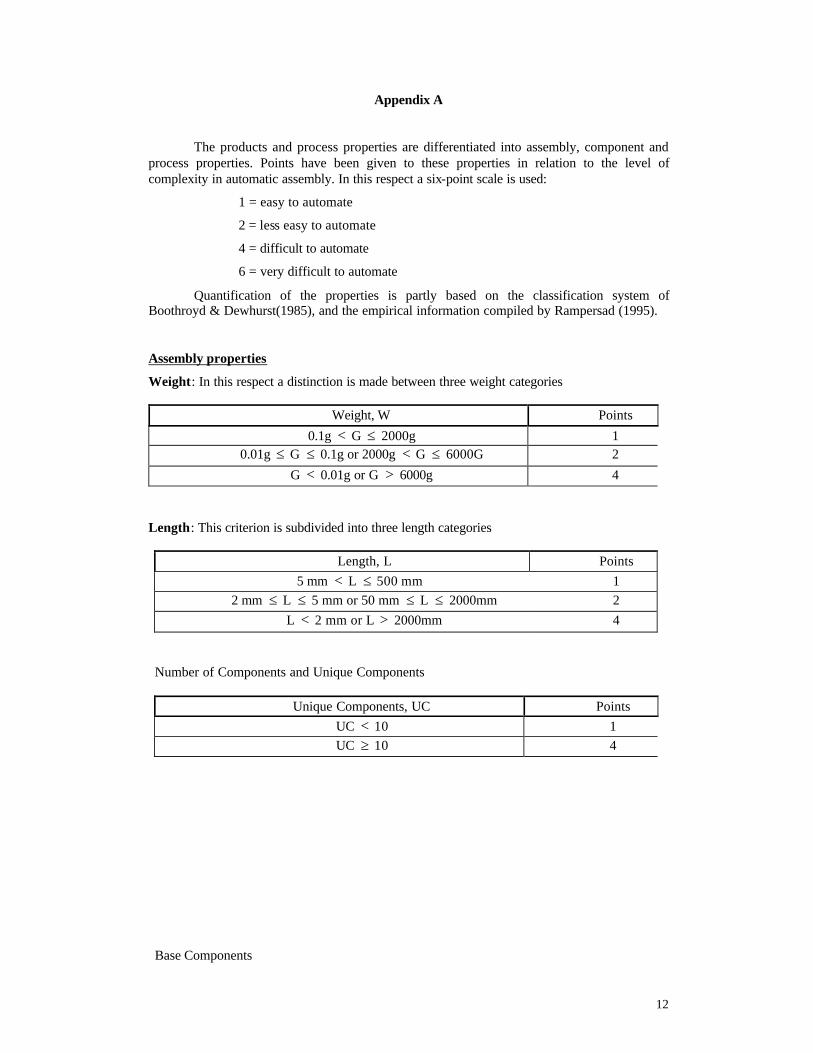
The products and process properties are differentiated into assembly, component and process properties. Points have been given to these properties in relation to the level of complexity in automatic assembly. In this respect a six-point scale is used:
1 = easy to automate
2 = less easy to automate
4 = difficult to automate
6 = very difficult to automate
Quantification of the properties is partly based on the classification system of Boothroyd & Dewhurst(1985), and the empirical information compiled by Rampersad (1995).
Assembly properties
Weight: In this respect a distinction is made between three weight categories
Weight, W Points
0.1g < G ≤ 2000g 1 0.01g ≤ G ≤ 0.1g or 2000g < G ≤ 6000G 2
G < 0.01g or G > 6000g 4
Length: This criterion is subdivided into three length categories
Length, L Points 5 mm < L ≤ 500 mm 1
2 mm ≤ L ≤ 5 mm or 50 mm ≤ L ≤ 2000mm 2 L < 2 mm or L > 2000mm 4
Number of Components and Unique Components
Unique Components, UC Points UC < 10 1 UC ≥ 10 4
Base Components
13
Base Components Points With 1
Without 4
Component Properties
Stiffness
Stiffness, Young’s Modulus, YM Points
YM > (7.0 E+10)Pa (Nonflexible componenents) 1 YM ≤ (7.0 E+10)Pa (Flexible) 4
Vulnerability: Related to drop height
Vulnerability, Hardness, H Points H ≤ 80 kgf mm-2 (Nonvulnerable components) 1
80 kgf mm-2 < H ≤ 150 kgf mm-2 (Vulnerable at a fall of 2 H > 150 kgf mm-2 (Deform or damage at a fall of 50mm) 4
Shape: Distinction made between round and not round components
Component Shape Dimensions Points
ROUND L/D < 0.8, Disc 1 Length, L 0.8 ≤ L/D ≤ 1.5, Short 2
Diameter, D L/D > 1.5, Long Cylinder 4
NOT ROUND A/B ≤ 3 and A/C > 4, Flat 1 Longest side, A A/B > 3, Long 1
Width, B & A/B ≤ 3 and A/C ≤ 4, Cubic 2
Sizes: Distinction is made between thickness or diameter and length
14
Component Shape Dimensions Points
ROUND 0.25 mm < t ≤ 50 mm 1 Thickness, t (D/2) t ≤ 0.25 mm or t > 50 mm 4
5 mm < L ≤ 500 mm 1 NOT ROUND 2 mm ≤ L ≤ 5 mm & 2
Length, L L < 2 mm or L > 2000 mm 4
Weight: In this respect a distinction is made between three weight categories
Weight, W Points
0.1g < G ≤ 2000g 1 0.01g ≤ G ≤ 0.1g or 2000g < G ≤ 6000G 2
G < 0.01g or G > 6000g 4
Symmetry: Properties are subdivided into three categories