Page 1
Synthesis of Zinc Oxide nanoparticles usingChrysopogonzizanioidesgrass extract, itsapplications in Photodegradation and AntimicrobialActivityParesh More
Kelkar College: Vinayak Ganesh Vaze College of Arts Science and CommerceVrushali Inamdar
Vinayak Ganesh Vaze College of Arts Science and CommerceShraddha Suresh
Vinayak Ganesh Vaze College of Arts Science and CommerceShreyas Dindorkar
Vinayak Ganesh Vaze College of Arts Science and CommerceShreya Peddakolmi
Vinayak Ganesh Vaze College of Arts Science and CommerceKhushi Jain
Vinayak Ganesh Vaze College of Arts Science and CommerceNandini Khona
Kelkar College: Vinayak Ganesh Vaze College of Arts Science and CommerceSummaiya Khatoon
Kelkar College: Vinayak Ganesh Vaze College of Arts Science and CommerceSunil Patange ( [email protected] )
Shrikrishna Mahavidyalaya https://orcid.org/0000-0003-3970-5537
Research Article
Keywords: ZnONPs, Photocatalyst, Reactive Brown 2, Antimicrobial activity.
Posted Date: March 30th, 2021
DOI: https://doi.org/10.21203/rs.3.rs-338595/v1
License: This work is licensed under a Creative Commons Attribution 4.0 International License. Read Full License
Page 2
Version of Record: A version of this preprint was published at Journal of Materials Science: Materials inElectronics on July 13th, 2021. See the published version at https://doi.org/10.1007/s10854-021-06585-z.
Page 3
1
Synthesis of Zinc Oxide nanoparticles using Chrysopogonzizanioidesgrass
extract, its applications in Photodegradation and Antimicrobial Activity
Paresh Morea*, VrushaliInamdara, Shraddha Suresha, Shreyas Dindorkara, Shreya
Peddakolmia, Khushi Jaina, NandiniKhonaa, SummaiyaKhatoona and Sunil Patangeb*
aDepartmentof Chemistry, K. E. T’s, Vinayak Ganesh Vaze College Autonomous,
Mulund (E), Mumbai-400081, Maharashtra, India.
bDepartmentof Physics, ShrikrishnaMahavidyalayaGunjoti, Maharashtra, India.
Abstract
Zinc oxide nanoparticles (ZnONPs) were synthesized using Zinc nitrate hexahydrate as an
oxidizer and Chrysopogonzizanioides (Vetiver) grass as a novel fuel. The X Ray Diffraction
pattern as well as the Rietveld refinement showed a single-phase wurtzite structure. The
average crystallite size and the lattice strain were estimated using Williamson-Hall plot. A
very small value of lattice strain indicates that there is no strain and the crystal lattice is very
stable. Thepresence of various functional groups in the plant extract and the Zinc –Oxygen
bonding in the ZnONPs were confirmed by FTIR. The surface morphology was investigated
using SEM and it showed nanorod like structure. The elemental mapping was carried out
using EDAX. The EDAX spectrum suggests formation of ZnO nanorods along with high
proportion of carbon and low proportion of Si as well as K might have resulted from the rich
organic profile of Chrysopogon zizanioidesgrass extract. Within the UV- Visible Spectrum at
300 nm, the highly blue shifted strong absorption band was observed due to the strong
quantum confinement effect. The band gap was observed to be 3.628 eV. The
photodegradation of RB2 dye was studied over ZnONPs catalyst and it showed excellent
photocatalytic activity. The catalyst was active up to five cycles without losing much of its
efficiency. Further antimicrobial activity was tested against broad range of micro-organisms
namely Staphylococcus aureus, Escherichia coli and much prevalent human fungal pathogen
Page 4
2
Candida albicans. The Minimum inhibitory concentration (MIC) for each micro-organism
was determined using broth micro dilution assay.
Key words: ZnONPs, Photocatalyst, Reactive Brown 2, Antimicrobial activity.
Author for correspondence:[email protected] (SMP),
[email protected] (PSM).
Introduction:
Dye contaminants obtained from textile, printing, production and many other industries have
assumed a pivotal role in damaging the environment. In the textile industries during fabric
dying, a large quantity of unbind dye is released in the wastewater stream. This wastewater
enters the water streams and triggers various environmental problems and health risks. Thus,
dying process precipitates highly coloured effluents in water resources, which is aesthetically
unpleasant and causes harmful effect on the marine ecosystem [1-2]. Various physical and
chemical techniques have been used for the treatments of dyes along with its effluents,
however these methods are not practically feasible as they are harmful and some of the
methods are highly expensive [3-4]. Numerous methods like osmosis, adsorption,
flocculation, etc. have been used for removal of dyes from river, but each method has its own
profits and limitations. These limitations can be conquered by using semiconductor
photocatalysts like TiO2, ZnO, CdS, WO3 and so on [5–8]. Recently researchers are focussing
more on ZnONPs as compared to other semiconductors as it absorbs wide range of the solar
spectrum as well as more light quanta than other semiconductor photocatalyst [9]. Further
ZnO not only has good photocatalytic activity but also has many more other applications
which give ZnO an edge over the most studied TiO2 semiconductor photocatalyst.
Additionally, the production cost of ZnO is also much lower (75% less) as compared with
TiO2semiconductor photocatalyst. This has excited researchers to synthesize ZnO
nanomaterials and to study its various applications. Researchers had synthesized ZnO
Page 5
3
nanomaterials by various physical and chemical methods. However green synthesis has more
advantages over other methods of preparations. Green methods are eco-friendly as they avoid
usage of toxic chemicals, reagents, solvents and they are very convenient to handle. In the
green synthesis of nanoparticles, the fruit juices, plant extract, plant latex, etc. acts as
fuelling, reducing andcapping agents.ReddyYadav et. al. had used juice of watermelon, sugar
cane as a fuel and reported excellent photo catalytic activity of ZnONPs [10-11]. Alamelu et.
al. reported synthesis of ZnONPs using tapioca starch in the photodegradation of methylene
blue dye [12]. Photo catalytic properties of ZnONps were studied using the plant extract of
Cassia fistula and Garcinia xanthochymus [13-14]. Additionally, along with photocatalytic
activity, ZnONPs exhibit antimicrobial properties also. In recent years, the development of
antimicrobial agents and external coatings has received significant attention. Strong UV-
adsorption capacity of ZnONPs makes them a very good antibacterial agent. Recent approach
of metal nanoparticles has gain importance in the development of potent antimicrobial agents
[15]. ZnO material synthesized by spin coating method have shown antimicrobial activity
against Gram-positive as well as Gram-negative bacteria; (such as S. pnemoniae, S. aureus,
E. coli and E. hermannii) at concentrations ranging from 100-600 μg/ml by agar well
diffusion method [16]. The MIC value of ZnONPssynthesized using neem extract was found
to be 10.42μg/ml against Escherichia coli and Salmonella typhi [17]. The antifungal activity
of ZnO biosynthesized using Ziziphus nummularia leaf extract showed effective MIC of 1.25
mg/ml for C. albicans and C. glabrate [18]. However, many of the ZnONPsalso suffered from
some evident disadvantages, namely weak crystallinity, very restricted spectrum reaction
range, less photocatalytic activity, weak antibacterial activity etc. Therefore, an easy and
schematic approach to assembling ZnO nanostructures is extremely desirable for effective
solar energy conversion as well as for effective antimicrobial activity.
Page 6
4
In continuation of our earlier research in photodegradation of industrial dyes using ferritte
nanoparticles [19-20], Herein, we report green synthesis of ZnONPsusing
Chrysopogonzizanioides grass extract. A plant of Indian origin, its oil (extracted from the
roots) has been traditionally used as the medicine, an aroma ingredient. However, the aerial
part of the plant is discarded and is considered as worthless, we have used this aerial part in
the synthesis of ZnO nanorods. The as-synthesized ZnONPs were characterized by using
various physicochemical techniques such as XRD, FTIR, SEM- EDAX, UV-visible, etc. To
the best of our knowledge this is the first study in which the photodegradation of RB2 dye
was studied using ZnONPs. The kinetic study and mechanism of RB2 dye degradation over
ZnONPswere discussed in detail. Further the antimicrobial activity of ZnONPs against
Staphylococcus aureus, (Gram- positive), Escherichia coli (Gram-negative), and Candida
albicans (Fungus) were discussed in detailed.
2. Experimental
2.1. Materials
Zinc nitrate hexahydrate (AR Grade) salt as the zinc precursor was purchased from
EMPLURA. Deionized water, distilled water,Chrysopogonzizanioides grass, S. aureusATCC
6538,E.ColiATCC 8739and C. Albicans were collected from Scientific Research
Centre,K.E.T’s, Vinayak Ganesh Vaze College, Mulund (E), Mumbai-400081, Maharashtra,
India. For the dye degradation: Reactive Brown 2 (CAS number: 12236-93-0/70210-17-2)
with the Molecular formula: C31H20ClN9Na4O12S4 was collected from Lakhani dye stuff
Ambernath Maharashtra, India.
2.2. Preparation of plant extract.
Chrysopogonzizanioidesgrass was collected and thoroughly washed with distilled water to
eliminate impurities. The grass was dried in the shade for 15 days and the dried leaves were
powdered using mortar and pestle. 20g of the prepared powder obtained was boiled at 60oC in
Page 7
5
300mLof distilled water. It was heated until the colour of the aqueous solution turned brown.
The plant extract was cool at room temperature; filtered using Whatman 41 and the filtrate
was used for synthesis of ZnONPs.
2.3. Synthesis of ZnONanorods.
10.0 cm3 of Chrysopogonzizanioidesgrass extract was heated till 60oC, followed by addition
of2.0 g of Zinc nitrate hexahydrate. Temperature of the solution was maintained between
60oC to 80oC under constant stirring till a paste of yellowish white colour was obtained. The
paste was sintered at 400oC for2 hrs. in the muffle furnace. Yellowish white colour powder
obtained was finely pulverized using mortar and pestle. The resulting sample was stored in a
glass vial at room temperature. This is the first report in which chemical reagents such as
NaOH or hydrazine or any other chemical stabilizing or capping agents are not used in the
synthesis of ZnONPs. As down the line these reagents changes the pH of water bodies
causing threats to aquatic flora and fauna and thus it is of immense ecological concern. Green
chemistry principles were followed in the synthesis of ZnONPs by avoiding usage of
chemical reagents.
2.4. Characterisation
Purity and crystalline structure were characterised at room temperature on Philips (Xpert) X-
ray diffractometer (XRD) with Cu kα radiation having wavelength 1.540 A0. FTIR spectra of
the samples were recorded on 3000 Hyperion Microscope with vertex 8 FTIR using KBr
pellets in the range of 400 to 4000 cm-1. The microstructure and the sample morphology of
particles were characterized by FESEM ULTRA PLUS manufacture Carl Zeiss Germany.
Surface area was analysed using micromeritics BET surface area analyser. Photo degradation
of RB2 was studied on UV-Visible spectrophotometer 1800of Shimadzu make.
Page 8
6
2.5. Photocatalytic degradation of dye
Degradation ofRB2 dye over ZnONPs was evaluated under solar irradiation. The
photoreactor used was 250 mL borosilicate beaker. 50 mL, 20 ppm aqueous solution
of RB2 dye containing 0.2 g of catalyst was stirred in dark for 30 minutes until
sunlight irradiation to maintain adsorption equilibria. This was followed by addition of
oxidizing agent H2O2. The mixture was then exposed to irradiation with constant stirring.
Aliquots of the irradiating mixture were taken at a constant interval of 30 minutes and were
analysed on UV-Visible spectrophotometer (Shimadzu- 1800). The reaction was performed
by controlling various parameters viz. amount of catalyst, pH of the dye solution and the
amount of H2O2.
2.6. Antimicrobial activity
MIC of ZnO nanorods of S. aureus ATCC 6538, E. coli ATCC 8739 and C. Albicans were
performed using the broth micro-dilution assay in 96 well microtiter plates. Briefly, overnight
grown bacterial and fungal cultures were re-suspended in Nutrient broth and Sabouraud broth
respectively. The OD of all the three cultures was adjusted to 0.1 at 600nm to give the count
of 8 x 10⁷cells/ml. To determine the MIC of each microbial culture, 100 µl of respective
broth and 10 µl cultures was added into the 96-well plate which gave maximum growth
(Positive or Growth Control).Stock solution was prepared by adding ZnONPs in broth and
sonicated for 2 minutes to obtain a uniform suspension. A 2-fold dilution was then made to
obtain different concentrations of ZnO nanorods ranging from 1000-0.48 µg/ml.100 µl of
varying concentrations ZnO nanorods solution was added to each well with and without
10µlof bacterial or fungal cell suspension to give test and colour blank readings respectively.
The micro titre plate was then incubated at 37°C for 24 hrs in case of bacteria and at room
Page 9
7
temperature for 48 hrs in case of fungus. The least ZnONPs concentration in the well where
no microbial growth was observed was the MIC. Negative control containing only broth was
used in the study. MIC was reported by reading the micro titre plate by micro titre plate
reader at 600nm [21-22].
3. Results and Discussion.
The Rietveld refined XRD pattern of ZnONPs is depicted in the (Fig. 1). The structure was
refined with the space group P63m cusingthe Full Prof programme. The XRD analyses
designated that ZnO nanorods have a hexagonal unit cell, single phase wurtzite structure. The
crystal data, the observed, calculated anddifference XRD profiles for ZnOnanorods after final
cycleof refinement and the refinement factors of ZnO obtained from X-ray powder diffraction
data is depicted in the Table 1. The observed profile and the calculated profile are perfectly
matching with each other (Fig.1). The value ofthe goodness factor(χ2) is equal to 2.56, which
is attributed as excellent value for the assessment. The profile fitting is excellent if the χ2
value is low, hence the procedure adopted for profile fitting was by minimizing the χ2
function [23].The crystal lattice parameters of ZnO nanorods are in the good agreement with
the literature report (JCPDS No. #36-1451). Williamson-Hall plot for ZnONPsis illustrated in
the inset of Fig. 1. The values of average crystallite size and the lattice strain are 42 nm and
0.0027 respectively, obtained from a linear least square fitting to ƞ cosθ–sinθ. The lattice
strain value is low, indicating stable structure of ZnONPs, this may be due to the green
method of synthesis. The crystal structure of ZnONPs from the Rietveld refinement is
depicted in the Fig. 2.
The SEM images and EDS spectra of as-synthesized ZnONPsis revealed in the Fig.3. The
SEM images manifest nanorod–like structures. The low magnification images (Fig. 3a and 3b)
show that these nanorod-like nanostructures are grown by gathering of small distorted
hexagonal shape like structures. The diameter of nanorod-like structures is in between 20-40
Page 10
8
nm. The high magnification image (Fig. 3c) depicts that; the sample consists of agglomerated
nanostructures. The corresponding EDS spectra is depicted in Fig.3d, it demonstrates the
atomic percentage of Zn and O in nanorod-like structure and are observed to be 45.3 and
38.92. Further atomic percentage of C, Si and K were found to be 15.07, 0.33 and 0.37
respectively. High proportion of carbon along with low proportion of Si and K might have
resulted from the rich organic profile of Chrysopogonzizanioidesgrass extract.
The FTIR spectrum of Chrysopogonzizanioidesgrass extract and the biosynthesized ZnONPs
is shown in Fig.4. The FTIR spectrum of Chrysopogonzizanioidesgrass extract (Fig. 4a)
exhibited several peaks at 3400, 2900, 2800, 1600, 1400, 1125, 900, 800,650, 490 cm-1.The
peaks at 3400 (O-H), 1600 (N-H), and 1125 (C-O) or 900 (RCOO) cm-1are related to
alkaloids, flavonoids, and phenolic compounds, respectively [24–27], whereas the broad
stretching band at 3400 cm-1stipulates the existence of hydrogen-bonded groups. These results
signify the presence of flavonoid derivatives in the plant extract. There is shift in the position
as well as the intensity of the band of the spectrum of ZnONPs (Fig. 4b). This is due to the
interrelation of the functional groups of the flavonoids as well as phenols with the ZnONPs.
The prominent and very sharp band was observed at 488 cm−1because of the stretching
vibration of Zn-O bond in tetrahedral coordination. A very weak band at 654 cm−1was
allocated to the stretching vibrations of Zn-O bonds in octahedral coordination. Tetrahedral
co-ordinations are very strong as compared to the octahedral co-ordinations in the synthesized
samples this further confirms wurtzite structure of ZnONPs [24-25].The band at 1382 cm−1 is
assigned to the asymmetric stretching vibrations of C= O group due to Lewis acidity. Whereas
band at 1629 cm−1is attributed to the symmetric stretching vibrations of C = O group because
ofBronsted acidity. The band at 2856 cm−1 and 2918 cm−1 are because of C-H bending and C-
H stretching vibration respectively. The broad hump at 3431cm−1isascribed to–OH stretching
vibration due to H2O which indicates that at the surface of nanoparticles water molecule is
Page 11
9
adsorbed. The ZnONPs gets easily dispersed into the water (RB2 dye solution prepared in
water) because of surface hydroxyl groups [26].
The optical properties of as prepared Chrysopogonzizanioidesgrass extract and ZnONPs were
examined using UV- Visible spectrophotometer in the range of 200 nm to 800 nm. The light
brown coloured extract showed a small hump in the near UV region (297.2 nm) as shown in
the Fig. 5a. The observed hump was probably due to the plant biomolecules (polyphenols,
flavonoids, etc.), which have crucial role in the reduction of metal ions [27- 28].To study
optical properties of ZnONPs, the particles were dispersed in deionised water followed by
ultrasonicationforabout15 minutes. The resultant solution showed a very strong band at 300
nm Fig.5a, this band is very much blue shifted when they are compared with their bulk
counterpart (360 nm). The strong blue shifted absorption edge confirms that ZnONPs showed
a very strong quantum confinement effect [29]. The change in the spectrum provided the first
conformation for the formation of ZnONPs. The optical band gap was calculated using UV-
Visible spectra by Tauc plot method (Fig. 5b). Extrapolating of straight line in the plot of
(αhν)2 vs Energy (hν) gives the value of optical band gap of ZnO NPs[30]. The optical band
gap was found to be 3.628 eV which shows slight increase (~ 0.4 eV) than the ideal value (at
room temperature). The increase in the band gap also supports that ZnONPs exhibits quantum
confinement effect. The photocatalytic activity was carried out using ZnONPs as a catalyst to
study the photodegradation of RB2 dye at various reaction conditions. The UV-Visible
spectrum showed absorption band at 463 nm and a small hump at 280 nm assigned to the
visible and UV region respectively.
Surface area of ZnONPswas estimated using (BET) surface analyzer at the temperature of-
196 °C. The samples were prepared with the flow of N2gas at the temperature of 150 °C for2
hours. The Langumir theory was extended by Brunauer, Emmett and Teller and they gave
following equation[31].
Page 12
10
1 Q[(P0P )−1] = C−1QmC ( PP0) + 1QmC(1)
The terms involved in the equations are, P-equilibrium pressure, P0-saturation pressure, Q-
amount of gas adsorbed on the adsorbate, Qm-monolayer adsorbed and C is the BET constant.
The BET plot (1/[Q(P0/P)] vs P/P0) of the ZnONPs is depicted in the Fig. 6a. It is clear from
the figure that the plot is linear, and the values obtained from the slope (A) and intercept (I)
gave unique values of Qm and C respectively. From the BET plots different variables were
calculated such as slope - 3.708996 g/cm3, Intercept -0.110422 g/cm3, Qm-0.2618 cm3/g, C -
34.589221, Stotaland SBET- 1.1398m2/g and pore width 77.3224 Å. The various empirical and
computational values required for plotting the curve are tabled in Table 2.The values of‘Qm’
and ‘C’, total surface area (Stotal) and specific surface area (SBET) were calculated according to
equation (2) , (3), (4) and (5). Qm = 1(A+I)(2)
𝐶 = 1 + 𝐴𝐼 (3)
𝑆𝑡𝑜𝑡𝑎𝑙 = 𝑄𝑚𝑁𝑆𝑉 (4)
𝑆𝐵𝐸𝑇 = 𝑆𝑡𝑜𝑡𝑎𝑙𝑀 (5)
Where Avogadro's number is ‘N’, The molecular cross-sectional area is ‘s’(0.1620 nm2), the
molar volume of the adsorbate gas is ‘V’ and mass of adsorbent sample is ‘M’ (0.1304g).The
Stotaland SBET were found to be1.5839m2/g and 1.138m2/g respectively. Thet-plot and BJH
adsorption methods were utilized to calculate pore volume and pore size and were found to be
0.00203 cm3 g-1 and 77.3224 nm respectively. The value of BET surface area of ZnO
nanorods was 1.5839 m2/g. The nitrogen adsorption and desorption isotherms of ZnO
nanorods was recorded and depicted in the Fig. 6b. According to the IUPAC classification, the
recorded isotherms are of the type IV [32]. The adsorption-desorption isotherm of
Page 13
11
ZnONPsforms type IV hysteresis loop indicating self-assembly of small nanoparticles which
exist as complex porous structure.Also, it is to be noted that the type IV isotherms are typical
isotherm for mesoporous materials [33]. Mesoporous materials are good adsorbent and hence
RB2 dye was well adsorbed at the surface of ZnONPs which leads in the rapid photo
degradation of RB2 dye.
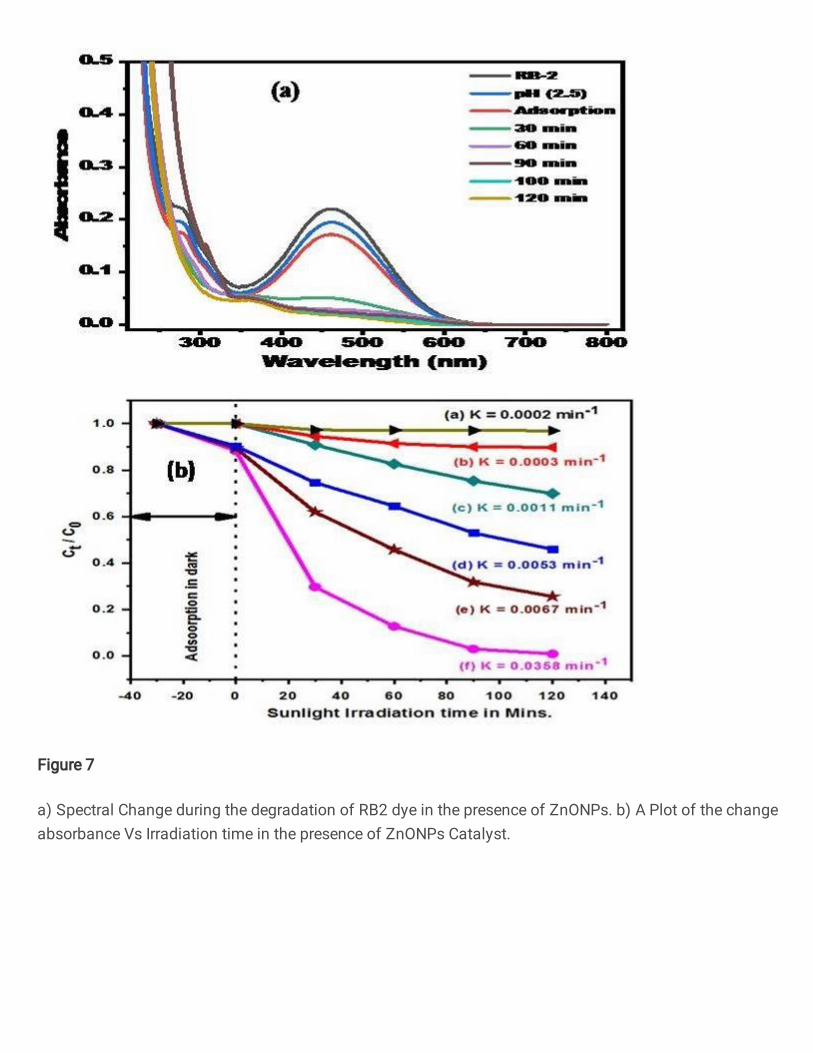
The degradation of RB2 dye was monitored through the variation observed in the intensity of
the absorption peak of the RB2. During beginning (t=0), the absorption band was observed at
463 nm in visible region and a small hump at 280 nm in the UV region. To demonstrate the
activity of ZnONPs catalyst on RB2 solution, the experiment was carried out in solar
irradiation. To the 50mL of 20 ppm RB2 solution, 25 mg of the catalyst was mixed, and the
solution was kept on the magnetic stirrer for adsorption and desorption in the dark for 30
minutes. Followed by addition of 0.2 mL H2O2 and at a maintained pH of the solution 2.5, the
beaker was kept in the sunlight to record the absorbance of the dye solution at the interval of
30 minutes using UV-Visible spectrophotometer. The absorption peak intensity of the RB2 at
463 nm gradually decreased in intensity and there is new band observed with the increase in
the irradiation time as shown in the Fig. 7a. These observations confirmed the degradation of
chromophore responsible for the colour of RB2 dye. Further the hump due to aromatic rings
vanished which indicate degradation of aromatic rings. The results indicate that during 30
minutes of adsorption desorption in the dark, the dye degradation was 2.32 %, after 30, 60, 90
and 120 minutes the degradation was 77.27%, 87.27%, 91.81% and 99.98%. The as
synthesized catalyst ZnONPs is very effective in the photo degradation of RB2 with almost
100 % degradation in just 120 minutes. The coefficient of determination (R2) was found to be
0.998 which is very close to unity. Thus, the reaction follows pseudo first order kinetics [34]
Different control experiments were carried out in the presence of ZnONPs using UV-Visible
spectroscopy and the data is depicted in the Fig.7b. It is clear from the graph that a very
Page 14
12
negligible dye was degraded in the absence of catalyst and H2O2 [RB2 + light (a)]. Dye
degradation efficiency was improved very slightly in the presence ([RB2+ H2O2 + light (b)],
and absence [RB2 + H2O2 + dark(c)] of light. The dye degradation efficiency was increased
when the catalyst was added [RB2 + ZnO NPs + dark (d)]. In the sunlight the dye
degradation efficiency increases to the great extent [RB2 + ZnO NPs + light (e)]. This is
since photo-induced process produces electron-hole pairs, which when migrate throughout
the Zinc oxide crystal and eventually responsible for increasing degradation efficiency [35].
However, the rate of the reaction was drastically increased to 100 % when the reaction was
carried out with [RB2 + ZnO NPs + light +H2O2 (f)], also the rate constant was found to be
highest in this case as depicted in the Fig.7b.
ZnO is an excellent semiconductor oxide which shows the semi-conductive nature at room
temperature. Broad direct band gap width of 3.37 eV, high excitation binding energy (60
meV) allows ZnO to show good photocatalytic activity along with anti-microbial and anti-
fungal properties. When ZnO is irradiated with solar radiation, the photonic energy (hv)
which is equal to or greater than threshold energy (Eg), promotes the electrons from filled
valence band to an empty conduction band. This photo-induced process produces electron-
hole pairs which has ability to delocalize throughout the ZnO lattice.The holes thus produced
reacts with water molecules resulting in the formation of H+ ion and OH• radical.The electron
reacts with oxygen molecules to form superoxide ions, which in turn reacts with H+ formed in
the reaction (II) to formhydroperoxyl radicals (HO2•).Two hydroperoxyl radicals combine to
give hydrogen peroxide which in turn reacts with superoxide ions yielding hydroxyl free
radicals having very high oxidizing ability. The attack of resulting hydroxyl radicals on
adsorbed RB2 molecules results in rapid formation of intermediate compounds which gets
converted to CO2 and H2O. The conversion of RB2 dye into less harmful degradation
products is due to the formation of active oxygen species. Based on the above results, we
Page 15
13
proposed the photocatalytic mechanism using ZnONPs under sunlight irradiation.Possible
Mechanism for the catalytic RB2 dye degradation under sunlight irridation using ZnONPsis
depicted in theFig. 8.
ZnO NPs → e- + holes (I)
holes + H2O→ H+ + OH• (II)
e− + O2→O2•− (III)
O2•− + H+→HO2• (IV)
2 HO2• →H2O2 + O2↑ → OH• + OH− + O2 (V)
RB2 + OH• → Intermediates → Degradation Products (CO2 + H2O) (VI)
Catalyst loading plays a very crucial role in photodegradation process. It is one of the most
importantparameters in the catalysis process. To make the process economically viable and
industrially important, optimum amount of the catalyst is to be used in the experiment. The
effect of catalyst on the degradation of RB2 at dye concentration of 20 mg/L, H2O2-0.2mL
and pH-2.5 is depicted in the Fig.9a. The results indicate that the rate of dye degradation
decreases as the concentration of the catalyst increases. Due to increase in concentration of
the catalyst the turbidity of the solution increases and there will be hindrance to the sunlight
in the penetration of the light through the dye solution. This leads to decrease in the rate of
photo-phenton process and the degradation efficiency decreases [36]. Based onobservations,
the optimized weight of the catalyst is 0.025g/L. The rate constant was also highest with this
concentration as depicted in the Table 3. All the experiments were performed with 0.025g/L
of photocatalyst.
Eg
O2•−
Page 16
14
pH of the solution plays a very critical role in the photo- degradation of RB2 dye. To make
the photo degradation process very effective and economical, the process is to be carried out
at appropriate pH. Hence experiments were carried out to check optimum amount of pH to be
maintained to carry out the reaction. The role of pH in the photodegradation of RB2 at
constant dye concentration of 20 mg/L, catalyst 0.025g/L and H2O2 0.2 mL,is depicted in the
Fig.9b.The results indicated high photo degradation at lower pH with maximum photo
degradation with pH 2.5. Hence all the experiments were carried out at pH 2.5. The rate
constant was also highest with this pH as depicted in the Table 3.
To make the process cost effective control dosages of H2O2 is essential as it is costly
chemical. The effect of H2O2 dosage on the degradation of RB2 at constant dye concentration
of 20 mg/L, catalyst 0.025g/L and pH-2.5 is depicted in the Fig.9c.The results indicate that
the rate of the photo degradation and the rate constant increases as the concentration of H2O2
increases. Based on above observations, the optimized concentration of H2O2 is 0.2 mL. The
rate constant was also highest with 0.2 mL of H2O2 as depicted in the Table 3.
It is clear from the photodegradation mechanism that H2O2 is generated during the
degradation process (equation V of mechanism) hence only 0.2 mL of H2O2is required for
optimising the process. The superoxide ions generated (equation III of mechanism) combine
with H2O2 to generate hydroxyl radical (OH•) which breaks organic pollutant to produce
intermediate and the intermediate gives the final product CO2 + H2O[37].The stability and
reusability of the ZnONPs photocatalystwere tested over RB2 dye, after recycling to replicate
the experiments under identical conditions Fig. 9d. More specifically, under sunlight
irradiation, ZnONPs photocatalystdisplayed sustained and consistent behaviour up to the 5th
cycle which proves the catalyst’s stability and recyclability.
Antimicrobial Activity.
Page 17
15
Due to the wide exploitation of antibiotics in modern era the rise of antibiotic resistant
bacteria has been increasing exponentially. To put this situation under control, it is necessary
to find antibiotics which show broad spectrum killing. Nanoparticles have broad range of
applications in many fields of life sciences. ZnONPs has known to show promising killing
effect against planktonic cultures and has proven to effectively inhibit biofilm formation by
gram positive or negative microbes. The teichoic acid filaments present in peptidoglycan
layer of gram-positive bacteria are negatively charged. Also, the cell wall of gram-positive
bacteria has abundant pores. Positively charged ZnONPs and their nanosized makes them
ideal candidate to penetrate easily, produce cellular lesions and induce cell death in gram
positive bacteria[38].The cell wall composition of gram-negative is complicated, wherein the
peptidoglycan is held together with lipopolysaccharide, lipoproteins and phospholipids which
effectivelyform a barrier that restricts penetration of nutrients and removal of catabolism
products at the level of porins [38].
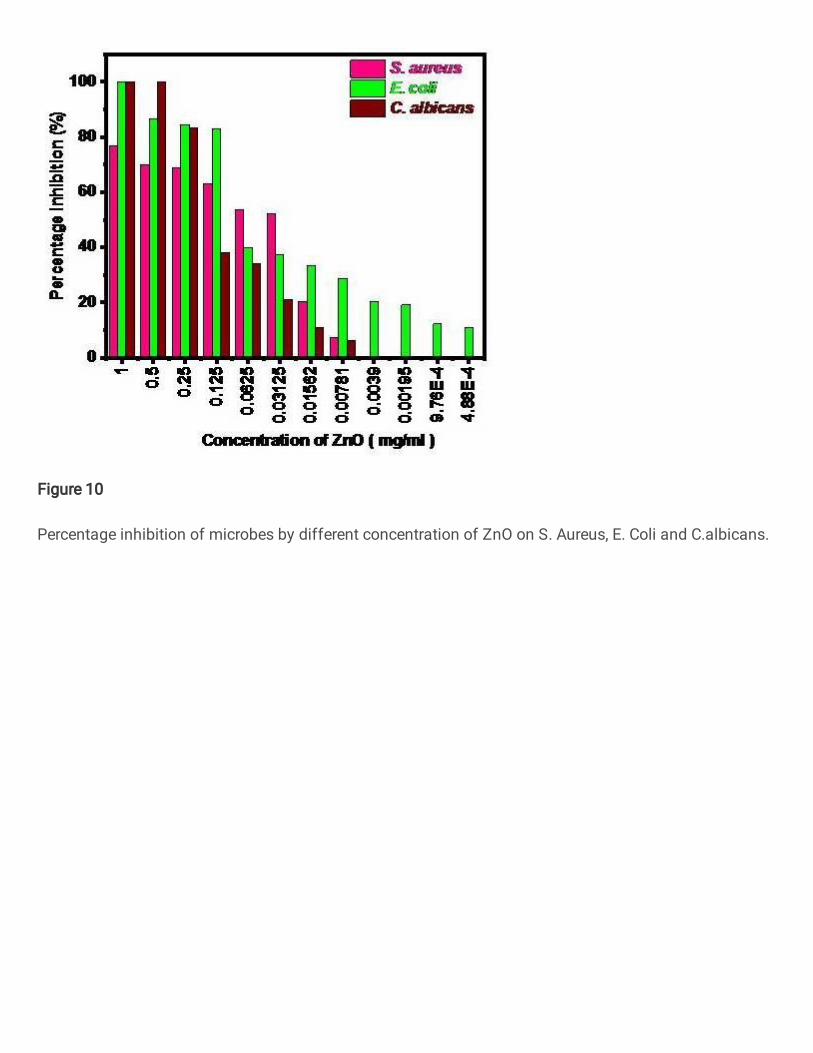
We have observed microbial static effect of ZnONPs on a broad range of microbes. The
study was done in triplicates, it was seen that ZnO showed broad spectrum inhibition of
microbial cultures.For the analysis of antimicrobial action of the ZnONPs, a gram positive
bacteria S. aureus ATCC 6538, a gram negative bacteria E.coli ATCC 8739 and a fungal
strain C. albicans were selected as model organisms. It was seen that, with the varying
concentration of ZnONPs nanoparticles the percentage inhibition of microbes also varied.
More the concentration of ZnONPs more the percentage inhibition of microbes, thus
concentration of ZnONPs was directly proportional to the percentage inhibition of
microbes.A graph of concentration of ZnONPs versus percentage inhibition of microbes (S.
aureus, E. coli and C. albicans) was plotted (Fig.10). Percentage inhibition for each was
calculated by the ratio of absorbance of test solution to the absorbance of control solution
multiplied by 100.
Page 18
16
𝑷𝒆𝒓𝒄𝒆𝒏𝒕𝒂𝒈𝒆 𝑰𝒏𝒉𝒊𝒃𝒊𝒕𝒊𝒐𝒏 𝒐𝒇 𝑴𝒊𝒄𝒓𝒐𝒃𝒆𝒔 = 𝑨𝒃𝒔𝒐𝒓𝒃𝒂𝒏𝒄𝒆 𝒐𝒇 𝒕𝒆𝒔𝒕 𝒔𝒐𝒍𝒖𝒕𝒊𝒐𝒏𝑨𝒃𝒔𝒐𝒓𝒃𝒂𝒏𝒄𝒆 𝒐𝒇 𝒄𝒐𝒏𝒕𝒓𝒐𝒍 𝒔𝒐𝒍𝒖𝒕𝒊𝒐𝒏 × 𝟏𝟎𝟎
In the graph, it is seen that ZnO NPs shows a 100% inhibitory concentration (IC 100) of 1.0
mg/ml and 0.5 mg/ml forE. coli and C. albicans respectively. However, for S. aureusZnO
NPs shows 70% inhibitory concentration (IC 70)of 0.5 mg/ml. After the above concentrations
of ZnO NPS the percentage inhibition of microbes decreases with the decreasing
concentration of ZnO for all the three model microorganisms (Fig.10).
ZnONPswere found to be effective againstGram positive and Gram-negative bacteria as well
as against fungal strain, which indicates it can act as broad spectrum microstatic drug. E.
coli ATCC 8739 was treated with ZnONPs, showed growthinhibition and leading to death in
the E.coli cells at very low concentration. The MIC value of ZnONPs against E.coli found
(1.0 mg/mLIC100) (Fig.11a) which is very low than the formerly reported values for bare
ZnO [39-41], doped ZnO [42] and ZnO materials in combination with antibiotics . In case of
E. coli ATCC8739, ZnO-NP hasa higher efficiency in opposition to the strain in planktonic
growth. Active pathogenic growth of S. aureus ATCC 6538 was treated by ZnO-NP, and it
was found that cell growth was inhibited in the presence of very low concentration. The
growth inhibition and death in microbes observed in the ZnONPs treated wells and the MIC
(0.5 mg/mL IC 70) (Fig.11b)obtained against S. aureus ATCC 6538 is very low than the
previously reported values[43-44]. The ZnONPs compounds were tested for antifungal
activity toward one reference pathogenic fungal strain, C. albicans.ZnONPs shows the most
promising antifungal activity, being active against the fungal strain in planktonic growth state
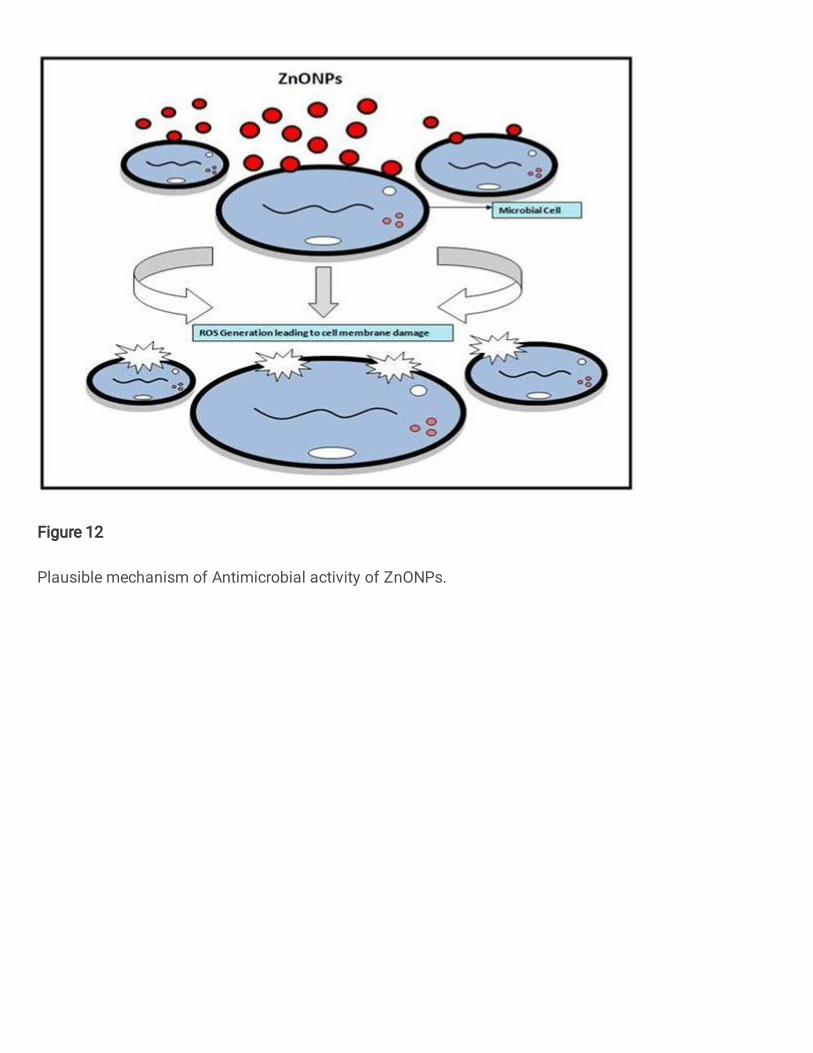
(0.5 mg mL-1 IC 100) (Fig.11c). ZnO obstructs membrane integrity by producing reactive
oxygen species that destroy fungi [45-49]. Furthermore, production of hydrogen peroxide and
Zn2+ has played a key role in the antifungal activity of nanoparticles.The obtained MICs are
Page 19
17
lower than previously reported several zinc oxide-based materials ZnO [39, 41], Pd-doped
ZnOand ZnO-chitosan composites [46], polycarbonate-based cationic polymer and different
antibiotics[41, 50]. Based on the above resultsthe plausible mechanism for Antimicrobial
activityofZnONPsis depicted in theFig. 12.
4. Conclusion:
This study signifies a simple green synthetic approach towards the synthesis of ZnONPs
using aqueous Chrysopogonzizanioidesgrassextract. The photocatalytic degradation by ZnO
NPs was checked on RB2 dye under solar irradiation. The catalyst is very stable and showed
excellent catalyticefficiency up to five cycles. Further it describes the use of ZnONPs as
antibacterial and antifungal agent. The antibacterial and antifungal results were very
promising.
Acknowledgement:
Authors are thankful to TIFR Faculties, Dr. Deepa Khushlani and Mr. BalsahebChandanshive
for BET Analysis, Mr. Nilesh Kulkari for XRD, Mrs. Bhagyashri Chalke for SEM,EDAX,
SAIF IIT Bombay for FTIR,Dr.Kiran Kharat from Department of Zoology K.E.T’s,
V.G.Vaze College Autonomous for discussion on Antimicrobial activity and Principal
Dr.B.B.Sharma for providing all the infrastructure facilities.
Page 20
18
References:
[1] N.Barka, A. Assabbane, A. Nounach, L. Laanab, Y.A. Ichou, Desalination, 235, 264(2009).
[2] G. Zhu, H.Mirabbos, K. Kenichi, Xu Cai, M. Nobuhiro, K. Okada, P. Liu, J. Zhou,
Materials Chemistry and Physics, 142,95(2013).
[3] N.Mahmoodi, Water Air Soil Poll., 224, 1419(2013).
[4] N. Mahmoodi, F. Najafi, Mesopor. Mater., 156, 153(2002).
[5] B. Liu, T. Torimoto, H. Yoneyama, J. Photochem.Photobiol. A: Chem., 113,93(1998).
[6] I. Konstantinou, T. Sakellarides, V. Sakkas, T. Albanis, Environ. Sci. Technol.,
35,398(2001).
[7] Y. Kwon, K. Song,W.Lee, G.Choi, Y.RagDo., J.Catal., 191, 192(2000).
[8] H. Lin, S. Liao, S. Hung, J. Photochem. Photobiol. A: Chem., 174,82(2005).
[9] S. Sakthivel, B. Neppolian, M. Shankar, B. Arabindoo, M. Palanichamy, V. Murugesan,
Energy Mater. Sol. C., 77,65(2003).
[10] L.ReddyYadav, D. Kumar, K.Kavithra, H. Rajanaika, B. DarukaPrasad,
H.Nagabhushana, G. Nagaraju, International Journal of Nanoscience., 15,1650006(2016).
[11] L.ReddyYadav, B. Archana, K. Lingaraju, K. Kavitha, D.Suresh, H. Nagabhushana,
G.Nagaraju, International Journal of Nanoscience 15(2),1650013(2016).
[12] K.Alamelu, H. RajaNaika, H. Nagabhushana, T. Ramakrishnappa, R. Geetha,
Balkrishna, G. Nagaraju, Materials Characterization., 99, 266(2015).
[13] D.Suresh, P.Nethravathi, Udaybhanu, H.Rajanaika, H. Nagabhushana, S. Sharma,
Materials Science in Semiconductor processing., 31,446(2015).
[14] P.Nethravathi, G.Sgruthi, D. Suresh, Udaybhanu, H. Nagabhushana, S. Sharma, Ceramic
International., 41, 8680(2015).
[15] R.Singh, W.James, Jr.Lillard, Experimental and molecular pathology., 86(3),215(2009).
[16] K. Kaviyarasu, C. Magdalane, K. Kanimozhi, J. Kennedy,B. Siddhardha,E. Reddy, N.
Rotte, C.Sharma,F. Thema, D. Letsholathebe, G. Mola, Journal of Photochemistry and
Photobiology B: Biology., 173,466(2017).
[17] B.Thakur, A.Kumar, D.Kumar, South African Journal of Botany., 124, 223(2019).
[18] H. Padalia, S.Chanda, Artificial cells, nanomedicine, and biotechnology., 45(8),
1751(2017).
[19] K. Jangam, K. Patil, S. Balgude, S. Patange, P. More, Journal of Physics and Chemistry
of Solids., 148,109700(2021).
[20]K. Jangam, K. Patil, S. Balgude, S. Patange, P. More, RSC Adv., 10, 42766(2020).
Page 21
19
[21] M.Alekish, Z. Ismail, B. Albiss, S. Nawasrah, Veterinary World., 11(10), 1428 (2018).
[22] P.Mariappan, K.Krishnamoorthy, J. Kadarkaraithangam, M. Govindasamy, Nanomedicine
:Nanotechnology, Biology, and Medicine., ,7,184(2011).
[23] L. McCusker, R.VonDreele, D.Cox, D. Louër, P. Scardi, J ApplCryst., 32,36(1999).
[24] S. Kumar, S. Mukherjee,K. Singh, S. Chatterjee, A.Ghosh, J. Appl. Phys.,
110,103508(2010).
[25] Y. Guo, X. Cao, X.Lan, C. Zhao, X. Xue,Y. Song, J. Phys. Chem. C.,112, 8832(2008).
[26] S. Darshan, J. Ranjana, Ceramics International., 43, 8488(2017).
[27]A. Mittal, C. Yusuf, U. Banerjee, Biotechnology Advances., 31, 346(2013).
[28] A. Imran, C.Peng, Y. Tong, N.Iffat., RSC Advances., 8, 8878(2018).
[29]A.Moharram, S.Mansour, M.Hussein, M.Rashad, Journal of Nanomaterials,2014,716210
(2014).
[30] M.Debanath, S.Karmakar, Materials Letters., 111, 116 (2013).
[31] D. He, Z. Huan, M. Wang, J Mater Sci: Mater Electron., 30, 1468(2019).
[32] K.Sing, D.Everett, R. Haul, Pure and Applied Chemistry., 57(4), 603 (1985).
[33] A.Alswatta, M. Ahmad, N.Al-HadaH. Kamari,M. Hussain, N. Ibrahim, Results in
Physics., 7 , 723 (2017).
[34] N.Laouedj, A. Elaziouti, A. Bekka, Fibers and Polymers., 13(3), 303 (2012).
[35] W. Zhansheng,X. Chen, X. Liu, X. Yang, Y. Yang, Nanoscale Research Letters.,
147,1(2019).
[36] T. Soltani, M.H. Entezari, Ultrason.Sonochem., 20, 1245(2013).
[37] Y.Zoang, Z. Li, X.Wang, J. Ma, Y.Men, Ceram.Int., 40(7), 10375 (2014).
[38] J.John, Thwaites, H. Neil, Mendelson, Advances in Microbial Physiology.,32,
173(1991).
[39] M.Premanathan, K.Karthikeyan, K. Jeyasubramanian, G.Manivannan, Nano med, 7,
184(2011).
[40] D.Ong, P. Wu, P. Su, D. Wang, H. Tian, Mater. Lett., 70, 94(2012).
[41] R.Bhande, C.Khobragade, R.Mane, S. Bhande, J. Nanopart. Res., 15, 1413 (2013).
[42] B.Guo, P.Han, L. Guo, Y.Cao, A. Li, J.Kong, H.Zhai,D.Wu, Nanoscale Res. Lett., 10, 1
(2015).
[43] J. Yunhong, Z.Lingling, W.Dongsheng, D.Yulong, Materials Science and Engineering C.,
69, 361(2016).
[44] N. Sharma, J.Kumar, S.Thakur, S. Sharma, V. Shrivastava, Today., 5(1),50 (2013).
Page 22
20
[45] H.Chen,C. Liu, D. Chen, K.Madrid, S.Peng, X. Dong, M.Zhang, Y. Gu.; Mol. Pharm,
12, 2505 (2015).
[46] B.Guo P. Han, Li. Guo, Y. Cao, A. Li, J. Kong, H. Zhai, D. Wu, Nanoscale Research
Letters 10, 336 (2015).
[47] Y. Wang, Q. Zhang, C. Zhang, P. Li, Food Chemistry., 132, 419 (2012).
[48] D.Monteiro, A.Takamiya, L. Feresin, L. Gorup, E.deCamargo, A.Delbem, Med Mycol.,
52(6), 627 (2014).
[49] M. Kratk, J.Vinsov, V.Buchta, ScientificWorld Journal., 2012, 290628(2012).
[50] A. Huh, Y. Kwon, J Control Release., 156, 128 (2011).
Figure Caption:
Figure 1: Rietveld refinement of XRD pattern and Inset:Williamson-Hall plot
for ZnONPs.
Figure 2: Hexagonal Closed Packed Wurtzite crystal structure of ZnONPs with space group
P 63 m c.
Figure 3: SEM images and EDS spectra of as-synthesized ZnO nanostructures at different
magnifications.
Figure 4: a) FTIR spectra of Chrysopogonzizanioidesgrass extract and b) ZnONPsin the
range of 400-4000 cm-1.
Figure 5: a) UV-Visible absorption spectrum of Chrysopogonzizanioidesgrassextractand
ZnONPs b) Optical band gap of synthesized ZnONPs.
Figure 6: a) The fitting curve of the BET surface area and b) Nitrogen adsorptionisotherm of
ZnONPs.
Figure 7: a) Spectral Change during the degradation of RB2 dye in the presence of ZnONPs.
b) A Plot of the change absorbance Vs Irradiation time in the presence of ZnONPs Catalyst.
Figure 8: Possible Mechanism for the photocatalytic RB2 dye degradation under sunlight
irridation using ZnONPs.
Figure 9. Effects of a) Catalyst b) pH variation c) H2O2 Variation d) Recyclability of
ZnONPs.
Figure 10: Percentage inhibition of microbes by different concentration of ZnO on S.
Aureus, E. Coli and C.albicans.
Figure 11: Minimum inhibitory concentration (MIC) for a) E. coli b) S. aureus and c)
C.albicans.
Figure 12. Plausible mechanism of Antimicrobial activity of ZnONPs.
Page 23
Figures
Figure 1
Rietveld re�nement of XRD pattern and Inset:Williamson-Hall plot for ZnONPs.
Figure 2
Page 24
Hexagonal Closed Packed Wurtzite crystal structure of ZnONPs with space group P 63 m c.
Figure 3
SEM images and EDS spectra of as-synthesized ZnO nanostructures at different magni�cations.
Figure 4
a) FTIR spectra of Chrysopogonzizanioidesgrass extract and b) ZnONPsin the range of 400-4000 cm-1.
Page 25
Figure 5
a) UV-Visible absorption spectrum of Chrysopogonzizanioidesgrassextractand ZnONPs b) Optical bandgap of synthesized ZnONPs.
Figure 6
a) The �tting curve of the BET surface area and b) Nitrogen adsorptionisotherm of ZnONPs.
Page 26
Figure 7
a) Spectral Change during the degradation of RB2 dye in the presence of ZnONPs. b) A Plot of the changeabsorbance Vs Irradiation time in the presence of ZnONPs Catalyst.
Page 27
Figure 8
Possible Mechanism for the photocatalytic RB2 dye degradation under sunlight irridation using ZnONPs.
Figure 9
Effects of a) Catalyst b) pH variation c) H2O2 Variation d) Recyclability of ZnONPs.
Page 28
Figure 10
Percentage inhibition of microbes by different concentration of ZnO on S. Aureus, E. Coli and C.albicans.
Page 29
Figure 11
Minimum inhibitory concentration (MIC) for a) E. coli b) S. aureus and c) C.albicans.
Page 30
Figure 12
Plausible mechanism of Antimicrobial activity of ZnONPs.