Page 1
S1
Synthesis, Structure and Properties of Thiophene-fused BODIPYs and AzaBODIPYs
as Near-infrared Agents
Jun Wang, Jin Li, Na Chen, Yayang Wu, Erhong Hao,* Yun Wei, Xiaolong Mu, and Lijuan Jiao*
The Key Laboratory of Functional Molecular Solids, Ministry of Education; Anhui Laboratory of
Molecule-Based Materials; School of Chemistry and Materials Science, Anhui Normal University,
Wuhu, 241000, China
*To whom correspondence should be addressed. E-mail: [email protected] ; [email protected]
Contents:
1. Crystal structure……………………………..……….………………..…………………....S2
2. Photophysical properties…………………………….……………………………………....S5
3. Table S2………………………………….…………..………….…..……..……………….S14
4. Copies of 1H and 13C NMR spectra.……………..…..………………………………….S15
5. High resolution mass spectroscopes for all new compounds………………..………….S51
Electronic Supplementary Material (ESI) for New Journal of Chemistry.This journal is © The Royal Society of Chemistry and the Centre National de la Recherche Scientifique 2016
Page 2
S2
1. Crystal Structure
Figure S1: X-ray structures of 1f. C, light gray; H, gray; N, blue; B, dark yellow; F, light green; S, yellow; O, red.
Figure S2: Intermolecular crystal packing of 1f through H-bonding (dotted line). C, light gray; H, gray; N, blue; B, dark yellow; F, light green; S, yellow; O, red.
Page 3
S3
Figure S3: X-ray structures of 2b. C, light gray; H, gray; N, blue; B, dark yellow; F, light green; S, yellow; O, red.
Figure S4: Intermolecular crystal packing of 2b through H-bonding (dotted line). C, light gray; H, gray; N, blue; B, dark yellow; F, light green; S, yellow; O, red.
Page 4
S4
Table S1. Selected geometrical parameters of compound 1e and 2b obtained from crystallography
1f 2b
the B-N bond distances (A) 1.5655(74) 1.5684(84)
1.5500(43) 1.5578(78)
the intramolecular F-H Hydrogen bond distances (Å) 2.4463(34) 2.6514(23)
the intermolecular F-H Hydrogen bond distances (Å) 2.7922(35) 2.5344(17)
2.8216(19) dihedral angles of two thiophene rings (deg) 5.278(178) 7.958(85)
dihedral angles of two pyrrole rings (deg) 2.634(220) 8.943(116)
dihedral angles between thiophene ring and phenyl ring
Pa (deg)
18.799(210) 38.981(170)
27.547(109) 32.340(87)
dihedral angles between thiophene ring and phenyl ring
Pb (deg)
57.820(174) 75.174(182)
64.115(141) 88.247(140)
dihedral angles between pyrrole ring and phenyl ring
Pc (deg)
24.564(222) 33.697(191)
34.699(104) 40.286(117)
Page 5
S5
2. Photophysical Properties
600 700 8000.0
0.2
0.4
0.6
0.8
1.0
Nor
mal
ized
Abs
orba
nce Chloroform
Cyclohexane DMSO Acetonitrile Toluene
Wavelength (nm)
750 800 850 9000.0
0.2
0.4
0.6
0.8
1.0 Chloroform Cyclohexane DMSO Acetonitrile Toluene
Nor
mal
ized
Flu
ores
cenc
e In
tens
ity
Wavelength (nm)
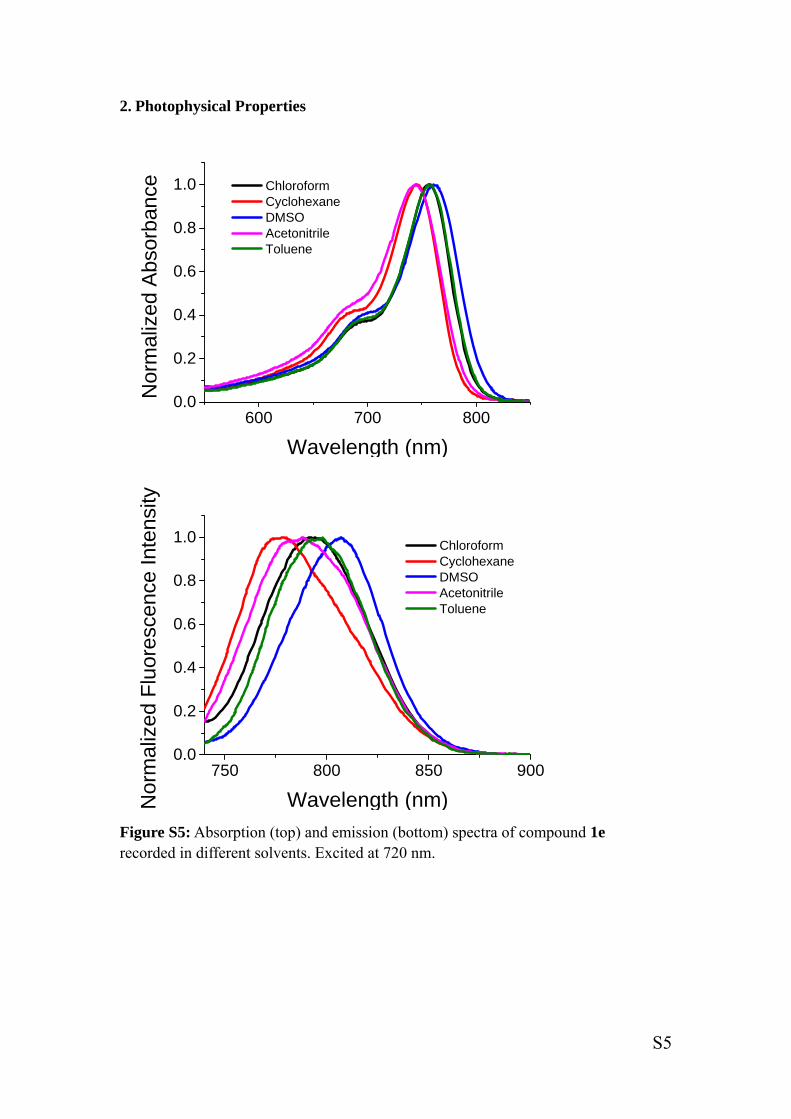
Figure S5: Absorption (top) and emission (bottom) spectra of compound 1e recorded in different solvents. Excited at 720 nm.
Page 6
S6
600 700 8000.0
0.2
0.4
0.6
0.8
1.0 Chloroform Cyclohexane DMSO Acetonitrile Toluene
Nor
mal
ized
Abs
orba
nce
Wavelength nm.
750 800 8500.0
0.2
0.4
0.6
0.8
1.0 Chloroform Cyclohexane DMSO Acetonitrile Toluene
Nor
mal
ized
Flu
ores
cenc
e In
tens
ity
Wavelength (nm)
Figure S6: Absorption (top) and emission (bottom) spectra of compound 1f recorded in different solvents. Excited at 720 nm.
Page 7
S7
550 600 650 700 7500.0
0.2
0.4
0.6
0.8
1.0N
orm
aliz
ed A
bsor
banc
e
Wavelength (nm)
Chloroform Cyclohexane DMSO Acetonitrile Toluene
650 700 750 8000.0
0.2
0.4
0.6
0.8
1.0
Nor
mal
ized
Flu
ores
cenc
e In
tens
ity
Wavelength (nm)
Chloroform Cyclohexane DMSO Acetonitrile Toluene
Figure S7: Absorption (top) and emission (bottom) spectra of compound 2a recorded in different solvents. Excited at 630 nm
Page 8
S8
550 600 650 700 7500.0
0.2
0.4
0.6
0.8
1.0
Wavelength (nm)
Chloroform Cyclohexane DMSO Acetonitrile Toluene
Nor
mal
ized
Abs
orba
nce
650 700 750 8000.0
0.2
0.4
0.6
0.8
1.0
Nor
mal
ized
Flu
ores
cenc
e In
tens
ity
Wavelength (nm)
Chloroform Cyclohexane DMSO Acetonitrile Toluene
Figure S8: Absorption (top) and emission (bottom) spectra of compound 2b recorded in different solvents. Excited at 630 nm
Page 9
S9
600 700 8000.0
0.2
0.4
0.6
0.8
1.0 Chloroform Cyclohexane DMSO Acetonitrile Toluene
Nor
mal
ized
Abs
orba
nce
Wavelength (nm)
750 800 8500.0
0.2
0.4
0.6
0.8
1.0 Chloroform Cyclohexane DMSO Acetonitrile Toluene
Nor
mal
ized
Flu
ores
cenc
e In
tens
ity
Wavelength (nm)
Figure S9: Absorption (top) and emission (bottom) spectra of compound 2c recorded in different solvents. Excited at 660 nm.
Page 10
S10
500 600 700 8000.0
0.2
0.4
0.6
0.8
1.0N
orm
aliz
ed A
bsor
banc
e
Wavelength (nm)
Chloroform Cyclohexane DMSO Toluene
650 700 750 800 8500.0
0.2
0.4
0.6
0.8
1.0
Nor
mal
ized
Flu
ores
cenc
e In
tens
ity
Wavelength (nm)
Chloroform Cyclohexane Toluene
Figure S10: Absorption (top) and emission (bottom) spectra of compound 3a recorded in different solvents. Excited at 610 nm.
Page 11
S11
500 600 700 8000.0
0.2
0.4
0.6
0.8
1.0N
orm
aliz
ed A
bsor
banc
e
Wavelength (nm)
Chloroform Cyclohexane DMSO Toluene
650 700 750 800 8500.0
0.2
0.4
0.6
0.8
1.0 Chloroform Cyclohexane Toluene
Nor
mal
ized
Flu
ores
cenc
e In
tens
ity
Wavelength (nm) Figure S11: Absorption (top) and emission (bottom) spectra of compound 3b recorded in different solvents. Excited at 610 nm.
Page 12
S12
300 400 500 600 700 8000.0
0.2
0.4
0.6
0.8
1.0
1.2
1.4
1.6
Abs
orpt
ion
Wavelength(nm)
0S
60S
Figure S12. Absorption spectra of DPBF (5× 10⁻⁵ mol/ L) upon irradiation in the
presence of 1e (5× 10⁻⁶ mol/ L) for 60s. (a) 0 s to (b) 60s (recorded at 10s interval)
under broad band light ( >590 nm) in chloroform.
300 400 500 600 700 8000.0
0.2
0.4
0.6
0.8
1.0
1.2
1.4
1.6
Abs
orpt
ion
Wavelength(nm)
0S
60S
Figure S13. Absorption spectra of DPBF (5× 10⁻⁵ mol/ L) upon irradiation in the
presence of 2c (5× 10⁻⁶ mol/ L) for 60 s. (a) 0 s to (b) 60 s (recorded at 10 s interval)
under broad band light ( >590 nm) in chloroform.
Page 13
S13
300 400 500 600 700 8000.0
0.2
0.4
0.6
0.8
1.0
1.2
1.4
1.6
60S0S
Abs
orpt
ion
Wavelength(nm)
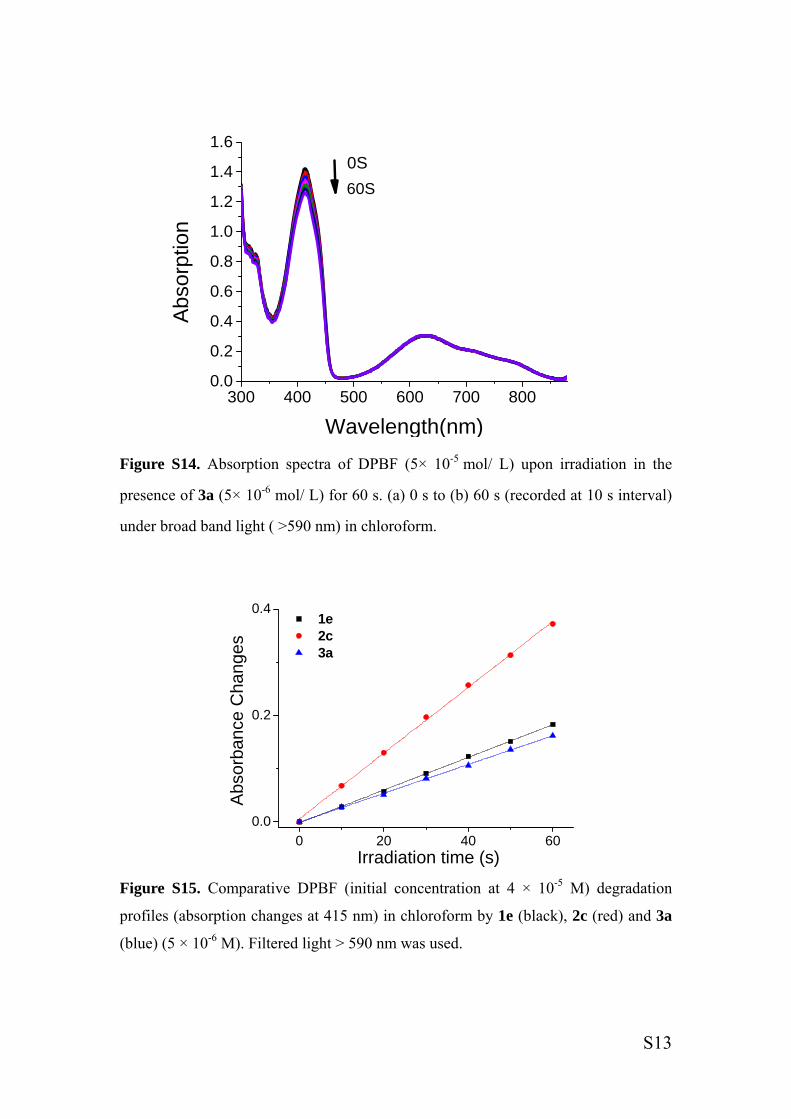
Figure S14. Absorption spectra of DPBF (5× 10⁻⁵ mol/ L) upon irradiation in the
presence of 3a (5× 10⁻⁶ mol/ L) for 60 s. (a) 0 s to (b) 60 s (recorded at 10 s interval)
under broad band light ( >590 nm) in chloroform.
0 20 40 600.0
0.2
0.4 1e 2c 3a
Abs
orba
nce
Cha
nges
Irradiation time (s)
Figure S15. Comparative DPBF (initial concentration at 4 × 10⁻⁵ M) degradation
profiles (absorption changes at 415 nm) in chloroform by 1e (black), 2c (red) and 3a
(blue) (5 × 10⁻⁶ M). Filtered light > 590 nm was used.
Page 14
S14
3. Table S2: Photophysical properties of 1e-f, 2a-c and 3a-b in different solvents at room temperature (DMSO: Dimethyl sulfoxide).
BODIPYs solvents λabsmax
(nm) λem
max (nm) logεmax
a φc Stokes Shift (cm-1)
1e
cyclohexane 746 778 5.22 0.02 551 toluene 757 798 4.97 0.02 679
chloromethane 757 796 5.22 0.02 647 DMSO 761 806 5.19 0.01 734
acetonitrile 745 788 5.18 0.01 732
1f
cyclohexane 757 792 5.21 0.05 584 toluene 767 795 5.18 0.07 459
chloromethane 767 803 5.21 0.05 585 DMSO 756 812 5.14 0.01 912
acetonitrile 771 802 5.14 0.01 501
2a
cyclohexane 661 687 5.19 0.86 573 toluene 668 692 5.15 0.76 519
chloromethane 670 694 5.20 0.85 516 DMSO 664 695 5.08 0.61 672
acetonitrile 655 683 5.18 0.68 626
2b
cyclohexane 671 694 5.17 0.85 494 toluene 678 702 5.17 0.76 504
chloromethane 677 700 5.26 0.82 485 DMSO 679 710 5.10 0.52 643
acetonitrile 665 697 5.16 0.56 690
2c
cyclohexane 735 769 5.07 0.001 602 toluene 718 788 5.10 0.002 1237
chloromethane 730 783 5.08 0.002 927 DMSO 732 793 5.01 0.001 1051
acetonitrile 721 779 5.09 0.001 1033
3a
cyclohexane 626 692 4.76 0.002 1524 toluene 635 693 4.73 0.001 1318
chloromethane 628 709 4.73 0.001 1819 DMSO 630 -c 4.68 - -
acetonitrile - - - - -
3b
cyclohexane 618 697 4.70 0.01 1834 toluene 623 708 4.71 0.004 1927
cyclohexane 618 697 4.70 0.01 1834 DMSO 626 - 4.65 - -
acetonitrile - - - - - aMolar extinction coefficients are in the maximum of the highest peak. bFluorescence quantum yields of 1e-f were calculated using ICG (φ = 0.12 in DMSO), 2a-c were calculated using 1,7-diphenyl-3,5- di(p-methoxyphenyl)-azadipyrromethene (φ = 0.36 in chloroform), 3a-b were calculated using 1,3,5,7-tetraphenyl-azadipyrromethene (φ = 0.34 in chloroform). c“-” means no data available due to poor solubility or very low emission.
Page 15
S15
4. Copies of 1H NMR and 13C NMR spectra
1H NMR spectrum of Compound 8a in CDCl3 solution.
Page 16
S16
13C NMR spectrum of Compound 8a in CDCl3 solution.
Page 17
S17
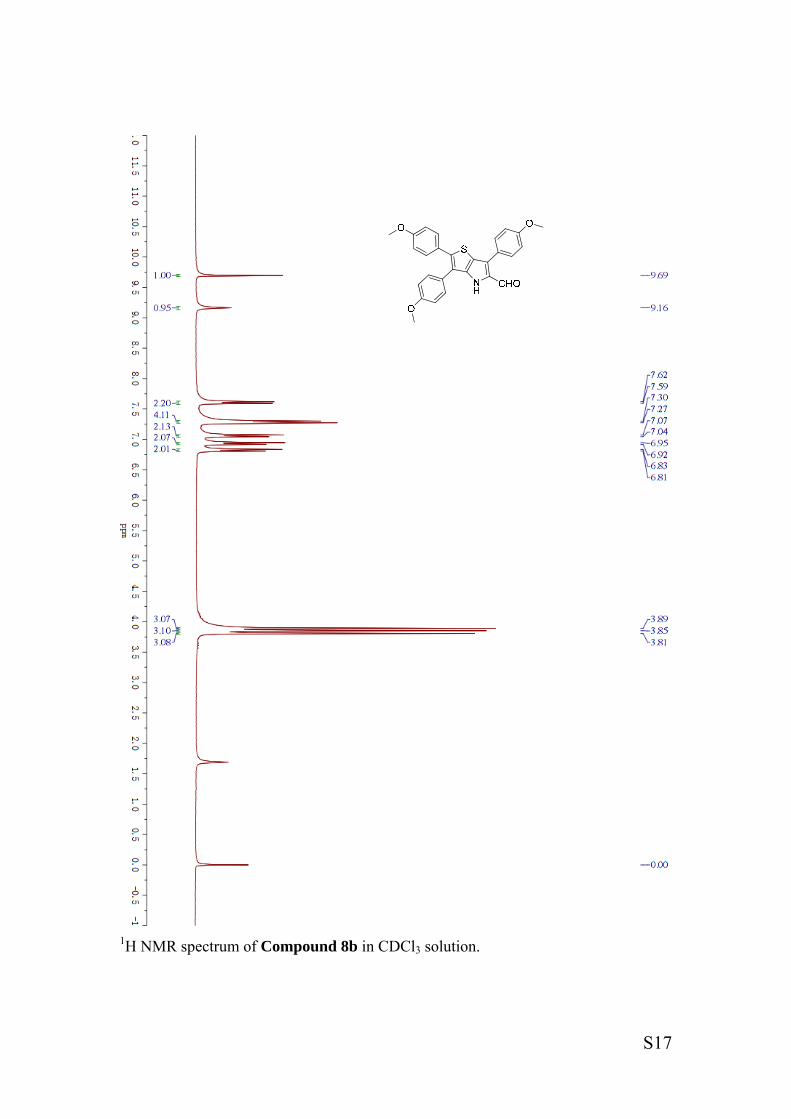
1H NMR spectrum of Compound 8b in CDCl3 solution.
Page 18
S18
13C NMR spectrum of Compound 8b in CDCl3 solution.
Page 19
S19
1H NMR spectrum of Compound 2a in CDCl3 solution.
S N N SB
F F
Page 20
S20
13C NMR spectrum of Compound 2a in CDCl3 solution.
S N N SB
F F
Page 21
S21
1H NMR spectrum of Compound 2b in CDCl3 solution.
S N
O
O
O
N SB
F F
O
O
O
Page 22
S22
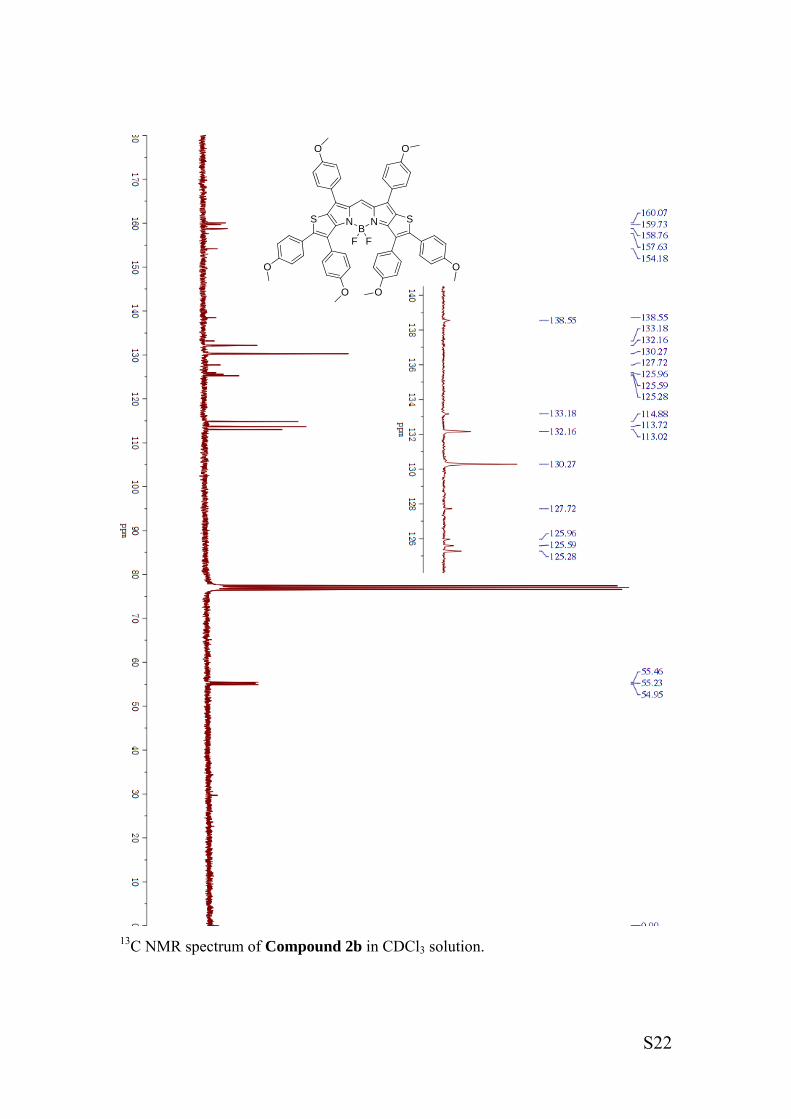
13C NMR spectrum of Compound 2b in CDCl3 solution.
S N
O
O
O
N SB
F F
O
O
O
Page 23
S23
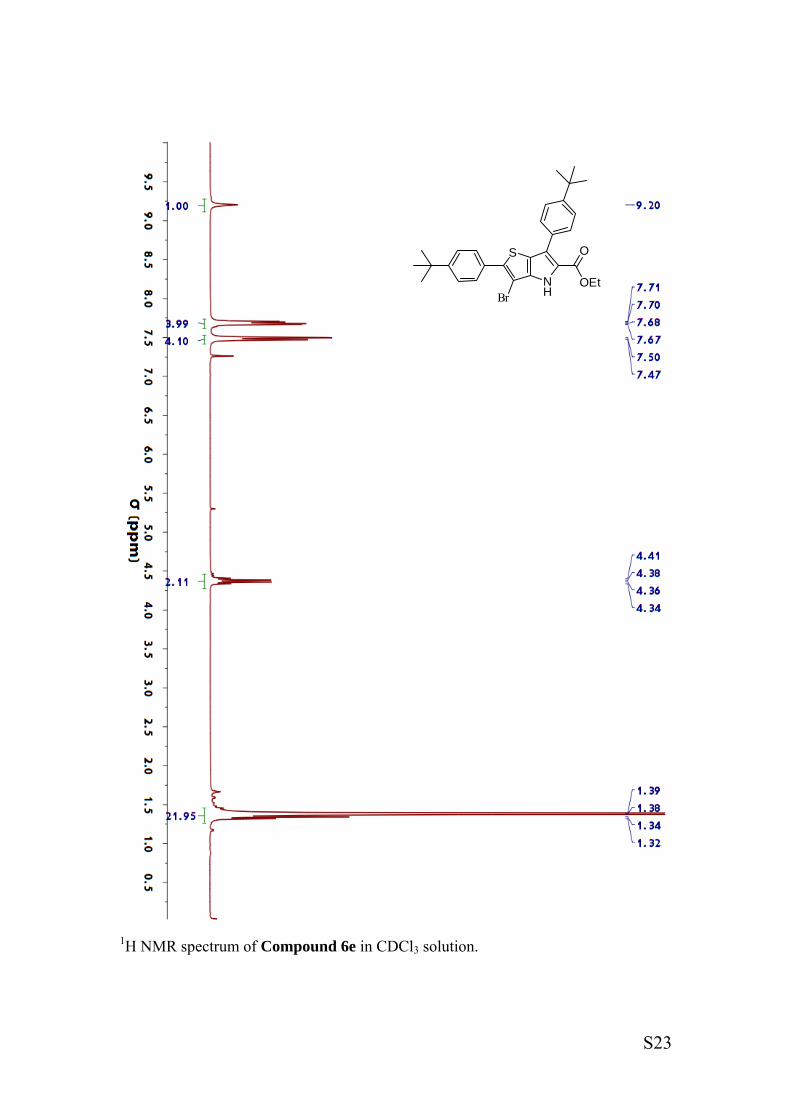
1H NMR spectrum of Compound 6e in CDCl3 solution.
S
NH
OEt
O
Br
Page 24
S24
13C NMR spectrum of Compound 6e in CDCl3 solution.
S
NH
OEt
O
Br
Page 25
S25
1H NMR spectrum of Compound 7e in CDCl3 solution.
S
NHBr
Page 26
S26
13C NMR spectrum of Compound 7e in CDCl3 solution.
S
NHBr
Page 27
S27
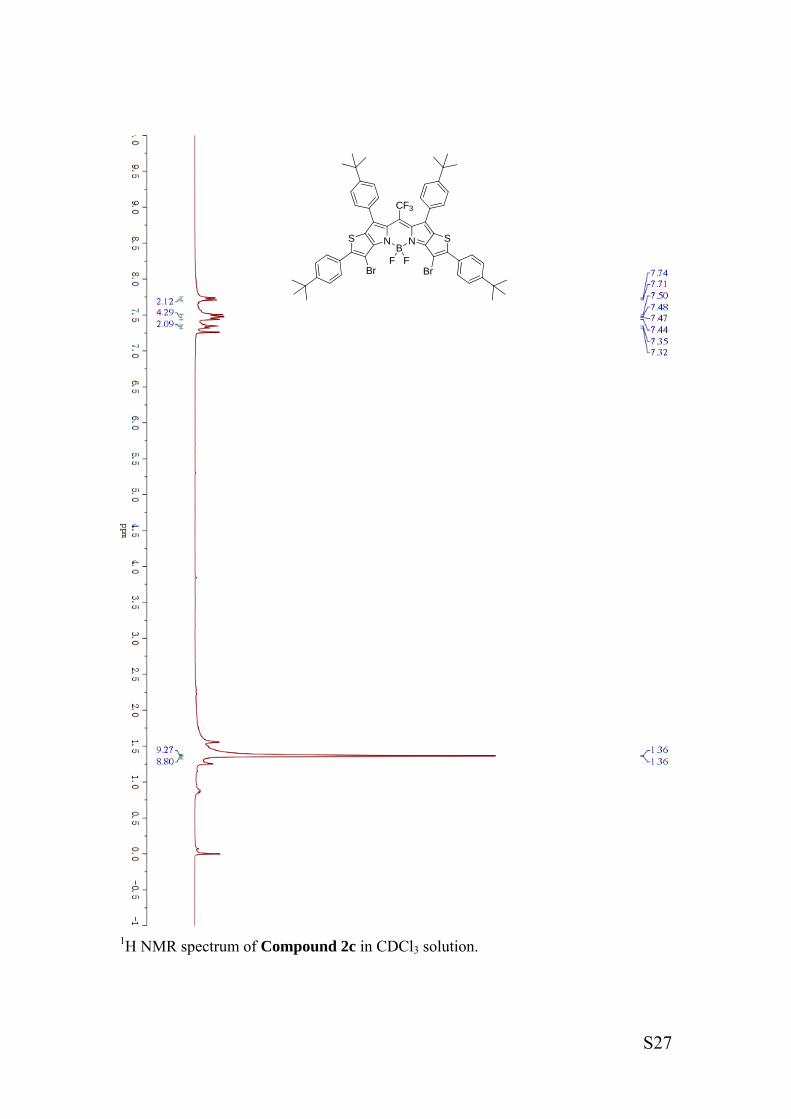
1H NMR spectrum of Compound 2c in CDCl3 solution.
S N N S
Br
BF F
Br
CF3
Page 28
S28
13C NMR spectrum of Compound 2c in CDCl3 solution.
Page 29
S29
1H NMR spectrum of Compound 1e in CDCl3 solution.
S N SN
N
BF F
Br Br
Page 30
S30
13C NMR spectrum of Compound 1e in CDCl3 solution.
Page 31
S31
1H NMR spectrum of Compound 6f in CDCl3 solution.
NH
S
OEt
O
MeO
Page 32
S32
13C NMR spectrum of Compound 6f in CDCl3 solution.
NH
S
OEt
O
MeO
Page 33
S33
1H NMR spectrum of Compound 7f in CDCl3 solution.
NH
S
MeO
Page 34
S34
13C NMR spectrum of Compound 7f in CDCl3 solution.
NH
S
MeO
Page 35
S35
1H NMR spectrum of Compound 1f in CDCl3 solution.
N
N
NB
F F
SS
O O
Page 36
S36
13C NMR spectrum of Compound 1f in CDCl3 solution.
N
N
NB
F F
SS
OMeMeO
Page 37
S37
1H NMR spectrum of Compound 10 in CDCl3 solution.
Page 38
S38
13C NMR spectrum of Compound 10 in CDCl3 solution
Page 39
S39
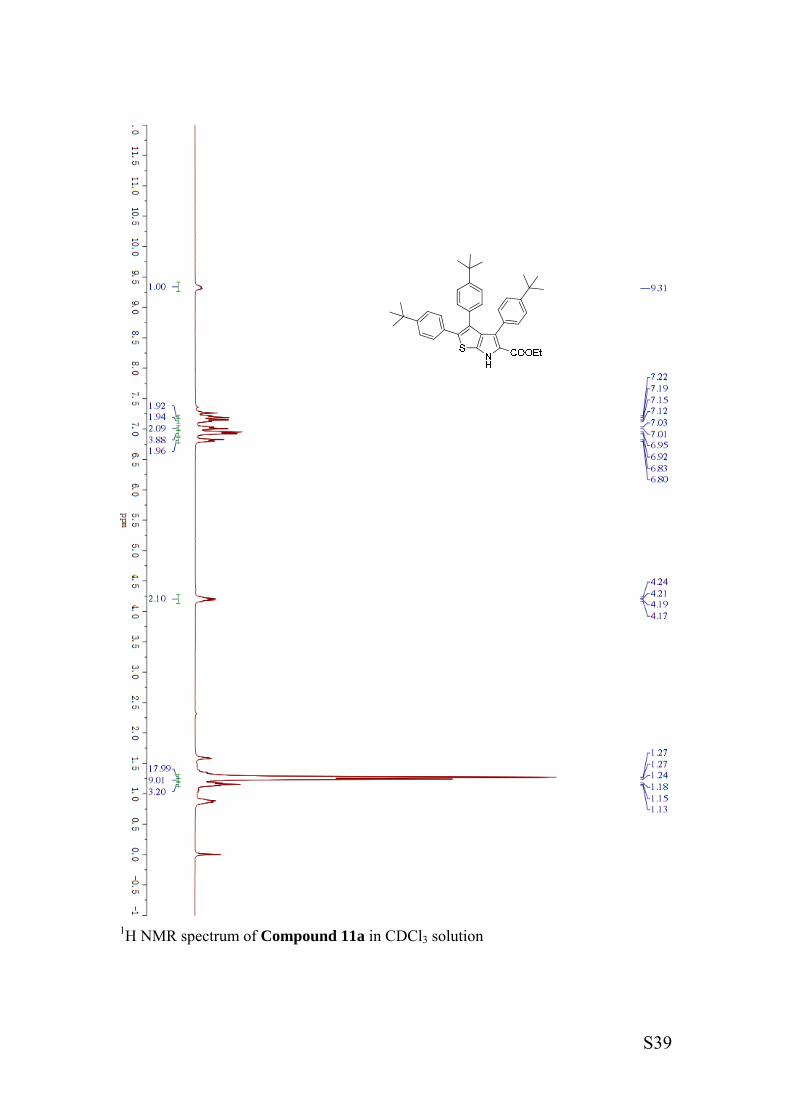
1H NMR spectrum of Compound 11a in CDCl3 solution
Page 40
S40
13C NMR spectrum of Compound 11a in CDCl3 solution.
Page 41
S41
1H NMR spectrum of Compound 11b in CDCl3 solution.
NH
S COOEt
O
O
O
Page 42
S42
13C NMR spectrum of Compound 11b in CDCl3 solution.
NH
S COOEt
O
O
O
Page 43
S43
1H NMR spectrum of Compound 12a in CDCl3 solution.
Page 44
S44
13C NMR spectrum of Compound 12a in CDCl3 solution.
Page 45
S45
1H NMR spectrum of Compound 12b in CDCl3 solution.
Page 46
S46
13C NMR spectrum of Compound 12b in CDCl3 solution.
Page 47
S47
1H NMR spectrum of Compound 3a in CDCl3 solution.
Page 48
S48
13C NMR spectrum of Compound 3a in CDCl3 solution.
Page 49
S49
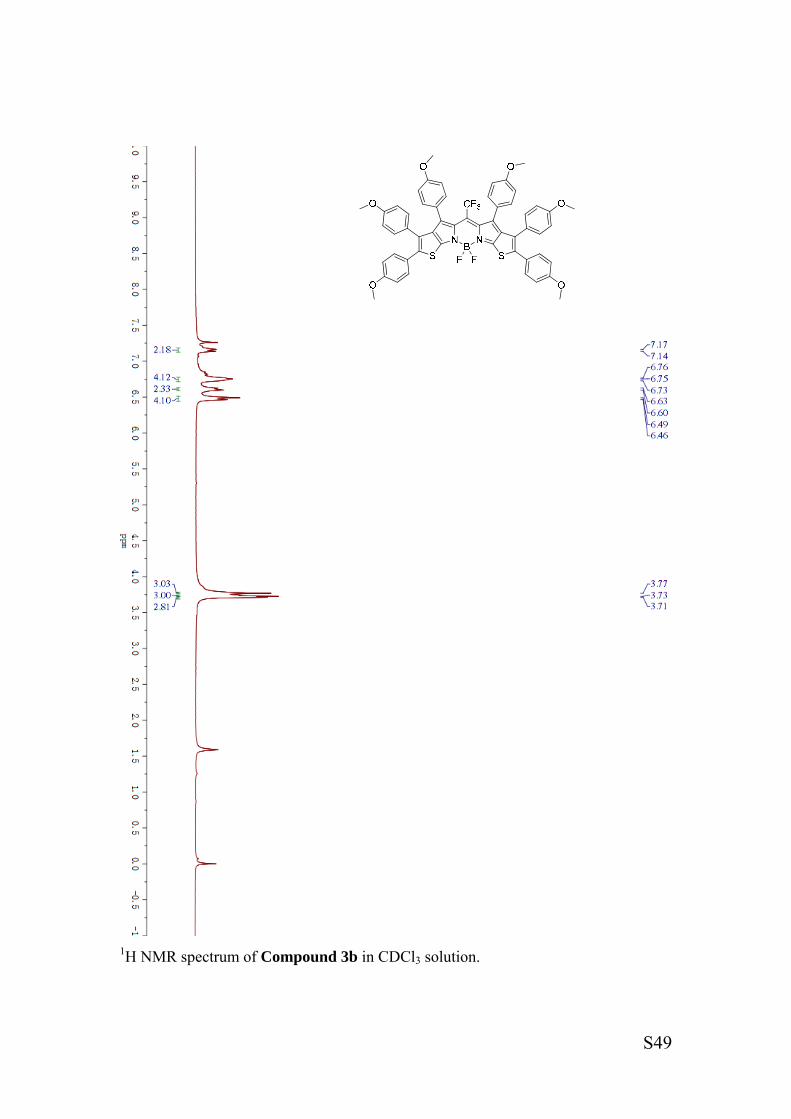
1H NMR spectrum of Compound 3b in CDCl3 solution.
Page 50
S50
13C NMR spectrum of Compound 3b in CDCl3 solution.
Page 51
S51
5. High resolution mass spectroscopes for all new compound 20150429_APCI+f-8 #10 RT: 0.15 AV: 1 NL: 2.58E6T: FTMS + c APCI corona Full ms [200.00-2000.00]
534 536 538 540 542 544 546 548 550 552 554 556 558 560 562 564 566 568m/z
0
5
10
15
20
25
30
35
40
45
50
55
60
65
70
75
80
85
90
95
100R
elat
ive
Abu
ndan
ce548.29773
549.30096
551.50293
552.50641537.53510 565.56635535.54474 553.50977547.40247540.53528 561.56061 568.09729542.77216 556.53088 558.49945
HRMS for 8a
HRMS for 8b
Page 52
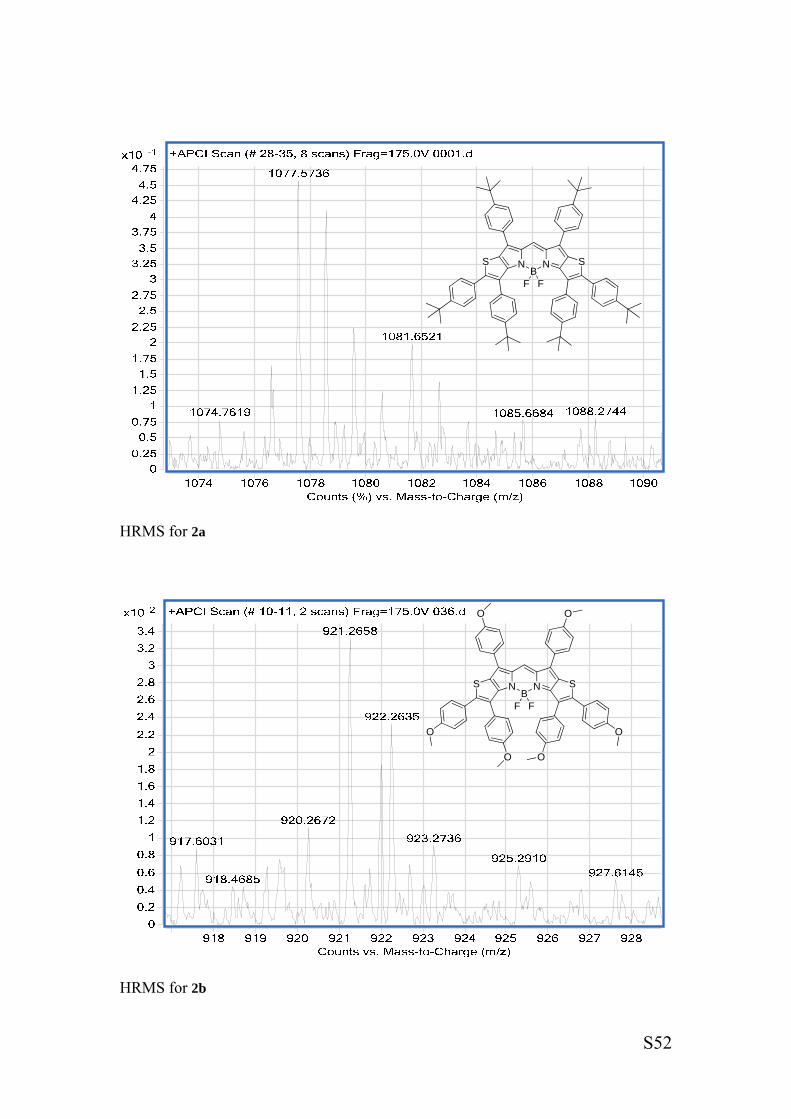
S52
HRMS for 2a
HRMS for 2b
S N N SB
F F
S N
O
O
O
N SB
F F
O
O
O
Page 53
S53
HRMS for 6e
HRMS for 7e
Page 54
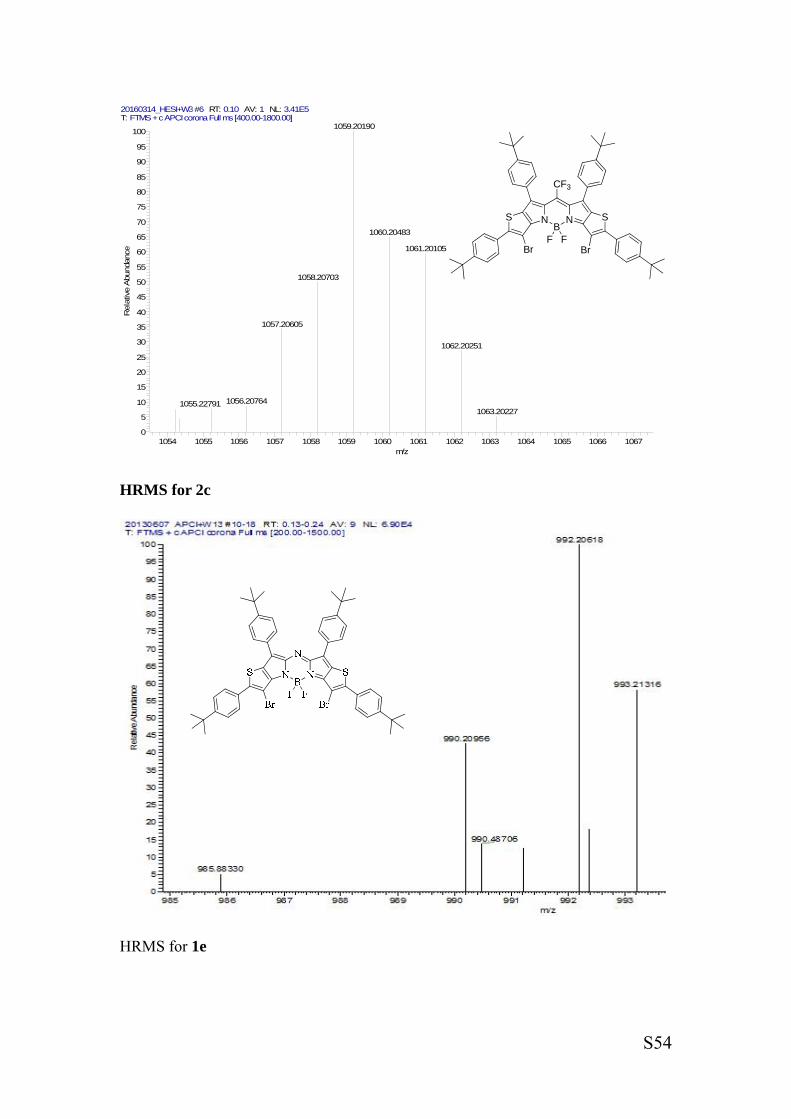
S54
20160314_HESI+W3 #6 RT: 0.10 AV: 1 NL: 3.41E5T: FTMS + c APCI corona Full ms [400.00-1800.00]
1054 1055 1056 1057 1058 1059 1060 1061 1062 1063 1064 1065 1066 1067m/z
0
5
10
15
20
25
30
35
40
45
50
55
60
65
70
75
80
85
90
95
100R
elat
ive
Abu
ndan
ce1059.20190
1060.20483
1061.20105
1058.20703
1057.20605
1062.20251
1056.207641055.227911063.20227
HRMS for 2c
HRMS for 1e
S N N S
Br
BF F
Br
CF3
Page 55
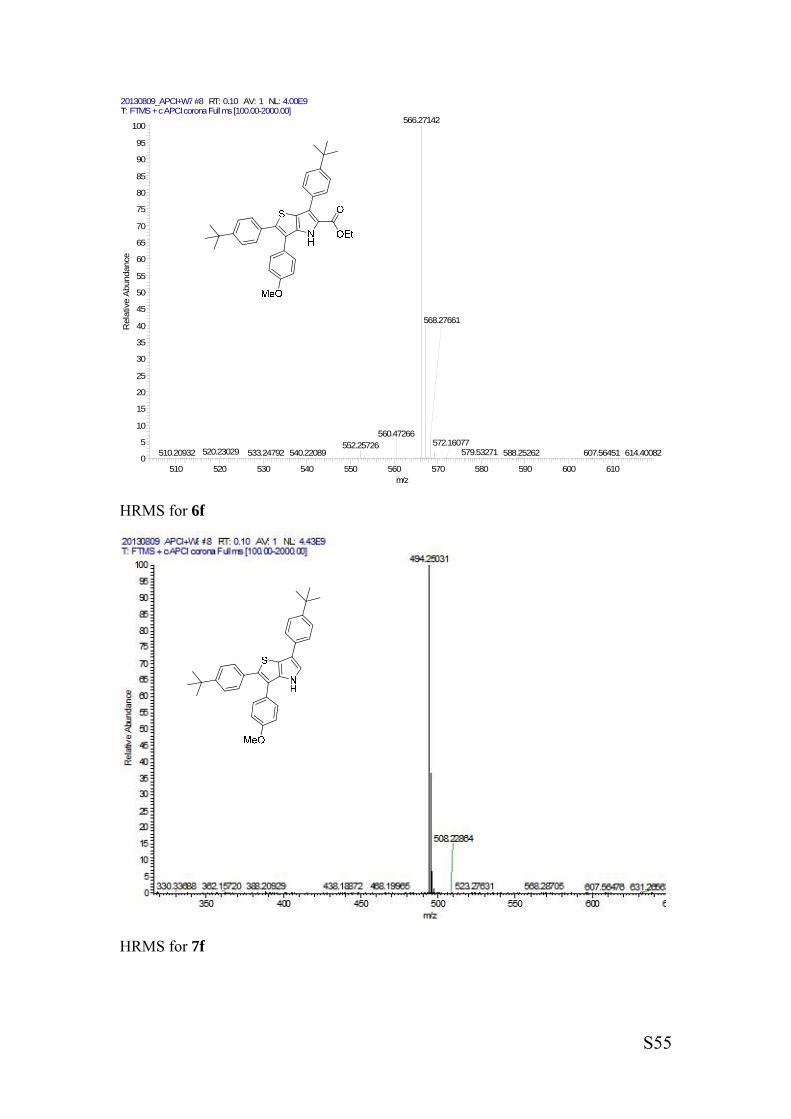
S55
HRMS for 6f
HRMS for 7f
20130809_APCI+W7 #8 RT: 0.10 AV: 1 NL: 4.00E9T: FTMS + c APCI corona Full ms [100.00-2000.00]
510 520 530 540 550 560 570 580 590 600 610m/z
0
5
10
15
20
25
30
35
40
45
50
55
60
65
70
75
80
85
90
95
100R
elat
ive
Abu
ndan
ce566.27142
568.27661
552.25726520.23029 579.53271540.22089
572.16077560.47266
607.56451510.20932 614.40082588.25262533.24792
Page 56
S56
HRMS for 1f
HRMS for 10
S N SN
N
BF F
OMeMeO
Page 57
S57
20150126_HESI+W1 #10 RT: 0.16 AV: 1 NL: 2.84E5T: FTMS + c ESI Full ms [100.00-1000.00]
592.0 592.5 593.0 593.5 594.0 594.5 595.0 595.5m/z
0
5
10
15
20
25
30
35
40
45
50
55
60
65
70
75
80
85
90
95
100R
elat
ive
Abu
ndan
ce592.32281
593.32617
594.32898
595.37994592.49756593.50189 594.58075592.79987
HRMS for 11a 20150126_HESI+W2 #7 RT: 0.11 AV: 1 SB: 3 0.01-0.04 NL: 9.34E5T: FTMS + c ESI Full ms [100.00-1000.00]
513.6 513.8 514.0 514.2 514.4 514.6 514.8 515.0 515.2 515.4 515.6 515.8 516.0 516.2 516.4 516.6 516.8m/z
0
5
10
15
20
25
30
35
40
45
50
55
60
65
70
75
80
85
90
95
100
Rel
ativ
e A
bund
ance
514.16711
515.17047
516.17365
514.50909 515.38324 515.56793514.66986
HRMS for 11b
NH
S COOEt
O
O
O
Page 58
S58
HRMS for 12a
HRMS for 12b
Page 59
S59
20160325_HESI+W1 #7 RT: 0.11 AV: 1 NL: 1.33E5T: FTMS + c APCI corona Full ms [400.00-1200.00]
1162 1163 1164 1165 1166 1167 1168 1169 1170 1171m/z
0
5
10
15
20
25
30
35
40
45
50
55
60
65
70
75
80
85
90
95
100R
elat
ive
Abu
ndan
ce1165.57214
1166.57605
1167.58313
1164.577511168.57178
1169.727171168.80078
HRMS for 3a 20160314_HESI+W2 #6 RT: 0.10 AV: 1 NL: 2.96E5T: FTMS + c APCI corona Full ms [400.00-1800.00]
1007 1008 1009 1010 1011 1012m/z
0
5
10
15
20
25
30
35
40
45
50
55
60
65
70
75
80
85
90
95
100
Rel
ativ
e A
bund
ance
1009.25824
1010.26233
1008.26190
1011.26874
HRMS for 3b
Page 60
S60
References:
(1) (a) A. Gorman, J. Killoran, C. O’ Shea, T. Kenna, W. M. Gallagher, D. F. O’Shea,
J. Am. Chem. Soc., 2004, 126, 10619. (b) R. C. Benson, H. A. Kues, Phys. Med. Biol.,
1978, 23, 159.
(2) J. Lakowicz, Principles of Fluorescence Spectroscopy, 3rd ed., Springer-Verlag:
New York, 2006.
(3) SAINT V 6.01 (NT) Software for the CCD Detector System, Bruker Analytical
X-ray Systems, Madison, WI (1999).
(4) G. M. Sheldrick, SHELXS-90, Program for the Solution of Crystal Structure,
University of Göttingen, Germany, 1990.
(5) SHELXL-97, Program for the Refinement of Crystal Structure, University of G¨
ottingen, Germany, 1997.
(6) SHELXTL 5.10 (PC/NT-Version), Program library for StructureSolution and
Molecular Graphics, Bruker Analytical X-ray Systems,Madison, WI (1998).
(7) S. Soth, M. Farnier, C. Paulmier, Can . J. Chem., 1978, 56, 1429.
(8) Y. Wu, C. Cheng, L. Jiao, C. Yu, S, Wang, Y. Wei, X. Mu, E. Hao, Org. Lett.,
2014, 16, 748;


![External complexation of BODIPYs by CB[7] improves in-cell ...](https://static.documents.pub/doc/80x56/624fcdaaefbeb448ef73b3e4/external-complexation-of-bodipys-by-cb7-improves-in-cell-.jpg)


![Full Functionalization of the Thieno[3,2-b]thiophene ... · polymers, functional oligothiophenes or fused S-heterocycles are predominant.16 More recently thienothiophenes, in particular](https://static.documents.pub/doc/80x56/5f06f8cf7e708231d41aa7a4/full-functionalization-of-the-thieno32-bthiophene-polymers-functional-oligothiophenes.jpg)


