34
Satellite Monitoring of Urbanization in Megacities Yifang Ban Professor of Geoinformatics Department of Urban Planning & Environment KTH Royal Institute of Technology Stockholm, Sweden

Satellite Monitoring of Urbanization in Megacities
Yifang Ban Professor of Geoinformatics
Department of Urban Planning & Environment KTH Royal Institute of Technology
Stockholm, Sweden

Introduction
In 2007, more than 50% of the world population live in cities
Urbanization causes formation of megacities, population: > 10 million.
27 Megacities globally

World Urban Population 2025
Introduction
Source: United Nations: World Urbanization Prospects, the 2011 Revision. New York 2012

Environmental Consequences
Urban heat island (UHI) and heat waves – UHI – urban air temperatures higher than surrounding rural areas.
– The average air temperature in a city with 1 million inhabitants is 1-3 degrees warmer.
– Heat waves: In the afternoon, the difference can be 12 degrees warmer, no night time cooling. Death rate raise during heat waves.

Environmental Consequences
High concentrations of aerosols, exhaust gases, pollution and dust – Hazardous to health
– Increased smog, haze, fog, clouds
Source: The Associated Press
Source: Suicup via Wikimedia

Environmental Consequences
Paved surfaces -> rainfall water -> flooding – Water runs on the paved surface. Poor storm water systems, unable
to prevent flooding from rains
– 79 people died in July 2012 Beijing flooding
Source: BBC News Source: www.theatlanticcities.com
Source: rendezvous.blogs.nytimes.com

Environmental Consequences
Internal wind climate – Long streets generate jet effects with high speed winds
Skyscrapers act as magnets for lightning
Source: pittsburghskyline.com

Research Objectives
To map and monitor urbanization in Megacities
To develop effective classification and change detection methods
To assess the environmental impact of urbanization – Land Cover & Land Surface Temprature
– Landscape fragmentation
– Ecosystem Services

LOS ANGELES
MEXICO CITY
NEW YORK
SAN PAULO
LONDON MOSCOW
DEHLI DHAKA
BEIJING TOKYO
Study Areas

Study Areas

Study Areas
Source: Taubenböck et al., , Monitoring urbanization in mega cities from space. Remote Sensing of Environment 117 (2012) 162–176

Data Description
Name Country Population(2011)
Sattelite imagery (old)
Sattelite imagery (new)
Beijing China 16.4 1999-10-21 2009-09-22 Delhi India 23.0 2000-02-19 2010-02-14 Dhaka Bangladesh 14.0 1999-11-24 2009-11-27
LA USA 17.6 2000-09-15 2010-09-19
London UK 12,6 2002-09-13 2011-09-30
Mexico City Mexico 23.2 2000-02-02 2010-02-05
Moscow Russia 16.2 2001-05-04 2010-06-22 NYC USA 21.5 2000-10-20 2010-10-08 Sao Paulo Brazil 21.1 2000-10-20 2010-10-08
Shanghai China 25.3 2000 2010
Tokyo Japan 34.5 2002-03-19 2011-04-05
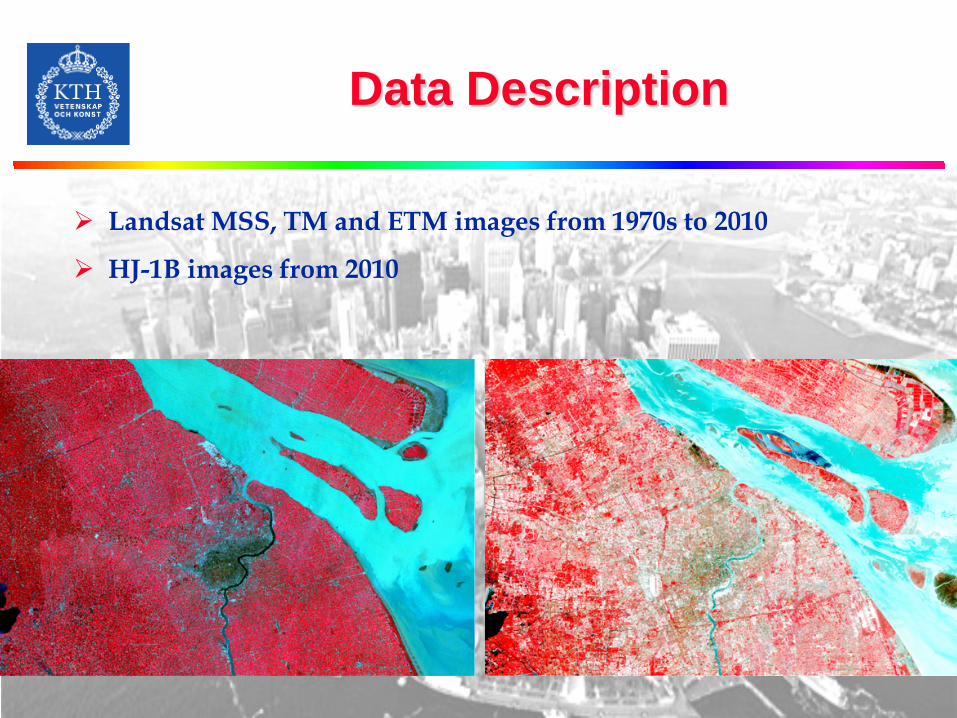
Data Description
Landsat MSS, TM and ETM images from 1970s to 2010
HJ-1B images from 2010

ESA Data
ENVISAT ASAR archives
ERS-1/2 archives

TerraSAR-X/TanDEM-X data
RADARSAR-2 Polarimetric SAR data
TPM Data

16
FUSION
SAR ENVISAT ASAR
OPTICAL HJ-1B
Methodology: Data Fusion

Methodology: KTH-SEG
Coregistration
Optical data
Speckle filtering
Edge detection
Sample selection -> SVM - Training SVM- Prediction
Land cover/use map
Prep
roce
ssin
g Parameter selection
Quality Assesment
SAR data
Segm
enta
tion
Growing off edges
Growing on edges
Mutual merging
Threshold merging
Min size merging
Cla
ssif
icat
ion

Methodology: KTH-SEG
(a) Grow off edges (b) Grow on edges
(c) Mutual merging
(d) Threshold merging
(e) Min size merging
Ban, Y. and A. Jacob, 2013. Object-based Fusion of Multitemporal Multi-angle ENVISAT ASAR and HJ-1 Multispectral Data for Urban Land-Cover Mapping. IEEE Transaction on GeoScience and Remote Sensing.

Methodology: Image Classification
Niu, X., and Y. Ban. 2013. Multitemporal RADARSAT-2 Polarimetric SAR Data for Urban Land Cover Classification using Object-based Support Vector Machine and Rule-based Approach, International Journal of Remote Sensing, 34(1):1-26.
Niu X. and Y. Ban, 2013, Multitemporal Polarimetric RADARSAT-2 SAR Data for Urban Land Cover Mapping Through a Dictionary-based and a Rule-based Model Selection in a Contextual SEM Algorithm. Canadian Journal of Remote Sensing.
Hu, H. and Y. Ban. 2012. Multitemporal RADARSAT-2 Ultra-Fine-Beam SAR Data for Urban Land Cover Classification. Canadian Journal of Remote Sensing, 38(01): 1-11, 10.5589/m12-008.

Methodology: Change Detection
Ban, Y. and O. A. Yousif, 2012. Multitemporal Spaceborne SAR Data for Urban Change Detection in China. IEEE Journal on of Selected Topics in Applied Earth Observations and Remote Sensing, 5(4): 1087-1094. Yousif, O. and Y. Ban, 2013. Improving Urban Change Detection from Multitemporal SAR Images Using PCA-NLM. IEEE Transaction on GeoScience and Remote Sensing.

Environmental Impact Assessment
Maria Bobrinskaya, 2012. Remote Sensing for Analysis of Relationships between Land Cover and Land Surface Temperature in Ten Megacities. MSc thesis, Supervised by YifangBan, KTH Geoinformaitcs.

Environmental Impact Assessment
Furberg, D. and Y. Ban, 2012. Satellite Monitoring of Urban Sprawl and Assessment of its Potential Environmental Impact in the GTA between 1985 and 2005. Environmental Management. Furberg, D. and Y. Ban, 2012. Satellite Monitoring of Urban Land Cover Change in Stockholm between 1986 and 2006 and Environmental Impact Assessment through the Use of Indicators. Earth Observation for Global Change 2011, Springer Book. Haas, J. and Y. Ban. 2012. Remote Sensing of Bidecadal Urbanization and Its Impact on Ecosystem Service in the Yangtze River Delta, Proceedings, Dragon 2 Final Symposium.

Results & Discussion

Results & Discussion
London Source: Taubenböck et al., , Monitoring urbanization in mega cities from space. Remote Sensing of Environment 117 (2012) 162–176
Shanghai London Zhang, Q.,Ban, Y., Hu, Y.; Liu, J. 2009. The Trajectories of Urban Land and Industrial Land in Shanghai over the Past 30 Years. Joint Urban Remote Sensing Event, 1022-1028, Shanghai.

Results & Discussion
Source: Taubenböck et al., , Monitoring urbanization in mega cities from space. Remote Sensing of Environment 117 (2012) 162–176

1999 2009 LULC & LST
HD built-up
LD built-up
Bare soil
Agriculture
Water
Forest
Beijing 1999 2010 Change rate Area (sq.km) Area (sq.km)
Urban High 348.7086 685.4760 97% Urban Low 975.2940 1552.0374 59% Agriculture 1239.0210 568.2888 -54% Bare 679.7268 149.6529 -78% Forest 336.8700 660.6441 96% Water 56.3796 19.9008 -65%

1999 Beijing

2010 Moscow

Urbanization In China
In China, urban areas increased from 12252.9 km2 in 1990s, to 40533.8 km2 in 2010s.
Wang L et al, 2012. China’s urban expansion from 1990 to 2010 determined with satellite remote sensing. Chinese Bulletin of Sciences.

Urbanization In China
Wang L et al, 2012. China’s urban expansion from 1990 to 2010 determined with satellite remote sensing. Chinese Bulletin of Sciences.

Urbanization on Air Temperature
Shao, Q., C. Sun, J. Liu, Y. Ban, J. He and W. Kuang. 2009. Impact of Urban Expansion on Meteorological Observation Data and Over-estimation to Regional Air Temperature in China. Acta Geographica Sinica (In Chinese).

GEO Global urban mapping and monitoring
Very high resolution SAR &/or optical data fusion for urban analysis
Novel methods for urban land cover mapping & change detection
Quantitative representation of LULC-LST relationship
Converting LULC change to pressure on biodiversity
Future Research
Wang L et al, 2012. China’s urban expansion from 1990 to 2010 determined with satellite remote sensing. Chinese Bulletin of Sciences.

Acknowledgement
Prof. Yifang Ban, KTH Royal Institute of Technology, Geoinformatics, European Lead PI
Prof. Peng Gong, Tsinghua University & University of California, Berkeley, Chinese Lead PI
Prof. Paolo Gamba, University of Pavia, Department of Electronics, Remote Sensing Group
Prof. Peijun Du, Nanjing University, China
Dr. Hannes Taubenböck, DLR Earth Observation Center German Remote Sensing Data Center
Prof. Jing Li, Beijing Normal University
This research is part of the ‘Urbanization and Climate Project’ within the ESA-MOST Dragon 3 Program.

Acknowledgement
This research is funded through research grants from the Swedish National Space Board, Formas and VR.
Contributing researchers from KTH: – Maria Bobrinskaya, MSc student
– Dr. Juan Deng, Visiting researcher
– Dorothy Furberg, PhD student
– Jan Haas, PhD student
– Hongtao Hu, PhD student
– Alexander Jacob, PhD student
– Dr. Xin Niu, Postdoctoral researcher
– Osama Yousif, PhD student


