Synthetic aperture superresolved microscopy in digitallensless Fourier holography by time and angular
multiplexing of the object information
Luis Granero,1 Vicente Micó,2,* Zeev Zalevsky,3 and Javier García2
1AIDO—Technological Institute of Optics, Color and Imaging, Nicolás Copérnico 7, 46980, Paterna, Spain2Departamento de Óptica, University Valencia, Dr. Moliner, 50, 46100 Burjassot, Spain
3School of Engineering, Bar-Ilan University, Ramat-Gan 52900, Israel
In 1873, Abbe established that the resolving power inimaging systems is limited by the wave nature oflight [1]. Since then, the ability to improve the resol-ving power of imaging systems beyond the limit im-posed by diffraction has become a widely studiedtopic in applied optics. But the beginning of super-resolution did not start until Françon reported hiswork in 1952 [2]. It was a time-multiplexing ap-proach based on the synchronized movement oftwo pinholes, one over the object and another oneat the image plane through an optical imaging sys-tem. Thus, by spatial scanning the whole object fieldof view, the approach provides two-dimensional (2D)images via point-by-point imaging of the input object.After Françon’s idea, many other superresolving
approaches were reported using information theory
as a starting point [3,4]. In summary, since the num-ber of degrees of freedom (channels) of an imagingsystem remains constant, any degree of freedom inthe system could be extended above the classical lim-it if any other channel is proportionally reduced [5,6].In that sense, the resolution limit imposed by diffrac-tion could be improved by multiplexing the object’sspatial-frequency information in any other channelif the object is independent to such a degree of free-dom [7]. Thus, time-multiplexing superresolution en-codes the object’s spatial-frequency information intothe temporal degree of freedom because its ampli-tude distribution does not vary in time. The encodedobject information passes through the limited sys-tem’s aperture in different time slots, and the re-maining problem is how to recover and decode theencoded information.
The classical way to perform such an encoding-decoding process is by using diffraction gratings[5–7]. However, and as Abbe pointed out in his paper[1], another way to increase the resolution of an
imaging system is by tilting the illumination with re-spect to the optical axis because, then, high orderfrequency bands are diffracted on axis. So, we canestablish an equivalence between the grating’s dif-fraction orders and a set of tilted beams (on-axisand off-axis beams), where each tilted beam producesa given frequency shift in the object’s spectrum, de-pending on its oblique illuminationangle.Once again,the point is to recover and reposition each additionalhigh-frequency band to its original location in the ob-ject’s spectrum, that is, to its original diffracted anglewhen on-axis illumination is considered. Interfero-metric image plane recording [8–10] allows the rear-rangement of the spatial information correspondingwith each transmitted frequency band.Tilted beam illumination has been applied to
superresolution purposes since Ueda and Satoreported the recording of a multiexposed hologramcomposed of the coherent superposition of a set ofimages obtained sequentially under different obliqueillumination conditions [11]. From then to now, thecombination of tilted beam illumination and inter-ferometric recording as a way to get superresolutionhas been applied to classical holography [11–13],digital holography [14–16], and mainly to digitalholographic microscopy [17–23]. Essentially, time-multiplexing superresolution by tilted beams pro-duces a synthetic enlargement in the limited systemaperture. This synthetic aperture (SA) is equivalentto a CCD camera with greater size [14–16,24–30] orto a microscope objective with a higher numericalaperture (NA) value [17–23] for applications in digi-tal holography and digital holographic microscopy,respectively.Recently proposed, digital in-line holographic mi-
croscopy combines a Gabor optical implementationand digital reconstruction by numerical processingprovided by computers [31–34]. Using this method,experimental results showing an NA value between0.2 and 0.3 were reported [34]. However, the previousconcept is restricted to weak diffraction assumptionsas was assumed in the original Gabor concept [35]. Inthat sense, digital in-line holography considering anexternal reference beam has been also reported ex-tensively in the literature [36]. But the insertion ofa reference beam in the recording plane is usuallyperformed by placing a beam splitter in front ofthe CCD. Thus, the input object cannot be placedclose to the CCD in order to achieve high NA. So,the maximum achievable resolution is limited.In this paper, we demonstrate superresolution cap-
abilities inmicroscopy of tilted beamilluminationandinterferometric recording in a digital lensless Fourierholographic architecture based imaging system.Since the CCD size is restricted to a few millimeters(limited aperture of the imaging system) and the sam-ple must be positioned at a few centimeters from theCCD (due to the beam splitter), the resolving power ofthe imaging setup becomes restricted. However, highorder frequency bands can be recovered by using ob-lique illumination and off-axis holographic recording
in a time sequence. The key is to perform time multi-plexing by means of a set of tilted beams having dif-ferent inclinations. Because of each tilted beam, adifferent bandpass of the object’s spectrum is dif-fracted on axis and recovered by a filtering processperformed over the Fourier transform (FT) of the re-corded hologram. Finally, each recovered bandpassimage is used to generate an SA expanding the cutofffrequency of the imaging system, or in other words,improving its resolution. Moreover, if it is a prioriknown that the object’s spectrum does not containuseful information at specific directions, the timemultiplexing illumination stage can be optimiz-ed by avoiding those tilted beams corresponding withthose useless directions. This fact allows the genera-tion of a customizedSAshape inaccordancewith theapriori object information. In this work, experimentaldemonstration of medium-high NA values (0:4 <SNA < 0:5), covering without gaps the Fourier do-main, showing capabilities of customizedSA,workingwithout lenses and outside the weak diffraction as-sumptions imposed by the Gabor regime is reported.
The paper is organized as follows: Section 2 pre-sents both a qualitative description and the mathe-matical background of the experiment. Section 3experimentally validates the proposed approach,providing different shapes of synthetic aperturesfor two different kind of objects (resolution test targetand human red blood cells), and Section 4 concludesthe paper.
2. Experimental Configuration
A. Qualitative System Description
The proposed experimental setup is depicted inFig. 1. It is based on aMach–Zehnder interferometricconfiguration in which an He–Ne laser beam is splitin two branches. In the first one (imaging branch),the object under test is illuminated in transmissionmode and a Fresnel diffracted pattern is recorded bya CCD imaging device. Such a diffracted pattern iscombined at the CCD plane with a second beam in-coming from the reference branch by using a beamsplitter cube. The reference beam is an off-axis sphe-rical divergent wavefront having the particularitythat the distance “d” between the object and theCCD [see Fig. 1] is equal to the distance betweenthe point source [focal plane of the FT lens in Fig. 1]and the CCD. This configuration defines a digitallensless Fourier transforming holographic setupwhere whole information about the complex diffract-ed wavefront at the input object can be recovered atthe Fourier domain of the recorded hologram, sinceoff-axis recording avoids the overlapping betweenthe different holographic diffraction orders.
Using this experimental assembly, the FTof the re-corded hologram performs the recovery of the focusedbandpass image of the object under test. When on-axis illumination is used [Fig. 1(a)], the focused im-age at the Fourier domain becomes the conventionalimage provided by the proposed imaging system
architecture. That image will be limited in resolutiondue to the low NA that is defined by the imagingsystem and resulting from both the reduced CCD sizeand the distance between the input object andthe CCD.One way to improve this low NA value is by using a
diffraction grating in the imaging arm of the inter-ferometric configuration [27–29]. The grating allowsthat additional spatial-frequency bands of the spec-trum diffracted by the object will be redirected towa-rd the CCD in such a way that, without the grating,they would fall outside the CCD aperture. Therefore,due to each additional frequency band diffracted bythe grating arriving at the CCD with a different an-gle, its spectral content is recovered by inserting areference beam in an off-axis [27,28] or in an on-axis[29] interferometric configuration. However, verymodest resolution limits (above 15 μm) are experi-mentally validated using these approaches.In a similar way, and according to the analogy be-
tween a diffraction grating and a set of tilted beams,the angular multiplexing of the input object spatialinformation can also be performed in digital hologra-phy by providing pulsed tilted illumination andcoherence coding onto the input object [15]. In thiscase, a single laser pulse is split in amplitude intothree subpulses, each one of them having a time de-lay with respect to the other two and each one ofthem being optically manipulated to achieve tiltedbeam illumination onto the input object. Later on,a single-frame CCD recording allows the recoveryof the different multiplexed bands due to the coher-ence coding, and SA generation provides a superre-solved image. However, this approach becomesdifficult to assemble because of the rigorous opticalbeam path matching and also becomes restrictedin the number of usable tilted beams, since the in-crease in the angular multiplexing directions impliescomplex procedures to split the original pulsed beaminto additional ones. In addition, as the number ofsubpulses increases to multiplex more directions,the system becomes restricted in dynamic range,avoiding bandpass image recovery.Now, the proposed approach presents a new proce-
dure based on angular multiplexing provided bytilted beam illumination but having improved cap-abilities that allow the definition of a new resolutionlimit in the range of 1 μm. As it is depicted inFig. 1(b), the illumination stage is composed of aprism that can be shifted and rotated to provide se-quential oblique illumination onto the input object,thus, the shift allows tilted beam illumination at agiven angle (defined by the deviation angle of theprism), and the rotation allows 2D spatial-frequencyspace coverage around a circle where the deviationangle of the prism is constant. Let us call this circlean illumination ring. Thus, once on-axis illuminationis considered, the wedge prism is shifted to off-axispositions and rotated according to such positionsin order to illuminate obliquely the input object.Figure 1(b) depicts one of those tilted beam illumina-
tion positions, while Fig. 2 illustrates the whole set oftilted illuminations where the object’s diffractedwavefront has been divided into rectangular slotsfor clarity.
This illumination procedure permits the sequen-tial recovery of different spectral bands of the object’sspectrum when performing digital FT of every off-axis recorded hologram and a filtering process overone of the diffraction hologram orders. Thus, differ-ent rectangular elementary apertures [see Fig. 2]containing a different spatial-frequency range of theobject’s spectrum are recovered in time sequence. 2DFourier space coverage is ensured by providing tiltedbeams around the illumination ring. This additionalinformation can be properly managed to generate anSA, allowing superresolved imaging by a simple di-gital FT of the information contained in the SA.
Recovered elementary apertures must be contigu-ous in order to generate an SA having a syntheticcutoff frequency as high as possible. Otherwise,either if the illumination angle is too high there willbe empty regions between apertures and the fre-quency space will not be fully covered, or if theillumination angle is too small there will be a greatoverlapping between apertures and the syntheticcutoff frequency will be low. Since the CCD is typi-cally rectangular, the setup must be designed to pro-vide contiguous elementary apertures in the shorterdirection and, thus, overlapping in the larger one.
Fig. 1. Experimental setup arrangement for the proposed ap-proach: (a) on-axis and (b) off-axis input object illumination cases.
This fact can easily be fulfilled by either placing theCCD at a given distance from the input object so thatthe angle defined between the optical axis and theshorter CCD direction (typically the vertical one) willbe half the oblique illumination angle, or selectingthe deviation angle of the illumination prism to betwice the angle defined by the NA in the shorterCCD direction. In any case, a contiguous frequencyband will be diffracted on axis when vertical tilted ill-umination impinges on the input object. Thus, thenew vertical cutoff frequency is expanded three timesor, equivalently, the resolution is improved by afactor of 3 in the vertical Fourier direction [21]. How-ever, when applying the proposed method in other di-rections, the resolution gain will be slightly lowerthan 3 because the CCD is normally wider in the hor-izontal than in the vertical direction. Figure 3 depictsthis situation.Finally, the set of recovered bandpass images must
be carefully managed to provide a high-qualityreconstructed image. Typically, the position of eachhologram in the Fourier domain is commanded bycomputing cross correlation between the overlappingareas in adjacent recordings [25]. As the overlappingincreases, the reconstruction becomes more accu-rate but a higher number of recordings is needed.Recently, Jiang et al. reported a method to correctlyoverlap the different recordings in SA digital holo-graphy [37]. They used a procedure based on themaximization of both the reconstructed image qual-ity using image variance criterion and the spectralenergy distribution ratio between each pair of adja-
cent holograms obtained when the CCD is shifted.Here, we have adopted a similar strategy wherethree factors are considered in order to digitallysynthesize a high-quality superresolved image. First,we have considered the addition of a global linearphase [expðiCÞ, C being a constant] to each recoveredaperture coming from the different optical path tra-veled for each tilted illumination that is used in theillumination stage. Such an optical path difference isdue to subwavelength distance mismatches that areimpossible to match on each illumination separately.Second, we have considered that a difference in thedivergence between both interference beams primar-ily introduces a misfocus in the reconstructed image.Aside from a fine adjustment of the distance “d” to beequal in both interferometric branches, small errorsremain due to the FT lens in the reference branch.This effect will be the same for every hologramand can be compensated for by introducing a quad-ratic phase factor [expði2πðax2 þ by2Þ=λÞ, whereða; bÞ are coefficients proportional to the misfocusand λ is the illumination wavelength] in each re-corded hologram [17,38]. Third, we have accuratelyreplaced each recovered pupil to its original positionat the object spectrum using the following steps. Byknowing the oblique illumination angle, we haveadded a linear phase factor [expði2πðcxþ dyÞ=λÞ,where ðc;dÞ are coefficients proportional to the obli-que illumination angle] to each recorded hologram inorder to shift back each elementary aperture to arough position in the Fourier domain. And final fineadjustment is accomplished by adding smaller linear
Fig. 2. Scheme of the angular multiplexing provided by tilted beam illumination in the proposed approach. From (a) to (i), differentoblique beam directions allow the recording of different portions of the input object diffracted wavefront. The dashed circle representsthe illumination ring where tilted beams are generated.
phase factors in both horizontal and vertical direc-tions. This procedure is repeated for each elementarypupil used in the experiment. Although the wholeprocess can be guided by an image quality criterion,as in [37], here the final reconstructed image is ob-tained by visual evaluation of the reconstructed im-age quality every time a new bandpass image isadded to the others.
B. Theoretical System Analysis
In this subsection we present the mathematical foun-dation of the proposed approach. Having in mind theoptical setup depicted in Fig. 1, the amplitude distri-bution arriving at the CCD plane comes from the ad-dition of both an imaging and a reference beam.Assuming that collimated illumination impingesonto the input object, the imaging beam is obtainedby Fresnel propagating the amplitude distribution atthe input plane, which is given by
ðx0; y0Þ being the spatial coordinates at the inputplane, and tðx0; y0Þ is the amplitude distribution ofthe input object. Note that the use of collimated illu-mination does not introduce any penalty in the setup.Moreover, it provides an advantage due to its simpli-city and because it ensures beam power equalizationin all illuminations.The exponential factor in Eq. (1) gives an account
of the illumination beam with a propagation carrier
frequency given by ðνm; νnÞ in the horizontal and ver-tical directions, respectively. After propagation by adistance “d” in free space, the amplitude distributionarriving at the CCD from the imaging branch is
UimCCDðx; yÞ ¼ C exp
�jk2d
½x2 þ y2��Z Z
tðx0; y0Þ
× exp�jk2d
½x20 þ y20��exp
�−j2π
��xλd − νm
�
× x0 þ�
yλd − νn
�y0
��dx0dy0; ð2Þ
k being the wavenumber, λ is the illumination wave-length, and C is a constant including all the constantfactors. For convenience, let us rewrite Eq. (2) as
UimCCDðx; yÞ ¼ C exp
�jk2d
½x2 þ y2���
FTftðx0; y0Þgu0;v0
⊗ FT�exp
�jk2d
½x20 þ y20���
u0;v0
�; ð3Þ
where ⊗ denotes convolution operation, and ðu0; v0Þare the scale factors of the FT defined as u0 ¼xλd − νm and v0 ¼ y
λd − νn. Now, Eq. (3) is added, withthe amplitude distribution incoming from the refer-ence branch, that is, with an off-axis spherical refer-ence beam diverging from the same distance “d” infront of the CCD in the form of
UrefCCDðx; yÞ ¼ D exp
�jk2d
�ðx − xrÞ2 þ ðy − yrÞ2
��; ð4Þ
where D is the amplitude of the reference beam andðxr; yrÞ is the off-axis point where the reference beamis generated. Thus, the total amplitude distributionat the CCD plane comes from the addition of Eqs. (3)and (4) multiplied by the CCD rectangular shapethat trims the recording area at the output plane.And finally, the CCD performs an intensity operationover the total amplitude
ItotalCCDðx; yÞ ¼ jUtotalCCDðx; yÞj2 ¼
����½UimCCDðx; yÞ
þUrefCCDðx; yÞ�rect
�xΔx
;yΔy
�����2
¼ ½jUimCCDj2 þ jUref
CCDj2 þUimCCDU
refCCD
�
þUimCCD
�UrefCCD�rect
�xΔx
;yΔy
�; ð5Þ
where � represents the complex conjugate andðΔx;ΔyÞ are the width of the CCD sensing area inthe horizontal and vertical directions, respectively,which can be defined under paraxial approximationas Δx ¼ 2dNAHOR and Δy ¼ 2dNAVER, NAHOR andNAVER being the NA values of the imaging systemin the horizontal and vertical directions, respectively.
Fig. 3. Hypothetical SA for full 2D frequency space coverage gen-erated by the addition of eight off-axis elementary apertures plusthe on-axis one.
Since the proposed approach is based on a digitallensless Fourier holographic configuration, we mustperform the FT operation of Eq. (5) in order to getimaging. But this procedure provides four terms thatcan be separately analyzed. The first one is the auto-correlation slot of the diffracted object wavefrontselected by the considered tilted beam
T1ðu; vÞ ¼ FT�jUim
CCDj2rect�
xΔx
;yΔy
��¼ FTfUim
CCDg
⊗ FTfUimCCD
�g
⊗ FT�rect
�xΔx
;yΔy
��; ð6Þ
ðu; vÞ being the spatial-frequency coordinates. Sincethis term is not dependent on the reference beam, itwill be centered at the Fourier domain. Somethingsimilar happens with the second term T2ðu; vÞ thatcomes from the FT of the square modulus amplitudedistribution provided by the reference beam multi-plied by the rect function representative of theCCD. So, T2ðu; vÞ implies the convolution of a deltafunction with the FT of the CCD aperture that is cen-tered at the origin. Since the carrier frequency be-tween both interferometric beams can be easilyadjusted by slightly tilting the off-axis referencebeam in the experimental setup, the hologram orderswill not overlap with the zero order term. Thus, wecan put aside in our analysis these two terms sincethey define the zero hologram order. Thus, the thirdterm allows the recovery of the complex amplitudedistribution of the frequency bandpass selected bythe illumination beam
T3ðu; vÞ ¼ FT�Uim
CCDUrefCCD
�rect�
xΔx
;yΔy
��
¼ FT�C0�~t
�xλd − νm;
yλd − νn
�
⊗ FT�exp
�jk2d
½x20 þ y20���
u0;v0
��;
⊗ FT�exp
�j2πλd ½xrxþ yry�
��
⊗ FT�rect
�xΔx
;yΔy
��¼ C0
�½tðλd x; λd yÞ
× expfj2πðνmxþ νnyÞg�
× exp�jk2d0 ðx20 þ y20Þ
��
⊗ FT�rect
�xΔx
;yΔy
��
⊗ δ�u −
xrλd ; v −
yrλd
�ð7Þ
C0 being the redefined global constant and d0 is thenew distance of the divergent illumination beam in-coming from the double FT process. Note that thefourth term from Eq. (5) is the complex conjugate
of the third term and has an equivalent meaningto it.
But now we must carefully analyze the differentterms in Eq. (7). Taking a look at the square bracket,we can see that a scaled version of the complex am-plitude distribution of the input object is multipliedby a linear phase factor coming from the illuminationbeam. That is, depending on the tilted beam wechoose in the illumination procedure, a differentspectral content of the input object spectrum willbe accessible at the Fourier domain. This bandpassimage is multiplied by a quadratic phase factor re-lated with the axial point of the input plane and re-presentative of the imaging beam divergence. Afterthat, a convolution with the FT of the CCD rectangu-lar area represents the limitation in the spatial-frequency content of the transmitted bandpassimage due to the CCD aperture. And finally, the re-sulting spectral distribution is moved away from thecenter of the Fourier domain by the convolution withthe delta function incoming from the off-axis refer-ence beam. Notice that the action of the referencebeam, aside from avoiding the overlap of the differ-ent hologram orders, is to cancel the quadratic phasefactor outside the square bracket in Eq. (3) in such away that the bandpass image of the input object se-lected by the tilted beam becomes imaged at theFourier domain. The carrier frequency in the holo-graphic recording can be properly tuned by rotatingthe beam splitter cube.
So, depending on the tilted beam defined byðνm; νnÞ, a different bandpass image of the inputobject having different spectral content can be recov-ered in time sequence. Finally, by time multiplexingthe whole 2D frequency space, a set of different ele-mentary pupils is recovered and used to synthesizean SA, expanding the cutoff frequency of the imagingsystem by proper relocation of each elementary aper-ture to its original position at the object’s spectrum.This procedure is performed in a latter digital proces-sing stage that finally culminates in a superresolvedimage of the input object, by FT, the spectral informa-tion contained in the generated SA.
3. Experimental Results
In this section we include the optical experimentalvalidation of the proposed approach, considered intwo subsections. In the first one, initial calibrationof the system setup is presented as a way to both ad-just the experimental setup and provide a first shapeof SA. Resolution limits, as well as NA and syntheticnumerical aperture (SNA) values, are theoreticallyprovided and experimentally validated. Once the ex-perimental setup is properly adjusted, the secondsubsection shows different shapes of SA, dependingon the disposable a priori information about the in-put object. In all the cases, we use an He–Ne laser(632nm emitting wavelength) as an illuminationsource, a CCD (Basler A312f, 582 × 782 pixels,8:3 μm pixel size, 12 bits=pixel) as an imaging device,a wedge prism with 10 deg deviation angle as the
illumination prism, a beam splitter cube (20mm×20mm side, BK7) to allow holographic recording,and a doublet lens (80mm focal length and 60mmdiameter) to provide a spherical divergent off-axisreference beam. Optic mounts, beam expanders, neu-tral density filter wheels to equalize the beam aspectratio, and micrometric translation stages completethe experimental setup.
A. System Calibration
In order to calibrate the experimental setup, we use anegative high-resolution United States Air Force(USAF) test target as the input object. The test tar-get is placed 36mm in front of the CCD, but the pre-sence of a beam splitter cube brings its imagethrough, closer to the CCD [39]. Under paraxial ap-proximation, the displacement Δs originated by aplano–parallel plate is given by Δs ¼ eð1 − 1=nÞ,where e and n are the width and the refractive indexof the plate, respectively. According to technical spe-cifications provided by Schott [40], the refractive in-dex of BK7 at the He–Ne wavelength is 1.515, andthen the displacement introduced by the beam split-ter cube is around Δs ¼ 6:6mm. Thus, the effectivedistance between the test target and the CCD is29:4mm. Obviously, the reference beam is also forcedto diverge from a distance equal to 29:4mm in frontof the CCD in order to get imaging at the Fourier do-main [see Fig. 1]. The distance in the referencebranch can be easily tuned by computing on-linedigital FT of the recorded hologram until the test tar-get will appear focused at the Fourier domain.Using this effective distance and the theoretical
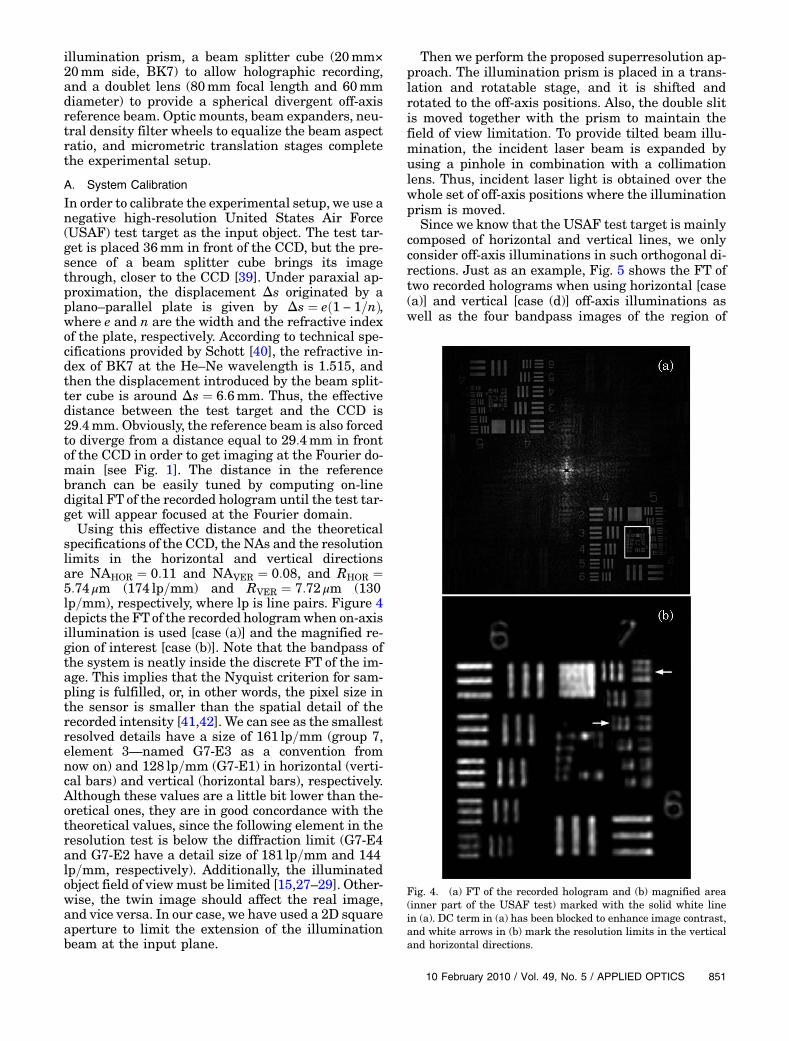
specifications of the CCD, the NAs and the resolutionlimits in the horizontal and vertical directionsare NAHOR ¼ 0:11 and NAVER ¼ 0:08, and RHOR ¼5:74 μm (174 lp=mm) and RVER ¼ 7:72 μm (130lp=mm), respectively, where lp is line pairs. Figure 4depicts the FTof the recorded hologramwhen on-axisillumination is used [case (a)] and the magnified re-gion of interest [case (b)]. Note that the bandpass ofthe system is neatly inside the discrete FT of the im-age. This implies that the Nyquist criterion for sam-pling is fulfilled, or, in other words, the pixel size inthe sensor is smaller than the spatial detail of therecorded intensity [41,42]. We can see as the smallestresolved details have a size of 161 lp=mm (group 7,element 3—named G7-E3 as a convention fromnow on) and 128 lp=mm (G7-E1) in horizontal (verti-cal bars) and vertical (horizontal bars), respectively.Although these values are a little bit lower than the-oretical ones, they are in good concordance with thetheoretical values, since the following element in theresolution test is below the diffraction limit (G7-E4and G7-E2 have a detail size of 181 lp=mm and 144lp=mm, respectively). Additionally, the illuminatedobject field of viewmust be limited [15,27–29]. Other-wise, the twin image should affect the real image,and vice versa. In our case, we have used a 2D squareaperture to limit the extension of the illuminationbeam at the input plane.
Then we perform the proposed superresolution ap-proach. The illumination prism is placed in a trans-lation and rotatable stage, and it is shifted androtated to the off-axis positions. Also, the double slitis moved together with the prism to maintain thefield of view limitation. To provide tilted beam illu-mination, the incident laser beam is expanded byusing a pinhole in combination with a collimationlens. Thus, incident laser light is obtained over thewhole set of off-axis positions where the illuminationprism is moved.
Since we know that the USAF test target is mainlycomposed of horizontal and vertical lines, we onlyconsider off-axis illuminations in such orthogonal di-rections. Just as an example, Fig. 5 shows the FT oftwo recorded holograms when using horizontal [case(a)] and vertical [case (d)] off-axis illuminations aswell as the four bandpass images of the region of
Fig. 4. (a) FT of the recorded hologram and (b) magnified area(inner part of the USAF test) marked with the solid white linein (a). DC term in (a) has been blocked to enhance image contrast,and white arrows in (b) mark the resolution limits in the verticaland horizontal directions.
interest (inner part of the USAF test) correspondingwith the four tilted beam illuminations [magnifiedimages inside cases (a) and (b), and cases (c) and (d)].Once each bandpass image is recovered by filtering
at the Fourier domain, they are used to assemble anSA by coherent addition of the different bandpassimages. Figure 6 depicts the SA [case (a)] and thesuperresolved image [case (b)] obtained by FT ofthe SA. In accord with the theoretical prediction,the SNA and the superresolution limits in horizontaland in vertical are given by SNAHOR ¼ NAHOR þNAILUM ¼ 0:28 and SNAVER ¼ NAVER þNAILUM¼ 0:25, and SRHOR ¼ 2:26 μm (442 lp=mm) andSRVER ¼ 2:53 μm (395 lp=mm), respectively, NAILUMbeing the NA of the illumination and SR the newsuperresolution limit. From Fig. 6(b), we can see thatthe last resolved elements are G8-E5 (406 lp=mm)and G8-E4 (362 lp=mm) in horizontal and vertical di-rections, respectively. Once again, these experimen-tal values agree with the theoretical prediction sincethe following elements in the USAF test are belowthe superresolved diffraction limit: G8-E6 (456lp=mm) and G8-E5 (406 lp=mm) for horizontal andvertical directions. In this case, the gain factors inthe resolution are 2.5 and 3 when comparing the re-solution limits in both horizontal and vertical direc-tions, respectively, without and with the proposedapproach.
B. Synthetic Aperture Shaping
In this subsection we show the capabilities of the pro-posed approach for easily synthesizing any SA shapeand the adaptation of the generated SA to the type ofimaged object. As the first case, we report on thepossibility that the input object contains the quasi-totality of useful information in orthogonal directionsat the Fourier domain but not in the vertical and hor-izontal ones. To demonstrate this particular case, weconsider a 45 deg rotation of the USAF test at theinput plane. Figures 7(a) and 7(b) show the casewhen off-axis oblique illumination at 45 deg is used(FT of the recorded hologram and magnified area ofinterest, respectively). Analogously, cases (c) and (d)correspond with the case of 135 deg off-axis obliqueillumination.In these conditions and under on-axis illumina-
tion, the CCD defines the same NA for the two ortho-gonal directions. Making some simple calculations,the new NA is equal to 0.115 in both directionsand the new resolution limit is 5:5 μm (181 lp=mm).We can see that the last resolved element is now G7-E3 (161 lp=mm) in both directions [see white arrowsin Fig. 7(e)]. Although G7-E4 (181 lp=mm) coincidesexactly with the theoretical resolution limit, this ele-ment does not appear resolved in the image becauseit is in the limit of the imaging setup resolution. ThenSA generation is performed using tilted beam illumi-nation only in the oblique orthogonal directions, thatis, 45-135-225-315 deg illumination directions. As afinal result, four off-axis rectangular apertures arerecovered and used to assemble the SA by coherent
addition with the on-axis one [Fig. 7(f)]. No specialcare (attenuation of the overlapping area) has beentaken when adding overlapping spectrums at theFourier domain. The superresolved image is depictedin Fig. 7(g). Now the resolution limit is experimen-tally improved until G8-E5 (406 lp=mm), and its cor-responding theoretical value comes from an SNAvalue equal to SNA ¼ NACCD þNAILUM ¼ 0:285 thatdefines a superresolution limit equal to SR ¼2:22 μm (450 lp=mm). Note that those values are
Fig. 5. (a) and (b) are the FT of the recorded holograms for hor-izontal (right) and vertical (up) off-axis illuminations, respectively.Inner images magnify the area of interest (solid white rectangle).(c) and (d) correspond with the area of interest when consideringthe complementary horizontal (left) and vertical (down) off-axisilluminations.
the same for both superresolved directions. Onceagain, both experimental and theoretical valuesare in good agreement, since the following USAF ele-ment (G8-E6) is below the superresolved diffractionlimit (456 lp=mm).As a second case, we present the general case
where the input object contains information in everydirection at the spatial-frequency space. Then SAgeneration must cover the whole spatial-frequencyplane by considering the addition of elementaryapertures in all possible directions (0-45-90-135-180-225-270-315 deg tilted illuminations). To illustratethis case, we present experimental results obtainedwhen using a biosample of fixed human red bloodcells. The erythrocyte slide is stained using a spe-cially prepared mixture of Methylene Blue and Eosinin methanol (Wright’s stain). Now the theoreticalvalues defined by the experimental setup are thosepresented in Subsection 3.A (NAHOR ¼ 0:11 andNAVER ¼ 0:08, and RHOR ¼ 5:74 μm and RVER ¼7:72 μm). Figures 8(a)–8(d) show the cases whenon-axis and horizontal, vertical, and oblique (45deg) off-axis illumination, respectively, are used. In-sets depict magnified images of the area of intereston each case. The lower inset in case (a) defines
the low-resolution image provided by the conven-tional imaging mode. This low-resolution image isalso depicted in case (f), where we can see that theimage presents higher resolution in the horizontalthan in the vertical direction, in accord with the rec-tangular size of the CCD. Moreover, since the redblood cells are around 6–7 μm in diameter, theyare not imaged in the vertical direction but can bebarely seen in the limit for the horizontal direction.After performing the proposed approach, Fig. 8(e) de-picts the SA generated by coherent addition of theeight off-axis rectangular pupils, where the conven-tional rectangular aperture is again marked with adashed white rectangle for clarity. Once again, no at-tenuation of the overlapping area when adding thedifferent spectrums is considered. And finally, thesuperresolved image is presented in Fig. 8(g), show-ing the resolution improvement. Notice that, in somecells, there appears a faint black point in the center.This black point is originated by deviation of the lightat the center of the cells due to the typical donutlikeshape of the red blood cells. According to the theory,the SNA values and the new resolution limits arethose presented in the USAF validation (SNAHOR ¼0:28, SNAVER ¼ 0:25, SNAOBLIQUE ¼ 0:285, andSRHOR ¼ 2:26 μm, SRVER ¼ 2:53 μm and SROBLIQUE¼ 2:22 μm), values that enable image formation ofthe cells.
Finally, and as a third case, we show now how tofurther improve the resolution limit while perform-ing the proposed approach. By considering a secondillumination ring at twice the oblique illuminationangle of the first ring, it is possible to expand upthe synthetic cutoff frequency by addition of a newrectangular pupil. This second illumination ringcan be produced by both the use of a new wedgeprism having a deviation angle twice the angle ofthe prism used in the previous experiments, thatis, 20 deg, or a combination of two identical wedgelikeprisms in a beam steering application. We have se-lected the second option, where two identical prismshaving a 10 deg deviation angle are combined. Noticethat the paraxial condition supposed in the analysisof the beam splitter cube still prevails because eachrecording defines an NA of 0.1, independently of theillumination angle. Thus, the first illumination ringis provided by a single prism covering the four ortho-gonal directions of the USAF target, and then a sec-ond illumination ring is performed using the twoprisms together. With this procedure, a set of tiltedbeams having an oblique illumination angle of 20 degcan be produced over the input plane: this is our sec-ond illumination ring.
To experimentally validate that it is possible tofurther achieve a better resolution limit, we usethe USAF test target as the input object. Once again,the NAs and the resolution limits in the horizontaland vertical directions of the imaging system withon-axis illumination are those ones specified in Sub-section 3.A. Since we want to show proof of principlevalidation, and the USAF test has the most useful
Fig. 6. (a) generated SA where the conventional aperture isshown with a dashed white line and (b) superresolved image.
Fig. 7. USAF test rotated 45 deg: (a)–(b) are the FT of the recorded hologram when off-axis oblique (45 deg) illumination is used and amagnification of the area of interest, respectively. (c)–(d) are the equivalent images when off-axis oblique (135 deg) illumination is con-sidered. (e) is the low-resolution imagemagnification obtained with on-axis illumination, (f) is the generated SA (the conventional apertureis marked with a dashed white rectangle), and (g) is the superresolved image.
Fig. 8. Cell biosample case: (a) FT of the recorded hologram when on-axis illumination is considered. The inner figures marked withdotted and dashed white lines show increasing magnification of the area of interest. (b)–(d) are the equivalent images when horizontal,vertical, and oblique illuminations are used, respectively. (e) is the generated SA (the conventional aperture is marked with a dashed whiterectangle). (f) is the conventional imaging mode when on-axis illumination is considered. (g) is the superresolved image. The white scalebars in the upper-right corner of (f) and (g) are 10 μm.
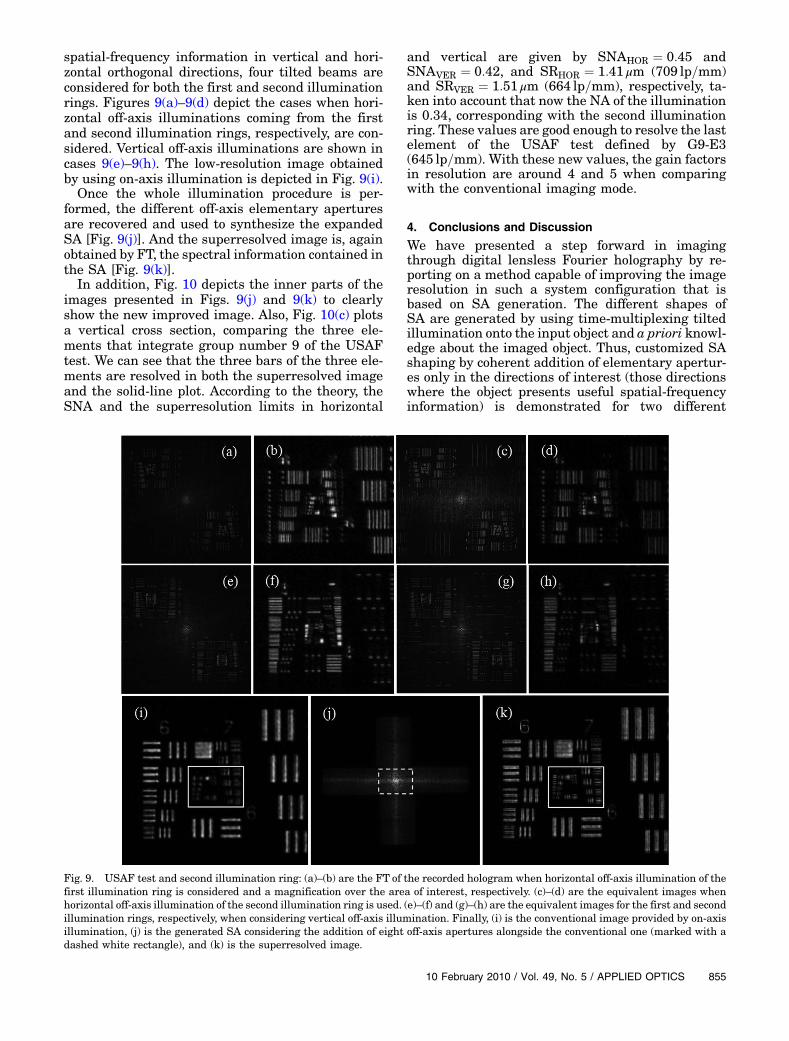
spatial-frequency information in vertical and hori-zontal orthogonal directions, four tilted beams areconsidered for both the first and second illuminationrings. Figures 9(a)–9(d) depict the cases when hori-zontal off-axis illuminations coming from the firstand second illumination rings, respectively, are con-sidered. Vertical off-axis illuminations are shown incases 9(e)–9(h). The low-resolution image obtainedby using on-axis illumination is depicted in Fig. 9(i).Once the whole illumination procedure is per-
formed, the different off-axis elementary aperturesare recovered and used to synthesize the expandedSA [Fig. 9(j)]. And the superresolved image is, againobtained by FT, the spectral information contained inthe SA [Fig. 9(k)].In addition, Fig. 10 depicts the inner parts of the
images presented in Figs. 9(j) and 9(k) to clearlyshow the new improved image. Also, Fig. 10(c) plotsa vertical cross section, comparing the three ele-ments that integrate group number 9 of the USAFtest. We can see that the three bars of the three ele-ments are resolved in both the superresolved imageand the solid-line plot. According to the theory, theSNA and the superresolution limits in horizontal
and vertical are given by SNAHOR ¼ 0:45 andSNAVER ¼ 0:42, and SRHOR ¼ 1:41 μm (709 lp=mm)and SRVER ¼ 1:51 μm (664 lp=mm), respectively, ta-ken into account that now the NA of the illuminationis 0.34, corresponding with the second illuminationring. These values are good enough to resolve the lastelement of the USAF test defined by G9-E3(645 lp=mm). With these new values, the gain factorsin resolution are around 4 and 5 when comparingwith the conventional imaging mode.
4. Conclusions and Discussion
We have presented a step forward in imagingthrough digital lensless Fourier holography by re-porting on a method capable of improving the imageresolution in such a system configuration that isbased on SA generation. The different shapes ofSA are generated by using time-multiplexing tiltedillumination onto the input object and a priori knowl-edge about the imaged object. Thus, customized SAshaping by coherent addition of elementary apertur-es only in the directions of interest (those directionswhere the object presents useful spatial-frequencyinformation) is demonstrated for two different
Fig. 9. USAF test and second illumination ring: (a)–(b) are the FT of the recorded hologram when horizontal off-axis illumination of thefirst illumination ring is considered and a magnification over the area of interest, respectively. (c)–(d) are the equivalent images whenhorizontal off-axis illumination of the second illumination ring is used. (e)–(f) and (g)–(h) are the equivalent images for the first and secondillumination rings, respectively, when considering vertical off-axis illumination. Finally, (i) is the conventional image provided by on-axisillumination, (j) is the generated SA considering the addition of eight off-axis apertures alongside the conventional one (marked with adashed white rectangle), and (k) is the superresolved image.
objects: a synthetic resolution test and a complexcells sample. The proposed approach can be easilyadapted to any system requirements, that is, itmeans a versatile, simple and customized methodto improve resolution in digital lensless Fourier ho-lographic microscopy imaging. Finally, theoreticalcalculations and experimental validation are pre-sented, showing a good concordance between them.Other lensless approaches allowing the generation
of an SA by means of time-multiplexing tilted beamillumination in digital holography have been re-ported [14,16]. Themain novelty is that the recordingpattern is not in the spatial domain (FT of the givenfrequency band) but in the Fourier space (image of afrequency bandpass). This fact increases the systeminformation capacity for a given camera, but also canlead to ambiguity of phase determination and possi-ble information loss for patterns with high periodi-city due to a restricted detection dynamic range.The authors have demonstrated an SNA close to0.75 coming from the addition of multiple off-axis ho-lograms, where each individual one has a rectangu-lar equivalent extension of 0.13 NA. However, thegenerated SA does not imply full 2D coverage ofthe object’s spectrum (four noncontiguous rectangu-lar areas due to the CCD aperture shape in [14] andan annular shape aperture in [16]). Thus, the synthe-sized images resemble those obtained when usingdark-field coherent microscopy. In that case, a prioriknowledge about the input object is known and usedto define the angle of the illumination beam. In a si-milar way, we use a priori information about the in-put object to multiplex only the directions of interest,
but here it is simpler to cover the full 2D object spec-trum when generating the SA.
Moreover, we have experimentally demonstratedthe versatility of the method to generate differentSA shapes, not only for synthetic resolution test ob-jects but also for more complex samples such as hu-man red blood cells. Because of that, and due to theholographic nature of the method, phase visualiza-tion and quantification can be achieved for thosesamples where phase information will be much morerelevant than the amplitude one. Thus, the combina-tion of the proposed method with digital image pro-cessing enables a lot of capabilities for phase sampleimaging, such as phase contrast or differential inter-ference contrast imaging [31], three-dimensionalsample representation [22], or even refocusing thesample at different planes [23].
In addition, the proposed method demonstrates again in resolution of 3 providing an improved resolu-tion limit of around 2:2 μm (best value) while cover-ing the whole 2D spatial-frequency space. Thepossibility to achieve better values is also reportedby adding more external elementary apertures usinga second illumination ring coming from the combina-tion of two prisms in the illumination procedure.With this second illumination ring, the SNA, super-resolution limit, and resolution gain best values are0.45, 1:41 μm, and 5, respectively. This is the firsttime, to the best of our knowledge, that such valuesare reported in digital lensless Fourier holography.Other digital lensless Fourier holographic superreso-lution methods are based on diffraction gratings[27,28] or tilted pulsed beam illumination [15] andhave the advantage of being able to work in a singleillumination shot because their underlying principleis spatial rather than time multiplexing. However,those methods demonstrated more modest improve-ments in comparison with the one reported here. Justas an example, [28] demonstrates a resolution gainfactor of 1.6 with a resolution limit of 20 μm, while[15] reported on a gain in resolution of 1.78, arrivinguntil 6:5 μm of resolution limit, approximately. Now,we have reached a resolution limit of around 1:4 μm,enabling the proposed method for real microscopicapplications.
This work was supported by theMinisterio de Edu-cación y Ciencia de España and Fondo Europeo deDesarrollo Regional (FEDER) funds under projectFIS2007-60626. Luis Granero wants to thank theTechnological Institute of Optics, Color and Imaging(AIDO) for the time dedicated to this research.
References
1. E. Abbe, “Beitrage zür theorie des mikroskops und dermikroskopischen wahrnehmung,” Archiv. MicroskopischeAnat. 9, 413–468 (1873).
2. M. Françon, “Amélioration de resolution d’optique,” NuovoCimento Suppl. 9, 283–290 (1952).
3. G. Toraldo di Francia, “Resolving power and information,” J.Opt. Soc. Am. 45, 497–501 (1955).
Fig. 10. (a) and (b) are magnified areas of the inner parts markedwith a solid white line rectangle in cases (a) and (c) of Fig. 9,respectively. (c) plots the vertical cross sections corresponding withthe lines in cases (a) and (b). The dashed curve represents the con-ventional image, and the solid curve is representative of the super-resolved image case.
4. I. J. Cox and C. J. R. Sheppard, “Information capacity andresolution in an optical system,” J. Opt. Soc. Am. A 3,1152–1158 (1986).
5. W. Lukosz, “Optical systems with resolving powers exceedingthe classical limit,” J. Opt. Soc. Am. 56, 1463–1472 (1966).
6. W. Lukosz, “Optical systems with resolving powers exceedingthe classical limit II,” J. Opt. Soc. Am. 57, 932–941 (1967).
7. Z. Zalevsky and D. Mendlovic, Optical Super Resolution(Springer, 2002).
8. X. Chen and S. R. J. Brueck, “Imaging interferometric lithog-raphy: approaching the resolution limits of optics,” Opt. Lett.24, 124–126 (1999).
9. C. J. Schwarz, Y. Kuznetsova, and S. R. J. Brueck, “Imaginginterferometric microscopy,” Opt. Lett. 28, 1424–1426(2003).
10. V. Mico, Z. Zalevsky, P. García-Martínez, and J. García, “Singlestep superresolution by interferometric imaging,” Opt. Ex-press 12, 2589–2596 (2004).
11. M. Ueda and T. Sato, “Superresolution by holography,” J. Opt.Soc. Am. 61, 418–419 (1971).
12. M. Ueda, T. Sato, and M. Kondo, “Superresolution by multiplesuperposition of image holograms having different carrierfrequencies,” Opt. Acta 20, 403–410 (1973).
13. T. Sato, M. Ueda, and G. Yamagishi, “Superresolution micro-scope using electrical superposition of holograms,” Appl. Opt.13, 406–408 (1974).
14. S. A. Alexandrov, T. R. Hillman, T. Gutzler, and D. D. Sampson,“Synthetic aperture Fourier holographic optical microscopy,”Phys. Rev. Lett. 97, 168102 (2006).
15. C. Yuan, H. Zhai, and H. Liu, “Angular multiplexing in pulseddigital holography for aperture synthesis,” Opt. Lett. 33,2356–2358 (2008).
16. T. R. Hillman, T. Gutzler, S. A. Alexandrov, and D. D. Sampson,“High-resolution, wide-field object reconstruction with syn-thetic aperture Fourier holographic optical microscopy,”Opt. Express 17, 7873–7892 (2009).
17. V. Mico, Z. Zalevsky, P. García-Martínez, and J. García,“Superresolved imaging in digital holography by super-position of tilted wavefronts,” Appl. Opt. 45, 822–828(2006).
18. V. Mico, Z. Zalevsky, and J. García, “Superresolution opticalsystem by common-path interferometry,” Opt. Express 14,5168–5177 (2006).
19. G. Indebetouw, Y. Tada, J. Rosen, and G. Brooker, “Scanningholographic microscopy with resolution exceeding the Ray-leigh limit of the objective by superposition of off-axis holo-grams,” Appl. Opt. 46, 993–1000 (2007).
20. Y. Kuznetsova, A. Neumann, and S. R. J. Brueck, “Imaginginterferometric microscopy—approaching the linear systemlimits of optical resolution,” Opt. Express 15, 6651–6663(2007).
21. V. Mico, Z. Zalevsky, and J. García, “Synthetic aperture micro-scopy using off-axis illumination and polarization coding,”Opt. Commun. 276, 209–217 (2007).
22. V. Mico, Z. Zalevsky, and J. García, “Common-path phase-shifting digital holographic microscopy: a way to quantitativeimaging and superresolution,” Opt. Commun. 281, 4273–4281 (2008).
23. V. Mico, Z. Zalevsky, C. Ferreira, and J. García, “Superresolu-tion digital holographic microscopy for three-dimensionalsamples,” Opt. Express 16, 19260–19270 (2008).
24. F. Le Clerc, M. Gross, and L. Collot, “Synthetic apertureexperiment in the visible with on-axis digital heterodyneholography,” Opt. Lett. 26, 1550–1552 (2001).
25. J. H. Massig, “Digital off-axis holography with a syntheticaperture,” Opt. Lett. 27, 2179–2181 (2002).
26. R. Binet, J. Colineau, and J-C. Lehureau, “Short-range syn-thetic aperture imaging at 633nm by digital holography,”Appl. Opt. 41, 4775–4782 (2002).
27. Ch. Liu, Z. Liu, F. Bo, Y. Wang, and J. Zhu, “Super-resolutiondigital holographic imaging method,” Appl. Phys. Lett. 81,3143–3145 (2002).
28. M. Paturzo, F. Merola, S. Grilli, S. De Nicola, A. Finizio, and P.Ferraro, “Super-resolution in digital holography by two-dimensional dynamic phase grating,” Opt. Express 16,17107–17118 (2008).
29. L. Granero, V. Micó, Z. Zalevsky, and J. García, “Superresolu-tion imaging method using phase-shifting digital lenslessFourier holography,” Opt. Express 17, 15008–15022 (2009).
30. V. Micó, L. Granero, Z. Zalevsky, and J. García, “Superresolvedphase-shifting Gabor holography by CCD shift,” J. Opt. A:Pure Appl. Opt. 11, 125408 (2009).
31. W. Xu, M. H. Jericho, I. A. Meinertzhagen, and H. J. Kreuzer,“Digital in-line holography for biological applications,” Proc.Natl. Acad. Sci. USA 98, 11301–11305 (2001).
32. G. Pedrini and H. J. Tiziani, “Short-coherence digital micro-scopy by use of a lensless holographic imaging system,” Appl.Opt. 41, 4489–4496 (2002).
33. L. Repetto, E. Piano, and C. Pontiggia C, “Lensless digital ho-lographic microscope with light-emitting diode illumination,”Opt. Lett. 29, 1132–1134 (2004).
34. J. Garcia-Sucerquia, W. Xu, S. K. Jericho, P. Klages, M. H.Jericho, and H. J. Kreuzer, “Digital in-line holographic micro-scopy,” Appl. Opt. 45, 836–850 (2006).
35. V. Micó, J. García, Z. Zalevsky, and B. Javidi, “Phase-shiftingGabor holography,” Opt. Lett. 34, 1492–1494 (2009).
36. U. Schnars and W. P. Jueptner, Digital Holography (Springer,2005).
37. H. Jiang, J. Zhao, J. Di, and Ch. Qin, “Numerically correctingthe joint misplacement of the sub-holograms in spatial syn-thetic aperture digital Fresnel holography,” Opt. Express17, 18836–18842 (2009).
38. G. Pedrini, P. Fröning, J. H. Tiziani, and F. M. Santoyo, “Shapemeasurement of microscopic structures using digital holo-grams,” Opt. Commun. 164, 257–268 (1999).
39. S. De Nicola, P. Ferraro, A. Finizio, S. Grilli, and G. Pierattini,“Experimental demonstration of the longitudinal image shiftin digital holography,” Opt. Eng. 42, 1625–1630 (2003).
41. P. Picart and J. Leval, “General theoretical formulation of im-age formation in digital Fresnel holography,” J. Opt. Soc. Am.A 25, 1744–1761 (2008).
42. D. P. Kelly, B. M. Hennelly, N. Pandey, T. J. Naughton, and W.T. Rhodes, “Resolution limits in practical digital holographicsystems,” Opt. Eng. 48, 095801 (2009).