31
Sysco 1Q FY22 Earnings Results November 9, 2021

Sysco 1Q FY22 Earnings ResultsNovember 9, 2021
Forward Looking StatementsStatements made in this presentation or in our earnings call for the first quarter of fiscal 2022 that look forward in time or that express management’s beliefs , expectations or hopes are forward-looking statements within the meaning of thePrivate Securities Litigation Reform Act of 1995. Such forward-looking statements reflect the views of management at the time such s tatements are made and are subject to a number of risks, uncertainties, estimates , and assumptions that maycause actual results to differ materially from current expectations. These statements include s tatements concerning: the effect, impact, potential duration or other implications of the coronavirus (“COVID-19”) pandemic and any expectations wemay have with respect thereto, including the extent and duration of lockdowns in the U .S. and Europe; our expectations regarding the pace and timing of the business recovery in the U .S. and Europe; our expectations that our transformationalagenda will drive long-term growth; our belief in Sysco’s ability to take market share, and our expectations regarding future market share gains in fiscal 2022 and 2024; our belief that growth in customers and sales in the first quarter of fiscal2022 will fuel our success in future periods; our expectations regarding the continuation of an inflationary environment; our expectations regarding improvements in the travel, hospitality and foodservice management sectors of our business, andthe impact that recovery in such sectors will have on our business; our expectations that our business and industry segment will see upward momentum in January as select companies plan to begin reopening their offices at that time; ourexpectations that the easing of international travel restrictions should benefit our hospitality sector in specific regions of our business; our expectations regarding the impact of our Recipe for Growth strategy on our international results ; ourexpectations that our strategic priorities will enable us to grow faster than the market; our expectations regarding our efforts to reduce overtime rates and the incremental investments in hiring, and that profit flow through should improvethroughout fiscal 2022 as a result; our expectations regarding the impact of our new pricing systems on our business; our expectations regarding the impact of our personalization engine on our business; our ability to accelerate profitablegrowth; our expectations regarding the impact of the Greco and Sons acquisition, and the acquisition of a produce distributor, on our business; our expectations regarding our ability to grow faster than the total market in fiscal 2022 and fiscal2024; our expectations regarding our partnership with suppliers and the performance of our suppliers in fiscal 2022 and 2023; our plans and expectations regarding the SyscoDriver Academy; our expectations regarding incremental operationalexpenses as a result of enhanced safety and health regulations; our savings goals from fiscal 2023 through fiscal 2024; our ability to deliver against our strategic priorities; economic trends in the United States and abroad; our plans to reduceindebtedness by the end of fiscal 2022, including the repayment of notes in fiscal 2022; our commitments to further reduce debt in fiscal 2022; our expectations regarding our ability to hit our leverage target; our expectations regarding ourdividend payments in calendar year 2022; our plans to increase capital expenditures; our future growth; our expectations regarding profits and sales in fiscal 2022; our expectations regarding the effects of our cost savings , including effects onprofit growth; the pace of implementation of our business transformation initiatives; our expectations regarding our overall effective tax rate in fiscal 2022; our expectations regarding our earnings per share in fiscal 2022; our expectationsregarding capital expenditures and our net debt to adjusted EBITDA target; our expectations regarding the commencement of share repurchase activity under our share repurchase program; our expectations regarding snap-back andtrans formation investments , and the decline of snap-back costs as the year progresses; and our commitments to responsible growth and efficiency improvements; our implementation of cost-out programs to fund snap-back and trans formationcosts.
The success of our plans and expectations regarding our operating performance are subject to the general risks associated with our business , including the risks of interruption of supplies due to lack of long-term contracts, severe weather, c ropconditions, work stoppages, intense competition, technology dis ruptions , dependence on large, long-term regional and national customers , inflation risks , the impact of fuel prices, adverse publicity, labor issues , political or financial instability,trade restrictions, tariffs , currency exchange rates, transport capacity and costs and other factors relating to foreign trade, any or all of which could delay our receipt of product or increase our input costs. Risks and uncertainties also include theimpact and effects of public health crises, pandemics and epidemics, such as the COVID-19 pandemic , and the adverse impact thereof on our business, financial condition and results of operations , including, but not limited to, our growth, productcosts, supply chain, labor availability, logistical capabilities , customer demand for our products and industry demand generally, consumer spending, our liquidity, the price of our securities and trading markets with respect thereto, our creditratings, our ability to maintain compliance with the covenants in our credit agreement, our ability to access capital markets , and the global economy and financial markets generally. Risks and uncertainties also include risks impacting theeconomy generally, including the risks that the current general economic conditions will deteriorate, or consumer confidence in the economy or consumer spending, particularly on food-away-from-home, may decline. Market conditions may notimprove. Competition and the impact of GPOs may reduce our margins and make it difficult for us to maintain our market share, growth rate and profitability. We may not be able to fully compensate for increases in fuel costs , and fuel hedgingarrangements intended to contain fuel costs could result in above market fuel costs . Our ability to meet our long-term strategic objectives depends on our ability to grow gross profit, leverage our supply chain costs and reduce administrativecosts. This will depend largely on the success of our various business initiatives , including efforts related to revenue management, expense management, our digital e-commerce strategy and any efforts related to restructuring or the reduction ofadministrative costs. There are various risks related to these efforts , including the risk that if sales from our locally managed customers do not grow at the same rate as sales from regional and national customers , or if we are unable to continueto accelerate local case growth, our gross margins may decline; the risk that we are unlikely to be able to predict inflation over the long term, and lower inflation is likely to produce lower gross profit; the risk that our efforts to mitigate increasesin warehouse costs may be unsuccessful; the risk that we may not be able to accelerate and/or identify additional administrative cost savings in order to compensate for any gross profit or supply chain cost leverage challenges; the risk that theseefforts may not provide the expected benefits in our anticipated time frame, if at all, and may prove costlier than expected; the risk that the actual costs of any initiatives may be greater or less than currently expected; and the risk of adverseeffects to our business, results of operations and liquidity if past and future undertakings, and the associated changes to our business , do not prove to be cost effective or do not result in the cost savings and other benefits at the levels that weanticipate. Our plans related to and the timing of any initiatives are subject to change at any time based on management’s subjective evaluation of our overall business needs . I f we are unable to realize the anticipated benefits from our efforts ,we could become cost disadvantaged in the marketplace, and our competitiveness and our profitability could decrease. Adverse publicity about us or lack of confidence in our products could negatively impact our reputation and reduce earnings.Capital expenditures may vary based on changes in business plans and other factors , including risks related to the implementation of various initiatives, the timing and successful completion of acquisitions , construction schedules and thepossibility that other cash requirements could result in delays or cancellations of capital spending. Periods of s ignificant or prolonged inflation or deflation, either overall or in certain product categories, can have a negative impact on us and ourcustomers, as high food costs can reduce consumer spending in the food-away-from-home market, and may negatively impact our sales , gross profit, operating income and earnings , and periods of deflation can be difficult to manage effectively.Fluctuations in inflation and deflation, as well as fluctuations in the value of foreign currencies , are beyond our control and subject to broader market forces . Expanding into international markets presents unique challenges and risks, includingcompliance with local laws , regulations and customs and the impact of local political and economic conditions, including the impact of Brexit and the “yellow vest” protests in France against a fuel tax increase, pension reform and the Frenchgovernment, and such expansion efforts may not be successful. Any business that we acquire may not perform as expected, and we may not realize the anticipated benefits of our acquisitions . Expectations regarding the financial statementimpact of any acquisitions may change based on management’s subjective evaluation. A divestiture of one or more of our businesses may not provide the anticipated effects on our operations . Meeting our dividend target objectives depends onour level of earnings , available cash and the success of our various strategic initiatives . Changes in applicable tax laws or regulations and the resolution of tax disputes could negatively affect our financial results . We rely on technology in ourbusiness and any cybersecurity incident, other technology disruption or delay in implementing new technology could negatively affect our business and our relationships with customers. For a discussion of additional factors impacting Sysco’sbus iness, see our AnnualReport on Form10-K for the year ended July 3, 2021, as filed with the SEC, and our subsequent filings with the SEC. We do not undertake to update ourforward-looking statements, except as required by applicable law.
2

KEVIN HOURICANPresident & CEO

Financial Results: Topline Momentum & Meaningful Market Share Gains
Topline sequentially improved throughout the quarter and continued to improve in October
Q1 sales grew 8.2% compared to fiscal 2019, with additional recovery pending
Continuing to invest in our Long-Term Transformational Agenda that is supporting share gains and will drive long-term growth
Profitability exceeded our expectations; Reiterating our guidance for fiscal 2022
4
4%
8%
10%
0%
2%
4%
6%
8%
10%
12%
Q4 FY21 Q1 FY22 Oct. FY22
Total Sysco Net Sales Growth
Net Sales vs. FY19

Business Transformation: Improving Efficiency + Continued Investments for Our Recipe For Growth
We are on track with our Recipe For Growth
Pricing project implementation substantially complete
Personalization engine, sales transformation and efficiency work continues to advance
5
STRATEGY | How We Win - We will grow 1.5x faster than the market through our strategic priorities

We Are Increasing Our Efforts to Better Service Specialty Customers
6
Greco and Sons acquisition closed duringQ1 and is already leading to customer wins
Expected to deliver over $1 billion inincremental sales this fiscal year
Importer and distributer of premiumquality food and non-food products as wellas value-added specialty meat products
Sysco is expanding the Greco platform tocreate a nationwide Italian segmentplatform

State of the Business: Staffing Health Remains a Critical Enabler
7
Successful National Hiring Event resulted in 1,000+ new supply chain associates in one day
On track with Driver Academy to train our next generation of Sysco drivers
Fill-rates: Delivered a higher fill-rate to our customers than industry average
We continue to gain share

AARON ALTEVP & CFO
9
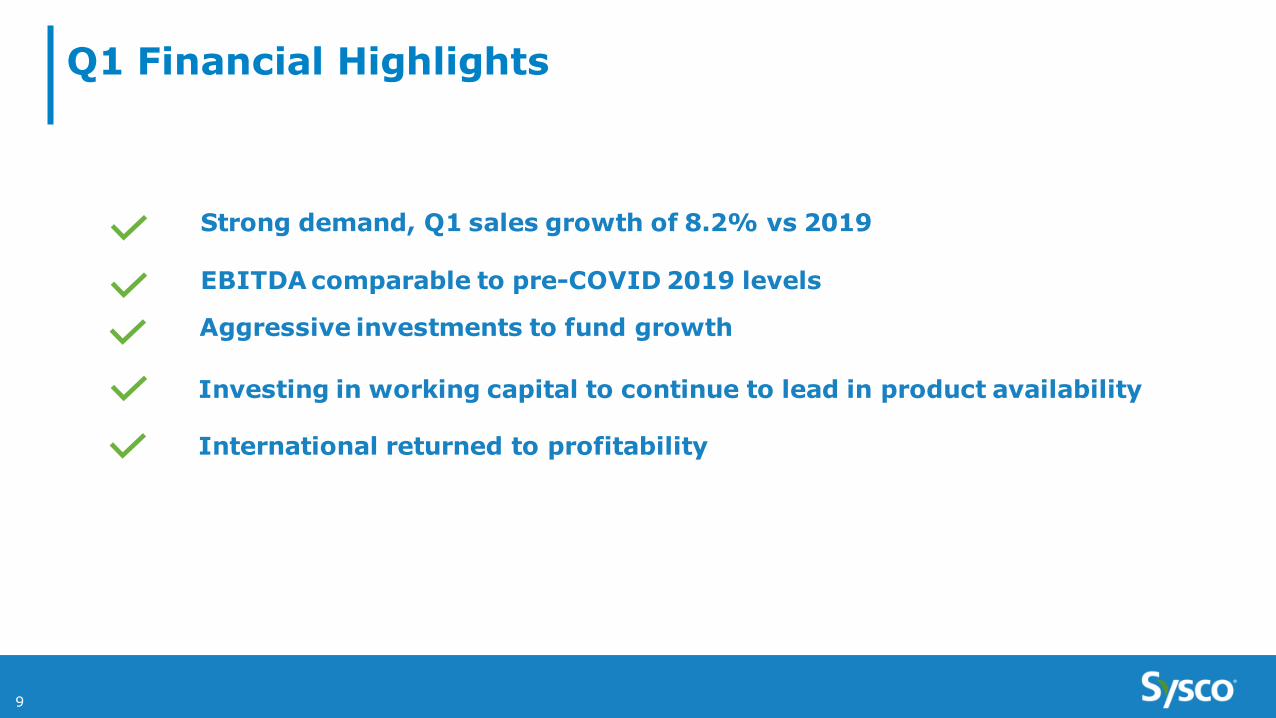
Strong demand, Q1 sales growth of 8.2% vs 2019
Investing in working capital to continue to lead in product availability
Q1 Financial Highlights
EBITDA comparable to pre-COVID 2019 levels
Aggressive investments to fund growth
International returned to profitability

10
Upgrade from BBB minus to BBB flat of our investment grade rating by S&P
A Balanced Approach to Capital Allocation: Funding Growth and Returning Value to Shareholders
Increased dividend in Q1; maintaining Dividend Aristocrat status
Continued investment against the five pillars of our Recipe for Growth Strategy
Expect to begin share repurchase activity in 2Q, up to $500 million in fiscal 2022
Elimination of all debt covenant restrictions on our ability to repurchase shares or increase our dividend in the future

39.7%
Adj. EBITDA1
Sales $16.5B
Total Sysco 1Q22
87.9%
144.1%
Gross Profit $3.0B
$685M
$0.83
33.9%
Adj. Operating Income1
62.5%
Adj. EPS1
$853M
11
1Q22 Total Sysco Results
8.2%
vs 1Q19
-1.0%
-8.8%
2.3%
-0.6%
1 See Non-GAAP reconciliations at the end of the presentation..
EBITDA Comparable to Pre-COVID 2019 levels

1Q22 U.S. Foodservice Results
47%$11.6B
U.S. Foodservice
$2.2B
$1.4B
$796M
37%
27%
58%
Sales
U.S. Foodservice
Gross Profit
Adj. Operating Expenses1
Adj. Operating Income1
1Q22
12
1 See Non-GAAP reconciliations at the end of the presentation..
Sales +12% compared to first quarter of fiscal 2019

1Q22 SYGMA Results
12%$1.7B
1Q22
$138M
$141M
($2M)
5%
17%
-121%
Sales
SYGMA
Gross Profit
Adj. Operating Expenses1
Adj. Operating Loss1
13
1 See Non-GAAP reconciliations at the end of the presentation..
Fifth consecutive quarter of SYGMA sales growth, +5% vs. fiscal 2019

1Q22 International Results
Sales
International
Gross Profit
Adj. Operating Expenses1
1Q22
14
1 See Non-GAAP reconciliations at the end of the presentation..
Sales in-line vs. fiscal 2019
Adj. Operating Income1
34%$2.9B
$589M
$525M
$64M
31%
22%
241%

Cash from Ops
Free Cash Flow1
$931M
$862M $171M
$271M
1Q21 1Q19
15
$31M
$111M
1Q22
Purposefully invested in inventory in support of managing product availability; CapEx planned to ramp up
1 See Non-GAAP reconciliations at the end of the presentation..
1Q22 Cash Flow

16
Balance Sheet & Capital Allocation
$2.1 billion of cash at the end of Q1
Target: net debt-to-adjusted EBITDA leverage ratio of 2.5x-2.75x by end of fiscal 2022
Capital Allocation Progress
• Returning Cash to Shareholders with dividend of 47 cents July and October
• Recently upgraded from BBB- to BBB flat of our IG rating from S&P
• Elimination of debt covenant restrictions
• Commence our share repurchase activity starting in Q2
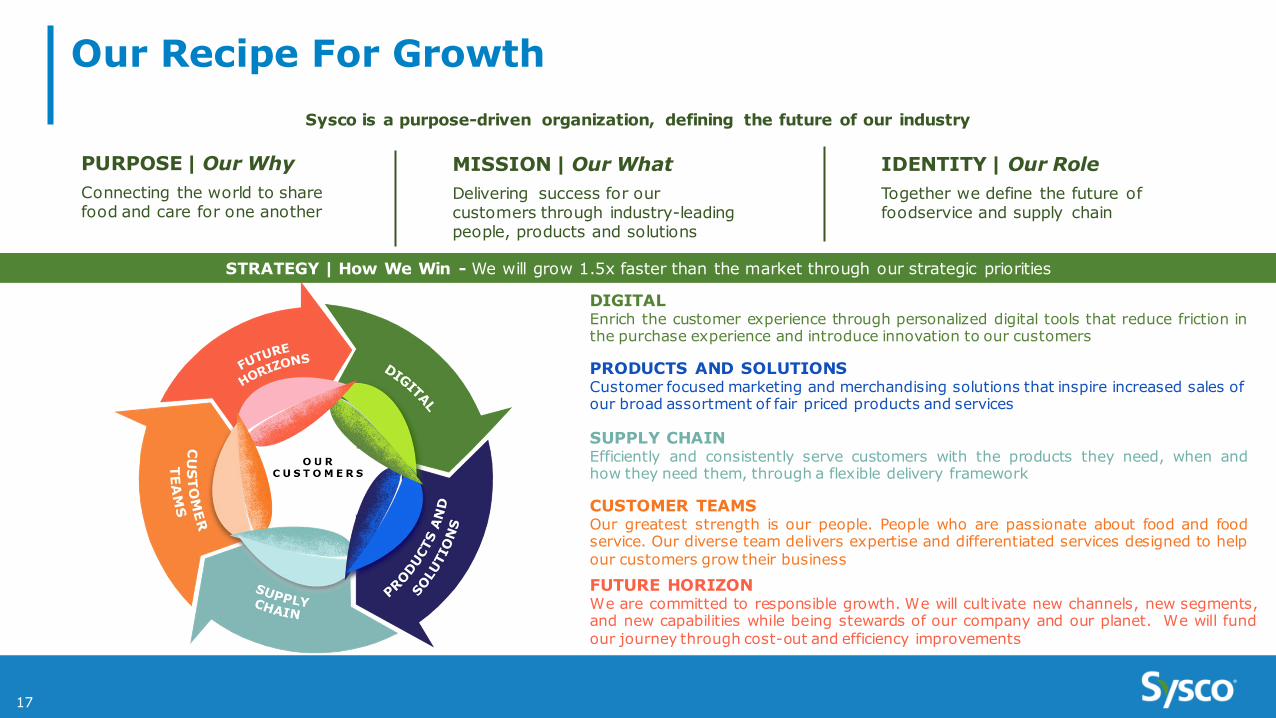
Sysco is a purpose-driven organization, defining the future of our industry
IDENTITY | Our RoleTogether we define the future of foodservice and supply chain
MISSION | Our WhatDelivering success for ourcustomers through industry-leadingpeople, products and solutions
PURPOSE | Our WhyConnecting the world to share food and care for one another
STRATEGY | How We Win - We will grow 1.5x faster than the market through our strategic priorities
DIGITALEnrich the customer experience through personalized digital tools that reduce friction inthe purchase experience and introduce innovation to our customers
PRODUCTS AND SOLUTIONSCustomer focused marketing and merchandising solutions that inspire increased sales of our broad assortment of fair priced products and services
SUPPLY CHAINEfficiently and consistently serve customers with the products they need, when andhow they need them, through a flexible delivery framework
FUTURE HORIZONWe are committed to responsible growth. We will cult ivate new channels, new segments,and new capabilities while being stewards of our company and our planet. We will fundour journey through cost-out and efficiency improvements
CUSTOMER TEAMSOur greatest strength is our people. People who are passionate about food and foodservice. Our diverse team delivers expertise and differentiated services designed to helpour customers grow their business
Our Recipe For Growth
17


NON-GAAPRECONCILIATIONS
Impact of Certain Items
Our discussion of our results includes certain non-GAAP financial measures, including EBITDA and adjusted EBITDA, that we believe provide important perspectivewith respect to underlying business trends. Other than free cash flow, any non-GAAP financial measures will be denoted as adjusted measures to remove the impact of restructuringand transformational project costs consisting of: (1) restructuring charges, (2) expenses associated with our various transformation initiatives and (3) facility closure and severancecharges; and by acquisition-related costs consisting of: (1) intangible amortization expense and (2) acquisition costs and due diligence costs related to our significant acquisitions.Our results for the first quarter of fiscal 2022 are also impacted by the increase in reserves for uncertain tax positions. Sysco’s results for the first quarter of fiscal 2022 and fiscal2021 were also impacted by the reduction of bad debt expense previously recognized in fiscal 2020 due to the impact of the COVID-19 pandemic on the collectability of our pre-pandemic trade receivable balances, by a loss on the sale of a business and by a net benefit from remeasuring net deferred tax assets due to the changes in U.K. tax rates.
The results of our foreign operations can be impacted due to changes in exchange rates applicable in converting local currencies to U.S. dollars. We measure our totalSysco and our International Foodservice Operations results on a constant currency basis. Constant currency operating results are calculated by translating current-period localcurrency operating results with the currency exchange rates used to translate the financial statements in the comparable prior-year period to determine what the current-period U.S.dollar operating results would have been if the currency exchange rate had not changed from the comparable prior-year period. The constant currency impact on our adjusted totalSysco and our adjusted International Foodservice Operations results are disclosed when the impact exceeds a defined threshold of greater than 1% on the growth metric. If theamount does not exceed this threshold, a disclosure will be made that the impact of the currency change was not significant.
Management believes that adjusting its operating expenses, operating income, net earnings and diluted earnings per share to remove these Certain Items andpresenting its International Foodservice Operations results on a constant currency basis, provides an important perspective with respect to our underlying business trends and resultsand provides meaningful supplemental information to both management and investors that (1) is indicative of the performance of the company’s underlying operations and (2)facilitates comparisons on a year-over-year basis.
Although Sysco has a history of growth through acquisitions, certain acquisitions were significantly larger than the companies historically acquired by Sysco, with aproportionately greater impact on Sysco’s consolidated financial statements. Accordingly, Sysco is excluding from its non-GAAP financial measures for the relevant periods the impactof acquisition-related intangible amortization, acquisition costs and due-diligence costs specific to our significant acquisitions. We believe this approach significantly enhances thecomparability of Sysco’s results for fiscal 2022 and fiscal 2021.
Our operating results in fiscal 2022 included one-time and short-term transitory expenses related to the business recovery, focused on items including marketing openpositions, signing bonuses, referral bonuses and retention bonuses, and operating expense investments for our Recipe for Growth strategy. Management believes that excluding theseinvestments provides a meaningful measurement of the company's diluted earnings per share performance. Our results in fiscal 2022 also included interest expense related toprecautionary senior notes issued in fiscal 2020 in response to the COVID-19 pandemic, as the company sought to preserve its available liquidity. Management believes that adjustinginterest expense further enhances the comparability of Sysco’s results for fiscal 2022.
Set forth below is a reconciliation of sales, operating expenses, operating income, other (income) expense, net earnings and diluted earnings per share to adjustedresults for these measures for the periods presented. Individual components of diluted earnings per share may not add up to the total presented due to rounding. Adjusted dilutedearnings per share is calculated using adjusted net earnings divided by diluted shares outstanding.
21

Impact of Certain Items, 1Q22 vs. 1Q21
22
Sysco Corporation and its Consolidated SubsidiariesNon-GAAP Reconciliation (Unaudited)Impact of Certain Items, 1Q22 vs. 1Q21 (Dollars in Thousands, Except for Share and Per Share Data)
13-WeekPeriod EndedOct. 2, 2021
13-WeekPeriod EndedSep. 26, 2020
Change in Dollars % Change
Sales (GAAP) $ 16,456,546 $ 11,777,379 $ 4,679,167 39.7%Impact of currency fluctuations (1) (124,726) - (124,726) -1.1%Comparable sales using a constant currency basis (Non-GAAP) $ 16,331,820 $ 11,777,379 $ 4,554,441 38.7%
Gross Profit (GAAP) $ 2,971,708 $ 2,219,845 $ 751,863 33.9%Impact of currency fluctuations (1) (23,863) - (23,863) -1.1%
Comparable gross profit using a constant currency basis (Non-GAAP) $ 2,947,845 $ 2,219,845 $ 728,000 32.8%
Gross margin (GAAP) 18.06% 18.85% -79 bpsImpact of currency fluctuations (1) -0.01% 0% -1 bpsComparable Gross margin using a Constant Dollar Basis (Non-GAAP) 18.05% 18.85% -80 bps
Operating expenses (GAAP) $ 2,340,026 $ 1,800,266 $ 539,760 30.0%Impact of restructuring and transformational project costs (2) (24,511) (25,964) 1,453 5.6%Impact of acquisition-related costs (3) (35,926) (17,755) (18,171) -102.3%Impact of bad debt reserve adjustments (4) 7,061 98,629 (91,568) -92.8%Operating expenses adjusted for Certain Items (Non-GAAP) 2,286,650 1,855,176 431,474 23.3%Impact of currency fluctuations (1) (21,751) - (21,751) -1.2%Comparable operating expenses adjusted for Certain Items using a constant currency basis (Non-GAAP) $ 2,264,899 $ 1,855,176 $ 409,723 22.1%
Operating income (GAAP) $ 631,682 $ 419,579 $ 212,103 50.6%Impact of restructuring and transformational project costs (2) 24,511 25,964 (1,453) -5.6%Impact of acquisition-related costs (3) 35,926 17,755 18,171 102.3%Impact of bad debt reserve adjustments (4) (7,061) (98,629) 91,568 92.8%Operating income adjusted for Certain Items (Non-GAAP) $ 685,058 $ 364,669 $ 320,389 87.9%Impact of currency fluctuations (1) (2,112) - (2,112) -0.6%Comparable operating income (loss) adjusted for Certain Items using a constant currency basis (Non-GAAP) $ 682,946 $ 364,669 $ 318,277 87.3%
Other (income) expense (GAAP) $ (3,252) $ 14,124 $ (17,376) 123.0%Impact of loss on sale of a business - (12,043) 12,043 NMOther (income) expense adjusted for Certain Items (Non-GAAP) $ (3,252) $ 2,081 $ (5,333) 256.3%

Impact of Certain Items, 1Q22 vs. 1Q21 continued
23
Net earnings (GAAP) $ 378,013 $ 216,900 $ 161,113 74.3%Impact of restructuring and transformational project costs (2) 24,511 25,964 (1,453) -5.6%Impact of acquisition-related costs (3) 35,926 17,755 18,171 102.3%Impact of bad debt reserve adjustments (4) (7,061) (98,629) 91,568 92.8%Impact of loss on sale of business - 12,043 (12,043) NMTax impact of restructuring and transformational project costs (5) (6,186) (5,920) (266) -4.5%Tax impact of acquisition-related costs (5) (9,066) (4,048) (5,018) -124.0%Tax Impact of bad debt reserve adjustments (5) 1,782 22,488 (20,706) -92.1%Tax impact of loss on sale of business (5) - (7,553) 7,553 NMImpact of adjustments to uncertain tax positions 12,000 - 12,000 NMImpact of foreign tax rate change (6) - (5,548) 5,548 NMNet earnings adjusted for Certain Items (Non-GAAP) $ 429,919 $ 173,452 $ 256,467 147.9%
Diluted earnings per share (GAAP) $ 0.73 $ 0.42 $ 0.31 73.8%Impact of restructuring and transformational project costs (2) 0.05 0.05 - 0.0%Impact of acquisition-related costs (3) 0.07 0.03 0.04 133.3%Impact of bad debt reserve adjustments (4) (0.01) (0.19) 0.18 94.7%Impact of loss on sale of business - 0.02 (0.02) NMTax impact of restructuring and transformational project costs (5) (0.01) (0.01) - 0.0%Tax impact of acquisition-related costs (5) (0.02) (0.01) (0.01) -100.0%Tax Impact of bad debt reserve adjustments (5) - 0.04 (0.04) NMTax impact of loss on sale of business (5) - (0.01) 0.01 NMImpact of adjustments to uncertain tax positions 0.02 - 0.02 NMImpact of foreign tax rate change (6) - (0.01) 0.01 NMDiluted earnings per share adjusted for Certain Items (Non-GAAP) (7) $ 0.83 $ 0.34 $ 0.49 144.1%
Diluted shares outstanding 515,782,928 510,738,760
NM represents that the percentage change is not meaningful.- more -
(5) The tax impact of adjustments for Certain Items is calculated by multiplying the pretax impact of each Certain Item by the statutory rates in effect for each jurisdiction where theCertain Item was incurred.
(7) Individual components of diluted earnings per share may not add up to the total presented due to rounding. Total diluted earnings per share is calculated using adjusted net earningsdivided by diluted shares outstanding.
(3) Fiscal 2022 includes $22 million of intangible amortization expense and $14 million in acquisition and due diligence costs, which are primarily included in Global Support Center expenses.Fiscal 2021 represents $18 million related to intangible amortization expense.
(2) Fiscal 2022 includes $16 million related to various transformation initiative costs, primarily consisting of changes to our business technology strategy and $8 million related torestructuring charges. Fiscal 2021 includes $13 million related to various transformation initiative costs, primarily consisting of changes to our business technology strategy and $13 millionof primarily consisting of restructuring charges.
(4) Fiscal 2022 and 2021 represent the reduction of bad debt charges previously taken on pre-pandemic trade receivable balances in fiscal 2020.
(1) Represents a constant currency adjustment, which eliminates the impact of foreign currency fluctuations on current year results.
(6) Fiscal 2021 represents a net benefit from remeasuring Sysco’s accrued income taxes, deferred tax asset and deferred tax liabilities due to changes in tax rates in the United Kingdom.

Impact of Certain Items, Snap Back Costs, Recipe for Growth Investments and Interest Expense (1Q22 vs. 1Q19)
24
Sysco Corporation and its Consolidated SubsidiariesNon-GAAP Reconciliation (Unaudited)Impact of Certain Items, Snap Back Costs, Recipe for Growth Investments and Interest Expense (1Q22 vs. 1Q19)(Dollars in Thousands, Except for Share and Per Share Data)
13-WeekPeriod EndedOct. 2, 2021
13-Week Period Ended Sep. 29, 2018
Change in Dollars % Change
Sales (GAAP) $ 16,456,546 $ 15,215,279 $ 1,241,267 8.2%Gross Profit (GAAP) 2,971,708 2,903,785 67,923 2.3%Gross margin (GAAP) 18.06% 19.08% -103 bps
Operating expenses (GAAP) $ 2,340,026 $ 2,275,645 $ 64,381 2.8%Impact of restructuring and transformational project costs (1) (24,511) (40,903) 16,392 40.1%Impact of acquisition-related costs (2) (35,926) (22,636) (13,290) -58.7%Impact of bad debt reserve adjustments (3) 7,061 - 7,061 NMOperating expenses adjusted for Certain Items (Non-GAAP) 2,286,650 2,212,106 74,544 3.4%Impact of short-term transitory expenses associated with business recovery (57,025) - (57,025) NMImpact of investments for Recipe for Growth initiatives (24,360) - (24,360) NMOperating expense adjusted for Certain Items and business recovery and Recipe for Growth investments (Non-GAAP) $ 2,205,265 $ 2,212,106 $ (6,841) -0.3%
Operating income (GAAP) $ 631,682 $ 628,140 $ 3,542 0.6%Impact of restructuring and transformational project costs (1) 24,511 40,903 (16,392) -40.1%Impact of acquisition-related costs (2) 35,926 22,636 13,290 58.7%Impact of bad debt reserve adjustments (3) (7,061) - (7,061) NMOperating income adjusted for Certain Items (Non-GAAP) 685,058 691,679 (6,621) -1.0%Impact of short-term transitory expenses associated with business recovery 57,025 - 57,025 NMImpact of investments for Recipe for Growth initiatives 24,360 - 24,360 NMOperating income adjusted for Certain Items and business recovery and Recipe for Growth investments (Non-GAAP) $ 766,443 $ 691,679 $ 74,764 10.8%
Interest expense (GAAP) $ 128,214 $ 146,717 $ (18,503) -12.6%Impact of interest on COVID-19 related debt (50,852) - (50,852) 34.7%
Interest expense adjusted for impact of interest on COVID-19 related debt (Non-GAAP) $ 77,362 $ 146,717 $ (69,355) -47.3%

Impact of Certain Items, Snap Back Costs, Recipe for Growth Investments and Interest Expense (1Q22 vs. 1Q19 continued)
25
Net earnings (GAAP) $ 378,013 $ 431,042 $ (53,029) -12.3%Impact of restructuring and transformational project costs (1) 24,511 40,903 (16,392) -40.1%Impact of acquisition-related costs (2) 35,926 22,636 13,290 58.7%Impact of bad debt reserve adjustments (3) (7,061) - (7,061) NMTax impact of restructuring and transformational project costs (4) (6,186) (10,674) 4,488 42.0%Tax impact of acquisition-related costs (4) (9,066) (4,691) (4,375) -93.3%Tax Impact of bad debt reserve adjustments (4) 1,782 - 1,782 NMImpact of adjustments to uncertain tax positions 12,000 - 12,000 NMNet earnings adjusted for Certain Items (Non-GAAP) 429,919 479,216 (49,297) -10.3%Impact of short-term transitory expenses associated with business recovery 57,025 - 57,025 NMImpact of investments for Recipe for Growth initiatives 24,360 - 24,360 NMTax impact of short-term transitory expenses associated with business recovery (14,391) - (14,391) NMTax impact of investments towards Recipe for Growth initiatives (6,148) - (6,148) NMNet earnings adjusted for Certain Items and business recovery and Recipe for Growth investments (Non-GAAP) 490,765 479,216 11,549 2.4%Impact of interest on COVID-19 related debt 50,852 - 50,852 NMTax impact of interest on COVID-19 related debt (12,833) - (12,833) NMNet earnings adjusted for Certain Items, business recovery and Recipe for Growth investments and impact of interest on COVID-19 related debt (Non-GAAP) $ 528,784 $ 479,216 $ 49,568 10.3%
Diluted earnings per share (GAAP) $ 0.73 $ 0.81 $ (0.08) -9.9%Impact of restructuring and transformational project costs (1) 0.05 0.08 (0.03) -37.5%Impact of acquisition-related costs (2) 0.07 0.04 0.03 75.0%Impact of bad debt reserve adjustments (3) (0.01) - (0.01) NMTax impact of restructuring and transformational project costs (4) (0.01) (0.02) 0.01 50.0%Tax impact of acquisition-related costs (4) (0.02) (0.01) (0.01) -100.0%Impact of adjustments to uncertain tax positions 0.02 - 0.02 NMDiluted earnings per share adjusted for Certain Items (Non-GAAP) (5) 0.83 0.91 (0.08) -8.8%Impact of short-term transitory expenses associated with business recovery 0.11 - 0.11 NMImpact of investments for Recipe for Growth initiatives 0.05 - 0.05 NMTax impact of short-term transitory expenses associated with business recovery (0.03) - (0.03) NMTax impact of investments towards Recipe for Growth initiatives (0.01) - (0.01) NM
Earnings per share adjusted for Certain Items and business recovery and Recipe for Growth investments (Non-GAAP) 0.95 0.91 0.04 4.4%Impact of interest on COVID-19 related debt 0.10 - 0.10 NM
Tax impact of interest on COVID-19 related debt (0.02) - (0.02) NMEarnings per share adjusted for Certain Items, business recovery and Recipe for Growth investments and impact of interest on COVID-19 related debt (Non-GAAP) $ 1.03
$ 0.91
$ 0.12 13.2%
Diluted shares outstanding 515,782,928 529,034,470
NM represents that the percentage change is not meaningful.
(5) Individual components of diluted earnings per share may not add up to the total presented due to rounding. Total diluted earnings per share is calculated using adjusted net earningsdivided by diluted shares outstanding.
- more -
(1) Fiscal 2022 includes $16 million related to various transformation initiative costs, primarily consisting of changes to our business technology strategy, and $8 million primarily consisting ofrestructuring charges. Fiscal 2019 includes $26 million related to various transformation initiative costs and $15 million related to severance, restructuring and facility closure charges.
(2) Fiscal 2022 includes $22 million of intangible amortization expense and $14 million of acquisition and due diligence costs, which are primarily included in Global Support Center expenses.Fiscal 2019 includes $21 million of intangible amortization expense and $1 million of acquisition costs.(3) Fiscal 2022 represents the reduction of bad debt charges previously taken on pre-pandemic trade receivable balances in fiscal 2020. (4) The tax impact of adjustments for Certain Items is calculated by multiplying the pretax impact of each Certain Item by the statutory rates in effect for each jurisdiction where theCertain Item was incurred.

Earnings Before Interest, Taxes, Depreciation and Amortization (EBITDA)
26
EBITDA represents net earnings plus (i) interest expense, (ii) income tax expense and benefit, (iii) depreciation and (iv) amortization. The net earnings component ofour EBITDA calculation is impacted by Certain Items that we do not consider representative of our underlying performance. As a result, in the non-GAAP reconciliations below for eachperiod presented, adjusted EBITDA is computed as EBITDA plus the impact of Certain Items, excluding Certain items related to interest expense, income taxes, depreciation andamortization. Sysco's management considers growth in this metric to be a measure of overall financial performance that provides useful information to management and investorsabout the profitability of the business, as it facilitates comparison of performance on a consistent basis from period to period by providing a measurement of recurring factors andtrends affecting our business. Additionally, it is a commonly used component metric used to inform on capital structure decisions. Adjusted EBITDA should not be used as a substitutefor the most comparable GAAP measure in assessing the company’s financial performance for the periods presented. An analysis of any non-GAAP financial measure should be used inconjunction with results presented in accordance with GAAP. In the tables that follow, adjusted EBITDA for each period presented is reconciled to net earnings.

EBITDA, 1Q22 vs. 1Q21
27
Sysco Corporation and its Consolidated SubsidiariesNon-GAAP Reconciliation (Unaudited)
(In Thousands)
13-WeekPeriod EndedOct. 2, 2021
13-WeekPeriod EndedSep. 26, 2020
Change in Dollars %/bps Change
Net earnings (GAAP) $ 378,013 $ 216,900 $ 161,113 74.3%Interest (GAAP) 128,214 146,717 (18,503) -12.6%Income taxes (GAAP) 128,707 41,838 86,869 207.6%Depreciation and amortization (GAAP) 186,466 180,520 5,946 3.3%EBITDA (Non-GAAP) $ 821,400 $ 585,975 $ 235,425 40.2%Certain Item adjustments:
Impact of restructuring and transformational project costs (1) 24,247 25,278 (1,031) -4.1%Impact of acquisition-related costs (2) 14,221 - 14,221 NMImpact of bad debt reserve adjustments (3) (7,061) (98,629) 91,568 -92.8%Impact of loss on sale of business - 12,043 (12,043) NM
EBITDA adjusted for Certain Items (Non-GAAP) (4) $ 852,807 $ 524,667 $ 328,140 62.5%
NM represents that the percentage change is not meaningful.
Impact of Certain Items on Earnings Before Interest, Taxes, Depreciation and Amortization
(1) Includes various transformation initiative costs, primarily consisting of changes to our business technology strategy, excluding charges related to accelerated depreciation.
(3) Fiscal 2022 and 2021 represent the reduction of bad debt charges previously taken on pre-pandemic trade receivable balances in fiscal 2020.
(2) Fiscal 2022 includes acquisition and due diligence costs.
(4) In arriving at adjusted EBITDA, Sysco does not adjust out interest income of $2 million and $4 million for fiscal 2022 and fiscal 2021, respectively, or non-cash stockcompensation expense of $29 million and $25 million in fiscal 2022 and fiscal 2021, respectively.
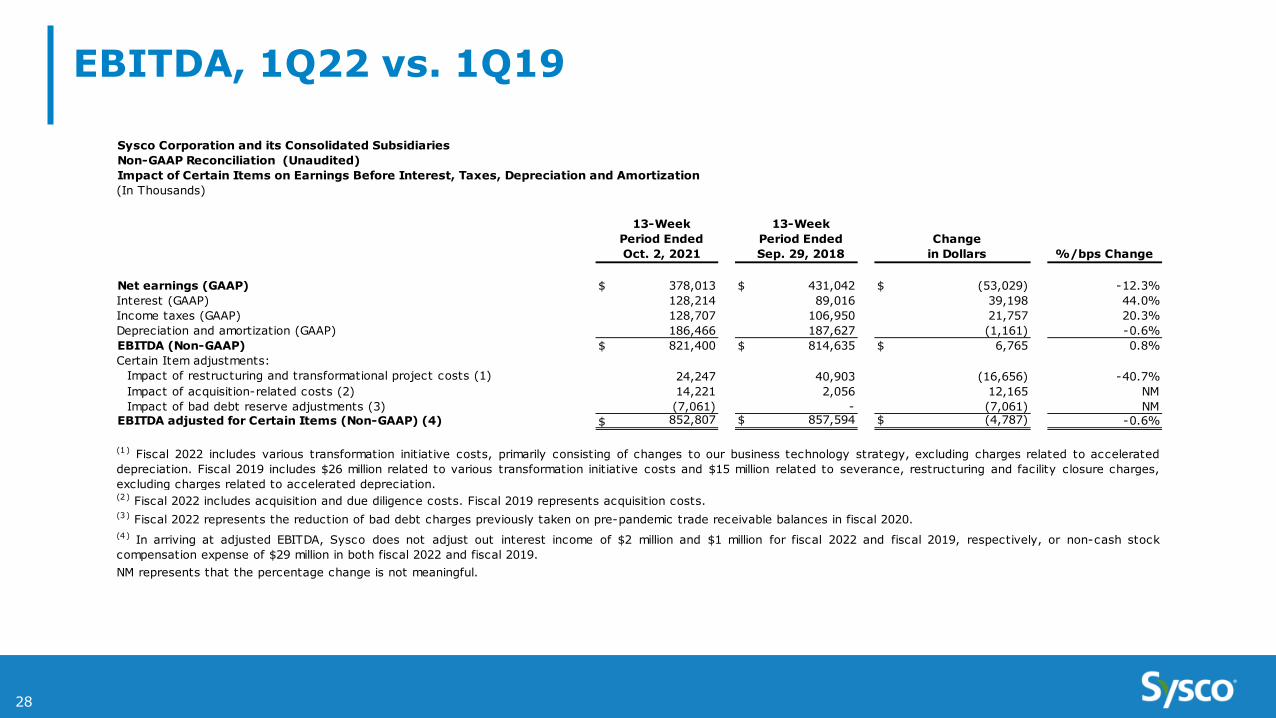
EBITDA, 1Q22 vs. 1Q19
28
Sysco Corporation and its Consolidated SubsidiariesNon-GAAP Reconciliation (Unaudited)
(In Thousands)
13-WeekPeriod EndedOct. 2, 2021
13-Week Period Ended Sep. 29, 2018
Change in Dollars %/bps Change
Net earnings (GAAP) $ 378,013 $ 431,042 $ (53,029) -12.3%Interest (GAAP) 128,214 89,016 39,198 44.0%Income taxes (GAAP) 128,707 106,950 21,757 20.3%Depreciation and amortization (GAAP) 186,466 187,627 (1,161) -0.6%EBITDA (Non-GAAP) $ 821,400 $ 814,635 $ 6,765 0.8%Certain Item adjustments:
Impact of restructuring and transformational project costs (1) 24,247 40,903 (16,656) -40.7%Impact of acquisition-related costs (2) 14,221 2,056 12,165 NMImpact of bad debt reserve adjustments (3) (7,061) - (7,061) NM
EBITDA adjusted for Certain Items (Non-GAAP) (4) $ 852,807 $ 857,594 $ (4,787) -0.6%
NM represents that the percentage change is not meaningful.
Impact of Certain Items on Earnings Before Interest, Taxes, Depreciation and Amortization
(1) Fiscal 2022 includes various transformation initiative costs, primarily consisting of changes to our business technology strategy, excluding charges related to accelerateddepreciation. Fiscal 2019 includes $26 million related to various transformation initiative costs and $15 million related to severance, restructuring and facility closure charges,excluding charges related to accelerated depreciation.(2) Fiscal 2022 includes acquisition and due diligence costs. Fiscal 2019 represents acquisition costs.(3) Fiscal 2022 represents the reduction of bad debt charges previously taken on pre-pandemic trade receivable balances in fiscal 2020.(4) In arriving at adjusted EBITDA, Sysco does not adjust out interest income of $2 million and $1 million for fiscal 2022 and fiscal 2019, respectively, or non-cash stockcompensation expense of $29 million in both fiscal 2022 and fiscal 2019.

Impact of Certain Items on Applicable Segments,(1Q22 vs. 1Q21)
29
Sysco Corporation and its Consolidated SubsidiariesSegment ResultsNon-GAAP Reconciliation (Unaudited)Impact of Certain Items on Applicable Segments, 1Q22 vs. 1Q21(Dollars in Thousands)
13-WeekPeriod EndedOct. 2, 2021
13-WeekPeriod EndedSep. 26, 2020
Change in Dollars %/bps Change
U.S. FOODSERVICE OPERATIONS
Sales $ 11,602,963 $ 7,921,533 $ 3,681,430 46.5%Gross Profit 2,185,154 1,599,707 585,447 36.6%Gross Margin 18.83% 20.19% -136 bps
Operating expenses (GAAP) $ 1,387,631 $ 1,011,298 $ 376,333 37.2%Impact of restructuring and transformational project costs (3) (940) 937 99.7%Impact of acquisition-related costs (1) (4,654) - (4,654) NMImpact of bad debt reserve adjustments (2) 6,420 86,317 (79,897) -92.6%Operating expenses adjusted for Certain Items (Non-GAAP) $ 1,389,394 $ 1,096,675 $ 292,719 26.7%
Operating income (GAAP) $ 797,523 $ 588,409 $ 209,114 35.5%Impact of restructuring and transformational project costs 3 940 (937) -99.7%Impact of acquisition-related costs (1) 4,654 - 4,654 NMImpact of bad debt reserve adjustments (2) (6,420) (86,317) 79,897 92.6%Operating income adjusted for Certain Items (Non-GAAP) $ 795,760 $ 503,032 $ 292,728 58.2%
INTERNATIONAL FOODSERVICE OPERATIONS
Sales (GAAP) $ 2,895,247 $ 2,163,693 $ 731,554 33.8%Impact of currency fluctuations (3) (121,395) - (121,395) -5.6%Comparable sales using a constant currency basis (Non-GAAP) $ 2,773,852 $ 2,163,693 $ 610,159 28.2%
Gross Profit (GAAP) $ 589,134 $ 450,398 $ 138,736 30.8%Impact of currency fluctuations (3) (22,734) - (22,734) -5.0%Comparable gross profit using a constant currency basis (Non-GAAP) $ 566,400 $ 450,398 $ 116,002 25.8%
Gross Margin (GAAP) 20.35% 20.82% -48 bpsImpact of currency fluctuations (3) -0.07% - -7 bpsComparable gross margin using a constant currency basis (Non-GAAP) 20.42% 20.82% -40 bps
Operating expenses (GAAP) $ 552,458 $ 450,935 $ 101,523 22.5%Impact of restructuring and transformational project costs (4) (9,426) (12,993) 3,567 27.5%Impact of acquisition-related costs (5) (18,656) (17,755) (901) -5.1%Impact of bad debt reserve adjustments (2) 641 11,429 (10,788) -94.4%Operating expenses adjusted for Certain Items (Non-GAAP) 525,017 431,616 93,401 21.6%Impact of currency fluctuations (3) (21,074) - (21,074) -4.9%Comparable operating expenses adjusted for Certain Items using a constant currency basis (Non-GAAP) $ 503,943 $ 431,616 $ 72,327 16.8%
Operating income (loss) (GAAP) $ 36,676 $ (537) $ 37,213 NMImpact of restructuring and transformational project costs (4) 9,426 12,993 (3,567) -27.5%Impact of acquisition-related costs (5) 18,656 17,755 901 5.1%Impact of bad debt reserve adjustments (2) (641) (11,429) 10,788 94.4%Operating income adjusted for Certain Items (Non-GAAP) 64,117 18,782 45,335 241.4%Impact of currency fluctuations (3) (1,660) - (1,660) -8.8%Comparable operating income adjusted for Certain Items using a constant currency basis (Non-GAAP) $ 62,457 $ 18,782 $ 43,675 232.5%

Impact of Certain Items on Applicable Segments,(1Q22 vs. 1Q21 continued)
30
SYGMA
Sales $ 1,704,033 $ 1,524,148 $ 179,885 11.8%Gross Profit 138,157 131,541 6,616 5.0%Gross Margin 8.11% 8.63% -52 bps
Operating expenses (GAAP) $ 140,604 $ 119,849 $ 20,755 17.3%Impact of restructuring and transformational project costs - (13) 13 NMOperating expenses adjusted for Certain Items (Non-GAAP) $ 140,604 $ 119,836 $ 20,768 17.3%
Operating (loss) income (GAAP) $ (2,447) $ 11,692 $ (14,139) -120.9%Impact of restructuring and transformational project costs - 13 (13) NMOperating (loss) income adjusted for Certain Items (Non-GAAP) $ (2,447) $ 11,705 $ (14,152) -120.9%
OTHER
Sales $ 254,303 $ 168,005 $ 86,298 51.4%Gross Profit 59,021 40,430 18,591 46.0%Gross Margin 23.21% 24.06% -86 bps
Operating expenses (GAAP) $ 52,565 $ 40,435 $ 12,130 30.0%Impact of bad debt reserve adjustments (2) - 883 (883) NMOperating expenses adjusted for certain items (Non-GAAP) $ 52,565 $ 41,318 $ 11,247 27.2%
Operating income (loss) (GAAP) $ 6,456 $ (5) $ 6,461 NMImpact of bad debt reserve adjustments (2) - (883) 883 NMOperating income (loss) adjusted for certain items (Non-GAAP) $ 6,456 $ (888) $ 7,344 NM
GLOBAL SUPPORT CENTER
Gross Profit $ 242 $ (2,231) $ 2,473 110.8%
Operating expenses (GAAP) $ 206,768 $ 177,749 $ 29,019 16.3%Impact of restructuring and transformational project costs (6) (15,082) (12,018) (3,064) -25.5%Impact of acquisition related costs (7) (12,616) - (12,616) NMOperating expenses adjusted for Certain Items (Non-GAAP) $ 179,070 $ 165,731 $ 13,339 8.0%
Operating loss (GAAP) $ (206,526) $ (179,980) $ (26,546) 14.7%Impact of restructuring and transformational project costs (6) 15,082 12,018 3,064 25.5%Impact of acquisition related costs (7) 12,616 - 12,616 NMOperating loss adjusted for Certain Items (Non-GAAP) $ (178,828) $ (167,962) $ (10,866) 6.5%
TOTAL SYSCO
Sales $ 16,456,546 $ 11,777,379 $ 4,679,167 39.7%Gross Profit 2,971,708 2,219,845 751,863 33.9%Gross margin 18.06% 18.85% -79 bps
Operating expenses (GAAP) $ 2,340,026 $ 1,800,266 $ 539,760 30.0%Impact of restructuring and transformational project costs (4) (6) (24,511) (25,964) 1,453 5.6%Impact of acquisition-related costs (1) (5) (7) (35,926) (17,755) (18,171) -102.3%Impact of bad debt reserve adjustments (2) 7,061 98,629 (91,568) -92.8%Operating expenses adjusted for Certain Items (Non-GAAP) $ 2,286,650 $ 1,855,176 $ 431,474 23.3%
Operating income (GAAP) $ 631,682 $ 419,579 $ 212,103 50.6%Impact of restructuring and transformational project costs (4) (6) 24,511 25,964 (1,453) -5.6%Impact of acquisition-related costs (1) (5) (7) 35,926 17,755 18,171 102.3%Impact of bad debt reserve adjustments (2) (7,061) (98,629) 91,568 92.8%Operating income adjusted for Certain Items (Non-GAAP) $ 685,058 $ 364,669 $ 320,389 87.9%
- more -
(4) Includes restructuring and facility closure costs primarily in Europe.(5) Represents intangible amortization expense.
NM represents that the percentage change is not meaningful.
(7) Represents due diligence costs.
(3) Represents a constant currency adjustment, which eliminates the impact of foreign currency fluctuations on current year results.
(6) Includes various transformation initiative costs, primarily consisting of changes to our business technology strategy.
(1) Fiscal 2022 includes $3 millon intangible amortization expense and acquisition costs. (2) Fiscal 2022 and 2021 represent the reduction of bad debt charges previously taken on pre-pandemic trade receivable balances in fiscal 2020.

Free Cash Flow,1Q22 vs. 1Q21 and 1Q22 vs. 1Q19
31
Sysco Corporation and its Consolidated Subsidiaries
Free Cash Flow, 1Q22 vs. 1Q21 and 1Q22 vs.1Q19
Net cash provided by operating activities (GAAP) $ 110,812 $ 930,914 $ (820,102) $ 110,812 $ 271,145 $ (160,333) Additions to plant and equipment (85,019) (75,539) (9,480) (85,019) (104,322) 19,303 Proceeds from sales of plant and equipment 5,627 7,064 (1,437) 5,627 3,839 1,788 Free Cash Flow (Non-GAAP) $ 31,420 $ 862,439 $ (831,019) $ 31,420 $ 170,662 $ (139,242)
Changein Dollars
Non-GAAP Reconciliation (Unaudited)
(In Thousands)
13-WeekPeriod EndedOct. 2, 2021
13-WeekPeriod EndedSep. 26, 2020
Changein Dollars
13-WeekPeriod EndedOct. 2, 2021
13-Week Period Ended Sep. 29, 2018
Free cash flow represents net cash provided from operating activities less purchases of plant and equipment and includes proceeds from sales of plant and equipment. Sysco considers free cash flow to be a liquidity measure that provides useful information to management and investors about the amount of cash generated by the business after the purchases and sales of buildings, fleet,equipment and technology, which may potentially be used to pay for, among other things, strategic uses of cash including dividend payments, share repurchases and acquisitions. However, freecash flow may not be available for discretionary expenditures, as it may be necessary that we use it to make mandatory debt service or other payments. Free cash flow should not be used as asubstitute for the most comparable GAAP measure in assessing the company’s liquidity for the periods presented. An analysis of any non-GAAP financial measure should be used in conjunction withresults presented in accordance with GAAP. In the table that follows, free cash flow for each period presented is reconciled to net cash provided by operating activities.

Net Debt to Adjusted EBITDA Leverage Ratio Target
32
Form of calculation:Notes payableCurrent maturities of long-term debtLong term debtTotal Debt (GAAP)
Less finance leases and other debtLess book value in excess of face value of senior debt
Total Debt adjusted for finance leases, other debt and excess book value (Non-GAAP)Less cash and cash equivalentsNet debt
Net earnings (GAAP)Interest (GAAP)Income taxes (GAAP)Depreciation and amortization (GAAP)EBITDA (Non-GAAP)Certain Item adjustments:
Impact of restructuring and transformational project costsImpact of acquisition-related intangible amortizationImpact of bad debt reserve adjustments
EBITDA adjusted for Certain Items (Non-GAAP)
Net Debt to Adjusted EBITDA Ratio
Net Debt to Adjusted EBITDA Leverage Ratio Targets
We expect to achieve our net debt to adjusted EBITDA leverage ratio forecast in the fourth quarter offiscal 2022. We cannot predict with certainty when we will achieve these results or whether thecalculation of our EBITDA will be on an adjusted basis in future periods to exclude the effect of certainitems. Due to these uncertainties, we cannot provide a quantitative reconciliation of these potentiallynon-GAAP measures to the most directly comparable GAAP measure without unreasonable effort.However, we expect to calculate these adjusted results, if applicable, in the same manner as thereconciliations provided for the historical periods that are presented herein.


