51
System and User Aspects of Web Search Latency Ioannis Arapakis, Xiao Bai, B. Barla Cambazoglu Yahoo Labs, Barcelona
| Date post: | 30-Jul-2015 |
| Category: |
Internet |
| Upload: | yahoo-labs |
| View: | 199 times |
| Download: | 1 times |

System and User Aspects of Web Search Latency Ioannis Arapakis, Xiao Bai, B. Barla Cambazoglu
Yahoo Labs, Barcelona

Web Search Engines

Search Engine Result Page (SERP)

Actors in Web Search § User’s perspective: accessing information
• relevance • speed
§ Search engine’s perspective: monetization • attract more users • increase the ad revenue • reduce the operational costs
§ Advertiser’s perspective: publicity • attract more customers • pay little

Components of a Web Search Engine
§ Major components: Web crawling, indexing, and query processing
crawler
Web
indexer queryprocessor
documentcollection index
query
results user

Expectations from a Web Search Engine
§ Crawl and index a large fraction of the Web § Maintain most recent copies of the content in the Web § Scale to serve hundreds of millions of queries every day § Evaluate a typical query under several hundred milliseconds § Serve most relevant results for a user query

Multi-site Web Search Engines (why?)
§ Better scalability and fault tolerance § Faster web crawling due to reduced proximity to web servers § Lower response latency due to reduced proximity to users
DC1 DC2
DC3
DC4

Search Data Centers § Quality and speed requirements
imply large amounts of compute resources, i.e., very large data centers
§ High variation in data center sizes • hundreds of thousands of computers • a few computers

Web Search Engine Architectures
§ Partitioned § Replicated § Centralized

Energy-Price-Driven Query Processing Problem

Idea
§ Shifting the query workload among the search sites to decrease the total financial cost involved in query processing by exploiting the spatio-temporal variation in • Query workload"• Energy price"

Problem
Query
? Local site
Remote sites
§ Forward a query to another data center based on • Query processing capacities • Estimated workloads • Estimated response latency • Current energy prices

Example
21
= $3
21 1 1
= $1
2
= $3
2 1 1 1
= $1
A
= $2
B
C A
= $2
1
B
C
Cost = $26 Cost = $22
221
1
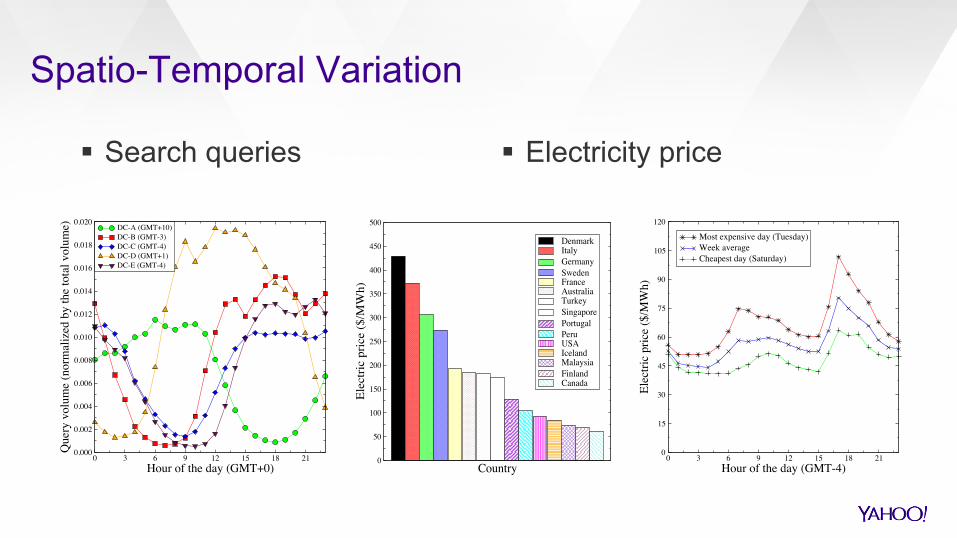
Spatio-Temporal Variation
0 3 6 9 12 15 18 21Hour of the day (GMT+0)
0.000
0.002
0.004
0.006
0.008
0.010
0.012
0.014
0.016
0.018
0.020
Que
ry v
olum
e (n
orm
aliz
ed b
y th
e to
tal v
olum
e) DC-A (GMT+10)DC-B (GMT-3)DC-C (GMT-4)DC-D (GMT+1)DC-E (GMT-4)
Country0
50
100
150
200
250
300
350
400
450
500
Elec
tric
pric
e ($
/MW
h)
DenmarkItalyGermanySwedenFranceAustraliaTurkeySingaporePortugalPeruUSAIcelandMalaysiaFinlandCanada
0 3 6 9 12 15 18 21Hour of the day (GMT-4)
0
15
30
45
60
75
90
105
120
Elec
tric
pric
e ($
/MW
h)
Most expensive day (Tuesday)Week averageCheapest day (Saturday)
§ Search queries" § Electricity price

Formal Problem Definition
§ Minimize financial cost"
§ Response time constraint
§ Capacity constraint

Solution

Generating Probabilities
A
D
C
B
Remote sites
Local site Query
w.p. pA(A)
w.p. pA(C)

Generating Probabilities
§ Cheap
§ Expensive

Price Variation Configurations
§ Universal § Spatial § Temporal § Spatio-temporal
30
60
90
120
150
180
210
240
270
300
Pric
e ($
/MW
h)
DC-A, DC-B, DC-C, DC-D, DC-E DC-ADC-BDC-CDC-DDC-E
0 3 6 9 12 15 18 21Hour of the day (GMT+0)
30
60
90
120
150
180
210
240
270
300
Pric
e ($
/MW
h)
DC-ADC-BDC-CDC-DDC-E
0 3 6 9 12 15 18 21Hour of the day (GMT+0)
DC-ADC-BDC-CDC-DDC-E
Universal (PC-U) Temporal (PC-T)
Spatial (PC-S) Spatio-temporal (PC-ST)
U T
S ST
Impact of Temporal and Spatial Price Variation
44 64 76 81 94 99 139 148 168 176Network latency between data center pairs (ms)
0.00
0.01
0.02
0.03
0.04
0.05
0.06
0.07
0.08
Frac
tion
Saving (r=400)Saving (r=800)
0.00
0.01
0.02
0.03
0.04
0.05
0.06
0.07
0.08
Forwarded queries (r=400)Forwarded queries (r=800)
0 3 6 9 12 15 18 21Hour of the day
0.00
0.01
0.02
0.03
0.04
0.05
0.06
Frac
tion
SavingForwarded queriesElectric price

Query Response Time and Cost Saving
>100 >200 >400 >800Query response time (ms)
0.00
0.02
0.04
0.06
0.08
0.10
0.12
0.14
0.16
0.18
0.20
0.22
0.24
Frac
tion
of q
uery
traf
fic v
olum
e
PC-UPC-TPC-SPC-ST
200 400 800 inf.Query response time limit (ms)
0.00
0.04
0.08
0.12
0.16
0.20
0.24
0.28
0.32
0.36
0.40
Savi
ng in
ele
ctric
cos
t
PC-TPC-SPC-ST

Human Perception of Web Search Latency

Background Information
§ The core research in IR has been on improving the quality of search results with the eventual goal of satisfying the information needs of users
§ This often requires sophisticated and costly solutions • more information stored in the inverted index • machine-learned ranking strategies • fusing results from multiple resources

Trade-off between the speed of a search system and the quality of its results
Too slow or too fast may result in financial consequences for the search engine

§ Web users • are impatient • have limited time • expect sub-second response times
§ High response latency • can distract users • results in fewer query submissions • decreases user engagement over time
Web Search Economics

Components of User-Perceived Response Latency
§ network latency: tuf + tfu
§ search engine latency: tpre + tfb + tproc + tbf + tpost
§ browser latency: trender
User Searchfrontend
Searchbackend
tpre tproc
tpost
tfb
tbf
tuf
tfu
trender
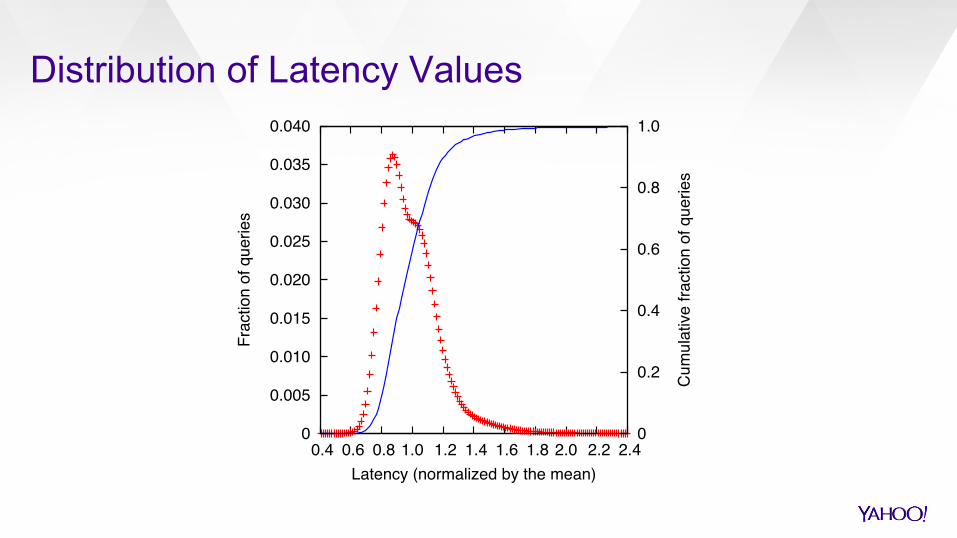
Distribution of Latency Values
0
0.005
0.010
0.015
0.020
0.025
0.030
0.035
0.040
0.4 0.6 0.8 1.0 1.2 1.4 1.6 1.8 2.0 2.2 2.40
0.2
0.4
0.6
0.8
1.0
Frac
tion
of q
uerie
s
Cum
ulat
ive
fract
ion
of q
uerie
s
Latency (normalized by the mean)

Contribution of Latency Components
0
20
40
60
80
100
0.4 0.6 0.8 1.0 1.2 1.4 1.6 1.8 2.0 2.2 2.4
Con
tribu
tion
per c
ompo
nent
(%)
Latency (normalized by the mean)
search engine latencynetwork latencybrowser latency

Experimental Design
User Study 1: User Sensitivity to Latency
User Study 2: Impact of Latency on Search Experience
Study 1: User Sensitivity to Latency

Experimental Method (Task 1 & 2)
§ Independent variables: • Search latency (0 – 2750ms) • Search site speed (slow, fast)
§ 12 participants (female=6, male=6) • aged from 24 to 41 • Full-time students (33.3%), studying while working (54.3%),
full-time employees (16.6%)

Task 1: Procedure
§ Participants submitted 40 navigational queries § After submitting each query, they were asked to report if the
response of the search site was “slow” or “normal” § For each query we increased latency by a fixed amount (0 –
1750ms), using a step of 250ms § Each latency value (e.g., 0, 250, 500) was introduced 5 times,
in a random order

Task 1: Results
250 750 1250 1750Added latency (ms)
0.0
0.1
0.2
0.3
0.4
0.5
0.6
0.7
0.8
0.9
1.0
Like
lihoo
d of
feel
ing
adde
d la
tenc
y
Slow SE (base)Slow SEFast SE (base)Fast SE
250 750 1250 1750Added latency (ms)
0.0
0.1
0.2
0.3
0.4
0.5
0.6
0.7
0.8
0.9
1.0
Incr
ease
rela
tive
to b
ase
likel
ihoo
d
Slow SEFast SE
§ Delays <500ms are not easily noticeable
§ Delays >1000ms are noticed with high likelihood

Task 2: Procedure
§ Participant submitted 50 navigational queries § After each query submission they provided an estimation of
the search latency in milliseconds § Search latency was set to a fixed amount (500 – 2750ms),
using a step of 250ms § Each latency value (e.g., 0, 250, 500) was introduced 5
times, in a random order § A number of training queries was submitted without any
added delay

Task 2: Results
Fig. 1: Slow search engine
1750 2000 2250 2500 2750Actual latency (ms)
0
500
1000
1500
2000
2500
3000
3500
4000
4500
5000
Pred
icte
d la
tenc
y (m
s)
ActualMalesFemalesAverage
750 1000 1250 1500 1750 2000 2250 2500 2750Actual latency (ms)
0
500
1000
1500
2000
2500
3000
3500
4000
4500
5000
Pred
icte
d la
tenc
y (m
s)
ActualMalesFemalesAverage
Fig. 2: Fast search engine

Study 2: Impact of Latency on Search Experience

Experimental Design
§ Two independent variables • Search latency (0, 750, 1250, 1750) • Search site speed (slow, fast)
§ Search latency was adjusted by a desired amount using a custom-made JS deployed through the Greasemonkey extension § 20 participants (female=10, male=10)

Procedure
§ Participants performed four search tasks • Evaluate the performance of four different backend search systems • Submit as many navigational queries from a list of 200 randomly sampled
web domains • For each query they were asked to locate the target URL among the first
ten results of the SERP
§ Training queries were used to allow participants to familiarize themselves with the “default” search site speed

Questionnaires § User Engagement Scale (UES)
• Positive affect (PAS)
• Negative affect (NAS) • Perceived usability • Felt involvement and focused attention
§ IBM’s Computer System Usability Questionnaire (CSUQ) • System usefulness (SYSUSE)
§ Custom statements

Descriptive Statistics (M) for UE and SYSUSE
§ Positive bias towards SEfast
§ SEfast participants were more deeply engaged
§ SEfast participants’ usability perception was more tolerant to delays
SEslow latency SEfast latency 0 750 1250 1750 0 750 1250 1750
Post-Task Positive Affect 16.20 14.50 15.50 15.20 20.50 19.00 20.80 19.30
Post-Task Negative Affect 7.00 6.80 7.60 6.90 6.80 7.40 7.40 7.20
Frustration 3.20 3.10 2.90 3.30 2.80 3.00 3.50 2.60
Focused Attention 22.80 22.90 19.90 22.20 27.90 26.60 23.90 29.50
SYSUS 32.80 28.90 29.80 27.90 35.20 31.30 29.80 33.20

Correlation Analysis of Beliefs and Reported Scales
Correlation Matrix
Beliefs postPAS postNAS FA CSUQ-SYSUS custom-1 custom-2 custom-3
SEslow will respond fast to my queries .455** .041 0.702** .267 .177 .177 .082
SEslow will provide relevant results .262 -.083 .720** .411** .278 .263 .232
SEfast will respond fast to my queries -.051** .245 .341* .591** .330* .443** .624**
SEfast will provide relevant results -.272 .133 -.133 .378* .212 .259 .390*
*. Correlation is significant at the .05 level (2-tailed). **. Correlation is significant at the .01 level (2-tailed)

Query Log Analysis

Query Log and Engagement Metric
§ Random sample of 30m web search queries obtained from Yahoo § We use the end-to-end (user perceived) latency values § To control for differences due to geolocation or device, we select
queries issued: • Within the US • To a particular search data center • From desktop computers
§ We quantify engagement using the clicked page ratio metric

0.0
0.2
0.4
0.6
0.8
1.0
0.4 0.6 0.8 1.0 1.2 1.4
Clic
ked
page
ratio
(nor
mal
ized
by
the
max
)
Latency (normalized by the mean)
Variation of Clicked Page Ratio Metric

0.02
0.04
0.06
0.08
0.10
0.12
0 250 500 750 1000 1250 1500 1750 20000.8
0.9
1.0
1.1
1.2
1.3
Frac
tion
of q
uery
pai
rs
Clic
k-on
-fast
/Clic
k-on
-slo
w
Latency difference (in milliseconds)
Click-on-fastClick-on-slowRatio
Eliminating the Effect of Content
§ q1 = q2 & SERP1 = SERP2
§ 500ms of latency difference is the critical point beyond which users are more likely to click on a result retrieved with lower latency

Eliminating the Effect of Content
0.02
0.04
0.06
0.08
0.10
0.12
0 250 500 750 1000 1250 1500 1750 20000.8
0.9
1.0
1.1
1.2
1.3
Frac
tion
of q
uery
pai
rs
Clic
k-m
ore-
on-fa
st/C
lick-
mor
e-on
-slo
w
Latency difference (in milliseconds)
Click-more-on-fastClick-more-on-slowRatio
§ q1 = q2 & SERP1 = SERP2
§ Clicking on more results becomes preferable to submitting new queries when the latency difference exceeds a certain threshold (1250ms)

Conclusions

Conclusions § Up to a point (500ms) added response time delays are not
noticeable by the users § After a certain threshold (1000ms) the users can feel the added
delay with very high likelihood § Perception of search latency varies considerably across the
population!

Conclusions § The tendency to overestimate or underestimate system
performance biases users’ interpretations of search interactions and system usability
§ Participants of the SE_fast: • were generally more deeply engaged • their usability perception was more tolerant to delays

Conclusions § Given two content-wise identical result pages, users are more
likely to click on the result page that is served with lower latency § 500ms of latency difference is the critical point beyond which
users are more likely to click on a result retrieved with lower latency
§ Clicking on more results becomes preferable to submitting new queries when the latency difference exceeds a certain threshold (1250ms)


