System Based Testing of a 72 kV Line Protection Scheme at EPCOR
Adam Rudd, EPCOR Utilities Inc., CANADA Yordan Kyosev, EPCOR Utilities Inc., CANADA Peter Fong, Sequence Instruments Inc., CANADA Abstract The power utility EPCOR Utilities Inc. located in Edmonton, Alberta is upgrading the line protection on its 72 kV transmission network. EPCOR has taken a new approach to end-to-end testing, using software which will simulate all relevant portions of the network for testing. This paper discusses all aspects of this system based testing, from planning and execution to resolution of issues. An overview of the progression of this type of testing within the company is performed, showing the improvements with each evolution. The results are analyzed, and compared with other methods of testing.
1 Progression of Modern End-To-End Testing at EPCOR
The benefits of synchronized end-to-end testing for testing and commissioning line protection systems have been well documented over the years. With the introduction of more powerful simulation software tools designed for use with portable test equipment, the application of end-to-end testing has evolved from simple verification of the protection system, to comprehensive performance analysis of the protection system including such things as:
- Relay performance verification under real system conditions (transient behavior)
- Relay setting and algorithm verification under various power system scenarios.
- Current transformer (CT) performance verification under real system conditions
Over the years, EPCOR has utilized various software tools to simulate the system conditions while performing end-to-end testing. These tools include the following:
- Static State Sequence Simulation - Dynamic Simulation with preset system
models - Dynamic Simulation with customizable
system models Static State Sequence Simulation Static State Sequence Simulation allows the simulation of pre-fault, fault, and post-fault states. These fault states are normally calculated from a fault study software which provides the voltages and currents for the fault (see Figure 1). This type of simulation is adequate for simple verification of protection schemes, e.g. permissive overreaching
transfer trip (POTT) schemes. However, transient conditions during the fault state are not simulated. Therefore, the dynamic performance of the protection system under transient conditions could not be assessed. With this type of software, there is no information about the system parameters or fault conditions for the operator to verify whether the fault produced is correct or not. It is also not possible to adjust the system parameters or fault conditions to observe the behavior of the protection system under different scenarios.
Figure 1: Static State Sequence Simulation
Dynamic Simulation with Preset System Models Dynamic Simulation allows the users to select from a list of preset system models (e.g. single-line, parallel-line, three-terminal line, etc.) and configure system parameter and fault conditions such as:
- line impedance - source impedance - arc resistance - pre-fault and post-fault load flow - fault location and fault type - simulation of CT saturation
From the configuration, the software will produce voltage and currents simulating the real condition of the fault, including transient conditions (see Figure 2).
Figure 2: Dynamic Simulation with Preset System Models
This type of simulation allows for relay performance verification under real system conditions and CT behavior. Since the system parameters and fault conditions are configurable, the user can easily verify that the correct parameters and conditions are being applied. Simulation under different fault conditions can also be easily applied at the time of testing. The drawback of this software is with the flexibility of the preset system models. In cases where more complex or different system models are required, it is not possible to customize the model. Dynamic Simulation with Customizable System Models With the introduction of Dynamic Simulation software which allows for customizable system models, it became possible to create dynamic fault simulation with the exact model of the power system. This allows the user to perform analysis on protection systems which are applied on more challenging and complex power systems. This type of software allows for free configuration of lines and sources as well as placement of the protection and fault conditions (see Figure 3).
Figure 3: Dynamic Simulation with Customizable System
Models
Modern relay test sets running this software also provide a method to pass the simulation signals over an Internet cloud server from one substation to another so that the test could be performed and test results observed by one operator. The test results from both ends of the protection system are combined into a single test report for analysis. This capability makes end-to-end testing much more efficient and easier to apply (see Figure 4).
Figure 4: Test Set Synchronization Over Internet Cloud
Server
2 General Overview of the Protection Scheme
New 72 kV Line Protection Scheme A new line protection scheme is being applied as part of EPCOR’s long-term plan for the replacement of the protection schemes for the company’s 72 kV cable lines. The start of this replacement project involves the installation of the new scheme for two 72 kV cable lines. Since this is the first of many similar installations, thorough testing is required to prove the desired protection specification and fine-tuning all the logic and algorithms of the scheme. As such, EPCOR has decided to perform testing of this new scheme using a dynamic simulation software which allows for customizable system models. For the new line protection scheme, dual multifunctional protection is applied. Two protection functions are enabled in each of the main protection (A Protection) and backup protection (B Protection): line differential protection and communication assisted distance protection. See Figure 5. Relays from various vendors were bench tested to prove that their specifications would be met during the bidding process. However, one of the vendor’s relay model was new to the market and therefore required more testing to gain company confidence.
Figure 5: 72kV Cable Line Protection Configuration
System Configuration Challenges EPCOR’s sub-transmission system poses additional challenges to the protection engineers in comparison to their transmission system. The system was originally designed to work in close-loop configuration, but presently it is operated in a radial configuration in a cost-efficient way in order to keep the balance between reliability and the cost of improvement. Figure 6 shows the system in normal configuration.
Figure 6: Normal Configuration
In case of substation (N-1) conditions two operational scenarios apply for radial (N-1) configuration (see Figure 7). Scenario #1: When line CK12 is out of service, the system must be reconfigured and substation load must be divided between the two radial lines fed from different sources.
Figure 7: Configuration Radial
Scenario #2: When line CK13 is out of service, the system must be reconfigured to work in closed-loop configuration which parallel two sources: Clover Bar Substation and Namao Substation (See Figure 8). For this scenario, remote backup functionality of distance relays has to be set very carefully and tested due to the strong infeed in the remote buses.
Figure 8: Configuration Closed Loop
In addition, a closed loop configuration as the normal operational scenario for the sub-transmission system also has to be considered in the near future (see Figure 9).
Figure 9: Normal Closed Loop (Future)
A single protection setting group is required to cover all scenarios and system configurations described above. The relay setting should be addressed for all scenarios: strong infeed effect due to peak generation, possible weak infeed effect, and reliable remote backup in the system. System Data Challenges EPCPOR’s system model was created based on manufacturer’s data from 1980’s for the 72kV cable impedance. However, the zero sequence parameters of the cables required for ground fault protection have never been proven by measurement. Current transformer saturation effect also has to be properly addressed, mitigated and tested. Test Equipment and Testing Technologies EPCOR has already established testing practices with the following OMICRON technologies: Netsim Software for Dynamic Simulation testing, CT Analyzer test set for current transformer analyzing, and CPC100 primary test set (with CP CU1 unit) for line impedance measurement. All of the above test equipment is in place and engineers and testing technicians are well trained to use these technologies efficiently. To properly address the challenges mentioned above, a significant amount of senior protection expertise is
required for setting calculation, testing and commissioning. To effectively meet these needs, EPCOR has decided to utilize the RelaySimTest software to help in meeting these challenges. This would allow for multiple simulation scenarios to be tested in a thorough, efficient and cost-effective manner.
3 Testing Preparations Line Impedance Measurement The line impedances were measured during the line outages, and the results were compared to the calculated values. Both line measurements produced similar results. As expected the positive sequence measurements were close to the calculated values. However, the zero sequence measurements were quite different. This is most likely due to the effects of ground resistivity and proximity of other underground conductors. It is also very difficult to predict the paths for the ground current - it could be through the cable sheath, the soil, or a combination of the two. These factors will only affect the zero sequence component, as it relates to the ground return path. Therefore, it was decided to base the impedance zone reaches of the distance protection on the measured line impedance data.
% div 0.46% 18.05% 54.15% 7.63% Figure 11: 72CK13 Line Impedance
Current Transformer Testing During the line outages, the current transformers (CT) used in the protection scheme were also tested, with the intention of importing this data into the simulation software. The software uses the data to incorporate the effect, if any, of CT saturation to the fault current waveforms.
Figure 12: 72CK12 CT Test Results (Kennnedale Top, Clover
Bar Bottom)
The saturation test results were very closely matched with manufacturer’s data. However, the residual magnetism values were of concern. Up to a value of 67% was found at Clover Bar. These results show a strong possibility of the CTs being driven early into saturation during a fault (should the CTs be left in this condition). The CTs were demagnetized after the testing was complete. The following example shows simulated faults at the Clover Bar Station and the effects of residual magnetism.
Figure 13: B-N Fault, 0% Residual Magnetism
Figure 14: B-N Fault, 67% Residual Magnetism
Figures 13 and 14 show the effects of residual magnetism on a close in B-N fault at Clover Bar Substation. When a high level of residual magnetism is present in the CT, some saturation occurs in the first cycle of the fault.
Figures 15 and 16 shows a close in 3PH fault at Clover Bar Substation. In this case, CT saturation is occurring even without any residual magnetism. When residual magnetism is present, the saturation is noticeably more severe.
4 Testing Execution Functional Testing Functional testing was performed on each relay individually. This is still an essential part of testing, and will continue to be utilized in conjunction with dynamic simulation testing. The purpose of functional testing is to prove distance zone reaches, line differential operating characteristic, overcurrent curves, and relay logic such as fuse failure logic and switch-on-to-fault logic. Pre-Construction Testing Extensive testing was performed in a laboratory environment, before the construction phase begins. System Based Testing using a dynamic simulation software with customizable system models was utilized for this portion of testing. The purpose of this testing was to prove the relay logic, functionality and communication scheme in the typical configuration as well as the (N-1) scenarios mentioned above. This type of testing subjects the protection system to real fault conditions similar to what it may encounter once it is in service. During the pre-construction phase, more time can be spent to analyze the performance of the protection scheme under different scenarios since there is no time pressure to complete the testing within a specified time period before the power system is required to be restored. Testing was performed on 72CK12 and 72CK13 line protections simultaneously. This required using three time-synchronized relay test sets, each with a three-phase, 64 Amp current output. Three current amplifiers connected in parallel were also required to attain a 150 Amp, three-phase output. The amplifiers were placed on the faulted line at the strong infeed (Clover Bar Substation) to reach the necessary secondary fault levels. The relay test set was
sufficient for the current required on the un-faulted line.
Figure 17: Pre-Construction Test Setup
Test Scenario #1: In this test scenario, the 72CK12 line was simulated to be out of service. When one line feeding Kennedale Substation is out of service, the system must be reconfigured to supply the necessary load without overloading the remaining cable. The 72KN23 line is switched into service, providing a source from Namao Substation. This source is very weak compared to the one from Clover Bar Substation. Therefore, when a fault occurs on 72CK13 line, a weak infeed condition occurs with the fault fed almost entirely from the Clover Bar Substation.
Figure 18: System Configuration with 72CK12 Out of Service
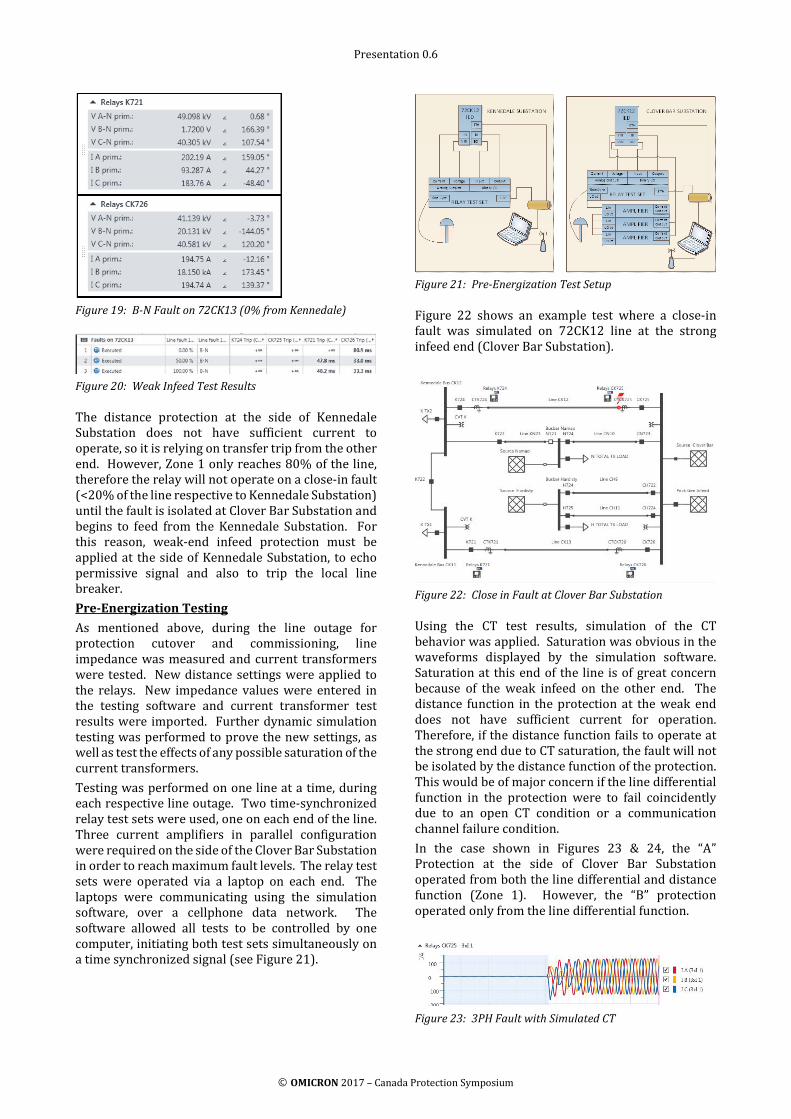
Figure 19: B-N Fault on 72CK13 (0% from Kennedale)
Figure 20: Weak Infeed Test Results
The distance protection at the side of Kennedale Substation does not have sufficient current to operate, so it is relying on transfer trip from the other end. However, Zone 1 only reaches 80% of the line, therefore the relay will not operate on a close-in fault (<20% of the line respective to Kennedale Substation) until the fault is isolated at Clover Bar Substation and begins to feed from the Kennedale Substation. For this reason, weak-end infeed protection must be applied at the side of Kennedale Substation, to echo permissive signal and also to trip the local line breaker. Pre-Energization Testing As mentioned above, during the line outage for protection cutover and commissioning, line impedance was measured and current transformers were tested. New distance settings were applied to the relays. New impedance values were entered in the testing software and current transformer test results were imported. Further dynamic simulation testing was performed to prove the new settings, as well as test the effects of any possible saturation of the current transformers. Testing was performed on one line at a time, during each respective line outage. Two time-synchronized relay test sets were used, one on each end of the line. Three current amplifiers in parallel configuration were required on the side of the Clover Bar Substation in order to reach maximum fault levels. The relay test sets were operated via a laptop on each end. The laptops were communicating using the simulation software, over a cellphone data network. The software allowed all tests to be controlled by one computer, initiating both test sets simultaneously on a time synchronized signal (see Figure 21).
Figure 21: Pre-Energization Test Setup
Figure 22 shows an example test where a close-in fault was simulated on 72CK12 line at the strong infeed end (Clover Bar Substation).
Figure 22: Close in Fault at Clover Bar Substation
Using the CT test results, simulation of the CT behavior was applied. Saturation was obvious in the waveforms displayed by the simulation software. Saturation at this end of the line is of great concern because of the weak infeed on the other end. The distance function in the protection at the weak end does not have sufficient current for operation. Therefore, if the distance function fails to operate at the strong end due to CT saturation, the fault will not be isolated by the distance function of the protection. This would be of major concern if the line differential function in the protection were to fail coincidently due to an open CT condition or a communication channel failure condition. In the case shown in Figures 23 & 24, the “A” Protection at the side of Clover Bar Substation operated from both the line differential and distance function (Zone 1). However, the “B” protection operated only from the line differential function.
Figure 24: 3PH Fault with Ideal CT (For Reference)
In the case shown in Figures 25 & 26, both the “A” and “B” protection operated on line differential function and distance function (Zone 1).
Figure 25: B-N Fault with Simulated CT
Figure 26: B-N Fault with Ideal CT (For Reference)
These results prove that the line protection will operate sufficiently and isolate the fault instantaneously even if CT saturation occurs. However, they do reveal a weakness in our protection system. There is a high possibility that CT saturation will occur on a close-in or bus fault at Clover Bar Substation. Because of the weak infeed at the side of Kennedale Substation, the mis-operation of the line differential function due to a bus fault is not of concern. However, simulation testing should be performed on the transformer differential protection to prove that there will not be a mis-operation due to CT saturation on a through-fault condition. Testing Line Differential vs Distance Functions System based testing is a valuable tool for both distance and line differential functions. What we found to be the most valuable when testing line differential function is simulating the maximum through faults, with CT saturation curves, and proving that a mis-operation will not occur. This aspect of testing is often neglected in all types of line differential schemes, but is an essential test scenario to be considered. System based testing is vital for distance protection schemes. This is the only way to truly prove that the zone reach settings are set to operate correctly for real system values. Settings errors can be identified with this type of testing. Functional testing typically is performed to prove that the relay settings are in accordance with the calculated values, but in most cases, it will not find mistakes in calculation. In the age of ‘copy-and-paste’ and computer programs performing calculations, this is a very important aspect of testing. Using realistic fault values is also going to prove that the relay settings are correct for
the system. Modern relays have hundreds (or even thousands) of settings, and a misunderstanding of any of these settings can have a huge impact on relay operation. System based testing also proved to be an excellent way to prove the permissive overreaching transfer tripping (POTT) scheme used for line protection. It’s easy to prove communication bits are being transmitted and received at the expected times during this testing. Iterative Closed-Loop Testing An iterative closed-loop feature is available in the simulation software. When using this feature, the software will use feedback from the relay in order to predict what would occur during an actual operation. The software will then replay the fault, using the learned data to alter the fault conditions. One area that we used this feature was for testing a communication fail between relays. When a line fault occurs at the strong end, the fault is fed from the strong end until the breaker trips via the distance function (Zone1) of the line protection. Once the breaker trips, the fault will be fed through the parallel line until the weak end trips in Zone 2, 300 milliseconds later. On the first execution of the fault, the fault is injected for the duration of the user-defined fault time. The software receives feedback that the CK726 circuit breaker opened. For the second execution, after CK726 opens, the fault will be fed from the side of the Kennedale Substation and the protection will operate in Zone 2. Figures 27 to 30 shows this test scenario.
Figure 27: System Configuration for Closed Loop Testing of
5 Test Results and Analysis Data Obtained One major advantage of this type of system based testing is the ease and speed with which multiple tests and scenarios can be executed. This allows a lot of data to be obtained and is extremely useful for evaluating the performance of the protection system. However, this also leads to the question of how many test scenarios should be considered. Since hundreds of tests can be prepared within minutes, a firm plan of what needs to be tested and possible logic and settings that are of most concern is required in order to limit the number of tests to perform. Because of the large number of test scenarios considered, this protection scheme was the most thoroughly tested protection scheme at EPCOR. EPCOR is confident that this protection scheme will operate correctly in any possible system condition, with test results to support it. Issues Discovered Issue #1 - “A” Protection Under-Reaching on Ground Faults During testing, the distance function of the “A” Protection was found to be severely under-reaching on ground faults. Through trouble-shooting, it was determined that the fault selection algorithm of the relay was not operating correctly. Any time there was above 50 Amps primary current on an un-faulted phase, the fault selector would determine that a phase-to-phase fault was present. Therefore, the phase-to-phase impedance would be used in the fault calculations, while the phase to ground impedance would be ignored. In the following example of an A-N fault, 10% from the side of Clover Bar Substation, the distance function should clearly be operating in Zone 1 on a phase-to-ground fault. When this test was applied all distance zones failed to pick up, as the relay was calculating fault impedance using the phase-to-phase value.
Figure 31: Example A-N Fault at Clover Bar substation
The cause of this problem was found to be the applied load encroachment setting. The intention was to disable load encroachment. Because it was not possible to disable load encroachment in this relay, the load encroachment was set to the maximum value. The manufacturer later advised that the load encroachment setting is used in the fault selection algorithm. However the exact algorithm used was not revealed. As a result, the load encroachment setting was set to an appropriate value based on 120% of the emergency loading of the line. Afterward, the protection operated correctly. This issue was not noticed during typical functional testing of the relay because the fault current was not applied to the un-faulted phases. If system based testing was not performed, this issue would most likely not have been found, and would certainly have potential for very severe consequences. Issue #2 - “B” Protection Residual Compensation The “B” Protection was found to be not correctly applying its residual compensation factor when calculating ground fault impedances. It appeared to be ignoring the residual compensation factor and using loop impedance instead. After much discussion with the relay manufacturer, the cause of this issue is still undetermined. The solution was to change the current transformer connection from “3-phase + IN” to “3-phase”. This seems to be an isolated issue to this particular model of relay. We tested the line distance function of different models from the same manufacturer and were unable to reproduce this behavior. This issue was noticed during functional testing, and confirmed again during simulation testing. However, it would be easy to achieve false positive results with functional testing simply by adjusting the test settings. In this case, system based testing provided us with confidence that a real issue existed. Especially when considering that the model had been proven with other types of relays.
Issue #3 - Incorrect Distance Zone Calculations after Line Measurement After the line impedance was measured, new settings were applied for both “A” and “B” Protection, and the relays were tested again. During system based testing, a problem with the quadrilateral reaches (phase-to-ground) was found. Upon further inspection of the settings, a calculation error was discovered - the positive sequence impedance angle was used in the zero sequence impedance reach calculation. Functional testing did not catch this error because the settings in the relay matched the calculated settings. The real problem was because the calculated settings did not correlate to the system values.
6 Lessons Learned Cost and Time Analysis One major advantage to system based testing is the amount of benefits gained for the cost. When comparing to the cost of this project, the dynamic simulation software itself is a negligible cost. When considering that the software is a one-time purchase that will be used on countless projects in the future, and be a huge aid in troubleshooting future settings issues and relay mis-operations, the cost is extremely low. Comparing the efforts of this type of testing versus the traditional static state sequence testing, performing the same number of test cases would take less time. This of course is assuming that the model used for testing is correct, and no troubleshooting is required in the software to achieve proper testing conditions. More complexity creates more opportunity for error. As engineers and field staff become more comfortable with the application of the software in different testing scenarios, the efforts will likely reduce. When comparing to dynamic simulation software with preset system models, the time is significantly reduced. Even though more data is required to set up the full system model for the dynamic simulation software with customizable system models, it actually takes less time due to the flexibility of the software. A mistake in the model or test parameters can be corrected and applied to all test cases. Test parameters can easily be altered and multiple tests can be created simultaneously. Performing the tests is simplified as well, with the ability to control all test sets at multiple locations from one computer. The cost of performing full system simulation testing for end-to-end testing has proven to be very similar to the costs of traditional testing methods. The cost of future mis-operations that can be avoided by performing this testing is also a major benefit. A mis-operation can have large effects on system stability and produce costly and unnecessary outages.
Feedback from Operational Crews Field staff involved in this project quickly grasped the concept of the system based testing since they are already familiar with dynamic simulation testing with preset system models. Therefore, the learning curve was not very steep for the new software. The improved flexibility of the software was also appreciated. The reduced overall time for end-to-end testing allowed for a less stressful outage and the work was actually completed two days ahead of the scheduled in-service date.
7 Conclusion System Based Testing proved to be valuable in evaluating the performance of line protection systems at EPCOR. In addition, this type of simulation testing is useful to discover relay setting errors as well as relay algorithm errors. When used in end-to-end testing, the simulation software can be used to perform tests more efficiently. Finally, proper considerations of the test scenarios can give protection engineers more confidence to apply the protection scheme in the power system.
Adam Rudd graduated from the Northern Alberta Institute of Technology in 2008 with a diploma in Electrical Engineering Technology. He spent 2 years performing field service for industrial and utility clients with Pace Technologies Inc. In 2010 he joined EPCOR’s Substation
Operations group, where he became a journeyman Power System Electrician in 2013. He joined EPCOR’s Substation Engineering team in 2014, in his current role as Electrical Technologist, Substation Integration.
Yordan Kyosev is a registered professional engineer in the province of Alberta, Canada. He is accountable for the performance of protection & control systems of the company including capital
planning, project execution, asset management and operational support. Prior joining EPCOR he worked as a P&C engineer in Bulgarian National Electric Company and as a power systems engineer in Schlumberger, Canada.
Peter Fong graduated from the University of British Columbia with a B.A.Sc. and is a Professional Engineer registered in the province of British Columbia. Peter was previously an Application Specialist with OMICRON electronics Corp. USA and has
vast experience with relay and substation testing equipment. Peter is a member of IEEE and has given papers in various technical conferences. He is currently the General Manager of Sequence Instruments Inc. in Vancouver, Canada.
www.omicronenergy.com
OMICRON is an international company serving the electrical power industry with innovative testing and diagnostic solutions. The application of OMICRON products allows users to assess the condition of the primary and secondary equipment on their systems with complete confidence. Services offered in the area of consulting, commissioning, testing, diagnosis and training make the product range complete.
Customers in more than 160 countries rely on the company’s ability to supply leading-edge technology of excellent quality. Service centers on all continents provide a broad base of knowledge and extraordinary customer support. All of this together with our strong network of sales partners is what has made our company a market leader in the electrical power industry.
For more information, additional literature, and detailed contact information of our worldwide offices please visit our website.