System Dynamic Model for Crop Production, Water Footprint, and Virtual Water Nexus Inas K. El-Gafy Received: 5 November 2013 /Accepted: 5 May 2014 # Springer Science+Business Media Dordrecht 2014 Abstract Intended for comprehensive assessment of water usage in agricultural for food production and to address its future, it is essential to scrutinize the dynamic behavior of crop production and its water footprint and virtual water trade. Through the current research a System Dynamic model that can be applied to estimate crop production, water footprint, and virtual water nexus was developed. The system could be applied to explore how water footprint of crop production and consumption change under proposed planned scenarios which differ from each other in terms of main drivers of change. The drivers of change include population, per capita crop consumption, crop trade patterns, crop yield, and climate change impact. The system is developed to be applied at the country level. A case study from Egypt was analyzed applying the developed system. Where, water footprint of wheat production (green, blue, and grey water), consumption (internal, import and export), and its virtual water balance for years 2010 to 2050 were analyzed under proposed planned scenarios. These proposed planned scenarios were varying in wheat trade pattern strategies and impact of climate change on wheat water consumption and its yield. Keywords Water footprint . Scenario building . System dynamics modeling . Virtual water trade balance 1 Introduction The total use of local water resources within a country is not the accurate measure of a nation’ s water use (Hoekstra et al. 2011). Where, traditional national water use accounts only refer to the water use from the internal water resources within the country. If there is virtual water (VW) import into a country, VW is defined as the amount of water consumed in the product process of a product (Allan 1998), this VW volume should be added to the total water use of the country in order to realize real picture of the nation’ s actual use of the global water resources. Similarly the export of VW should be deducted from the volume of the nation’ s water use (Hoekstra et al. 2011). Water Resour Manage DOI 10.1007/s11269-014-0667-2 I. K. El-Gafy (*) Strategic Research Unit, Ministry of Water Resources and Irrigation, NWRC Admin. Bldg., El-Qanater 13621, Qalyoubia, Egypt e-mail: [email protected]
Transcript
System Dynamic Model for Crop Production, WaterFootprint, and Virtual Water Nexus
Inas K. El-Gafy
Received: 5 November 2013 /Accepted: 5 May 2014# Springer Science+Business Media Dordrecht 2014
Abstract Intended for comprehensive assessment of water usage in agricultural for foodproduction and to address its future, it is essential to scrutinize the dynamic behavior ofcrop production and its water footprint and virtual water trade. Through the currentresearch a System Dynamic model that can be applied to estimate crop production, waterfootprint, and virtual water nexus was developed. The system could be applied to explorehow water footprint of crop production and consumption change under proposed plannedscenarios which differ from each other in terms of main drivers of change. The drivers ofchange include population, per capita crop consumption, crop trade patterns, crop yield,and climate change impact. The system is developed to be applied at the country level. Acase study from Egypt was analyzed applying the developed system. Where, waterfootprint of wheat production (green, blue, and grey water), consumption (internal,import and export), and its virtual water balance for years 2010 to 2050 were analyzedunder proposed planned scenarios. These proposed planned scenarios were varying inwheat trade pattern strategies and impact of climate change on wheat water consumptionand its yield.
Keywords Water footprint . Scenario building . Systemdynamicsmodeling .Virtualwater tradebalance
1 Introduction
The total use of local water resources within a country is not the accurate measure of anation’s water use (Hoekstra et al. 2011). Where, traditional national water use accountsonly refer to the water use from the internal water resources within the country. If there isvirtual water (VW) import into a country, VW is defined as the amount of waterconsumed in the product process of a product (Allan 1998), this VW volume shouldbe added to the total water use of the country in order to realize real picture of thenation’s actual use of the global water resources. Similarly the export of VW should bededucted from the volume of the nation’s water use (Hoekstra et al. 2011).
Water Resour ManageDOI 10.1007/s11269-014-0667-2
I. K. El-Gafy (*)Strategic Research Unit, Ministry of Water Resources and Irrigation, NWRC Admin. Bldg., El-Qanater13621, Qalyoubia, Egypte-mail: [email protected]
Accordingly, traditional national water use should be enhanced to include the abovelisted issues, thus the water footprint (WFP) concept has been developed. WFP can beapplied as a comprehensive indicator of freshwater resources appropriation next to thetraditional measure of water withdrawal. WFP of a nation can be assessed by taking theuse of domestic water resources subtract the VW flow that leaves the country and add theVW flow that enters the country (Chapagain and Hoekstra 2004; Hoekstra et al. 2011).WFP of the national consumption is defined as the total amount of fresh water that isconsumed by the inhabitants of the nation (Hoekstra et al. 2009).
On the other hand, the term “freshwater” within the WFP includes both consumptivewater use (green and blue water footprint) and the water required to assimilate pollution(grey water footprint). Green WFP refers to consumption of rainwater stored in the soilas soil moisture. Blue WFP refers to consumption of surface and ground water. GreyWFP refers to pollution and is defined as the volume of freshwater that is required toassimilate the load of pollutants based on existing ambient water quality standards(Hoekstra et al. 2009; Hoekstra et al. 2011; Mekonnen and Hoekstra 2011; Dourte andFraisse 2012). In the area of agricultural water use, accounting WFP and VW for cropsand food item is an important issue for decision makers in a country to have a reliableand robust knowledge base for the water use for crop production and consumption.
Several studies for calculation of the WFP and VW of crop (s) and different fooditems were carried out. Hoekstra and Hung (2002) were the first to make a globalestimate of the consumptive water use for a number of crops per country. Chapagainand Hoekstra (2004) calculated the VW for each nation of the world for the period 1997–2001. Chapagain et al. (2005a) analyzed global VW trade for the period 1997–2001.Hsayan et al. (2006) reviewed the concept of potential VW trade among the Arabcountries for the period 1999–2003. El-Sadek (2010) analyzed how to apply the conceptof VW as a strategy in a way that meets its interests and objectives defined in theEgyptian National Water Resources Plan. El-Sadek (2010) analyzed the virtual waterconcept as a solution for water scarcity in Egypt.
Hoekstra and Hung (2002) expanded the VW concept to develop the WFP, whichadds the important distinction between consumption of surface water and groundwater(blue water use) and consumption of rainfall (green water use). Chapagain et al.(2005b) estimated the green, blue and grey WFP of worldwide cotton consumption.Hoekstra and Chapagain (2007) calculated the WFP for each nation of the world forthe period 1997–2001. Chapagain and Hoekstra (2010) estimated the green, blue andgrey WFP of rice. Mekonnen and Hoekstra (2010a) estimated green, blue and greyWFP of wheat. Ge et al. (2011) estimates the water footprint of China in 2007.Mekonnen and Hoekstra (2010b, 2011) estimated green, blue and grey WFP of 126crops at a 5 by 5 arc minute grid using a grid-based dynamic water balance model.Shrestha et al. (2013) estimated the green, blue and grey WFP of nine primary cropsproduction in Nepal. Sun et al. (2013) assessed internal variability of green, blue andgrey WFP of maize production in Beijing from 1978 to 2008.
On the hand, some other studies were conducted to assess WFP and VW for futureamong those are El-Gafy and Attia (2009) and Ercin and Hoekstra (2012). El-Gafy andAttia (2009) estimated the VW import and export, water saving due to agricultural trade,and WFP of crops production at Egypt for year 2050. Ercin and Hoekstra (2012)developed WFP scenarios for 2050. Ercin and Hoekstra (2012) comprise two assess-ments; one for the globe as a whole and another one for some countries in Europe.
As shown in the previous section the researchers were focused only on calculating theWFP and VW for certain time periods. However, the water demand for production of
I. K. El-Gafy
food crops is increasing globally; this tends to put pressure on the nation water resourcesmanagement. Consequently, aiming at a comprehensive assessment of water managementin agricultural for food production and to better understand its future, it is necessary toanalyze the dynamic behavior of crop production demand and its WFP and VW tradeover time (Dourte and Fraisse 2012).
The system dynamics is an approach to understanding the behavior of complex systemsover time. The most important feature of system dynamics approach is to elucidate endoge-nous structure of the system under study, to see how different elements of the system actuallyrelate to one another, and to experiment with changing relations within the considered systemwhen different decisions are included (Simonovic 2000; Chen and Wei 2014).
The main objective of the current research is assisting the decision maker in the areaof water resources management in determining the dynamic behavior of crop produc-tion and its water footprint and VW trade. The objective of the research was achievedby carrying out two main steps. The first step was developing a System DynamicModel to be applied at the country level to assist the decision maker in scrutinizingcrop production, WFP, and VW trade nexus over time under a number plannedscenarios that differ from each other in terms of main drivers of changes. These driversof changes include population, per capita crop consumption, crop trade patterns, cropyield, and climate change impact on crop yield and blue and green water consumption.The second step was scrutinizing a case study from Egypt with the purpose ofillustrating the significance of the system. The developed system was applied tosimulate dynamics of production, WFP, and VW trade nexus of wheat in Egypt forthe interval 2010 – 2050 under proposed scenarios. The accuracy of the system wasassessed applying a historical data from 2001 to 2005.
2 Methodology
The objective of the research was achieved by that are: i) developing System Dynamic Modelfor crop production, WFP, and VW nexus (SD-CWPVN) and ii) applying the developedsystem on a case study from Egypt.
2.1 Developing System Dynamic Model for Crop Production, WFP, and VW Nexus(SD-CWPVN)
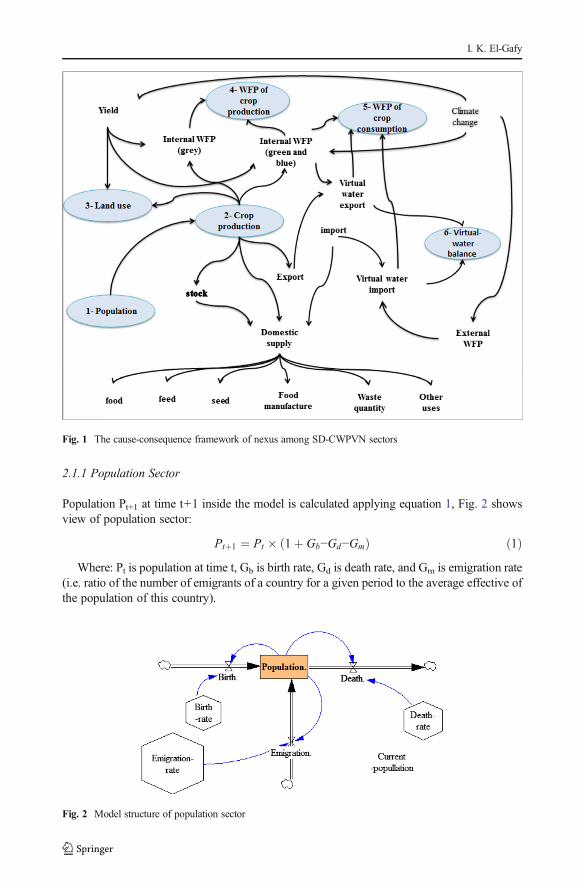
SD-CWPVN consists of six sectors which are: population, crop production, land use, WFP ofcrop production, national WFP of crop consumption, and VW balance sectors. The conceptuallinks between the sectors of SD-CWPVN are shown in Fig. 1. Vensim PLE is utilized todevelop the system (Ventana 2007
The population sector of SD-CWPVN forecasting total population of the nation basedon expected birth, death, and mitigation rate. The crop production sector deals with thedemanded quantity from crop production over time. This demand is driven by populationgrowth, per capita food demand, and trade pattern. The land use sector determines thearea needed to produce the demand crop production depending on its yield. WFP of cropproduction sector estimate green, blue, and grey WFP of crops production. WFP of cropproduction is driven by yield, climate change, and demand crop production scenarios.National WFP of crop consumption sector determines internal, import, and export WFPof crop consumption under trade pattern scenarios. VW balance sector estimates thewater saved due to crop trade pattern. The following is the formulation of each sector.
System Dynamic Model for Crop Production, Water Footprint, and Virtual Water Nexus
2.1.1 Population Sector
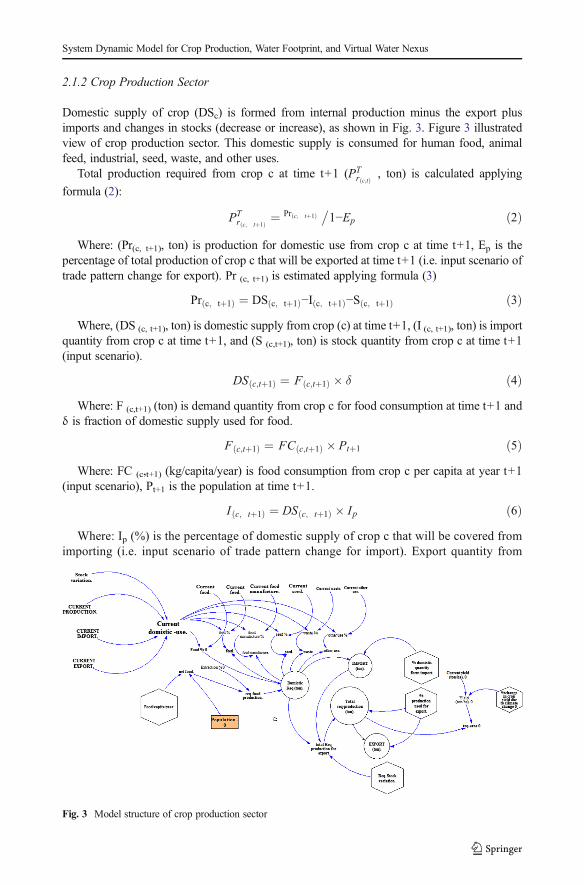
Population Pt+1 at time t+1 inside the model is calculated applying equation 1, Fig. 2 showsview of population sector:
Ptþ1 ¼ Pt � 1þ Gb−Gd−Gmð Þ ð1ÞWhere: Pt is population at time t, Gb is birth rate, Gd is death rate, and Gm is emigration rate
(i.e. ratio of the number of emigrants of a country for a given period to the average effective ofthe population of this country).
Fig. 1 The cause-consequence framework of nexus among SD-CWPVN sectors
Fig. 2 Model structure of population sector
I. K. El-Gafy
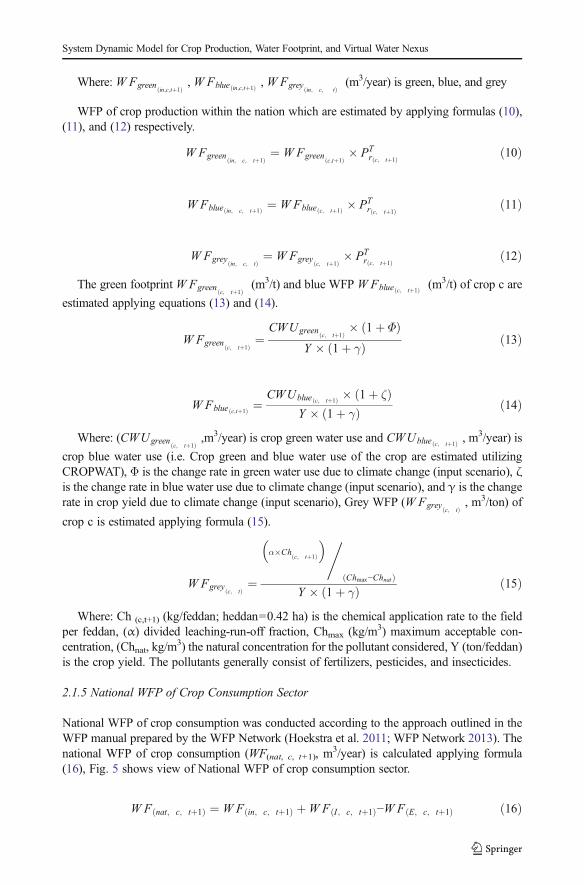
2.1.2 Crop Production Sector
Domestic supply of crop (DSc) is formed from internal production minus the export plusimports and changes in stocks (decrease or increase), as shown in Fig. 3. Figure 3 illustratedview of crop production sector. This domestic supply is consumed for human food, animalfeed, industrial, seed, waste, and other uses.
Total production required from crop c at time t+1 (PTr c;tð Þ , ton) is calculated applying
formula (2):
PTr c; tþ1ð Þ ¼ Pr c; tþ1ð Þ
�1−Ep ð2Þ
Where: (Pr(c, t+1), ton) is production for domestic use from crop c at time t+1, Ep is thepercentage of total production of crop c that will be exported at time t+1 (i.e. input scenario oftrade pattern change for export). Pr (c, t+1) is estimated applying formula (3)
Pr c; tþ1ð Þ ¼ DS c; tþ1ð Þ−I c; tþ1ð Þ−S c; tþ1ð Þ ð3ÞWhere, (DS (c, t+1), ton) is domestic supply from crop (c) at time t+1, (I (c, t+1), ton) is import
quantity from crop c at time t+1, and (S (c,t+1), ton) is stock quantity from crop c at time t+1(input scenario).
DS c;tþ1ð Þ ¼ F c;tþ1ð Þ � δ ð4ÞWhere: F (c,t+1) (ton) is demand quantity from crop c for food consumption at time t+1 and
δ is fraction of domestic supply used for food.
F c;tþ1ð Þ ¼ FC c;tþ1ð Þ � Ptþ1 ð5ÞWhere: FC (c,t+1) (kg/capita/year) is food consumption from crop c per capita at year t+1
(input scenario), Pt+1 is the population at time t+1.
I c; tþ1ð Þ ¼ DS c; tþ1ð Þ � Ip ð6ÞWhere: Ip (%) is the percentage of domestic supply of crop c that will be covered from
importing (i.e. input scenario of trade pattern change for import). Export quantity from
Fig. 3 Model structure of crop production sector
System Dynamic Model for Crop Production, Water Footprint, and Virtual Water Nexus
crop c at time t+1 (E (c, t+1), ton) is calculated applying formula (7):
E c;tþ1ð Þ ¼ PTr c; tþ1ð Þ−Pr c; tþ1ð Þ ð7Þ
2.1.3 Land Use Sector
Total area A(c, t+1) (feddan; feddan=0.42 ha) required from crop c at time t+1 is estimatedapplying formula (8).
A c; tþ1ð Þ ¼ PTr c; tþ1ð Þ
.Y ð8Þ
Where: Y (ton/feddan) is the crop yield.
2.1.4 WFP of Crop Production Sector
The WFP of a crop production is defined as the volume of water consumed for its production.WFP of crop production was conducted according to the approach outlined in the WFP manualprepared by the WFP Network (Hoekstra et al. 2011; WFP Network 2013). Total WFP of crop cproduction at time t+1 (WF (c,t+1), m
3/year) is estimated according to formula (9), Fig. 4 showsview of WFP of crop production :
W F c; tþ1ð Þ ¼ W Fgreenin; c; tþ1ð Þ
þW Fblue in; c; tþ1ð Þ þW Fgreyin; c; tþ1ð Þ
ð9Þ
Fig. 4 Model structure of WFP of crop production sector
I. K. El-Gafy
Where: W Fgreenin;c;tþ1ð Þ
, W Fblue in;c;tþ1ð Þ , W Fgreyin; c; tð Þ
(m3/year) is green, blue, and grey
WFP of crop production within the nation which are estimated by applying formulas (10),(11), and (12) respectively.
W Fgreenin; c; tþ1ð Þ
¼ W Fgreenc;tþ1ð Þ
� PTr c; tþ1ð Þ ð10Þ
W Fblue in; c; tþ1ð Þ ¼ W Fblue c; tþ1ð Þ � PTr c; tþ1ð Þ ð11Þ
W Fgreyin; c; tð Þ
¼ W Fgreyc; tþ1ð Þ
� PTr c; tþ1ð Þ ð12Þ
The green footprint W Fgreenc; tþ1ð Þ
(m3/t) and blue WFP W Fblue c; tþ1ð Þ (m3/t) of crop c are
estimated applying equations (13) and (14).
W Fgreenc; tþ1ð Þ
¼CWUgreen
c; tþ1ð Þ� 1þ Φð Þ
Y � 1þ γð Þ ð13Þ
W Fblue c;tþ1ð Þ ¼CWUblue c; tþ1ð Þ � 1þ ζð Þ
Y � 1þ γð Þ ð14Þ
Where: (CWUgreenc; tþ1ð Þ
,m3/year) is crop green water use and CWUblue c; tþ1ð Þ , m3/year) is
crop blue water use (i.e. Crop green and blue water use of the crop are estimated utilizingCROPWAT), Φ is the change rate in green water use due to climate change (input scenario), ζis the change rate in blue water use due to climate change (input scenario), and γ is the changerate in crop yield due to climate change (input scenario), Grey WFP (W Fgrey
c; tð Þ, m3/ton) of
crop c is estimated applying formula (15).
W Fgreyc; tð Þ
¼
α�Chc; tþ1ð Þ
� �,Chmax−Chnatð Þ
Y � 1þ γð Þ ð15Þ
Where: Ch (c,t+1) (kg/feddan; heddan=0.42 ha) is the chemical application rate to the fieldper feddan, (α) divided leaching-run-off fraction, Chmax (kg/m3) maximum acceptable con-centration, (Chnat, kg/m
3) the natural concentration for the pollutant considered, Y (ton/feddan)is the crop yield. The pollutants generally consist of fertilizers, pesticides, and insecticides.
2.1.5 National WFP of Crop Consumption Sector
National WFP of crop consumption was conducted according to the approach outlined in theWFP manual prepared by the WFP Network (Hoekstra et al. 2011; WFP Network 2013). Thenational WFP of crop consumption (WF(nat, c, t+1), m
3/year) is calculated applying formula(16), Fig. 5 shows view of National WFP of crop consumption sector.
W F nat; c; tþ1ð Þ ¼ W F in; c; tþ1ð Þ þW F I ; c; tþ1ð Þ−W F E; c; tþ1ð Þ ð16Þ
System Dynamic Model for Crop Production, Water Footprint, and Virtual Water Nexus
Where: WF (in,c,t+1) (m3/year) is the internal WFP of crop c at time t+1, WF (I,c,t+1) (m
3/year) is the imported WFP of crop c at time t+1, and WF (E,c,t+1) (m
3/year) is the exportedWFP of the crop c at time t+1.
W F in; c; tþ1ð Þ ¼ W Fgreenin; c; tþ1ð Þ
þW Fblue in; c; tþ1ð Þ ð17Þ
W F I ; c; tþ1ð Þ ¼ V n;c;tþ1ð Þ � I c;tþ1ð Þ ð18Þ
W F E; c; tþ1ð Þ ¼ V n; c; tþ1ð Þ � E c; tþ1ð Þ ð19ÞWhere: V (n,c,t) is the VW content (m3/ton) of the crop c in the exporting country n, I (n,c,y) is
the imported quantity of crop c from nation n at year y and E (c,y) is the exported quantity ofcrop (ton) to nation n at year y. As mentioned by Hoekstra et al. (2011), if further details arenot available, one can assume that a product is produced in the exporting country.
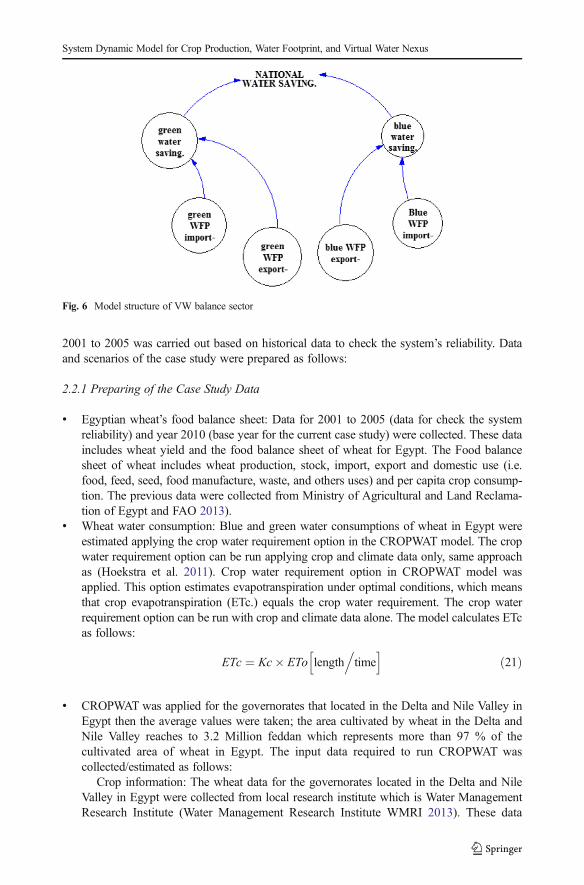
2.1.6 Virtual-Water Balance Sector
The national water saving ΔS (c,t+1) (m3/year) due to trade of crop (c) at time t is estimated
according to formula (20), Fig. 6 shows view of Virtual-water balance sector.
ΔS c; tþ1ð Þ ¼ W F I ; c; tþ1ð Þ−W F E; c; tþ1ð Þ ð20Þ
2.2 Case Study
SD-CWPVN was applied to simulate dynamics of production, WFP, and VW trade nexus ofwheat in Egypt for the interval 2010–2050 under proposed scenarios. Simulation from years
Fig. 5 Model structure of WFP of crop consumption sector
I. K. El-Gafy
2001 to 2005 was carried out based on historical data to check the system’s reliability. Dataand scenarios of the case study were prepared as follows:
2.2.1 Preparing of the Case Study Data
& Egyptian wheat’s food balance sheet: Data for 2001 to 2005 (data for check the systemreliability) and year 2010 (base year for the current case study) were collected. These dataincludes wheat yield and the food balance sheet of wheat for Egypt. The Food balancesheet of wheat includes wheat production, stock, import, export and domestic use (i.e.food, feed, seed, food manufacture, waste, and others uses) and per capita crop consump-tion. The previous data were collected from Ministry of Agricultural and Land Reclama-tion of Egypt and FAO 2013).
& Wheat water consumption: Blue and green water consumptions of wheat in Egypt wereestimated applying the crop water requirement option in the CROPWAT model. The cropwater requirement option can be run applying crop and climate data only, same approachas (Hoekstra et al. 2011). Crop water requirement option in CROPWAT model wasapplied. This option estimates evapotranspiration under optimal conditions, which meansthat crop evapotranspiration (ETc.) equals the crop water requirement. The crop waterrequirement option can be run with crop and climate data alone. The model calculates ETcas follows:
ETc ¼ Kc� ETo length.time
h ið21Þ
& CROPWAT was applied for the governorates that located in the Delta and Nile Valley inEgypt then the average values were taken; the area cultivated by wheat in the Delta andNile Valley reaches to 3.2 Million feddan which represents more than 97 % of thecultivated area of wheat in Egypt. The input data required to run CROPWAT wascollected/estimated as follows:
Crop information: The wheat data for the governorates located in the Delta and NileValley in Egypt were collected from local research institute which is Water ManagementResearch Institute (Water Management Research Institute WMRI 2013). These data
Fig. 6 Model structure of VW balance sector
System Dynamic Model for Crop Production, Water Footprint, and Virtual Water Nexus
include values of Kc for wheat over the length of the growing period, growth stages,sowing and harvesting date, and season length.
Climatic data: Climate Information Tool (CIT) software, a component of AQUASTAT(FAO 2009a; FAO 2009b), was used to generate the required climatic data for eachEgyptian governorate. The climate data include: minimum and maximum air temperature,relative humidity, sunshine duration, wind speed and monthly rainfall. The generated databy (CIT) has been validated by comparing it with of some local stations for the sameperiod of time. Figure 7, as example, illustrates comparison between mean temperaturescollected from two stations located at Giza and Kafr-El-Sheikh governorates in Egypt andthe generated data from (CIT). The collected data obtained from the Egyptian Meteoro-logical Authority (Eid et al. 2006). The RMSE between the measured and generated datafor Kafr El-Sheikh was found to be 0.22 while the RMSE for Giza station was found to be0.55. These values of the RMSE indicate that there are strong agreements between thegenerated and measured data.
For the validation of the results of CROPWAT, a comparison between the estimatedwheat water requirement (blue and green) at the Egyptian governorates and the waterrequirement per feddan of wheat in the same governorates according to (Water Manage-ment Research Institute WMRI 2013 was carried out. As shown in Fig. 8, there is goodcorrelation between the estimated total wheat water requirement (blue and green) byCROPWAT and the collected data from (Water Management Research Institute WMRI2013) where the average relative error was about 2.7 %.
Grey water was estimated applying equation (15) that mentioned in the methodologysection. Data on the application of fertilizers (nitrogen) application rate to the field perfeddan of wheat was obtained from Ministry of Agricultural and Land Reclamations ofEgypt. The maximum acceptable concentration of nitrogen in the water body is deter-mined according to Law 48 for year 1982 of Egypt. The natural concentration of nitrogenin the receiving water body was assumed to be zero. The quantity of nitrogen thatreaches free flowing water bodies has been assumed to be 10 per cent of the appliedfertilization rate (in kg/feddan/year); same approach as Hoekstra and Chapagain, 2008.The effect of the use of other nutrients, pesticides and herbicides to the environment hasnot been analyzed during the study.
Fig. 7 Validation of climatic data for Kafr El-Sheikh and Giza Governorate (1961–1990)
I. K. El-Gafy
2.2.2 Building Proposed Scenarios
The planned scenario approach was applied to build proposed scenarios for the casestudy; the planned scenario is a methodology for long-range strategic planning incontexts of uncertainty (Schwartz 1991). Scenario planning allows a community toconsider a variety of plausible futures by taking into account the possible interactionsamong a variety of driving forces in the socio-ecological system. The scenario buildingin this study involves the following key steps:
& Identify the focal issue: The enquiry to be address in this current case study is simulatingthe dynamics of production, WFP, and VW trade nexuses of wheat in Egypt for the interval2010–2050.
& Identify the driving forces: For the current case study were considered the key drivingforces are population, wheat per capita consumption, wheat trade pattern (import andexport), and impact of climate change on wheat water consumption (blue and green) andits yield. According to grey WFP, it is assumed that the same quantity of fertilizer will beapplied in the simulation years.
& Rank importance and uncertaint: The importance and uncertainty of each driver were deter-mined according to consultancy with experts in the area of water, agriculture and environment.The most important and uncertainty drives were climate change and trader pattern drivers asshown in Table 1. Economic change was not considered during the current study.
& Select scenario logics: The scenario logics are defined by exploring the interactions of themost uncertain and important drivers. For each driving force, as shown in Fig. 9, twoattributes are selected representing two polar directions in which the drivers can go in thefuture. For wheat trade pattern import and export, the study focused on alternativescenarios that achieve self-sufficiency from wheat in Egypt. For impact of climate changeon wheat blue water consumption and its yield, it is focused on the no climate change andthe expected climate change scenarios.
& Flesh‐out the scenarios: Base on the previous set parameters and different combina-tion of every parameter, different varieties of the driving scenarios in the simulation
Fig. 8 Validation of the estimated wheat water requirement
System Dynamic Model for Crop Production, Water Footprint, and Virtual Water Nexus
period for wheat in Egypt could be obtained. However, considering the representa-tives and practical purpose of the scenarios as well as the limited space of the paper,the climate change with trade pattern drivers are setting into seven scenarios, asshown in Table 2, that are:
i. Base line scenario (continuation of the current situation), in this scenario, it is assumed that47 % of the domestic need will be imported and 1.1 % of the local production will beexported yearly (same percentage as the base year), the climate change will not impact onwheat water consumption, and adaptation measurements will carried out to the impact ofclimate change of the crop yield
ii. Fully self-sufficiency scenario with climate change impact scenarios (Sc1, Sc2a and Sc2b).Under the three scenarios, it is assumed wheat domestic need will be totally producedinternally (i.e. no export or import of what). Under Sc1 the climate change will not impact
Table 1 The importance and uncertainty of key driving forces
Driver forces Important Uncertainty
Population High Low
Wheat per capita consumption High Low
Wheat trade pattern import and export High High
Impact of climate change on wheat blue water consumption High High
Impact of climate change on wheat green water consumption Low High
Impact of climate change on yield High High
Sources: consultancy with experts; personal meeting
Fig. 9 The designated scenarios in the case study
I. K. El-Gafy
on wheat water consumption. Adaptation measurements will be carried out to the impactof climate change on the crop yield under Sc1 and Sc2-a.
iii. Partly self-sufficiency with climate change impact scenarios (Sc3, Sc4-a, and Sc4-b): UnderSc3, Sc4-a, and Sc4-b, it is assumed that 37 % of the domestic need will be imported and1.1 % of the local production will be exported yearly. Under Sc3 the climate change willnot impact on wheat water consumption. Adaptation measurements will be carried out tothe impact of climate change on the crop yield under Sc3 and Sc4-a.
& Setting drivers of change: The driving forces of the different scenarios were setting asfollows:
i. Population growth: Data for birth, death, and emigration scenarios (medium varia-tion) for years 2010, 2020, 2030, 2040, and 2050 were collected from United NationDepartment of Economic and Social Affairs site (United Nations 2013). Lineregression utilizing TableCurve 2D version 5.01 program was applied to determinethe scenarios of birth, death, and mitigation rates for each simulation year. Theseresults are applied as input to SD-CWPVN.
ii. Impact of climate change on crop water consumption: Egypt will face severeenvironmentally induced security challenges due to climatic change (Agrawalaet al. 2004). Averaged mean temperature will be increased by 1.4 Co by 2050.The change in precipitation will be not statistically significant (Nour El-Din,2013). Therefore, the impact of climate change through the study in greenWFP was neglected. The impact of climate change on blue water consumptionof wheat in Egypt was determined utilizing CROPWAT under five hypothet-ical scenarios for climatic change for the interval 2010–2050 The five scenar-ios are proposed by changing the maximum and minimum temperature at eachgovernorate of Egypt. The first scenario was applying the current climatic data(status quo). For the other four scenarios, it is proposed that the maximum andminimum temperature will be increased by +0.25, 0.5, 1.0, and 1.4°C. For eachchange in the temperature the corresponding relative humidity was calculated.The other climatic data that sunshine duration, wind speed and monthlyrainfall are supposed to be same as the status quo.
Table 2 Applied scenarios
Scenarios Trade pattern Impact of climate change on
Water consumption Yield
Base line 47 % of wheat domestic need will be importedand 1.1 % from domestic production will be exported
No impact No impact
Sc1 Wheat domestic need will be totally produced internally(i.e. no export or import of what)
No impact No impact
Sc2a Impact No impact
Sc2b Impact Impact
Sc3 37 % of wheat domestic need (reducing the percentageof the imported quantity by 10 %) will be importedand 1.1 % from domestic production will be exported
No impact No impact
Sc4a Impact No impact
Sc4b Impact Impact
System Dynamic Model for Crop Production, Water Footprint, and Virtual Water Nexus
The results of CROPWAT indicated that increasing the temperature by 0.25 ° 0.5,1.0, and 1.4 °C will result in increasing water requirement of wheat by about 0.92,1.5, 2.9, and 4.1 % respectively. Polynomial regression utilizing programTableCurve 2D version 5.01 was applied to determine the impact of climate changeon blue water for each simulation year. These results are applied as input to SD-CWPVN.
iii. Impact of climate change on crop yield: Data for impact of climate changescenarios for years 2010, 2030 and 2050, were collected from (Nour El-Din,2013). Line regression utilizing TableCurve 2D version 5.01 program was appliedto determine the scenarios of crop yield change for each simulation year. Theseresults are applied as input to SD-CWPVN.
iv. Per capita consumption of wheat:It is assumed that this driver forces will be as thebase year (year 2010) in all scenarios.
& Select indicators for monitoring: A set of indicator are selected to assess the implications ofalternative futures on the focal issue. These indicators are the outputs of the developedsystem SD-CWPVN. The selected indicators are WFP of wheat consumption, WFP ofwheat production, and VW trade balance.
3 Results and Discusion
3.1 Reliability of the System
Simulation from years 2001 to 2005 was carried out based on historical data toadjust the model and to check up the system’s reliability. According to WFP (green,blue, and gray) and VW there were no historical data available as the current studywas the first study to apply these approaches locally in Egypt. The accuracyassessment with the historical data indicated that the SD-CWPVN was robust.Where, the validation results, as shown in Table 3, illustrated that the parameterswith relative error less that 1 % account from 88 % and less than 2.5 % reach100 %. This accuracy assessment indicates that SD-CWPVN has high validity andcan be used in understanding the crop production, water footprint, and VW nexus insome ways.
3.2 WFP of Wheat Production and Consumption Under the Built Scenarios
Due to the population’s growth in Egypt, the required quantity from wheat fordomestic use will increase. Portion of this domestic need is satisfied by producingit locally and the rest is imported. Through the study, different scenarios wereproposed for wheat trade pattern to satisfy this domestic need. Under the differentscenarios, due to the trade pattern change, the required wheat production, import,export, and its cultivated area will be changed. Consequently, WFP of its productionand consumption and water saving due to wheat VW trade will change. Additional,driver force which is impact of climate change on wheat water consumption and itsyield was considering in the different scenarios. In the following sections analysis ofWFP of wheat production and consumption and water saving due to wheat VW tradeunder different scenarios will be illustrated.
I. K. El-Gafy
Tab
le3
Accuracyassessmentof
simulationresults
Year
Populatio
n(M
)Area(M
feddan)
Production
quantity(1,000
tons)
Importquantity
(1,000
tons)
Stockvariation
(1,000
tons)
Exportquantity
(1,000
tons)
Dom
estic
supply
(1,000
tons)
Food
quantity
(1,000
tons)
WFP
ofcrop
Consumption
(MCM)
Green
Blue
Gray
Total
Historical
data
2001
65.29
2.32
6255
4,823
547
23.24
10,508
9,931
nn
n5,275
2002
66.61
2.50
6,750
5,985
300
1,334
12,422
11,750
nn
n5,693
2003
67.97
2.55
6,895
4,576
482
30.46
10,958
10,365
nn
n5,815
2004
6,933
2.67
7,198
4,963
378
35.00
11,748
11,099
nn
n6,070
2005
70.69
3.02
8,141
5,688
484
35.00
13,310
12,575
nn
ii6,866
Forecast
results
2001
65.29
2.32
6,255
4,823
547
23.24
10,508
9,931
526
4,634
397
5,159
2002
66.60
2.50
6,755
5,989
300
1,335
12,431
11,748
568
5,004
429
5,571
2003
67.93
2.55
6,896
4,577
482
30.47
10,961
10,359
580
5,108
438
5,688
2004
69.29
2.66
7,192
4,959
378
34.97
11,738
11,093
605
5,327
457
5,932
2005
70.67
3.01
8,137
5,685
484
34.98
13,304
12,573
684
6,028
517
6,712
Relative
error
2001
0.00
0.00
0.00
0.00
0.00
0.00
0.00
0.0
−2.2
2002
−0.02
0.07
0.07
0.07
0.00
0.07
0.07
0.0
−2.2
2003
−0.05
0.02
0.02
0.03
0.00
0.02
0.03
−0.1
−2.2
2004
−0.05
−0.08
−0.08
.0.09
0.00
−0.08
−0.09
−0.1
−23
2005
−0.02
−0.05
−0.05
−0.05
0.00
−0.05
−0.05
0.0
−2.3
nnotavailable
System Dynamic Model for Crop Production, Water Footprint, and Virtual Water Nexus
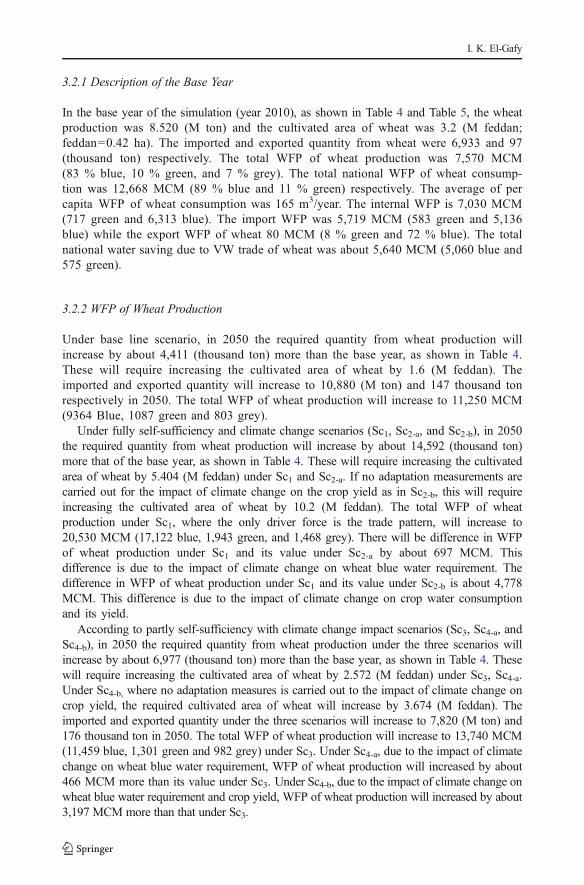
3.2.1 Description of the Base Year
In the base year of the simulation (year 2010), as shown in Table 4 and Table 5, the wheatproduction was 8.520 (M ton) and the cultivated area of wheat was 3.2 (M feddan;feddan=0.42 ha). The imported and exported quantity from wheat were 6,933 and 97(thousand ton) respectively. The total WFP of wheat production was 7,570 MCM(83 % blue, 10 % green, and 7 % grey). The total national WFP of wheat consump-tion was 12,668 MCM (89 % blue and 11 % green) respectively. The average of percapita WFP of wheat consumption was 165 m3/year. The internal WFP is 7,030 MCM(717 green and 6,313 blue). The import WFP was 5,719 MCM (583 green and 5,136blue) while the export WFP of wheat 80 MCM (8 % green and 72 % blue). The totalnational water saving due to VW trade of wheat was about 5,640 MCM (5,060 blue and575 green).
3.2.2 WFP of Wheat Production
Under base line scenario, in 2050 the required quantity from wheat production willincrease by about 4,411 (thousand ton) more than the base year, as shown in Table 4.These will require increasing the cultivated area of wheat by 1.6 (M feddan). Theimported and exported quantity will increase to 10,880 (M ton) and 147 thousand tonrespectively in 2050. The total WFP of wheat production will increase to 11,250 MCM(9364 Blue, 1087 green and 803 grey).
Under fully self-sufficiency and climate change scenarios (Sc1, Sc2-a, and Sc2-b), in 2050the required quantity from wheat production will increase by about 14,592 (thousand ton)more that of the base year, as shown in Table 4. These will require increasing the cultivatedarea of wheat by 5.404 (M feddan) under Sc1 and Sc2-a. If no adaptation measurements arecarried out for the impact of climate change on the crop yield as in Sc2-b, this will requireincreasing the cultivated area of wheat by 10.2 (M feddan). The total WFP of wheatproduction under Sc1, where the only driver force is the trade pattern, will increase to20,530 MCM (17,122 blue, 1,943 green, and 1,468 grey). There will be difference in WFPof wheat production under Sc1 and its value under Sc2-a by about 697 MCM. Thisdifference is due to the impact of climate change on wheat blue water requirement. Thedifference in WFP of wheat production under Sc1 and its value under Sc2-b is about 4,778MCM. This difference is due to the impact of climate change on crop water consumptionand its yield.
According to partly self-sufficiency with climate change impact scenarios (Sc3, Sc4-a, andSc4-b), in 2050 the required quantity from wheat production under the three scenarios willincrease by about 6,977 (thousand ton) more than the base year, as shown in Table 4. Thesewill require increasing the cultivated area of wheat by 2.572 (M feddan) under Sc3, Sc4-a.Under Sc4-b, where no adaptation measures is carried out to the impact of climate change oncrop yield, the required cultivated area of wheat will increase by 3.674 (M feddan). Theimported and exported quantity under the three scenarios will increase to 7,820 (M ton) and176 thousand ton in 2050. The total WFP of wheat production will increase to 13,740 MCM(11,459 blue, 1,301 green and 982 grey) under Sc3. Under Sc4-a, due to the impact of climatechange on wheat blue water requirement, WFP of wheat production will increased by about466 MCM more than its value under Sc3. Under Sc4-b, due to the impact of climate change onwheat blue water requirement and crop yield, WFP of wheat production will increased by about3,197 MCM more than that under Sc3.
I. K. El-Gafy
Tab
le4
WFP
ofwheatproductio
nunderdifferentscenarios(outputfrom
SD-CWPV
N)
Scenarios
Year
Populatio
n(M
)Dom
estic
use
(1000tons)
Production
(1000tons)
Import
(1000tons)
Export
(1000tons)
Stock
(1000tons)
Area(M
feddan)
WFP
ofwheatproduction(M
CM)
Green
Blue
Gray
Total
Baseyear
2010
7714,592
8.523
6.933
97767
3,157
717
6,313
541
7,571
Baseline
2020
8916,850
9.306
5.051
112
767
3,632
824
7,202
617
8,643
2030
9918,892
10,980
9,132
125
767
4,067
92.3
8,003
636
9,614
2040
109
20,783
12,039
10,080
137
767
4,459
1,012
3,743
750
10,510
2050
118
22,348
12,934
10,881
147
767
4,790
1,037
9,364
803
11,254
Sc1
2020
8916,850
17.617
00
767
6.525
1,431
13.050
1.119
15,650
2030
9918,892
19.659
00
767
7.231
1,653
14,562
1.248
17,463
2040
109
20,783
21,550
00
767
7,932
1,312
15,963
1,363
19,143
2050
118
22,348
23,115
00
767
8,561
1,943
17,122
1,463
20,533
Sc2-a
2020
8916,350
17.617
00
767
6,525
1,431
13,137
1,119
15,737
2030
9918,892
19,659
00
767
7,281
1,653
14,306
1,248
17,707
2040
109
20,783
21,550
00
767
7,982
1,812
16,311
1,363
19,591
2050
118
22,348
23,115
00
767
8,561
1,933
17,819
1,463
21,230
Sc2-b
2020
8916,350
17,617
00
767
6,343
1,55.3
13,797
1,174
16,526
20.30
9918,892
19,659
00
767
7,993
1,814
16,253
1,371
19,439
2040
109
20,783
21,550
00
767
9,141
2,075
13,795
1,563
22,433
2050
118
22,333
23,115
00
767
10,207
2,317
21,244
1,750
25,311
Sc3
2020
8916,850
11.900
5.893
1.35
767
4,391
997
8,781
753
10,531
2030
9918,892
13,200
6,612
150
767
4,883
1,110
9,776
833
11,723
2040
109
20,783
14,400
7,274
164
767
5,343
1,214
10,697
917
12,328
2050
118
22,338
15,500
7,822
176
767
5,729
1,301
11,4.59
932
13,732
Sc4-a
2020
8916,850
11.900
5.893
135
767
4.391
997
8,336
753
10,596
2030
9918,892
13,200
6,612
150
767
4,833
1,110
9,939
833
11,887
2040
109
20,783
14,400
7,274
164
767
5,3.43
1,214
10,997
917
13,128
System Dynamic Model for Crop Production, Water Footprint, and Virtual Water Nexus
Tab
le4
(contin
ued)
Scenarios
Year
Populatio
n(M
)Dom
estic
use
(1000tons)
Production
(1000tons)
Import
(1000tons)
Export
(1000tons)
Stock
(1000tons)
Area(M
feddan)
WFP
ofwheatproduction(M
CM)
Green
Blue
Gray
Total
2050
113
22,333
15,500
7,822
176
767
5,729
1,301
11,92s
982
13,208
Sc4-b
2020
8916,350
11.900
5.893
135
767
4.603
1,036
9,28.4
790
11,120
2030
9911,892
13.200
6.612
150
767
5.366
1.218
10.911
920
13.049
2640
109
20,783
14.400
7,274
163
767
6,125
1,390
12,595
105.0
15.036
2054
118
22,333
15,500
7,822
176
767
6,831
1,551
14,217
1171
16,939
I. K. El-Gafy
Tab
le5
NationalWFP
ofwheatconsum
ptionunderdifferentscenarios(outputfrom
SD-CWPV
N)
Scenario
Year
ConsumptionWFP
(MCM)
Import
Export
Internal
National
Green
Blue
Green
Blue
Green
Blue
Green
Blue
TOTA
L
Baseyear
2010-
583
5,136
872
717
613
1,291
11,377
12,668
Baseline
2020
679
5,930
982
824
7,202
1,494
13,050
14,531
2030
768
6,649
1191
923
8,004
1,680
14,562
16,215
2040
847
7,314
12100
1,012
8,748
1,848
15,963
17,775
2050
915
7,865
12107
1,087
9,364
1,990
17,122
19,066
Sc1
2020
00
00
L481
13,050
1,481
13,050
14,531
2030
00
00
1,653
14,562
1,653
14,562
16,215
2040
00
00
1,812
15,963
1,812
15,963
17,775
2050
00
00
1,943
17,122
1,943
17,122
19,066
Sc2-a
2020
00
00
1,481
13,147
1,481
13,147
14.628
2030
00
00
1,653
14,806
1,653
14,806
16,459
2040
00
00
1,812
16,411
1,812
16,411
18,223
2050
00
00
1,943
17,819
1,943
17,819
19,763
Sc2-b
2020
00
00
1,554
13.797
1,554
13,797
15,352
2030
00
00
1,814
16,253
1,814
16,253
18,068
2040
00
00
2,075
18,795
2,075
18,795
20,871
2050
00
00
2,317
21,244
2,317
21,244
23,561.
Sc3
2020
496
4369
11100
997
8,781
1,481
13.050
14,531
2030
556
4,898
13111
1,110
9,776
1,653
14,562
16,215
2040
612
5,388
14122
1,214
10,697
1,812
15,963
17.775
2050
658
5,794
15130
1,301
11,459
1,943
17,122
19,066
Sc4-a
2020
496
4,401
11101
997
8,846
1,481
13,147
14,628
System Dynamic Model for Crop Production, Water Footprint, and Virtual Water Nexus
Tab
le5
(contin
ued)
Scenario
Year
ConsumptionWFP
(MCM)
Import
Export
Internal
National
Green
Blue
Green
Blue
Green
Blue
Green
Blue
TOTA
L
2030
556
4,980
13113
1,110
9,939
1,653
14,806
16,459
2040
612
5,539
14125
1,214
10,997
1,812
16,411
18,223
2050
658
6,030
15136
1,301
11,925
1,943
17,819
19,763
Sc4-b
2020
520
4,401
12106
1,046
9,284
1,554
13,797
15,352
2030
610
4,980
14124
1,218
10,911
1,814
16,253
18,068
2040
700
5.539
16143
1,390
12.595
2,075
18,795
20,871
2050
784
6.030
18162
1,551
14,217
2,317
21.244
23.561
I. K. El-Gafy
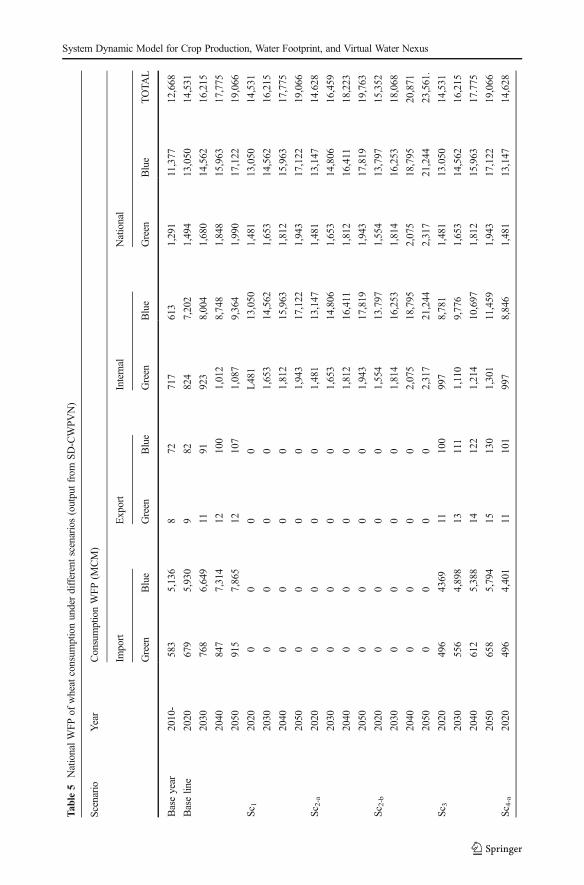
3.2.3 National WFP of Wheat Consumption
There will be a minor change in the national WFP of wheat consumption under thedifferent scenarios for the interval 2010–2050. This minor change is due to the impact ofclimate change. The national WFP of wheat consumption under no climate changeimpact (i.e. base line scenario, Sc1 and Sc3), as shown in Table 5, will be about19,066 MCM (55 %, 100 %, and 67 % of this value are internal WFP under the previousthree scenarios respectively) in year 2050. Under Sc2-a, and Sc4-a, where it is assumedthat the climate change will impact on crop water consumption, the national WFP ofwheat consumption will increase to 19,763 MCM. Under Sc2-b and Sc4-b, where it isassumed that the climate change will impact on crop water consumption and its yield, thenational WFP of wheat consumption will increase to 23,561 MCM. The highest changein the internal WFP of wheat consumption will be under Sc2-b. Since under this scenario,the required quantity of wheat will total produced locally and the climate change willimpact on both the crop blue water consumption and its yield.
The highest import WFP of wheat will be under base line scenario. Under baseline scenario, the import WFP of wheat will increase to 8,780 (7,865 MCM blue and915 MCM green) in year 2050, as shown Table 5. The highest export WFP of wheatwill be under Sc3 and Sc4 where it will increase to 145 MCM (130 MCM blue and 15MCM green) and 151 MCM (136 MCM blue and 15 MCM green) respectively in year2050.
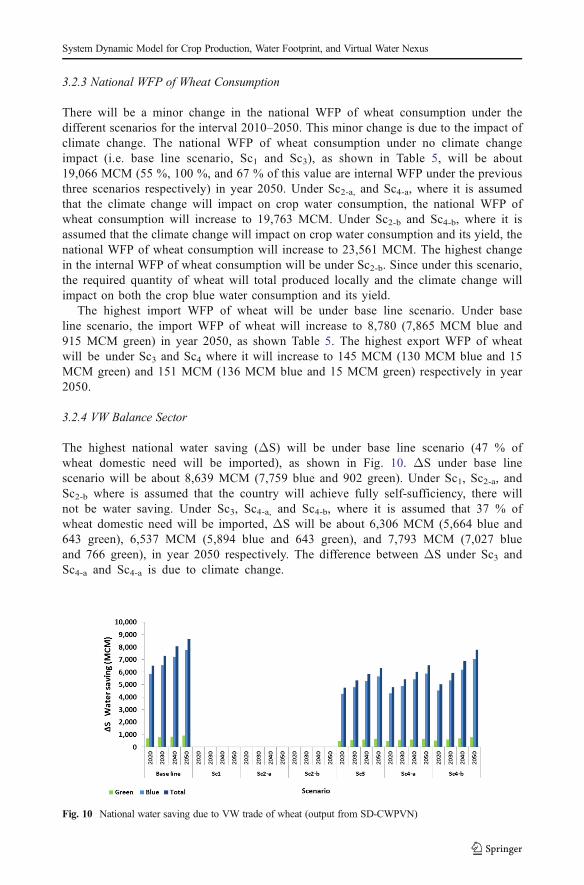
3.2.4 VW Balance Sector
The highest national water saving (ΔS) will be under base line scenario (47 % ofwheat domestic need will be imported), as shown in Fig. 10. ΔS under base linescenario will be about 8,639 MCM (7,759 blue and 902 green). Under Sc1, Sc2-a, andSc2-b where is assumed that the country will achieve fully self-sufficiency, there willnot be water saving. Under Sc3, Sc4-a, and Sc4-b, where it is assumed that 37 % ofwheat domestic need will be imported, ΔS will be about 6,306 MCM (5,664 blue and643 green), 6,537 MCM (5,894 blue and 643 green), and 7,793 MCM (7,027 blueand 766 green), in year 2050 respectively. The difference between ΔS under Sc3 andSc4-a and Sc4-a is due to climate change.
Fig. 10 National water saving due to VW trade of wheat (output from SD-CWPVN)
System Dynamic Model for Crop Production, Water Footprint, and Virtual Water Nexus
4 Conclusion
A System Dynamic model for crop, WFP, and VW nexus was developed through the currentstudy. The system was applied on a case study from Egypt. The accuracy assessment withhistorical data from 2001 to 2005 indicated that the system is robust. The developed systemwas applied for the simulation of production, WFP, and VW trade nexuses of wheat in Egyptfor the interval 2010–2050 under built scenarios to illustrate the function of the system.
In the base year (year 2010), the cultivated area of wheat was 3.2 (M feddan), the totalWFP ofwheat production was 7,570 MCM (83 % blue, 10 % green, and 7 % grey). Total WFP of wheatconsumption was about 12,668 MCM (7,030 internal, 5,719 import, and 80 export). The totalnational water saving due to VW trade of wheat is about 5,640MCM (5,060 blue and 575 green).
Under the studied scenarios through the current research, WFP of wheat production,consumption and water saving due to wheat VW trade will change through the interval2010–2050. Analysis of the results illustrated that, in 2050 achieving 100 %, 63 %, and 53 %of self-sufficiency from wheat with adaptation to the impact of climate change on crop yieldwill require increasing the cultivated area of wheat by 5.4, 2.6, and 1.6 (M feddan) respectively.Without adaptation to the impact of climate change on crop yield, achieving 100 % and 63 % ofself-sufficiency will increase the wheat cultivated area by 1.6 and 1.1 (M feddan) respectively.
In 2050, achieving 100 %, 63 %, 53 % of self-sufficiency with no impact of climate change onwheat water consumption (blue, green, and gray) and adaptation measurements to the impact ofclimate change on the crop yield, will increase the total WFP of wheat production more than itsvalue in the base year by about 171%, 82%, and 49% respectively. These values will be increasedby 3 % due to the climate change impact on wheat water consumption and with adaptationmeasurements to its impact on the crop yield. If no adaptation measurements were carried out tothe impact of climate change on the crop yield, these values will be increased by 23 %.
The total WFP of wheat consumption will be increased by 6,334 MCM in 2050 under thescenarios with no climate change impact. Under climate change impact on wheat blue waterconsumption, the total WFP of wheat consumption will be increased by 7,094 MCM.Under climate change impact on wheat water consumption and crop yield, the total WFPof wheat consumption will increase by 10,892 MCM. The highest water saving due toVW trade of wheat will be when achieving 53 % of self-sufficiency with no impact ofclimate change where it will be increased to 8,639 MCM (7,759 blue and 902 green).
From previous, it can be concluded that the developed system during the research can beapplied for addressing the water and agricultural policies based on the WF and VW analysis.The WFP should be assisted continuously as WFP is considered as a comprehensiveindicator of fresh water resources usage rather than the conventional methods. Where,WFP demonstrates information about: i) blue, green and grey water use for productproduction, ii) national product water consumption (internal, import, and export), and iii)VW flows as a result of product trade. These information assists the decision maker insetting polices related to water resources utilization. WFP should be addressed whendeveloping a product's trade policy especially in water scarcity countries such as Egypt.
References
Agrawala S, Moehner A, El Raey M, Conway D, Aalst M, Hagenstad M, Smith J, (2004) Development andClimate Change in Egypt: Focus on Coastal Resources and the Nile. Organization for economic co-operationand development, OECD project. Paris, France. http://www.oecd.org/dataoecd/57/4/33330510.pdf, (Sited onMar. 2013)
Allan J (1998) Virtual Water: A Strategic Resource: Global Solutions to Regional Deficits. Groundwater 36(4):546Chapagain A, Hoekstra A (2004) Water footpints of nations. Value of Water Research Report Series No.16,
UNESCO-IHE UNISCO- IHE, Institute for Water Education.Chapagain A, Hoekstra A, Savenije H (2005a) Saving water through global trade. Value of Water Research
Report Series No.17, UNESCO-IHE.Chapagain A, Hoekstra A, Savenije H, Gautam R (2005b) The water footprint of cotton consumption. Value of
Water Research Report Series No.18, UNESCO-IHE, Netherland.Chapagain A, Hoekstra A (2010) The green, blue and grey water footprint of rice from both a production and
consumption perspective. Value of Water Research Report Series No.40, UNESCO-IHE.Chen Z, Wei S (2014) Application of system dynamics to water security research. Water Resource Management
28:287–300Dourte D, Fraisse C (2012) What is a water footprint?: An Overview and Applications in Agriculture, http://edis.
ifas.ufl.edu/ae484, (Sited on August 2013)Eid H, El_Marsafawy S, Ouda S (2006) Assessing the impact of climate on crop water needs in Egypt: the
cropwat analysis of three districts in Egypt. CEEPA Discussion Paper No. 29, CEEPA, University ofPretoria. http://www.ceepa.co.za/discussionp2006.html, (sited on March 2013)
El-Gafy I, Attia B (2009) Virtual water approach for achieving long term planning for water intended for foodsecurity in Egypt. Ain Shams University Faculty of Engineering, Ain Shams Journal of Civil Engineering(ASJCE), Vol. 2, pp. 331–349, September.
El-Sadek A (2010) Virtual water trade as a solution for water scarcity in Egypt. Water Resources Management24(11):2437–2448
Ercin A, Hoekstra A (2012) Water footprint scenarios for 2050 - a global analysis and case study for Europe.Value of Water Research Report Series No.18, UNESCO-IHE, Netherland.
FAO (2013), FAOSTAT, http://faostat.fao.org/site/354/default.aspx, (Sited on June 2013)FAO (2009a), FAO's Information System on Water and Agriculture, AQUASTAT, http://www.fao.org/nr/water/
aquastat/main/index.stm, (Sited on Apr. 2013)FAO (2009b), Climate Information Tool, http://www.fao.org/nr/water/aquastat/gis/index3.stm, (Sited on Apr.
2013)Ge L, Xie G, Zhang C, Li S, Qi Y, Cao S, He T (2011) An Evaluation of China’s Water Footprint. Water
Resources Management 25(10):2633–2647Hoekstra A, Hung P (2002) Virtual water trade: A quantification of virtual water flows between nations in
relation to international crop trade. Value of Water Research Report Series No.11, UNESCO-IHE, theNetherlands.
Hoekstra A, Chapagain K (2007) Water footprint of nations: Water use by people as a function of theirconsumption pattern. Water Resource Management 21:35–48
Hoekstra A, Chapagain A, Aldaya M, Mekonnen M (2009) The water footprint assessment manual- state of theart 2009. WFP Network, Enschede, The Netherlands, www.waterfootprint.org
Hoekstra A, Chapagain A., Aldaya M, Mekonnen M (2011) The water footprint assessment manual: setting theglobal standard. Washington, D.C.: Earthscan. http://www.waterfootprint.org/downloads/TheWaterFootprintAssessmentManual.pdf, (Sited on Mar. 2013).
Hsayan K, Allam M, Ghaith M, Bekhit H (2006) Evaluation of Potential Virtual Water Trade among the ArabCountries. Proceedings of the Second International Arab Water Conference, 9–11 December 2006, Cairo,Egypt
Mekonnen M, Hoekstra A (2011) The green, blue and grey water footprint of crops and derived crop products.Hydrology and Earth System Sciences 15(5):1577–1600
Mekonnen M, Hoekstra A (2010a) The green, blue and grey water footprint of wheat. Hydrology and EarthSystem Sciences 14:1259–1276
Mekonnen M, Hoekstra A (2010b). The green, blue and grey water footprint of crops and derived crop products.Value of Water Research Report Series No.47, UNESCO-IHE, the Netherlands.
Nour El-Din M (2013) Climate change risk management in Egypt proposed -climate change adapta-tion strategy for the Ministry of Water Resources & Irrigation in Egypt. Prepared for UNESCO-Cairo Office, Egypt
Schwartz P (1991) The art of the long view: planning for the future in an uncertain World. Currency Doubleday,New York
Shrestha S, Pandey V, ChanamaiC GD (2013) Green, Blue and Grey Water Footprints of Primary CropsProduction in Nepal. Water Resources Management 27(15):5223–5243
Simonovic S (2000) Tools for water management: one view of the future. Water International 25:76–88Sun S, Wu P, Yu B, Wang Y, Zhao X (2013) Temporal Variability of Water Footprint for Maize Production: The
Case of Beijing from 1978 to 2008. Water Resources Management 27(7):2447–2463United Nations (2013) Population division, population estimates and projection section. Department of
Economic and Social Affairs, http://esa.un.org/unpd/wpp/index.htm
System Dynamic Model for Crop Production, Water Footprint, and Virtual Water Nexus
Ventana Systems (2007) User’s Guide. Version 5, Inc. Revision Date. www.vensim.com/documentation/users_guide.htm, (Sited on June 2013)
Water footprint Network (2013). http://www.waterfootprint.org/?page=files/NationalWaterAccountingFramework,(Sited on May 2013).
Water Management Research Institute (WMRI) (2013) Water consumption and estimate the water needs of themajor crops in the light of climate change and its impact. National Committee for the needs of water.National Water Research Center. Ministry of Water Resources and Irrigation of Egypt